20160330 q3 performance outcome tables final
27
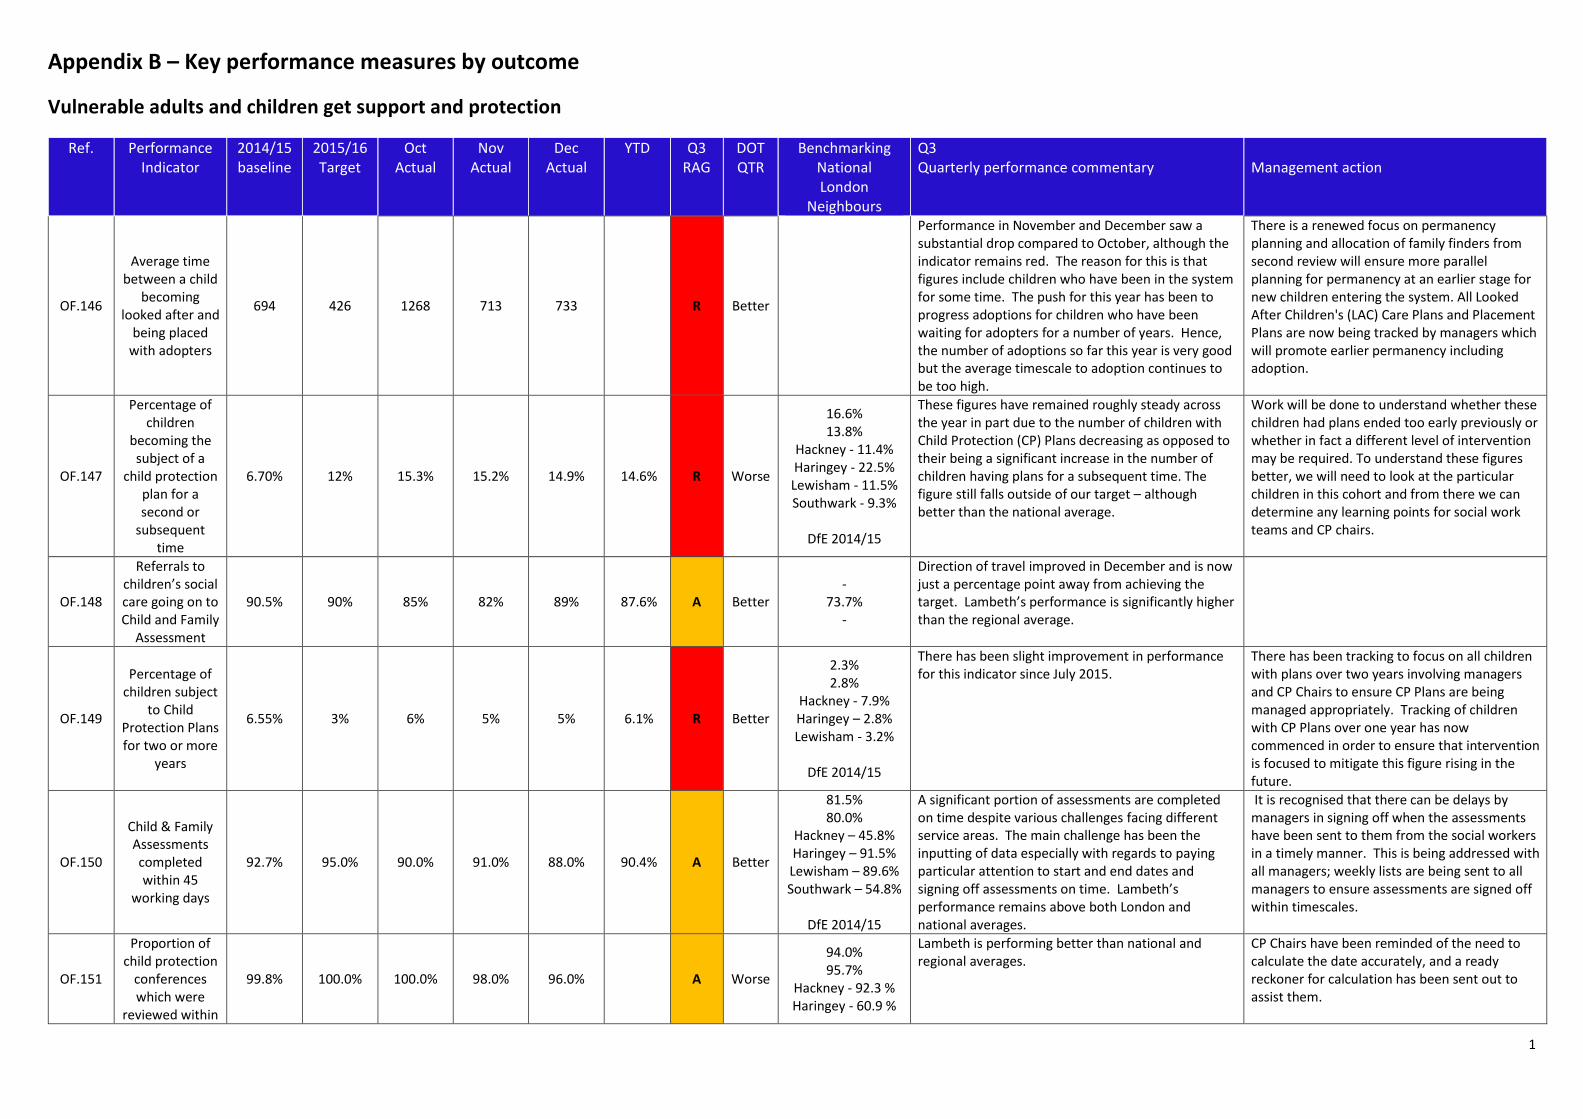
1 Appendix B – Key performance measures by outcome Vulnerable adults and children get support and protection Ref. Performance Indicator 2014/15 baseline 2015/16 Target Oct Actual Nov Actual Dec Actual YTD Q3 RAG DOT QTR Benchmarking National London Neighbours Q3 Quarterly performance commentary Management action OF.146 Average time between a child becoming looked after and being placed with adopters 694 426 1268 713 733 R Better Performance in November and December saw a substantial drop compared to October, although the indicator remains red. The reason for this is that figures include children who have been in the system for some time. The push for this year has been to progress adoptions for children who have been waiting for adopters for a number of years. Hence, the number of adoptions so far this year is very good but the average timescale to adoption continues to be too high. There is a renewed focus on permanency planning and allocation of family finders from second review will ensure more parallel planning for permanency at an earlier stage for new children entering the system. All Looked After Children's (LAC) Care Plans and Placement Plans are now being tracked by managers which will promote earlier permanency including adoption. OF.147 Percentage of children becoming the subject of a child protection plan for a second or subsequent time 6.70% 12% 15.3% 15.2% 14.9% 14.6% R Worse 16.6% 13.8% Hackney - 11.4% Haringey - 22.5% Lewisham - 11.5% Southwark - 9.3% DfE 2014/15 These figures have remained roughly steady across the year in part due to the number of children with Child Protection (CP) Plans decreasing as opposed to their being a significant increase in the number of children having plans for a subsequent time. The figure still falls outside of our target – although better than the national average. Work will be done to understand whether these children had plans ended too early previously or whether in fact a different level of intervention may be required. To understand these figures better, we will need to look at the particular children in this cohort and from there we can determine any learning points for social work teams and CP chairs. OF.148 Referrals to children’s social care going on to Child and Family Assessment 90.5% 90% 85% 82% 89% 87.6% A Better - 73.7% - Direction of travel improved in December and is now just a percentage point away from achieving the target. Lambeth’s performance is significantly higher than the regional average. OF.149 Percentage of children subject to Child Protection Plans for two or more years 6.55% 3% 6% 5% 5% 6.1% R Better 2.3% 2.8% Hackney - 7.9% Haringey – 2.8% Lewisham - 3.2% DfE 2014/15 There has been slight improvement in performance for this indicator since July 2015. There has been tracking to focus on all children with plans over two years involving managers and CP Chairs to ensure CP Plans are being managed appropriately. Tracking of children with CP Plans over one year has now commenced in order to ensure that intervention is focused to mitigate this figure rising in the future. OF.150 Child & Family Assessments completed within 45 working days 92.7% 95.0% 90.0% 91.0% 88.0% 90.4% A Better 81.5% 80.0% Hackney – 45.8% Haringey – 91.5% Lewisham – 89.6% Southwark – 54.8% DfE 2014/15 A significant portion of assessments are completed on time despite various challenges facing different service areas. The main challenge has been the inputting of data especially with regards to paying particular attention to start and end dates and signing off assessments on time. Lambeth’s performance remains above both London and national averages. It is recognised that there can be delays by managers in signing off when the assessments have been sent to them from the social workers in a timely manner. This is being addressed with all managers; weekly lists are being sent to all managers to ensure assessments are signed off within timescales. OF.151 Proportion of child protection conferences which were reviewed within 99.8% 100.0% 100.0% 98.0% 96.0% A Worse 94.0% 95.7% Hackney - 92.3 % Haringey - 60.9 % Lambeth is performing better than national and regional averages. CP Chairs have been reminded of the need to calculate the date accurately, and a ready reckoner for calculation has been sent out to assist them.
-
Upload
chris-guthrie -
Category
Government & Nonprofit
-
view
52 -
download
0
Transcript of 20160330 q3 performance outcome tables final
1
Appendix B – Key performance measures by outcome
Vulnerable adults and children get support and protection
Ref. Performance Indicator
2014/15 baseline
2015/16 Target
Oct Actual
Nov Actual
Dec Actual
YTD Q3 RAG
DOT QTR
Benchmarking National London
Neighbours
Q3 Quarterly performance commentary
Management action
OF.146
Average time between a child
becoming looked after and
being placed with adopters
694 426 1268 713 733 R Better
Performance in November and December saw a substantial drop compared to October, although the indicator remains red. The reason for this is that figures include children who have been in the system for some time. The push for this year has been to progress adoptions for children who have been waiting for adopters for a number of years. Hence, the number of adoptions so far this year is very good but the average timescale to adoption continues to be too high.
There is a renewed focus on permanency planning and allocation of family finders from second review will ensure more parallel planning for permanency at an earlier stage for new children entering the system. All Looked After Children's (LAC) Care Plans and Placement Plans are now being tracked by managers which will promote earlier permanency including adoption.
OF.147
Percentage of children
becoming the subject of a
child protection plan for a second or
subsequent time
6.70% 12% 15.3% 15.2% 14.9% 14.6% R Worse
16.6% 13.8%
Hackney - 11.4% Haringey - 22.5% Lewisham - 11.5% Southwark - 9.3%
DfE 2014/15
These figures have remained roughly steady across the year in part due to the number of children with Child Protection (CP) Plans decreasing as opposed to their being a significant increase in the number of children having plans for a subsequent time. The figure still falls outside of our target – although better than the national average.
Work will be done to understand whether these children had plans ended too early previously or whether in fact a different level of intervention may be required. To understand these figures better, we will need to look at the particular children in this cohort and from there we can determine any learning points for social work teams and CP chairs.
OF.148
Referrals to children’s social care going on to Child and Family
Assessment
90.5% 90% 85% 82% 89% 87.6% A Better -
73.7% -
Direction of travel improved in December and is now just a percentage point away from achieving the target. Lambeth’s performance is significantly higher than the regional average.
OF.149
Percentage of children subject
to Child Protection Plans for two or more
years
6.55% 3% 6% 5% 5% 6.1% R Better
2.3% 2.8%
Hackney - 7.9% Haringey – 2.8% Lewisham - 3.2%
DfE 2014/15
There has been slight improvement in performance for this indicator since July 2015.
There has been tracking to focus on all children with plans over two years involving managers and CP Chairs to ensure CP Plans are being managed appropriately. Tracking of children with CP Plans over one year has now commenced in order to ensure that intervention is focused to mitigate this figure rising in the future.
OF.150
Child & Family Assessments completed within 45
working days
92.7% 95.0% 90.0% 91.0% 88.0% 90.4% A Better
81.5% 80.0%
Hackney – 45.8% Haringey – 91.5% Lewisham – 89.6% Southwark – 54.8%
DfE 2014/15
A significant portion of assessments are completed on time despite various challenges facing different service areas. The main challenge has been the inputting of data especially with regards to paying particular attention to start and end dates and signing off assessments on time. Lambeth’s performance remains above both London and national averages.
It is recognised that there can be delays by managers in signing off when the assessments have been sent to them from the social workers in a timely manner. This is being addressed with all managers; weekly lists are being sent to all managers to ensure assessments are signed off within timescales.
OF.151
Proportion of child protection
conferences which were
reviewed within
99.8% 100.0% 100.0% 98.0% 96.0% A Worse
94.0% 95.7%
Hackney - 92.3 % Haringey - 60.9 %
Lambeth is performing better than national and regional averages.
CP Chairs have been reminded of the need to calculate the date accurately, and a ready reckoner for calculation has been sent out to assist them.

2
Ref. Performance Indicator
2014/15 baseline
2015/16 Target
Oct Actual
Nov Actual
Dec Actual
YTD Q3 RAG
DOT QTR
Benchmarking National London
Neighbours
Q3 Quarterly performance commentary
Management action
required timescales
Lewisham – 91.9 % Southwark - 100 %
DfE 2014/15
OF.152
Proportion of looked after children who
had their review completed
within timescale
97.90% 100% 87% 92% 92% A Worse Data unavailable
The dip in performance for October 2015 was due to two underperforming Independent Reviewing Officers (IRO). One is no longer in the team and the other has ensured her reviews are within timescale.
Reviews continue to be outside of timescale due to late referral to the IRO Team and IRO oversight. It is not always possible to get the reviews back into timescale until the 3rd Review. The performance management of the IROs is currently being addressed through the supervision process.
OF.153
Timeliness from placement
order to child placed with
adopters
TBC 142 days Local indicator
Data unavailable
OF.154
Stability of placements:
Proportion of LAC in same
placement for 2+ years
69.44% 75% 62% 61% 60% R Better
- 67.9%
Croydon – 73.1% Lewisham – 67.3% Newham – 68.6%
LAPS 2014/5
Placement stability is key to improving outcomes for looked after children. Some moves are positive and are based on constructive plans for children such as joining an adoptive family. Other moves are the result of older children having challenging behaviour that the carer is unable to manage.
Placement Panel has been revamped to ensure robust decision making about all children who move placement.
OF.155
Percentage of children looked
after at 31 March with 3 or
more placements
during the year ending 31
March
14.29% 10% 17.3% 16.9% 17.2% 15.8% R Worse
- 12.0%
Hackney - 12% Haringey - 9%
Lewisham – 13% Southwark - 17%
LGInform 2013/4
Placement Panel scrutinises placements and there is management oversight requiring approval of all placement moves. A review is underway to understand the proportion of children for whom a change in placement is a positive outcome and to establish where in the child’s journey unnecessary moves occurred.
OF.156 Number of
completed CAFs 1205 1200 65 81 74 820 A Worse Unavailable
The main factor accounting for worsening performance is due to a drop in CAFs received from Early Intervention (EI) CAMHS. There is a twofold reason for this. Firstly, it is partly due to the effect of waiting times for the EI CAMHS service. The service is managing this and the waiting time has already been reduced. Secondly, GPs are no longer using the CAF as a referral to access EI CAMHS. CAMHS is still receiving referrals for this service but by a central referral panel. There are concerns that there may be a knock on effect on the use of CAFs to access CAMHS by schools, this will be monitored in the next quarter.
The CAFs from the Early Years Services remains low and further focussed work by the heads of MAT with all practitioners will continue. The Senior Practitioners will be aligned to the Children’s Centres and Schools and they will support the use of the CAF. The CAF and Information Sharing Training continues with an increase in Health Visitors attending training.
OF.157
Proportion of adult social care clients receiving
a review
69.80% 80% 44% 46% 52% 52% R Worse Unavailable
Performance at the end of Q3 is below the target and the main reasons are identified below: 1) There have been a number of provider failure resulting in an increase in reassessments and
A policy is being developed to complete telephone reviews for service users. This will reduce the resource required to arrange and carry out face to face visits.

3
Ref. Performance Indicator
2014/15 baseline
2015/16 Target
Oct Actual
Nov Actual
Dec Actual
YTD Q3 RAG
DOT QTR
Benchmarking National London
Neighbours
Q3 Quarterly performance commentary
Management action
safeguarding reviews of service users that have already received a review during the year. This has meant that resources have been diverted away from completing scheduled reviews. 2) There has been an increase in Deprivation of Liberty cases and these are undertaken by the council only and not by our partner agencies. These are complex and take a significant amount of resource to complete. 3) The implementation of the care act and change in eligibility criteria has resulted in us undertaking full reassessments to meet the change in legislation. These take longer to complete than scheduled reviews and this has resulted in additional workload pressures.
Following the change in eligibility criteria and the requirement to carry out reassessments for all service users this financial year, we will be using standard review documentation for service users whose needs haven’t changed in the next financial year and this should result in increased capacity.
OF.161
Proportion of care leavers in employment, education or
training
55% 60.0% 29% 41% 21% 40% R Worse
- 58.1%
Croydon – 67.8% Haringey - 40%
Newham – 41.4%
LAPS 2014/15
Performance in December is accounted for through a number of care leavers whose status is not currently recorded. These cases are currently being checked to confirm their status, with the result that performance is likely to improve significantly. Going forward, staff in the care leavers’ team are also to be trained on the correct process for recording this data on the Framework system.
A designated EET personal adviser is now based with the Leaving Care Service and work has started focusing on NEET. A monitoring tool is in place which will calculate the conversion rate of referrals from NEET to EET. Partnerships are being created with local business to offer opportunities to care leavers.
OF.162
Percentage Education,
Health and Care Plans
completed in 20 weeks (with
valid exemption and without
valid exemption)
100% 100%
66% without VE. No
cases had VEs
100% without VE. 50% with VEs
42.8% without
VEs. 20% with VEs.
69.6 % without 56.7% with
A Worse Unavailable
This is a significant drop compared to our previous returns. This is due to the fact that we had a large number of plans to process during the Summer holiday period. This meant that the assessment process was delayed due to the fact that meetings with schools could not be held during this period. This had a knock on effect which is only now being cleared.
Next summer holidays we will continue to have meetings throughout the Summer even if schools cannot participate. This should prevent a back log occurring which has an effect on the ability to meet deadlines.
OF.163
Percentage of children who wait less than
16 months between
entering care and moving in
with their adoptive family
TBC 50% 17% 27% 25% R Better
Rigorous tracking of Legal Proceedings through the South London Care Proceedings Project has reduced court timescales. A renewed focus on permanency planning and allocation of family finders from second review will ensure more parallel planning for permanency at an earlier stage for new children entering the system. More management rigour is required for children who start to be looked after under S20 of the Children Act 89 and are not in Care Proceedings
OF.164
Percentage of children who
leave care as a result of adoption
7% 12% 7.8% 8.5% 9.5% R Better 14%
9.94% -
Performance has seen a gradual improvement since May 2015. Performance is dependent on courts making adoption orders. Forthcoming cases indicate that the target of 12% will not be reached by 31
March 2016 but will match the London average.

4
Ref. Performance Indicator
2014/15 baseline
2015/16 Target
Oct Actual
Nov Actual
Dec Actual
YTD Q3 RAG
DOT QTR
Benchmarking National London
Neighbours
Q3 Quarterly performance commentary
Management action
OF.165
Average timescale for
children adopted between
placement order and
match to an adoptive family
430 121 307 289 289 R Better Awaiting
Historic cases in the system which have now been finalised continue to impact on this figure. Children who have entered care more recently will evidence an improving picture in relation to this indicator.
Management actions include the allocation of Family Finders at second review and exploring all avenues of family finding for Adopters immediately Placement Orders are made, rather than doing this sequentially.
5
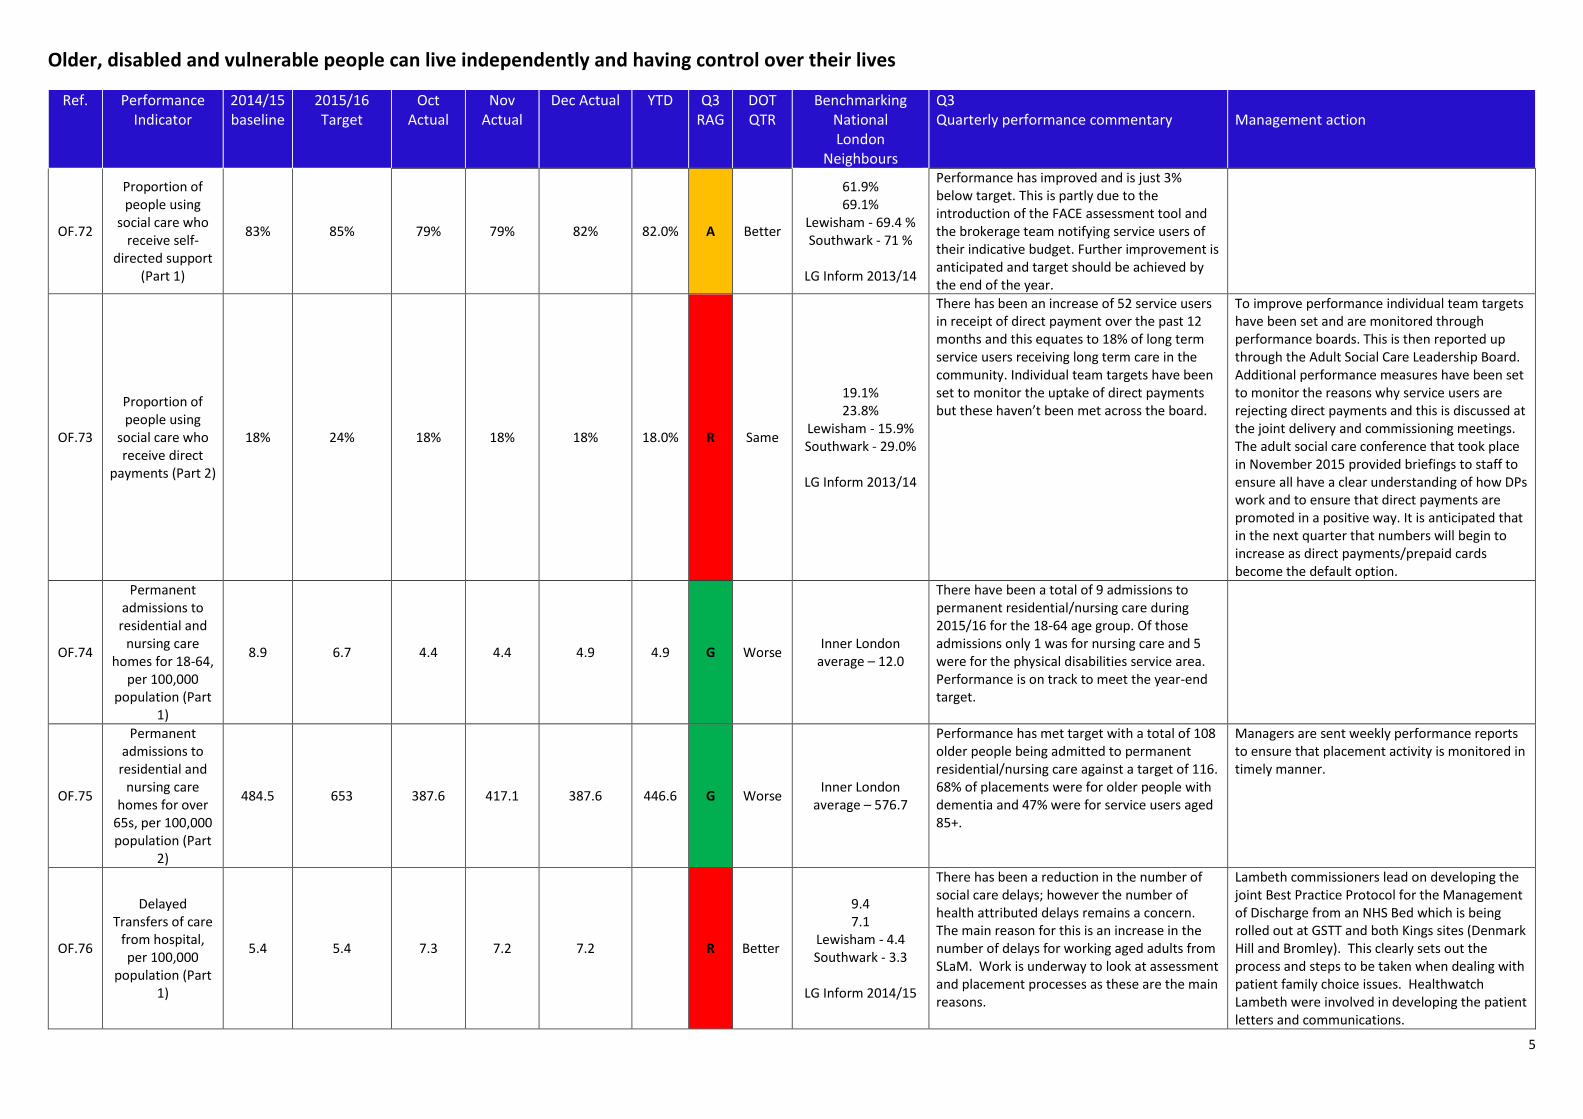
Older, disabled and vulnerable people can live independently and having control over their lives
Ref. Performance Indicator
2014/15 baseline
2015/16 Target
Oct Actual
Nov Actual
Dec Actual YTD Q3 RAG
DOT QTR
Benchmarking National London
Neighbours
Q3 Quarterly performance commentary
Management action
OF.72
Proportion of people using
social care who receive self-
directed support (Part 1)
83% 85% 79% 79% 82% 82.0% A Better
61.9% 69.1%
Lewisham - 69.4 % Southwark - 71 %
LG Inform 2013/14
Performance has improved and is just 3% below target. This is partly due to the introduction of the FACE assessment tool and the brokerage team notifying service users of their indicative budget. Further improvement is anticipated and target should be achieved by the end of the year.
OF.73
Proportion of people using
social care who receive direct
payments (Part 2)
18% 24% 18% 18% 18% 18.0% R Same
19.1% 23.8%
Lewisham - 15.9% Southwark - 29.0%
LG Inform 2013/14
There has been an increase of 52 service users in receipt of direct payment over the past 12 months and this equates to 18% of long term service users receiving long term care in the community. Individual team targets have been set to monitor the uptake of direct payments but these haven’t been met across the board.
To improve performance individual team targets have been set and are monitored through performance boards. This is then reported up through the Adult Social Care Leadership Board. Additional performance measures have been set to monitor the reasons why service users are rejecting direct payments and this is discussed at the joint delivery and commissioning meetings. The adult social care conference that took place in November 2015 provided briefings to staff to ensure all have a clear understanding of how DPs work and to ensure that direct payments are promoted in a positive way. It is anticipated that in the next quarter that numbers will begin to increase as direct payments/prepaid cards become the default option.
OF.74
Permanent admissions to
residential and nursing care
homes for 18-64, per 100,000
population (Part 1)
8.9 6.7 4.4 4.4 4.9 4.9 G Worse Inner London
average – 12.0
There have been a total of 9 admissions to permanent residential/nursing care during 2015/16 for the 18-64 age group. Of those admissions only 1 was for nursing care and 5 were for the physical disabilities service area. Performance is on track to meet the year-end target.
OF.75
Permanent admissions to
residential and nursing care
homes for over 65s, per 100,000 population (Part
2)
484.5 653 387.6 417.1 387.6 446.6 G Worse Inner London
average – 576.7
Performance has met target with a total of 108 older people being admitted to permanent residential/nursing care against a target of 116. 68% of placements were for older people with dementia and 47% were for service users aged 85+.
Managers are sent weekly performance reports to ensure that placement activity is monitored in timely manner.
OF.76
Delayed Transfers of care
from hospital, per 100,000
population (Part 1)
5.4 5.4 7.3 7.2 7.2 R Better
9.4 7.1
Lewisham - 4.4 Southwark - 3.3
LG Inform 2014/15
There has been a reduction in the number of social care delays; however the number of health attributed delays remains a concern. The main reason for this is an increase in the number of delays for working aged adults from SLaM. Work is underway to look at assessment and placement processes as these are the main reasons.
Lambeth commissioners lead on developing the joint Best Practice Protocol for the Management of Discharge from an NHS Bed which is being rolled out at GSTT and both Kings sites (Denmark Hill and Bromley). This clearly sets out the process and steps to be taken when dealing with patient family choice issues. Healthwatch Lambeth were involved in developing the patient letters and communications.

6
Ref. Performance Indicator
2014/15 baseline
2015/16 Target
Oct Actual
Nov Actual
Dec Actual YTD Q3 RAG
DOT QTR
Benchmarking National London
Neighbours
Q3 Quarterly performance commentary
Management action
There will be a focus on assessment processes for both timeliness and detail. This includes a review of the continuing health care assessment process and use of extra care flats for a ‘discharge to assess’ pilot.
OF.77
Percentage of people who use adult social care
services who have improved overall control over their daily
life
95%
Sustain performance
against baseline
92% 91% 89% 91% G Local indicator
Data for this indicator is derived from the LASCOM (Lambeth Adult Social Care Outcome Measures) questionnaire. Information from this is used to monitor trends only and targets aren't formally set.
OF.80
Proportion of adults with
learning disabilities in paid
employment
2.90% 4% 2% 2% 2% 2% R Same
6.0% 8.0%
Lewisham - 10.3% Southwark - 4.3 %
LG Inform 2014/15
Performance has remained the static during the year and an additional 5 people are required to meet target.
In October 2015, following a comprehensive commissioning process, council officers invited organisations to submit proposals to re-open the Phoenix House canteen for staff. Suppliers were asked to provide bids using a supported employment model that would ensure staff employed in the canteen, were local residents and had learning difficulties or disabilities. Supported Employment has been successfully used for decades as a personalised model for supporting people with significant disabilities to secure and retain paid employment. These staff would receive training and support that ensured that they achieved sustainable long-term employment. Despite holding soft market events for potential suppliers, the council did not receive any submissions. Feedback from the organisations was that the canteen was not financially viable due to the lack of cooking facilities on site. The Camden Society have since approached the council to provide a trolley catering service for Phoenix House employees, using their existing Platform 1 café at Clapham Junction as a base. This solution can be seen as providing a useful service to staff and importantly the trolley service would also provide one supported employment opportunity for a young Lambeth resident with learning difficulties or disabilities (LDD). In the long term this project will help the council decide on the catering offer in the ‘Your new Town Hall’ development. It will also pilot supported employment opportunities for local

7
Ref. Performance Indicator
2014/15 baseline
2015/16 Target
Oct Actual
Nov Actual
Dec Actual YTD Q3 RAG
DOT QTR
Benchmarking National London
Neighbours
Q3 Quarterly performance commentary
Management action
young people and feed into the council’s wider research on developing a social enterprise infrastructure that can develop and facilitate supported employment opportunities for Lambeth residents who need the extra support to get into work. The Camden Society are ready to start the project as soon as the council has given due diligence to the process involved in signing off this decision and the ‘Service Level Agreement’ has been signed. Once this is in place, officers will need to develop a marketing strategy for staff and Camden Society will need to recruit the employee. We hope to have the service to be in place by April 2016.
OF.81
Delayed Transfers of care
from hospital, and those which are attributable to adult social
care per 100,000 population (Part
2)
1.8 2 2.7 2.7 2.7 R Same
- 2.5
Lewisham - 2.1 Southwark - 0.9
LG Inform 2014/15
The number of delays due to adult social care have remained lower than NHS delays and performance is slightly worse than the target set. The main reason for social care delays were due to nursing care placements and care packages in the home. Work is underway to look at assessment and placement processes as these are the main reasons.
OF.82
Has the care and support you
receive changed your quality of
life overall?
86%
Sustain performance
against baseline
83% 84% 79% 83.0% G Same Local indicator
Data for this indicator is derived from the LASCOM (Lambeth Adult Social Care Outcome Measures) questionnaire. Information from this is used to monitor trends only and targets aren't formally set.
OF.83
Proportion of carers receiving a
needs assessment or
review, a specific carers service, or
advice and information
60.60% 40% 21% 27% 33% 33.0% G Better Inner London – 29.7
Performance is on target to meet the year-end target. The number of carers assessments completed has increased from the same position last year. All teams have set individual targets and these are reported through the performance boards.
OF.84
Planned moves within the
Vulnerable Adults Pathway
(reduction in evictions and
abandonments)
77% 80% 84% 80.0% G Local indicator
There is improved performance from large hostels in planned moves and avoiding evictions, although planned offender move-on is still below target. Supported housing patches showing significant increase in both number and percentage of planned moves. The indicator is now on target for the year.
Work with offender services and large hostels to decrease unplanned move on will continue.
OF.85
Proportion of adults with
learning disabilities who live in their own
64.4% 66% 62% 62% 62% 62% A Same
- 69.6%
Lewisham - 75.5% Southwark - 71.8%
Performance is just below the target and below the outturn of 2014/15. Exception reports are issued to managers to ensure that the correct tenure type is recorded in the system. It is hoped the new extra care housing scheme will
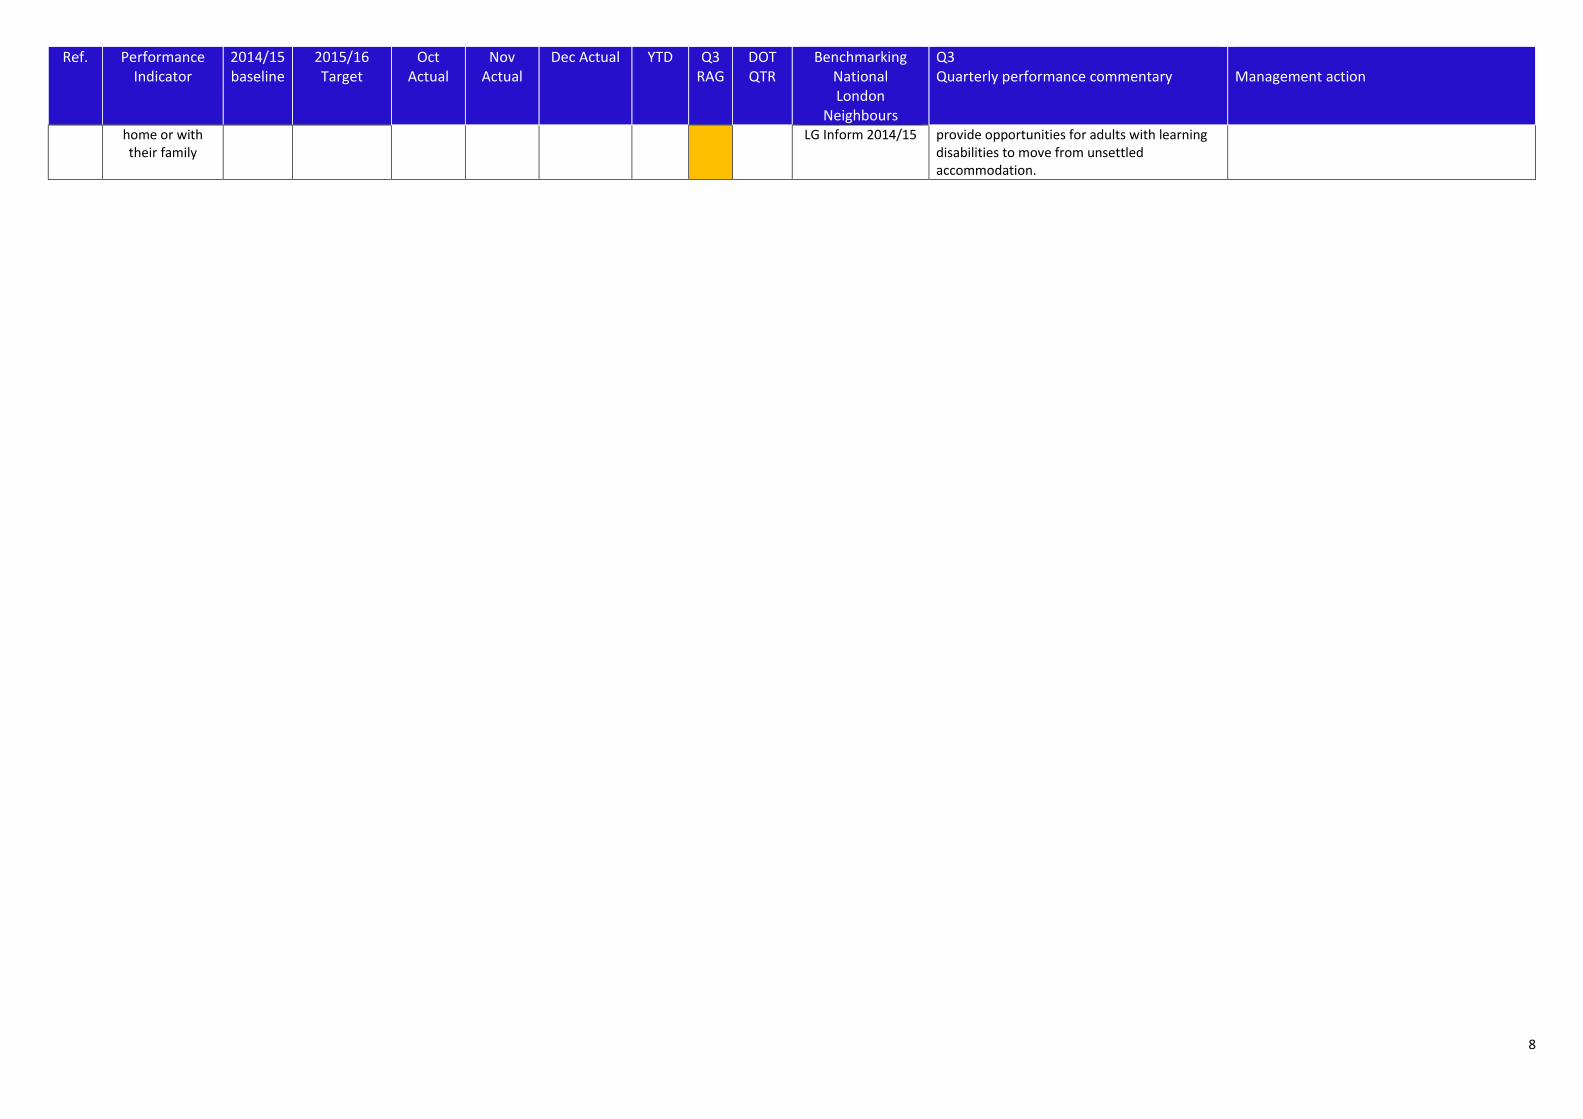
8
Ref. Performance Indicator
2014/15 baseline
2015/16 Target
Oct Actual
Nov Actual
Dec Actual YTD Q3 RAG
DOT QTR
Benchmarking National London
Neighbours
Q3 Quarterly performance commentary
Management action
home or with their family
LG Inform 2014/15 provide opportunities for adults with learning disabilities to move from unsettled accommodation.

9
Crime reduces
Ref. Performance Indicator
2014/15 baseline
2015/16 Target
Oct Actual
Nov Actual
Dec Actual YTD Q3 RAG
DOT QTR
Benchmarking National London
Neighbours
Q3 Quarterly performance commentary
Management action
OF.47
Repeat incidents of domestic
violence reported by those victims
who are managed by a
MARAC
20% 20% 19.0% 20.0% 20.0% 20.0% G Same
- -
Croydon – 13% Hackney – 14%
Tower Hamlets – 23%
LAPS 2015
In the last 12 months (January-December 2015) the MARAC saw a total of 398 cases and 79 repeats which is a 20% repeat rate. This is an improvement of 6% points compared to the same time last year.
OF.48
Reduction in levels of risk for victims of VAWG
engaged with GAIA
TBC 35% 42.0% G Better Local indicator
Performance for quarter 2 was 37% against a target of 35%. This represents a slight increase in performance from quarter 1, and remains on target for the year. In Q1, there was concern that the introduction of the Mayor's DV advocacy service could lead to victims falling through the cracks. However, this has not affected performance data although the impact continues to be monitored.
OF.49 Number of
people on Gangs matrix
133 55 27 G Same Local indicator
The number of gang members recorded on the 2013/14 Lambeth Gangs Matrix has reduced by 96 (-72%) from the baseline of 133, as at September 2015. 37 remain on the matrix. 18 are subject to custodial sentences and 78 have affected a positive exit. A positive exit will relate to the cessation of problematic and criminal behaviour and the absence of intelligence related to gang involvement. For many, this will be through access to new support networks, training or employment opportunities. There has been similar reductions in the number of gang members in the 2014/15 cohort (-66%) and 2015/16 cohort (-37%).

10
People are healthier for longer
Ref. Performance Indicator
2014/15 baseline
2015/16 Target
Oct Actual
Nov Actual
Dec Actual YTD Q3 RAG
DOT QTR
Benchmarking National London
Neighbours
Q3 Quarterly performance commentary
Management action
OF.104
Number of eligible adults (aged 40 - 74
and without pre-existing long-
term conditions) who have
received an NHS Health Check
28.14% (gap of 20.7%)
Narrow the gap between
Lambeth and the London average
17.7% (Q3)
R Better
Data errors affecting Q1 performance now rectified. Performance will continue to be monitored to ensure ongoing improvements are embedded.
OF.105
Number of people in drug or
alcohol treatment who were retained
for 12 weeks or more, or
completed treatment
1404 Increase
from 2014/15
1397 (Aug) 1397 (Sept) 1397 A Worse
Performance is marginally off target and stable, showing efficient use of available capacity. Data is provided three months in arrears.
OF.106
Successful completions
from drug treatment –
opiates
8.30% Better than
Local Comparators
7.89% 7.14% 7.1% A Worse
7.8 9.0
Hackney - 8.9 Haringey - 9.3
Lewisham - 11.6 Southwark - 6.0
Current worsening trend in performance may be partly attributable to an identified data input error in a large provider.
Remedial action has been taken and should be reflected in next report.
OF.107
Successful completions
from drug treatment – non
opiates
34.10% Better than
Local Comparators
39.02% 41.40% 41.4% A Better
37.2 37.7
Hackney - 31.1 Haringey - 35.2 Lewisham - 50.1 Southwark - 34.2
Performance will continue to be monitored through provider forum and individual contract monitoring to ensure positive direction of travel is maintained.
OF.108
Proportion of drug treatment clients with no
record of completing a
course of HBV vaccinations as a proportion of all eligible clients
79.70% Reduce from
2014/15 81.1% (Q2) A Worse
Local indicator Provider asked to bring forward remedial plan to address apparent decline in screening and vaccination rates, which will be monitored via contract review process.

11
Lambeth residents have more opportunities for better quality homes
Ref. Performance Indicator
2014/15 baseline
2015/16 Target
Oct Actual
Nov Actual
Dec Actual YTD Q3 RAG
DOT QTR
Benchmarking National London
Neighbours
Q3 Quarterly performance commentary
Management action
OF.59
Number of households where
major aids and adaptations are
delivered
216 200 29 12 18 177 G Better Local indicator
The direction of travel is slightly better than this time last year. This is mainly due to some procedural changes to improve the service. Further changes to improve the service are being planned for February 2016 which should enable the overall target to be exceeded
In December 2015 the service was able to obtain a waiver from the procurement Board and Director to enable to the continued use of the three framework contractors for bathroom adaptations. The re- procurement process has started and will be completed with the new contractors in place by 1/7/2016. Any delays to the re-procurement will have some impact in Q2 but a major impact Q3 and Q4 in 2016/17 and therefore overall performance in 2016/27
OF.60 Number of new
affordable housing units delivered
859 285 0 0 0 G Same
_ _
Lewisham - 728 Southwark 1154
Two schemes scheduled to complete by the end of December will now complete in the final quarter. The target of 285 is expected to be achieved by the end of the year.
OF.63
Number of new private sector
tenancies created as a prevention of
homelessness
270 660 25 44 46 357 R Worse Local indicator
Performance is down by 12% in Q3 nonetheless 115 new permanent homes in the private rented sector were created for families threatened with homelessness who would otherwise have made a homeless application and been accepted as homeless (see OF.67). Lambeth reported highest performance in London for this prevention measure in Q2, 131 new homes.
1. The annual target remains very challenging in the context of a competitive, high rent, local and London market. 2. Private sector procurement plays a key role in the Temporary Accommodation Reduction Pan and is monitored monthly at the Temporary Accommodation Reduction Plan meetings.
OF.64
Number of Lambeth Council homes
brought up to LHS standard in-year
2696 2,100 1028 2428 G Better Local indicator
Productivity in quarter 3 of the 2015/16 capital programme has been high, with a further 1,028 homes brought up to the Lambeth Housing Standard (LHS) by the end of December. The completed works have now exceeded the annual target that we set at the start of the year and we expect to be able to revise our annual target for 2015/16 upward to 5,000+ properties. This should be agreed for quarter 4 (end of year). During the first 4 years of the programme (2012-2016), we will have brought 14,723 homes to the LHS standard, which included 12,025 to the Decent Homes Standard (DHS) standard. Although there remain a number of challenges in delivering the LHS programme, a large number of improvements have been made, including: > New internal audit process to increase Lambeth’s ability to collect income from leaseholders. Interim bills have been issued to leaseholders across entire program and final Section 20 bills have been issued across the program, with the exception of four schemes within the North and Central areas that are undergoing further diligence checks and should
We will continue to improve our management of the capital programme to ensure that Lambeth citizens receive the best outcomes that we meet the GLA requirements to make 2,125 homes decent and honour the commitments made to stakeholders in communications. Our mid-term review of the LHS programme indicates that 6,860 homes will be brought up to LHS standards which includes 3,864 homes brought up to DHS standards during 2015/16. We are now revising the quarterly targets against the remaining 15/16 programme. Our final targets for 2016/17 are dependent on the agreed budget which will be set in the 2016/17 budget cycle. As GLA funding to bring housing stock up to DHS ends in 2015/16, it is also recommended that we only report on LHS from April 2016. DHS includes mostly internal elements, plus roofs and windows, and is a subset of LHS which also includes improvements to external elements, insulation, drainage, CCTV/ door entry etc.

12
Ref. Performance Indicator
2014/15 baseline
2015/16 Target
Oct Actual
Nov Actual
Dec Actual YTD Q3 RAG
DOT QTR
Benchmarking National London
Neighbours
Q3 Quarterly performance commentary
Management action
be issued in October 2015. > Lambeth have engaged an independent leaseholder expert to support delivery of the Major Works Action Plan. > A borough-wide communication strategy across the entire program has been agreed and is being delivered. > Technical Inspectors have been employed to implement GLA audit recommendations regarding quality control. > Suppliers for Mechanical and Electrical works on the programme have submitted tenders which are now undergoing validation.
OF.66
Number of households where
homelessness is prevented
1263 1,300 99 132 135 1049 G Better
-
847 Hackney - 838
Lewisham - 764 Southwark - 1788
LG Inform 2015
For the second consecutive quarter sustained levels of high homeless prevention and relief performance is reported. Performance is contributing to reductions in new levels of demand for temporary accommodation, homeless acceptance levels (OF.67), and temporary accommodation occupation levels (OF.65). In Q2 Lambeth reported second highest prevention performance in Inner London (including Croydon).
1. At the end of Q3 performance is above target for the time of year and is on course to deliver the 2015/16 target.
OF.67 Number of
homelessness acceptances
504 <700 63 52 40 387 G Better
- 547
Hackney - 902 Lewisham - 769 Southwark - 857
LG Inform 2015
Performance at the end of Q3 is well within target for the time of year and is on course to deliver the annual target. 4,700 households were accepted as homeless in London in Q2. Lambeth reported 5th lowest homeless acceptance levels in Inner London including Croydon.
The Temp to Settled Scheme (reported in OF.63) is reducing temporary accommodation occupation levels (OF.65) and homeless acceptance levels (see OF.65). High levels of homeless prevention actions (see OF.66) are reducing new quarterly demand for temporary accommodation.
OF.68
Number of households in
nightly charged accommodation (B&B Hotels and
Annexes)
791 <700 794 802 800 N / A R Better
- 487
Hackney – 497 Southwark - 231 Lewisham – 471
(DCLG Q1 2015)
Performance has improved since the Q2 report and every effort is made to minimise use of B&B Hotels and B&B Annexes. It should be noted that in the absence of old style leased properties for use as temporary accommodation many London councils are forced to rely on self-contained B&B Annexe accommodation for families. Use of B&B Annexe accommodation contributes to good performance reported in OF.69.
1. There is a Temporary Accommodation Reduction Plan in place that is monitored at fortnightly meetings. The transfer of families out of BB Annexes and into permanent homes in the private sector is monitored at those meetings and remains a high priority. 2. The Temp to Settled Programme ensures that use of B&B Annexes is minimised by quickly matching families with homes in the private rented sector. 3. Also helping to reduce occupation levels is a programme of work in place to contact households newly placed in temporary accommodation to encourage then to move out into private rented accommodation or return to family/friends, where possible, with the reward of priority housing (B&B).
OF.69 Number of families in shared Bed and
2 0 0 0 1 R Better -
14.4 Tower Hamlets – 174
Performance has improved since the Q3 report when there were 13 families in shared B&B for 6+ weeks. At the end of Q3 there was 1 family
1. The transfer of families out of Shared B&B and into more suitable accommodation is monitored weekly and is a high priority.
13
Ref. Performance Indicator
2014/15 baseline
2015/16 Target
Oct Actual
Nov Actual
Dec Actual YTD Q3 RAG
DOT QTR
Benchmarking National London
Neighbours
Q3 Quarterly performance commentary
Management action
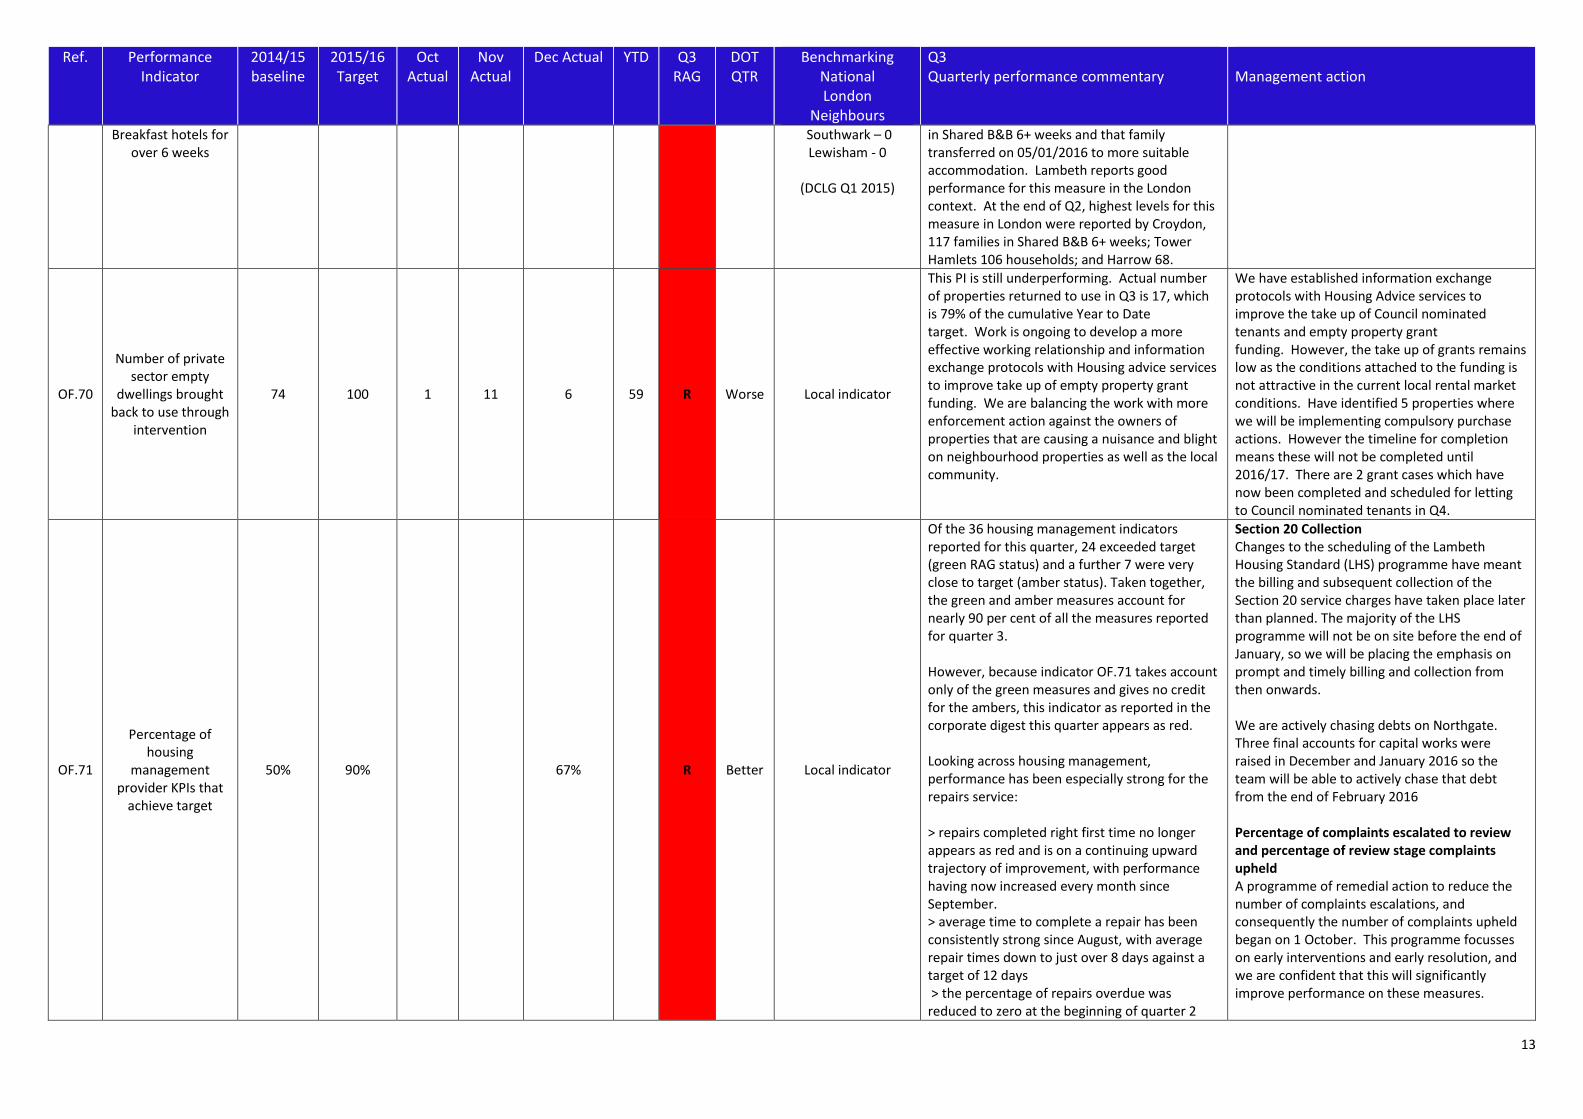
Breakfast hotels for over 6 weeks
Southwark – 0 Lewisham - 0
(DCLG Q1 2015)
in Shared B&B 6+ weeks and that family transferred on 05/01/2016 to more suitable accommodation. Lambeth reports good performance for this measure in the London context. At the end of Q2, highest levels for this measure in London were reported by Croydon, 117 families in Shared B&B 6+ weeks; Tower Hamlets 106 households; and Harrow 68.
OF.70
Number of private sector empty
dwellings brought back to use through
intervention
74 100 1 11 6 59 R Worse Local indicator
This PI is still underperforming. Actual number of properties returned to use in Q3 is 17, which is 79% of the cumulative Year to Date target. Work is ongoing to develop a more effective working relationship and information exchange protocols with Housing advice services to improve take up of empty property grant funding. We are balancing the work with more enforcement action against the owners of properties that are causing a nuisance and blight on neighbourhood properties as well as the local community.
We have established information exchange protocols with Housing Advice services to improve the take up of Council nominated tenants and empty property grant funding. However, the take up of grants remains low as the conditions attached to the funding is not attractive in the current local rental market conditions. Have identified 5 properties where we will be implementing compulsory purchase actions. However the timeline for completion means these will not be completed until 2016/17. There are 2 grant cases which have now been completed and scheduled for letting to Council nominated tenants in Q4.
OF.71
Percentage of housing
management provider KPIs that
achieve target
50% 90% 67% R Better Local indicator
Of the 36 housing management indicators reported for this quarter, 24 exceeded target (green RAG status) and a further 7 were very close to target (amber status). Taken together, the green and amber measures account for nearly 90 per cent of all the measures reported for quarter 3. However, because indicator OF.71 takes account only of the green measures and gives no credit for the ambers, this indicator as reported in the corporate digest this quarter appears as red. Looking across housing management, performance has been especially strong for the repairs service: > repairs completed right first time no longer appears as red and is on a continuing upward trajectory of improvement, with performance having now increased every month since September. > average time to complete a repair has been consistently strong since August, with average repair times down to just over 8 days against a target of 12 days > the percentage of repairs overdue was reduced to zero at the beginning of quarter 2
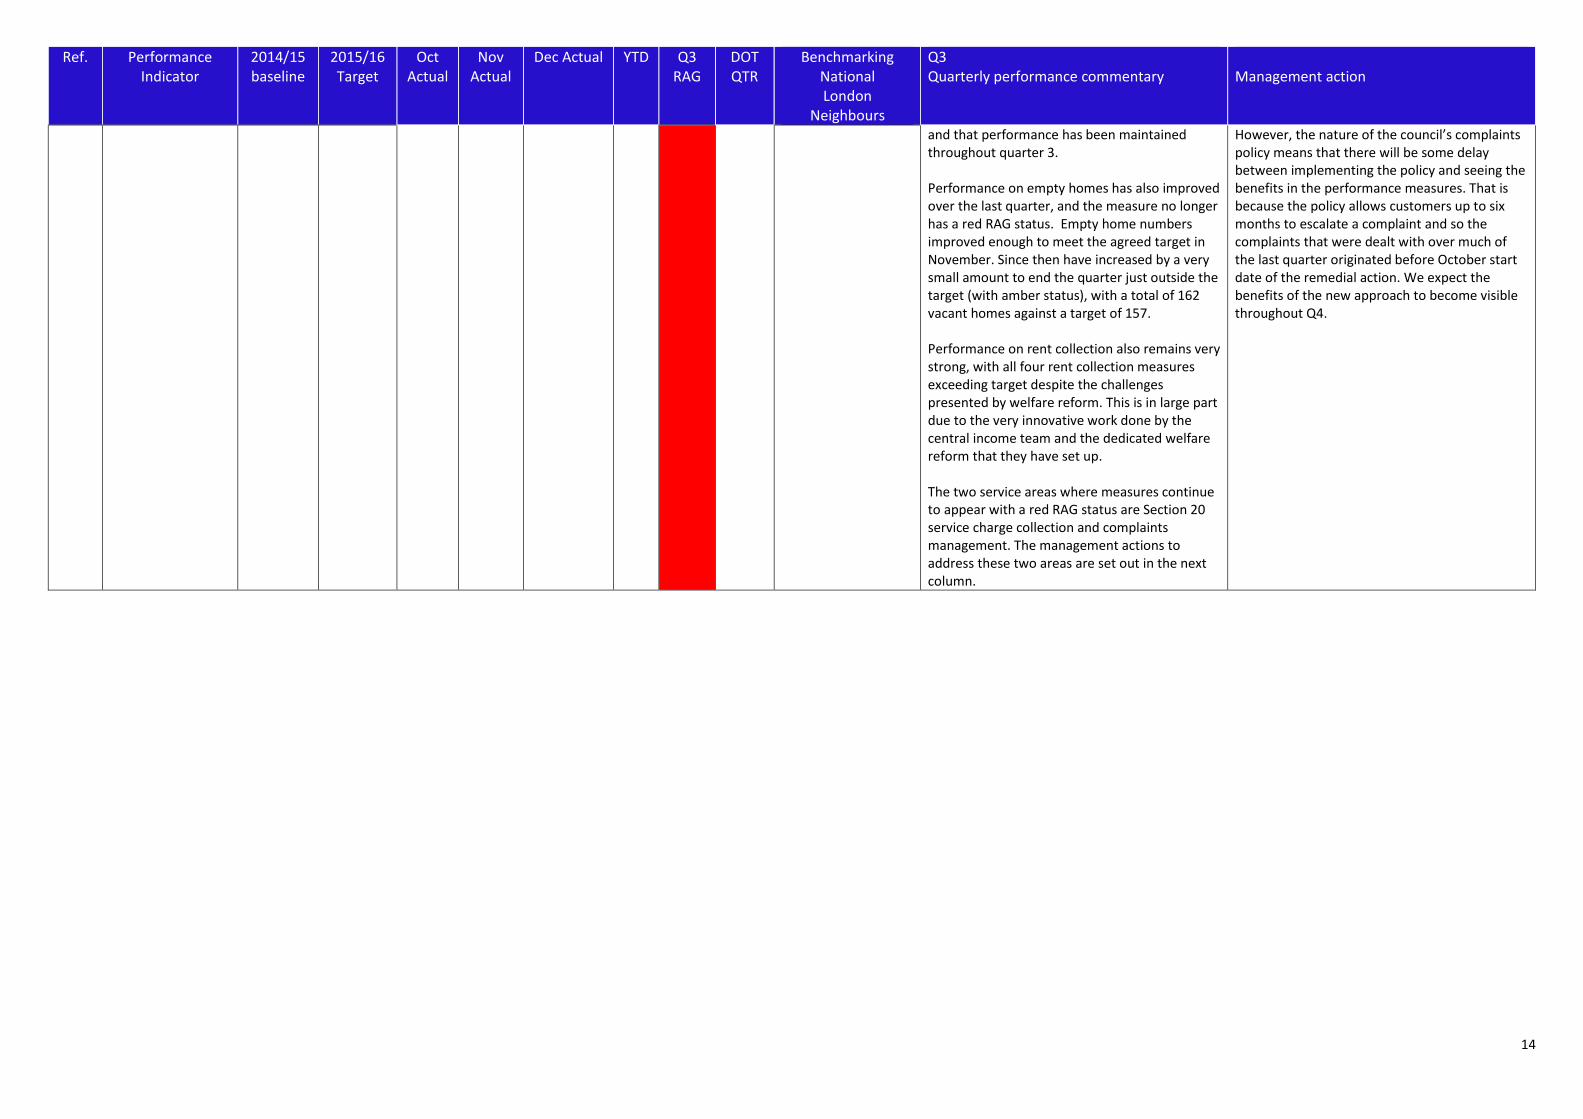
Section 20 Collection Changes to the scheduling of the Lambeth Housing Standard (LHS) programme have meant the billing and subsequent collection of the Section 20 service charges have taken place later than planned. The majority of the LHS programme will not be on site before the end of January, so we will be placing the emphasis on prompt and timely billing and collection from then onwards. We are actively chasing debts on Northgate. Three final accounts for capital works were raised in December and January 2016 so the team will be able to actively chase that debt from the end of February 2016 Percentage of complaints escalated to review and percentage of review stage complaints upheld A programme of remedial action to reduce the number of complaints escalations, and consequently the number of complaints upheld began on 1 October. This programme focusses on early interventions and early resolution, and we are confident that this will significantly improve performance on these measures.
14
Ref. Performance Indicator
2014/15 baseline
2015/16 Target
Oct Actual
Nov Actual
Dec Actual YTD Q3 RAG
DOT QTR
Benchmarking National London
Neighbours
Q3 Quarterly performance commentary
Management action
and that performance has been maintained throughout quarter 3. Performance on empty homes has also improved over the last quarter, and the measure no longer has a red RAG status. Empty home numbers improved enough to meet the agreed target in November. Since then have increased by a very small amount to end the quarter just outside the target (with amber status), with a total of 162 vacant homes against a target of 157. Performance on rent collection also remains very strong, with all four rent collection measures exceeding target despite the challenges presented by welfare reform. This is in large part due to the very innovative work done by the central income team and the dedicated welfare reform that they have set up. The two service areas where measures continue to appear with a red RAG status are Section 20 service charge collection and complaints management. The management actions to address these two areas are set out in the next column.
However, the nature of the council’s complaints policy means that there will be some delay between implementing the policy and seeing the benefits in the performance measures. That is because the policy allows customers up to six months to escalate a complaint and so the complaints that were dealt with over much of the last quarter originated before October start date of the remedial action. We expect the benefits of the new approach to become visible throughout Q4.

15
People achieve financial security
Ref. Performance Indicator
2014/15 baseline
2015/16 Target
Oct Actual
Nov Actual
Dec Actual YTD Q3 RAG
DOT QTR
Benchmarking National London
Neighbours
Q3 Quarterly performance commentary
Management action
OF.89
Proportion of all households in arrears
with their Council Tax payments
13.50% Reduce
from 2014/15
12.40% 11.50% 12.00% 12.0% G Better Local indicator
Performance against this indicator remains stable No major issues and constantly being monitored via contract
OF.91
Proportion of residents referred to the Lambeth Advice Network that have been supported to resolve a benefits,
housing or debt issue
New 60% 60% G Better Local indicator
Outcomes from the four Lambeth Advice Network providers have increased in the last quarter as many open cases are resolved. This figure is also expected to be an under-representation of the actual performance as one of the providers was not accurately recording successful outcomes for the first two quarters.
OF.92 Number of multiple
debtors (to the council)
1898 Decrease
from 2014/15
2620 2630 2595 A Better Local indicator
The number of multiple debtors has decreased over this quarter but still remains above the baseline. This is the number of accounts that are in arrears for Council tax and council rent of at least £100 in each. We expect the number to decline over the year as Council Tax and other debts are settled or payment plans agreed.
A project to support people who receive a summons for non-payment of Council Tax began in October. This offers residents receiving a summons the opportunity to engage with Advising London, a local charity, to work out a payment plan for the Council Tax and also to look at wider budgeting and debt issues. Residents engaging with the project will avoid getting into further debt and incurring further court costs. Early indications are that the number of people engaging with this support is low, so we are reviewing the methods used to encourage people to engage with Advising London. This meeting is scheduled for 9 February. Officers involved in the collection of rents, Council Tax and financial resilience are meeting on 16 February to discuss further, with recommendations being taken to the Financial Resilience Cabinet Sub-group on 1 March.
OF.93
Number of Every Pound Counts clients supported to achieve
benefit gains
1800 1800 1190 A Better Local indicator
In the last quarter 435 residents were supported to achieve benefit gains in cases which were closed. This was an increase compared to 337 in the previous quarter. The speed at which clients can be supported to achieve benefit gains is largely outside of the control of EPC as it is dependent on how quickly DWP respond to benefit applications, appeals and requests for review.

16
All young people have the opportunity to achieve their ambitions
Ref. Performance Indicator
2014/15 baseline
2015/16 Target
Oct Actual Nov Actual
Dec Actual YTD Q3 RAG
DOT QTR
Benchmarking National London
Neighbours
Q3 Quarterly performance commentary
Management action
OF.07
Percentage of children’s centres
judged good or better in Ofsted inspections
89% 90% 100.0% 100.0% 100.0% 100.0% G Same Data unavailable
There have been no Ofsted inspections of children's centres in Q3 2015. The government is currently undertaking a review of children's centres.
none
OF.14 Percentage of schools judged good or better in Ofsted inspections
86% 90% 91% 91% 92% 92% G Better -
85% -
Performance has improved in Quarter 3 as a primary school was inspected in December 2015 and removed from the category 'requires improvement' and is now judged 'good' overall.
OF.16
Percentage of young people in suitable
education, training or employment at the end
of their YOS intervention
80.3% 80.0% 61% (as at Sept 2015)
R Worse Recent data unavailable
As at September 2015, the number of YOS clients in EET was 61%. This is a reduction of 9% points compared with the last quarter. The overall target for ETE in the YOS has been raised to 80% and performance is currently at 61% overall, 77% for school-aged and only 66% for above school age young people.
To raise performance, a regular monthly monitor of NEET young people is produced with targeted intervention for the relevant young people and their parents by the two workers in the YOS that work on EET issues. Service provision for the difficult to reach post-16 NEET cohort is being expanded.
OF.17 Rate of permanent
exclusions from school 0.04% 0.10%
0.03% (12 exclusions)
0.01% (7 exclusion
s)
0.01% (6 exclusions)
0.12% (45
exclusions)
G Same
0.07% 0.07%
Hackney - 0.1% Haringey - 0.1%
Lewisham - 0.13% Southwark - 0.05%
LG Inform 2015
Percentages based on pupil population of 35470 per R&S. Three permanent exclusions avoided within this period by undertaking Managed Transfers.
Managed Transfers to continue to be utilised where apt in order to reduce the number of exclusions.

17
People have the skills to find work
Ref. Performance Indicator 2014/15 baseline
2015/16 Target
Oct Actual
Nov Actual
Dec Actual YTD Q3 RAG
DOT QTR
Benchmarking National London
Neighbours
Q3 Quarterly performance commentary
Management action
OF.13
Percentage of young People in cohort years 12-14 who are not in
Education, Training or Employment (NEET)
3.10% 2.10% 2.04% 1.75% 1.98% 3.50% G Better
4.8% 3.4%
Hackney - 3.5% Haringey - 3.0% Lewisham - 3.5% Southwark - 2.0%
LG Inform 2014/15
The variation for quarter 2 and quarter 3 is always around destinations unknown at this specific time of year (we have many leavers who have not specified destination (March to June). In quarter 3, the council undertakes September guarantee place significant chasing of offer measures – this tracks down all young people to ensure that they have an offer in education or training (apprenticeship). We cross check all London all schools leaver destinations and cross check with all schools and college enrolment data to ensure that young people have arrived at destination. This full chasing (September Guarantee) is tied up usually by end of September (but usually mid-October) hence sharp decrease in numbers of NEETs (our Q3 to the end of September). Lambeth's has the 2nd lowest number of NEET's across the 7 other London boroughs that make up the London Partnership.
OF.114
Number of unemployed residents with barriers to
progression that are supported into work
through Lambeth Working
372 375 41 54 22 255 A Better Local indicator
2015-16 targets were profiled using 14-15 performance figures as a baseline; the labour market is however more buoyant than 12 months ago with the number of economically active, but unemployed people reducing significantly; and the JSA claimant count dropping from 3% (October 14) to 2.5% (October 15). Lambeth Working has noted numbers of job-ready candidates being referred for job roles has reduced, with a more 'hands-on' approach to candidate engagement, and job preparation such as development of soft skills and additional training necessary in order to progress those with barriers into employment. As the Lambeth Working team approaches full capacity performance is anticipated to continue to increase in Q4. December is a typically quiet month for recruitment but indicative figures for January demonstrate strong performance, particularly in the recruitment of Lambeth residents into construction.
In response to changes in the labour market and decreasing JSA registers, two Link Worker posts have been created for recruitment in Q4 from existing NHB funds to support the delivery of a more intensive candidate facing employment support service. A communications /engagement plan targeting unemployed residents not already accessing services such as JCP or third sector provision is in development, with a focus on partnership working with Lambeth RSLs for resident engagement.
OF.120
Number of employers supported to employ
through Lambeth Working
54 300 26 8 6 166 R Worse Local indicator
Lambeth Working is taking a pan-team holistic approach to employer contact and only counting each employer once against this performance indicator, regardless of how many times they recruit through the brokerage. The impact of this is particularly significant in construction, where developers/contractors may be on site for a
Delivery against this particular indicator has been in some part impacted by the delayed recruitment to NHB posts, particularly in apprenticeships where planned activity around engagement of BID businesses in work-based learning (apprenticeships and traineeships) has been pushed back to 2016-

18
Ref. Performance Indicator 2014/15 baseline
2015/16 Target
Oct Actual
Nov Actual
Dec Actual YTD Q3 RAG
DOT QTR
Benchmarking National London
Neighbours
Q3 Quarterly performance commentary
Management action
period of years and recruit multiple residents on multiple occasions; however they are only counted against this target once. The direction of travel for the brokerage is to establish and maintain exclusive relationships with employers through an account management function, encouraging employers such as Pret a Manger and Premier Inn to use Lambeth Working exclusively to recruit for their vacancies on an ongoing basis.
17. It is however proposed that this target be reviewed in 2016-17; as the current high target for employer engagement is counter-productive to the development of long term, exclusive relationships with employers by Lambeth Working. In terms of effective resource management, repeat business from employers should be encouraged through delivery of an employer account management function, with the desired outcome being the recruitment of higher numbers of residents into a proportionately smaller number of employers.
OF.121
Number of Lambeth residents supported into employment through the tri-borough Pathways to Employment programme
2 (3
months)
The annual
target for this is
currently 37. This
will increase from Dec
30 R Same Local indicator
Phase One of Pathways to Employment is now closed. The 30 job starts that were achieved were less than the target of 37 in Lambeth, and this was largely due to a lower number of participants being referred to the programme. Phase Two is due to start in January 2016 subject to final negotiations about European Social Fund with London Councils.

19
Lambeth plays a strong role in London’s economy
Ref. Performance Indicator 2014/15 baseline
2015/16 Target
Oct Actual
Nov Actual
Dec Actual YTD Q3 RAG
DOT QTR
Benchmarking National London
Neighbours
Q3 Quarterly performance commentary
Management action
OF.55
Major applications determined within 13
weeks or in accordance with Planning
Performance Agreement
88.30% 85% 100% 100% 100% 98% G Better
77% 77%
Hackney - 71% Haringey - 100% Lewisham - 90% Southwark - 85%
LG Inform 2015
The development management team’s performance in terms of major applications continues to be high with 100% of these strategic developments being determined within the agreed time-frame.
Continue to ensure that all major applications are determined within 13 weeks or the timeframe specified in the PPA. Continue to promote use of our PPA service to applicants to assist with this.
OF.56 Minor & Other planning applications determined
within 8 weeks 74.71% 75% 81% 88% 91% 85% G Better
77% 69%
Hackney - 74% Haringey - 77% Lewisham - 74% Southwark - 83%
LG Inform 2015
Performance in terms of determining small and medium sized applications continues to improve, there has been a month by month increase over Q3 and the YTD is currently higher than the two previous years.
Work further to reducing the number of minor and other applications which are not determined within 8 weeks.
OF.57 Annual S106 spend is met 111.00% 90% 8% NA 28% 36% A Worse Local indicator
Q3 saw Section 106 expenditure draw down of over £1.9 million, taking expenditure in year to 36% against total profiled expenditure. However, much of this expenditure was transfer to TfL for Northern Line Extension Payment, and other works. Actual expenditure draw downs on Council led projects remains low, against profile expenditure. Expenditure in Q4 expected to increase, as service areas seek to undertake drawdowns for 2015/16. In addition, additional Section 106 allocations progressed through Sept and Dec AMIG and AMCAP Meetings.
AIMG request for relevant Directors to provide position statement where Section 106 draw downs are falling behind projected spend, remedial action to be taken to address this. First AIMG officer sub group regarding Infrastructure provision and Section 106 and CIL allocation and spend will take place in early 2016.

20
People live in, work in and visit our vibrant and creative town centres
Ref. Performance Indicator 2014/15 baseline
2015/16 Target
Oct Actual
Nov Actual
Dec Actual YTD Q3 RAG
DOT QTR
Benchmarking National London
Neighbours
Q3 Quarterly performance commentary
Management action
OF.130 Visitor numbers in
libraries 1,371,998
Increase by 3%
140,057 119,993 103,180 1,104,913 G Same Not available
This is a 12% increase on the Q3 performance for 2014-15. Overall this is a 5% increase to date on last year. In 2014-15 only two library authorities in England, Scotland and Wales had an increase across the three indicators of visits, memberships and issues. These were Lambeth and Manchester. This year's performance is building on last year's high level of improvement.
Continue to deliver the annual library and archives plan and deliver on its targets to maintain strong performance
OF.134 Miles of carriageways
and footways resurfaced 28 miles 30 miles 23 miles G Same Local indicator
The indicator is on target to be achieved.
21
People take greater responsibility for their neighbourhoods
Ref. Performance Indicator 2014/15 baseline
2015/16 Target
Oct Actual
Nov Actual
Dec Actual YTD Q2 RAG
DOT QTR
Benchmarking National London
Neighbours
Q2 Quarterly performance commentary
Management action
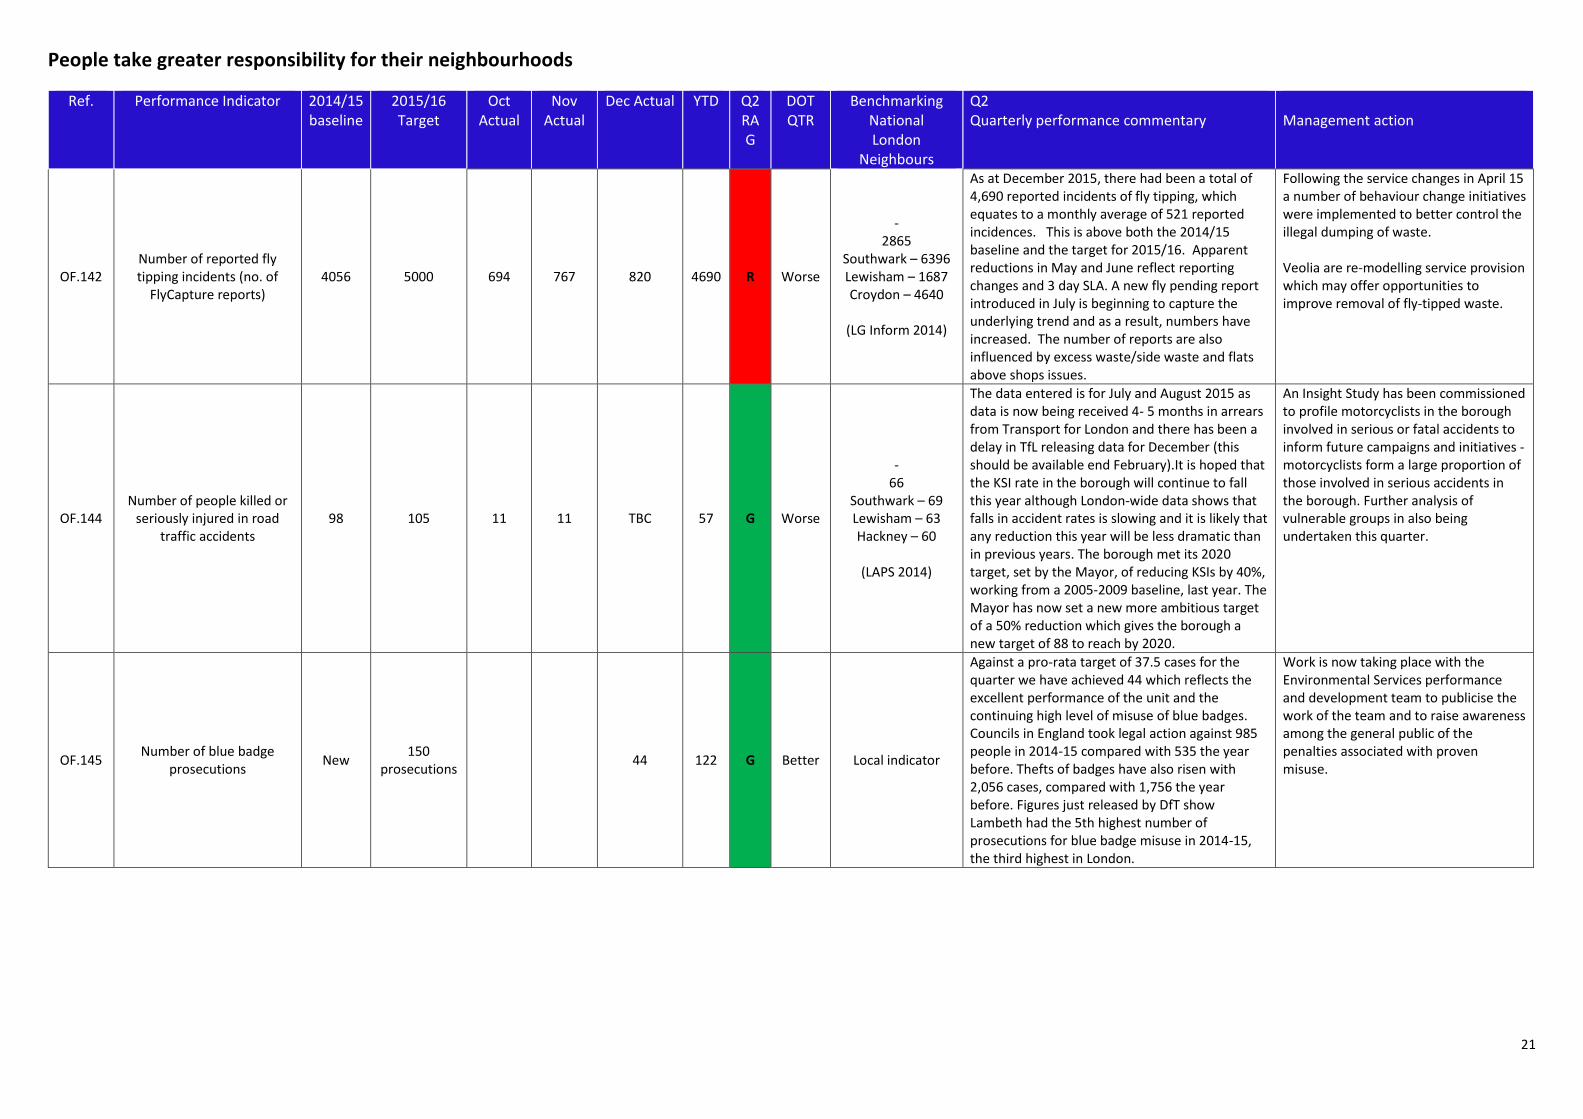
OF.142 Number of reported fly tipping incidents (no. of
FlyCapture reports) 4056 5000 694 767 820 4690 R Worse
- 2865
Southwark – 6396 Lewisham – 1687 Croydon – 4640
(LG Inform 2014)
As at December 2015, there had been a total of 4,690 reported incidents of fly tipping, which equates to a monthly average of 521 reported incidences. This is above both the 2014/15 baseline and the target for 2015/16. Apparent reductions in May and June reflect reporting changes and 3 day SLA. A new fly pending report introduced in July is beginning to capture the underlying trend and as a result, numbers have increased. The number of reports are also influenced by excess waste/side waste and flats above shops issues.
Following the service changes in April 15 a number of behaviour change initiatives were implemented to better control the illegal dumping of waste. Veolia are re-modelling service provision which may offer opportunities to improve removal of fly-tipped waste.
OF.144 Number of people killed or
seriously injured in road traffic accidents
98 105 11 11 TBC 57 G Worse
- 66
Southwark – 69 Lewisham – 63 Hackney – 60
(LAPS 2014)
The data entered is for July and August 2015 as data is now being received 4- 5 months in arrears from Transport for London and there has been a delay in TfL releasing data for December (this should be available end February).It is hoped that the KSI rate in the borough will continue to fall this year although London-wide data shows that falls in accident rates is slowing and it is likely that any reduction this year will be less dramatic than in previous years. The borough met its 2020 target, set by the Mayor, of reducing KSIs by 40%, working from a 2005-2009 baseline, last year. The Mayor has now set a new more ambitious target of a 50% reduction which gives the borough a new target of 88 to reach by 2020.
An Insight Study has been commissioned to profile motorcyclists in the borough involved in serious or fatal accidents to inform future campaigns and initiatives - motorcyclists form a large proportion of those involved in serious accidents in the borough. Further analysis of vulnerable groups in also being undertaken this quarter.
OF.145 Number of blue badge
prosecutions New
150 prosecutions
44 122 G Better Local indicator
Against a pro-rata target of 37.5 cases for the quarter we have achieved 44 which reflects the excellent performance of the unit and the continuing high level of misuse of blue badges. Councils in England took legal action against 985 people in 2014-15 compared with 535 the year before. Thefts of badges have also risen with 2,056 cases, compared with 1,756 the year before. Figures just released by DfT show Lambeth had the 5th highest number of prosecutions for blue badge misuse in 2014-15, the third highest in London.
Work is now taking place with the Environmental Services performance and development team to publicise the work of the team and to raise awareness among the general public of the penalties associated with proven misuse.

22
People lead environmentally sustainable lives
Ref. Performance Indicator 2014/15 baseline
2015/16 Target
Oct Actual
Nov Actual
Dec Actual YTD Q2 RAG
DOT QTR
Benchmarking National London
Neighbours
Q2 Quarterly performance commentary
Management action
OF.124 Percentage of municipal
waste that is recycled (EU option 4)
45% 48% 44.49% A Same Unavailable
Performance is currently below target and has remained broadly the same compared to Q2.
The phase 3 waste strategy is currently under development to take recycling to the next level. The strategy is building on data and experience from across London on what works. A trial of wheeled bins is underway in the Herne Hill area and the results will inform the future service configuration.
OF.125 Kerbside households – waste sent for reuse,
recycling or composting 38% 39% 37.87% 37.47% 38.02% 37.27% A Better Unavailable
Kerbside recycling performance in December improved from preceding months. However, despite our ambition for people to recycle more, as at December 2015, our YTD kerbside recycling rate is 37.27%, below our 2014/15 baseline of 38.40%.
As above
OF.126 Estate households – waste sent for reuse,
recycling or composting 19.50% 20% 20.60% 19.94% 20.86% 19.92% G Better Unavailable
Since September 2015, the monthly percentage of estate waste sent for recycling has consistently been above target, reflected in the YTD figure of 19.92% which is above the target of 19.50%. It is important to note that Lambeth experience many of the same issues as other boroughs and is place in the middle for performance compared to other London boroughs.
Work is underway with Housing colleagues to develop the next push on recycling on estates.
OF.127 Household waste that is sent for reuse, recycling or composting (NI192)
30.32% 30% 30.56% G Better
43.5% 35.4%
Lewisham – 17.1% Croydon – 34.8%
Hackney – 25.48%
(LAPS Q1 2015/16)
Performance is above the set target for Q3. As above
OF.129 Total household waste
generated per household 657kg 650kg 51.00 51.72 53.91 470.42 G Better Unavailable
The amount of waste generated in Q3 has gone down compared to Q2 and the outturn is significantly lower compared to the same period in the previous year.

23
Corporate Health
Ref. Performance Indicator 2014/15 baseline
2015/16 Target
Oct Actual
Nov Actual
Dec Actual YTD Q3 RAG
DOT QTR
Benchmarking National London
Neighbours
Q3 Quarterly performance commentary
Management action
OF.20 Agency workers as a
percentage of workforce 17.5% 12% 19.48% 16.60% 15.52% 15.52% R Better Local indicator
Heads of People Management are working closely with business areas to reduce usage where possible. There continues to be close scrutiny of data by the unions at CCF with a strong focus on longer term and higher paid agency workers. Recent months have seen a good reduction in the use of agency workers, down from 19.5% to 15.5% in this quarter alone.
There is a high reliance of agency workers in children’s social care. This is being addressed by looking closely at the need for agency workers as well as recruiting more permanent workers to the business area, including absorbing agency workers to permanent positions where possible. Running alongside this are plans to review remuneration as a means of recruiting and retaining staff. The service is currently undergoing a restructure and it is anticipated that this will also result in the number of agency workers reducing. More generally there has been a specific initiative rolled out whereby all Directors have been instructed to review the usage of all agency workers in their area with a view to business cases being submitted for all agency workers they wish to retain. This will required sign off by the relevant Strategic Director and the Corporate Management Team. This initiative has so far resulted in an overall reduction in agency worker numbers from 633 at the start of the exercise to 517 at the end of January.
OF.21
Average days to process new Housing Benefit claims and change in
circumstances
8.60 12.5 - 15 days 15.3 17.9 16.8 12.16 A Worse
- 9.5
Lewisham – 5.9 Southwark – 7.6
(LAPS 2014/15)
Q3 has been a challenging quarter with ICT and restructure related issues leading to a decline in performance.
This indicator will always demonstrate a better outturn in Q1 and Q4. As the YTD to the end of Q3 remains below target it is expected that the target at the end of the year will be achieved. Issues which affected Q3 appear resolved, however recording and resolution protocols for ICT related issues are being reviewed to improve clarity and responsiveness.
OF.22 Average number of working days lost to
sickness per FTE 8.37 8.0
0.82 (9.84)
0.77 (9.24)
0.67 (8.04)
5.93 (7.91)
G Worse
- 8.0
Croydon – 6.5 Lewisham – 7.7
(LAPS 2014/15)
The average number of days lost to sickness is averaging out at 7.9 days per FTE so far this year, indicating a minor improvement on the previous year's performance. Efforts continue to ensure managers record sickness periods and reasons for their staff.
The Assistant Director, HR and Organisational Development is will working with Heads of People Management to address this and all information and guidance relating to sickness absence reporting and absence management held on the intranet has recently been refreshed and updated.
OF.23 Council tax collection
rate 95.0% 95.2% 65.50% 74.26% 83.20% 83.2% G Better
97.01% 96.36%
Lewisham - 94.32% Southwark - 95.00%
LG Inform 2014/15
Collection continues to be ahead when compared to the same period in the previous year (82.75%) and is ahead of the profile to meet the year-end target. Collection for council tax support accounts is also ahead of last year’s position despite the additional intervention added to process in line with income & debt policy
Recovery continues as planned and all accounts are picked up as soon as possible once they fall behind. Agreed interventions have been put in place and work continues to ensure that this trend continues.
24
Ref. Performance Indicator 2014/15 baseline
2015/16 Target
Oct Actual
Nov Actual
Dec Actual YTD Q3 RAG
DOT QTR
Benchmarking National London
Neighbours
Q3 Quarterly performance commentary
Management action
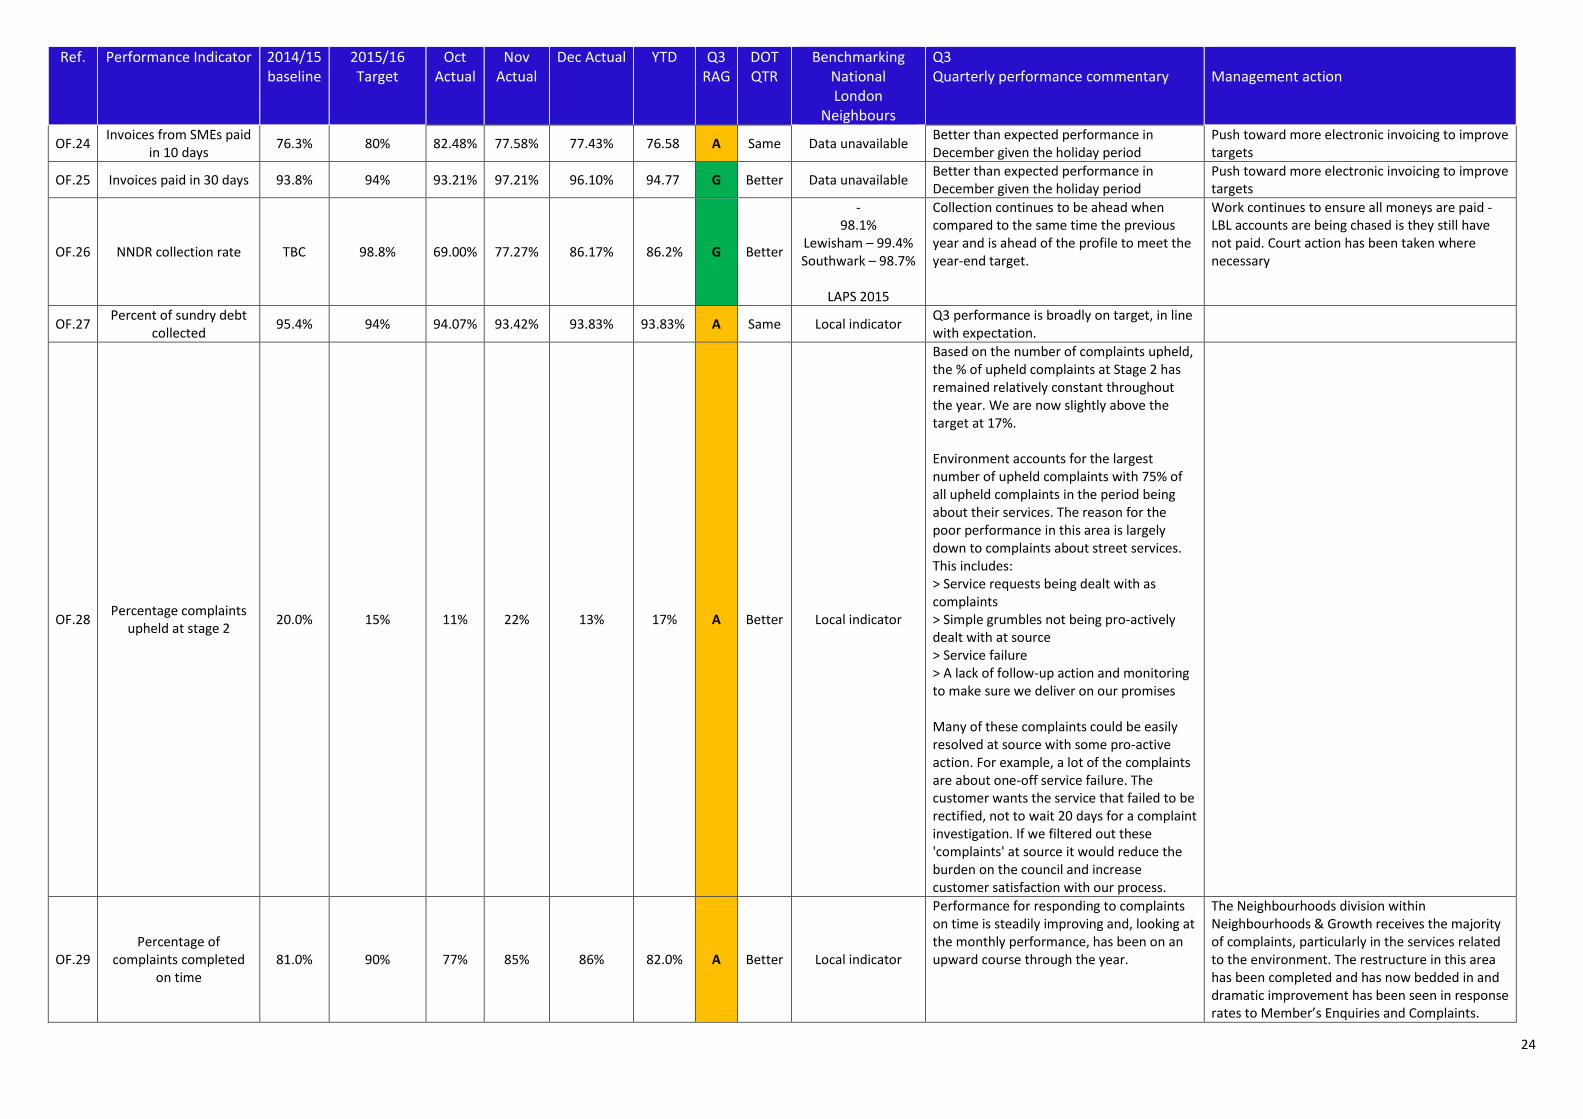
OF.24 Invoices from SMEs paid
in 10 days 76.3% 80% 82.48% 77.58% 77.43% 76.58 A Same Data unavailable
Better than expected performance in December given the holiday period
Push toward more electronic invoicing to improve targets
OF.25 Invoices paid in 30 days 93.8% 94% 93.21% 97.21% 96.10% 94.77 G Better Data unavailable Better than expected performance in December given the holiday period
Push toward more electronic invoicing to improve targets
OF.26 NNDR collection rate TBC 98.8% 69.00% 77.27% 86.17% 86.2% G Better
- 98.1%
Lewisham – 99.4% Southwark – 98.7%
LAPS 2015
Collection continues to be ahead when compared to the same time the previous year and is ahead of the profile to meet the year-end target.
Work continues to ensure all moneys are paid - LBL accounts are being chased is they still have not paid. Court action has been taken where necessary
OF.27 Percent of sundry debt
collected 95.4% 94% 94.07% 93.42% 93.83% 93.83% A Same Local indicator
Q3 performance is broadly on target, in line with expectation.
OF.28 Percentage complaints
upheld at stage 2 20.0% 15% 11% 22% 13% 17% A Better Local indicator
Based on the number of complaints upheld, the % of upheld complaints at Stage 2 has remained relatively constant throughout the year. We are now slightly above the target at 17%. Environment accounts for the largest number of upheld complaints with 75% of all upheld complaints in the period being about their services. The reason for the poor performance in this area is largely down to complaints about street services. This includes: > Service requests being dealt with as complaints > Simple grumbles not being pro-actively dealt with at source > Service failure > A lack of follow-up action and monitoring to make sure we deliver on our promises Many of these complaints could be easily resolved at source with some pro-active action. For example, a lot of the complaints are about one-off service failure. The customer wants the service that failed to be rectified, not to wait 20 days for a complaint investigation. If we filtered out these 'complaints' at source it would reduce the burden on the council and increase customer satisfaction with our process.
OF.29 Percentage of
complaints completed on time
81.0% 90% 77% 85% 86% 82.0% A Better Local indicator
Performance for responding to complaints on time is steadily improving and, looking at the monthly performance, has been on an upward course through the year.
The Neighbourhoods division within Neighbourhoods & Growth receives the majority of complaints, particularly in the services related to the environment. The restructure in this area has been completed and has now bedded in and dramatic improvement has been seen in response rates to Member’s Enquiries and Complaints.

25
Ref. Performance Indicator 2014/15 baseline
2015/16 Target
Oct Actual
Nov Actual
Dec Actual YTD Q3 RAG
DOT QTR
Benchmarking National London
Neighbours
Q3 Quarterly performance commentary
Management action
These are now answered by the Performance and Development officers who have a pool of specialist knowledge relating to the service from working in different parts of the department and are able to respond to complaints related to projects they are working on. Good relationships have been built up with officers in all parts of Environment through new systems and processes and this means that information to answer issues is either available within the team or is obtained quicker from the service area. Other initiatives that have led to improved performance include: > Weekly monitoring of performance and outstanding items > Introduction of a SharePoint spreadsheet for Streetcare items (the majority of cases). Streetcare officers input information to enable cases to be answered and a quick weekly meeting is held to iron out any queries. This is a smarter way of passing on information and frees up the time of Streetcare officers who are no longer inundated with emails > Availability of Streetcare Officer on street to fast track investigation and responses to urgent issues > Introducing a culture of investigating and answering early rather than aiming at the deadline > Taking on and eliminating backlogs in work areas such as Trees and Registrars
OF.30 Percentage of corporate
customer centre calls abandoned
2.6% 5% 2.80% 2.00% 1.40% 2.20% G Better Local indicator Performance continues to be well within target
OF.31
Percentage of Freedom of Information (FoI)
requests completed on time
72.0% 85% 75% 79% 79% 77% A Worse Local indicator
Q3 has seen a slight dip in FOI performance with the YTD figure dropping from 80% at the end of Q2 to 77% at the end of Q3. This is despite a general improvement in performance this year compared to the same period last year. Part of the reason for this is down to staff absence in the Corporate Complaints Unit, who are responsible for co-ordinating responses to requests. The team has been running at 2/3 capacity since the start of Q3 and this has had an impact on performance. At the same time the volume of requests is not going down.
Cover is currently being recruited to cover the absences in the Corporate Complaints Unit. Once in place this should see an improvement in performance, although the new officer is unlikely to be in post before the end of Q4. In addition to this we have not gone live with the updated intranet and internet pages. Therefore the benefit that we were expecting to see from this has not yet been delivered. When this does go live we would hope to see a positive impact. On a positive note, we have seen some improvement in FOI performance for Children's Social Care, which has historically been poor.

26
Ref. Performance Indicator 2014/15 baseline
2015/16 Target
Oct Actual
Nov Actual
Dec Actual YTD Q3 RAG
DOT QTR
Benchmarking National London
Neighbours
Q3 Quarterly performance commentary
Management action
OF.32 Percentage of Housing Management customer centre calls abandoned
5% 1.4% 1.9% 1.1% 1.9% G Better Data unavailable
Performance continues to improve remaining well below the target of fewer than 5 per cent abandoned calls, with the average level of abandonment reducing from 2.2 per cent at the end of quarter 2 to less than 2 per cent by the end of quarter 3. In addition to the low call abandonment rate shown here, performance has been strong on the average call answering time (22 seconds, one of the lowest in the sector) and the percentage of calls answered within target time (84 per cent answered within 20 seconds, also amongst the best in the sector).
We will continue the effective client management of our call handling contract with General Dynamics IT (GDIT) call centre to ensure they meet all contractual key performance indicators (KPIs), in particular ensuring that 80 per cent of calls are answered within 20 seconds We expect to maintain strong performance for the remainder of the year.
OF.33 Percentage of Members
Enquiries’ (MEs) completed on time
80.0% 90% 72% 70% 71% 71% R Better Local indicator
Performance for responding to MEs has improved during Q3 but the YTD figure is still some way short of the 90% target. There is a similar position to that with complaints - the largest area (environment) has not been performing well and this has had an impact on overall performance. A completed restructure in that area has seen performance improve but quite as quickly as it has with complaints. In addition to this, we need to look at ways of reducing the burden of MEs by filtering out some at the point-of-contact. This would reduce the overall number by making the service more efficient and would allow more time to focus on the 'proper' enquiries.
See OF.29 for management actions to improve the speed at which MEs are responded to in the Environment division.
OF.34
Percentage of staff that would speak highly of
the Council as an employer
55% Increase from
2014/15 baseline
52% A Worse Local indicator
It is encouraging that around a half (52%) of employees speak highly about Lambeth Council as an employer. This is considerably higher than the proportion who are critical (13%). However, when compared to recent quarterly staff surveys, there has been a decline from 58% in April 2014. Staff in Corporate Resources are more likely to speak highly of the council as an employer, while those in Neighbourhoods and Growth are more likely to be critical. Other groups that are more positive about both the council as an employer and of council services are those on SMG grades, line managers, Black African staff, those aged 45 and over, those who have worked

27
Ref. Performance Indicator 2014/15 baseline
2015/16 Target
Oct Actual
Nov Actual
Dec Actual YTD Q3 RAG
DOT QTR
Benchmarking National London
Neighbours
Q3 Quarterly performance commentary
Management action
at the council for over ten years and Christian staff. In contrast, staff with a disability or long-term health condition, younger staff (aged under 35) are more likely to be critical both of the council as an employer.
OF.35 In-year rent collection 99.2%
Profiled target
Apr 94.50% May 95.50% Jun 97.10% Jul 98.60%
Aug 98.60% Sep 98.60% Oct 98.20% Nov 98.20% Dec 98.20% Jan 99.00% Feb 99.00% Mar 99.00%
99.48% 100.02% 99.16% 99.16% G Worse Data unavailable
At the end of quarter 3, Lambeth Housing Management remains on course to exceed its annual in-year income rent collection target of 99 per cent. Although the rent collection rate was maintained above the monthly target, performance in December 2015 fell to a six-month low due to the annual impact of the Christmas / New Year period. This is a wider seasonal trend due in part to increased financial pressure around Christmas time. Despite a targeted communication campaign involving text, email and telephone contact with ‘cash paying’ tenants, performance dipped significantly month-on-month. However, the final quarter has historically been the strongest performing quarter of the financial year and we would anticipate that both measures will see improvement in January and that we will end the financial year exceeding both targets.
Lambeth Housing Management continues to use a variety of methods to contact our tenants with on-going use of text messaging and emailing to contact tenants in arrears. In addition, we are soon to trial "nudge theory" in our collection processes, something that Council Tax successfully introduced in 2014/15. Tenants adversely affected by bedroom tax who are well positioned to move into paid work continue to be supported through the Welfare Reform team’s Get Set Go programme. The second phase of this programme has allowed 30 participants to access work experience, job interview skills training, as well as support to improve their numeracy and literacy skills. Housing Management’s Welfare Reform Team has been shortlisted for two awards for its Workwise initiative, being recognised for undertaking to improve the skills and employment opportunities for Lambeth housing tenants.
OF.37 Call centre satisfaction New 3 4.3 4.2 4.3 4.3 G Same Local indicator
Residents record a score against 4 questions about their experience of using the call centre using a 5 point scale - 1 being most dissatisfied and 5 being most satisfied. Capita must achieve a score of 3.0 (out of 5) from all responses in a particular quarter. The average response at the end of Q3 was 4.3 and continues to be well within target