2016 - UFICO · Mr. Yahya Zakaria Al Kadamani Dr. Mazen Mohammad Al Basheir Dr. Yanal Mawloud...
81
Transcript of 2016 - UFICO · Mr. Yahya Zakaria Al Kadamani Dr. Mazen Mohammad Al Basheir Dr. Yanal Mawloud...


iiiii
2016Annual Report
Together we planour success

iv v
Table of Contents
Board of Directors
Chairman’s Letter
Board of Directors' Report 2016
Consolidated Financial Statements for the Year Ended December 31, 2016
Additional Information as Required by the Jordan Securities Commission 2016
Corporate Governance
Disclosure and Transparency
Addresses of Bank of Jordan Branches
Bank of Jordan
Public Shareholding Limited Company, established in 1960,Commercial Registration No. 13, Paid-up Capital JD 200,000,000P.O. Box 2140 Amman 11181 Jordan, Tel.: 5696277 Fax: 5696291
E-mail: [email protected]: bankofjordan.comCall Center: 06 580 77 77
Our Mission
To build amicable relations with our customers, optimize the returns to shareholders and contribute to social advancement by providing comprehensive financial solutions through high-quality and efficient service channels and a modern business environment that comprises an excelling team of employees.
Our Vision
To be a pioneering bank that excels in providing products and services, offers comprehensive financial solutions and acquires an advanced position in the Arab region.
Page Number
9
10
12
36
116
144
153
155

vi vii
His MajestyKing Abdullah II Bin Al Hussein

viii ix
His Royal HighnessCrown Prince Hussein Bin Abdullah II

Board of Directors
Chairman & CEO
Mr. Shaker Tawfiq Fakhouri
Vice Chairman
Dr. Abdel Rahman Touqan
Members:
Mr. Yahya Zakaria Al Kadamani
Dr. Mazen Mohammad Al Basheir
Dr. Yanal Mawloud Naghouj
Mr. "Shadi Ramzi" Abd Al-Salam Al-Majali
Mr. Haitham Abu Nasr Al MuftiRepresentative of Al-Ekbal Jordanian General Trading (LLC)
Mr. Ammar Mahmoud Abu Namous Representative of Al Pharaenah Int'l for Industrial Investments Co.
Mr. Haitham Mohammed Samih Barakat
Mr. Husam Rashed Manna'
Mr. Mohammad Anwar Hamdan
General Manager
Mr. Shaker Tawfiq Fakhouri
Auditors
Deloitte & Touche (M. E.) – Jordan
Kawasmy & Partners Co. (KPMG)
8 9

10 11
Chairman’s Letter Dear Bank of Jordan Shareholders,
I am honored to present you with our Fifty Sixth statement of
achievement in this Annual Report for the Bank of Jordan.
Despite the many challenges in year 2016, and specifically to
the Jordanian banking sector, I am happy to inform you that
our shareholder equity increased by 11.9%, from 2015, to reach
405.4 million Jordanian Dinar. Customer deposits grew to 1,607
million Jordanian Dinar, a 2.7% increase from the prior year, while
the loan portfolio on the other hand grew by 7.3% to reach 1,226
million Jordanian Dinar. All in all, our total assets grew by 6% to
reach 2,339 million Jordanian Dinar.
This was achieved while the non-performing loan (NPL) ratio dropped from 5.94% in 2015 to 4.59%
for this year. The continuing improvement in NPLs, as it was 7.21% in 2014, is a testimonial to the
quality of Bank of Jordan’s assets. Furthermore, the provision coverage ratio for such loans now stands
at 112.2%, as compared to 101.2% in the prior year; a standout number in the Jordanian banking
industry and an assurance that Bank of Jordan is ready for such credit contingencies.
This growth comes with the backdrop of the persistent regional geopolitical turmoil that cast its shadows
on the Jordanian economy. The leadership in Jordan has successfully managed to steer the country
away from the plights of some of the neighboring countries. Nevertheless, trade activities in Jordan, as
well as tourism, were adversely impacted, with hindered exports, imports and transport activities to and
from neighboring countries. These regional challenges led to a slowdown in the rate of growth of the
Jordanian economy: 2% in the first three quarters of the year 2016 as opposed to 2.3% in the same
period of the year 2015. Combined with the slightly rising energy prices in 2016, the sovereign debt
grew to 26.2 billion Jordanian Dinar.
Rising costs of funds, dropping market liquidity as well as asset-pricing pressures were the main challenges
facing the banking sector in 2016. The year also saw the central bank ushering in direct bond offerings to
consumers and the Jordanian government experimenting with borrowing using Islamic Sukuks.
Globally, the economic slowdown continued, with the IMF estimating 3.1% global growth for 2016
and 3.4% for 2017. Despite the brightening outlook for the USA, Europe and China, Jordan’s major
trading partners, the slowing trend continued. Being a net importer from these countries, the overall
impact on Jordan from this global slowdown was a reduction in the trade deficit.
The Jordanian Dinar interest rates in 2016 continued to be affected by the rising rates in the USA as well
as the perception that further increases in Federal Reserve rates are forthcoming.
The Federal Reserve took the second step to raise interest rates in December (a 0.25% raise) and signaled at least
three more such actions in 2017.
As a result, the overnight deposit rate for the Central Bank of Jordan ended the year at 1.75%, with higher levels
expected in 2017. As for foreign reserves, the Central Bank of Jordan reported 12.9 billion USD at year end; a
healthy level despite the 9% drop from the 2015 levels.
Dear fellow shareholders,
Despite these challenges, we are very proud to inform you that Bank of Jordan not only continued to fare well
in 2016, but also has more reasons to be optimistic about prospects in 2017. Thus, Bank of Jordan intends to
distribute 18 piasters per share as dividends, after the Shareholders General Assembly approval, for an effective
dividends yield of 6.25% based on end-of-year closing stock price.
Revenue in 2016 grew by 1.8% to reach 127.4 million Jordanian Dinar, with 91.2% of the income being
operational, as opposed to 88.9% in 2015. Bank of Jordan also succeeded in achieving 1.4% growth in its net
profit for the Bank’s shareholders.
This growth, albeit modest, was achieved whilst the Capital Adequacy ratio stood at 20.82%, well above the
Central Bank of Jordan mandate of 12%. The liquidity ratio at year-end stood at 127.25%, also exceeding
Central Bank of Jordan requirements. Both such numbers allow the Bank further room to expand its asset base,
and hence revenue, comfortably.
These achievements did not go unnoticed by financial institutions elsewhere. Morgan Stanley Capital International
included Bank of Jordan in its MSCI Frontier Markets Index in the fourth quarter of 2016, making the Bank one
of only four Jordanian companies to achieve such status to date.
Dear valued shareholders,
Our continuing ability to achieve such performance numbers and risk metrics in view of a very difficult year
in 2016, is the reason we continue to be optimistic about our future. Our persistent and successful efforts
to maintain healthy capital position, liquidity ratios, and NPL provisions helped us to not only weather the
turbulence of the year, but to also grow.
Our success relies on your continued support of the Bank, as investors and as clients. My sincerest appreciation
goes to you, our esteemed shareholders, for this valued support, and to our board members and staff for their
sincere efforts to serve you, the customers, and the society at large.
Yours Very Truly
Shaker Tawfiq Fakhoury
Chairman of the Board

12 13
Economic Performance 2016
Achievements in 2016
Analysis of Financial Position and Business Results for the Year 2016
Our Goals for 2017
Additional Information as Required by the Jordan Securities Commission 2016
2016Board of Directors' Report

14 15
Economic Performance 2016
The economic landscape in Jordan continued to reel from external turbulence and the burden of hosting a huge number of Syrian refugees. Persistent weak oil prices is also perceived as a medium-term risk as it may hit remittances from Gulf nations and foreign direct investment. The Kingdom’s finances might also be further strained by potential cuts in the historically generous support from the GCC countries, where lower reserves and widening deficits have necessitated austerity measures and spending cuts. On a positive note, the pace of economic reforms in the Kingdom has picked up with the conclusion of a new financial reforms program with the IMF. The three-year arrangement is aimed at broad structural reforms needed to maintain economic and financial stability and achieve sustainable growth. Another landmark achievement in 2016 was the endorsement of Law No. 24 for the year 2016, under which the CBJ has become the sole authority to determine the exchange rate policy. The legal reserve requirement set at 5% of bank deposits was also abolished. The CBJ objectives have also been re-defined to cope with market and banking developments.
Main Macroeconomic Indicators in 2016:– Real GDP growth stood at 2% in the first three quarters of 2016, against 2.3% recorded in the same period the year before.
– The general price level measured against the relative change in the Consumer Price Index (CPI) retracted by 0.8% at the end of 2016 as compared to a retraction of 0.9% in the 2015.
– Unemployment rose to 15.9% by the end of Q3, 2016 from 13.8% in Q3, 2015.
– CBJ foreign reserves amounted to USD 12.9 billion at the end of 2016, a drop of 9% from a year earlier.
– Total deposits of the banking sector edged up 0.9% to JD 32.9 billion at the end of November, 2016 when compared to the previous year. This came on a year-on-year increase of JD 13.6 million in dinar-denominated deposits, and a JD 289.5 million increase (4.4%) in foreign currency deposits.
– Credit facilities granted by banks grew by 7.7% to JD 22.7 billion end of November 2016 against their balance at the end of 2015.
– The trade deficit, which represents the difference between total exports and imports, shrank by 9.6% to JD 6,792.8 million end of October, 2016.
– The number of real estate transactions saw a year-on-year drop of 7% to JD 7.1 billion in 2016.
– Tourism income (travel receipts) declined by 0.8% year-to-November compared to the same period in 2015, reaching JD 2.6 billion.
– Remittances dropped by 2.9% end of November 2016 to JD 2.4 billion, while FDI saw net inflows of JD 809.1 million in the first three quarters of 2016 versus JD 808.2 million in the same span in 2015.
– The current account deficit reached a JD 1,910.2 million (9.5% of GDP in the first three quarters of 2016), compared with a shortfall of JD 1,979.6 million (10.1% of GDP in the first nine months of 2015).
– Net public debt (domestic and external) shot to JD 24.4 billion at the end of November 2016 representing 88.9% of GDP projected for the same period.
Gross Domestic Product:
GDP at constant prices picked up 2% during the first three quarters of 2016 compared to a growth of 2.3% in the corresponding period in 2015. Sector performance came in varied during the period: “electricity and water” expanded by 10.8% from 8.6%, and “transport, storage, and communications” grew by 3.2% against 3%. The “construction” activity rose by 0.8% against a retraction of 2.7%. Additionally, “agriculture” saw a growth of 5.3% compared to 0.7%, while “finance, insurance, real estate, and business services” reported an expansion of 3.9% against 3.8%. “Trade, restaurants, and hotels”, meanwhile, picked up 1.1% versus 0.9%.
On another front, some economic sectors saw sluggish performance in the first nine months of 2016, “producers of social and personal services” sector inched up 3.6% against 4.1%, while “mining and quarrying” retracted to 14.7% compared to a growth of 16.8%. “Manufacturing” inched up 0.8% versus 1.5%.
Other sectors to report lower growth in the first nine months in 2016 include “producers of government services” which inched up 1.2% compared to a rise of 2.4%. In light of the above, inflation was down by 0.8% at the end of 2016 against a retraction of 0.9% at the end of 2015.
3.5
3.0
2.5
2.0
1.5
1
0.5
0.02014
2.6 2.7 2.8
3.1
2.4
2.0
2011 2012 2013 2015 Sep-16
Gross Domestic Product (%) 2011 - 2016
Public Finance:
Total domestic revenues and foreign grants rose by 7.9% to JD 6,187.3 million in the first eleven months of 2016 against JD 5,735.2 million in the corresponding period in 2015. Official figures reveal that foreign grants amounted to JD 406.4 million against JD 448.4 million. Domestic revenues, meanwhile, rose by 9.3% to JD 5,780.9 million versus JD 5,286.8 million due to a JD 185.8 million and a JD 311 million rise in tax revenues and other revenues respectively. Total expenditure climbed by 3.4% to JD 6,990.6, on the back a 4.1% increase in current spending and a drop of 1.7% in capital spending. This left the budget with a deficit of JD 803.3 million by end of November, 2016 against JD 1,025.6 million reported in the corresponding period the year before.
The public debt totaled JD 26.2 million or 95.6% of GDP at the end of November 2016 (officially estimated at JD 27,450 million per month) compared with 93.4% of GDP at the end of 2015. The debt of the National Electricity Company and Jordan Water Authority skyrocketed to JD 6.6 billion at the end of November 2016. Accordingly, the net public debt (domestic and external) reached JD 24.4 billion or 88.9% of GDP projected for the end of November 2016.
The Monetary and Banking Sector:
The banking sector managed to overcome the ongoing regional turmoil and the subsequent recession that hit several economic sectors, and harmed Jordan’s already humble exports following the disruption of trade routes. Guided by the CBJ prudent policies, banks in Jordan reported growth in most financial indicators in 2016. This, combined with a solid financial position, helped the banking industry endure difficult times while keeping abreast of latest banking trends.
In yet another development, the CBJ launched the National Strategy for Financial Inclusion for the years 2018-2020, which covers financial awareness, financial consumer protection, SMEs, micro-finance services, and digital payments. The strategy urges banks to exert more efforts to provide access to finance to the under banked and the unbanked specifically, in the shortest time and at the lowest cost possible.
As for interest on monetary policy instruments, the CBJ raised the main Interest rate (the one-week repurchase agreement rate), the overnight deposit window rate, and one-week CDs interest rates by 25 basis points as of 18/12/2016. Yet, it kept the rediscount rate and overnight repo rate unchanged. Interest on medium-term loans for banks, related to refinancing economic sectors, remained unchanged as well. This falls under the CBJ strategy aimed at ensuring the Jordanian dinar remains competitive and to strengthen monetary and banking stability.
Also in 2016, the CBJ continued to pave the way for shifting from cash to electronic payments, with the launch of the Automated Clearing House (ACH). The funds transfer system allows for the electronic clearning of small and medium size financial transfers in various currencies in Jordan - swiftly and at lower cost than traditional payment tools.
On the monetary and banking front, figures unveil that foreign reserves fell by 9% year-on-year to around USD 12.9 billion at the end of 2016. Domestic liquidity, meanwhile, went up 2.7% to JD 32.5 billion at the end of November 2016 compared to its balance at the end of 2015. Total deposits of banks in Jordan inched up 0.9% to JD 32.9 billion for the same period. Dinar-denominated deposits

16 17
rose by JD 13.6 million to JD 26 billion, while those in foreign currency edged up 4.4% to JD 6.9 billion. Credit facilities, in the meantime, saw a growth of 7.7% as compared to their level at the end of 2015, clocking in at JD 22.7 billion. By sector, figures reveal that credit to the mining sector recorded the highest growth of 70.6%, followed by agriculture whose loans grew by 35%. Credit to “transport, storage, and communications” went up 33.3% and for construction, growth stood at 13.1%.
Another positive indicator was marked on the asset side, with total assets of the banking sector growing to JD 47.8 billion at the end of November 2016, up 1.4% when compared to the end of 2015.
35
30
25
20
15
10
5
020152012 2013 2014 Nov - 2016
Development of Deposits and Credit Facilities in Banking Sector
25.0
17.818.9
19.3 21.122.7
27.6
30.332.6 32.9
JD-Billions
Credit Facilities Deposits
Interest rate on deposits and credit facilities, on the other hand, witnessed a decline in the first eleven months of 2016 against rates at the end of 2015. On demand deposit, figures show that the weighted average interest stood at 0.24%. For savings and time deposits, it stood at 0.64% and 3.04%, respectively. This represents a drop of 8 basis points for demand deposits, and a drop of 2 basis points on savings and time deposits, against levels registered at the end of 2015.
The weighted average interest on credit facilities also declined to 7.64% for overdraft, a drop of 37 basis points year-to-November 2016 compared to the end of the previous year. For loans and advances, it went down 34 basis points to 7.9%, while for discounted bills; it went up 167 points to 10.37%, compared to its levels end of 2015.
Amman Stock Exchange:
The unfavorable regional conditions continued to dampen investor sentiment in 2016, sending key stock market indices further down. ASE figures for 2016 show a decline of 3.6% in market capitalization to JD 17.3 billion, and a 3.8% drop in the Share Price Index weighted by market capitalization to 4,069.7 points against 4,229.9 points in 2015. Additionally, the trading value was down JD 1,087.6 million or 31.8% to JD 2.3 billion by year end. Yet, non-Jordanian investments in the bourse increased by JD 237.1 million against a rise of JD 10.6 million in 2015. Accordingly, net of non-Jordanian investments in listed companies stood at 49.6% of market value compared with 49.5% the previous year.
External Trade:
External trade (national exports and imports) saw a drop of 7.9% in the first ten months of 2016 to JD 14.9 billion as compared to the corresponding period in 2015. National exports retracted by JD 372.7 million to JD 3.6 billion. The US market was the biggest market for the Kingdom’s goods, accounting for 23.9% of the total, followed by the Saudi market, with 15.3% of total exports. Imports, meanwhile, dropped by 7.5% to JD 11.3 billion, with China topping the list of exporting countries at 14.1% of total imports. Saudi Arabia clinched second place, with 11.6% of the total. Vehicles and spare parts constituted 10.9% of total imports valued at JD 1.2 billion. Based on these developments, the trade deficit shrank by 9.7% to JD 6.8 billion.
20,000
15,000
10,000
5,000
020152013 20142012 Jan-Oct
2016
Development of Total Exports, Imports and Trade Balance
JD-M
illions
Total Exports Imports Trade Balance
Economic Performance 2017
Global economic projections put global growth at 3.1% in 2016 and 3.4% in 2017. A state of uncertainty and weak confidence still prevails following Britain’s exit from the EU. The largely unexpected move, has cast a shadow on the global economic outlook in the next few years. Advanced economies are expected to see a slowdown, with projections that growth will remain unchanged at 1.8% in 2017 compared to 2016. For developing and emerging economies, growth is expected to rise to 4.6% against 4.1% in 2016.
Based on the IMF estimates, Jordan’s GDP is expected to expand by 2.4% in 2016, and 3.2% in 2017. Inflation is projected to rise to 2.3% in 2017.
In line with the Budget law for 2017, the Jordanian government envisions spending of JD 8.9 billion (JD 7.6 billion in current spending and JD 1.3 billion in capital expenditure), leaving a deficit of JD 906.7 billion (including JD 827.3 million in grants). The budget of government units is projected at JD 1.8 billion, with a shortfall of JD 355.3 million.
Following the completion of the Stand-by-Arrangement with the IMF for 2012-2015, Jordan found itself in a critical need for a new arrangement. In August, 2016, the Fund approved an extended arrangement with Jordan under which USD 723 million will be disbursed over the program’s three year span, subject to six reviews. The cooperation program seeks to advance fiscal consolidation to reduce the debt-to-GDP ratio and contain the ballooning budget deficit. The program also envisions – among other measures, further spending cuts and improving the business climate as well as the conditions for a more inclusive growth.
On the monetary and banking front, foreign reserves are projected to sit at comfortable levels. Savings in the Jordanian currency will likely continue to be attractive. The banking sector is also projected to maintain solid performance, buoyed by a capital adequacy ratio of 19.1%, and a high legal liquidity ratio of 149% as of the end of 2015.

18 19
Achievements In 2016
Bank of Jordan saw another year of impressive growth in 2016. Significant improvements were also reported across all operations and business processes which bolstered the Bank’s bottom line and solid reputation locally and regionally. Furthermore, the year witnessed the execution of strategic projects aimed at taking banking services to a new level.Bank of Jordan also continued to shift to digital while keeping up with major trends in the banking industry.
Moreover, the Bank has been listed on Morgan Stanley Capital International (MSCI) Jordan Index - as of November 2016. The Index measures the performance of large and mid cap segments of Jordan’s market through four constituents, covering around 85% of the Kingdom’s equity market. It is worth noting that the Index aims to provide extensive coverage of investment opportunities across various markets. The listing is expected to improve Bank of Jordan’s visibility on the global investment map.
Financial Results:Despite all challenges, Bank of Jordan managed to maintain key financial indicators within legal requirements in 2016; capital adequacy stood at 20.82%, and the legal liquidity ratio settled at 127.25%. Non-performing facilities to total facilities (net of suspended interest) dropped from 5.94% in 2015 to 4.59% in 2016 - compared with the international benchmark ratio of 10%. The coverage ratio of provisions for non-performing loans, meanwhile, rose to 112.2% in 2016 from 101.2% in 2015. Net profit attributable to Bank shareholders inched up 1.4% resting at JD 41.4 million, while net profit before tax remained almost unchanged at JD 62.3 million. Assets amounted to JD 2,338.8 million in 2016, up 6% from a year earlier, while shareholders’ equity rose by 11.9% to JD 405.4 million.
70,000
60,000
50,000
40,000
30,000
20,000
10,000
020152012 2013 2014 2016
Net Profit Before Deducting Taxes (JD’ 000)
46,222 50,204
59,99961,966 62,315
On the funding side, figures show that customer deposits rose by 2.7% to JD 1,606.9 million: demand deposits rose by 9.5% to JD 535.2 million, savings accounts by 1.2% to JD 675.8 million, and CDs by 38.8% to JD 72.1 million. Time deposits, on the other hand, saw a year-on-year drop of 9.2%. On the credit front, figures reveal that Bank of Jordan continued to extend credit but only to feasible projects, ensuring credit risk exposure remains within acceptable limits. As a result, the net credit portfolio grew by 7.3% in 2016, settling at JD 1,226 million when compared to 2015. Credit to the retail sector increased by 18.8% to JD 328.8 million while loans to the real estate sector jumped by 7.7% to JD 224.9 million. Credit to SMEs, meanwhile, rose by 17% to JD 147.9 million. Loans to the corporate sector, however, saw a slight drop of 0.8% resting at JD 456.8 million. The government and the public sector benefited from loans worth JD 139.4 million, which represents a drop of 6.8% compared to 2015.
Total Assets Customers' Deposits Net Credit Facilities
The Development of Financial Position (JD’ 000)
2,500,000
2,000,000
1,500,000
1,000,000
500,000
0
2015 20162012 2013 2014
The 2016 interest and income statement in the meantime revealed that total income reached JD 127.4 million, up 1.8% when compared to a year earlier. Net interest and commission income constituted 91.2% of total income. Cash dividends from investments in financial assets reached JD 2.8 million while foreign currency income amounted to JD 2.5 million. Total expenditure recorded a rise of 3%, reaching JD 65.1 million.
In efforts to diversify income streams, the International Markets Unit continued to watch for low-risk top stocks - with big potential payoffs - in the international market during 2016. Trading in international bonds was also resumed on a wider scale with the newly-established Fixed Income Desk.
It is worth noting that Bank of Jordan subsidiary “Excel for Financial Investments Company” had largely contributed to higher brokerage commission and revenues in 2016. The company offers a range of financial services including asset management and brokerage services.
In Palestine, Bank of Jordan has put on offer a new product (buying T-bills) issued by the Palestinian Finance Ministry. This is in addition to launching custody services in the Palestinian market in Q2 2016, aimed at meeting the requirements of foreign portfolios and asset management in Palestine.
Competitive Position:Bank of Jordan continued to hold a fair share of deposits and credit facilities in the Jordanian, Palestinian, and the Syrian markets. In Jordan, the Bank clinched a share of 3.8% and 4.8% of customer deposits and credit facilities respectively. In Palestine, the Bank’s share stood at 9.8% of total customer deposits and 8.6% of total credit facilities. In Syria, marred by a fierce war that has entered its sixth year, Bank of Jordan - Syria secured a share of 1.5% of total deposits and 8.2% of total credit facilities extended by private banks, according to recent statistics.

20 21
Products and Services:Persistent economic challenges have not weakened the Bank’s resolve to continue to excel and innovate. Rather, they drove growth in the retail, SMEs, corporate, and investment markets. Thanks to vast human and physical capital, Bank of Jordan was more keen than ever to stand out among peers, with customers at the center of every business and marketing strategy.
Retail Services:In efforts to attract clients, the Bank offered various financing programs, including the car financing program, whereby customers can be granted a loan in a matter of hours without down payment. The Bank also launched the taxi loan program at competitive interest and a repayment period of up to 6 years. The popular “Solution” personal loan program was also put on offer again, with incentives including competitive interest, postponement options, and exemption from administrative commissions in case the loan is purchased from other banks. Several other personal financing options targeted professional customers including physicians, pharmacists, the military, and certain public and private institutions.
Also, in 2016, the Bank offered the real estate loans campaign, with beneficiaries (both Jordanians and resident foreigners) given the option of either enjoying low interest or exemption from mortgage and other administrative fees.
Credit card holders enjoyed additional benefits in 2016, with cash refund of up to 7% of total purchases from (supermarkets, hotels, restaurants, coffee shops, and online shopping). Furthermore, Bank of Jordan was the first Bank in Jordan to offer the Visa Risk Manager “VRM” solution, which helps it to dynamically respond to fraud as it occurs. Bank of Jordan has won the Best Customer Loyalty Award for 2016, granted by EMP (Emerging Markets Payments) in recognition of loyalty programs on offer since 2013.
Several awards were also offered for savings accounts and the children’s savings account “Sanabel”. Every month, the Bank doubles the salaries of five customers who deposit their monthly salary in the Bank, as part of a scheme aimed at growing the deposit base. Moreover, a new customer classification scheme was prepared and banking programs have been re-designed based on the needs of each customer class.
In Palestine, the Bank succeeded in solidifying its position through re-designing the public taxi, housing, and retail loan programs. Several other awards were also granted for savings accounts.
Corporate Services:Bank of Jordan continued to extend credit to key economic sectors in 2016, including the pharmaceuticals, food, construction, and motor trade businesses. Added to that, the Bank participated in syndicated loans worth JD 33.2 million. Moreover, a team of professionals has been assigned the large corporations portfolio. The team provides valuable advcie for existing and prospective clients on the best financing solutions and updates them on the latest product lines and services.
SMEs Services:Loans to Small and Medium Size Enterprises (SMEs) continued to account for a sizeable chunk of total credit in 2016. These include short and long term loans offered to the commercial, industrial, and services sectors through business development centers covering most governorates.
The Point of Sale program for Visa card holders was also implemented, under which overdraft is granted in proportion to the annual point of sale turnover. Plans are underway to hire additional staff in order to attract more customers in this category.
Financial Leasing:Through its subsidiary “Jordan Company for Financial Leasing”, Bank of Jordan continued to offer several financial leasing services for all asset types and sectors. As part of its marketing strategy, the company is now promoting its products in major cities, including the capital Amman, Zarqa and Irbid. Added to that, the company’s capital increased in 2016 toJD 20 million to help it execute its expansion plan and achieve target growth.
Network of Branches:In efforts to ensure that customers are served in a convenient and modern environment, Bank of Jordan continued to move older branches to new premises. Also in 2016, more and more branches were renovated inside and outside Amman. A new branch was also added, this time in the high-end Al-Abdali Shopping Mall. Excel for Financial Investment Company and Jordan for Financial Leasing Company also moved to their new locations – in a busy business district in Amman.
For the headquarters, the outdoor arenas and ATM booths were renovated, and LED exterior lighting was installed – resulting in major cuts in energy bills. Work is also in the pipeline to generate cheaper, cleaner, and renewable energy through implementing solar photovoltaic projects in the northern, central, and southern parts of the Kingdom.
In Syria, a new branch was opened, bringing the total number of branches in the Syrian market to 14, spread across main governorates.On another positive note, Bank of Jordan-Bahrain is expected to kick-start operations in the Kingdom of Bahrain as a conventional wholesale Bank once CBJ licensing is obtained. Expanding in new markets is also being considered.
Electronic Banking Options: With efficient service delivery as a core objective, Bank of Jordan continued to invest heavily in its IT, with a special emphasis on e-payment systems and distribution channels.
In due course, the Automated Clearing House (ACH) was applied in line with the CBJ requirements, ensuring speedy and secure interbank funds transfer. It will also be linked with the new Internet Banking System to offer various services, specifically for corporate clients.
For SMS services, three countries, namely Egypt, the UAE, and Iraq, have been added to the list of areas where customers can receive the service.
GASPER Reporting System was also activated to monitor ATM machines and extract Uptime and Downtime reports, in order to ensure ATM efficiency round-the-clock. It is worth noting that a fleet of (159) ATMs serve clients in Jordan and Palestine 24/7.
Organizational Structure and Technical Resources:Bank of Jordan continued to improve its business processes, aligning IT with organizational goals to ensure smooth workflow and enhanced performance. Efforts were similarly focused on enhancing the Bank’s organizational governance structure, streamlining procedures, and improving communications.
To that end, structural changes were deemed necessary at the department and branch levels here and in Palestine to meet evolving work requirements. In Jordan, six departments and two branches were re-structured including the HR, Treasury and Investment, and the IT departments in addition to two branches at Taj Mall. In Palestine, the Financial Supervision and the Corporate Departments were restructured. A new organizational chart was also designed for the recently-established Market Research Unit within the Corporate Department.
New work mechanisms pertaining to card fraud management, banking segments, real estate assessors, and cash refund were adopted. This is in addition to implementing new procedures for transferring fixed assets for Palestine branches. In parallel, operating procedures related to project financing were revised following the restructuring of the Engineering Services Department. New job descriptions were also drafted to reflect new tasks, and new bank forms were issued.
On the IT front, data bases for all systems have been upgraded from Oracle 9 to Oracle 11, and the communications network has also been updated. Work also started on implementing a new DWH system for branches in Palestine in efforts to improve the reporting system. For maximum server and database security, a new Firewall was installed. A New Swift Platform was also applied replacing older applications.
Furthermore, the Bank rolled out the retail banking services strategy, and the CCM Bluering system for corporations and SMEs was applied.
The ECC was upgraded to Version 19, and Polaris Palestine was applied for branches in Palestine. To assess credit risks, the Bank is using FICO scores – ICBS. It’s worth noting that all branches are now offering on-line services.
The national e-payment system (ACH) has been implemented in line with the CBJ requirements ensuring speedy and secure interbank funds transfer. Using the GIS, digital maps are now produced, providing essential data on real estate that is to be mortgaged or financed. Branches in Palestine have also been connected and are using the application.
Moving to risk management, the Bank largely focused on identifying and assessing risks, and ensured the proper allocation of resources to minimize and control any unfortunate impact on its business. In due course, best international practices were adopted, and risk management strategies pertaining to operations, anti-money laundering and terrorism financing were reviewed and amended. Operational errors were also reclassified, and the KPIs are now applied electronically. A similar revision was carried out for IT systems that are used for producing reports that inform credit decisions for retail customers.
In a related development, a cooperation agreement was signed with CRIF Jordan, whereby the Bank can have access to credit information available on the company’s database. The Bank has also obtained the PCI – DSS Version 3.1 compliance certification.In compliance with international banking regulations, the Bank fulfilled the ALM System requirements in line with Basel III principles. The system is being experimented on a small scale. All other Basel III requirements were also met and an impact analysis was conducted and results were submitted to the CBJ. The Bank is also ready to use the IFRS9 after meeting the necessary conditions.
22 23
The Internal Capital Adequacy Assessment Process (ICAAP) was also applied based on the Bank’s statements as of 31/12/2015, which showed that the level of capital was adequate to absorb all potential risks. Stress testing was conducted and scenarios were reviewed to cope with the nature and size of risk. Moreover, an independent Financial Crime Unit was set up to monitor suspicious and fraudulent cases, to which the FATCA unit reports.
Moreover, the Bank continues to share tax data related to certain accounts with the Internal Revenue Service (IRS). This applies to Bank of Jordan customers in Jordan and Palestine and to Excel for Financial Investment Company customers.
With customer satisfaction as a top priority, the Bank has in place a strict customer complaints management policy, whereby each complaint is reviewed, and dealt with sensitively and efficiently.
To ensure proper functioning, the Bank also continued to implement best corporate governance practices in line with the CBJ guidelines and the Basel Committee’s revised principles. In due course, (the Chairman of the Board and General Manager positions were separated).
Human Resources:With a strong belief that investing in employees ensures business success, Bank of Jordan continued to implement best management practices in efforts to develop employee abilities and skills. In due course, the Bank contracted Aon Hewitt Investment Consulting to apply the behavioral competencies project across HR systems including the recruitment, performance evaluation, and training systems. The consulting firm is also tasked with evaluating the efficiency of the HR Department. The Share Point system has also been activated, serving as a portal for communication between the management and employees. Furthermore a LinkedIn page has also been launched to support and improve the recruitment process using the best tools to attract talents in the banking market.
In a bid to ensure consistency among HR systems across Bank of Jordan Group, a new job structure was designed for Bank of Jordan-Syria. Accordingly, the salary scale was updated based on the prevailing market rates. The proposed changes to the HR systems of Bank of Jordan-Syria, Jordan Leasing Company, and Excel for Financial Investment Company will also be reviewed before they are officially adopted. For branches in Palestine, changes to the system have already been approved. In the meantime, Jordan Financial Leasing Company has begun using the HRMS. A succession plan was also approved in line with the outcomes of the technical competencies project.
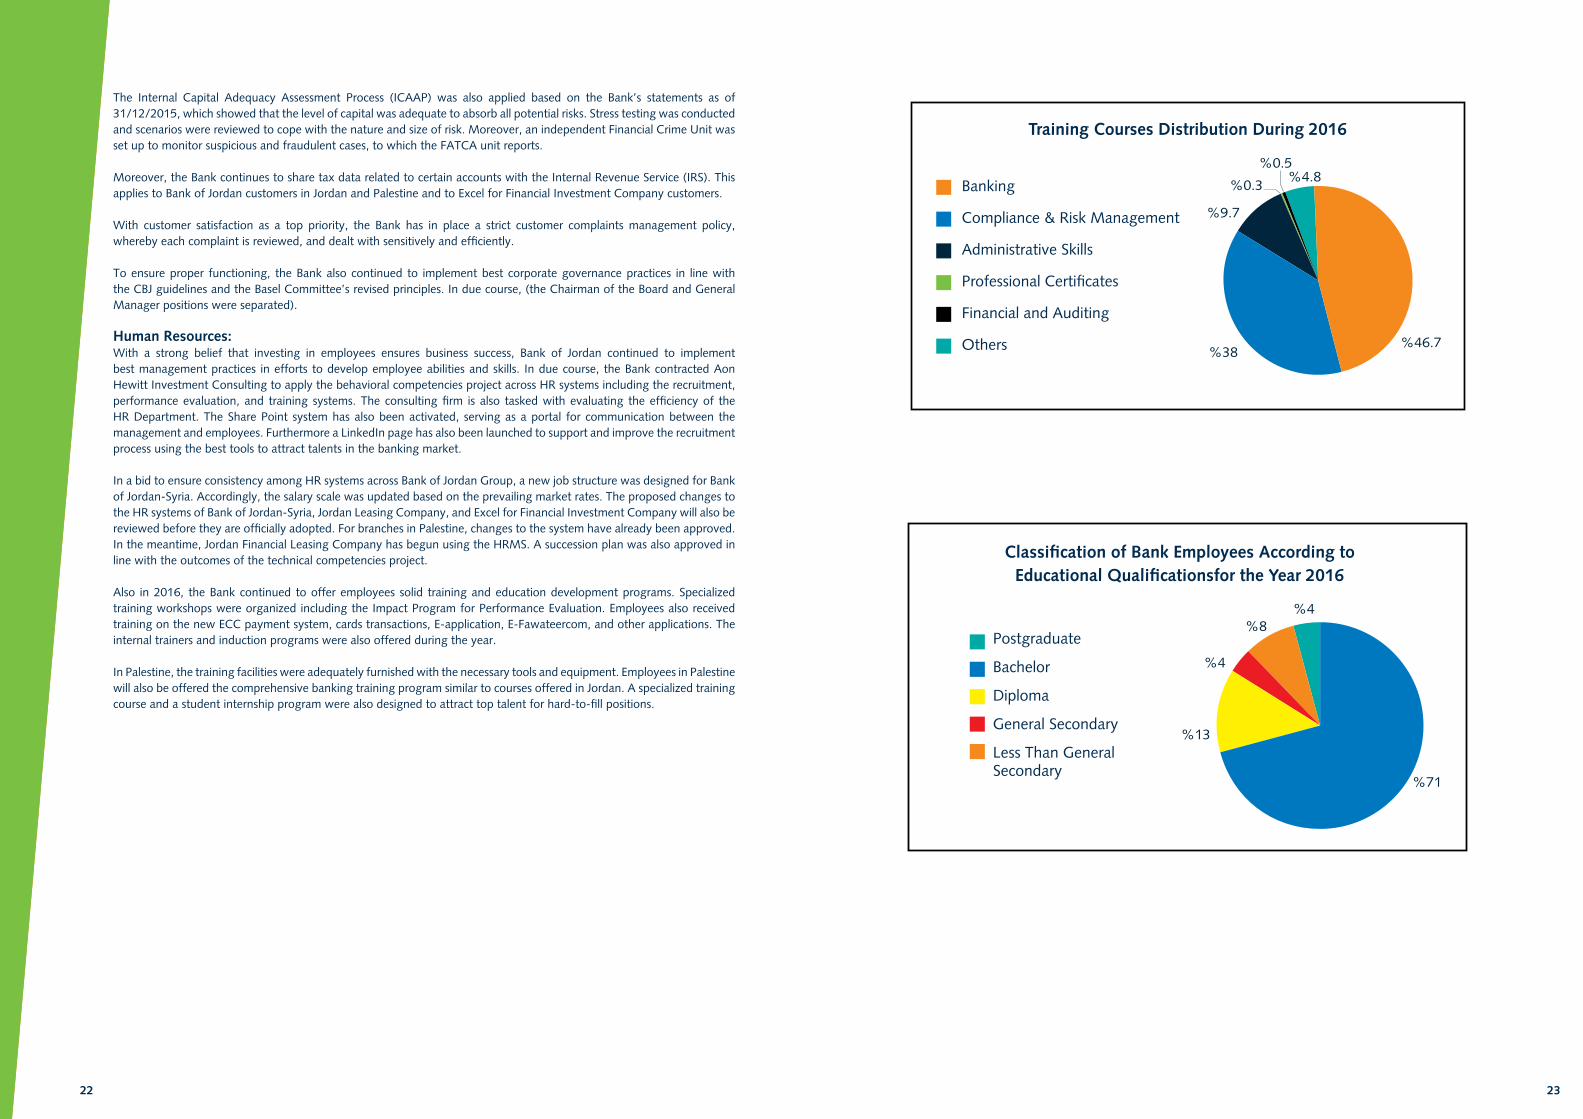
Also in 2016, the Bank continued to offer employees solid training and education development programs. Specialized training workshops were organized including the Impact Program for Performance Evaluation. Employees also received training on the new ECC payment system, cards transactions, E-application, E-Fawateercom, and other applications. The internal trainers and induction programs were also offered during the year.
In Palestine, the training facilities were adequately furnished with the necessary tools and equipment. Employees in Palestine will also be offered the comprehensive banking training program similar to courses offered in Jordan. A specialized training course and a student internship program were also designed to attract top talent for hard-to-fill positions.
Training Courses Distribution During 2016
%38%46.7
%9.7
%0.3
%0.5%4.8
Banking
Compliance & Risk Management
Administrative Skills
Professional Certificates
Financial and Auditing
Others
Classification of Bank Employees According toEducational Qualificationsfor the Year 2016
%13
%4
%8%4
%71
Postgraduate
Bachelor
Diploma
General Secondary
Less Than GeneralSecondary

24 25
Corporate Social Responsibility:
Driven by a sense of responsibility towards the environment and the community, Bank of Jordan continued to support and sponsor various scientific, cultural, sports, and social activities and charities.
In the education sector, Bank of Jordan offered ten scholarships in the UNRWA-run Faculty of Educational Sciences and Arts. Another 33 university scholarships were funded through Bank of Jordan Fund in cooperation with the Ministry of Higher Education and Scientific Research. The Bank also sponsored a distinguished student in the prestigious King’s Academy School. Moreover, the Bank bought several Braille Sense U2 machines for visually-impaired students.This is in addition to furnishing information to students and researchers to help them complete their studies.
Celebrating eight years of cooperation with the Children’s Museum, BOJ continued to sponsor the “Open Days” initiative, allowing thousands of children and their parents free entry on the first Friday of each month. In Palestine, the Bank is supporting efforts aimed at improving children’s creative reading and writing skills in partnership with the Jerusalem-based Arma’ Institution.
Also in 2016, the Bank joined hands with the Central Bank of Jordan to promote financial awareness and education among citizens. In support of environmental causes, the Bank took part in a tree planting campaign in Balqa governorate organized by the Arab Group for the Protection of Nature. The initiative is part of efforts to increase green space and fight desertification. It has also supported the (Back to the Future) initiative for the production of artistic creations made of natural wool. The scheme seeks to create employment opportunities for impoverished citizens in the Jordan Valley.
In sports, the Bank sponsored runner Nabil Maqableh - the visually-impaired category and facilitated his participation in marathons inside and outside Jordan. It also sponsored Jordanian climber Nuha Bulbul, being among the first group of Jordanian women to successfully climb Mira Peak in the Himalayas, 6,476 meters above sea level.
Over the course of the year, Bank of Jordan co-sponsored King Al-Hussein Cancer Center “Goal for Life” football tournament, and extended donations to charity campaigns organized by the Jordan Hashemite Fund for Human Development.
Other associations and charities that received cash donations from the Bank in the year 2016 included Al Karak Construction Association, the Jordan Medical Aid for Palestinians Association, the Cerebral Palsy Foundation and Palestine International Institute. The Bank also supported the Cycling for Palestine initiative, and co-sponsored “the Martyr” Symphony. Total contributions in 2016 amounted to around JD 568 thousand.

26 27
Analysis of Financial Position and Business Results for the Year 2016
Assets grew by 6% to JD 2,338.8 million at the end of 2016 compared to 2015 as the Bank spared no effort to grow shareholder equity, and find low risk, high return investments. The Bank also held sufficient liquidity buffers to meet its liabilities as they fall due. At the same time, funds were efficiently utilized, further bolstering the Bank’s financial position and profit growth.
The Bank’s Assests
JD (Millions) Relative Significance %
2016 2015 2016 2015
Cash, Balances, and Deposits with Banks 747.6 670.8 32.0% 30.4%
Direct Credit Facilities - Net 1,226.0 1,142.2 52.4% 51.8%
Financial Assets Portfolio 265.0 292.3 11.3% 13.2%
Property, Equipment and Intangible Assets 33.3 29.1 1.4% 1.3%
Deferred Tax Assets and Other Assets 66.9 71.8 2.9% 3.3%
Total Assets 2,338.8 2,206.2 100% 100%
Relative Significance of the Bank’s Assets 2016
%11.3
%2.9
%1.4
%32.0
%52.4
Cash, Balances, and Deposits With Banks
Direct Credit Facilities - Net
Financial Assets Portfolio
Property, Equipment and Intangible Assets
Deferred Tax Assets and Other Assets
Liabilities and Owners’ Equity
JD (Millions) Relative Significance %
2016 2015 2016 2015
Customers’ Deposits 1,607.0 1,564.9 68.7% 70.9%
Banks and Financial Institutions’ Deposits 145.6 123.6 6.2% 5.6%
Cash Margins 129.3 111.2 5.5% 5.0%
Income Tax and Sundry Provisions 21.9 19.4 1.0% 0.9%
Borrowing Money and Other Liabilities 22.6 20.2 1.0% 1.0%
Bank Shareholders’ Equity 405.4 362.2 17.3% 16.4%
Non-controllers’ Interest 7.0 4.7 0.3% 0.2%
Total Liabilities and Owners’ Equity 2,338.8 2,206.2 100% 100%
Relative Significance of the Bank’s Liabilities and Owners’ Equity 2016
%6.2
%5.5
%17.3
%1.0%1.0
%0.3
%68.7
Customers' Deposits
Banks and Financial Institutions' Deposits
Cash Margins
Income Tax and Sundry Provisions
Borrowling Money and other Liabilities
Bank Shareholders' Equity
Non-controllers' Interest
Direct Credit Facilities:
Total direct credit facilities increased to JD 75.9 million by 6.2% year-on-year settling at JD 1,297.8 million in 2016, thanks to a well-crafted credit policy that factored in fluctuations in interest rates yield spread, as well as credit and market risks. As a result, non-performing loans to total credit (net interest in suspense) fell to 4.59% in 2016 from 5.94% in 2015 – still within the benchmark ratio.The Bank also continued to offer funding programs well into 2016 for various customer types; retail, SMEs, large corporations, and the public sector as part of its risk diversification and fund management strategy.
28 29
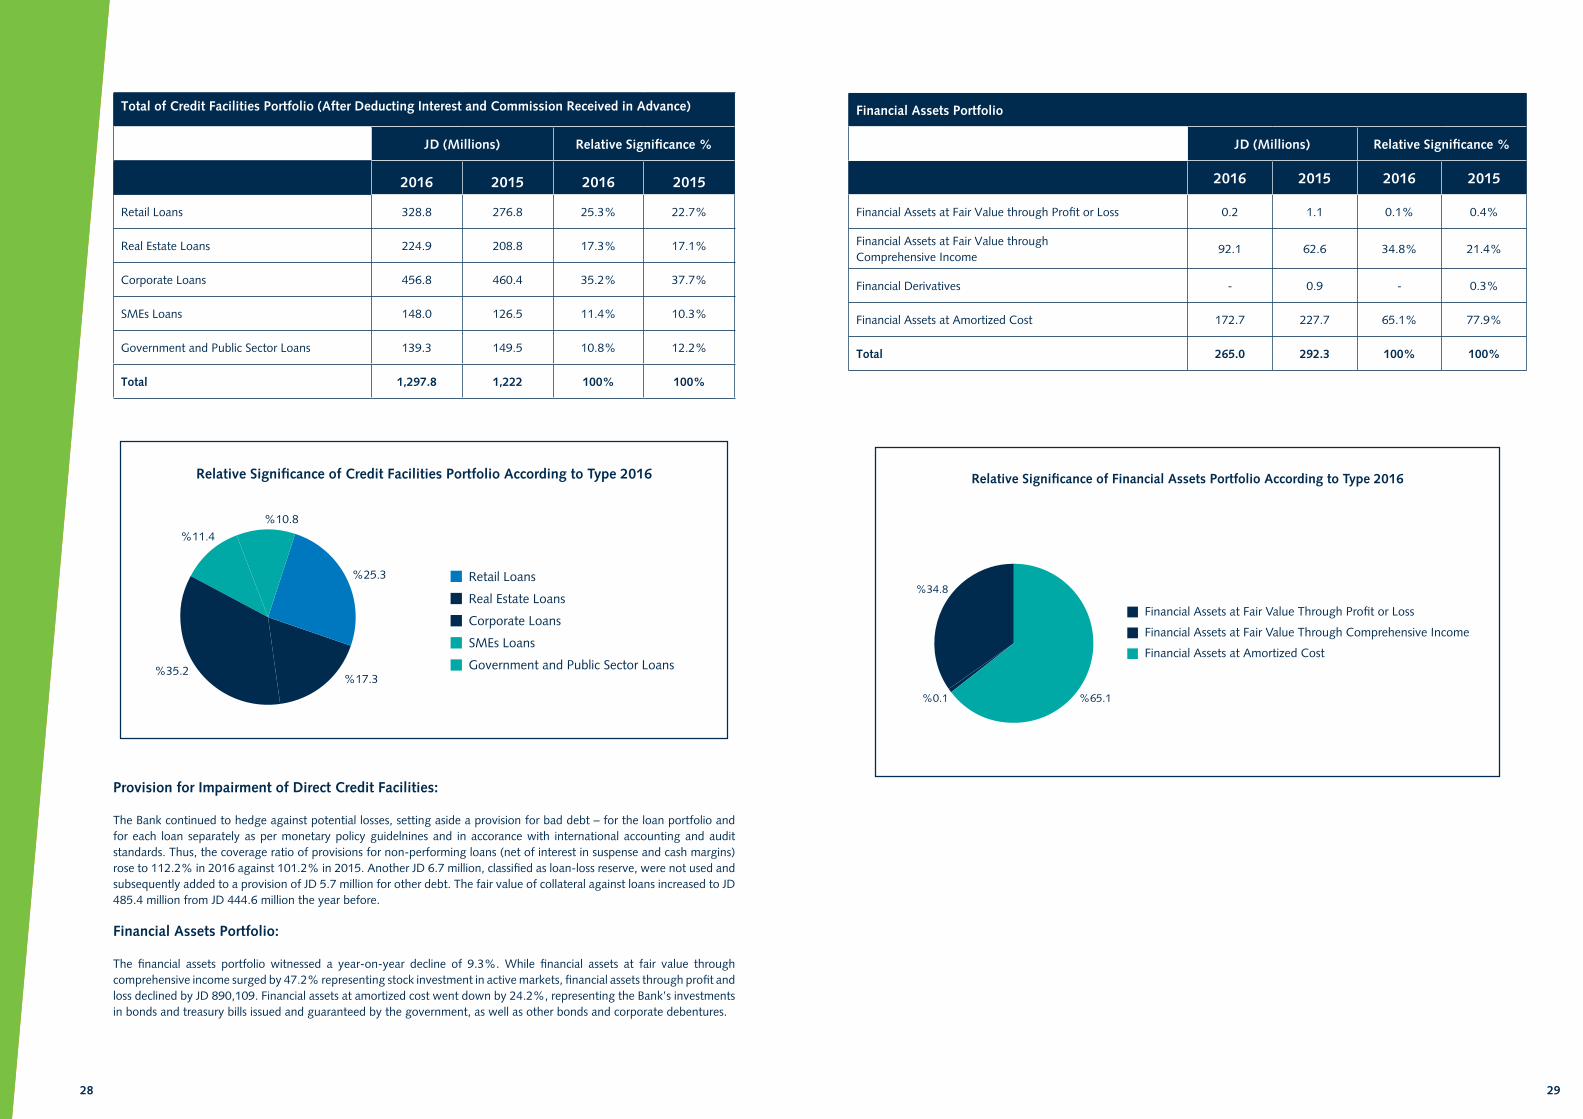
Total of Credit Facilities Portfolio (After Deducting Interest and Commission Received in Advance)
JD (Millions) Relative Significance %
2016 2015 2016 2015
Retail Loans 328.8 276.8 25.3% 22.7%
Real Estate Loans 224.9 208.8 17.3% 17.1%
Corporate Loans 456.8 460.4 35.2% 37.7%
SMEs Loans 148.0 126.5 11.4% 10.3%
Government and Public Sector Loans 139.3 149.5 10.8% 12.2%
Total 1,297.8 1,222 100% 100%
Relative Significance of Credit Facilities Portfolio According to Type 2016
%11.4%10.8
%17.3
%25.3
%35.2
Retail Loans
Real Estate Loans
Corporate Loans
SMEs Loans
Government and Public Sector Loans
Provision for Impairment of Direct Credit Facilities:
The Bank continued to hedge against potential losses, setting aside a provision for bad debt – for the loan portfolio and for each loan separately as per monetary policy guidelnines and in accorance with international accounting and audit standards. Thus, the coverage ratio of provisions for non-performing loans (net of interest in suspense and cash margins) rose to 112.2% in 2016 against 101.2% in 2015. Another JD 6.7 million, classified as loan-loss reserve, were not used and subsequently added to a provision of JD 5.7 million for other debt. The fair value of collateral against loans increased to JD 485.4 million from JD 444.6 million the year before.
Financial Assets Portfolio:
The financial assets portfolio witnessed a year-on-year decline of 9.3%. While financial assets at fair value through comprehensive income surged by 47.2% representing stock investment in active markets, financial assets through profit and loss declined by JD 890,109. Financial assets at amortized cost went down by 24.2%, representing the Bank’s investments in bonds and treasury bills issued and guaranteed by the government, as well as other bonds and corporate debentures.
Financial Assets Portfolio
JD (Millions) Relative Significance %
2016 2015 2016 2015
Financial Assets at Fair Value through Profit or Loss 0.2 1.1 0.1% 0.4%
Financial Assets at Fair Value throughComprehensive Income
92.1 62.6 34.8% 21.4%
Financial Derivatives - 0.9 - 0.3%
Financial Assets at Amortized Cost 172.7 227.7 65.1% 77.9%
Total 265.0 292.3 100% 100%
Relative Significance of Financial Assets Portfolio According to Type 2016
%34.8
%0.1 %65.1
Financial Assets at Fair Value Through Profit or Loss
Financial Assets at Fair Value Through Comprehensive Income
Financial Assets at Amortized Cost

30 31
Customer Deposits:
Customer deposits inched up 2.7% to JD 1,606.9 million at the end of 2016 against JD 1,564.9 million in 2015 with efforts largely focused on attracting fixed deposits, promoting savings accounts and CDs, and expanding the customer base. Figures unveiled that savings accounts rose by 1.2%, current accounts and demand deposits by 9.5%, and CDs by 38.8%. Time deposits, on the other hand, went down 9.2% while non-interest bearing deposits amounted to JD 901.2 million against JD 864.9 million in 2015.
Customer Deposits According to Type
JD (Millions) Relative Significance %
2016 2015 2016 2015
Current Accounts and Demand Deposits 535.2 488.9 33.3% 31.2%
Savings Accounts 675.8 667.6 42.1% 42.7%
Time Deposits 323.8 356.5 20.1% 22.8%
Certificates of Deposit 72.1 51.9 4.5% 3.3%
Total 1,606.9 1,564.9 100% 100%
Relative Significance of Customers’ Deposits 2016
%20.1
%4.5 %33.3
%42.1
Current Accounts and Demand Deposits
Savings Accounts
Time Deposits
Certificates of Deposit
Shareholders’ Equity:
Shareholders’ equity grew by 11.9% to JD 405.4 million in 2016 when compared to the year before, as legal reserves surged by 9.2% to JD 73.9 million. The Bank’s paid up capital also increased by JD 44.9 million to JD 200 million through the distribution of bonus shares emanating from the capitalization of voluntary reserves and a portion of retained earnings. The Board has recommended to the general assembly to distribute cash dividends of 18% of capital, equivalent to JD 36 million, and retain the remaining profits.
Capital Adequacy:
The capital adequacy ratio stood at 20.82% in 2016 versus 18.21% in 2015, which is higher than the 8.625% minimum requirement set by the Basel III and the 12% minimum set by CBJ. The regulatory capital adequacy to risk-weighted assets ratio rose to 20.06% for 2016 against 17.34% in 2015.
Financial Results:
Total revenues dropped by 1% to JD 144.6 million in 2016 from JD 146.1 million in 2015. Total income reached JD 127.4 million against JD 125.2 million in 2015, while net interest and commission income rested at JD 116.2 million, up 4.4% from 2015.Profit before taxes and provisions amounted to JD 70.9 million in 2016 from JD 71.1 million the previous year.Net profit – after deducting the provision for impairment of credit facilities and assets seized by the Bank - grew by 5.3% to JD 42.2 million in 2016 against JD 40.1 million in 2015.
Net Profit Before and After Taxes and Provisions
JD (Millions) Difference
2016 2015 2016
Net Profit before Taxes and Provisions 70.9 71.1 (0.2)
Provision for Impairment of Direct Credit Facilities (5.7) (4.1) (1.6)
Provision for Assets Seized by the Bank (2.5) (3.9) 1.4
Sundry Provisions (0.4) (1.1) 0.7
Net Profit (Before Tax) 62.3 62.0 0.3
Income Tax Expenses (20.1) (21.9) 1.8
Net Profit 42.2 40.1 2.1

32 33
Total Realized Revenue
JD (Millions) Relative Significance %
2016 2015 2016 2015
Interest Income 109.9 111.7 76.0% 76.5%
Net Commission Income 23.5 20.5 16.3% 14%
Financial Assets (Shares) Profit 2.8 3.0 1.9% 2%
Foreign Exchange Profit and Other Revenues 8.4 10.9 5.8% 7.5%
Total 144.6 146.1 100% 100%
Relative Significance of Total Revenues 2016
%1.9
%16.3
%5.8
%76.0
Interest Income
Net Commission Income
Financial Assets (Shares) Profit
Foreign Exchange Profit and Other Revenues
Expenses and Provisions:
Total expenses and provisions rose by 3% to JD 65.1 million in 2016 when compared to the previous year. This is attributed to a 39.7% increase in the provision for impairment of credit facilities against a 1.8% drop in the depreciation item. Employee expenses went up JD 1.74 million. Similarly, other expenses saw a rise due to higher cost of insurance, hospitality, donations, fees, licenses and taxes, professional and legal fees, and other items.
The salaries and compensation of the senior executive management stood at JD 2.3 million. As for audit fees, Bank of Jordan paid JD 127.1 thousand while Bank of Jordan – Syria paid JD 20.6 thousand. Excel for Financial Investments and Jordan Leasing Company paid audit fees of JD 5.2 thousand and JD 2.9 thousand respectively.
Expenses and Provisions
JD (Millions) Relative Significance %
2016 2015 2016 2015
Provision for Impairment of Direct Credit Facilities 5.7 4.1 8.8% 6.5%
Provision for Assets Seized by the bank 2.5 3.9 3.8% 6.2%
Sundry Provisions 0.4 1.1 0.6% 1.7%
Staff Expenses 30.3 28.5 46.5% 45.1%
Other Expenses 21.6 20.9 33.2% 33.1%
Depreciation and Amortization 4.6 4.7 7.1% 7.4%
Total 65.1 63.2 100% 100%
Relative Significance of Expenses and Provisions 2016
%33.2 %8.8
%3.8
%0.6
%7.1
%46.5
Provision for Impairment of Direct Credit Facilities
Provision for assets seized by the Bank
Sundry Provisions
Staff Expenses
Other Expenses
Depreciation and Amortization
Main Financial Ratios
20152016
11.7%10.78%Return on Average Bank Shareholders’ Equity
20.42%20.7%Return on Capital
1.86%1.82%Return on Average Assets
JD 19,677 JD 19,647Profitability Per Employee (After Tax)
5.08%4.84%Interest Income / Average Assets
0.95%0.75%Interest Expense / Average Assets
4.13%4.08%Interest Margin / Average Assets
101.2%112.2%Coverage Ratio of provisions for Non-Performing Loans (Net)
5.94%4.59% Non-performing loans / total credit facilities(after deducting interest in suspense)

34 35
Financial indicators for the years (2012 – 2016) Amount in JD Thousand
Financial Year 2012 2013 2014 2015 2016
Total Assets 2,016,628 2,076,937 2,190,187 2,206,222 2,338,839
Total Credit Facilities 1,028,093 1,146,687 1,196,856 1,221,967 1,297,832
Total Deposits (Customers and Banks) 1,587,636 1,614,125 1,702,899 1,688,476 1,752,603
Bank Shareholders’ Equity 276,510 316,986 335,746 362,242 405,447
Non-controllers’ Interest 14,267 4,506 4,116 4,703 6,989
Net Profit Before Tax 46,222 50,204 59,999 61,966 62,315
20162015201420132012
440,000
400,000
360,000
320,000
280,000
240,000
200,000
160,000
120,000
80,000
40,000
0
The Development of Bank Shareholders’ Equity and Profit
Net Profit Before Tax Bank Shareholders' Equity
JD T
hous
and
2,400,000
2,000,000
1,600,000
1,200,000
800,000
400,000
020162015201420132012
The Development of Financial Position
JD T
hous
and
Total Deposits (Customers & Banks) Total Credit Facilities Total Assets
Our Goals for 2017
– Bolster the Bank’s competitive position and vigilantly monitor evolving market developments, while improving key financial indicators in compliance with local, regional, and international regulatory requirements.
– Develop innovative products and services, and re-launch financing programs that are tailored to fulfill customers’ changing needs.
– Build credibility and improve relations with large corporations and SMEs through outstanding customer service to gain customer loyalty.
– Boost the Bank’s presence locally and regionally through expanding the branch network. The Bank also plans to complete its corporate identity development project, aimed at creating a convenient business environment that enhances customer experience.
– Improve operational effectiveness to meet the current and future needs of the Bank and its subsidiaries locally and regionally. This helps ensure smooth communication between branches and headquarters and efficient service delivery, leading ultimately to maximizing customer satisfaction.
– Launch the new Internet Banking and Mobile Banking systems as part of plans to develop and promote e-payment channels which contribute to achieving the national goal of expanding financial inclusion through the national payment system.
– Develop risk management plans in line with best international practices through regular reviews of policies pertaining to compliance, operational risks, data security, and anti-money laundering. In addition, the Bank will continue to carry out stress tests, ICAAP, and other projects in compliance with BASEL III, COBIT5 (Control Objectives for Information and Related Technologies), and IFRS9 requirements.
– Design a systematic training strategy to improve employee competencies and skills and linking it to the Competencies project. The Bank also plans to adopt new tools to measure the efficiency and effectiveness Soft of HR systems and training programs.
– Move ahead with implementing corporate social responsibility initiatives through building partnerships with leading national institutions and extending support to community-based activities in line with good governance principles.

36 37
Independent Auditor’s Report
Consolidated Statement of Financial Position
Consolidated Statement of Income
Consolidated Statement of Comprehensive Income
Consolidated Statement of Changes in Owners’ Equity
Consolidated Statement of Cash Flows
Notes to the Consolidated Financial Statements
2016Consolidated Financial Statements and Independent Auditor’s Report

38 39
INDEPENDENT AUDITOR’S REPORT

40 41

42 43

44 45
CONSOLIDATED STATEMENT OF FINANCIAL POSITION
Bank of Jordan (A Public Shareholding Limited Company) Amman - Jordan
NoteDecember 31
2016 2015
Assets JD JD
Cash and balances with central banks 4 228,197,814 234,500,507
Balances with banks and financial institutions 5 494,451,425 281,318,758
Deposits with banks and financial institutions 6 25,000,000 155,000,000
Financial assets at fair value through profit or loss 7 205,719 1,095,828
Financial assets at fair value through comprehensive income 8 92,128,338 62,655,399
Financial derivatives 38 - 866,107
Direct credit facilities – Net 9 1,226,013,033 1,142,237,246
Financial assets at amortized cost 10 172,637,680 227,655,707
Investments in associates 11 1 1
Property and equipment – Net 12 29,774,830 25,795,455
Intangible assets – Net 13 3,559,146 3,320,303
Deferred tax assets 19/b 11,926,470 12,217,573
Other assets 14 54,944,608 59,558,989
Total Assets 2,338,839,064 2,206,221,873
Liabilities and Owners’ Equity
Liabilities:
Banks and financial institutions’ deposits 15 145,623,458 123,589,030
Customers’ deposits 16 1,606,979,130 1,564,886,963
Cash margins 17 129,292,102 111,171,152
Financial derivatives 38 17,655 -
Sundry provisions 18 5,015,992 6,226,165
Income tax provision 19/a 16,872,706 13,197,654
Borrowed money 20 424,879 500,956
Other liabilities 21 22,176,908 19,704,999
Total Liabilities 1,926,402,830 1,839,276,919
Owners’ Equity:
Equity attributable to the Bank’s shareholders
Paid-up capital 22 200,000,000 155,100,000
Statutory reserve 23 73,917,046 67,716,833
Voluntary reserve 23 113,124 13,709,740
General banking risks reserve 23 12,996,161 12,646,252
Special reserve 23 3,330,908 2,921,601
Foreign currencies translation differences 24 (12,401,835) (11,481,891)
Fair value reserve 25 63,565,588 33,186,645
Retained earnings 26 63,926,237 88,442,614
Total Equity Attributable to the Bank’s Shareholders 405,447,229 362,241,794
Non-controllers’ interest 6,989,005 4,703,160
Total Owners’ Equity 412,436,234 366,944,954
Total Liabilities & Owners’ Equity 2,338,839,064 2,206,221,873
Board of Director’s Chairman/ Chief Executive Officer The Accompanying Notes From (1) To (47) Constitute An Integral Part
Of These Consolidated Finacial Statements And Should Be Read With Them.

46 47
CONSOLIDATED STATEMENT OF INCOME
Bank of Jordan (A Public Shareholding Limited Company) Amman - Jordan
Note
For the Year Ended December 31
2016 2015
JD JD
Interest income 28 109,915,974 111,672,273
Interest expense 29 17,153,738 20,826,542
Net Interest Income 92,762,236 90,845,731
Commissions income – Net 30 23,482,888 20,514,522
Net Interest and Commissions Income 116,245,124 111,360,253
Foreign currencies income 31 2,486,154 2,791,535
(Loss) from financial assets at fair value through income statement 32 (54,858) (130,717)
Cash dividends from financial assets at fair value through comprehensive income
8 2,815,647 3,107,684
Other income 33 5,956,955 8,091,777
Total Income 127,449,022 125,220,532
Employees’ expenses 34 30,254,435 28,514,832
Depreciation and amortization 12,13 4,591,875 4,674,828
Other expenses 35 21,645,649 20,921,269
Provision for impairment of direct credit facilities 9 5,689,334 4,071,190
Provision for assets seized by the Bank 14 2,537,031 3,941,057
Sundry provisions 18 415,290 1,131,178
Total Expenses 65,133,614 63,254,354
Profit before Income Tax 62,315,408 61,966,178
Less: Income tax expense 19 20,113,384 21,903,385
Profit for the Year 42,202,024 40,062,793
Attributable to:
Bank’s Shareholders 41,396,285 40,835,470
Non-controllers’ Interest 805,739 (772,677)
Profit for the Year 42,202,024 40,062,793
Earnings per share for the year attributableto the Banks’ shareholders
Basic/diluted 36 0.207 0.204
Board of Director’s Chairman/ Chief Executive Officer
The Accompanying Notes From (1) To (47) Constitute An Integral Part Of These Consolidated Finacial Statements And Should Be Read With Them.
CONSOLIDATED STATEMENT OF COMPREHENSIVE INCOME
Bank of Jordan (A Public Shareholding Limited Company) Amman - Jordan
For the Year Ended December 31
20152016
JDJD
40,062,79342,202,024Profit for the Year
Other comprehensive income items:
“Items that may be reclassified subsequently to consolidated statement of income:”
4,065,419 2,583,450 Foreign currencies translation differences
4,065,419 2,583,450
“Items that will not be reclassified subsequently to consolidated statement of income:”
- (491,918)“(Loss) from sales of financial assets at fair value through comprehensive income”
15,227,173 32,217,724 Change in fair value reserve - Net of tax
15,227,173 31,725,806
59,355,38576,511,280Total Comprehensive Income
Total Comprehensive Income Attributable to:
58,129,78174,225,435The Bank’s Shareholders
1,225,604 2,285,845Non-controllers’ Interest
59,355,38576,511,280
The Accompanying Notes From (1) To (47) Constitute An Integral Part Of These Consolidated Finacial Statements And Should Be Read With Them.
48 49
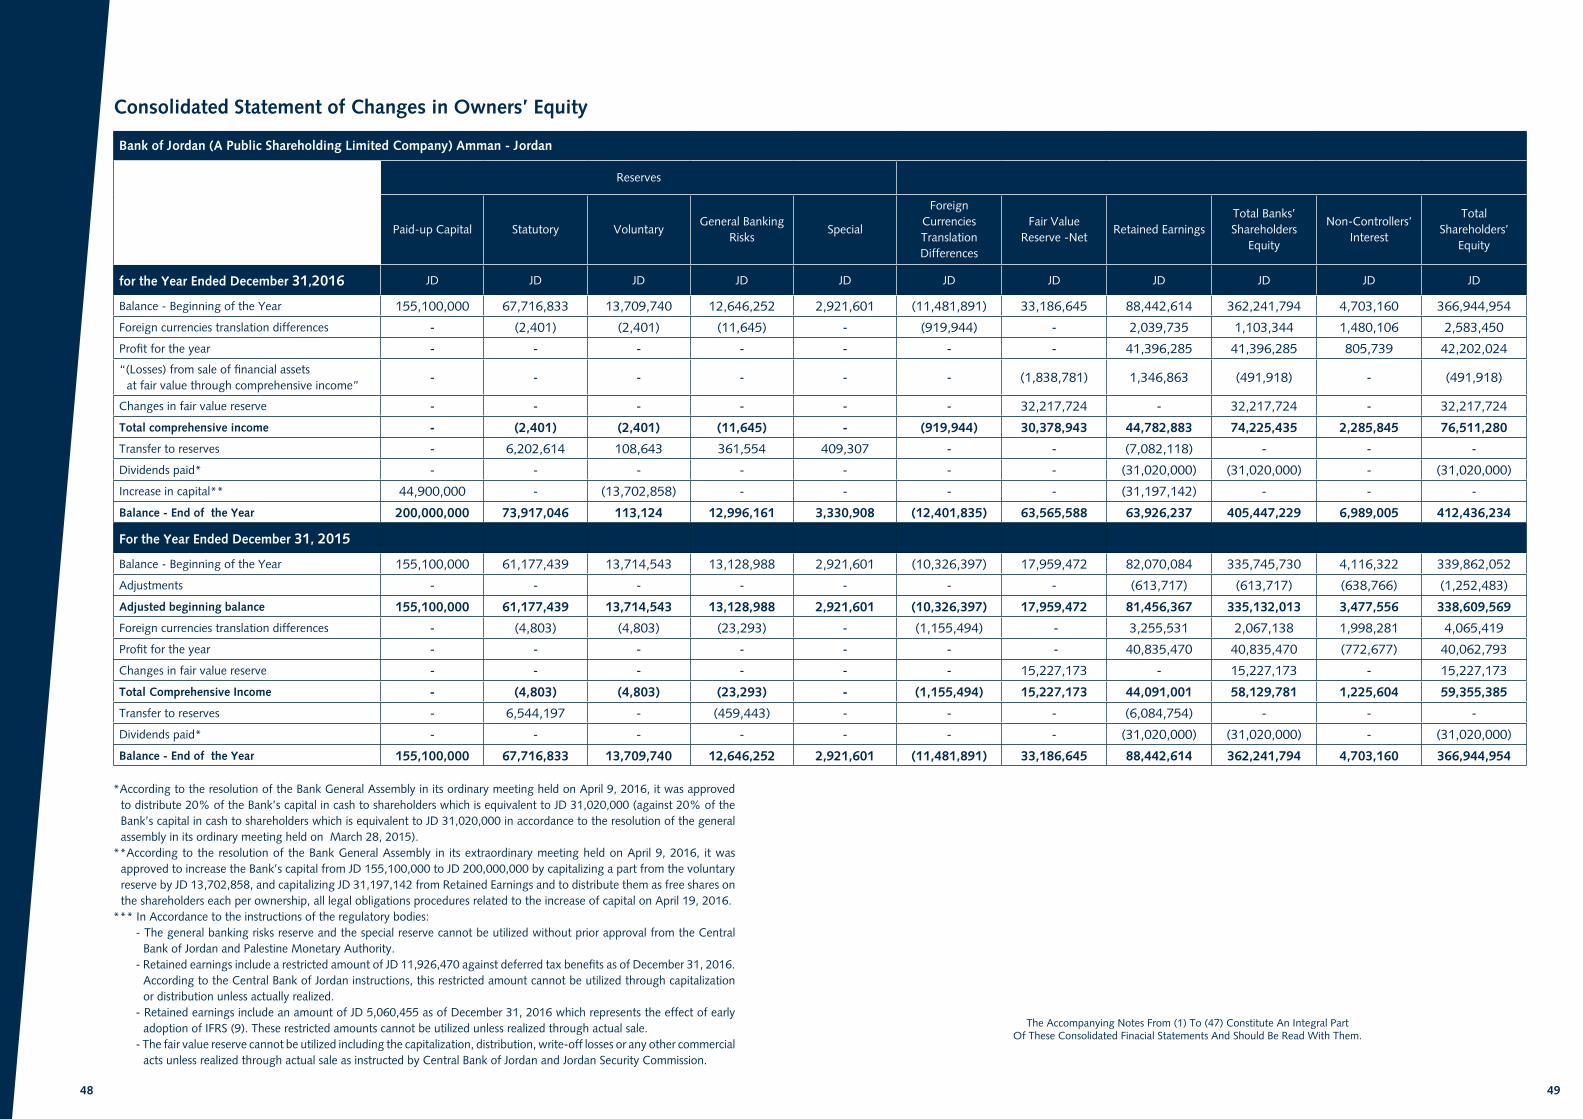
Consolidated Statement of Changes in Owners’ Equity
Bank of Jordan (A Public Shareholding Limited Company) Amman - Jordan
Reserves
Paid-up Capital Statutory VoluntaryGeneral Banking
RisksSpecial
Foreign Currencies Translation Differences
Fair Value Reserve -Net
Retained EarningsTotal Banks’ Shareholders
Equity
Non-Controllers’ Interest
Total Shareholders’
Equity
for the Year Ended December 31,2016 JD JD JD JD JD JD JD JD JD JD JD
Balance - Beginning of the Year 155,100,000 67,716,833 13,709,740 12,646,252 2,921,601 (11,481,891) 33,186,645 88,442,614 362,241,794 4,703,160 366,944,954
Foreign currencies translation differences - (2,401) (2,401) (11,645) - (919,944) - 2,039,735 1,103,344 1,480,106 2,583,450
Profit for the year - - - - - - - 41,396,285 41,396,285 805,739 42,202,024
“(Losses) from sale of financial assets at fair value through comprehensive income”
- - - - - - (1,838,781) 1,346,863 (491,918) - (491,918)
Changes in fair value reserve - - - - - - 32,217,724 - 32,217,724 - 32,217,724
Total comprehensive income - (2,401) (2,401) (11,645) - (919,944) 30,378,943 44,782,883 74,225,435 2,285,845 76,511,280
Transfer to reserves - 6,202,614 108,643 361,554 409,307 - - (7,082,118) - - -
Dividends paid* - - - - - - - (31,020,000) (31,020,000) - (31,020,000)
Increase in capital** 44,900,000 - (13,702,858) - - - - (31,197,142) - - -
Balance - End of the Year 200,000,000 73,917,046 113,124 12,996,161 3,330,908 (12,401,835) 63,565,588 63,926,237 405,447,229 6,989,005 412,436,234
For the Year Ended December 31, 2015
Balance - Beginning of the Year 155,100,000 61,177,439 13,714,543 13,128,988 2,921,601 (10,326,397) 17,959,472 82,070,084 335,745,730 4,116,322 339,862,052
Adjustments - - - - - - - (613,717) (613,717) (638,766) (1,252,483)
Adjusted beginning balance 155,100,000 61,177,439 13,714,543 13,128,988 2,921,601 (10,326,397) 17,959,472 81,456,367 335,132,013 3,477,556 338,609,569
Foreign currencies translation differences - (4,803) (4,803) (23,293) - (1,155,494) - 3,255,531 2,067,138 1,998,281 4,065,419
Profit for the year - - - - - - - 40,835,470 40,835,470 (772,677) 40,062,793
Changes in fair value reserve - - - - - - 15,227,173 - 15,227,173 - 15,227,173
Total Comprehensive Income - (4,803) (4,803) (23,293) - (1,155,494) 15,227,173 44,091,001 58,129,781 1,225,604 59,355,385
Transfer to reserves - 6,544,197 - (459,443) - - - (6,084,754) - - -
Dividends paid* - - - - - - - (31,020,000) (31,020,000) - (31,020,000)
Balance - End of the Year 155,100,000 67,716,833 13,709,740 12,646,252 2,921,601 (11,481,891) 33,186,645 88,442,614 362,241,794 4,703,160 366,944,954
*According to the resolution of the Bank General Assembly in its ordinary meeting held on April 9, 2016, it was approved to distribute 20% of the Bank’s capital in cash to shareholders which is equivalent to JD 31,020,000 (against 20% of the Bank’s capital in cash to shareholders which is equivalent to JD 31,020,000 in accordance to the resolution of the general assembly in its ordinary meeting held on March 28, 2015).
**According to the resolution of the Bank General Assembly in its extraordinary meeting held on April 9, 2016, it was approved to increase the Bank’s capital from JD 155,100,000 to JD 200,000,000 by capitalizing a part from the voluntary reserve by JD 13,702,858, and capitalizing JD 31,197,142 from Retained Earnings and to distribute them as free shares on the shareholders each per ownership, all legal obligations procedures related to the increase of capital on April 19, 2016.
*** In Accordance to the instructions of the regulatory bodies:- The general banking risks reserve and the special reserve cannot be utilized without prior approval from the Central
Bank of Jordan and Palestine Monetary Authority.- Retained earnings include a restricted amount of JD 11,926,470 against deferred tax benefits as of December 31, 2016.
According to the Central Bank of Jordan instructions, this restricted amount cannot be utilized through capitalization or distribution unless actually realized.
- Retained earnings include an amount of JD 5,060,455 as of December 31, 2016 which represents the effect of early adoption of IFRS (9). These restricted amounts cannot be utilized unless realized through actual sale.
- The fair value reserve cannot be utilized including the capitalization, distribution, write-off losses or any other commercial acts unless realized through actual sale as instructed by Central Bank of Jordan and Jordan Security Commission.
The Accompanying Notes From (1) To (47) Constitute An Integral Part Of These Consolidated Finacial Statements And Should Be Read With Them.

50 51
CONSOLIDATED STATEMENT OF CASH FLOWS
Bank of Jordan (A Public Shareholding Limited Company) Amman - Jordan JD
For the year ended December 31
Cash Flows From Operating Activities Note 2016 2015
Profit before income tax 62,315,408 61,966,178
Adjustments for:
Depreciation and amortization 12,13 4,591,875 4,674,828
Provision for impairment in direct credit facilities 9 5,689,334 4,071,190
(Gain) from sale of property and equipment 33 (64,547) (16,988)
Loss from financial assets at fair value through profit or loss – Unrealized 32 36,351 61,466
Effect of exchange rate fluctuations 31 (2,341,645) (2,758,803)
Sundry provisions 18 415,290 1,131,178
Provisions for assets foreclosed by the Bank 14 2,537,031 3,941,057
Foreign currency exchange differences 1,466,147 3,214,347
Profit before Changes in Assets and Liabilities 74,645,244 76,284,453
Changes in Assets and Liabilities:
Decrease (increase) in restricted balances (746,708) 221,572 (Increase) decrease in deposits with banks and financial institutions(maturing over 3 months) 130,000,000 (155,000,000)
Decrease in financial assets at fair value through profit or loss 853,758 3,698,605
(Increase) in direct credit facilities (89,465,121) (45,691,135)
Decrease in other assets 2,077,350 6,882,672
(Decrease) increase in deposits and financial institutions (maturing over 3 months) (3,159,000) 3,159,000
increase (Decrease) in customers’ deposits 42,092,167 (63,586,340)
Increase in cash margins 18,120,950 9,059,666
(Decrease) in borrowing money (76,077) -
Increase (decrease) in other liabilities 2,399,248 (781,850)
Net Change in Assets and Liabilities 102,096,567 (242,037,810)
Net Cash Flows from (used in) Operating Activities before Taxes, End-of-Service Indemnity Provision, and Lawsuits Provision 176,741,811 (165,753,357)
Paid from end-of-service indemnity provision and lawsuits provision 18 (1,525,128) (3,627,631)
Income tax paid 19 (16,811,866) (19,562,896)
Net Cash Flows from (used in) Operating Activities 158,404,817 (188,943,884)
Cash Flows From Investing Activities
(Purchase) of financial assets at amortized cost (37,503,238) (94,490,374)
Maturity of financial assets at amortized cost 92,521,265 318,792,131
(Purchase) of financial assets at fair value through comprehensive income (2,988,738) -
Sale of financial assets at fair value through comprehensive income 5,237,547 -
Maturity (Purchase) of financial derivatives 883,762 (115,362)(Purchase) of property and equipment and advance payments to]acquire property and equipment (8,895,633) (4,634,780)
Sale of property and equipment 213,092 199,536
(Purchase) of intangible assets 13 (960,792) (609,886)
Net Cash Flows from Investing Activities 48,507,265 219,141,265
Cash Flows From Financing Activities
Foreign currencies translation differences 2,583,450 4,065,419
Dividends distributed to shareholders (30,947,339) (30,555,289)
Net Cash Flows (used in) Financing Activities (28,363,889) (26,489,870)
Effect of exchange rate fluctuations on cash and cash equivalents 31 2,341,645 2,758,803
Net Increase in Cash and Cash Equivalents 180,889,838 6,466,314
Cash and Cash Equivalents – Beginning of the Year 383,255,834 376,789,520
Cash and Cash Equivalents – End of the Year 37 564,145,672 383,255,834
The Accompanying Notes From (1) To (47) Constitute An Integral Part Of These Consolidated Finacial Statements And Should Be Read With Them.
NOTES TO CONSOLIDATED FINANCIAL STATEMENTS
1. General Bank of Jordan was established in 1960 as a public shareholding limited company with headquarters in Amman – Jordan. On March 3, 1960, it was registered under number (1983) according to the Companies Law No. 33 for the Year 1962 with an authorized capital of JD 350,000, represented by 70,000 shares at a par value of JD 5 per share. However, the Bank’s authorized and paid-up capital was increased in stages last of which took place in accordance to the resolution of the general assembly in their extraordinary meeting held on April 9, 2016, thus, the Bank’s capital increased from 155/5 million to become 200 million through the capitalization of JD 13,702,858 from voluntary reserve and JD 31,197,142 from retained earnings, All of the legal procedures related to the capital increase have been completed on April 19, 2016.
The Bank provides all financial and banking services within its scope of activities. Those services are offered through its (71) branches in Jordan, (14) branches in Palestine and its subsidiaries in Jordan and Syria (Excel for Financial Investments Company, Jordan Leasing Company and Bank of Jordan - Syria).
The consolidated financial statements have been approved by the Board of Directors in its meeting No.595 held on January 24, 2017 and remain subjected to the Central Bank of Jordan approval.
2. Summary of Significant Accounting Policies
Basis of Preparation - The consolidated financial statements for the Bank and its subsidiaries were prepared in accordance with the standards issued by the
International Accounting Standards Board and the interpretations of the International Financial Reporting Interpretation Committee Emanating from the International Accounting Standards Board and in conformity with the applicable laws and regulations of the Central Bank of Jordan.
The consolidated financial statements were prepared on the historical cost basis except for financial assets at fair value through profit or loss, financial assets at fair value through comprehensive income and financial derivatives which are measured at fair value at the date of the consolidated financial statements. Moreover, hedged assets and liabilities are stated at fair value.
- The consolidated financial statements are presented in Jordanian Dinar “JD”, being the functional currency of the Bank.
- The accounting policies adopted for the current year are consistent with those applied in the year ended December 31, 2015 except for the effect of the adoption of new and modified standards as stated in Note (47 - A).
Basis of Consolidation - The consolidated financial statements include the financial statements of the Bank and the subsidiaries controlled by the Bank.
Control is achieved whereby the Bank has the power to govern the financial and operating policies of the subsidiaries to obtain benefits from their activities. All intra-group transactions, balances, income, and expenses are eliminated in full.
- The financial statements of the subsidiary companies are prepared for the same financial year of the Bank using the same accounting policies adopted by the Bank. If the accounting policies adopted by the subsidiary companies are different from those used by the Bank, the necessary adjustments to the financial statements of the subsidiary companies are made so as to comply with the accounting policies used by the Bank.
As of December 31, 2016 and 2015, the Bank has the following subsidiary companies:
Name of Subsidiary Paid-up CapitalBank’s Ownership
Percentage %
Subsidiary’s Nature of Business
Place of Operation
Acquisition Date
Excel for FinancialInvestments Company
JD 3.5 Million 100Financial
BrokerageAmman March 23, 2006
Bank of Jordan – Syria*3,000 Million (Syrian – Lira)
49 Banking Activities Syria May 17, 2008
Jordan Leasing Company JD 20 Million 100 Finance Lease Amman October 24, 2011

52 53
The most important information of the subsidiaries for the year 2016 is as follows:
December 31, 2016 For the Year 2016
Name of Subsidiary Total Assets Total Liabilities Total Revenues Total Expenses
JD JD JD JD
Excel for FinancialInvestments Company
12,234,986 4,032,604 6,045,049 1,642,649
Bank of Jordan – Syria* 42,027,798 27,356,050 2,929,648 1,349,768
Jordan Leasing Company 22,860,991 262,202 1,356,380 569,105
- The results of the subsidiaries are incorporated into the consolidated statement of income from the effective date of acquisition which is the date on which actual control over the subsidiary is assumed by the Bank. Moreover, the operating results of the disposed subsidiaries are incorporated into the consolidated statement of income up to the effective date of disposal which is the date on which the Bank loses control over the subsidiaries.
- Non-controllers’ interest represents the portion of equity not held by the Bank in the subsidiary company.
* The results of Bank of Jordan – Syria have been consolidated in the accompanied consolidated financial statements due to the Bank’s power to govern the financial and operating policies of the subsidiary company.
Segmental Information - Business is a group of assets and operations that jointly provide products or services subject to risks and returns different
from those of other business segments , to the effect that it is measured according to the reports used by the Executive Directors and the main decision maker at the Bank.
- Geographical sector relates to providing products or services in an economic environment subject to specific risks and returns different from those operating in other sectors of other economic environments.
Direct Credit Facilities - A provision for the impairment of direct credit facilities is recognized when the Bank cannot obviously recover the
overdue amounts, and there is objective evidence that the future cash flows of the direct credit facilities have been negatively impacted by an event as well as the estimation of the impairment loss. The provision amount is charged to in the consolidated statement of income.
- Interest and commission earned on non-performing credit facilities are suspended in accordance with the instructions of the Central Bank of Jordan, and in accordance with the instructions of the regulatory authorities in Syria and the Palestinian Monetary Authority, whichever is more conservative.
- Credit facilities are written off against its provision when the procedures to collect these direct credit facilities are not feasible. Any surplus in the gross provision - if any - is reversed through the consolidated statement of income. Subsequent recoveries of amounts previously written off are credited to revenue.
- The credit facilities and their own suspended interests that have been fully provided for with provisions, are transferred to off-consolidated financial position statement based on the board of directors’ decisions regarding this issue.
- The suspended interests are accounted for the accounts at the off – the consolidated financial position which have legal suits based on the Board of Directors’ decisions.
Financial Derivatives and Hedge AccountingFinancial Derivatives for Trading:The fair value of financial derivatives for trading (such as forward foreign currency contracts, future interest rate contracts, swap agreements, and foreign currency options) is recorded in the consolidated statement of financial position. Fair value is measured according to the prevailing market prices; the change in fair value is recognized in the consolidated statement of income.
Financial Derivatives for Hedging:For hedge accounting purposes, the financial derivatives are stated at fair value. Hedges are classified as follows:
• Fair value hedge: Hedge for the change in the fair value exposures of the Bank’s assets and liabilities.
– When the conditions of an effective fair value hedge are met, the resulting gains and losses from re-measuring the valuation of fair value hedge and the change in the fair value of the hedged assets or liabilities is recognized in the consolidated statement of income.
– When the conditions of an effective portfolio hedge are met, the gain or loss resulting from the revaluation of the hedging instrument at fair value as well as the change in the fair value of the assets or liabilities portfolio is recorded in the consolidated statement of income for the same year.
• Cash flow hedge:Hedge for the change in the current and expected cash flows Exposures of the Bank’s assets and liabilities.
– When the conditions of an effective cash flow hedge are met, the gain or loss of the hedging instruments is recognized in owners’ equity. Such gain or loss is transferred to the consolidated statement of income in the period in which the hedge transaction impacts the consolidated statement of income.
– When the conditions of the effective hedge do not apply, the gain or loss resulting from change in the fair value of the hedging instrument is recorded in the consolidated statement of income in the same year.
– Profit or loss resulting from the foreign exchange of interest-bearing debt instruments and within financial assets at fair value through other comprehensive income is included in the consolidated statement of income. Differences in the foreign currency translation of equity instruments are included in the cumulative change in fair value reserve within owners’ equity in the consolidated statement of financial position.
Financial Assets at Amortized Cost – Financial assets at amortized cost are the financial assets which the Bank management intends, according to its business model, to
hold for the purpose of collecting the contractual cash flows which comprise the contractual cash flows that are solely payments of principal and interest on the outstanding principal.
– Financial assets are recorded at cost upon purchase plus acquisition expenses. Moreover, the issue premium \ discount is amortized using the effective interest rate method, and recorded as debit or credit in the interest account. Provisions associated with the decline in value of these investments leading to the inability to recover the investment or parts thereof are deducted. Any impairment is recorded in the consolidated statement of income and should be presented subsequently at amortized cost less any impairment losses.
– The amount of the impairment loss recognised at amortized cost is the difference between the asset’s carrying amount and the present value of estimated future cash flows discounted at the original effective interest rate.
– It is not allowed to reclassify any financial assets to / from this category except for certain cases specified at the International Financial Reporting Standards (and in the case of selling any of those assets before its maturity date, the results should be recorded in a separate account in the consolidated statement of comprehensive income, disclosures should be made in accordance with the requirements of relevant International Financial Reporting Standards).
Financial Assets at Fair Value through Profit or Loss– Financial assets at fair value through profit or loss are the financial assets purchased by the Bank for the purpose of trading in the
near future and achieving gains from the fluctuations in the short-term market prices or trading margins.
– Financial assets at fair value through profit or loss are initially stated at fair value at acquisition date (purchase costs are recorded in the consolidated statement of income upon acquisition) and subsequently measured in fair value. Moreover, changes in fair value are recorded in the consolidated statement of income including the change in fair value resulting from translation of non-monetary assets stated at foreign currency. Gains or losses resulting from the sale of these financial assets or part of them are taken to the consolidated statement of income.
– Dividends and interests from these financial assets are recorded in the consolidated statement of income.
– It is not allowed to reclassify any financial assets to / from this category except for the cases specified in the International Financial Reporting Standards.

54 55
Financial Assets at Fair Value through Other Comprehensive Income– These financial assets represent the investments in equity instruments held for long term.
– These financial assets are recognized at fair value plus transaction costs. Subsequently, they are measured at fair value with gains and losses arising from changes in fair value recognized in the consolidated statement of other comprehensive income and within owner’s equity, including the changes in fair value resulting from translation of non-monetary assets stated in foreign currency. Gain or loss from the sale of these investments or part of them should be recognized in the consolidated statement of comprehensive income and within the consolidated owner’s equity, and the balance of the revaluation reserve for these assets should be transferred directly to the retained earnings not through the consolidated statement of income.
– No impairment testing is required for these assets.
– Dividends are recorded in the consolidated statement of income.
Fair Value The closing price (Asset Purchase/Liabilities Selling) as of the date of the consolidated financial statements in active markets represent the fair value of financial assets and derivatives that have declared market prices.
In case declared market prices do not exist, active trading of some financial assets and derivatives is not available, or the market is inactive, fair value is estimated by: – Comparison with the current market value of a highly similar financial instrument.
– The estimated future cash flows and discounted cash flows at current rates applicable for items with similar terms.
– Options pricing models.
– Evaluation of long-term assets and liabilities that bear no interest in accordance with discounted cash flows using effective interest rate. Premiums and discounts are amortized within interest revenues or expense in the consolidated statement of income.
The evaluation methods aim to obtain a fair value that reflects market expectations and takes into consideration market factors and any expected risks or benefits at the time of evaluation of the financial instruments. In case the fair value of a financial instrument cannot be measured reliably, it is stated at cost less any impairment. Impairment in Financial AssetsThe Bank reviews the values of financial assets recorded on the date of the consolidated statement of financial position in order to determine if there are any indications of impairment in their value individually or in the form of a portfolio. In case such indication exists, the recoverable value is estimated so as to determine the impairment loss.
Investments in Associates– An associate is an entity over which the Bank has significant influence on the decisions related to Financial and operating
policies (but does not control) and whereby the Bank owns 20% - 50% of its voting rights. Moreover, the Bank recognizes its share in the associate based on the equity method.
– Profits and losses resulting from transactions between the Bank and its associates are eliminated according to the Bank’s ownership percentage in these companies.
Property and Equipment– Property and equipment are stated at cost less accumulated depreciation and any impairment loss in its value. Moreover,
depreciation is calculated (except for lands) when the assets are ready for use on the straight-line basis over the estimated useful lives of these assets as follows:
%
Buildings 2 – 15
Equipment and Fixtures 15
Furniture 9
Vehicles 15
Computers 15
Improvements and Decorations 15
– When the carrying amounts of Property and Equipment exceed their recoverable values, assets are written down, and impairment losses are recorded in the consolidated statement of income.
– The useful lives of Property and Equipment are reviewed at the end of each year. In case the expected useful life is different from what was determined before, the change in estimate is recorded in the following years, being a change in estimate.
– Property and Equipment are derecognized when disposed of or when there is no expected future benefit from their use.
ProvisionsProvisions are recognized when the Bank has an obligation on the date of the consolidated statement of financial position arising from a past event and the costs to settle the obligation are both probable and can be reliably measured.
End-of-Service Indemnity Provision The annual end-of-service indemnities paid to resigned employees are deducted from the related provision when paid, moreover, the excess in the amounts paid to resigned employees than the booked provision are recorded in the consolidated statement of income. Furthermore, provision against commitments of end-of-service indemnity is taken to the consolidated statement of income.
Income Tax– Income tax expenses represent accrued taxes and deferred taxes.
– Income tax expenses are accounted for on the basis of taxable income. Taxable income differs from declared income in the consolidated financial statements because the latter includes non-taxable revenues or disallowed taxable expenses in the current year but deductible in subsequent years, tax acceptable accumulated losses, and items not accepted for tax purposes or subject to tax.
– Taxes are calculated on the basis of the tax rates according to the prevailing laws, regulations, and instructions enforced in the countries where the Bank operates.
– Deferred taxes are taxes expected to be paid or recovered as a result of temporary timing differences between the value of assets and liabilities in the consolidated financial statements and the value of taxable amounts. Deferred tax is calculated on the basis of liability method in the consolidated statement of financial position according to the rates expected to be applied when the tax liability is settled or deferred tax assets are recognized.
– Deferred tax assets and deferred tax liabilities are reviewed as of the date of the consolidated statement of financial position, and reduced in case it is expected that no benefit or need will arise, partially or totally.
Paid-up Capital – Cost of issuing or purchasing the Bank’s shares
The cost of issuance or purchase of the Bank’s shares is recognized in the Retained Earnings (net after tax effect if any). If the purchase/issue transaction has not been completed, then the cost will be recognized as an expense in the consolidated statement of income.
– Treasury SharesNo gain or loss is recognised in the consolidated statement of income on the sale of treasury shares but recognised in owners’ equity within share premium/discount. Moreover, loss is recorded in retained earnings in case the share premium of treasury shares has been used up.
Accounts Managed on Behalf of Customers– These represent the accounts managed by the Bank on behalf of its customers, but do not represent part of the Bank’s assets.
– The fees and commissions on such accounts are shown in the consolidated statement of income.
– A provision against the impairment in the capital-guaranteed portfolios managed on behalf of customers is taken.
OffsettingFinancial assets and financial liabilities are offset, and the net amount is reported in the consolidated statement of financial position when there is a legally enforceable right to offset the recognized amounts and the Bank intends to either settle them on a net basis or to realize the asset and settle the liability simultaneously.

56 57
Realization of Income and Recognition of Expenses– Interest income is realized by using the effective interest method except for interest and commissions from non-
performing credit facilities, which have not been recognized as income and registered in interest and commissions in suspense.
– Revenues and expenses are recognised according to the accrual basis.
– Commission is recorded as revenue when the related services are provided. Moreover, dividends are recorded when realized (decided upon by the General Assembly of Shareholders).
Recognition of Financial Assets Purchase and sale of financial assets are recognized on the trading date (which is the date on which the Bank commits itself to purchase or sell the financial asset).
Mortgaged Financial AssetsMortgaged financial assets are assets mortgaged to third parties, which hold the right to sell or refinance the mortgage. Those assets are continuously evaluated according to the accounting policies designated for each of them and to its original class.
Foreclosed AssetsAssets that have been subjected to foreclosure by the Bank are shown at the consolidated financial position under “other assets” at the acquisition value or fair value, whichever is lower. As of the consolidated financial statements date, these assets are re-valued individually at fair value. Any decline in their market value is taken to the consolidated statement of income as a loss whereas any such increase is not recognized. Subsequent increase is taken to the consolidated statement of income to the extent that it does not exceed the previously recorded impairment.
In accordance with the dissemination of the Central Bank of Jordan No. 10/1/4076 dated on March 27, 2014, the Bank has started from the beginning of the year 2015 to calculate a gradual provision against the assets foreclosed against debts with periods exceeding 4 years.
Intangible AssetsA - Goodwill:– Goodwill is recorded at cost which repesents the excess of the acquisition costs or investment costs in a subsidiary over
the net assets fair value of the subsidiary as of the acquisition date. Goodwill that arises from the investment in the subsidiary is recognised in a separate item as intangible assets. Later on, goodwill will be reviewed and reduced by any impairment amount.
– Goodwill is allocated to cash generating unit(s) to test impairment in its value.
– Impairment testing is done on the date of the consolidated financial statements. Goodwill is reduced if the test indicates that there is impairment in its value, and that the estimated recoverable value of the cash generating unit(s) relating to goodwill is less than the book value of the cash generating unit(s). Impairment is recognised in the consolidated statement of income.
B- Other intangible assets:– Intangible assets raised through combination are stated at fair value on the date of acquisition. Other intangible assets
raised other than combination are recorded at cost.
– Intangible assets are classified on the basis of either a definite or an indefinite useful life. Intangible assets with definite useful economic lives are amortized over their useful lives and recorded as an expense in the consolidated statement of income. Intangible assets with indefinite lives are reviewed for impairment as of the consolidated financial statements date, and impairment loss is treated in the consolidated statement of income.
– No capitalization of intangible assets resulting from the Bank’s operations is made. They are rather recorded as an expense in the consolidated statement of income for the year.
– Any indications of impairment in the value of intangible assets as of the consolidated financial statements date are reviewed. Furthermore, the estimated useful lives of the impaired intangible assets are reassessed, and any adjustment is made in the subsequent period.
The accounting policy for the intangible assets of the Bank:
Computer SoftwareSoftware is shown at cost at the time of purchase and amortized at an annual rate of 15% - 20%.
Foreign Currency– Transactions in foreign currencies during the year are recorded at the exchange rates prevailing on the date of the transaction.
– Financial assets and financial liabilities denominated in foreign currencies are translated at the average rates prevailing on the consolidated statement of financial position date as declared by the Central Bank of Jordan, Central Bank of Syria and the Palestinian Monetary Authority.
– Non-monetary assets and liabilities denominated in foreign currencies and recorded at fair value are translated on the date when their fair value is determined.
– Gains or losses resulting from foreign currency translation are recorded in the consolidated statement of income.
– Translation differences for non-monetary assets and liabilities denominated in foreign currencies (such as equity securities) are recorded as part of the change in fair value.
– When consolidating the financial statements, the assets and liabilities of foreign branches and subsidiary companies are translated into the functional currency of each entity at the average exchange rates of the Central Bank of Jordan prevailing on the consolidated statement of financial position date. Income and expense items are translated at the average exchange rates for the year. Any exchange differences are taken directly to a foreign currency translation adjustment reserve within owners’ equity. Exchange differences arising from the sale of foreign branches or subsidiaries are recorded as part of the revenues or expenses within the consolidated statement of income.
Cash and Cash EquivalentsCash and cash equivalents comprise cash balances with central banks and balances with banks and financial institutions, less balances due to banks and financial institutions maturing within three months and restricted funds.
3. Accounting EstimatesPreparation of the consolidated financial statements and the application of the accounting policies require the Bank’s management to perform assessments and assumptions that affect the amounts of assets, liabilities, disclosures and contingent liabilities. Moreover, these assessments and assumptions affect revenues, expenses, provisions and the balance of fair value reserves within capital and reserves. In particular, this requires the Bank’s management to issue significant judgments and assumptions to assess the future cash flows amounts and their timing. Moreover, the beforementioned assessments are necessarily based on assumptions and factors with varying degrees of consideration and uncertainty. In addition, actual results may differ from assessments due to the changes arising from the conditions and circumstances of those assessments in the future.
We believe that the assumptions and estimates with material impacts on the recognition of balances recorded in the consolidated financial statements are fairly presented. And the details of these assumptions are as follows:
– A provision for credit facilities is taken on the basis and estimates approved by management in conformity with the International Financial Reporting Standards (IFRS). The outcomes of these basis and estimates are compared against the adequacy of the provisions as per the instructions of the Central Banks where the Bank branches and subsidiaries operate. The strictest outcomes that conform to the IFRS are used for the purpose of determining the provision.
– Management periodically reassesses the economic useful lives of tangible and intangible assets for the purpose of calculating annual depreciation and amortization based on the general condition of these assets and the assessment of their expected useful economic lives. Impairment loss is taken to the consolidated statement of income.
– Impairment of assets foreclosed are recorded based on recent and approved evaluations of these assets performed by approved evaluators for the purposes of calculating the impairment. The impairment for these assets is reviewed periodically. In accordance with the dissemination of the Central Bank of Jordan No. 10/1/4076 dated on March 27, 2014, the Bank has started from the beginning of the year 2015 to calculate a gradual provision against the assets foreclosed against debts with a period exceeding 4 years.
– A provision for lawsuits raised against the Bank is taken. This provision is based on a legal study prepared by the Bank’s legal advisors. Moreover, the study highlights potential risks that the Bank may encounter in the future. Such legal assessments are reviewed periodically.

58 59
– A provision for income tax is taken on the current year’s profit and for accrued and estimated tax of the deducted provision for the prior year in case a final settlement with the Income Tax Department is reached for the prior year.
– Fair value hierarchyThe Bank is required to determine and disclose the level in the fair value hierarchy into which the fair value measurements are categorised in their entirety, segregating fair value measurements in accordance with the levels defined in the IFRS. Differentiating between Level 2 and Level 3 fair value measurements, i.e., assessing whether inputs are observable and whether the unobservable inputs are significant, may require judgement and a careful analysis of the inputs used to measure fair value, including consideration of factors specific to the asset or liability. When assessing the financial assets and liabilities’ fair value, the Bank uses market information when available. In case level 1 inputs are not present, the Bank will deal with independent, qualified parties to prepare evaluation studies. Proper evaluation methods and inputs used in preparing the evaluation are reviewed by the management.
4. Cash and Balances with Central Banks
This item consists of the following:
December 31
2016 2015
JD JD
Cash in vaults 61,925,791 60,743,739
Balances at Central Banks:
- Current accounts and demand deposits 64,139,425 43,126,936
- Term and notice deposits* 10,626,907 9,958,189
- Certificates of deposit - 33,700,000
- Statutory cash reserve 91,505,691 86,971,643
228,197,814 234,500,507
- Except for the statutory cash reserve, restricted balances amounted to JD 2,402,507 as of December 31, 2016 (JD 2,513,689 as of
December 31, 2015).
* This balance includes JD 8,224,400 maturing within a period exceeding three months (JD 7,444,500 as of December 31, 2015).
5. B
alan
ces
wit
h B
anks
and
Fin
anci
al In
stit
utio
ns
This
item
con
sist
s of
the
fol
low
ing:
Loca
l Ban
ks a
nd
Fina
ncia
l Ins
titut
ions
Fore
ign
Bank
s an
d F
inan
cial
Inst
itutio
nsTo
tal
Dec
embe
r 31
Dec
embe
r 31
Dec
embe
r 31
2016
2015
2016
2015
2016
2015
JDJD
JDJD
JDJD
Cur
rent
acc
ount
s an
d de
man
d de
posi
ts-
-38
,434
,350
54,1
71,8
7738
,434
,350
54,1
71,8
77
Dep
osits
mat
urin
g w
ithin
3 m
onth
s or
less
390,
387,
634
160,
141,
720
65,6
29,4
4167
,005
,161
456,
017,
075
227,
146,
881
390,
387,
634
160,
141,
720
104,
063,
791
121,
177,
038
494,
451,
425
281,
318,
758
- N
on-i
nter
est
bear
ing
bala
nces
at
bank
s an
d fin
anci
al in
stitu
tions
am
ount
ed t
o JD
34,
597,
230
as o
f D
ecem
ber
31, 2
016
(JD
49,
667,
196
as o
f D
ecem
ber
31, 2
015)
.
- R
estr
icte
d ba
lanc
es a
t ba
nks
and
finan
cial
inst
itutio
ns a
mou
nted
to
2,25
3,20
2 JD
as
of D
ecem
ber
31, 2
016
(JD
2,1
75,2
12 a
s of
Dec
embe
r 31
, 201
5).
6. D
epos
its
wit
h B
anks
and
Fin
anci
al In
stit
utio
ns
This
item
con
sist
s of
the
fol
low
ing:
Loca
l Ban
ks a
nd
Fina
ncia
l Ins
titut
ions
Fore
ign
Bank
s an
d F
inan
cial
Inst
itutio
nsTo
tal
Dec
embe
r 31
Dec
embe
r 31
Dec
embe
r 31
2016
2015
2016
2015
2016
2015
JDJD
JDJD
JDJD
Dep
osits
mat
urin
g w
ithin
3 t
o 6
mon
ths
10,0
00,0
0010
,000
,000
--
10,0
00,0
0010
,000
,000
Dep
osits
mat
urin
g w
ithin
6 t
o 9
mon
ths
-90
,000
,000
--
90,0
00,0
00
Dep
osits
mat
urin
g w
ithin
9 m
onth
s to
a y
ear
15,0
00,0
0055
,000
,000
--
15,0
00,0
0055
,000
,000
25,0
00,0
0015
5,00
0,00
0-
-25
,000
,000
155,
000,
000
- Th
ere
are
no r
estr
icte
d de
posi
ts a
s of
Dec
embe
r 31
, 201
6 an
d 20
15.

60 61
7. Financial Assets at Fair Value through Profit or Loss
This item consists of the following:December 31
2016 2015
JD JD
Shares listed in local active markets 122,600 173,300
Shares unlisted in local active markets 83,119 68,770
Shares listed in foreign active markets - 853,758
205,719 1,095,828
8. Financial Assets at Fair Value through Comprehensive Income
This item consists of the following:December 31,
2016 2015
JD JD
Shares listed in local active markets 79,021,668 47,209,483
Shares unlisted in local active markets* 7,146,541 7,324,125
Shares listed in foreign active markets 4,252,624 6,407,983
Shares unlisted in foreign active markets* 1,707,505 1,713,808
92,128,338 62,655,399
- Total cash dividends from financial assets at fair value through comprehensive income amounted to JD 2,815,647 for the year ended
December 31, 2016 (JD 3,107,684 for the year ended December 31, 2015).
*The fair value for unlisted investments had been calculated in accordence to Bank’s share of the net assets of these investments based
on the lastest audited financial statements for the company in which the Bank invested.
9. Direct Credit Facilities - Net
This item consists of the following:December 31,
2016 2015
JD JD
Individual (Retail Customers): 328,815,801 276,767,171
Overdraft accounts 10,453,963 10,941,372
Loans and discounted bills* 305,735,908 254,102,985
Credit cards 12,625,930 11,722,814
Real estate loans 224,886,600 208,815,795
Corporate: 604,772,198 586,872,921
Large corporate customers 456,804,426 460,396,554
Overdraft accounts 128,944,650 62,930,449
Loans and discounted bills* 327,859,776 397,466,105
SMEs 147,967,772 126,476,367
Overdraft accounts 39,217,032 36,179,899
Loans and discounted bills* 108,750,740 90,296,468
Government and public sector 139,357,534 149,510,740
Total 1,297,832,133 1,221,966,627
Less: Provision for impairment in direct credit facilities (64,840,522) (70,706,100)
Less: Interest in suspense (6,978,578) (9,023,281)
Net Direct Credit Facilities 1,226,013,033 1,142,237,246
* Net of interest and commission received in advance amounting to JD 12,623,079 as of December 31, 2016 (JD 10,118,604 as of December 31, 2015).
- Non-performing credit facilities amounted to JD 66,206,464 representing (5.1%) of the direct credit facilities balance for the year (JD 81,073,382
representing (6.63%) for the prior year).
- Non-performing credit facilities after deducting the suspended interest amounted to JD 59,227,886 representing (4.59%) of direct credit facilities
after deducting the suspended interest for the year (JD 72,050,101 representing (5.94%) for the prior year).
- Credit facilities granted to and guaranteed by the Jordanian Government amounted to JD 87,000,117 representing (6.7%) of total direct credit
facilities for the year (JD 84,054,200 representing (6.88%) for prior year). Moreover, credit facilities granted to the public sector in Palestine
amounted to JD 52,357,417 for the year (JD 65,456,540 for the prior year).

62 63
Prov
isio
n fo
r im
pair
men
t in
dir
ect
cred
it f
acili
ties
:
The
follo
win
g is
the
mov
emen
t on
the
pro
visi
on f
or im
pairm
ent
in d
irect
cre
dit
faci
litie
s:In
divi
dual
(R
etai
l C
usto
mer
s)R
eal E
stat
e Lo
ans
Cor
pora
te E
ntiti
es
Publ
ic S
ecto
rTo
tal
Larg
e C
orpo
rate
C
usto
mer
sSM
Es
2016
JDJD
JDJD
JDJD
Bala
nce
– Be
ginn
ing
of t
he Y
ear
17,4
72,3
182,
283,
060
45,9
44,6
045,
006,
118
-70
,706
,100
Fore
ign
curr
ency
diff
eren
ces
(122
,648
)(1
,196
)(2
,890
,903
)(7
4,95
0)-
(3,0
89,6
97)
Prov
isio
n fo
r th
e ye
ar t
aken
fro
m r
even
ues
1,60
3,67
550
3,37
91,
377,
908
2,20
4,37
2-
5,68
9,33
4
Prov
isio
ns t
rans
ferr
ed t
o of
f-st
atem
ent
of fi
nanc
ial p
ositi
on a
ccou
nts
--
(8,4
65,2
15)
--
(8,4
65,2
15)
Bal
ance
– E
nd o
f th
e Y
ear
18,9
53,3
452,
785,
243
35,9
66,3
947,
135,
540
-64
,840
,522
Indi
vidu
al (R
etai
l C
usto
mer
s)R
eal E
stat
e Lo
ans
Cor
pora
te E
ntiti
es
Publ
ic S
ecto
rTo
tal
Larg
e C
orpo
rate
C
usto
mer
sSM
Es
2015
JDJD
JDJD
JDJD
Bala
nce
– Be
ginn
ing
of t
he Y
ear
17,3
28,6
093,
465,
954
45,1
30,2
5819
,189
,212
-85
,114
,033
Fore
ign
curr
ency
diff
eren
ces
(411
,477
)(5
2,75
8)6,
971,
806
(12,
596,
534)
-(6
,088
,963
)
Prov
isio
n fo
r th
e ye
ar t
aken
fro
m r
even
ues
3,06
1,19
8(1
,130
,136
)2,
305,
307
(165
,179
)-
4,07
1,19
0
Prov
isio
ns t
rans
ferr
ed t
o of
f-st
atem
ent
of fi
nanc
ial p
ositi
on a
ccou
nts
(2,5
06,0
12)
-(8
,462
,767
)(1
,421
,381
)-
(12,
390,
160)
Bal
ance
– E
nd o
f th
e Y
ear
17,4
72,3
182,
283,
060
45,9
44,6
045,
006,
118
-70
,706
,100
The
amou
nt o
f ca
lcul
ated
pro
visi
ons
on a
sin
gle
clie
nt b
asis
and
on
a po
rtfo
lio b
asis
and
not
rep
orte
d ye
t is
as
follo
ws:
Indi
vidu
al (
Ret
ail
Cus
tom
ers)
Rea
l Est
ate
Loan
s
Cor
pora
te E
ntiti
es
Publ
ic S
ecto
rTo
tal
Larg
e C
orpo
rate
C
usto
mer
sSM
Es
2016
JDJD
JDJD
JDJD
On
a si
ngle
clie
nt b
asis
18,6
53,9
062,
713,
020
35,2
61,3
917,
002,
432
-63
,630
,749
On
a po
rtfo
lio b
asis
299,
439
72,2
2370
5,00
313
3,10
8-
1,20
9,77
3
Bal
ance
– E
nd o
f th
e ye
ar18
,953
,345
2,78
5,24
335
,966
,394
7,13
5,54
0-
64,8
40,5
22
Indi
vidu
al (
Ret
ail
Cus
tom
ers)
Rea
l Est
ate
Loan
s
Cor
pora
te E
ntiti
es
Publ
ic S
ecto
rTo
tal
Larg
e C
orpo
rate
C
usto
mer
sSM
Es
2015
JDJD
JDJD
JDJD
On
a si
ngle
clie
nt b
asis
17,2
54,7
392,
283,
060
45,8
00,6
174,
921,
414
-70
,259
,830
On
a po
rtfo
lio b
asis
217,
579
-14
3,98
784
,704
-44
6,27
0
Bal
ance
– E
nd o
f th
e Y
ear
17,4
72,3
182,
283,
060
45,9
44,6
045,
006,
118
-70
,706
,100
- Th
e pr
ovis
ions
no
long
er n
eede
d du
e to
set
tlem
ents
or
repa
ymen
ts a
nd t
rans
ferr
ed a
gain
st o
ther
deb
ts a
mou
nted
to
JD 6
,714
,569
as
of D
ecem
ber
31, 2
016
(JD
11,
006,
261
as o
f D
ecem
ber
31, 2
015)
.
-The
re a
re d
irect
cre
dit
faci
litie
s w
ith a
bal
ance
of
JD
9,9
20,1
48, a
sus
pend
ed in
tere
st o
f JD
1,4
54,9
33 a
nd a
pro
visi
on o
f JD
8,4
65,2
15 a
s of
Dec
embe
r 31
, 201
6 w
hich
hav
e be
en t
rans
ferr
ed t
o of
f-st
atem
ent
of
finan
cial
pos
ition
acc
ount
s as
per
the
Boa
rd o
f D
irect
ors
deci
sion
s, a
s th
ese
cred
it fa
cilit
ies
are
fully
pro
vide
d fo
r as
of
the
date
of
the
cons
olid
ated
fina
ncia
l sta
tem
ents
.(A
gain
st d
irect
cre
dit
faci
litie
s w
ith a
bal
ance
of J
D13
,673
,729
, a s
uspe
nded
inte
rest
of
JD 1
,283
,569
, and
a p
rovi
sion
of
JD 1
2,39
0,16
0 as
of
Dec
embe
r 31
, 201
5)

64 65
Inte
rest
in S
uspe
nse:
The
follo
win
g is
the
mov
emen
t on
the
inte
rest
in s
uspe
nse:
Indi
vidu
al (
reta
il cu
stom
ers)
Rea
l Est
ate
Loan
s
Cor
pora
te E
ntiti
es
Tota
lLa
rge
corp
orat
e cu
stom
ers
SMEs
2016
JDJD
JDJD
JD
Bala
nce
– Be
ginn
ing
of t
he Y
ear
2,52
8,25
459
0,37
54,
459,
612
1,44
5,04
09,
023,
281
Add
: Int
eres
t su
spen
ded
durin
g th
e ye
ar22
8,27
315
5,68
0(1
75,3
46)
838,
189
1,04
6,79
6
Less
: Int
eres
t in
sus
pens
e re
vers
ed t
o in
com
e(2
30,2
99)
(221
,461
)(5
25,0
86)
(659
,720
)(1
,636
,566
)
Susp
ende
d in
tere
st t
rans
ferr
ed t
o of
f-st
atem
ent
of fi
nanc
ial p
ositi
on a
ccou
nts
--
(1,4
54,9
33)
-(1
,454
,933
)
Bal
ance
– E
nd o
f th
e Y
ear
2,52
6,22
852
4,59
42,
304,
247
1,62
3,50
96,
978,
578
Indi
vidu
al (
Ret
ail
Cus
tom
ers)
Rea
l Est
ate
Loan
s
Cor
pora
te E
ntiti
es
Tota
lLa
rge
Cor
pora
te
Cus
tom
ers
SMEs
2015
JDJD
JDJD
JD
Bala
nce
– Be
ginn
ing
of t
he Y
ear
2,79
2,64
776
2,95
05,
805,
793
1,76
2,91
711
,124
,307
Add
: Int
eres
t su
spen
ded
durin
g th
e ye
ar29
0,86
013
8,06
4(2
65,3
51)
378,
726
542,
299
Less
: Int
eres
t in
sus
pens
e re
vers
ed t
o in
com
e(2
11,9
13)
(310
,639
)(4
08,8
02)
(428
,402
)(1
,359
,756
)
Less
: Int
eres
t in
sus
pens
e w
ritte
n of
f du
ring
the
year
Su
spen
ded
inte
rest
tra
nsfe
rred
to
off-
stat
emen
t of
fina
ncia
l pos
ition
acc
ount
s(3
43,3
40)
-(6
72,0
28)
(268
,201
)(1
,283
,569
)
Bal
ance
– E
nd o
f th
e Y
ear
2,52
8,25
459
0,37
54,
459,
612
1,44
5,04
09,
023,
281
Dir
ect
cred
it f
acili
ties
are
dis
trib
uted
in a
ccor
danc
e w
ith
geog
raph
ical
di
stri
buti
on a
nd e
cono
mic
sec
tors
as
follo
win
g:
Tota
l
Dec
embe
r 31
,
Insi
de K
ingd
omO
utsi
de K
ingd
om
2016
2015
JDJD
JDJD
Fina
ncia
l 2,
851,
395
-2,
851,
395
2,70
7,34
1
Indu
stria
l10
5,48
5,11
833
,821
,838
139,
306,
956
189,
908,
858
Trad
ing
230,
408,
273
26,7
17,1
3425
7,12
5,40
727
1,77
6,25
5
Rea
l est
ate
181,
654,
124
1,00
7,17
618
2,66
1,30
014
1,95
1,53
2
Con
stru
ctio
ns
42,2
25,3
00-
42,2
25,3
0047
,451
,139
Agr
icul
ture
8,
080,
448
8,86
9,75
216
,950
,200
16,1
86,2
62
Tour
ism
, res
taur
ants
and
pub
lic f
acili
ties
88,8
26,4
404,
937,
397
93,7
63,8
3767
,392
,470
Shar
es11
,202
,167
-11
,202
,167
9,17
6,60
9
Indi
vidu
als
353,
999,
338
58,3
88,6
9941
2,38
8,03
732
5,90
5,42
1
Gov
ernm
ent
and
publ
ic s
ecto
r 87
,000
,117
52,3
57,4
1713
9,35
7,53
414
9,51
0,74
0
Tota
l1,
111,
732,
720
186,
099,
413
1,29
7,83
2,13
31,
221,
966,
627

66 67
10. Financial Assets at Amortized Cost
This item consists of the following:December 31
2016 2015
Financial assets with market prices: JD JD
Governmental bonds or guaranteed by the government 112,596,012 202,032,574
Bonds and debentures of companies 60,041,668 25,623,133
Total financial assets with market prices 172,637,680 227,655,707
Financial assets without market prices:
Treasury bills or guaranteed by the government - -
Total financial assets without market prices - -
Financial assets at amortized cost – Net 172,637,680 227,655,707
Analysis of bonds and bills:
December 31
2016 2015
JD JD
Financial assets with fixed-rate-of-return 160,343,376 227,655,707
Financial assets with variable-rate-of-return 12,294,304 -
172,637,680 227,655,707
The maturities of these assets are as follows:
Up to 1
Month
More Than 1
Month
Up to 3
Months
More Than 3
Months
Up to 6
Months
More Than 6
Months
Up to 1 Year
More Than 1
Year
Up to 3 Years
More Than 3
Years Total
JD JD JD JD JD JD JD
December 31, 2016 5,173,074 4,193,787 1,422,450 14,424,134 71,633,705 75,790,530 172,637,680
December 31, 2015 - 32,930,822 9,998,971 78,688,145 63,049,691 42,988,078 227,655,707
The proceeds of the financial assets at amortized cost are to be paid in semi-annual instalments.
11. Investments in Associates
The summarized movement on the Bank’s investment inassociates is as follows:
2016 2015
JD JD
Balance – Beginning of the Year 1 1
Balance – End of the Year * 1 1
* The Bank’s share in National Industries Company is one Jordanian Dinar only, since the Company is under liquidation and a full provision has been booked against the value of the Bank’s investment in prior years for this Company. Th
e de
tails
of
inve
stm
ents
in a
ssoc
iate
s ar
e as
fol
low
s:
Dec
embe
r 31
, 201
6
Cos
t
Perc
enta
ge o
fO
wne
rshi
pBo
ok V
alue
-Be
ginn
ing
of t
he Y
ear
Add
ition
s(D
ispo
sals
)V
alue
Acc
ordi
ng t
o Eq
uity
Met
hod
Bank
’s S
hare
Indu
stry
Typ
e
Com
pany
’s N
ame
%JD
JDJD
JD
Jord
ania
n co
mpa
nies
:
Nat
iona
l Ind
ustr
ies
Co.
46
.74
1-
1-
Indu
stria
l
(und
er li
quid
atio
n)
1-
1-
Dec
embe
r 31
, 201
5
Cos
t
Perc
enta
ge o
fO
wne
rshi
pBo
ok V
alue
-
Begi
nnin
g of
the
Yea
rA
dditi
ons
(Dis
posa
ls)
Rev
alua
tion
Usi
ng t
he
Equi
ty M
etho
dBa
nk’s
Sha
re o
f (L
osse
s)In
dust
ry T
ype
Com
pany
’s N
ame
%JD
JDJD
JD
Jord
ania
n co
mpa
nies
:
Nat
iona
l Ind
ustr
ies
Co.
46
.74
1-
1-
Indu
stria
l
(und
er li
quid
atio
n)
1-
1-
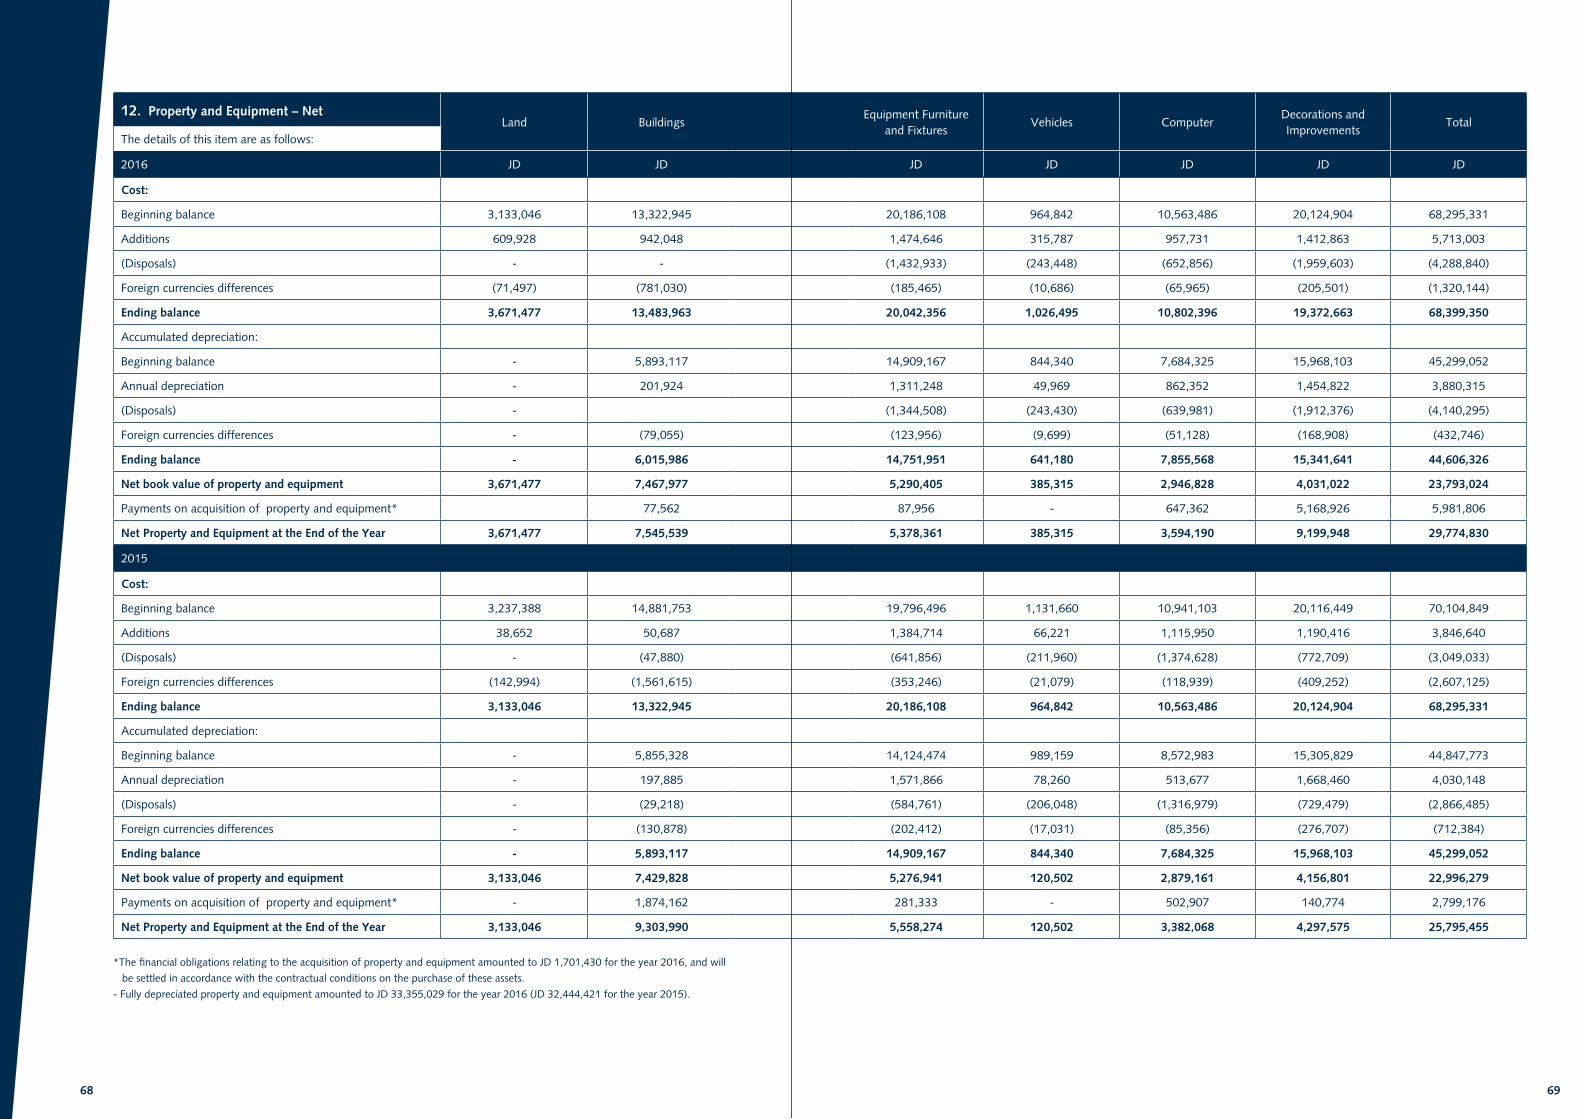
68 69
12. Property and Equipment – NetLand Buildings
Equipment Furniture and Fixtures
Vehicles Computer Decorations and Improvements
TotalThe details of this item are as follows:
2016 JD JD JD JD JD JD JD
Cost:
Beginning balance 3,133,046 13,322,945 20,186,108 964,842 10,563,486 20,124,904 68,295,331
Additions 609,928 942,048 1,474,646 315,787 957,731 1,412,863 5,713,003
(Disposals) - - (1,432,933) (243,448) (652,856) (1,959,603) (4,288,840)
Foreign currencies differences (71,497) (781,030) (185,465) (10,686) (65,965) (205,501) (1,320,144)
Ending balance 3,671,477 13,483,963 20,042,356 1,026,495 10,802,396 19,372,663 68,399,350
Accumulated depreciation:
Beginning balance - 5,893,117 14,909,167 844,340 7,684,325 15,968,103 45,299,052
Annual depreciation - 201,924 1,311,248 49,969 862,352 1,454,822 3,880,315
(Disposals) - (1,344,508) (243,430) (639,981) (1,912,376) (4,140,295)
Foreign currencies differences - (79,055) (123,956) (9,699) (51,128) (168,908) (432,746)
Ending balance - 6,015,986 14,751,951 641,180 7,855,568 15,341,641 44,606,326
Net book value of property and equipment 3,671,477 7,467,977 5,290,405 385,315 2,946,828 4,031,022 23,793,024
Payments on acquisition of property and equipment* 77,562 87,956 - 647,362 5,168,926 5,981,806
Net Property and Equipment at the End of the Year 3,671,477 7,545,539 5,378,361 385,315 3,594,190 9,199,948 29,774,830
2015
Cost:
Beginning balance 3,237,388 14,881,753 19,796,496 1,131,660 10,941,103 20,116,449 70,104,849
Additions 38,652 50,687 1,384,714 66,221 1,115,950 1,190,416 3,846,640
(Disposals) - (47,880) (641,856) (211,960) (1,374,628) (772,709) (3,049,033)
Foreign currencies differences (142,994) (1,561,615) (353,246) (21,079) (118,939) (409,252) (2,607,125)
Ending balance 3,133,046 13,322,945 20,186,108 964,842 10,563,486 20,124,904 68,295,331
Accumulated depreciation:
Beginning balance - 5,855,328 14,124,474 989,159 8,572,983 15,305,829 44,847,773
Annual depreciation - 197,885 1,571,866 78,260 513,677 1,668,460 4,030,148
(Disposals) - (29,218) (584,761) (206,048) (1,316,979) (729,479) (2,866,485)
Foreign currencies differences - (130,878) (202,412) (17,031) (85,356) (276,707) (712,384)
Ending balance - 5,893,117 14,909,167 844,340 7,684,325 15,968,103 45,299,052
Net book value of property and equipment 3,133,046 7,429,828 5,276,941 120,502 2,879,161 4,156,801 22,996,279
Payments on acquisition of property and equipment* - 1,874,162 281,333 - 502,907 140,774 2,799,176
Net Property and Equipment at the End of the Year 3,133,046 9,303,990 5,558,274 120,502 3,382,068 4,297,575 25,795,455
*The financial obligations relating to the acquisition of property and equipment amounted to JD 1,701,430 for the year 2016, and will
be settled in accordance with the contractual conditions on the purchase of these assets.
- Fully depreciated property and equipment amounted to JD 33,355,029 for the year 2016 (JD 32,444,421 for the year 2015).

70 71
13. Intangible Assets – Net
This item consists of softwares which are amortized at an annual rate ranging from 15% to 20%, the details are as follows:
For the year ended December 31,
2016 2015
JD JD
Balance – Beginning of the year 3,320,303 3,371,359
Additions during the year 960,792 609,886
Amortization for the year (711,560) (644,680)
Foreign currencies differences (10,389) (16,262)
Balance – End of the Year 3,559,146 3,320,303
14. Other Assets
This item consists of the following:
December 31,
2016 2015
JD JD
Accrued interest income 4,810,872 6,638,640
Prepaid expenses 2,587,778 2,107,795
Assets foreclosed by the Bank in repayment of debts* 34,705,556 37,373,852
Clearance cheques 1,634,270 2,434,194
Advanced payments on the acquisition of lands & real estate 912,359 1,015,307
Prepaid tax expenses 1,970,506 1,473,124
Accounts receivables and other debit balances 8,302,713 8,448,822
Transactions in transit 20,554 67,255
54,944,608 59,558,989
* The following is the movement on the assets foreclosed by the Bank in repayment of debts:
Foreclosed Assets
2016 2015
JD JD
Balance – Beginning of the Year 41,642,564 42,714,825
Additions 2,430,218 2,379,766
Disposals (2,561,483) (3,452,027)
End of the year balance 41,511,299 41,642,564
Impairment provision of assets foreclosed by the Bank** (6,805,743) (4,268,712)
Balance – End of the Year 34,705,556 37,373,852
- According to the Jordanian Banks’ Law, buildings and plots of land foreclosed by the Bank against debts due from customers should be
sold within two years from the foreclosure date. However, the Central Bank of Jordan may extend this period for a maximum of two
more years in exceptional cases. In accordance with the dissemination of the Central Bank No. 10/1/4076 dated on March 27, 2014 the
Bank has started to calculate a gradual provision against the assets foreclosed against debts with periods exceeding 4 years.
** The following is the movement on the impairment provision of assets foreclosed by the Bank which include assets impairment provision and the foreclosed assets provision that is calculated in accordance with Central Bank of Jordan dissemination 10/1/4076 :
2016 2015
JD JD
Balance – Beginning of the Year 4,268,712 327,655
Additions 2,537,923 3,941,057
Disposals (892) -
Balance – End of the Year 6,805,743 4,268,712
15. Banks and Financial Institutions’ Deposits
This item consists of the following:
December 31,
2016 2015
Inside the Kingdom of
Jordan
Outside the Kingdom of
JordanTotal
Inside the Kingdom of
Jordan
Outside the Kingdom of
JordanTotal
JD JD JD JD JD JD
Current accounts and demand deposits - 43,248,408 43,248,408 - 14,763,256 14,763,256
Time Deposits 47,500,000 54,875,050 102,375,050 - 108,825,774 108,825,774
47,500,000 98,123,458 145,623,458 - 123,589,030 123,589,030
There are no deposits maturing within 3 months as of December 31, 2016 (against 3,159,000 as of December 31, 2015 maturing within more than
3 months and less than 6 months).
16. Customers’ Deposits
This item consists of the following:
December 31, 2016
IndividualsLarge
CorporatesSMEs
Government and Public
Sector Total
JD JD JD JD JD
Current accounts and demand deposits 355,601,307 84,696,037 83,093,736 11,818,041 535,209,121
Saving accounts 661,287,174 1,384,695 13,092,843 78,767 675,843,479
Time and notice deposits 202,401,692 85,959,821 25,621,116 9,860,366 323,842,995
Certificates of deposit 65,897,325 570,890 5,615,320 - 72,083,535
Total 1,285,187,498 172,611,443 127,423,015 21,757,174 1,606,979,130
December 31, 2015
IndividualsLarge
CorporatesSMEs
Government and Public
Sector Total
JD JD JD JD JD
Current accounts and demand deposits 328,240,342 55,898,871 82,188,847 22,522,530 488,850,590
Saving accounts 650,414,852 1,342,623 15,734,630 60,065 667,552,170
Time and notice deposits 235,603,488 50,752,929 24,982,634 45,204,607 356,543,658
Certificates of deposit 49,509,355 40,000 2,391,190 - 51,940,545
Total 1,263,768,037 108,034,423 125,297,301 67,787,202 1,564,886,963
- Deposits of the Jordanian Government and the public sector inside Jordan amounted to JD 16,118,947 equivalent to (1%) of total customers’
deposits for the year (JD 58,092,471 equivalent to (3.71%) for the prior year).
- Non-interest bearing deposits amounted to JD 901,249,775 equivalent to (56.08%) of total customers’ deposits for the year (JD 864,982,291
equivalent to (55.27%) of total deposits for the prior year).
- Restricted deposits amounted to JD 20,715,053 equivalent to (1.29%) of total customers’ deposits for the year (JD 13,059,220 equivalent to
(0.83%) of total deposits for the prior year).
- Dormant deposits amounted to JD 82,178,656 for the year (JD 82,805,617 for the prior year).

72 73
17. Cash Margins
The details of this item are as follows:
December 31,
2016 2015
JD JD
Cash margins on direct credit facilities 111,304,651 90,930,302
Cash margins on indirect credit facilities 17,987,451 20,240,850
Total 129,292,102 111,171,152
18. Sundry Provisions
Ending Balance
Foreign Currencies Differences
Provision Used During the
Year
Provision Created During the Year
Beginning Balance
The details of this item are as follows:
JDJDJDJDJD2016
4,186,235-(1,504,804)353,1665,337,873Provision for end-of-service indemnity
626,714-(15,715)41,628600,801Provision for lawsuits raised against the Bank
203,043(100,335)(4,609)20,496287,491Other provisions
5,015,992(100,335)(1,525,128)415,2906,226,165
JDJDJDJDJD2015
5,337,873-(3,604,397)776,7158,165,555Provision for end-of-service indemnity
600,801-(23,234)277,111346,924Provision for lawsuits raised against the Bank
287,491(70,325)-77,352280,464Other provisions
6,226,165(70,325)(3,627,631)1,131,1788,792,943
19. Income Tax
a. Income tax provisionThe movement on the income tax provision is as follows:
2016 2015
JD JD
Balance – Beginning of the Year 13,197,654 15,998,305
Income tax paid (16,811,866) (19,562,896)
Accrued Income tax 20,486,918 16,762,245
Balance – End of the Year 16,872,706 13,197,654
Income tax in the consolidated statement of income represents the following:
2016 2015
JD JD
Income tax on current year’s profit 20,486,918 16,762,245
Deferred tax assets for the year-addition (1,517,791) (1,587,473)
Amortization of deferred tax assets 1,144,257 6,728,613
20,113,384 21,903,385
- Legal income tax rate in Jordan amounts to 35% starting from the beginning of the year 2015, whereas the legal income tax rate in Palestine where
the Bank has investments and branches amounts to 15%, in Syria (a subsidiary) to 25% and 24% for the subsidiary companies in Jordan.
A final settlement was reached with the Income and Sales Tax Department in Jordan up to the end of the year 2013. Moreover the Bank submitted
its tax returns for the years 2011, 2014 and 2015 and has paid the required amounts according to the law. However, no final settlement has been
reached with the Income and Sales Tax Department for these years yet. The Income and Sales Tax Department claims the Bank with tax differences
against the year 2011 amounting to JD 1,750,030. The Bank has objected this assessment and raised a lawsuit against Income and Sales Tax
Department in this regards which is still at the court of first instance. Furthermore, the Income and Sales Tax Department also requested for the Bank
with tax differences against the year 2014 and it’s still in the objection period at which the Bank intends to object the assessment made by the Income
and Sales Tax Department. In the opinion of the management and its legal and tax consultant, the Bank will not entail any obligations in excess of
the provision booked in the consolidated financial statements.
- The Bank has reached a final settlement up to the end of the year 2015 with the Income Tax and Value added Tax Department on the Bank’s operations
in Palestine. Moreover, the Bank has allocated an amount of JD 1,130,000 to meet the Tax obligations on the Bank’s results for the year 2015
(JD 495,000 against income tax and JD 635,000 against value added tax). In the opinion of the Bank’s management and its tax consultant the
allocated provisions are sufficient to meet the tax obligations for the year 2016.
- A final settlement was reached with the Income and Sales Tax Department up to the end of the year 2014 regarding Excel for Financial Investments
Company (subsidiary). Furthermore, the Company has submitted its tax returns for the year 2015. However, no final settlement has been reviewed
by the Income and Sales Tax Department yet. In the opinion of the Company’s management and its tax consultant, the allocated provisions in the
financial statements are sufficient to meet any tax obligations.
- Jordan Leasing Company (subsidiary) has reached a final settlement with the Income and Sales Tax Department up to the year 2013. Moreover,
the Company has submitted its tax returns for the years 2014 and 2015 and paid the declared taxes, however, it has not been reviewed by the
Income and Sales Tax Department yet. In the opinion of the Company’s management and its tax consultant, the allocated provisions in the financial
statements are sufficient to meet any tax obligations

74 75
b. D
efer
red
Tax
Ass
ets
2016
2015
The
deta
ils o
f th
is it
em a
re a
s fo
llow
s:Ba
lanc
e -
Begi
nnin
g of
the
Yea
rA
mou
nts
Rel
ease
dA
mou
nts
Add
edBa
lanc
e -
End
ofth
e Y
ear
Def
erre
d Ta
xBa
lanc
e -
Def
erre
dTa
x
Acc
ount
s In
clud
ed D
efer
red
Tax
Ass
ets:
JDJD
JDJD
JDJD
Prov
isio
ns f
or n
on-p
erfo
rmin
g de
bts
16,4
03,0
56-
1,37
5,99
517
,779
,051
6,22
2,66
85,
741,
070
Prov
isio
n fo
r no
n-pe
rfor
min
g de
bts
- Pr
ior
year
s3,
781,
736
27,5
01-
3,75
4,23
51,
082,
233
1,09
0,15
1
Prov
isio
n fo
r st
aff
end-
of-s
ervi
ce in
dem
nity
5,33
7,87
31,
622,
963
471,
325
4,18
6,23
51,
243,
573
1,66
3,19
1
Inte
rest
in s
uspe
nse
998,
113
--
998,
113
261,
797
263,
258
Prov
isio
n fo
r la
wsu
its r
aise
d ag
ains
t th
e Ba
nk60
0,80
115
,715
41,6
2862
6,71
420
8,61
220
1,90
0
Impa
irmen
t in
ass
ets
fore
clos
ed b
y th
e Ba
nk4,
268,
712
892
2,53
7,92
36,
805,
743
2,21
9,55
81,
331,
622
Impa
irmen
t in
ass
ets
avai
labl
e fo
r sa
le62
,831
--
62,8
3121
,991
21,9
91
Oth
er p
rovi
sion
s7,
617,
560
4,95
3,40
8-
2,66
4,15
266
6,03
81,
904,
390
39,0
70,6
826,
620,
479
4,42
6,87
136
,877
,074
11,9
26,4
7012
,217
,573
- Th
e m
ovem
ent
on d
efer
red
tax
asse
ts is
as
follo
ws:
2016
2015
JDJD
Bala
nce
– Be
ginn
ing
of t
he Y
ear
12,2
17,5
7319
,984
,865
Adj
ustm
ents
-
(1,2
52,4
83)
Adj
uste
d ba
lanc
e –
Beg
inni
ng o
f th
e Y
ear
12,2
17,5
7318
,732
,382
The
effe
ct o
f th
e am
endm
ents
of
Inco
me
Tax
Law
on
Pale
stin
e an
d Jo
rdan
*-
(414
,598
)
Add
ed d
urin
g th
e ye
ar1,
517,
791
1,58
7,47
3
Am
ortiz
ed d
urin
g th
e ye
ar(1
,144
,257
)(6
,314
,015
)
Fore
ign
curr
enci
es d
iffer
ence
s(6
64,6
37)
(1,3
73,6
69)
Bal
ance
– E
nd o
f th
e Y
ear
11,9
26,4
7012
,217
,573
* Th
e ac
crue
d ta
x ra
tio u
sed
in d
efer
red
tax
calc
ulat
ion
is t
he e
ffec
tive
ratio
in t
hese
cou
ntrie
s.
c. The following is a summary of the reconciliation between accounting profit and taxable profit:
2016 2015
JD JD
Accounting profit 62,315,408 61,966,178
Tax-exempt profit (5,979,800) (23,222,541)
Tax-unacceptable expenses 7,493,529 7,976,757
Taxable profit 63,829,137 46,720,394
Income tax rate 32.1% 35.9%
20,486,918 16,762,245
20. Borrowed Money
The details of this item are as follows:
Number of Instalments
Amount In totalThe
Remaining
Periodic Instalments
MaturityCollaterals
Price of Borrowing
Interest
2016 JD JD
Borrowing from the Central Bank of Jordan
424,879 48 60 Monthly Treasury bonds
2.25%
Total 424,879
2015 JD JD
Borrowing from theCentral Bank of Jordan
500,956 60 60 Monthly Treasury bonds
2.25%
Total 500,956
- The above amount has been re-borrowed to one of the Bank’s customers listed under small and medium entities with an interest rate of 5.25%.
- This balance is borrowed with fixed interest rate, and there are no borrowing in variable rates or with no interest rate as of December 31, 2016.
21. Other Liabilities
The details of this item are as follows:
December 31,
2016 2015
JD JD
Accrued interest payable 2,748,843 3,449,363
Accepted cheques 7,261,564 7,346,676
Temporary deposits 2,452,353 2,114,422
Dividends payable 1,880,403 1,807,742
Deposits on safe boxes 169,226 166,306
Sold real estate margins 291,472 96,850
Other liabilities* 7,373,047 4,723,640
22,176,908 19,704,999

76 77
*The details of other liabilities are as follows: December 31
2016 2015
JD JD
Social security deposits 264,323 240,624
Income tax deposits 283,396 207,090
Accrued expenses 3,459,949 2,628,509
Incoming transfers 231,740 197,322
Board of Directors’ remuneration 55,000 55,000
Other credit balances 3,078,639 1,395,095
7,373,047 4,723,640
22. Paid–up Capital- The authorized capital of the Bank is JD 200,000,000 as of December 31, 2016 (JD 155,100,000 as of December 31, 2015)
- The authorized capital of the Bank is JD 200,000,000 by year end, divided into 200,000,000 shares at a par value of JD 1 each.
23. Reserves - Statutory Reserve The amount accumulated in this account is transferred from the annual net income before tax at 10% during the year and previous years according to the Banks Law and Companies Law. This reserve cannot be distributed to shareholders.
- Voluntary Reserve The amounts accumulated in this account are transferred from the annual net income before taxes at 10% during the previous years. This reserve will be used for the purposes approved by the Board of Directors. Moreover, the General Assembly of Shareholders has the right to capitalize or distribute the whole reserve or part thereof as dividends.
- General Banking Risks Reserve This item represents the general banking risks reserve in line with the instructions of the Central Bank of Jordan, and other regulatory bodies.
- Special Reserve This reserve represents the periodic fluctuation reserve calculated according to the instructions of the Palestinian Monetary Authority concerning The Bank’s branches operating in Palestine.
The restricted reserves are as follows:
Reserve Amount Nature of Restriction
JD
Legal reserve 73,917,046 Companies and Banks Laws
General banking risks reserve 12,996,161 Regulatory bodies requirements
Special reserve 3,330,908 Regulatory bodies requirements
24. Foreign Currencies Translation DifferencesThis item represents the differences resulting from the translation of net investment in foreign subsidiary (Bank of Jordan – Syria) upon consolidating the financial statements.
The movement on this item during the year is as follows: 2016 2015
JD JD
Balance – Beginning of the Year (11,481,891) (10,326,397)
Changes in the translation of net investment in the subsidiary companyduring the year*
(919,944) (1,155,494)
Balance – End of the Year (12,401,835) (11,481,891)
* This item includes the Bank’s net share of the structural position related to the investment in the capital of Bank of Jordan - Syria for the years 2016
and 2015.
25. Fair Value Reserve
The details of the fair value reserve are as follows:2016 2015
JD JD
Balance – Beginning of the Year 33,186,645 17,959,472
Unrealized gains 32,217,724 15,227,173
(Transferred) as a result for shares sale to retained earning recognized (1,838,781) -
Balance – End of the Year 63,565,588 33,186,645
26. Retained Earnings
The details of this item are as follows:2016 2015
JD JD
Balance – Beginning of the Year 88,442,614 82,070,084
Adjustments - (613,717)
Adjusted Balance – Beginning of the Year 88,442,614 81,456,367
Dividends distributed to shareholders (31,020,000) (31,020,000)
Profit for the year 41,396,285 40,835,470
Transferred to reserves (7,082,118) (6,084,754)
Transferred as a result for sale of financial assets through comprehensive income 1,346,863 -
The currencies translation differences 2,039,735 3,255,531
(Transferred) increase in paid-up capital – Note (1) (31,197,142) -
Balance – End of the Year* 63,926,237 88,442,614
* Retained earnings include an amount of JD 11,926,470 restricted against deferred tax benefits as of December 31, 2016 (JD 12,217,573 as of
December 31, 2015).
- Retained earnings include an amount of JD 5,060,455 as of December 31, 2016 which represents the effect of early adoption of IFRS (9). These
restricted amounts cannot be utilized unless realized as instructed by Jordan Securities Commission.
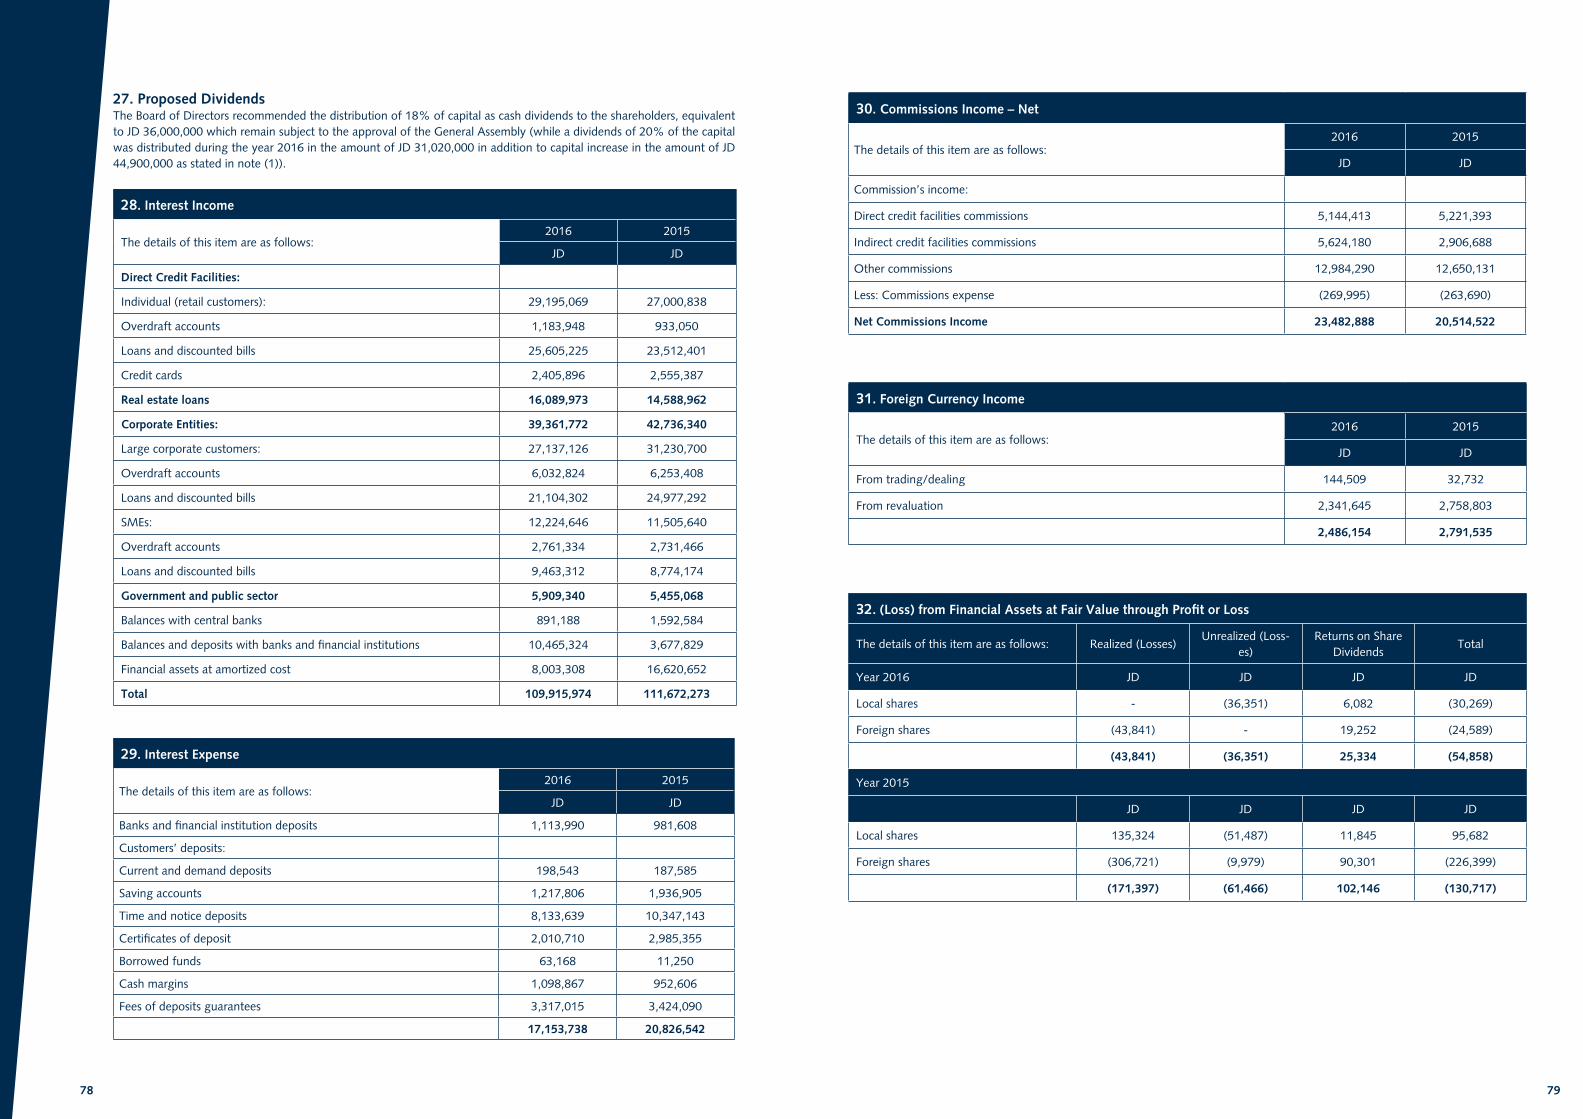
78 79
27. Proposed Dividends The Board of Directors recommended the distribution of 18% of capital as cash dividends to the shareholders, equivalent to JD 36,000,000 which remain subject to the approval of the General Assembly (while a dividends of 20% of the capital was distributed during the year 2016 in the amount of JD 31,020,000 in addition to capital increase in the amount of JD 44,900,000 as stated in note (1)).
28. Interest Income
20152016The details of this item are as follows:
JDJD
Direct Credit Facilities:
27,000,83829,195,069Individual (retail customers):
933,0501,183,948Overdraft accounts
23,512,40125,605,225Loans and discounted bills
2,555,3872,405,896Credit cards
14,588,96216,089,973Real estate loans
42,736,34039,361,772Corporate Entities:
31,230,70027,137,126Large corporate customers:
6,253,4086,032,824Overdraft accounts
24,977,29221,104,302Loans and discounted bills
11,505,64012,224,646SMEs:
2,731,4662,761,334Overdraft accounts
8,774,1749,463,312Loans and discounted bills
5,455,0685,909,340Government and public sector
1,592,584891,188Balances with central banks
3,677,82910,465,324Balances and deposits with banks and financial institutions
16,620,6528,003,308Financial assets at amortized cost
111,672,273109,915,974Total
29. Interest Expense
The details of this item are as follows:2016 2015
JD JD
Banks and financial institution deposits 1,113,990 981,608
Customers’ deposits:
Current and demand deposits 198,543 187,585
Saving accounts 1,217,806 1,936,905
Time and notice deposits 8,133,639 10,347,143
Certificates of deposit 2,010,710 2,985,355
Borrowed funds 63,168 11,250
Cash margins 1,098,867 952,606
Fees of deposits guarantees 3,317,015 3,424,090
17,153,738 20,826,542
30. Commissions Income – Net
The details of this item are as follows:2016 2015
JD JD
Commission’s income:
Direct credit facilities commissions 5,144,413 5,221,393
Indirect credit facilities commissions 5,624,180 2,906,688
Other commissions 12,984,290 12,650,131
Less: Commissions expense (269,995) (263,690)
Net Commissions Income 23,482,888 20,514,522
31. Foreign Currency Income
20152016The details of this item are as follows:
JDJD
32,732144,509From trading/dealing
2,758,8032,341,645From revaluation
2,791,5352,486,154
32. (Loss) from Financial Assets at Fair Value through Profit or Loss
The details of this item are as follows: Realized (Losses) Unrealized (Loss-
es)Returns on Share
DividendsTotal
Year 2016 JD JD JD JD
Local shares - (36,351) 6,082 (30,269)
Foreign shares (43,841) - 19,252 (24,589)
(43,841) (36,351) 25,334 (54,858)
Year 2015
JD JD JD JD
Local shares 135,324 (51,487) 11,845 95,682
Foreign shares (306,721) (9,979) 90,301 (226,399)
(171,397) (61,466) 102,146 (130,717)

80 81
33. Other Income
The details of this item are as follows:2016 2015
JD JD
Revenue from prior years returned to income 1,192,926 1,074,059
Gains from the sale of assets foreclosed by the Bank 645,607 1,628,485
Revenue from telephone, post, and swift 493,111 476,359
Real estate rent 354,793 170,896
Gain from the sale of property and equipment 64,547 16,988
Interest in suspense reversed to income 1,636,566 1,359,756
Gains from sale of financial assets foreclosed by the Bank - 1,861,500
Other income 1,569,405 1,503,734
5,956,955 8,091,777
34. Employees Expenses
The details of this item are as follows: 2016 2015
JD JD
Salaries, bonuses, and employees’ benefits 24,173,266 22,846,565
Bank’s contribution to social security 2,029,156 1,895,371
Bank’s contribution to provident fund 1,549,808 1,477,886
Medical expenses 1,460,682 1,360,857
Staff training expenses 281,195 295,605
Transportation and travel expenses 760,328 638,548
30,254,435 28,514,832
35. Other Expenses
The details of this item are as follows:2016 2015
JD JD
Rent 3,186,977 3,191,913
Printing and stationery 790,281 895,352
Telephone, post and swift 1,560,783 1,560,769
Maintenance, repairs, and cleaning 2,898,817 3,039,529
Fees, taxes, and licences 2,769,587 1,853,840
Advertisements and subscriptions 3,397,142 3,508,021
Insurance expenses 1,995,673 1,908,703
Electricity and heating 2,212,085 2,455,768
Donations 544,925 522,106
Hospitality 245,171 236,702
Professional, consultancy and legal fees 1,145,878 1,056,962
Board of Directors remunerations 55,000 55,000
Miscellaneous 843,330 636,604
21,645,649 20,921,269
36. Earnings per Share
The details of this item are as follows:2016 2015
JD JD
Profit for the year (Bank’s shareholders) 41,396,285 40,835,470
Weighted average number of shares* 200,000,000 200,000,000
Net income for the year/share (Bank’s shareholders):
Basic 0,207 0.204
Diluted 0,207 0.204
* The weighted average number of shares for the year ended December 31, 2015 has been adjusted to be JD 200 million instead of JD 155/1 million
as the increase in the shares was due to distributed bonus shares.
37. Cash and Cash Equivalents
The details of this item are as follows:
December 31,
2016 2015
JD JD
Cash and balances with central
banks maturing within 3 months 219,973,414 227,056,007
Add: Balances with banks and other financial institutions maturing within 3 months
494,451,425 281,318,758
Less: Banks and financial institutions’ deposits maturing within 3 months
(145,623,458) (120,430,030)
Restricted balances (4,655,709) (4,688,901)
564,145,672 383,255,834

82 83
38. F
inan
cial
Der
ivat
ives
Inst
rum
ents
This
det
ails
of
finan
cial
der
ivat
ives
as
of y
ear-
end
are
as
follo
ws:
Po
sitiv
eFa
ir V
alue
Neg
ativ
eFa
ir V
alue
Tota
lN
omin
alV
alue
Nom
inal
Val
ue M
atur
ities
Dur
ing
3 M
onth
sFr
om 3
To
12 M
onth
sTo
tal
2016
JDJD
JDJD
JDJD
Fore
ign
curr
enci
es f
orw
ard
cont
ract
s (p
urch
ase)
-23
61,
428,
188
1,42
8,18
8-
1,42
8,18
8
Fore
ign
curr
enci
es f
orw
ard
cont
ract
s (p
urch
ase)
-31
,193
1,18
7,13
21,
187,
132
-1,
187,
132
Fore
ign
curr
enci
es f
orw
ard
cont
ract
s (p
urch
ase)
13,7
74-
699,
274
699,
274
-69
9,27
4
Tota
l 13
,774
31,4
293,
314,
594
3,31
4,59
4-
3,31
4,59
4
2015
Fore
ign
curr
enci
es f
orw
ard
cont
ract
s (p
urch
ase)
866,
107
-2,
995,
051
2,99
5,05
1-
2,99
5,05
1
Tota
l 86
6,10
7-
2,99
5,05
12,
995,
051
-2,
995,
051
Nom
inal
val
ue in
dica
tes
the
valu
e of
tra
nsac
tions
at
year
-end
, and
doe
s no
t re
late
to
mar
ket
risk
or c
redi
t ris
k.
39. Related parties transaction
Within its normal activities, the Bank entered into transactions with its major shareholders, members of the Board of Directors, executive management and the associate company at the commercial rates of interest and commission. Moreover, all loans and advances with related parties are performing, and no provision for probable credit losses has been taken thereon.
The following are summaries of balances and transactions with related parties:
Consolidated Statement of
Financial Position Items:
Related Parties Total December 31,
Major
Shareholders
Board of
Directors
Members
Executives
Management
Staff
Provident
Fund
Other Parties2016 2015
JD JD JD JD JD JD JD
Credit facilities *9,491,296 4,016,723 1,225,623 - 32,419,714 47,153,356 31,564,028
Deposits 36,515,318 356,476 1,873,217 394,040 6,104,003 45,243,054 10,470,840
Cash margins 5,172,177 900 - - 517,628 5,690,705 595,907
Off-consolidated Statement of Financial Position Items:
Letters of guarantee - 4,687 4,277 - 2,597,391 2,606,355 338,557
Total
For the Year Ended
December 31,
2016 2015
Consolidated Statement
of Income Items:JD JD JD JD JD JD JD
Credit interest and
commission 44,119 1,493 258,064 22,938 1,193,831 1,520,445 1,704,764
Debit interest and
commission
41,38318 9,481 - 13,129 64,011 74,196
Interest rates: – Interest income prices in JD ranged between (6.15%) to (9.7%)– Interest income in foreign currency was 0%– Interest prices in JD ranged between (0.25%) to (3.9%)– Interest prices in JD foreign currency ranged between (0.2%) to (0.4%)
* This balance represents the partial financing made by the Bank to a company related to one of the Bank’s major shareholders for the sale of the portion of investments which exceeded the allowed limits per Article (38/A/1) of the Banks Law No. (28) for the Year 2000. These investments summarized by financial assets at fair value through comprehensive income represented by 984,835 shares in El-Eqbal Investment Company at its fair value as of the sale date which is equivalent to JD 13 per share, in addition to the sale of 1,940,000 shares of the Bank’s investment in North Industrial Company (a non traded associate company).
Salaries and Remunerations of Executive Management summary:
2016 2015
JD JD
Salaries and benefits 2,457,340 1,966,566
Transportation and board secretary 48,000 45,242
Total 2,505,340 2,011,808

84 85
40. Risk Management
First: Descriptive Disclosures:The Bank manages banking risks through identifying the risks that it might be exposed to and methods of challenging and mitigating them. This is achieved through implementing a group of restructuring projects using best standards and banking acts that aim at separating risk management activities from those related to development of business and operations (execution).
• In this context, the Bank has formed a Risk and compliance Management Committee, derived from the Board of Directors to ensure the presence of an effective internal monitoring function in accordance with the policies and scope of work set for it by the Board of Directors.
• Risk management assumes the responsibility of managing the various types of risks through:– Preparing policies and getting them approved by the Board of Directors.– Analysing the risk types (credit, market, or operations).– Developing measurement and control methodologies for each risk type.– Providing the Board of Directors and executive management with reports and information about quantitative and
qualitative measurements of the Bank risks.
• The Bank has contracted to purchase several systems to prepare the requirements needed for the purpose of Basel III calculation and Stress Testing as well as preparing an internal valuation for Capital adequacy ICAAP.
Credit RisksCredit risks arise from the probable inability and/or lack of desire of the borrower or third party to fulfil its obligations in a timely manner. These risks include on-consolidated financial statements items such as loans and bonds and off-consolidated financial statements items such as guarantees and/or documentary credits causing financial losses to the Bank.In this regard, the Bank reinforces institutional frameworks that govern the management of credit through the following:
1. Setting up independent specialized departments for the management of credit as follows:– Companies Credit Risk Department (for management of companies’ credit risks).– Small and Medium Size Enterprises (SMEs) Risk Management Department (for management of SMEs credit risks).– Individuals Credit Risk Department (for management of individuals’ credit portfolios risks).– Credit Portfolios Risk Management Department: the department focuses on maintaining the quality of credit granted
for the Bank’s clients (Corporate, SME & Individual). Studying the Key Risk Indicators (KRI) and Key Performance Indicators (KPI) through preparing studies and reports covering the performance of economic sectors and industries and compare it with the performance of the Bank’s credit portfolios and associated provisions. Utilizing the aforementioned reports to establish proper recommendations which in turn provide guidance for the business developments units to target promising economic sectors/industries or to avert expansion in the deteriorating ones. In addition to the above, the department of Credit Portfolios Risk Management conducts periodical studies and reports shed lights on the below aspects:
– The concentrations of credit portfolio on economic activity level.– The concentrations of credit portfolio on product level.– Reports cover the Bank’s default ratios and coverage ratios compared to the banking sector.– Credit portfolios performance reports, conducted on segment basis (Corporate, SME, Government and Individuals)
compared to the banking sector in terms of growth and profitability rates.– The preparation for the implementation of IFRS 9 through conducting scenarios and reports required to comply with
the IFRS 9 implementation by the beginning of 2018.– Applying a risk rating system through which the clients will be classified to ten ranks (ratings) and according to the
below factors:•Obligor Risk Rating (economic sector, management, financial standing, experience, etc).•Facility Risk Rating (risk weight will be assigned according to the type and nature of the facility).•Collateral rating: (risk weight will be assigned according to the type and nature of the collateral), which will directly impact the Recovery Ratio thus the calculation of Loss Given Default LGD.
2. Separation of Business Development Department from Credit Risk Departments.
3. Implementing a set of approved policies and procedures that outline principles for defining, measuring, and managing the type of risk.
4. Determining credit concentrations at the credit type level, economic sector, geographical distribution, credit portfolios, etc. Credit risks are managed by departments according to their specialization.
5. Implementing an authorization and relationship management system:Bank of Jordan adopts an authorization system that includes authority granting, delegation, monitoring and relationship management of the various credit activities.
6. Determining credit risk mitigation methods:Bank of Jordan adopts various methods to mitigate credit risks such as the following:– Providing the proper credit structure that matches its purpose and repayment period.– Ensuring the completion of all control aspects relating to the utilization of credit and the sources of its payment.– Obtaining proper guarantees to hedge against any risks in this regard.– Analysing and evaluating credit transactions by credit risks departments.– Periodically evaluating guarantees according to the nature, type, and degree of risks to reinforce guarantees and ensure their
adequacy constantly.– Setting up specialized committees for approving credit.
7. Controlling credit execution by the credit control department in addition to a unit concerned with documentation, completion of legal audit, and execution.
8. Applying the credit management mechanisms (CREMS and E-loan).
9. Setting up a specialized department to follow up on the collection of dues and non-performing debts.
10. Setting up a committee for risk and compliance management committee at Board of Directors level to review policies, credit strategies, investments and risks.
11. Determining the duties of the various credit risks departments concerning the mechanism and periodicity of controls and issuance/submission of reports to the Board of Directors and Executive Management.
12. Analysing economic fluctuations and changes in the structure and quality of credit portfolios.
13. Preparation and implementation of Stress Testing procedures.
14. Control Reports:The credit risks departments, each according to its specialization, control and evaluate all credit operations through a set of control procedures:– Daily control:– Monitoring credit violations, un-renewed due credit ceilings, due accounts, and others.– Controlling the quality and distribution of the credit portfolio. – Rating credit risks, economic sector, credit type, guarantees, concentration, credit asset quality trends, and others.– Monitoring credit exposure at the customer level (Total Exposure), geographic area, credit type, economic sector, maturity date,
guarantee type, and others.– These reports are submitted periodically to the risk and compliance management committee at Board of Directors level. Timely
reports on daily operations are submitted to the General Manager.
Operational RiskOperational risks arise from the inefficiency or failure of internal operations, employees, or systems or may stem from external events including legal risks. The Operational Risk Unit was established in 2003 under the Risk Management Department to manage the Operational Risks in the bank where qualified staff were appointed and automated systems were supplied since that date to empower the unit to perform its duties effectively.
The Bank manages operational risks through the following process:1. Setting the operational risks policy, approving it by the Board of Directors, and implementing it across the bank and its affiliates.
This includes the standards for defining and measuring risks in addition to the Risk Appetite accepted for these risks.
2. Implementing an operational risk management system (CAREWeb).
3. Creating risk profiles for all bank entities which include all operational risks that may affect the entity, the related controls to mitigate them and the frequency of their testing to ensure effective and continuous implementation. Reports on risk profiles are submitted to the Risk and Compliance Committee on the Board level for approval.

86 87
4. Internal Audit Department evaluates the validity of the monthly self-assessment tests for the Bank’s various units, classifies these units according to the approved classification standards and incorporates them into the internal audit reports it submits to the Audit Committee on a timely basis. The Operational Risk Unit incorporates the self-assessment results in comparison with the internal audit results for all of the Bank’s entities and submits them to the Audit Committee on a quarterly basis.
5. Continuous evaluation of the Risk Profiles:In this regard, a self-assessment tool (Control & Risk Self-Assessment) has been applied to manage operational risks through continuous evaluation of risks to identify new risks, ensure the efficiency of control procedures to mitigate these risks, and update the risk profiles on a timely basis to reflect the actual internal control environment.
6. Setting up a database for operational incidents, analysing them and submitting reports on the concentration and type of these incidents to the Risk and Compliance Committee/Board of Directors.
7. Applying rating standards and evaluating the Bank’s entities according to international classification standards for internal control environment.
8. Setting up and determining key risk indicators (KRIs) at the Bank’s level and providing the related departments within the Bank with the results of these indicators to be monitored as well as applying rating standards and the correction procedures to avoid the risk before its occurrence.
9. Develop and implement the stress testing scenarios for Operational Risks in the Bank.
10. Providing the Risk and Compliance committee on the Board of Directors level with periodic reports (monthly, quarterly, semi-annually) that reflect the actual internal control environment for the various units in the Bank.
11. Evaluating the policies and procedures in the Bank to identify any control gaps in these processes and arrange with concerned entities to rectify these gaps.
12. Conducting trainings and awareness sessions for the Bank’s employees on Operational Risk Management to enhance the internal control environment at the Bank.
13. Creating the Corporate Risk Profile to identify risks that may arise on a strategic level and affect the achievement of
the Bank’s strategy and income targets negatively. The Internal Audit department evaluates the implementation of the corporate controls on an annual basis and submits a report of their findings to the Audit Committee and the Risk and Compliance Committee. The Corporate Risk Profile is evaluated on an annual basis by the Internal Audit department and the Operational Risk Unit and the updates are submitted in a report to the Risk and Compliance Committee.
14. The Operational Risk Unit has created an AML Risk profile at the bank level for identifying AML and CTF risks and controls that mitigate them. The Internal Audit department evaluates the implementation of these controls on an annual basis and submits a report of their findings to the Audit Committee and the Risk and Compliance Committee. The AML Risk Profile is evaluated on an annual basis by the Operational Risk Unit and the Compliance department and the updates are submitted in a report to the Risk and Compliance Committee.
Liquidity and Market RiskLiquidity riskLiquidity risk represents the Bank’s inability to make available the necessary funding to meet its obligations on their maturity dates or to finance its activities without incurring high costs or losses. Moreover, liquidity risks are divided into two types:
– Funding Liquidity Risk This risk represents the Bank’s inability to change assets into cash - such as the collection of receivables - or to obtain funding to meet its obligations.
– Market Liquidity Risk This risk represents the Bank’s inability to sell the asset in the market or selling the asset at a huge financial loss due to weak liquidity or demand in the market.
Market Risk– Market risks: are the risks of exposure of the positions on and off the Bank’s Consolidated Statement of Financial Position to
losses as a result of price fluctuations in the market. This includes the risks arising from the volatility of interest rates and stock prices of investment portfolios, both for the purpose of trading or exchange.
– Interest rate risks.– Currency exchange rate risks. (Dealing with Foreign Currency) – Fluctuation in share price risks.– Goods Risks.
Market risks arise from: 1. Changes that may occur in the political and economic conditions in markets.2. Fluctuations in interest rates.3. Fluctuations in the prices of financial instruments held for future buying and selling.4. Gaps in maturities of assets and liabilities and interest rate re-pricing. 5. Holding of uncovered positions. The substantial tools used to measure and manage markets risks as following:1. Basis Point Value 2. Value at Risk 3. Stress Testing
The Bank manages the market and liquidity risk through: – Installing a set of liquidity management policies and procedures, approved by the Board of Directors, that specifies the criteria for
definition, measurement, control, follow-up, and management of liquidity risk.– Setting up a liquidity crisis management plan that includes the following:
•Specialized procedures for the management of liquidity risk.•Specialized committee to manage liquidity risk.•A liquidity contingency plan.
– Developing measurement, management, and monitoring liquidity and market risk tools through:•Preparing liquidity risk reports according to the maturity scale.•Monitoring ceilings and quality of the investment portfolio.•Identifying sources of funds, and classifying/analysing them according to their nature.•Controlling legal liquidity and daily cash liquidity. This means keeping an adequate amount of liquid assets (cash and cash
equivalents) to meet obligations.•Matching maturities of assets and liabilities, taking into consideration all internal and external cash flows.•Performing stress testing.•Preparing a periodic analysis about the developments in local and international markets. •Monitoring investment tools and analyzing the range of conformity with the issued investment limits in the investment policy and
the allowed losses limits.•Analysing ceilings and limitations of the investments and providing a recommendation to adjust it according to improvements and
circumstances of international and local markets, and diverse investments that achieve best returns and less risks. •Analysing the investment concentrations on the level of each tool.•Reviewing and assessing the portfolios assets and liabilities. •Analysing credit rating for international and local banks according to the financial situation and how much it is effected by
economic crises and the range of its spread globally. •Monitoring interest trends on the volume of deposits, maturity date and its suspended range. •Preparing reports about the exceeding limit in investments tools.•Monitoring the changes on interest prices in international and local markets.•Monitoring the sensitivity of investment tools for changes in interest prices on each investment tool. •Monitoring pricing process for borrowing and lending/Investments ceiling. •Monitoring the concentration on, markets/tool and geographical distribution.
Submitting periodic reports to the Investment Committee, Executive Risk Management Committee, and Risk Management Committee/Board of Directors.

88 89
Information Security RiskDefined as any potential threat that may lead to a failure in confidentiality, availability, and integration of the Bank’s information. An Information Security Unit has been establish to protect the Bank’s information, users and assets by applying policies and procedures to be high level, through specific definitions of mandatory baseline controls.
Based on the above, Bank of Jordan adopts the following principles to manage information security risks:1. Review Information Security Policies and update the policies to be in line with international standards. 2. Comply with PCI-DSS Requirements.3. Monitor all systems, servers, and network components on a regular basis by using special tools to counter any threat.4. Review privileges based on job classification and function and restricted to least privileges necessary to perform job
responsibilities. 5. Identify threats and vulnerabilities and identify appropriate controls to mitigate any new risks. 6. Review and update the Business Contingency Plan periodically and do the necessary tests to check the effectiveness of
the plan, as well as periodically reviewing the Disaster Recovery Plan.7. Review and evaluate the physical security controls on a regular basis.8. Coordinate or conduct security orientation and security awareness programs. 9. Reporting information security/Communication Progress and related cases to the high management.
Compliance RisksThese represent the risks that arise from the probable failure by the Bank to comply with (violate/transgress) the prevailing laws, regulations, instructions, banking laws, and code of ethics issued by the international and local regulatory bodies, including the Bank’s internal policies.
The Bank has set up a compliance department, staffed with qualified and trained personnel, equipped with automatic systems, and assigned with the task of managing this type of risk according to the following criteria:
– Preparing the compliance policy, approving it by the Board of Directors, and enforcing it. This policy includes the principles for defining, measuring, and controlling risks.
– Applying an automatic system for managing compliance risks.– Evaluating and adopting all work policies and procedures and ensuring their compliance with laws, regulations, and
instructions governing the Bank’s work.– Preparing and applying compliance matrices, which include limiting the violation of laws and regulations and ensuring
compliance with them periodically according to the nature and type of the matrix.– Preparing and applying a conflict of interests management mechanism.– Promulgating and applying the code of ethics to all employees of the Bank.– Qualifying and training all employees of the Bank.– Providing the Board of Directors and Executive Management with periodic reports that include violations and non-
compliance at the Bank’s unit level.
As for Anti-Money Laundering activities, an autonomous unit within the Compliance Department has been set up with appropriate and qualified capabilities and systems, the Bank manages the unit of Anti-money laundering and terrorism finance as follows:1. Preparing a policy for anti-money laundering and Terrorism Financing Combat approved from the Board of Directors,
the policy is in line with the instruction of Anti-Money Laundering and Terrorism Financing Combat number 51 for the year 2010, and implementing it effectively.
2. The implementation of an automated system to check daily customer’s transactions.3. Rating of customers in accordance to their risk grade.4. A periodic automated check to ensure that none of the Bank’s customers are included in prohibited lists.5. Periodic check for customers with high risks.6. Awareness of the Bank’s employees, each as per their specialities.
The Bank has also established a unit to meet the requirements of tax compliance for foreign accounts (FATCA) and supply them with qualified human resources. The requirements of compliance operation management for FATCA law were prepared within the following basis:
– The preparation and adoption of a policy to deal with the FATCA law.– The preparation and adoption of a compliance program with the FATCA law.– Rehabilitation and training of all employees of the Bank to deal with the requirements of the FATCA law.– Contract with a specialized company to implement an automated system to manage the requirements of FATCA.– Adjusting opening new accounts application forms to meet the requirements of the law FATCA.– Developing a mechanism to update customer data on an ongoing basis.
Second: Quantitative Disclosures: (40/A) Credit Risk
20152016Exposure to credit risk (after impairment provisions and interest in suspense and before collateral held or other mitigation factors):
JDJDOn-Statement of Financial Position Items
173,756,768166,272,023Balances with central banks
281,318,758494,451,425Balances with banks and financial institutions
155,000,00025,000,000Deposits with banks and financial institutions
1,142,237,2461,226,013,033Credit facilities:
256,766,599307,336,228Individual (retail customers)
205,942,360221,576,763Real estate loans
530,017,547557,742,508Corporate entities
409,992,338418,533,785Large corporate customers
120,025,209139,208,723SMEs
149,510,739139,357,534Government & public sector
866,107-Financial derivatives instruments
227,655,707172,637,680Financial assets at amortized cost (Bonds & Treasury Bills)
19,696,70617,356,187Other assets
Off-statement of Financial Position Items
104,648,914117,565,620Letters of guarantee
45,308,13580,542,151Letters of credit
30,657,18574,535,617Acceptances
136,379,53586,932,724Un-utilized facilities
2,317,525,0612,461,306,460Total
The guarantees and mitigating credit risk factors against credit exposure mentioned above include the following:
– Obtaining suitable guarantees and recording them correctly against any potential risks. These guarantees represent cash guarantees, and non-cash guarantees such as real estate, vehicles, equipment and stock mortgages in addition to guarantees and credit derivatives binding to all parties involved and legally exercisable at all competent courts.
– Having a credit rating system for the Bank’s customers and relying on the credit ratings issued by international credit agencies for banks and companies.
– Performing periodic evaluations of guarantees according to the nature, type and degree of risk to regularly ensure their adequacy against the credit granted.
– Conducting a legal audit of all contracts and documents and their applicability according to the Bank’s system, laws and regulations.
– Having financial derivatives that mitigate market risks.

90 91
Cre
dit
expo
sure
is d
istr
ibut
ed a
ccor
ding
to
the
degr
ee o
f ri
sk a
s fo
llow
s:
Dec
embe
r 31
, 201
6
Tota
l
Bank
s &
Oth
er
Fina
ncia
l In
stitu
tions
Gov
ernm
ent
&
Publ
ic S
ecto
rO
ther
Ass
ets
Cor
pora
te E
ntiti
esR
eal E
stat
eLo
ans
Indi
vidu
al
(Ret
ail
Cus
tom
ers)
SMEs
Larg
e C
orpo
rate
C
usto
mer
s
JDJD
JDJD
JDJD
JDJD
418,
225,
569
166,
272,
023
251,
953,
546
--
--
-Lo
w g
rade
ris
k
1,62
3,77
7,10
754
8,89
5,09
3-
17,3
56,1
8712
7,44
2,38
441
3,62
4,86
021
3,23
6,92
530
3,22
1,65
8St
anda
rd g
rade
ris
k
From
whi
ch p
ast
due*
:
8,17
7,50
0-
--
2,20
0,96
72,
432,
768
125,
998
3,41
7,76
7U
p to
30
days
1,58
2,37
2-
--
535,
453
906,
972
81,1
7958
,768
From
31
to 6
0 da
ys
65,3
40,3
08-
--
6,90
9,08
050
,594
,088
4,98
4,46
52,
852,
675
Wat
ch li
st
66,2
06,4
64-
--
13,6
16,3
0823
,183
,478
6,66
5,21
022
,741
,468
Non
-per
form
ing:
5,11
0,28
2-
--
3,17
3,60
231
0,90
262
4,97
61,
000,
802
Subs
tand
ard
4,13
7,19
1-
--
304,
566
43,8
722,
055,
218
1,73
3,53
5D
oubt
ful
56,9
58,9
91-
--
10,1
38,1
4022
,828
,704
3,98
5,01
620
,007
,131
Loss
es w
ritte
n-of
f
2,17
3,54
9,44
871
5,16
7,11
625
1,95
3,54
617
,356
,187
147,
967,
772
487,
402,
426
224,
886,
600
328,
815,
801
Tota
l
(6,9
78,5
78)
--
-(1
,623
,509
)(2
,304
,247
)(5
24,5
94)
(2,5
26,2
28)
Less
: Int
eres
t in
sus
pens
e
(64,
840,
522)
--
-(7
,135
,540
)(3
5,96
6,39
4)(2
,785
,243
)(1
8,95
3,34
5)Le
ss: I
mpa
irmen
t pr
ovis
ion
2,10
1,73
0,34
871
5,16
7,11
625
1,95
3,54
617
,356
,187
139,
208,
723
449,
131,
785
221,
576,
763
307,
336,
228
Net
Cre
dit
expo
sure
is d
istr
ibut
ed a
ccor
ding
to
the
degr
ee o
f ri
sk a
s fo
llow
s:
Dec
embe
r 31
, 201
5
Tota
l
Bank
s &
Oth
er
Fina
ncia
l In
stitu
tions
Gov
ernm
ent
&
Publ
ic S
ecto
rO
ther
Ass
ets
Cor
pora
te E
ntiti
esR
eal E
stat
eLo
ans
Indi
vidu
al
(Ret
ail
Cus
tom
ers)
SMEs
Larg
e C
orpo
rate
C
usto
mer
s
JDJD
JDJD
JDJD
JDJD
526,
166,
189
174,
622,
875
351,
543,
314
--
--
-Lo
w g
rade
ris
k
1,45
4,42
6,77
344
6,30
6,89
1-
19,6
96,7
0610
5,91
5,57
942
4,41
5,34
320
0,54
6,46
625
7,54
5,78
8St
anda
rd g
rade
ris
k
From
whi
ch p
ast
due*
:
8,30
4,56
7-
--
1,35
0,89
54,
486,
294
834,
308
1,63
3,07
0U
p to
30
days
1,90
0,78
9-
--
540,
557
848,
564
33,2
3547
8,43
3Fr
om 3
1 to
60
days
18,5
94,3
29-
--
3,96
4,49
79,
721,
011
2,79
3,36
62,
115,
455
Wat
ch li
st
81,0
73,3
82-
--
16,5
96,2
9141
,895
,200
5,47
5,96
317
,105
,928
Non
-per
form
ing:
3,95
1,76
3-
--
285,
999
1,68
2,72
059
3,77
11,
389,
273
Subs
tand
ard
4,85
8,53
9-
--
1,11
5,82
886
4,58
31,
010,
483
1,86
7,64
5D
oubt
ful
72,2
63,0
80-
--
15,1
94,4
6439
,347
,897
3,87
1,70
913
,849
,010
Loss
es w
ritte
n-of
f
2,08
0,26
0,67
362
0,92
9,76
635
1,54
3,31
419
,696
,706
126,
476,
367
476,
031,
554
208,
815,
795
276,
767,
171
Tota
l
(9,0
23,2
81)
--
-(1
,445
,040
)(4
,459
,612
)(5
90,3
75)
(2,5
28,2
54)
Less
: Int
eres
t in
sus
pens
e
(70,
706,
100)
--
-(5
,006
,118
)(4
5,94
4,60
4)(2
,283
,060
)(1
7,47
2,31
8)Le
ss: I
mpa
irmen
t pr
ovis
ion
2,00
0,53
1,29
262
0,92
9,76
635
1,54
3,31
419
,696
,706
120,
025,
209
425,
627,
338
205,
942,
360
256,
766,
599
Net
- C
redi
t ris
k ex
posu
re in
clud
e ba
lanc
es a
nd d
epos
its a
t ba
nks
and
finan
cial
inst
itutio
ns, t
reas
ury
bills
and
any
ass
ets
whi
ch h
as c
redi
t ex
posu
re.
* A
ll of
the
loan
bal
ance
is c
onsi
dere
d m
atur
e if
any
inst
alm
ent
or in
tere
st m
atur
es f
or a
per
iod
that
exc
eeds
90
days
, as
for
the
over
draf
t it
is c
onsi
dere
d m
atur
e if
it ex
ceed
s th
e lim
it of
a
perio
d th
at e
xcee
ds 9
0 da
ys.

92 93
The
follo
win
g ta
ble
illus
trat
es t
he f
air
valu
e of
col
late
rals
hel
d as
sec
urit
y fo
r cr
edit
fac
iliti
es: Dec
embe
r 31
, 201
6
Tota
l G
over
nmen
t an
d Pu
blic
Sec
tor
Cor
pora
te E
ntiti
es
Rea
l Est
ate
Loan
sIn
divi
dual
(R
etai
l C
usto
mer
s)SM
EsLa
rge
Cor
pora
te
Cus
tom
ers
JDJD
JDJD
JDJD
Col
late
rals
:
--
--
--
Low
gra
de
423,
770,
387
-71
,826
,172
106,
546,
591
205,
970,
022
39,4
27,6
02St
anda
rd g
rade
26,9
21,4
88-
6,70
8,23
216
,785
,177
3,42
0,88
17,
198
Wat
ch li
st
34,7
08,2
27-
10,1
02,6
1018
,959
,079
4,81
0,89
283
5,64
6N
on-p
erfo
rmin
g:
11,4
24,2
80-
1,37
7,61
19,
136,
086
538,
286
372,
297
Subs
tand
ard
890,
958
-11
8,47
211
,048
758,
038
3,40
0D
oubt
ful
22,3
92,9
89-
8,60
6,52
79,
811,
945
3,51
4,56
845
9,94
9Lo
sses
writ
ten-
off
485,
400,
102
-88
,637
,014
142,
290,
847
214,
201,
795
40,2
70,4
46To
tal
-A
s:
62,2
27,7
80-
15,5
47,3
7633
,052
,562
1,68
7,78
011
,940
,062
Cas
h m
argi
ns
352,
929,
068
-65
,765
,169
70,4
11,8
4521
0,26
6,73
16,
485,
323
Rea
l est
ate
31,9
86,3
54-
321,
372
31,6
64,9
82-
-Li
sted
sha
res
38,2
56,9
00-
7,00
3,09
77,
161,
458
2,24
7,28
421
,845
,061
Equi
pmen
t an
d ve
hicl
es
485,
400,
102
-88
,637
,014
142,
290,
847
214,
201,
795
40,2
70,4
46To
tal
The
follo
win
g ta
ble
illus
trat
es t
he f
air
valu
e of
col
late
rals
hel
d as
sec
urit
y fo
r cr
edit
fac
iliti
es: Dec
embe
r 31
, 201
5
Tota
l G
over
nmen
t an
d Pu
blic
Sec
tor
Cor
pora
te E
ntiti
es
Rea
l Est
ate
Loan
sIn
divi
dual
(R
etai
l C
usto
mer
s)SM
EsLa
rge
Cor
pora
te
Cus
tom
ers
JDJD
JDJD
JDJD
Col
late
rals
:
--
--
--
Low
gra
de
396,
767,
038
-74
,028
,359
107,
481,
641
175,
213,
476
40,0
43,5
62St
anda
rd g
rade
8,03
3,63
4-
3,93
6,69
51,
347,
306
2,74
8,95
967
4W
atch
list
39,7
65,9
38-
10,9
76,3
4622
,903
,837
4,78
2,67
11,
103,
084
Non
-per
form
ing:
3,30
1,25
0-
920,
728
1,81
4,30
053
7,99
828
,224
Subs
tand
ard
2,53
3,68
3-
1,26
2,12
037
5,51
883
5,81
360
,232
Dou
btfu
l
33,9
31,0
05-
8,79
3,49
820
,714
,019
3,40
8,86
01,
014,
628
Loss
es w
ritte
n-of
f
444,
566,
610
-88
,941
,400
131,
732,
784
182,
745,
106
41,1
47,3
20To
tal
As:
38,6
00,3
33-
7,91
3,39
017
,732
,635
33,9
5012
,920
,358
Cas
h m
argi
ns
351,
483,
710
-68
,482
,274
84,2
71,6
1718
2,67
7,30
616
,052
,513
Rea
l est
ate
25,1
86,4
56-
506,
850
24,6
79,6
06-
-Li
sted
sha
res
29,2
96,1
11-
12,0
38,8
865,
048,
926
33,8
5012
,174
,449
Equi
pmen
t an
d ve
hicl
es
444,
566,
610
-88
,941
,400
131,
732,
784
182,
745,
106
41,1
47,3
20To
tal

94 95
1. Rescheduled LoansThese represent loans classified previously as non-performing, removed from non-performing credit facilities according to proper scheduling, and reclassified as debts under watch list. Total rescheduled loans amounted to JD 9,162,639 as of December 31, 2016 (JD 9,147,883 as of December 31, 2015).
This balance represents the rescheduled loans either classified as watch list or returned to performing loans.
2. Restructured LoansRestructuring means to rearrange facilities instalments by increasing their duration, postponing some instalments, or increasing their grace period. They are classified as debts under watch list and amounted to JD 38,261,806 as of December 31, 2016 (JD 23,839,111 as of December 31, 2015).
3. Bonds, Debentures and Treasury Bills
The schedule below shows the distribution of bonds, debentures and bills according to the internationalagencies’ classification:
Total Within Financial
Assets at Amortized Cost
ClassificationRating AgencyRating Grade
JDJD
4,980,0444,980,044A1Moody’sForeign Bank Bonds
2,845,6662,845,666A2Moody’sForeign Bank Bonds
2,127,0002,127,000A3Moody’sForeign Bank Bonds
7,759,1937,759,193Aa3Moody’sForeign Bank Bonds
8,817,2578,817,257Ba2Moody’sForeign Bank Bonds
2,914,5082,914,508Baa2Moody’sForeign Bank Bonds
112,596,012112,596,012Jordanian Government Bonds
30,598,00030,598,000Unrated Bonds
172,637,680172,637,680Total
4. C
once
ntra
tion
in c
redi
t ex
posu
re a
ccor
ding
to
geog
raph
ical
dis
trib
utio
n as
fol
low
s:
Dec
embe
r 31
, 201
6D
istr
ibut
ed a
ccor
ding
to
the
coun
try
of r
esid
ence
of
the
coun
terp
arty
Tota
lO
ther
C
ount
ries
Am
eric
aA
sia*
Euro
pe
Oth
er M
iddl
e Ea
st C
ount
ries
Insi
de J
orda
n G
eogr
aphi
cal a
rea
JDJD
JDJD
JDJD
JDIt
ems
166,
272,
023
--
--
59,4
18,3
3710
6,85
3,68
6Ba
lanc
es w
ith c
entr
al b
anks
494,
451,
425
75,9
605,
027,
919
64,8
5014
,339
,649
84,5
55,4
1539
0,38
7,63
2Ba
lanc
es w
ith b
anks
and
fina
ncia
l ins
titut
ions
25,0
00,0
00-
--
--
25,0
00,0
00D
epos
its w
ith b
anks
and
fina
ncia
l ins
titut
ions
1,22
6,01
3,03
3-
--
-16
6,96
9,87
21,
059,
043,
161
Cre
dit
faci
litie
s:
307,
336,
228
--
--
47,8
02,3
0125
9,53
3,92
7In
divi
dual
(re
tail
cust
omer
s)
221,
576,
763
--
--
815,
770
220,
760,
993
Rea
l est
ate
loan
s
557,
742,
508
--
--
65,9
94,3
8449
1,74
8,12
4C
orpo
rate
ent
itie
s
418,
533,
785
--
--
46,1
15,0
6437
2,41
8,72
1La
rge
corp
orat
e cu
stom
ers
139,
208,
723
--
--
19,8
79,3
2011
9,32
9,40
3SM
Es
139,
357,
534
--
--
52,3
57,4
1787
,000
,117
Gov
ernm
ent
& p
ublic
sec
tor
--
--
--
-Fi
nanc
ial d
eriv
ativ
es in
stru
men
ts
Bond
s &
Tre
asur
y Bi
lls
172,
637,
680
--
3,55
6,82
1-
41,4
84,8
4712
7,59
6,01
2Fi
nanc
ial a
sset
s at
am
ortiz
ed c
ost
17,3
56,1
87-
-3,
727
-5,
380,
498
11,9
71,9
62O
ther
ass
ets
2,10
1,73
0,34
875
,960
5,02
7,91
93,
625,
398
14,3
39,6
4935
7,80
8,96
91,
720,
852,
453
Tota
l for
the
Yea
r 20
16
2,00
0,53
1,29
2-
12,0
07,3
1252
3,99
820
,642
,223
307,
246,
881
1,66
0,11
0,87
8To
tal f
or t
he Y
ear
2015
*Exc
ept
for
Mid
dle
East
Cou
ntrie
s

96 97
5. C
once
ntra
tion
in c
redi
t ex
posu
re a
ccor
ding
to
the
econ
omic
sec
tor
as f
ollo
ws:
Tota
l
Gov
ernm
ent
and
Publ
ic S
ecto
r
Indi
vidu
als
Stoc
k
Tour
istic
Hot
els
Res
taur
ants
Publ
ic
Faci
litie
s
Agr
icul
ture
C
onst
ruct
ion
Rea
l Est
ate
Trad
ing
Indu
stria
lFi
nanc
ial
Econ
omic
Sec
tor
JDJD
JDJD
JDJD
JDJD
JDJD
JDIt
ems
166,
272,
023
--
--
--
--
-16
6,27
2,02
3Ba
lanc
es w
ith c
entr
al b
anks
494,
451,
425
--
--
--
--
-49
4,45
1,42
5Ba
lanc
es w
ith b
anks
and
finan
cial
inst
itutio
ns
25,0
00,0
00-
--
--
--
--
25,0
00,0
00D
epos
its w
ith b
anks
and
finan
cial
inst
itutio
ns
1,22
6,01
3,03
313
9,35
7,53
432
1,94
4,81
811
,202
,167
88,0
38,0
9916
,737
,743
43,5
48,0
5022
3,07
8,21
624
5,99
8,43
813
3,60
0,42
72,
507,
541
Cre
dit
faci
litie
s:
Fina
ncia
l ass
ets
at f
air
valu
e
--
--
--
--
--
-Fi
nanc
ial d
eriv
ativ
es
inst
rum
ents
Bond
s &
Tre
asur
y Bi
lls:
172,
637,
680
112,
596,
012
--
--
--
15,5
98,0
00-
44,4
43,6
68Fi
nanc
ial a
sset
s at
am
ortiz
ed c
ost
17,3
56,1
87-
11,4
8410
2,52
0-
--
1,57
624
,196
45,3
4217
,171
,069
Oth
er a
sset
s
2,10
1,73
0,34
825
1,95
3,54
632
1,95
6,30
211
,304
,687
88,0
38,0
9916
,737
,743
43,5
48,0
5022
3,07
9,79
226
1,62
0,63
413
3,64
5,76
974
9,84
5,72
6To
tal f
or t
he Y
ear
2016
2,00
0,53
1,29
235
1,54
3,31
427
3,46
9,18
99,
176,
609
66,3
03,1
9015
,963
,955
43,2
91,4
9513
9,34
9,71
626
9,22
1,20
018
4,33
1,26
164
7,88
1,36
3To
tal f
or t
he Y
ear
2015
40/b Market Risks: Descriptive Disclosure: These risks arise from the fluctuations in the fair values or the future cash flows of financial instruments due to the changes in market prices such as interest rate, currency exchange rate, and shares prices. Moreover, market risks arise from the existence of open positions in interest rates, currency exchange rates, and investments in shares. These risks are monitored according to specific policies and procedures through special committees and associated work centres and include the following:
– Interest rate risks.– Currency exchange rate risks.– Fluctuation in share price risks.– Market risks: are the risks of exposure of the positions on and off the Bank’s Consolidated Statement of Financial Position to losses
as a result of price fluctuations in the market. This includes the risks arising from the volatility of interest rates and stock prices of investment portfolios, both for the purpose of trading or exchange.
Market risks arise from: – Changes that may occur in the political and economic conditions in markets.– Fluctuations in interest rates.– Fluctuations in the prices of financial instruments held for future buying and selling.– Foreign currency fluctuations.– Gaps in maturities of assets and liabilities and interest rate re-pricing.– Creation of uncovered positions. Interest Rate RisksInterest rate risks arise from the probable impact of changes in interest rates on the value of other financial assets. The Bank is exposed to the risk of interest rates due to a mismatch or a gap in the amounts of assets and liabilities, according to the various time limits or review of interest rates in a certain period. Moreover, the Bank manages these risks through reviewing the interest rates on assets and liabilities based on the risk management strategy undertaken by the Asset and Liability Management Committee. The Bank follows a policy of hedging all financial assets and financial liabilities whenever the need arises. Hedging is against anticipated future risks.
The Bank has developed analysis scenarios to measure the sensitivity of interest rate risk in addition to providing a system for controlling the difference in the history of re-pricing. This ensures control; reduces risk, and takes into account acceptable risk and balancing maturities of assets with liabilities, as well as the gaps and benefits of hedging their prices.
Foreign Currency RisksForeign currency risks are the risks arising from changes in the values of financial instruments as a result of fluctuations in the prices of foreign currencies using good policy to manage its foreign currency positions.
The Bank’s investment policy includes a set of controls that limit this type of risk monitored by a market risk unit such as follows:– Exceeding limits is not allowed, and any currency excess is settled immediately.– Any dealer should close the position immediately when the loss reaches the allowed maximum limit.
The Treasury and Investment Department analyses and controls open positions daily. It closes the positions in case of excesses of ceiling, loss limits or heightened risks due to market fluctuations.
The following is the net of major foreign currencies positions at the Bank:
December 31,
Currency Type 2016 2015
JD JD
US Dollar (31,027,943) (20,004,009)
Sterling Pound 262,188 1,071,016
Euro (1,689,464) (3,590,984)
Japanese Yen 8,139 188,325
Other currencies (21,566,026) (21,491,911)
(54,013,106) (43,827,563)

98 99
Share Price RisksShare price risks result from the changes in the fair values of investments in shares. The Bank manages these risks through diversifying investments across various geographical areas and economic sectors. Most of the investments held by the Bank are listed in Amman Stock Exchange.
Market Risk ManagementThe Bank follows financial and investment policies for risk management within a specified strategy. Moreover, the Bank has an Asset and Liability Management Committee that supervises and controls risks and performs the optimal strategic distribution of assets and liabilities both on and off the Consolidated Statement of Financial Position. Moreover, a market risk unit was established, staffed with qualified human resources, and equipped with electronic systems. These risk management procedures include the following:– Preparation and implementation of an investment policy approved by the Board of Directors and the Central Bank of
Jordan.
– Preparation and application of a market risk management policy approved by the Board of Directors including the criteria for the definition, measurement, and monitoring of this type of risk.
– Preparation of a mechanism for management of ceilings of local and foreign investments.
– Development of market risk measurement, management, and monitoring tools through:•Value at risk (VAR).•Basis point analysis.•Stress testing.•Defining stop loss limit.•Preparation of investment concentration reports (geographical distribution, economic sector, currency, tool, etc.).•Controlling investment ceilings.•Controlling investment operations, open financial positions, local and international stocks.
– Preparation of periodic reports, to present to the Investment Committee, Executive Risk Management Committee, and Risk Management Committee/ Board of Directors.
Quantitative Disclosures:
1. Interest Rate Risks
December 31, 2016
Sensitivity of Equity
Sensitivity of Interest Revenue Analysis (Profits and Losses)
Increase in Currency Exchange Rate (%)
JDJDCurrency
-(620,559)2%US Dollar
-5,2442%Sterling Pound
-(33,789)2%Euro
-1632%Japanese Yen
-(431,321)2%Other Currencies
Sensitivity of Equity Analysis
Sensitivity of Interest Revenue Analysis (Profits and Losses)
Decrease in Interest Rate (%)
JDJDCurrency
-620,5592%US Dollar
-(5,244)2%Sterling Pound
-33,7892%Euro
-(163)2%Japanese Yen
-431,3212%Other Currencies
December 31, 2015
Sensitivity of Equity Analysis
Sensitivity of Interest Revenue Analysis (Profits and Losses)
Decrease in Interest Rate (%)
JDJDCurrency
-(400,080)2%US Dollar
-21,4202%Sterling Pound
-(71,820)2%Euro
-3,7672%Japanese Yen
-(429,838)2%Other Currencies
Sensitivity of Equity Analysis
Sensitivity of Interest Revenue Analysis (Profits and Losses)
Decrease in Interest Rate (%)
JDJDCurrency
-400,0802%US Dollar
-(21,420)2%Sterling Pound
-71,8202%Euro
-(3,767)2%Japanese Yen
-429,8382%Other Currencies
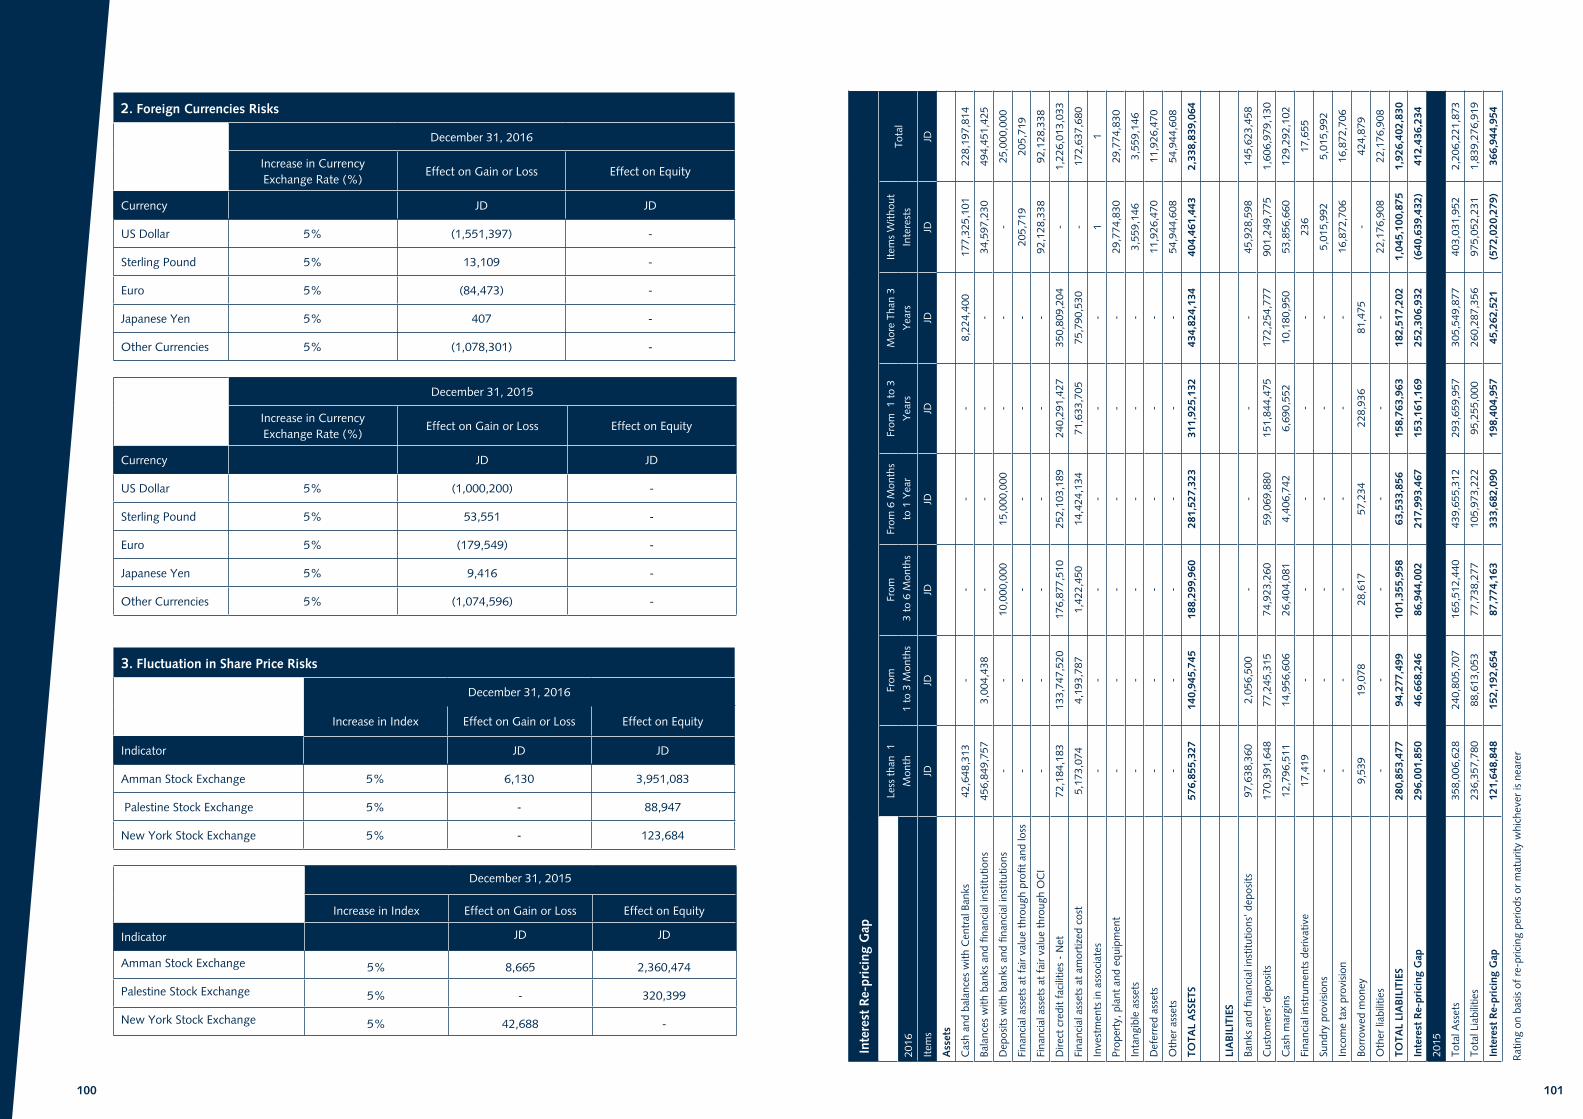
100 101
2. Foreign Currencies Risks
December 31, 2016
Effect on Equity Effect on Gain or LossIncrease in Currency Exchange Rate (%)
JDJDCurrency
-(1,551,397)5%US Dollar
-13,1095%Sterling Pound
-(84,473)5%Euro
-4075%Japanese Yen
-(1,078,301)5%Other Currencies
December 31, 2015
Effect on Equity Effect on Gain or LossIncrease in Currency Exchange Rate (%)
JDJDCurrency
-(1,000,200)5%US Dollar
-53,5515%Sterling Pound
-(179,549)5%Euro
-9,4165%Japanese Yen
-(1,074,596)5%Other Currencies
3. Fluctuation in Share Price Risks
December 31, 2016
Effect on Equity Effect on Gain or LossIncrease in Index
JDJDIndicator
3,951,0836,1305%Amman Stock Exchange
88,947-5% Palestine Stock Exchange
123,684-5%New York Stock Exchange
December 31, 2015
Effect on EquityEffect on Gain or LossIncrease in Index
JDJDIndicator
2,360,4748,6655%Amman Stock Exchange
320,399-5%Palestine Stock Exchange
-42,6885%New York Stock Exchange
Inte
rest
Re-
pric
ing
Gap
Tota
lIt
ems
With
out
Inte
rest
s
Mor
e Th
an 3
Yea
rs
From
1 t
o 3
Yea
rs
From
6 M
onth
s
to 1
Yea
r
From
3 t
o 6
Mon
ths
From
1 t
o 3
Mon
ths
Less
tha
n 1
Mon
th20
16
JDJD
JDJD
JDJD
JDJD
Item
s
Ass
ets
228,
197,
814
177,
325,
101
8,22
4,40
0-
--
-42
,648
,313
Cas
h an
d ba
lanc
es w
ith C
entr
al B
anks
494,
451,
425
34,5
97,2
30-
--
-3,
004,
438
456,
849,
757
Bala
nces
with
ban
ks a
nd fi
nanc
ial i
nstit
utio
ns
25,0
00,0
00-
--
15,0
00,0
0010
,000
,000
--
Dep
osits
with
ban
ks a
nd fi
nanc
ial i
nstit
utio
ns
205,
719
205,
719
--
--
--
Fina
ncia
l ass
ets
at f
air
valu
e th
roug
h pr
ofit
and
loss
92,1
28,3
3892
,128
,338
--
--
--
Fina
ncia
l ass
ets
at f
air
valu
e th
roug
h O
CI
1,22
6,01
3,03
3-
350,
809,
204
240,
291,
427
252,
103,
189
176,
877,
510
133,
747,
520
72,1
84,1
83D
irect
cre
dit
faci
litie
s -
Net
172,
637,
680
-75
,790
,530
71,6
33,7
0514
,424
,134
1,42
2,45
04,
193,
787
5,17
3,07
4Fi
nanc
ial a
sset
s at
am
ortiz
ed c
ost
11
--
--
--
Inve
stm
ents
in a
ssoc
iate
s
29,7
74,8
3029
,774
,830
--
--
--
Prop
erty
, pla
nt a
nd e
quip
men
t
3,55
9,14
63,
559,
146
--
--
--
Inta
ngib
le a
sset
s
11,9
26,4
7011
,926
,470
--
--
--
Def
erre
d as
sets
54,9
44,6
0854
,944
,608
--
--
--
Oth
er a
sset
s
2,33
8,83
9,06
440
4,46
1,44
343
4,82
4,13
431
1,92
5,13
228
1,52
7,32
318
8,29
9,96
014
0,94
5,74
557
6,85
5,32
7TO
TAL
ASS
ETS
LIA
BIL
ITIE
S
145,
623,
458
45,9
28,5
98-
--
-2,
056,
500
97,6
38,3
60Ba
nks
and
finan
cial
inst
itutio
ns’ d
epos
its
1,60
6,97
9,13
090
1,24
9,77
517
2,25
4,77
715
1,84
4,47
559
,069
,880
74,9
23,2
6077
,245
,315
170,
391,
648
Cus
tom
ers’
dep
osits
129,
292,
102
53,8
56,6
6010
,180
,950
6,69
0,55
24,
406,
742
26,4
04,0
8114
,956
,606
12,7
96,5
11C
ash
mar
gins
17,6
5523
6-
--
--
17,4
19Fi
nanc
ial i
nstr
umen
ts d
eriv
ativ
e
5,01
5,99
25,
015,
992
--
--
--
Sund
ry p
rovi
sion
s
16,8
72,7
0616
,872
,706
--
--
--
Inco
me
tax
prov
isio
n
424,
879
-81
,475
228,
936
57,2
3428
,617
19,0
789,
539
Borr
owed
mon
ey
22,1
76,9
0822
,176
,908
--
--
--
Oth
er li
abili
ties
1,92
6,40
2,83
01,
045,
100,
875
182,
517,
202
158,
763,
963
63,5
33,8
5610
1,35
5,95
894
,277
,499
280,
853,
477
TOTA
L LI
AB
ILIT
IES
412,
436,
234
(640
,639
,432
)25
2,30
6,93
215
3,16
1,16
921
7,99
3,46
786
,944
,002
46,6
68,2
4629
6,00
1,85
0In
tere
st R
e-pr
icin
g G
ap
2015
2,20
6,22
1,87
340
3,03
1,95
230
5,54
9,87
729
3,65
9,95
743
9,65
5,31
216
5,51
2,44
024
0,80
5,70
735
8,00
6,62
8To
tal A
sset
s
1,83
9,27
6,91
997
5,05
2,23
126
0,28
7,35
695
,255
,000
105,
973,
222
77,7
38,2
7788
,613
,053
236,
357,
780
Tota
l Lia
bilit
ies
366,
944,
954
(572
,020
,279
)45
,262
,521
198,
404,
957
333,
682,
090
87,7
74,1
6315
2,19
2,65
412
1,64
8,84
8In
tere
st R
e-pr
icin
g G
ap
Rat
ing
on b
asis
of
re-p
ricin
g pe
riods
or
mat
urity
whi
chev
er is
nea
rer

102 103
Con
cent
rati
on o
f Fo
reig
n C
urre
ncy
Ris
k
Dec
embe
r 31
, 201
6
Tota
lO
ther
Japa
nese
Yen
Euro
Ster
ling
Poun
dU
S D
olla
rC
urre
ncy
JDJD
JDJD
JDJD
Item
s
ASS
ETS
99,8
37,1
4532
,227
,973
486
1,76
2,23
627
3,36
1 65
,573
,089
Cas
h an
d ba
lanc
es w
ith C
entr
al B
anks
193,
303,
747
38,7
12,3
6061
,796
16,3
81,0
998,
063,
159
130,
085,
333
Bala
nces
with
ban
ks a
nd fi
nanc
ial i
nstit
utio
ns
--
--
--
Fina
ncia
l der
ivat
ives
inst
rum
ents
275,
415,
794
93,1
29,1
98-
1,98
2,00
1-
180,
304,
595
Dire
ct c
redi
t fa
cilit
ies
- N
et
55,5
19,8
85-
--
-55
,519
,885
Fin
anci
al a
sset
s (a
t am
ortiz
ed c
ost
and
at f
air
valu
e an
d in
vest
men
ts in
ass
ocia
tes)
9,47
4,45
57,
149,
966
4052
,999
4,94
92,
266,
501
Oth
er a
sset
s
633,
551,
026
171,
219,
497
62,3
2220
,178
,335
8,34
1,46
943
3,74
9,40
3TO
TAL
ASS
ETS
LIA
BIL
ITIE
S
51,2
77,0
366,
767,
265
-15
1,56
94,
235
44,3
53,9
67Ba
nks
and
finan
cial
inst
itutio
ns’ d
epos
its
532,
138,
626
155,
218,
403
23,3
5419
,739
,139
8,02
9,64
434
9,12
8,08
6C
usto
mer
s’ d
epos
its
35,6
65,8
376,
936,
824
30,8
291,
937,
084
33,3
7926
,727
,721
Cas
h m
argi
ns
68,4
82,6
3323
,863
,031
-40
,007
12,0
2344
,567
,572
Oth
er li
abili
ties
687,
564,
132
192,
785,
523
54,1
8321
,867
,799
8,07
9,28
146
4,77
7,34
6TO
TAL
LIA
BIL
ITIE
S
(54,
013,
106)
(21,
566,
026)
8,13
9(1
,689
,464
)26
2,18
8(3
1,02
7,94
3)N
et p
osit
ion
insi
de fi
nanc
ial p
osit
ion
2016
208,
070,
276
14,6
16,3
261,
058,
568
11,9
16,4
3641
,661
180,
437,
285
Com
mitm
ents
and
con
tinge
nt li
abili
ties
off
the
Stat
emen
tof
Fin
anci
al P
ositi
on d
urin
g th
e ye
ar 2
016
Dec
embe
r 31
, 201
5
Tota
lO
ther
Japa
nese
Yen
Euro
Ster
ling
Poun
dU
S D
olla
rC
urre
ncy
JDJD
JDJD
JDJD
Item
s
634,
124,
295
170,
635,
083
282,
612
39,4
67,3
678,
995,
322
414,
743,
911
TOTA
L A
SSET
S
677,
951,
858
192,
126,
994
94,2
8743
,058
,351
7,92
4,30
643
4,74
7,92
0TO
TAL
LIA
BIL
ITIE
S
(43,
827,
563)
(21,
491,
911)
188,
325
(3,5
90,9
84)
1,07
1,01
6(2
0,00
4,00
9)N
et c
once
ntra
tion
s in
side
fina
ncia
l pos
itio
n fo
r 20
15
108,
579,
173
13,8
40,1
451,
852,
830
3,17
3,88
212
,991
89,6
99,3
25C
omm
itmen
ts a
nd c
ontin
gent
liab
ilitie
s of
f th
e St
atem
ent
of F
inan
cial
Pos
ition
dur
ing
the
year
201
5
Liqu
idit
y R
isk
Firs
t: t
his
tabl
e su
mm
ariz
es b
elow
the
(un
rebu
tted
) lia
bilit
ies
on t
he r
emai
ning
per
iod
for
cont
ract
ual m
atur
ities
at
the
date
of
cons
olid
ated
fina
ncia
l sta
tem
ents
Tota
lsW
ithou
t M
atur
ityM
ore
than
3
Yea
rs
From
1 t
o 3
Yea
rs
From
6
Mon
ths
to 1
ye
ar
From
3 t
o 6
Mon
ths
From
1 t
o 3
Mon
ths
For
1 M
onth
Dec
embe
r 31
, 201
6
JDJD
JDJD
JDJD
JDJD
Liab
ilitie
s
145,
623,
458
--
--
-2,
056,
500
143,
566,
958
Dep
osits
with
ban
ks a
nd fi
nanc
ial i
nstit
utio
ns
1,60
6,97
9,13
055
,605
,619
358,
428,
636
374,
255,
660
201,
534,
523
97,3
49,8
5313
4,87
3,98
538
4,93
0,85
4C
usto
mer
s’ d
epos
its
129,
292,
102
2,80
620
,253
,129
16,4
18,3
7328
,906
,742
34,4
04,0
8115
,077
,104
14,2
29,8
67C
ash
mar
gin
5,01
5,99
24,
812,
949
--
--
-20
3,04
3Su
ndry
pro
visi
on
16,8
72,7
06-
--
-12
,654
,529
-4,
218,
177
Inco
me
tax
prov
isio
n
424,
879
-81
,475
228,
936
57,2
3428
,617
19,0
789,
539
Borr
owed
mon
ey
17,6
55-
--
--
-17
,655
Fina
ncia
l ins
trum
ents
der
ivat
ive
22,1
76,9
081,
799,
221
-12
,611
9,11
8,60
43,
631,
822
2,99
6,15
54,
618,
495
Oth
er li
abili
ties
1,92
6,40
2,83
062
,220
,595
378,
763,
240
390,
915,
580
239,
617,
103
148,
068,
902
155,
022,
822
551,
794,
588
Tota
l lia
bilit
ies
2,33
8,83
9,06
421
2,33
7,37
145
7,80
5,87
131
5,52
7,91
829
0,21
1,83
319
9,29
5,25
014
3,30
8,63
172
0,35
2,19
0To
tal A
sset
s (A
ccor
ding
to e
xpec
ted
mat
urit
y )
Tota
lsW
ithou
t M
atur
ityM
ore
than
3
Yea
rs
From
1 t
o 3
Yea
rs
From
6
Mon
ths
to 1
ye
ar
From
3 t
o 6
Mon
ths
From
1 t
o 3
Mon
ths
For
1 M
onth
Dec
embe
r 31
, 201
5
JDJD
JDJD
JDJD
JDJD
Liab
ilitie
s
123,
589,
030
--
--
3,15
9,00
03,
580,
200
116,
849,
830
Dep
osits
with
ban
ks a
nd fi
nanc
ial i
nstit
utio
ns
1,56
4,88
6,96
382
,805
,617
328,
910,
179
224,
783,
530
303,
272,
202
121,
397,
937
147,
853,
782
355,
863,
716
Cus
tom
ers’
dep
osits
111,
171,
152
50,0
00,2
669,
755,
649
6,39
3,72
614
,506
,262
7,00
1,54
97,
851,
450
15,6
62,2
50C
ash
mar
gin
6,22
6,16
56,
226,
165
--
--
--
Sund
ry p
rovi
sion
13,1
97,6
54-
--
-9,
891,
237
-3,
306,
417
Inco
me
tax
prov
isio
n
500,
956
-50
0,95
6-
--
--
Borr
owed
mon
ey
19,7
04,9
991,
856,
840
-15
6,90
990
,633
5,91
5,45
35,
180,
662
6,50
4,50
2O
ther
liab
ilitie
s
1,83
9,27
6,91
914
0,88
8,88
833
9,16
6,78
423
1,33
4,16
531
7,86
9,09
714
7,36
5,17
616
4,46
6,09
449
8,18
6,71
5To
tal l
iabi
litie
s
2,20
6,22
1,87
423
6,50
9,60
029
8,10
5,37
729
3,65
9,95
843
9,65
5,31
216
5,51
2,44
023
7,36
9,49
453
5,40
9,69
3To
tal A
sset
s (A
ccor
ding
to e
xpec
ted
mat
urit
y)

104 105
Second: this table summarizes the accrual financial instruments derivative on the remaining period of contractual maturity
from the date of the financial statements:
Financial derivative/liabilities which have been adjusted to gross which involves:
December 31, 2015December 31, 2016
Total For 3 months Total For 3 months
JDJDJDJD
Derivative for treading
Currency Derivative
(2,128,944)(2,128,944)(3,332,249)(3,332,249)Outflow
2,995,0512,995,0513,314,5943,314,594Inflow
866,107866,107(17,655)(17,655)Total
December 31, 2016Off-consolidated statement of financial position items:
Total Over 5 Years 1 to 5 Years Up to 1 Year
JDJDJDJD
155,077,768--155,077,768Letters of credit and acceptances
86,932,724--86,932,724Un-utilized facilities
117,565,620--117,565,620Letters of guarantee
12,852,1631,532,8128,892,0662,427,285Operational lease contracts
1,701,430--1,701,430Capital commitments
374,129,7051,532,8128,892,066363,704,827Total
December 31, 2015
Total Over 5 Years 1 to 5 Years Up to 1 Year
JDJDJDJD
75,965,320--75,965,320Letters of credit and acceptances
136,379,535--136,379,535Un-utilized facilities
104,648,914--104,648,914Letters of guarantee
2,123,913--2,123,913Operational leases contracts and capital commitments
319,117,682--319,117,682Total
41. Information on the Bank’s Business Segments1. The Bank’s business segments are:
The Bank is organized for management purposes in a manner that allows measurement of its segments according to reports used by its Chief Executive Officer and main decision-makers through the following main segments:– Retail Banking: includes following up on individual customers’ accounts, granting them loans, credit, credit cards, and
other services.– Corporate Banking: includes following up on deposits, credit facilities, and other banking services pertinent to
corporate customers.– Treasury: includes providing dealing and treasury services and management of the Bank’s funds.– Financial Brokerage Services: includes providing purchase and sale of customers’ portfolios on their behalf, custody of
investments, financial consultations, custody service, and management of initial public offerings. Info
rmat
ion
for
Ban
k bu
sine
ss s
egm
ents
dis
trib
uted
in a
ccor
danc
e w
ith
the
acti
viti
es
Tota
lO
ther
Fi
nanc
ial
Brok
erag
e Tr
easu
ry
Cor
pora
tion
Indi
vidu
al (
Ret
ail
Cus
tom
ers)
2015
2016
JDJD
JDJD
JDJD
JD
125,
220,
532
127,
449,
022
2,17
9,86
9
790,
548
18,0
27,8
5346
,919
,637
59,5
31,1
15To
tal R
even
ue
(4,0
71,1
90)
(5,6
89,3
34)
--
-
(3,7
99,2
20)
(1,8
90,1
14)
Prov
isio
n fo
r im
pairm
ent
in d
irect
cre
dit
faci
litie
s
121,
149,
342
121,
759,
688
2,17
9,86
979
0,54
818
,027
,853
43,1
20,4
1757
,641
,001
Sect
ors
busi
ness
res
ults
(59,
183,
164)
(59,
444,
280)
(5,4
58,0
92)
(234
,718
)(2
,551
,907
)(1
8,56
3,19
1)(3
2,63
6,37
2)O
ther
exp
ense
s
61,9
66,1
7862
,315
,408
(3
,278
,223
)55
5,83
015
,475
,946
24,5
57,2
2625
,004
,629
Profi
t be
fore
tax
(21,
903,
385)
(20,
113,
384)
418,
100
(1,4
05,7
86)
(3,2
56,2
30)
(7,3
82,3
10)
(8,4
87,1
58)
Inco
me
tax
40,0
62,7
9342
,202
,024
(2,8
60,1
23)
(849
,956
)12
,219
,716
17,1
74,9
1616
,517
,471
Net
pro
fit
Oth
er in
form
atio
n
4,63
4,78
08,
895,
633
6,59
8,99
28,
211
96,7
4374
,255
2,11
7,43
2C
apita
l Exp
endi
ture
s
4,67
4,82
84,
591,
875
1,71
0,58
217
,199
465,
734
205,
575
2,19
2,78
5D
epre
ciat
ion
and
amor
tizat
ion
2,20
6,22
1,87
32,
338,
839,
064
98,2
70,6
747,
784,
877
964,
351,
294
802,
670,
157
46
5,76
2,06
2To
tal A
sset
s
1,83
9,27
6,91
91,
926,
402,
830
63,1
72,9
004,
032,
604
146,
202,
123
383,
142,
312
1,32
9,85
2,89
1To
tal L
iabi
litie
s

106 107
2. Information about Geographical Distribution:This item represents the geographical distribution of the Bank’s activities. The Bank conducts its activities mainly in Jordan, representing local activities. Additionally, the Bank performs international activities through its branches in Palestine and the subsidiary company Bank of Jordan - Syria.
The following is the geographical distribution of the Bank’s revenues, assets, and capital expenses according to geographical location:
Inside the Kingdom Outside the Kingdom Total
2016 2015 2016 2015 2016 2015
JD JD JD JD JD JD
Total Revenues 126,978,242 131,376,085 17,895,403 14,934,679 144,873,645 146,310,764
Total Assets 1,877,695,284 1,809,983,454 461,179,780 396,238,419 2,338,839,064 2,206,221,873
Capital Expenditures
8,648,725 3,638,732 246,908 996,048 8,895,633 4,634,780
42. Analysis of Assets and Liabilities Maturities
December 31, 2016– The following table provides analysis of assets and liabilities according to the expected period of its recovery or settlement: Total Over 1 YearUp to 1 Year
JDJDJDAssets
228,197,81477,810,708150,387,106Cash and balances with Central Banks
494,451,425-494,451,425Balances with banks and financial Institutions
25,000,000-25,000,000Deposits with banks and financial Institutions
205,719205,719-Financial assets at fair value through profit or loss
92,128,33892,128,338-Financial assets at fair value through comprehensive income
---Financial derivatives instruments
1,226,013,033589,452,609636,560,424Direct Credit facilities – Net
172,637,680147,424,23525,213,445Financial assets at amortized cost
11-Investments in associates
29,774,83029,774,830-Property and equipment – Net
3,559,1463,559,146-Intangible assets
11,926,47011,926,470-Deferred tax assets
54,944,60833,389,10421,555,504Other Assets
2,338,839,064985,671,1601,353,167,904TOTAL ASSETS
LIABILITIES
145,623,458-145,623,458Banks and financial institutions’ deposits
1,606,979,130788,289,915818,689,215Customers’ deposits
129,292,10236,674,30892,617,794Cash margins
17,655-17,655Financial instruments divertive
5,016,9924,812,949203,043Sundry provisions
16,842,706-16,842,706Income tax provision
424,879310,411114,468Borrowing money
22,176,9081,811,83220,365,076Other liabilities
1,926,372,830831,899,4151,094,473,415TOTAL LIABILITIES
412,466,234153,771,745258,694,489Net
December 31, 2015Their recoverability or settlement:
Total Over 1 YearUp to 1 Year
JDJDJDAssets
234,500,50772,769,342161,731,165Cash and balances with Central Banks
281,318,7582,175,212279,143,546Balances with banks and financial institutions
155,000,000-155,000,000Deposits with banks and financial institutions
1,095,8281,095,828-Financial assets at fair value through profit or loss
62,655,39962,655,399-Financial assets at fair value through comprehensive income
866,107-866,107Financial derivatives instruments
1,142,237,246488,544,254653,692,992Direct Credit facilities – Net
227,655,707106,037,769121,617,938Financial assets at amortized cost
11-Investments in associates
25,795,45525,795,455-Property and equipment – Net
3,320,3033,320,303-Intangible assets
12,217,57312,217,573-Deferred tax assets
59,558,98953,663,7985,895,191Other Assets
2,206,221,873828,274,9341,377,946,939TOTAL ASSETS
LIABILITIES
123,589,030-123,589,030Banks and financial institutions’ deposits
1,564,886,963636,499,326928,387,637Customers’ deposits
111,171,15266,149,64145,021,511Cash margins
6,226,1656,226,165-Sundry provisions
13,197,654-13,197,654Income tax provision
500,956500,956-Borrowing money
19,704,9992,013,74917,691,250Other liabilities
1,839,276,919711,389,8371,127,887,082TOTAL LIABILITIES
366,944,954116,885,097250,059,857Net
43. Capital Management
Capital Components:
- Paid-up Capital:The paid-up capital of Bank of Jordan consists of (200/1) million ordinary shares at a nominal value of JD 1 per share. The Bank maintains capital, statutory reserves, and retained earnings to meet the growth in its operations and the requirements of branching locally and regionally.
- Regulatory Capital:Regulatory capital is considered a control tool according to the requirements of regulatory authorities and Basel (II) for the purposes of achieving control over the adequacy of capital and the ratio of regulatory capital to risky and weighted assets and market risk. Regulatory capital consists of:•Paid-up capital, legal reserve, voluntary reserve, and retained earnings.•Undisclosed reserves, general banking risks reserve, special reserve subordinated debts, and the positive fair value reserve at 100%
and deduct regulatory adjustments according to Basel III.•Foreign currency translation differences.
- Regulatory Authorities’ Requirements: The regulatory authorities’ instructions entail that the minimum capital shall be JD 100 million. Moreover, banks have been requested to increase their capital adequacy ratio to no less than 12% according to the Central Bank of Jordan instructions. The ratio of owners’ equity to total assets must not be less than 6%.

108 109
- Achieving the Objectives of Capital Management:The Bank’s management aims at achieving the capital management objectives through developing (enhancing) the Bank’s activities, achieving a surplus in operating profits and revenues, and optimally investing available funds. All of this is geared towards reaching the targeted growth in owners’ equity through the increase in the compulsory reserve at 10% of the profits earned, voluntary reserve at 20%, and retained earnings.
During the year 2016, the Bank calculated the organizational capital and capital adequacy according to Basel III in accordance to the instructions issued by Central Bank of Jordan dated October 31, 2016 and cancelling the instructions related to Basel II, the organizational capital as per Base III follows:
December 31, 2016
In Thousands of JD
Regulatory capital for ordinary shares holders (CET 1): JD
Subscribed and paid-up capital 200,000
Statutory reserve 73,917
Voluntary reserve 113
Other reserves 3,331
Fair value reserve 63,566
Retained earnings 27,926
Minority interest in the capital of subsidiaries 3,381
Less: Intangible assets (3,559)
Foreign currency translation (12,402)
Deferred tax assets (11,926)
Total Primary Capital 344,347
Additional Capital Items
General banking risk reserve 12,996
Total additional capital 12,996
Total regulatory capital 357,343
Total risk weighted assets 1,716,372
Capital adequacy ratio (%) 20.82%
Regulatory capital for ordinary shareholders (CET 1) 20.06%
Capital adequacy for first layer (%) 20.06%
The organizational capital and capital adequacy according to standardized methodology for the year 2015 as following:
2015
Primary Capital Items JD
Subscribed and paid-up capital 155,100
Statutory reserve 67,717
Voluntary reserve 13,710
Other reserves 2,922
Retained earnings 42,146
Minority interest in the capital of subsidiaries 777
Less: Intangible assets (3,320)
50% in the investments in banks and insurance companies (2,232)
Total Primary Capital 276,820
Additional Capital Items
Foreign currency translation (11,482)
Financial assets assessment reserve 14,934
General banking risk reserve 12,646
Less: 50% in the investments in banks and insurance companies (2,232)
Total additional capital 13,866
Total regulatory capital 290,686
Total risk weighted assets 1,596,094
Capital adequacy ratio (%) 18.21%
Regulatory capital adequacy ratio (%) 17.34%

110 111
44. F
air
Val
ue H
iera
rchy
A. T
he f
air
valu
e of
fina
ncia
l ass
ets
and
finan
cial
liab
ilitie
s of
the
Ban
k sp
ecifi
ed a
t fa
ir va
lue
on a
n on
goin
g ba
sis:
Som
e fin
anci
al a
sset
s an
d lia
bilit
ies
of t
he B
ank
are
eval
uate
d at
fai
r va
lue
at t
he e
nd o
f ea
ch fi
scal
per
iod,
the
fol
low
ing
tabl
e sh
ows
the
info
rmat
ion
abou
t ho
w t
o de
term
ine
the
fair
valu
e of
the
se fi
nanc
ial a
sset
s an
d lia
bilit
ies
(eva
luat
ion
met
hods
and
inpu
ts u
sed)
.
Fina
ncia
l Ass
ets/
Fina
ncia
l Lia
bilit
ies
Fair
Val
ue
The
Leve
l
of F
air
Val
ue
Eval
uatio
n M
etho
d
and
Inpu
ts U
sed
Impo
rtan
t
Inta
ngib
le In
puts
Rel
atio
n Be
twee
n
the
Fair
Val
ue a
nd
the
Impo
rtan
t
Inta
ngib
le In
puts
Dec
embe
r 31
,
2016
Dec
embe
r 31
,
2015
JDJD
Fina
ncia
l Ass
ets
at F
air
Val
ue
Fina
ncia
l Ass
ets
at F
air
Val
ue T
hrou
gh In
com
e St
atem
ent
Shar
es t
hat
have
an
avai
labl
e m
arke
t pr
ice
122,
600
1,02
7,05
8Le
vel O
ne S
tate
d R
ates
in
finan
cial
mar
kets
D
oes
Not
App
lyD
oes
Not
App
ly
Shar
es t
hat
do n
ot h
ave
an a
vaila
ble
mar
ket
pric
e83
,119
68,7
70Le
vel T
wo
Fin
anci
al S
tate
men
ts
issu
ed b
y co
mpa
nies
Tota
l20
5,71
91,
095,
828
Forw
ard
Con
trac
ts (
Fore
ign
Cur
renc
y) -
86
6,10
7Le
vel O
ne S
tate
d R
ates
in
finan
cial
mar
kets
D
oes
Not
App
lyD
oes
Not
App
ly
Fina
ncia
l Ass
ets
at F
air
Val
ue T
hrou
gh C
ompr
ehen
sive
Inco
me
Shar
es t
hat
have
ava
ilabl
e m
arke
t pr
ice
83,2
74,2
9253
,617
,466
Leve
l One
Sta
ted
Rat
es in
finan
cial
mar
kets
D
oes
Not
App
lyD
oes
Not
App
ly
Shar
es t
hat
do n
ot h
ave
avai
labl
e m
arke
t pr
ice
8,85
4,04
69,
037,
933
Leve
l Tw
o F
inan
cial
Sta
tem
ents
issu
ed b
y co
mpa
nies
D
oes
Not
App
lyD
oes
Not
App
ly
Tota
l92
,128
,338
62,6
55,3
99
Tota
l Fin
anci
al A
sset
s at
Fai
r V
alue
92,3
34,0
5764
,617
,334
Fina
ncia
l Lia
bilit
ies
at F
air
Val
ue
Forw
ard
Con
trac
ts (
Fore
ign
Cur
renc
y)17
655
-
Leve
l One
Sta
ted
Rat
es in
finan
cial
mar
kets
D
oesn
’t A
pply
Doe
sn’t
App
ly
Tota
l Fin
anci
al L
iabi
litie
s at
Fai
r V
alue
17,6
55 -
Ther
e w
ere
no t
rans
fers
bet
wee
n le
vel 1
and
leve
l 2 d
urin
g th
e ye
ar 2
016.
B - The fair value of financial assets and financial liabilities of the Bank (non-specific fair value on an ongoing basis):Except as detailed in the table below, we believe that the carrying amount of financial assets and liabilities shown in the financial statements of the Bank approximate their fair value, because the Bank management believes that the carrying value of the items is equilivant to the fair value, and this is due to either maturity or short-term interest rates that have been repriced during the year.
December 31, 2016 December 31, 2015 The Level of
Book value Fair Value Book value Fair Value Fair Value
Financial Assets of non-specified Fair Value JD JD JD JD JD
Balances at central banks 166,272,023 166,272,023 173,756,768 173,763,000 Level Two
Balances at banks and financial institutions 494,451,425 495,300,577 281,318,758 281,500,129 Level Two
Deposits at banks and financial institutions 25,000,000 25,415,685 155,000,000 156,740,544 Level Two
Loans, bills and other 1,106,590,558 1,108,702,501 1,100,192,093 1,102,675,548 Level Two
Financial assets at amortized cost 172,637,680 173,980,219 227,655,707 229,740,861 Level Two
Other assets 34,705,556 83,584,255 37,373,852 86,260,538 Level Two
Total Financial Assets of Non-specified Fair Value 1,999,657,242 2,053,255,260 1,975,297,178 2,030,680,620
Financial Liabilities of Non-specified Fair Value
Deposits at banks and financial institutions 145,623,458 145,670,169 123,589,030 123,735,494 Level Two
Customers’ deposits 1,606,979,130 1,609,675,022 1,564,886,963 1,568,106,070 Level Two
Cash insurance 129,292,102 129,299,201 111,171,152 111,364,079 Level Two
Total Financial Liabilities of Non-specified Fair Value 1,881,894,690 1,884,644,392 1,799,647,145 1,803,205,643
The fair value for the financial assets and liabilities for the level 2 and level 3 were determined in accordance to an agreed pricing models, which reflects
the credit risk of the parties that are dealing with it.
45. Commitments and Contingent Liabilities
a. Contingent Liabilities:2016 2015
JD JD
Letters of credit 80,542,151 45,308,135
Acceptances 74,535,617 30,657,185
Letters of guarantee:
Payment 31,659,395 28,963,635
Performance 49,829,921 43,153,376
Other 36,076,304 32,531,903
Direct un-utilized credit facilities 86,932,724 136,379,535
Total 359,576,112 316,993,769
b. Contractual Liabilities:2016 2015
JD JD
Contracts for purchasing property and equipment* 1,701,430 2,123,913
Contracts for operating and capital lease** 12,852,163 -
Total 14,553,593 2,123,913
* These commitments mature in less than a year
** These commitments mature between a year to 10 years

112 113
46. Lawsuits against the Bank
The Bank is a defendant in lawsuits demanding cancellation of the Bank’s claims against others, lifting of real estate mortgages, compensation for damages, and non-cashing of cheques. These lawsuits amounted to JD 17,585,485 as of December 31, 2016 (JD 49,926,727 as of December 31, 2015). In the opinion of the management and legal counsel, no material financial liability is likely to be incurred as a result of these lawsuits in excess of provision recorded which amounted to JD 626,715 as of December 31, 2016 (JD 600,801 as of December 31, 2015). However, amounts that will probably be paid by the Bank as a result of dismissal or amicable settlement of these lawsuits will be taken to the consolidated Statement of Income or against the recorded provision when paid.
47. Adoption of New and Revised International Financial Reporting Standards (IFRSs)
4. a. New and revised IFRSs applied with no material effect on the financial statements:The following new and revised IFRSs, which became effective for annual periods beginning on or after January 1, 2016, have been adopted in these financial statements. The application of these revised IFRSs has not had any material impact on the amounts reported for the current and prior years but may affect the accounting for future transactions or arrangements.
•IFRS 14 Regulatory Deferral Accounts.•Amendments to IAS 1 Presentation of Financial Statements relating to Disclosure initiative.•Amendments to IFRS 11 Joint arrangements relating to accounting for acquisitions of interests in joint operations.•Amendments to IAS 16 Property, Plant and Equipment and IAS 38 Intangible Assets relating to clarification of
acceptable methods of depreciation and amortisation.•Amendments to IAS 16 Property, Plant and Equipment and IAS 41 Agriculture: Bearer Plants.•Amendments to IAS 27 Separate Financial Statements relating to accounting investments in subsidiaries, joint ventures
and associates to be optionally accounted for using the equity method in separate financial statements.•Amendments to IFRS 10 Consolidated Financial Statements, IFRS 12 Disclosure of Interests in Other Entities and
IAS 28 Investment in Associates and Joint Ventures relating to applying the consolidation exception for investment entities.
•Annual Improvements to IFRSs 2012 – 2014 Cycle covering amendments to IFRS 5, IFRS 7, IAS 19 and IAS 34.
4. b. New and revised IFRSs in issue but not yet effective and not early adoptedThe Bank has not yet applied the following new and revised IFRSs that have been issued but are not yet effective:
New and revised IFRSs Effective for annual periods beginning on or after
Annual Improvements to IFRS Standards 2014 – 2016 Cycle amending IFRS 1, IFRS 12 and IAS 28
The amendments to IFRS 1 and IAS 28 are effective for annual periods beginning on or after January 1, 2018, the amendment to IFRS 12 for annual periods beginning on or after January 1, 2017
Amendments to IAS 12 Income Taxes relating to the recognition of deferred tax assets for unrealized losses
January 1, 2017
Amendments to IAS 7 Statement of Cash Flows to provide disclosures that enable users of financial statements to evaluate changes in liabilities arising from financing activities.
January 1, 2017
IFRIC 22 Foreign Currency Transactions and Advance ConsiderationThe interpretation addresses foreign currency transactions or parts of transactions where:There is consideration that is denominated or priced in a foreign currency; The entity recognises a prepayment asset or a deferred income liability in respect of that consideration, in advance of the recognition of the related asset, expense or income; and The prepayment asset or deferred income liability is non-monetary.
January 1, 2018
Amendments to IFRS 2 Share Based Payment regarding classification and measurement of share based payment transactions.
January 1, 2018
Amendments to IFRS 4 Insurance Contracts: Relating to the different effective dates of IFRS 9 and the forthcoming new insurance contracts standard.
January 1, 2018
Amendments to IAS 40 Investment Property: Amends paragraph 57 to state that an entity shall transfer a property to, or from, investment property when, and only when, there is evidence of a change in use. A change of use occurs if property meets, or ceases to meet, the definition of investment property. A change in management’s intentions for the use of a property by itself does not constitute evidence of a change in use. The paragraph has been amended to state that the list of examples therein is non-exhaustive.
January 1, 2018
Amendments to IFRS 7 Financial Instruments: Disclosures relating to disclosures about the initial application of IFRS 9.
When IFRS 9 is first applied
IFRS 7 Financial Instruments: Disclosures relating to the additional hedge accounting disclosures (and consequential amendments) resulting from the introduction of the hedge accounting chapter in IFRS 9.
When IFRS 9 is first applied
IFRS 16 LeasesIFRS 16 specifies how an IFRS reporter will recognise, measure, present and disclose leases. The standard provides a single lessee accounting model, requiring lessees to recognise assets and liabilities for all leases unless the lease term is 12 months or less or the underlying asset has a low value. Lessors continue to classify leases as operating or finance, with IFRS 16’s approach to lessor accounting substantially unchanged from its predecessor, IAS 17.
January 1, 2019
Amendments to IFRS 10 Consolidated Financial Statements and IAS 28 Investments in Associates and Joint Ventures (2011) relating to the treatment of the sale or contribution of assets from and investor to its associate or joint venture.
Effective date deferred indefinitely
IFRS 9 Financial Instruments (revised versions in 2009, 2010, 2013 and 2014).IFRS 9 issued in November 2009 introduced new requirements for the classification and measurement of financial assets. IFRS 9 was subsequently amended in October 2010 to include requirements for the classification and measurement of financial liabilities and for derecognition, and in November 2013 to include the new requirements for general hedge accounting. Another revised version of IFRS 9 was issued in July 2014 mainly to include a) impairment requirements for financial assets and b) limited amendments to the classification and measurement requirements by introducing a ‘fair value through other comprehensive income’ (FVTOCI) measurement category for certain simple debt instruments.
A finalised version of IFRS 9 which contains accounting requirements for financial instruments, replacing IAS 39 Financial Instruments: Recognition and Measurement. The standard contains requirements in the following areas:
Classification and measurement: Financial assets are classified by reference to the business model within which they are held and their contractual cash flow characteristics. The 2014 version of IFRS 9 introduces a ‘fair value through other comprehensive income’ category for certain debt instruments. Financial liabilities are classified in a similar manner to under IAS 39, however there are differences in the requirements applying to the measurement of an entity’s own credit risk.
Impairment: The 2014 version of IFRS 9 introduces an ‘expected credit loss’ model for the measurement of the impairment of financial assets, so it is no longer necessary for a credit event to have occurred before a credit loss is recognised.
Hedge accounting: Introduces a new hedge accounting model that is designed to be more closely aligned with how entities undertake risk management activities when hedging financial and non-financial risk exposures.
Derecognition: The requirements for the derecognition of financial assets and liabilities are carried forward from IAS 39.
January 1, 2018
Amendments to IFRS 15 Revenue from Contracts with customers to clarify three aspects of the standard (identifying performance obligations, principal versus agent considerations, and licensing) and to provide some transition relief for modified contracts and completed contracts.
January 1, 2018

114 115
IFRS 15 Revenue from Contracts with CustomersIn May 2014, IFRS 15 was issued which established a single comprehensive model for entities to use in accounting for revenue arising from contracts with customers. IFRS 15 will supersede the current revenue recognition guidance including IAS 18 Revenue, IAS 11 Construction Contracts and the related interpretations when it becomes effective.
The core principle of IFRS 15 is that an entity should recognize revenue to depict the transfer of promised goods or services to customers in an amount that reflects the consideration to which the entity expects to be entitled in exchange for those goods or services. Specifically, the standard introduces a 5-step approach to revenue recognition:Step 1: Identify the contract(s) with a customer.Step 2: Identify the performance obligations in the contract.Step 3: Determine the transaction price.Step 4: Allocate the transaction price to the performance obligations in the contract.Step 5: Recognise revenue when (or as) the entity satisfies a performance obligation.
Under IFRS 15, an entity recognises when (or as) a performance obligation is satisfied, i.e. when ‘control’ of the goods or services underlying the particular performance obligation is transferred to the customer. Far more prescriptive guidance has been added in IFRS 15 to deal with specific scenarios. Furthermore, extensive disclosures are required by IFRS 15.
January 1, 2018
Management anticipates that these new standards, interpretations and amendments will be adopted in the Bank’s consolidated financial statements as and when they are applicable and adoption of these new standards, interpretations and amendments, except for IFRS 9, IFRS 15 and IFRS 16, may have no material impact on the consolidated financial statements of the Bank in the period of initial application.
Management anticipates that IFRS 15 and IFRS 9 will be adopted in the Bank’s consolidated financial statements for the annual period beginning January 1, 2018 and that IFRS 16 will be adopted in the Bank’s financial statements for the annual period beginning January 1, 2019.
The application of IFRS 15 and IFRS 9 may have significant impact on amounts reported and disclosures made in the Bank’s consolidated financial statements in respect of revenue from contracts with customers and the Bank’s financial assets and financial liabilities and the application of IFRS 16 may have significant impact on amounts reported and disclosures made in the Bank’s consolidated financial statements in respect of its leases.

116 117
2016Additional Information as Required bythe Jordan Securities Commission
Names and Brief Résumés of Board of Directors and Executive Managers
Major Shareholders’ Equity
Board of Directors’ Equity
Executive Managers’ Equity
Addresses of Bank of Jordan Branches
Organizational Structure

118 119
Additional Information as Required by the Jordan Securities Commission 2016
A. Chairman’s Letter
B. Board of Directors Report
1. a- Description of Main Activities:The Bank provides a comprehensive range of banking products and services. These include accepting all types of deposits (demand, savings, and time deposits), and issuing certificates of deposit, letters of credit, as well as letters of guarantee to all clients in the various economic sectors locally and abroad. The Bank also provides financial leasing services.
1. b- Location of Branches and Number of Employees:The Bank has 71 branches and 10 exchange offices in Jordan, in addition to 14 branches and one office in Palestine. The address of each branch and office is listed at the end of the report under the section “Addresses of Bank of Jordan branches”.
The total number of the Bank’s employees reached 1,920. The table below illustrates the number of employees in each branch and office.
BranchNo. of
EmployeesBranch
No. of Employees
BranchNo. of
EmployeesBranch
No. of Employees
Head Office 926 Wadi Al Seer 8 Aqaba 12 Al Rabieh 8
Regional Management 175 Deir Abi Saeed 7 Al Bayader 9 Abdoun 12
Shmeisani 20 Sweileh 9Industrial Area –
Al Bayader 8
Hurrieh St.–Moghablain 8
Amman 7 Al Fuheis 8 Al Rawnaq 9
Karak 7 Abu Nsair 7 Al Mafraq 10 Sport City 8
Irbid 15 Madaba 10 North Azraq 5 Taj Mall 14
Al Hussun St. 10 First Circle 10 Jabal Al Weibdeh 7 North Hashmi 6
Eidoun St. 7 Airport 4 Tareq 9 Sahab 6
Ma’an 8 Hakama St., Irbid 11 Zarqa Free Zone 8 Ramallah 24
Rumtha 8 Zarqa 9 Marj Al Hamam 7 Hebron 18
Al Turrah 5 Faisal St., Zarqa 9 Al Jeezah 7 Jenin 21
Salt 9 New Zarqa 7 Ras Al Ain 8 Nablus 24
Jerash 10 North Shuneh 8 Al Yasmeen 9 Gaza 16
Al Mahatta 8 Kufranjah 5 Sweifieh 12 Al Ram 7
Yarmouk St.– Al Nasser 7 Al Qweismeh 11 Al Wehdat 9 Al Eizaryeh 7
Marka 13 Third Circle 7 Jabal Al Shamali 8 Industrial Area, Ramallah 5
Ajloun 9 Mecca St. 14 Dwrat Khalda 13 Bethlehem 11
Jabal Al Hussein 13 University of Jordan 7 Al Ruseifa 8 Tulkarm 8
Al Khalidi 6 Thirty St. /Irbid 10Al Madina Al
Monawara /Tlaa Al Ali
9 Qabatiya 7
Al Jubaiha 10 Al Nuzha 7 Abu Alanda 10 Rafidia 5
Commercial Market 8 Gardens 19 Khalda 10 Al Naser 11
Abdali Mall 14 Al Madina Al Monawara St. 8 City Mall 14 Al Ersal 6
1. c- Capital Investment Volume: JD 405.4 million as of December 31st, 2016.
2. Subsidiaries:a. Bank of Jordan - Syria / Syrian Arab Republic
Name of Company Bank of Jordan - Syria
Type of Company Joint Stock Company
Date of Association 28/5/2008
Core Business All Banking Operations
Paid-up Capital SYP 3,000,000,000
Bank’s Ownership Percentage 49%
AddressSabaa Bahrat Square, Baghdad St. - DamascusP.O. Box 8058 Damascus, Syria Tel.: 00963-11-22900000 / 00963-11- 22900229Fax: 00963-11-2315368
Number of Employees 218 employees
Branch Location and Number of Employees Baghdad St. BranchDamascus- Sabaa Bahrat Square Tel.: 00963-11-22900000P.O. Box 8058 Damascus, SyriaAbu Rumaneh Branch - DamascusDamascus - Arab League SquareTel.: 00963-11-3354500P.O. Box 8058 Damascus, SyriaAbaseen Branch Damascus - Abaseen Square Tel.: 00963-11-4645322P.O. Box 8058 Damascus, SyriaJarmana BranchAl Raees Square - Damascus SuburbanTel.: 00963-11-22911221P.O Box: 8058 Damascus, SyriaHarasta Branch (Temporarily closed)Harasta - Damascus SuburbanTel.: 00963-11-5376711P.O. Box 8058 Damascus, SyriaSahnaya Branch (Temporarily closed)Sahnaya - Damascus SuburbanTel.: 00963-11-63900333P.O. Box 8058 Damascus, SyriaAl Faisal St. Branch / AleppoAleppo - Al Malek Faisal St.Tel.: 00963-21-2228070P.O. Box 8058 Damascus, SyriaBaroon Branch / AleppoAleppo - Baroon St. Tel.: 00963-21-2126996P.O. Box 8058 Damascus, SyriaAlazeziah Branch / AleppoAleppo - Alazeziah Area - Alzahraa Cinema St. Tel.: 00963-21-2122667P.O Box 8058 Damascus, SyriaAl Hamdanieh Branch / Aleppo (Temporarily closed)Aleppo – Martini HotelTel.: 00963-21-5120152P.O. Box 8058 Damascus, SyriaLattakia Branch Lattakia - Al-Korneish Al-Gharbee St. Tel.: 00963-41-457166P.O. Box 8058 Damascus, SyriaHoms BranchHoms - Square 94, Abou Tammam St.Tel.: 00963-31-2220605P.O. Box 8058 Damascus, SyriaTartous BranchAl Thawra St. - TartousTel.: 00963-43-313733P.O. Box 8058 Damascus, SyriaAl-Swaidaa BranchQanawat St. - SwaidaaTel.: 00963-16-324188P.O. Box 8058 Damascus, Syria
Fax: 00963-11-2317730Employees: 10
Fax: 00963-11-3354506Employees: 13
Fax: 00963-11-4645326Employees: 8
Employees: 5
Fax: 00963-11-5376717Employees: None
Fax: 00963-11-8140614Employees: None
Fax: 00963-21-2228081Employees: 7
Fax: 00963-21- 2125985Employees: 4
Fax: 00963-21-2125672Employees: 4
Fax: 00963-21-5120156Employees: None
Fax: 00963-41-456768Employees: 12
Fax: 00963-31-2222305Employees: 6
Fax: 00963-43-313793Employees: 8
Fax: 00963-16-324288Employees: 9
Projects Owned by the Bank and their Capitals There are no projects owned

120 121
Chai
rman
Com
plia
nce
and
Anti
Mon
ey L
aund
erin
g D
ept.
Audi
t Com
mitt
ee
Inte
rnal
Aud
it D
ept.
Risk
Com
mitt
ee
Risk
Man
agem
ent D
ept.
Corp
orat
e G
over
nanc
e, N
omin
atio
nan
d Re
mun
erat
ions
Com
mitt
eeBo
ard
Com
mitt
ee
Gen
eral
Man
ager
Boar
d Se
cret
ary
Shar
ehol
ders
' Affa
irs
Lega
l Cou
nsel
Org
aniza
tiona
l Stru
ctur
e/Ba
nk o
f Jor
dan-
Syria
Rem
edia
l and
Col
lect
ion
Div.
Lega
l Div.
Rem
edia
l and
Col
lect
ion
Dep
t.
Fina
ncia
l Ins
titut
ion
Dep
t.
Corp
orat
e Co
mm
unica
tion
and
Rese
arch
Dep
t.
Reta
il Ba
nkin
g D
ept.
Corp
orat
e D
ept.
Bank
ing
Busin
ess
Dev
elop
men
t Man
agem
ent
Prov
ision
and
Rep
orts
Con
trol D
iv.
Cred
it Re
view
Div.
Cred
it D
ept.
Inte
rnal
Ban
king
Con
trolle
r
Inte
rnal
Con
trol D
iv.
Secr
etar
y
Inve
stm
ent D
iv.
Trea
sury
Div.
Trea
sury
and
Inve
stm
ent D
ept.
Cent
ral P
roce
ssin
g D
ept.
Info
rmat
ion
Tech
nolo
gy D
ept.
Fina
ncia
l D
ept.
Cent
ral T
rade
Fin
ance
Dep
t.
Cent
ral O
pera
tions
Man
agem
ent
Boar
d of
Dire
ctor
s
b. Jordan Leasing Company - Limited Private Shareholding / Hashemite Kingdom of Jordan
Name of Company Jordan Leasing Company
Type of Company Limited Private Shareholding Company
Date of Association 24/10/2011
Core Business Financial Leasing
Paid-up Capital JD 20,000,000
Bank’s Ownership Percentage 100%
Address
Amman - Mecca St. - Al-Husseini Complex - Bldg. No. 164P.O. Box 2140 Amman 11181 Jordan Tel.: 00962 6 5542697 Fax: 00962 6 5542698
Number of Employees 2 employees
Branches None
Projects Owned by Company and their Capitals There are no projects owned
Organizational Structure / Jordan Leasing Company
Chairman Board of Directors
General Manager
Marketing &Customer Service
Accounting Checking & Processing
Internal Auditor
Legal Consultant

122 123
C. Excel for Financial Investments - Limited Private Shareholding Company / Hashemite Kingdom of Jordan
Name of Company Excel for Financial Investments Company
Type of Company Limited Private Shareholding Company
Date of Association 23/3/2006
Core Business Brokerage services (Buying and Selling Securities)
Paid-up Capital JD 3,500,000
Bank’s Ownership Percentage 100%
Address
Amman - Mecca St. - Al-Husseini Complex - Bldg. No. 164P.O. Box 942453 Amman 11194 JordanTel.: +962 6 5519309 Fax:+962 6 5519567
Number of Employees 8 employees
Branches None
Projects Owned by Company and their Capitals There are no projects owned
Organizational Structure / Excel for Financial Investments Company
Board of Directors
Audit committee
Internal Auditor
Compliance Officer Legal Consultant
Chairman
Executive Manager
BrokerageDepartment
Investment Department
Financial ControlDepartment
3.a- Names and Resumes of Board of Directors:
Mr. Shaker Tawfiq FakhouriChairman & CEO
Date of Birth: 14/11/1969 Date of Appointment: 21/1/1995 Date of Membership: 14/6/2001Nature of Membership: Executive / Non-independent
Educational Background: – M.A. in Business Administration and Professional Accounting from Canisius College, Buffalo / USA, 1995.
– B.A. in Economics from the University of Southern California / USA, 1990.
Professional Experience: – Chairman and CEO of Bank of Jordan, as of 8/2007. – General Manager of Bank of Jordan, as of 8/2003. – Deputy General Manager of Bank of Jordan, from 12/1996 until 8/2003. – Executive Assistant to the General Manager of Bank of Jordan, from 1/1995 until 12/1996. – Attended several advanced banking and leadership seminars and courses, including:
• The “Comprehensive Banking Operations” training program at Bank of Jordan branches, from 2/1991 until 1/1993.
• A specialized credit training course at the Headquarters of Manufacturers/ Hanover Bank, USA, from 9/1990 until 2/1991.
Other Current Board Memberships: – Chairman of the Board of Directors of Bank of Jordan – Syria. – Chairman of the Board of Directors of Excel for Financial Investments Co. – Member of the Board Investment Fund for Yarmouk University. – Member of the Board of Trustees – King Abdullah II Center for Excellence. – Board Member of the Association of Banks in Jordan until 12/2016. – Board Member of the Middle East Company for Insurance.
Dr. Abdel Rahman Samih Toukan Vice Chairman of the Board of Directors
Date of Birth: 5/2/1935 Date of Membership: 31/5/1997 Nature of Membership: Non-Executive / Non-Independent
Educational Background: – PhD in Economics from Vanderbilt University / USA, 1967. – M.A. in Economics from Vanderbilt University / USA, 1959. – B.A. in Economics from the American University of Beirut/ Lebanon, 1958.
Professional Experience: – Former Chairman of the Board of Directors of Amman Stock Exchange, from 2000 until 2004. – Former General Manager of Jordan Ahli Bank, from 1976 until 1997. – Former General Manager of the National Real Estate Company in Kuwait, from 1974 until 1976. – Deputy General Manager of Jordan Ahli Bank, from 1971 until 1974. – Former Director General of the Import, Export, and Supply Department / Government of Jordan, from 1969 until 1970.
– Head of planning Department, in the Jordanian Development Board, from 1961 until 1969.
Former Board Memberships: – Former Chairman of the Board of Directors of Amman Stock Exchange. – Board Member of the Jordan Cement Factories Company. – Board Member of the Industrial Development Bank. – Board Member of Jordan Ahli Bank. – Committee Member of Jordan Commercial Bank (previously Jordan Gulf Bank). – Board Member of Jordan Hotels & Tourism Company.
.

124 125
Mr. Yahya ZakaryiaAl-KadamaniBoard Member
Date of Birth: 1/1/1957 Date of Membership: 7/3/2009Nature of Membership: Non-Executive / Non-Independent
Educational Background: – B.A. in Business Administration from Minnesota University / USA, 1979.
Professional Experience: – Vice Chairman of the Board of Directors of Arab Islamic Bank / Palestine, as of 1993 to date.
– Manager of the Holy Lands Tourist Company – General Agents for Alitalia / Jordan, from 1979 until 2004.
Former Board Memberships: – Vice Chairman of the board of Directors of Arab Islamic Bank / Palestine. – Board Member of Jordan Express Tourist Transportation Company (JETT), from 1981 until 1999.
– Board Member of the International Tobacco and Cigarettes Company. – Board Member of Al-Ekbal Printing & Packaging Company.
Dr. Mazen Mohammed Al-Bashir Board Member
Date of Birth: 6/7/1955 Date of Membership: 22/10/2008Nature of Membership: Non-Executive/ Non-Independent
Educational Background: – M.Sc. in Family Medicine, London University / UK, 1990. – Membership of the Royal College of Family Physicians / UK, 1987. – M.B, B.Ch. in Medicine from Cairo University / Egypt, 1980.
Professional Experience: – Founder and Director of the Jordan Center of Family Medicine, as of 10/1991. – Family Physician in the private sector, as of 1992. – Part-time Lecturer at Liverpool University, University of Jordan, and Jordan University of Science and Technology, during the period between 1987 until 2000.
– President of the Jordanian Society of Family Physicians, serving several terms from 7/1993 until 2012.
Other previous Board Memberships: – Board Chairman and Chief Executive Officer of the Consultant and Investment Group Company (Istishari Hospital) since 6/2007 until 1/2016.
Dr. Yanal Mawloud Naghouj Board Member
Date of Birth: 13/12 /1956 Date of Membership: 22/10/2008Nature of Membership: Non-Executive / Independent
Educational Background: – B.A. in Literature / Philosophy and Social Studies from Beirut Arab University/Lebanon, 1986.
– B.Sc. in Medicine and Surgery from Alexandria University / Egypt, 1987.
Mr. “Shadi Ramzi” Abd Al-Salam Al-MajaliBoard Member
Date of Birth: 6/7/1962 Date of Membership: 7/3/2009 Nature of Membership: Non-Executive / Independent
Educational Background: – M.Sc. in Software Engineering (Computer Science / Systems Analysis) from George Washington University, Washington D.C. / USA, 1985.
– B.Sc. in Mathematics & Military Sciences from The Citadel USA – The Military College of South Carolina / USA, 1983.
Professional Experience: – CEO of New Vision for Electronics as of 3/2015 to date. – CEO of King Abdullah II Design and Development Bureau, from 7/2010 until 5/2014. – CEO of Aqaba Development Corporation, from 1/2010 until 7/2010. – General Manager of Saraya Aqaba, from 2/2007 until 12/2009. – Revenues and Customs Commissioner in Aqaba Special Economic Zone Authority (ASEZA), from 1/2004 until 2/2007.
– Gulf Area Manager of Qatar for the Middle East Contracting Company, from 9/2002 until 12/2003.
– Tala Bay CEO, from 10/2000 until 9/2002. – General Manager of Trans Jordan for Communications Services Company, from 5/1997 until 9/2000.
– General Manager of Al-Nisr for Advanced Telecommunications Company, from 2/1997 until 11/2003.
– Vast military experience, serving in the military, from 1985 until 1996.
Other Current Board Memberships: – Member of the Board of Trustees - Mutah University, as of 11/2014. – Board Member of Jordan Investment Trust, as of 7/2014.
Former Board Memberships: – Chairman of the board of the King Abdullah II Design & Development Bureau (KADDB) from 12/2010 until 5/2014.
– Member of the Board of Trustees - The Royal Tank Museum. – Member of the Board of Trustees - Jordan University for Science and Technology (JUST). – Member of the Board of Aqaba Water Company, from 1/2010 until 8/2010. – Member of the Board of the Aqaba Port and Containers Company, from 1/2010 until 8/2010.
– Member of the Board of Directors of Aqaba Airports Company, from 1/2010 until 8/2010. – Member of the Board of Trustees - Mutah University, from 11/2009 until 8/2010. – Member of the Board of Trustees - Applied Sciences University, from 1/2006 until 10/2009.
– ASEZA Commissioner, from 1/2004 until 2/2007. – Board Member of Jordan Electricity Distribution Company, from 6/2006 until 3/2007. – Board Chairman of Aqaba International School, from 6/2006 until 2/2007. – Board Member of the Yemeni Payphone Company, from 9/1998 until 9/2000. – Board Member of the Middle East Defense and Security Agency, from 8/1997 until 11/2003.
– Vice Chairman of the King Abdullah Special Operation Training Center (KASOTC), from 12/2010 until 2/2013.
– Member of Greater Amman Municipality Council, from 8/2010 until 8/2013.

126 127
Mr. Haitham Abu Nasr Al MuftiBoard Member / Representative ofAl - EKBAL Jordanian General Trading (LLC)
Date of Birth: 17/9/1950 Date of Membership: 7/3/2009Nature of Membership: Non-Executive / Non-Independent
Educational Background: – B.Sc. in Automotive Engineering from the University of Chelsea / UK, 1975.
Professional Experience: – Former Board Chairman of King Abullah II Design and Development Bureau, from 2004 until 2006.
Other Current Board Memberships: – Board Member of the International Company of Science and Technology.
Former Board Memberships: – Board Member of Alfa for Mining and Technology. – Board Chairman of Al Weibdeh for Tourist Restaurants Co. – Member of the Association Committee of King Abdullah II Design and Development Bureau.
– Board Member of the Royal Automobile Museum. – Vice Chairman of the Special Operations Forces Exhibition and Conference (SOFEX). – Member of the Royal Commission for Motor Sports. – Board Chairman of CLS Company / Jordan. – Board Chairman of JoSecure International Company. – Board Chairman of Jordan Electronic Logistics Support.
Mr. Ammar MahmoudAbu Namous Board Member/Representative of Al Pharaenah Int’l for Industrial Investment Co.
Date of Birth: 16/12/1968 Date of Membership: 16/6/2011Nature of Membership: Non-Executive / Non-Independent
Educational Background: – B.A. in Law from the University of Jordan, 1992.
Professional Experience: – Advocate since 1994 to date. – International Court of Justice – STL. / Member as of 1/2012 to date. – Vast experience in different fields, including:
• Local and international Market Mergers and acquisition.• Administration buy-outs and private company sales.• Re-organization of private equity and venture capital investments.• Joint ventures.• International Arbitration.• Dealing and consulting with Swiss private Banking concerning foreign investment
and family Trusts.
Current Board Memberships in Other Companies: – Board Member / Jordan Decapolis Properties Company.
Previous Board Memberships in Other Companies: – Member in the Board of executives / Raya Jet Aviation. – Board Member / Jordan Decapolis for Private Investments Company. – Board Member / Al Saytara for Investments. – Board Member / Al Juman for Investments. – Chairman of Ahyaa Amman for the rehabilitation and development of property Representative of Jordan Decapolis properties Company.
– Board Member of Ma’in Hot Spring Resort Company. – Board Member / Al Daman Al-Mumayaz Tourism investment.
Mr. Haitham MohammedSamih Barakat Board Member
Date of Birth: 1/5/1960 Date of Membership: 30/7/2015Nature of Membership: Non-Executive / Non-Independent
Educational Background: – B.Sc. in Electrical Engineering from the Portland State University / USA, 1984.
Professional Experience: – General Manager of the Advanced Engineering Group / Jordan, as of 2007 to date. – Founder and CEO of Quartz Electro Mechanic Company / Ras Al-Khaima, UAE, as of 2006 to date.
– Founder and partner of the Advanced Electrical Engineering Company / Qatar, as of 2001 to date.
– CEO of Kuwait Electrical Poles & Lighting Industries Company WLL (KEPLIC) / Kuwait, as of 1999 to date.
– Founder and CEO of the Qatar Electromechanical Company / Qatar, as of 1998 to date. – Founder and CEO of Faddan Electromechanical Contracting Company / Jordan, from 1994 until 1997.
– Deputy General Manager of the National Industries Company / Jordan, from 1/2004 until 7/2004.
– Deputy General Manager of Faddan for Trading and Contracting Company / Kuwait, from 1984 until 1990.
Other Current Board Memberships: – Founding Member of the Clean Energy Company / Jordan.
Former Board Memberships: – Board Member of the Arab Islamic Bank / Palestine. – Board Member of the United Cable Industries Company / Jordan. – Board Member of Al-Saqr Insurance Company.
Professional Experience Acquired from Private Business: – Over 30 years of experience in Jordan, the Gulf, and the USA including founding and managing various engineering companies in several countries.
Other Professional Experience: – Experience in project management and development.
Mr. Husam RashedRashad Manna’Board Member
Date of Birth: 6/9/1963 Date of Membership: 30/7/2015Nature of Membership: Non-Executive / Independent
Educational Background: – Master of Business Administration (MBA) from California State University, Chico/USA 1989. – Bachelor of Science, Business Administration from California State University, Chico/USA 1987.
Professional Experience: – Chief Commercial Officer of Shams Ma’an Power Generation Co. as of 10/2015 to date. – Portfolio Manager / Private business, as of 5/2004 to date. – General Manager of Aqaba Manufacturing & Refining Vegetable Oils CO. (AMRV), from 5/2011 until 5/2013.
– Member of the Auditing Committee of Al Janoub Filter Manufacturing Company (AJFM), from 5/2008 until 10/2010.
– Portfolio Manager at Arab Banking Corporation / Investment Department, from 3/2002 until 4/2004.
– Corporate Head / Manager at Arab Banking Corporation / Credit Facilities Department, from 9/2000 until 2/2002.
– Senior International Credit Officer / Supervisor at Arab Bank Plc. / Credit Facilities Division - Int’l Branches & Assoc. Co., from 7/1994 until 5/2000.
– Credit Officer / Section Head at Arab Bank Plc. - Mahatta Branch / Credit Facilities Dept., from 6/1991 until 6/1994.
– Account Executive at Metropolitan Life - San Francisco / California, USA, from 6/1989 until 6/1990.
Former Board Memberships: – Member of the Board of Directors of Al Janoub Filter Manufacturing Company (AJFM) from 5/2008 until 10/2010.
– Member of the Board of Directors of Real Estate Investment Compound Company from 3/2002 until 4/2004.

128 129
Mr. Mohammad Anwar HamdanBoard Member
Date of Birth: 5/12/1949 Date of Membership: 30/7/2015Nature of Membership: Non-Executive / Independent
Educational Background: – MBA in international Management from Thunderbird University / USA, 1979. – B.A. in Accounting from the University of Jordan, 1973.
Professional Experience: – Deputy General Manager of Bank of Jordan from 1/2007 until 6/2012. – Assistant General Manager / Credit Management / Bank of Jordan, from 11/1994 until 1/2007.
– Assistant General Manager / Credit Management / Cairo Amman Bank, from 1/1990 until 11/1994.
– Senior Manager / Credit Management / Bank of Jordan, from 8/1985 until 12/1990. – Assistant Manager for Investment & Branches/Jordan Kuwait Bank, from 7/1979 until 8/1985.
– Senior Financial Analyst / Central Bank of Kuwait, from 5/1976 until 5/1978. – Financial Analyst / Central Bank of Jordan, from 8/1973 until 5/1976.
Former Board Memberships: – Board Member in Ready Mix Concrete & Construction Supplies Company - representing Bank of Jordan.
– Board Member in Baton for Concrete Blocks and Interlocking Tiles Company - representing Bank of Jordan.
b- Names and Resumes of Senior Executive Managers
Mr. Saleh Rajab Hammad* AGM / Chief Risk Officer.* Board Secretary
Date of Birth: 27/7/1962 Date of Appointment: 27/7/2015
Educational Background: – B.Sc. in Computer Science from University of Jordan, 1985.
Professional Experience: – AGM / Chief Risk Officer, as of 7/2015 to date. – AGM / Chief Risk Officer, from 12/2014 until 5/2015. – Executive Manager / Compliance and Risk Department at Bank of Jordan, from 1/2009 until 12/2014.
– Manager of Compliance and Operational Risk Department at Bank of Jordan, from 12/1994 until 12/2008.
– Long-standing experience in auditing and operations. – Attended several courses on risk management and the Basel II requirements organized in Jordan and abroad.
– Holds several professional certificates including CCO, and CORE certificates.
Other Current Board Memberships: – Chairman of the Jordan Leasing Company. – Vice Chairman of Excel Investment Company from 12/2016 . – Board Member of Bank of Jordan – Syria from 12/2016 – Board Member of Al Ekbal Investment Co. (PLC). – Board Member of the Association of Banks in Jordan from 12/2016.
Dr. Nasser Mustafa KhraishiAGM / Chief Operating Officer
Date of Birth: 25/4/1962 Date of Appointment: 9/4/2014
Educational Background: – PhD in Electrical Engineering / Control Theory / Stanford University / USA, 1990. – M.Sc. in Engineering Economic systems / Stanford University / USA, 1985. – B.Sc. in Electrical Engineering / Kuwait University / Kuwait, 1984.
Professional Experience: – AGM / Chief Operating Officer, as of 12/2014 to date. – Executive Manager / Capital Markets Department, from 4/2014 until 12/2014. – General Manager / Monere LLC / California, from 2011 until 2014. – Assistant General Manager / Operations and Information Systems / Bank Al Etihad, from 2009 until 2011.
– Assistant General Manager / Information Systems / Jordan Kuwait Bank, from 2004 until 2009. – Held several executive / senior positions in several research and consulting firms offering services in Information Systems / USA, from 1988 until 2004.
Other Current Board Memberships: – Board Member of Al-Eqbal Investment Co. (PLC). – Board Member of Excel for Financial Investments Co.
Mr. Osama Samih SukkariLegal Advisor
Date of Birth: 27/4/1955 Date of Appointment as a Legal Advisor: 28/4/2015
Educational Background: – B.A. in Law from Beirut Arab University / Lebanon, 1977.
Professional Experience: – Legal Advisor, Bank of Jordan as of 4/2015 to date. – Legal Advisor & Head of legal Department, Bank of Jordan from 4/1994 until 4/2015. – Extensive experience in Legal consultations and lawsuits, as of 1981.
Other Current Board Memberships: – Board Member of Bank of Jordan – Syria. – Board Member of Pharma International Company.
Former Board Memberships: – Vice Chairman of the Board of Directors of Jordan Leasing Company. – Member of the Insurance Council of the Social Security Corporation. – Board Member of Excel for Financial Investments Company. – Board Member of Al-Mowahadah for Transportation Company. – Board Member of the National Industries Company. – Board Member of Al-Takamolyeh Investments Company. – Board Member of Al-Shamikha for Real Estate Investments Company.
Mrs. Rabab Jamil AbbadiExecutive Manager /Human Resources Department.
Date of Birth: 10/12/1963 Date of Appointment: 7/9/2015
Educational Background: – MBA - Marketing / Coventry University / UK, 2003. – B.Sc. in Chemical Engineering / Baghdad University / Iraq, 1987.
Professional Experience: – Executive Manager / HR Department / Bank of Jordan, as of 9/2015 to date. – Executive Manager / HR Department / Bank of Jordan, from 9/2009 until 7/2015. – Acting Manager / Financial Control Department / Bank of Jordan, from 8/2014 until 1/2015. – Head of HR / Bahrain and Egypt / Standard Chartered Bank, from 9/2006 until 8/2009. – Head of HR / LEVANT / Standard Chartered Bank, from 9/2004 until 8/2006. – Worked for Great Plains in the Middle East in several positions including HR Products Manager, from 10/2000 until 8/2002.
– HR Senior Officer/ The American University of Sharjah / UAE, from 7/1999 until 10/2000. – Credit Officer / Bank Al Etihad, from 9/1996 until 5/1999. – Credit Officer / Industrial Development Bank, from 4/1991 until 8/1996. – Chemical Engineer / Intermediate Petrochemicals Industries (IPI), from 11/1988 until 11/1990.

130 131
Mr. Turki Yousef Al-Jabour Executive Manager /Internal Audit Department
Date of Birth: 9/10/1952 Date of Appointment: 1/11/1994
Educational Background: – B.A. in Accounting from the University of Jordan, 1976.
Professional Experience: – Vast experience in auditing and banking, including:
• Executive Manager / Internal Audit Department, Bank of Jordan as of 1/2009 to date.
• Manager of Internal Audit Department at Bank of Jordan, from 12/2007 until 1/2009.
• Manager of Bank of Jordan / Amman Branch, from 4/2006 until 12/2007.• Manager of Internal Audit Department at Bank of Jordan, from 11/1994 until
4/2006.• Senior Inspector at Cairo Amman Bank, from 1/1987 until 10/1994.• Huge experience in auditing and accounting gained through years of work
with major auditing firms, including Al-Sha’er Auditing Firm.• Lecturer on Banking Operations and Auditing at training courses organized by
Bank of Jordan.• Attended several advanced courses and seminars on administration and banking.
Mr. DumamMohammad KhraisatExecutive Manager /Central Operations Department
Date of Birth: 20/12/1972 Date of Appointment: 1/7/2015
Educational Background: – MA in Accounting / University of Jordan / Jordan, 1996. – BA in Accounting / University of Jordan / Jordan, 1994.
Professional Experience: – Executive Manager / Central Operations Management as of 7/2015 to date. – Executive Manager / Central Operations Management from 3/2015 until 5/2015. – Manager Processes Reengineering Department / Bank of Jordan, from 11/2005 until 2/2015.
– Manager / Operations Engineering Department / Bank of Jordan, from 6/2005 until 11/2015.
– Manager / Banking Operations Department / Bank of Jordan, from 1/6/2005 until 13/6/2005.
– Head of the Program Testing Unit / Bank of Jordan, from 8/2004 until 5/2005. – Branch Assistant Manager / Bank of Jordan / Marka Branch, from 11/2003 until 8/2004
– Supervisor of the Branches Management Department / Bank of Jordan, from 10/2002 until 11/2003.
– Internal Auditor / Internal Audit Department / Bank of Jordan, from 3/1998 until 10/2002.
– Internal Auditor / Internal Audit Department / Cairo Amman Bank, from 1994 until 1998.
Mr. Hatem Nafi’ FoqahaaRegional Manager /Palestine Branches Management
Date of Birth: 4/5/1965 Date of Appointment: 28/1/1992
Educational Background: – MA in Accounting / University of Jordan / Jordan, 1993. – BA in Accounting / Birzeit University / Palestine, 1989.
Professional Experience: – Regional Manager / Palestine Branches Management / Bank of Jordan, as of 1/2015 to date.
– Acting Regional Manager / Palestine Branches Management / Bank of Jordan, from 3/2014 until 12/2014.
– Assistant Regional Manager / Palestine Branches Management/Bank of Jordan, from 7/2012 until 3/2014.
– Credit Manager / Palestine Branches / Bank of Jordan, from 8/2010 until 7/2012. – Manager / Ramallah Branch / Bank of Jordan, from 9/2001 until 8/2010. – Assistant Manager / Ramallah Branch / Bank of Jordan, from 5/1999 until 9/2001.
– Supervisor of the Letters of Credit and Guarantee Department / Bank of Jordan, from 10/1996 until 5/1999.
– Letters of Credit and Guarantee Officer / Bank of Jordan, from 1/1992 until 10/1996.
Mr. Nader Mohammad SarhanExecutive Manager /Credit Review Management
Date of Birth: 7/10/1967 Date of Appointment: 28/10/2007
Educational Background: – MA in Accounting from the Arab Academy for Banking and Financial Sciences / Jordan, 2002. – BA in Accounting from Mansoura University / Egypt, 1990.
Professional Experience: – Executive Manager / Credit Review Management / Bank of Jordan, as of 12/2014 to date. – Manager / Credit Department (Corporate, commercial, branches abroad) / Bank of Jordan, from 4/2013 until 12/2014.
– Manager / Credit Department (Corporate and branches abroad) / Bank of Jordan, from 11/2007 until 4/2013.
– Head of Credit Review (specialized Lending) / the Housing Bank for Trade and Finance, from 6/2005 until 10/2007.
– Team Leader of the Commercial Credit Department / the Housing Bank for Trade and Finance, from 10/2004 until 6/2005.
– Manager / Commercial Credit / Commercial Credit Department/ The Housing Bank for Trade and Finance, from 9/2003 until 10/2004.
– Head of the Companies Accounts / Jordan Commercial Bank, from 10/2002 until 9/2003. – Head of Commercial Credit Relations / the Commercial Credit Department / The Housing Bank for Trade and Finance, from 1992 until 10/2002.
Mr. Mousa Yousef MousaTreasurer / Treasury & Investment Department
Date of Birth: 13/2/1980 Date of Appointment: 31/3/2016
Educational Background: – BA in Accounting / Al Zaytoonah University / Jordan, 2002.
Professional Experience: – Treasurer / Treasury and Investment Department / Bank of Jordan, as of 3/2016 to date. – Treasurer / Treasury and Investment Department / Bank of Jordan, as of 3/2014 to 1/2016. – Chief Trader / Treasury and Investment Department / Bank of Jordan, from 2007 until 2/2014. – Dealer / Treasury and Investment Department / Cairo Amman Bank, from 2002 until 2007.
Ms. Lana Fayez Al-BarrishiManager / Compliance Department
Date of Birth: 30/7/1980 Date of Appointment: 29/11/2015
Educational Background: – BA in Business Administration / University of Jordan / Jordan, 2002.
Professional Experience: – Manager / Compliance Department / Bank of Jordan, as of 11/2015 to date. – Manager / Compliance Department / Bank of Jordan, from 6/2014 until 9/2015. – Head of the Anti-Money Laundering and Combating Financing Terrorism Unit / Bank of Jordan, from 2011 until 5/2014.
– Officer / the Anti-Money Laundering and Terror Financing Unit / Cairo Amman Bank, from 2009 until 2011.
– Customer Service Officer / Cairo Amman Bank, from 2002 until 2009. – Certified Anti-Money Laundering specialist CAMS. – Certified Anti-Corruption Manager CACM. – Member Of International Compliance Association (ICA).

132 133
Mr. Hani Hasan MansiManager / Financial Control Department
Date of Birth: 30/6/1981 Date of Appointment: 1/2/2015
Educational Background: – Bachelor Degree in Accounting, Applied Sciences University 2005, Amman, Jordan.
Professional Experience: – Manager / Financial Control Department / Bank of Jordan as of 3/2016 to date. – Acting manager / Financial Control Department / Bank of Jordan as of 2/2015 to 2/2016.
– Manager - External Audit Division - Deloitte & Touche M.E, Amman / Jordan from 6/2012 until 2014.
– Assistant manager - External Audit Division - Deloitte & Touche M.E, Amman / Jordan from 12/ 2011 until 5/2012.
– Supervisor - External Audit Division - Deloitte & Touche M.E, Amman / Jordan from 12/2010 until 11/2011.
– Senior 2 - External Audit Division - Deloitte & Touche M.E, Amman / Jordan from 6/2010 until 11/2010.
– Senior 1 Auditor - External Audit Division - Deloitte & Touche M.E, Amman / Jordan from 6/2009 until 5/2010.
– Acting Senior Auditor - External Audit Division - Deloitte & Touche M.E, Amman / Jordan from 6/2008 until 5/2009.
– Semi Senior Auditor - External Audit Division - Deloitte & Touche M.E, Amman / Jordan from 6/ 2007 until 5/ 2008.
– Junior level - External Audit Division - Deloitte & Touche M.E, Amman / Jordan from 12/2005 until 5/2007.
Other Professional Experience: – Financial Consultant – Binladin Holding Company, Jeddah / Saudi Arabia from 2014 until 2015.
Other Current Board Memberships: – Board Member of Jordan Leasing Company. – Board Member of Excel for Financial Investment.
Mr. Nicola Yousef BahouExecutive AGM / Chief BusinessOfficer To 15/12/2016
Date of Birth: 17/7/1965 Date of Appointment: 1/10/2015
Educational Background: – M.A. in Enterprise Management from Durham University / UK, 2006. – B.A. in Banking and Finance from the Ahliyya Amman University / Jordan, 2004.
– Diploma in Banking and Finance from the Institute of Banking Studies / Jordan, 1987.
Professional Experience: – Executive AGM / Chief Business Officer, since 10/2015 to 12/2016. – Executive AGM / Chief Business Officer, since 12/2014 to 7/2015. – Executive AGM / Chief Operating Officer at Bank of Jordan, since 3/2013 until 12/2014.
– AGM / Chief Operating Officer at Bank of Jordan, since 5/2005 until 2/2013. – Held many executive and administrative positions at HSBC Bank, from 1983 until 2005.
– Member of the Chartered Management Institute of London.
Former Board Memberships: – Board Member of Jordan Express Tourist Transportation Company (JETT). – Vice chairman of the Board of directors of Excel for Financial Investments Company until 12/2016.
– Board Member of Bank of Jordan – Syria until 12/2016.
4. S
hare
hold
ers
who
ow
n 1%
or
mor
e of
the
Ban
k’s
shar
es (
2016
& 2
015)
:
Nam
eN
atio
nalit
yN
o. o
f Sh
ares
20
16
Perc
enta
ge
2016
No.
of
Shar
es
2015
Perc
enta
ge
2015
The
ulti
mat
e be
nefi
ciar
y of
sha
res
201
6
The
stat
us
of s
hare
s 20
16*
Mr.
Taw
fiq S
hake
r Fa
khou
riJo
rdan
ian
46,4
90,8
2023
.245
%36
,286
,204
23.3
95%
Him
self
Part
ially
m
ortg
aged
(1
5,59
6,76
7)
Al-
Ekba
l Jor
dani
an G
ener
al T
radi
ng
(LLC
)Jo
rdan
ian
25,7
35,7
5312
.867
%19
,958
,077
12.8
67%
Mr.
Taw
fiq S
hake
r Fa
khou
riM
rs. N
i’mat
Taw
fiq F
akho
uri
-
Al P
hara
enah
Int’
l for
Indu
stria
l In
vest
men
ts C
o.Jo
rdan
ian
19,7
65,8
639.
882%
15,3
28,4
279.
882%
Mr.
Lai
th B
in G
haith
Bin
Ras
had
Phar
aon
Mrs
. Dim
a Bi
nt G
haith
Bin
Ras
had
Phar
aon
Mr.
Wae
l Bin
Gha
ith B
in R
asha
d Ph
arao
h M
rs. L
ana
Bint
Gha
ith B
in R
asha
d Ph
arao
n
Part
ially
m
ortg
aged
(6
,095
,860
)
Al A
raka
for
Inve
stm
ents
Co.
Jord
ania
n12
,236
,424
6.11
8%9,
489,
347
6.11
8%M
r. W
alid
Taw
fiq F
akho
uri
Mr.
Sam
er T
awfiq
Fak
hour
i-
Liby
an F
orei
gn B
ank
Liby
an9,
090,
909
4.54
5%7,
050,
000
4.54
5%-
-
Mr.
Gra
eme
Alla
h B
in R
adda
d A
l-Za
hran
iSa
udi A
rabi
a8,
033,
561
4.01
6%6,
230,
027
4.01
6%H
imse
lf-
Mr.
Rafi
q Bi
n M
oham
med
Abd
ul Q
adir
Saud
i Ara
bia
6,37
9,29
03.
189%
4,94
7,14
03.
189%
Him
self
-
Mrs
. Aw
atef
Moh
amm
ed
Al M
asri
Jord
ania
n5,
603,
766
2.80
1%4,
345,
721
2.80
1%H
erse
lf-
Mr.
Hus
sni J
alal
Al K
urdi
Jord
ania
n3,
914,
653
1.95
7%3,
035,
814
1.95
7%H
imse
lf-
Mrs
. Mah
aN
asri
Kha
lil N
asse
rJo
rdan
ian
3,00
0,00
01.
500%
1,99
7,53
21.
287%
Her
self
-
Al-
Yam
ama
For
Gen
eral
Inve
stm
ents
Co.
Jord
ania
n2,
490,
648
1.24
5%1,
898,
325
1.22
3%M
r. W
alid
Taw
fiq F
akho
uri
Mr.
Sam
er T
awfiq
Fak
hour
i -
Mr.
Sad
diq
Om
ar H
ashe
m A
bu S
eedo
Jo
rdan
ian
2,06
5,73
81.
032%
--
Him
self
-
*The
sta
tus
of s
hare
s 20
16 (
fully
or
part
ially
mor
tgag
ed).

134 135
5. Competitive Position of the Bank and its Market Share:Mentioned within the Bank’s achievements in 2016 (page 19).
6. Dependence on Specific Suppliers or Key Clients (Locally or Abroad):
No. Name of Suppliers Percentage of Total Supplies
1 Spectrum International For Renewable Energy 11.56%
There is no dependence on specific key clients (whether locally or abroad), who account for 10% or more of the Bank’s total sales.
7. - The Bank does not have any governmental protection, or any privileges, nor do any of its products or services, as stated by laws and regulations or others.
– The Bank has not obtained any patents or concession rights.
8. - There are no decisions issued by the government or international organizations or any other entity that would have any material effect on the Bank’s operations, products, or competitive capabilities. – The Bank adheres to all laws, regulations, and international standards that are related to its business. – International Quality Standards do not apply to the Bank.
9. A- An Organizational Structure of the Bank and its Subsidiaries:- Bank of Jordan Organizational Structure can be found on the last (page 159).- Bank of Jordan – Syria Organizational Structure can be found on (page 120).- Jordan Leasing Company Organizational Structure can be found on (page 121).- Excel Company Organizational Structure can be found on (page 122).
B. Number of Employees and Educational Qualifications:
Academic Qualification
No. of Employees / Bank of Jordan
No. of Employees / Bank of Jordan –
Syria
No. of Employees / Jordan Leasing
Co.
No. of Employees / Excel for Financial
Investments Co.
PhD 1 - - -
Master’s Degree 79 12 1 2
Higher Diploma 6 1 - -
Bachelor’s Degree 1,355 145 1 5
Diploma 257 32 - -
General Secondary Education
72 10 - -
Pre-secondary Education
150 18 - 1
Total 1,920 218 2 8
C. Details of Training Programs in 2016:
Description No. of Courses No. of Participants
In-house Courses (organized by the Bank’s Training Department) 1692 2533
External Courses 52 94
Total 1744 2627
Areas of Training:
Topic No. of Courses No. of Participants
Banking 291 1228
Compliance and Risk Management 1361 995
Administrative Skills 61 256
Professional Certificates 5 9
Financial & Audit 10 14
Others 16 125
Total 1744 2627
10. Description of Risks:Mentioned within the Corporate Government on (page 150). These risks include:
Credit Risk: This risk arises from the probable inability and/or lack of desire of the borrower or third party to fulfill its obligations at the specified time. These risks include on-consolidated financial statements items such as loans and bonds and off-consolidated financial statements items such as guarantees and/or documentary credits causing financial losses to the Bank.
Operational Risk: This risk arises from the inefficiency or failure of internal operations, employees, or systems or it may stem from external events including legal risks.
Compliance Risk: This arises from the probable failure by the Bank to comply with (violate/transgress) the prevailing laws, regulations, instructions, banking laws (including the Bank’s internal policies), and code of ethics issued by international and local regulatory authorities.
Liquidity risk: Represents the Bank’s inability to make available the necessary funding to meet its obligations on their maturity dates or to finance its activities without incurring high costs or losses moreover, liquidity risks are divided into two types:
Funding Liquidity Risk: This risk represents the Bank’s inability to change assets into cash – such as the collection of receivables – or to obtain funding to meet its obligations.
Market Liquidity Risk: This risk represents the Bank’s inability to sell the assets in the market or selling the asset at a huge financial loss due to weak liquidity or demand in the market.
Market risks: Are the risks of exposure of the positions on and off the Bank’s Consolidated Statement of Financial Position to losses as a result of price fluctuations in the market. This includes the risks arising from the volatility of interest rates and stock prices of investment portfolios, both for the purpose of trading or exchange.
Interest rate risks: – Currency exchange rate risks (Dealing with Foreign Currency). – Fluctuation in share price risks. – Goods risks.
Market risks arise from: – Changes that may occur in the political and economic conditions in the markets. – Fluctuations in interest rates. – Fluctuations in the prices of financial instruments, held for future buying and selling. – Gaps in the maturities of assets and liabilities and interest rate re-pricing. – Creation of uncovered positions.
Information Security Risk: Defined as any potential threat that may lead to failure in confidentiality, availability, and integration of the Bank’s information.
Interest Rate Risk: This risk arises from the probable impact of changes in interest rates on the value of other financial assets. The Bank is exposed to this risk due to a mismatch or a gap in the amounts of assets and liabilities, according to the various time limits or review of interest rates in a certain period.

136 137
Foreign Currency Risks: Are the risks arising from changes in the values of financial instruments as a result of fluctuations in the prices of foreign currencies using good policy to manage its foreign currency positions.
Share Price Risks: Result from the changes in the fair values of investments in shares.
11. Bank Achievements in 2016:Mentioned in the Board of Directors’ Report under a separate section (page 18), supported with figures and a description of the Bank’s main events in 2016.
12. There is no financial impact of non-recurring operations during 2016 and no intervention in the Bank’s main activities.
13. Realized Profits/Losses, Dividends, Bank Shareholders’ Equity, and the Closing Price of Share 2012-2016:
Financial Indicators for the past five years (2012-2016) In JD (Thousand)
Fiscal Year
Bank Shareholders’
Equity
Non-Controllers‘
Interest
Net Profit Before Tax
Cash Dividends Distribution of Bonus Shares
Closing Price of
Share (JD)Amount %
2012 276,510 14,267 46,222 23,265 15% - 2.30
2013 316,986 4,506 50,204 23,265 15% - 2.50
2014 335,746 4,116 59,999 31,020 20% - 2.65
2015 362,242 4,703 61,966 31,020 20% 44,900 2.60
2016 405,447 6,989 62,315 36,000 18% - 2.88
2015 Recommendation to distribute JD 44.9 million/share in 19/4/2016
14. Analysis of Bank’s Financial Position and Business Results for the Year 2016:Mentioned in the Board of Directors’ Report, under a separate section (page 26). Below are the main financial ratios:
No. Financial Ratios 2016 2015
1 Return on Average Shareholders’ Equity 10.78% 11.70%
2 Return on Capital 20.70% 20.42%
3 Return on Average Assets 1.82% 1.86%
4 Profitability per Employee (After tax) JD 19,647 JD 19,677
5 Interest Income to Average Assets 4.84% 5.08%
6 Interest Expense to Average Assets 0.75% 0.95%
7 Interest Margin to Average Assets 4.08% 4.13%
8 Non-Performing Loans to Total Credit Facilities 4.59% 5.94%
15. The Bank’s Future PlanThe Bank’s strategic future plans, projects, and the Board of Directors’ projections, are all mentioned within Bank of Jordan’s Goals for 2017, listed under a separate section (page 35).
16. Auditors’ Remuneration (for Bank of Jordan and its Subsidiaries):
Statement Auditors’ Remuneration (JD)
Bank of Jordan 127,062
Bank of Jordan – Syria 20,565
Excel For Financial Investments Company 5,246
Jordan Leasing Company 2,900
Total 155,773
Auditors were paid an amount of JD 13,920 in 2016, against other consulting services.
17. Statement of the Number of Financial Securities Issued by the Bank:A. Number of Shares Owned by Members of the Board of Directors and/or their Relatives:
Name Status NationalityNo. of Shares
2016 2015
Mr. Shaker Tawfiq Fakhouri Chairman & CEO Jordanian 6,447 5,000
Mrs. Suha Faisal Sroor Wife Jordanian 133,658 50,000
Aya Shaker Fakhouri Daughter Jordanian - -
Tala Shaker Fakhouri Daughter Jordanian - -
Sarah Shaker Fakhouri Daughter Jordanian - -
Salma Shaker Fakhouri Daughter Jordanian - -
Tamara Shaker Fakhouri Daughter Jordanian - -
Tawfiq Shaker Fakhouri Son Jordanian 351,000 -
Dr. Abdel Rahman Samih ToukanVice Chairman of the Board of
DirectorsJordanian 117,383 91,031
Mr. Yahya Zakariya Al-Kadamani Board Member Jordanian 1,300,000 952,000
Mrs. Amal Amin Al-Turk Wife Jordanian 300,000 205,000
Dr. Mazen Mohammad Al-Bashir Board Member Jordanian 138,039 107,050
Dr. Farihan Fakhri Al Barghouti Wife Jordanian 51,579 39,347
Dr. Yanal Mawloud Naghouj Board Member Jordanian 6,447 5,000
Mrs. Dana Kayd Zagha Wife Jordanian 724,585 544,494
Mr. «Shadi Ramzi» Abd Al-Salam Al-Majali Board Member Jordanian 10,000 14,100
Al-Ekbal Jordanian General Trading (LLC) Board Member Jordanian 25,735,753 19,958,077
Mr. Haitham Abu Nasr Al-MuftiRepresentative of
the CompanyJordanian - -
Al Pharaenah Int’l for IndustrialInvestments Co.
Board Member Jordanian 19,765,863 15,328,427
Mr. Ammar Mahmoud Abu NamousRepresentative of
the CompanyJordanian - -
Mr. Haitham Mohammed Samih Barakat Board Member Jordanian 6,615 5,130
Mrs. Dina Mohammed Al Qaq Wife Jordanian - 51
Mr. Husam Rashed Manna’ Board Member Jordanian 6,447 5,000
Mr. Mohammad Anwar Hamdan Board Member Jordanian 31,447 5,000

138 139
B. Number of Shares Owned by the Executive Managers and/or their Relatives:
Name Status NationalityNo. of Shares
2016 2015
Mr. Saleh Rajab HammadAGM / Chief Risk Officer
Board SecretaryJordanian 42,079 28,755
Dr. Nasser Mustafa KhraishiAGM / Chief Operating
OfficerJordanian 1,000 4
Saleen Nasser Khraishi Daughter Jordanian 2,500 1,000
Mr. Osama Samih Sukkari Legal Advisor Jordanian 106,950 28,655
Mrs. Najwa Mohammad Saeed Manku Wife Jordanian 116,267 88,537
Mrs. Rabab Jamil AbbadiExecutive Manager / Human
Resources DepartmentJordanian - -
Mr. Turki Yousef Al-JabourExecutive Manager /
Internal Audit DepartmentJordanian 61,000 36,000
Mr. Dumam Mohammad KhraisatExecutive Manager / Central
Operations DepartmentJordanian - -
Mr. Hatem Nafi’ FoqahaaRegional Manager / Palestine Branches
Palestinian - -
Mr. Nader Mohammad SarhanExecutive Manager / Credit
Review ManagementJordanian 41,500 14,570
Mrs. Nida’a Hasan Abu Zahra Wife Jordanian 9,000 8,000
Shaker Nader Sarhan Son Jordanian 2,952 2,290
Mr. Mousa Yousef MousaTreasurer / Treasury &
Investment DepartmentJordanian - -
Mrs. Lana Fayez Al BraishiManager / Compliance
DepartmentJordanian - -
Mr. Hani Hasan MansiManager / FinancialControl Department
Jordanian - -
Mr. Nicola Yousef BahouExecutive AGM / Chief Business Officer until
15/12/2016 Jordanian 216,250 115,000
C. Companies Controlled by the Chairman, Board Members, the Executive Managers and/or their Relatives, and the Number of Shares Held by Those Companies in Bank of Jordan for the Years 2016 and 2015:
Name Position Company
Equity Share in Bank of Jordan
2016 2015
Mr. Shaker Tawfiq FakhouriChairman &
CEOShaker Fakhouri & Associates Co. 32,529 25,227
Mr. “Shadi Ramzi” Abd Al-Salam Al-Majali
Board Member
New Vision for Electronicsand Electrical Application
- -
Jordan Investment Trust Plc. - Jordinvest 11,089 8,600
Mr. Haitham Abu Nasr Al-Mufti Board
MemberAlfa for Mining and Technology Co. - -
Mr. Ammar Mahmoud Abu Namous
Board Member
Tryada for International Investment - -
Mr. Haitham Mohammed Samih Barakat
Board Member
Lighting Industries Company WLL (KEPLIC) / Kuwait
- -
Mr. Osama Samih Sukkari Legal AdvisorOsama Sukkari & Associates –
Attorneys at Law- -
There are no companies controlled by other Board Members and/or their relatives nor by the Executive Managers and/or their relatives.
18. The Benefits and Remuneration of the Board Chairman, Board Members, and Executive Managers:
A. Benefits and Remuneration of the Chairman and Board Members for the Year 2016:
Name Position Annual Salary
Transport Allowance
Remuneration Total
Mr. Shaker Tawfiq Fakhouri Chairman & CEO 400,176 30,000 424,648 854,824
Dr. Abdel Rahman Samih ToukanVice Chairman of the
Board of Directors - 30,000 5,000 35,000
Mr. Yahya Zakariya Al-Kadamani Board Member - 30,000 5,000 35,000
Dr. Mazen Mohammed Al-Bashir Board Member - 30,000 5,000 35,000
Dr. Yanal Mawloud Naghouj Board Member - 30,000 5,000 35,000
Mr. “Shadi Ramzi» AbdAl-Salam Al-Majali
Board Member - 30,000 5,000 35,000
Mr. Haitham Abu Nasr Al-Mufti
Board Member / Representative of
Al-Ekbal Jordanian General Trading (LLC)
- 30,000 5,000 35,000
Mr. Ammar MahmoudAbu Namous
Board Member / Representative of
Al Pharaenah Int’l for Industrial Investments Co.
- 30,000 5,000 35,000
Mr. Haitham MohammedSamih Barakat
Board Member - 30,000 5,000 35,000
Mr. Husam Rashed Manna’ Board Member - 30,000 2083 32,083
Mr. Mohammad Anwar Hamdan Board Member - 30,000 2083 32,083
Total 400,176 330,000 468,815 1,198,991
The Board of Directors acknowledge that they didn’t receive any benefits or remunerations either personally or from related parties whether cash or in kind other than mentioned above.

140 141
B. Benefits and Remuneration of the Executive Managers for the Year 2016
NamePosition
Annual Salary
Remuneration
Allowance for Transportation & Assuming Board
Secretary Position Transportation
Total
JD JD JD JD
Mr. Saleh Rajab Hammad
*AGM / Chief Risk Officer
*Board Secretary142,500 36,088 18,000 196,588
Dr. Nasser Mustafa khraishi
AGM / Chief Operating
Officer100,980 26,941 - 127,921
Mr. Osama Samih Sukkari
Legal Advisor 192,016 52,118 - 244,134
Mrs. Rabab Jamil AbbadiExecutive Manager/ Human
Resources Department.102,578 22,724 - 125,302
Mr. Turki YousefAl-Jabour
Executive Manager / Internal
Audit Department 57,358 17,492 - 74,850
Mr. Dumam Mohammad Khraisat
Executive Manager / Central
Operations Department60,886 13,118 - 74,004
Mr. Hatem Nafi’ Foqahaa
Regional Manager / Palestine
Branches92,110 - - 92,110
Mr. Nader Mohammad Sarhan
Executive Manager / Credit
Review Management84,124 28,015 - 112,139
Mr. Mousa Yousef Mousa
Manager / Treasury &
Investment Department33,076 6,447 - 39,523
Mrs. Lana Fayez Al-Braishi
Manager / Compliance
Department27,998 7,561 - 35,559
Mr. Hani Hasan MansiManager / Financial Control
Department31,540 4,509 - 36,049
Mr. Nicola Yousef BahouExecutive AGM / Chief
Business Officer until
15/12/2016
230,922 76,241 - 307,163
Total 1,156,088 291,254 18,000 1,465,342
19. Balances and transactions with Subsidiaries
Item Year
CONSOLIDATED STATEMENT OF FINANCIAL POSITION CONSOLIDATED
STATEMENT OF INCOME
Assets Liabilities
Deposits
Balances
and current
account
Banks
depositsDeposits
Borrowed
moneyInterest &
Commissions
income
Interest &
Commissions
expense
JD JD JD JD JD JD
Balances and transactions 2016 4,467,345 5,357,264 7,078,429 3,609,725 28,891 5,246,345
Balances and transactions 2015 3,945,663 8,081,925 946,020 - 37,638 1,192,430
These balances and transactions with subsidiaries are eliminated from the Bank’s consolidated financial statements and are shown for
reference only.
20. Donations, Grants, and Contribution to the Local Community:
The Bank’s donations and support of activities related to the protection of the environment and the local community stood at JD 568 thousand, as detailed below:
Activity Amount (JD)
Supporting the Maaelsama Association 54,671
Supporting the National Financial and Social Education Program 51,700
Supporting the Children’s Museum 45,833
«Bank of Jordan University Scholarships Fund» / Ministry of Higher Education and Scientific Research
42,881
Supporting the Giza Municipality 25,000
Supporting The Jordanian Hashemite Fund For Human Development 25,000
Supporting Social and Charitable Organizations and Activities 177,088
Educational Activities Supporting 54,755
Supporting Cultural Activities 36,162
Supporting Environmental Activities 20,500
Sports Activities Supporting 26,573
Miscellaneous 7,691
Total 567,854
21. Contracts, Projects and Commitments Signed Between the Bank and its Subsidiaries, Affiliates, Chairman, Board Members, the General Manager, Employees in the Bank or their Relatives:
On another front, the Bank has assigned “Excel for Financial Investments Company” to manage the Bank’s investment portfolio against annual management fees. No other contracts have been signed between the Bank and any of its subsidiaries or affiliates or with the Board Chairman/Director General or board members or with any bank employee or their relatives. This is with the exception of the normal banking transactions - disclosed in note No. (39) on the financial statements - to which commercial interest and commission rates apply. All credit facilities granted to the concerned entities are classified as performing loans against which no provisions have been allocated.

142 143
22. Bank’s Contribution to Environmental Protection and Corporate Social Responsibility:
A. Bank’s Contribution to the Protection of Environment:The Bank has continued to provide environmental support to many stakeholders. In support of environmental activities, the Bank and the Arab Society for the Protection of Nature have implemented an afforestation campaign in the Balqa governorate area to increase the green area and combat desertification in Jordan. The Bank also supported the (Back to the Future) initiative for the production of art pieces made of natural wool, thus contributing to the creation of employment opportunities for residents in these areas.
B. Bank’s Corporate Social ResponsibilityIn line with the Bank’s strategic objectives towards the environment and society, the Bank will continue to serve the community and take care of social and cultural activities, charity, and support many charities and volunteers, as well as support education, rural education and humanitarian activities.
The Bank’s major achievements in the service of the community included Bank of Jordan’s continued focus on the education sector. The Bank continued to support initiatives that deal with education, presenting ten grants to the Faculty of Educational Sciences and Arts – UNRWA. In addition, the Bank continued to implement the Jordan University Fund in cooperation with the Ministry of Higher Education and Scientific Research and continued to support a student at King’s Academy. The Bank’s partnership with the Children’s Museum continued for the eighth year.
This is in addition to the Bank’s interest in researchers, schools and various institutions, and cooperation with them in providing the required information to compleate their studies, and supporting the project of spreading the community financial culture in cooperation with the Central Bank of Jordan. The Bank also continued to provide support to a number of institutions and associations in the charitable and humanitarian fields, the most important of which is the donation of charity campaign in cooperation with the Jordanian Hashemite Fund for Human Development. The Bank also supported the “Goal for Life” tournament organized by the King Hussein Cancer Center, which will contribute to the continuity of the Center in providing services to patients. In addition, the Bank supported the Society for the Water of the Disabled through the purchase of Braille Sense U2 devices to serve the blind students, which allows the creation and reading of files in different languages.
Mentioned within the Bank’s achievements in 2016 (page 24)
C. Annual Financial Statements - 2016The Bank’s annual financial statements, audited by the Bank’s auditors Deloitte and Touche (Middle East-Jordan), and Kawasmy & Partners Co. (KPMG), and a comparison with the previous year (2016), can be found in the second part of the report (Page 45).
D. Report of the Bank’s AuditorsThe report from the Bank’s auditors, Deloitte and Touche, and Kawasmy & Partners Co. (KPMG), which include the Bank’s annual financial statements, reveals that the audit process was conducted in accordance with international auditing standards. It can be found at the beginning of the 2016 annual financial statements (Page 38 ).
E. AcknowledgmentAs per Paragraph (E)/Article (4) of the Disclosure and Accounting Standards Instructions issued by the Jordan Securities Commission Board of Commissioners:
1. The Board of Directors of Bank of Jordan concedes that, to the best of its knowledge and belief, there are no material matters that may affect the continuity of the Bank’s operations during the fiscal year 2017.
2. The Board of Directors of Bank of Jordan acknowledges responsibility for the preparation of the 2016 financial statements and that the Bank operates an effective monitoring and evaluation system.
3. The Chairman & CEO and the Financial Control Manager acknowledge that the information and data mentioned in the Bank of Jordan 2016 Annual Report are true, accurate, and complete.

144 145
CorporateGovernance

146 147
Bank Commitment to the Corporate Governance Guide
Realizing that good corporate governance is a key to success, the Bank’s Board of Directors is keen on applying corporate governance practices that comply with the regulations issued by the Central Bank of Jordan and the Corporate Governance Guide for banks in Jordan. These practices, which have been incorporated into the Bank of Jordan Corporate Governance Guide, also comply with the best international practices recommended by the Basel Committee. It is worth noting that Bank of Jordan also adheres to regulatory requirements and guidelines in other countries where it operates.
It is worth noting that the Bank conducts periodic reviews of this Guide, and whenever the need arises, to ensure that it captures the Bank’s changing needs as well as developments in the banking industry. The Corporate Governance Guide is included in the annual report, alongside a separate report for the general public (shareholders) on the Bank’s compliance with provisions of the Guide.
Component One (Board of Directors)
- Chairman of the Board:Regulations of the Corporate Governance Guide, regarding the position of the Chairman of the Board, state the following:
1. Separation between the Chairman of the Board and the General Manager positions.
2. There should be no kinship (up to the fourth degree) between the Chairman of the Board (president) and the General Manager.
3. The tasks and duties/responsibilities entrusted to the Board Chairman shall be based on by written instructions that are approved by the Board, and shall not be in conflict with the enforced banking laws and regulations.
The continuation of the policies of the Bank aimed to meet the application of the Corporate Governance Guide of Bank of Jordan, which was prepared based on the instructions of the corporate governance requirements for banks no. 58/2014 dated 30/9/2014.
The Bank seeks to work to meet these requirements in order to serve the interests of the Bank and in accordance with the Jordanian banking business environment, legislative, legal and regulatory frame works of the banks in this regard, the Chairman of the Board of Directors holds an executive post (general Manager) and this not consistent with the item (1) above.
Board of Directors:
While the Executive Management is responsible for running daily operations of the Bank, the Board is in charge of drawing up strategies that best serve the interests of the Bank, its shareholders and clients, in accordance with respective laws and regulations. The board shall consist of 11 members who will be elected by the general assembly to a four-year term. The members shall have the expertise and qualifications that shall enable each of them to voice his/her opinion independently during board discussions. The suitability of board members has been assessed against the policy related to board members’ suitability in line with the requirements of the Corporate Governance Guide, and adjustments/corrections have been made accordingly. The board Chairman shall be elected by the board members.
The board convened (9) times during 2016. The board has a specific agenda in each meeting, and the minutes of meetings and decisions are officially documented by the Board Secretary.
Names of the Board Members:
Name Status No. of AttendanceLoan Balance for the Board Member
Mr. Shaker Tawfiq Fakhouri Chairman of the Board 8 5,874
Dr. Abdel Rahman Samih Toukan Vice Chairman of the Board 7 199
Mr. Yahya Zakariya Al-Kadamani Member 8 3,880,803
Dr. Mazen Mohammed Al-Bashir Member 9 65,636
Dr. Yanal Mawloud Naghouj Member 9 -
Mr. “Shadi Ramzi” Abd Al-Salam Al-Majali Member 9 57,646
Mr. Haitham Abu Nasr Al-Mufti Member 8 549
Mr. Ammar Mahmoud Abu Namous Member 4 5,942
Mr. Haitham Mohammed Samih Barakat Member 6 -
Mr. Husam Rashed Manna’ Member 9 -
Mr. Mohammad Anwar Hamdan Member 8 93
Mr. Saleh Rajab HammadBoard Secretary /
Committee Rapporteur9 -
The Committees of the Board:
As per the Corporate Governance Guide, five committees stem from the Board of Directors to ease implementation of responsibilities. The committees are as follows: the Audit Committee, the Corporate Governance and Strategy Committee, the Nominations and Remunerations Committee, the Risk Management Committee, and the Executive Committee.
The Audit Committee:
Three Board Members were elected to the audit committee on the condition that the majority of the committee members including the head are independent (non-executive) members. All committee members shall have academic qualifications, and shall enjoy suitable practical experience in accounting, finance, or any other related specialization.
The Audit Committee consists of the following: Status No. of Attendance
Mr. “Shadi Ramzi” Abd Al-Salam Al-Majali Head of the Committee 9
Mr. Haitham Abu Nasr Al-Mufti Member 7
Mr. Mohammad Anwar Hamdan Member 8
Mr. Saleh Rajab Hammad Board Secretary/Committee Rapporteur 9
The Audit Committee held (9) meetings in 2016.However, the Audit Committee does not substitute for the responsibilities of the Board of Directors or the Bank’s Executive Management for the supervision and adequacy of the Bank’s internal control system.

148 149
The Corporate Governance and Strategy Committee:
The corporate governance and institutional strategy committee was elected, comprising the Board Chairman and two independent members as a minimum.
The Corporate Governance and Strategy Committee consists of the following:
StatusNo. of
Attendance
Mr. Shaker Tawfiq Fakhouri Head of the Committee 2
Dr. Mazen Mohammed Al-Bashir Member 2
Mr. Mohammad Anwar Hamdan Member 2
Mr. Husam Rashed Manna’ Member 2
Mr. Saleh Rajab HammadBoard Secretary/Committee's
Rapporteur2
The Corporate Governance and Strategy Committee held (2) meetings during 2016.
The Risk Management Committee:
The committee shall consist of three board members - one of whom shall be independent, in efforts to deal with and manage all risks facing the Bank.
The Risk Management Committeeconsists of the following:
Status No. of Attendance
Mr. Shaker Tawfiq Fakhouri Head of the Committee 5
Dr. Mazen Mohammed Al-Bashir Member 5
Mr. Mohammad Anwar Hamdan Member 5
Mr. Husam Rashed Manna’ Member 5
Mr. Saleh Rajab Hammad Board Secretary/Committee's Rapporteur 5
The Risk Management Committee held (5) meetings during 2016.
The Executive Committee:
The Executive Committee was elected from six Board members.
The Executive Committee consists of the following: Status No. of Attendance
Dr. Abdel Rahman Samih Toukan Head of the Committee 41
Dr. Mazen Mohammed Al–Bashir Member 49
Dr. Yanal Mawloud Naghouj Member 38
Mr. Haitham Mohammed Samih Barakat Member 5
Mr. Mohammad Anwar Hamdan Member 44
Mr. Husam Rashed Manna’ Member 51
Facilities Committee’s Rapporteur/Committee’s Rapporteur 51
The Executive Committee held (51) meetings in 2016
The Nominations and Remunerations Committee:
The Nominations and Compensations committee was elected and consists of three members, with at least two, including the head, independent members.
The Nominations and Remunerations Committee consists of:
StatusNo. of
Attendance
Dr. Yanal Mawloud Naghouj Head of the Committee 3
Dr. Mazen Mohammed Al-Bashir Member 6
Mr. Mohammad Anwar Hamdan Member 6
Mr. Saleh Rajab Hammad Board Secretary/Committee’s Rapporteur 6
The Nominations and Remuneration Committee held (6) meetings in 2016.
The Board Secretary:
Minutes of meetings are significant for the Bank, shareholders, and supervisory agencies because they are a permanent register that demonstrate the Board’s activities and deliverables, Board of Director’s decisions and any other decisions made by committees operating under the Board. Given the vital role of the Board Secretary, it has been decided to appoint Mr. Saleh Rajab Hammad AGM/Chief Risk Officer, as Board Secretary. Duties and responsibilities of the Board Secretary are incorporated in the Corporate Governance Guide of the Bank.
The Senior Executive Management:
The senior executive management team shall meet the requirements pertaining to the suitability criteria of the senior executive management stated in the Bank’s Corporate Governance Guide.
Conflict of Interests:
The Board of Directors emphasized in the Bank’s Corporate Governance Code that all members of the Board must specify their relationships with the Bank, disclose the nature of this connection, avoid conflicts of interest, and abide by the substance of the Code of Conduct in this regard. A written disclosure must be given on an annual basis or in case of any development that so requires.
Component Two (Planning and Policy Formulation):
The Board of Directors undertakes responsibility for devising the Bank’s general strategy and its strategic course of action as well as defining the general objectives for the executive management and supervising their achievements.
Component Three (Control Environment):
The Board of Directors undertakes responsibility to adopt a general framework for internal control in order to achieve the following:• Effectiveness and efficiency of operations.• Credibility of financial reports.• Adherence to laws and regulations in force.
The Board hereby affirms the existence of a general framework for internal control that enables it to follow up on its tasks and take whatever measures are necessary within the following framework:
1- Internal Audit:
The Bank realizes that having an effective internal audit department would fundamentally enhance the internal control systems and the general framework for managing risks related to the Bank’s various activities. The internal audit administration performs its tasks within the following specifics:
a. Preparing the Internal Audit Charter and sanctioning it by the Board of Directors. The charter details the functions of the audit administration including its responsibilities, authorities, and work methodology.

150 151
b. Preparing internal auditing procedures that conform to the new organization of the Bank.
c. Ensuring the preparation of an annual audit plan to be approved by the Audit Committee. The plan should cover most of the Bank’s activities as well as organizational units based on risks associated with its activities.
d. Preparing an annual report about the adequacy of internal control and audit systems in order to eliminate risks and provide suitable recommendations to remove weaknesses.
e. Ensuring the recruitment and appointment of employees possessing high academic qualifications and appropriate practical experience to audit all activities and operations. This process should include qualified staff to assess data security and IT risks.
f. Following up on violations and remarks stated in the reports of supervisory agencies and the external auditor; ensuring that they are addressed and that the executive management has adequate controls to ensure such violations are not repeated.
g. Ensuring that necessary procedures are in place to receive, process, and keep customer complaints as well as remarks related to the accounting system, internal control, and audit processes. Periodic reports concerning these matters have to be submitted.
h. Keeping audit reports and sheets in a safe and organized manner for a period that conforms to applicable laws and regulations so that they can be examined by the regulatory authorities and the external auditor.
i. Reviewing the reporting procedures in the Bank to ensure key information about financial, administrative, and operational matters are accurate, reliable and timely.
j. Ensuring compliance with the Bank’s internal policies, the international standards as well as related laws and regulations.
k. Submitting reports to the Head of the Audit Committee.
2- External Audit:
The External Auditor represents another level of control on the credibility of financial data issued by the Bank’s accounting and information systems. In particular, this entails expressing clear and honest opinions about the fairness of these statements and the extent to which they mirror actual reality during a certain period. When dealing with external audit firms, the Board of Directors has to consider the Bank’s interest and professionalism of the auditing firms, keeping in mind the importance of regular audit rotations and previous experiences with such offices.
3- Risk Management:
The management of Bank of Jordan paid special attention to Basel II requirements as a framework to reinforce and enhance the Bank’s capability to upgrade the control environment and challenge various types of risks.
To implement these requirements, practical steps were taken such as establishing administrations in the Bank specialized in managing different risks (credit, operations, and market) and manning them with qualified staff and systems.
The Bank has also worked on enhancing credit risk management practices through setting up specialized departments (including Corporate Credit Review Department/SME Credit Review Department, Retail Credit Review Department, and Credit Review Department for branches in Palestine Credit portfolios Risk department.). Furthermore, the Bank has updated and developed policies and procedures related to risk management aimed at ensuring credit quality. In addition, the Bank implemented the “Reveleus System” for calculating the capital adequacy ratio.
As for operational risks, the Bank has been implementing the CARE system since 2003 and a Risk Profile has been created for each of the Bank’s departments in addition to a database for operational errors. As for market risks, the Bank has set up a risk management unit comprised of qualified employees.
Moreover, the Bank formed a committee for risk management at the executive management level. This committee is entrusted to review and evaluate the performance of all different risk departments and to submit periodic reports about its work to the Board’s Risk Management Committee.
The Risk Management functions in line with the following general framework: A. The Bank’s Risk Management submits periodic reports to the Executive Risk Management Committee whereas daily operations are
referred to the General Manager.
B. The Risk Management undertakes the following responsibilities: – Preparing risk policies for all types of risks and sanctioning them from the Board of Directors. – Analyzing all risks including credit, market, liquidity and operational risks. – Developing methodologies for measuring and controlling all types of risks. – Recommending risk limits and approvals to the Executive Risk Management Committee and submitting reports and exceptions
pertaining to the risk management policy. – Providing the Board and the Executive Management with information about risk assessment and risk profile in the Bank. The Board
regularly reviews the Bank’s qualitative and quantitative risk statistics. – Approving the means that help risk management, such as:
• Self-assessment of risks and setting risk indicators.• Preparation of a historical database of the losses in terms of their sources and classification according to type of risk.• Provision of the necessary systems suitable for risk management at the Bank.
C. Committees such as Credit, Assets, and Liabilities’ Management/Treasury, and Operational Risk assist Risk Management in performing its tasks in accordance with the authorizations defined for these committees.
D. Incorporating information about risk management in terms of its structure, nature of operations, and progress in the Bank’s annual report.
E. Providing information about risks facing the Bank for the purposes of disclosure and publication to the public.
F. Conducting stress tests regularly in order to assess the Bank’s ability to deal with risks and financial stressors. The Board plays a significant role in deciding on the assumptions and scenarios used in this simulation technique. The test results are later examined and thoroughly discussed by the board. In light of these results, the Risks and Compliance Committee approves measures needed to manage potential risks and mitigate losses.
G. Conducting Internal Capital Adequacy Assessment Process (ICAAP), which helps identify all potential risks through an effective methodology that takes into account the Bank’s strategy and capital adequacy. The process is regularly reviewed to ensure that the Bank keeps sufficient capital buffers to shield it against potential losses.
4- Compliance:
In accordance with the Bank’s commitment with the Basel II requirements, the Compliance Department was established to ensure compliance with laws, ethical regulations, legislation, and standards, defined by different supervisory bodies and the Bank’s internal policies. Qualified human resources and automatic systems were provided to the Department. On the Compliance Department level, all laws and regulations regulating the Bank’s operations were gathered, and compliance awareness was spread among employees through booklets and training courses. An anti-money laundering policy was developed to comply with the instruction of Anti-Money Laundering and Terrorist Finance No. (51/2010) date 23/11/2010. An independent Financial Crime Unit responsible for carrying out financial and tax audit. The unit, to which FATCA is affiliated, will identify and monitor any suspicious or fraudulent transactions and activities.
The Compliance Department has the following responsibilities:
A. Drawing up the compliance policy as well as improving and reviewing it regularly (at least once a year) and whenever necessary.
B. Applying the compliance policy at the Bank.
C. Preparing an efficient methodology to ensure the Bank’s compliance with effective laws and legislation in addition to any related regulations.
D. Submitting its periodic (bi-annual) reports on its work and on the compliance of the Bank’s departments and employees to the Executive Risk and Compliance Management Committee which will in turn refer them to the Board’s Risk Management Committee.
E. Evaluating and following up on applying Corporate Governance practices in the Bank.
F. Special policies pertaining to anti money laundering and terrorism financing were drafted and implemented. Other policies related to implementing FATCA requirements and to managing customer complaints were also formulated and implemented.

152 153
5- Financial Reports
The Executive Management of the Bank shall undertake the following tasks: A. Preparing financial reports according to International Accounting Standards.B. Presenting the reports to the Board members at each regular meeting.C. Publishing financial data every three months.D. Sending financial reports and full reports to the shareholders annually.
6- Code of Conduct:
The Bank has a Code of Conduct that was approved by the Board and circulated to all employees. Several training courses were organized to educate the Bank’s employees on the concept of the Code. The compliance department ensures compliance with these concepts.
Component Four (Treatment of Shareholders)
Under the law, each shareholder has the right to vote during the General Assembly meetings and the right to discuss issues placed on the General Assembly’s ordinary and extraordinary agendas. Added to that, shareholders enjoy the right to suggest any other topics to be added for discussion on the General Assembly’s ordinary agenda, after obtaining the approval of a number of shareholders (representing at least 10% of stocks recorded) in the meeting. In order to foster this relationship, the Bank works on encouraging shareholders, mainly minority shareholders, to attend the annual General Assembly meetings and to vote in person or in their absence by proxy.
The Board shall provide shareholders with the following: – A copy of the Annual Report mailed to their respective mailing addresses. – An invitation to the General Assembly meeting and its agenda. – All of the information and publicity items addressed to the shareholders in general.
Furthermore, each shareholder has the right to get acquainted with the shareholders’ register to get to know his/her own share. The Board shall be keen on the fair distribution of profits, which should be based on the number of stocks held by each shareholder.
Component Five (Transparency and Disclosure)
Bank of Jordan Corporate Governance Guidelines are based on the principles of integrity, objectivity, transparency, disclosure, openness, and accountability for decisions adopted by the Bank. This stems from the Bank’s belief that disclosure offers the only means to provide transparent, accurate, comprehensive, and timely information. This helps users assess the Bank’s financial position, its achievements, activities, as well as risks facing the Bank and the risk management policies. The Bank disclosed all required information from different regulatory institution. It also published the Corporate Governess Guide to the public and the extent of the management adheres to it. In accordance with the instructions of dealing with customers fairly and transparently No. (56/2012) date 31/10/2012 the Bank established a dedicated unit to manage and address customers’ complaints. The unit was equipped with qualified human resources and automated systems and all necessary means available to accommodate and resolve complaints. This unit was administratively subordinated to the compliance department in the Bank.
Disclosure and Transparency

155154
Disclosure and Transparency
Based on the instructions of dealing with customers fairly and transparently No. 56/2012 issued by the Central Bank of Jordan on 31/10/2012, a unit was established to manage and address customer complaints. The unit was equipped with qualified human resources and automated systems to be controlled and managed administratively by the compliance department. The Bank addresses and manages customer complaints within the following principles:
– Preparation of a mechanism to manage and address customer complaints that is then generalized to the whole Bank. – Preparation of a policy to deal with customers fairly and transparently that is then adopted and disseminated to the
whole Bank. – The provision of different communication channels for receiving customer complaints is in the following ways:
•Direct call to the unit dialing (06-5692572) or a toll-free number (080 022 335). •Email [email protected] •Fax to 06-5600918.•Telephone complaints allotted to the Bank’s branches in times of official business. •Personal visit to the General Administration Building. •Call Center for complaints made after official business hours.
– Adoption of Service Level Agreement (SLA) and escalation procedures in the event of delay to respond to customer complaints from various units of the Bank in order to meet customer requirements within the specified time frame.
– Study and evaluation of customer complaints to find out actual facts of these complaints and concentration, classification and impact.
– Provision of the Board of Directors and senior management with periodic disclosures including a summary of complaints by the degree of risk concentration and classified according to the degree of risk and the actions taken to reduce their recurrence in the future.
– Provision of Central Bank of Jordan with the statistics periodically (quarterly) of complaints received by the unit.
Following its statistical report of the complaints that were received from customers in 2016 through various channels distributed according to Electronic Services, (Interest rates, commissions, and fees), Professional Conduct, (Credit Cards and Remittances), and (Contracts, Terms and Conditions).
Electronic ServicesInterest Rates, Commissions,
and Fees
ProfessionalConduct
Credit Cards and Remittances
Contracts, Terms and Conditions
Total
68 51 363 79 355 916
These complaints were resolved within the following framework: – Complaints were given a reference number which was also provided to customers with the aim of follow-up. – Complaints were studied, analyzed and responded to within the time frame specified by the degree and nature of
complaints classification. – Recommendation of the following proposed actions to reduce the recurrence of such complaints in the future:
•Modify work procedures, if necessary.•Taking disciplinary measures against underperforming employees.•Rehabilitation and training of staff on working procedures, products, communication skills with customers, etc.•Development of the Bank’s various sites to receive customers and improve the service provided to them.
Addresses of Bank of JordanBranches
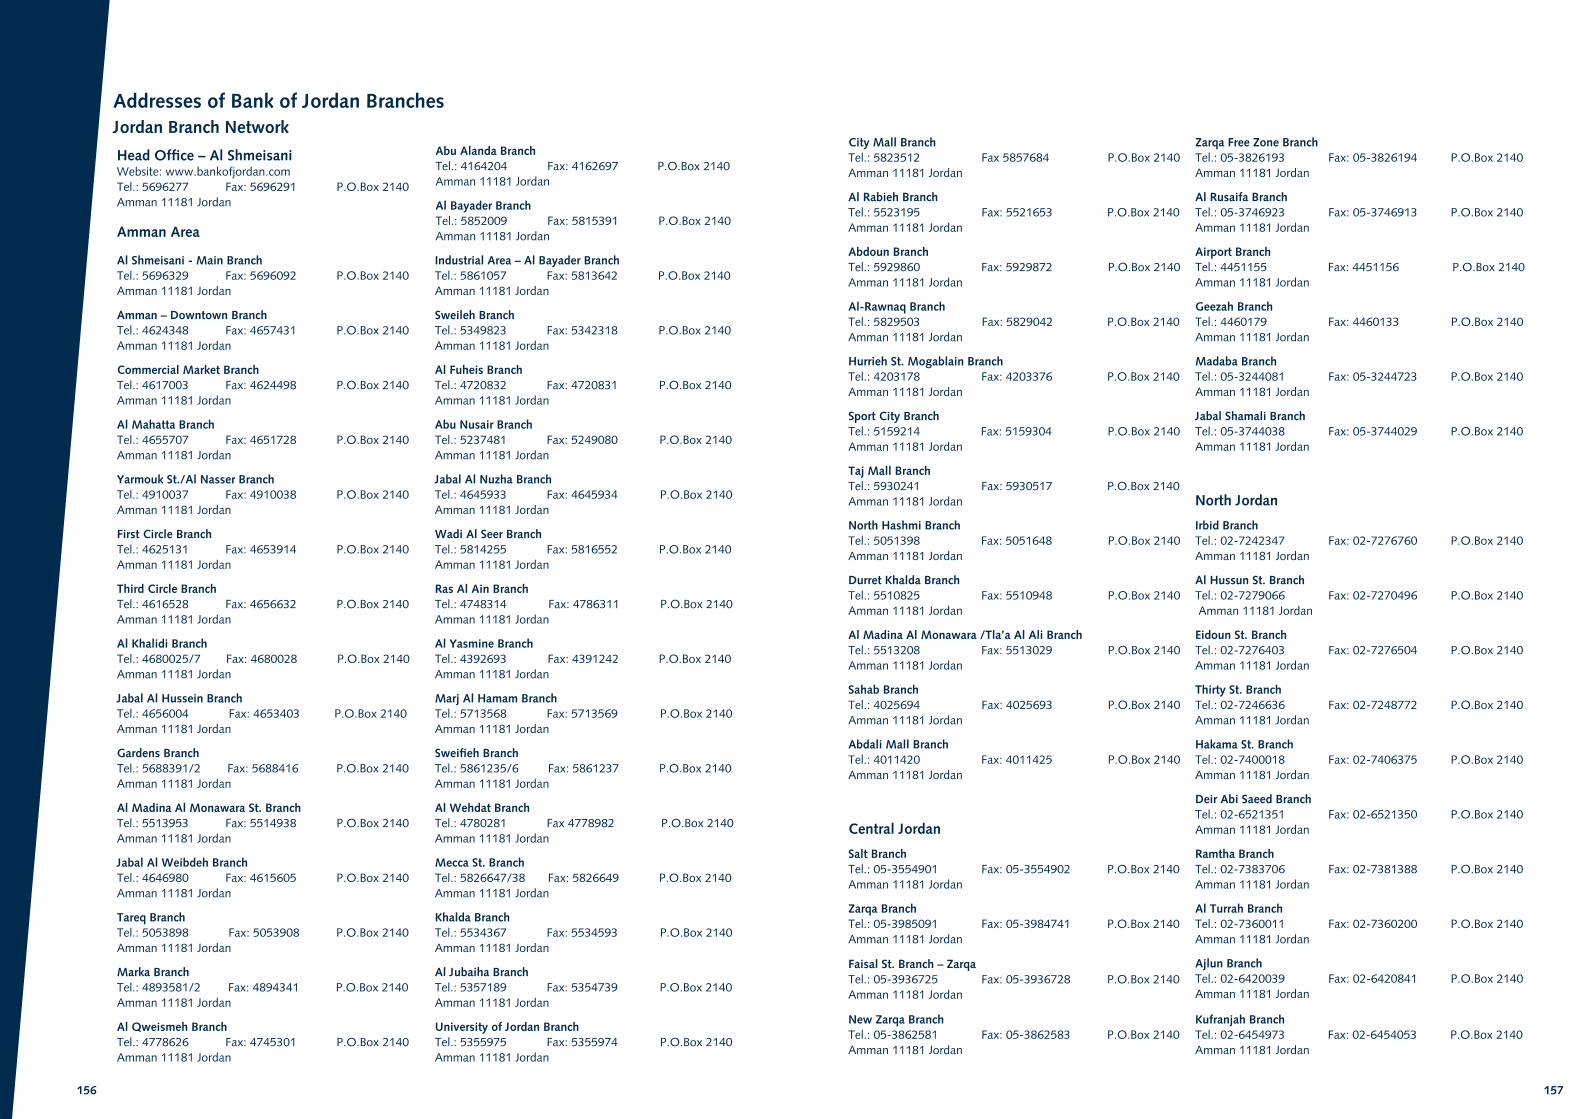
156 157
Addresses of Bank of Jordan Branches Jordan Branch Network Head Office – Al ShmeisaniWebsite: www.bankofjordan.comTel.: 5696277 Fax: 5696291 P.O.Box 2140Amman 11181 Jordan
Amman Area
Abu Alanda BranchTel.: 4164204 Fax: 4162697 P.O.Box 2140 Amman 11181 Jordan
Al Bayader BranchTel.: 5852009 Fax: 5815391 P.O.Box 2140 Amman 11181 Jordan
Al Shmeisani - Main BranchTel.: 5696329 Fax: 5696092 P.O.Box 2140 Amman 11181 Jordan
Industrial Area – Al Bayader BranchTel.: 5861057 Fax: 5813642 P.O.Box 2140 Amman 11181 Jordan
Amman – Downtown Branch Tel.: 4624348 Fax: 4657431 P.O.Box 2140 Amman 11181 Jordan
Sweileh BranchTel.: 5349823 Fax: 5342318 P.O.Box 2140 Amman 11181 Jordan
Commercial Market Branch Tel.: 4617003 Fax: 4624498 P.O.Box 2140 Amman 11181 Jordan
Al Fuheis BranchTel.: 4720832 Fax: 4720831 P.O.Box 2140 Amman 11181 Jordan
Al Mahatta BranchTel.: 4655707 Fax: 4651728 P.O.Box 2140 Amman 11181 Jordan
Abu Nusair BranchTel.: 5237481 Fax: 5249080 P.O.Box 2140 Amman 11181 Jordan
Yarmouk St./Al Nasser BranchTel.: 4910037 Fax: 4910038 P.O.Box 2140 Amman 11181 Jordan
Jabal Al Nuzha BranchTel.: 4645933 Fax: 4645934 P.O.Box 2140 Amman 11181 Jordan
First Circle BranchTel.: 4625131 Fax: 4653914 P.O.Box 2140 Amman 11181 Jordan
Wadi Al Seer BranchTel.: 5814255 Fax: 5816552 P.O.Box 2140 Amman 11181 Jordan
Third Circle BranchTel.: 4616528 Fax: 4656632 P.O.Box 2140 Amman 11181 Jordan
Ras Al Ain BranchTel.: 4748314 Fax: 4786311 P.O.Box 2140 Amman 11181 Jordan
Al Khalidi BranchTel.: 4680025/7 Fax: 4680028 P.O.Box 2140 Amman 11181 Jordan
Al Yasmine BranchTel.: 4392693 Fax: 4391242 P.O.Box 2140 Amman 11181 Jordan
Jabal Al Hussein BranchTel.: 4656004 Fax: 4653403 P.O.Box 2140 Amman 11181 Jordan
Marj Al Hamam BranchTel.: 5713568 Fax: 5713569 P.O.Box 2140 Amman 11181 Jordan
Gardens BranchTel.: 5688391/2 Fax: 5688416 P.O.Box 2140 Amman 11181 Jordan
Sweifieh BranchTel.: 5861235/6 Fax: 5861237 P.O.Box 2140 Amman 11181 Jordan
Al Madina Al Monawara St. BranchTel.: 5513953 Fax: 5514938 P.O.Box 2140 Amman 11181 Jordan
Al Wehdat BranchTel.: 4780281 Fax 4778982 P.O.Box 2140 Amman 11181 Jordan
Jabal Al Weibdeh BranchTel.: 4646980 Fax: 4615605 P.O.Box 2140 Amman 11181 Jordan
Mecca St. BranchTel.: 5826647/38 Fax: 5826649 P.O.Box 2140 Amman 11181 Jordan
Tareq BranchTel.: 5053898 Fax: 5053908 P.O.Box 2140 Amman 11181 Jordan
Khalda BranchTel.: 5534367 Fax: 5534593 P.O.Box 2140 Amman 11181 Jordan
Marka BranchTel.: 4893581/2 Fax: 4894341 P.O.Box 2140 Amman 11181 Jordan
Al Jubaiha BranchTel.: 5357189 Fax: 5354739 P.O.Box 2140 Amman 11181 Jordan
Al Qweismeh BranchTel.: 4778626 Fax: 4745301 P.O.Box 2140 Amman 11181 Jordan
University of Jordan BranchTel.: 5355975 Fax: 5355974 P.O.Box 2140 Amman 11181 Jordan
City Mall BranchTel.: 5823512 Fax 5857684 P.O.Box 2140 Amman 11181 Jordan
Zarqa Free Zone BranchTel.: 05-3826193 Fax: 05-3826194 P.O.Box 2140Amman 11181 Jordan
Al Rabieh BranchTel.: 5523195 Fax: 5521653 P.O.Box 2140 Amman 11181 Jordan
Al Rusaifa BranchTel.: 05-3746923 Fax: 05-3746913 P.O.Box 2140Amman 11181 Jordan
Abdoun BranchTel.: 5929860 Fax: 5929872 P.O.Box 2140 Amman 11181 Jordan
Airport BranchTel.: 4451155 Fax: 4451156 P.O.Box 2140Amman 11181 Jordan
Al-Rawnaq BranchTel.: 5829503 Fax: 5829042 P.O.Box 2140 Amman 11181 Jordan
Geezah BranchTel.: 4460179 Fax: 4460133 P.O.Box 2140Amman 11181 Jordan
Hurrieh St. Mogablain BranchTel.: 4203178 Fax: 4203376 P.O.Box 2140 Amman 11181 Jordan
Madaba BranchTel.: 05-3244081 Fax: 05-3244723 P.O.Box 2140Amman 11181 Jordan
Sport City BranchTel.: 5159214 Fax: 5159304 P.O.Box 2140 Amman 11181 Jordan
Jabal Shamali Branch Tel.: 05-3744038 Fax: 05-3744029 P.O.Box 2140Amman 11181 Jordan
Taj Mall BranchTel.: 5930241 Fax: 5930517 P.O.Box 2140 Amman 11181 Jordan North Jordan
North Hashmi BranchTel.: 5051398 Fax: 5051648 P.O.Box 2140 Amman 11181 Jordan
Irbid BranchTel.: 02-7242347 Fax: 02-7276760 P.O.Box 2140Amman 11181 Jordan
Durret Khalda BranchTel.: 5510825 Fax: 5510948 P.O.Box 2140 Amman 11181 Jordan
Al Hussun St. BranchTel.: 02-7279066 Fax: 02-7270496 P.O.Box 2140 Amman 11181 Jordan
Al Madina Al Monawara /Tla’a Al Ali BranchTel.: 5513208 Fax: 5513029 P.O.Box 2140 Amman 11181 Jordan
Eidoun St. BranchTel.: 02-7276403 Fax: 02-7276504 P.O.Box 2140Amman 11181 Jordan
Sahab BranchTel.: 4025694 Fax: 4025693 P.O.Box 2140 Amman 11181 Jordan
Thirty St. BranchTel.: 02-7246636 Fax: 02-7248772 P.O.Box 2140Amman 11181 Jordan
Abdali Mall BranchTel.: 4011420 Fax: 4011425 P.O.Box 2140 Amman 11181 Jordan
Hakama St. BranchTel.: 02-7400018 Fax: 02-7406375 P.O.Box 2140Amman 11181 Jordan
Central Jordan
Deir Abi Saeed BranchTel.: 02-6521351 Fax: 02-6521350 P.O.Box 2140Amman 11181 Jordan
Salt BranchTel.: 05-3554901 Fax: 05-3554902 P.O.Box 2140 Amman 11181 Jordan
Ramtha BranchTel.: 02-7383706 Fax: 02-7381388 P.O.Box 2140Amman 11181 Jordan
Zarqa BranchTel.: 05-3985091 Fax: 05-3984741 P.O.Box 2140 Amman 11181 Jordan
Al Turrah BranchTel.: 02-7360011 Fax: 02-7360200 P.O.Box 2140Amman 11181 Jordan
Faisal St. Branch – ZarqaTel.: 05-3936725 Fax: 05-3936728 P.O.Box 2140Amman 11181 Jordan
Ajlun Branch Tel.: 02-6420039 Fax: 02-6420841 P.O.Box 2140Amman 11181 Jordan
New Zarqa BranchTel.: 05-3862581 Fax: 05-3862583 P.O.Box 2140Amman 11181 Jordan
Kufranjah Branch Tel.: 02-6454973 Fax: 02-6454053 P.O.Box 2140Amman 11181 Jordan

158 159
Jerash Branch Tel.: 02-6351453 Fax: 02-6351433 P.O.Box 2140Amman 11181 Jordan
Al Mafraq Branch Tel.: 02-6233317 Fax: 02-6233316 P.O.Box 2140Amman 11181 Jordan
North Shuneh Branch Tel.: 02-6587177 Fax: 02-6587377 P.O.Box 2140Amman 11181 Jordan
North Azraq Branch Tel.: 05-3834308 Fax: 3834307-05 P.O.Box 2140Amman 11181 Jordan
Palestine Branch Network
Regional ManagementTel.: +970 22952703/2 Fax: +970 22952705P.O. Box 1328
Ramallah BranchTel.: +970 22958686 Fax: +970 22958684 P.O. Box 1829
Nablus BranchTel.: +970 92381120/5 Fax: +970 92381126 P.O. Box 107
Jenin BranchTel.: +970 42505403 Fax: +970 42505402 P.O. Box 183
South Jordan
Jenin Municipality OfficeTel.: +970 42505233 Fax: +970 42505231 P.O. Box 183
Kerak BranchTel.: 03-2351043 Fax: 03-2353451 P.O.Box 2140Amman 11181 Jordan
Qabatiya BranchTel.: +970 42512482 Fax: +970 42512483 P.O. Box 183
Ma’an BranchTel.: 03-2132090 Fax: 03-2131855 P.O.Box 2140Amman 11181 Jordan
Gaza BranchTel.: +970 82865281 Fax: +970 82824341 P.O. Box 528
Aqaba BranchTel.: 03-2013118 Fax: 03-2014733 P.O.Box 2140Amman 11181 Jordan
Al-Naser BranchTel.: +970 82857230 Fax: +970 82859258 P.O. Box 528
Exchange Offices
Hebron BranchTel.: +970 22224351 Fax: +970 22224350 P.O. Box 494
Jaber Border office – Arrivals *Tel.: 02-6254074
Jaber Border office – Departures *Tel.: 02-6254073
Ramtha Border – Travelers *Tel.: 02-7382425
Ruweished office *Tel.: 02-6295320
Aqaba Port – Arrivals / Departures officeTel.: 03-2022702
Sheikh Hussein Bridge – Departures / Arrivals Office Tel.: 02-6550473
King Hussein Bridge – Arrivals OfficeTel.: 05-3581146 Fax: 05-3581147
King Hussein Bridge – Departures OfficeTel.: 05-3539138 Fax: 05-3581147
Al Ram BranchTel.: +970 22343840 Fax: +970 22343842 P.O. Box 1328
Al Eizaryah BranchTel.: +970 22790243 Fax: +970 22790245 P.O. Box 148
Industrial Area Branch/ Ramallah Tel.: +970 22963785 Fax: +970 22963788 P.O. Box 1484
Tulkarm BranchTel.: +970 92687882 Fax: +970 92687884 P.O. Box 18
Bethlehem BranchTel.: +970 22749938 Fax: +970 22749941 P.O. Box 207
Rafidia BranchTel.: +970 92343647 Fax: +970 92343747 P.O. Box 107
Al Eersal BranchTel.: +970 22976315 Fax: +970 22976320P.O. Box 1328
* We temporarily suspended the operations in these exchange offices due to the security conditions in their locations.
Organizational Structure / Bank of Jordan - H
ead Office
Board of D
irectors
Consultant
Board of D
irectorsExcel for Financial
Investment
Board of D
irectorsJordan Leasing C
o.
Risk &
Com
plianceM
anagement C
omm
ittee
AG
M /
Chief R
isk Offi
cerA
GM
/ Chief
Operating O
fficer
Business Sector
Credit R
eviewM
anagement
Market &
Operational
Risk D
ept.
Corporate C
reditR
eview D
ept.
Foreign Branches
Credit R
eview D
ept.
Com
mercial C
reditR
eview D
ept.
Retail C
reditR
eview D
ept.Insurance U
nit
Credit R
emedial D
ept.
Credit Portfolios
Risk D
ept.
Com
pliance Dept.
Regional M
anagement
for Palestine Branches
Central O
perationsM
anagement
Retail B
ankingM
anagement
Corporate B
usinessD
evelopment D
epartment
Sales & Services
Branches
Treasury &Investm
ent Dept.
Retail B
anking Dept.
Securities Services Dept.
Collection D
ept.C
omm
ercial Business
Developm
ent Dept.
Com
mercial B
usinessD
evelopment C
enters
FinancialInstitutions U
nit
Market Studies U
nit
Branches Support D
ept.C
entral TradeServices D
ept.
Central R
emittances &
Back O
ffice Treasury
IT Dept.
Central D
epositProcessing D
ept.
Credit Processing
Adm
inistration dept.(C
orporate & C
omm
ercial)
Central Loans Processing
Dept. (R
etail)C
redit Cards
Processing Dept.
Centralized C
learingC
heques & Filing D
ept.A
dministration &
Procurement D
ept.
Programs
Developm
ent Unit
EngineeringServices D
ept.
Real Estate D
ept.
ProjectM
anagement D
ept.
Input / Output
Processing Unit
MIS D
ept.
Organization D
ept.
Head Q
uarterC
omm
ittees
Foreign Branching
Legal Dept.
Planning &R
esearch Dept.
Leasing Dept.
Hum
an Resources D
ept.
Financial Control D
ept.
General Secretary
Executive Com
mittee
Strategies & C
orporateG
overnance Com
mittee
Nom
inations andR
emunerations C
omm
itteeA
udit Com
mittee
Internal Audit
Dept.
Board of D
irectorsB
ank of Jordan / Syria
Chairm
anB
ank of Jordan / SyriaC
hairman Excel for
Financial Investment
CEO
Jordan Leasing Co.
General M
anager Jordan Leasing C
o.
General M
anagerExcel for Financial
Investment
General M
anagerB
ank of Jordan / Syria
Chairm
an /G
eneral Manager