2016 Irish Hotels Market Briefing - crowe.ie · Total Revenue €57k €42k €61k +€4k Total...
36
2016 Irish Hotels Market Briefing 28 September 2016
Transcript of 2016 Irish Hotels Market Briefing - crowe.ie · Total Revenue €57k €42k €61k +€4k Total...

2016 Irish Hotels
Market Briefing 28 September 2016

1 © 2016 Crowe Horwath
Audit | Tax | Advisory
Audit | Tax | Advisory
Hotel Market Performance and Opportunities
Aiden Murphy, Crowe Horwath
28th September 2016

2 © 2016 Crowe Horwath
Introduction
Crowe Horwath release the 21st Edition of the Annual Hotel Industry Survey
3 © 2016 Crowe Horwath
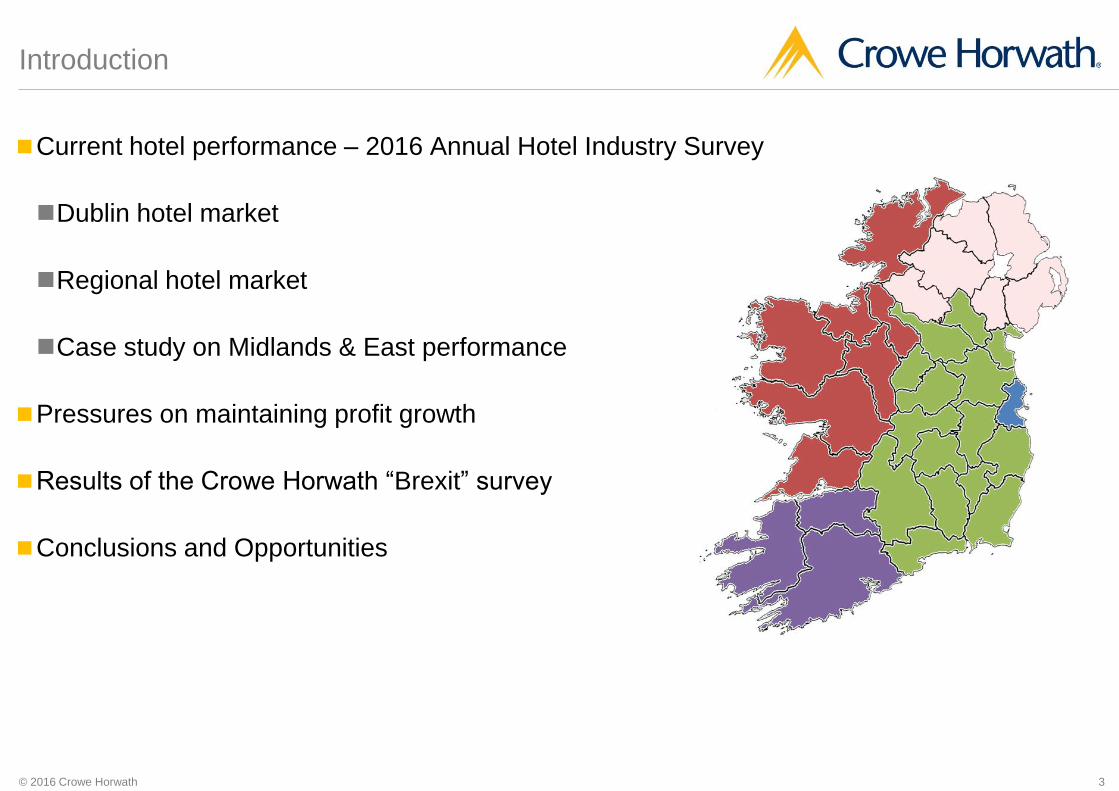
Introduction
Current hotel performance – 2016 Annual Hotel Industry Survey
Dublin hotel market
Regional hotel market
Case study on Midlands & East performance
Pressures on maintaining profit growth
Results of the Crowe Horwath “Brexit” survey
Conclusions and Opportunities
4 © 2016 Crowe Horwath
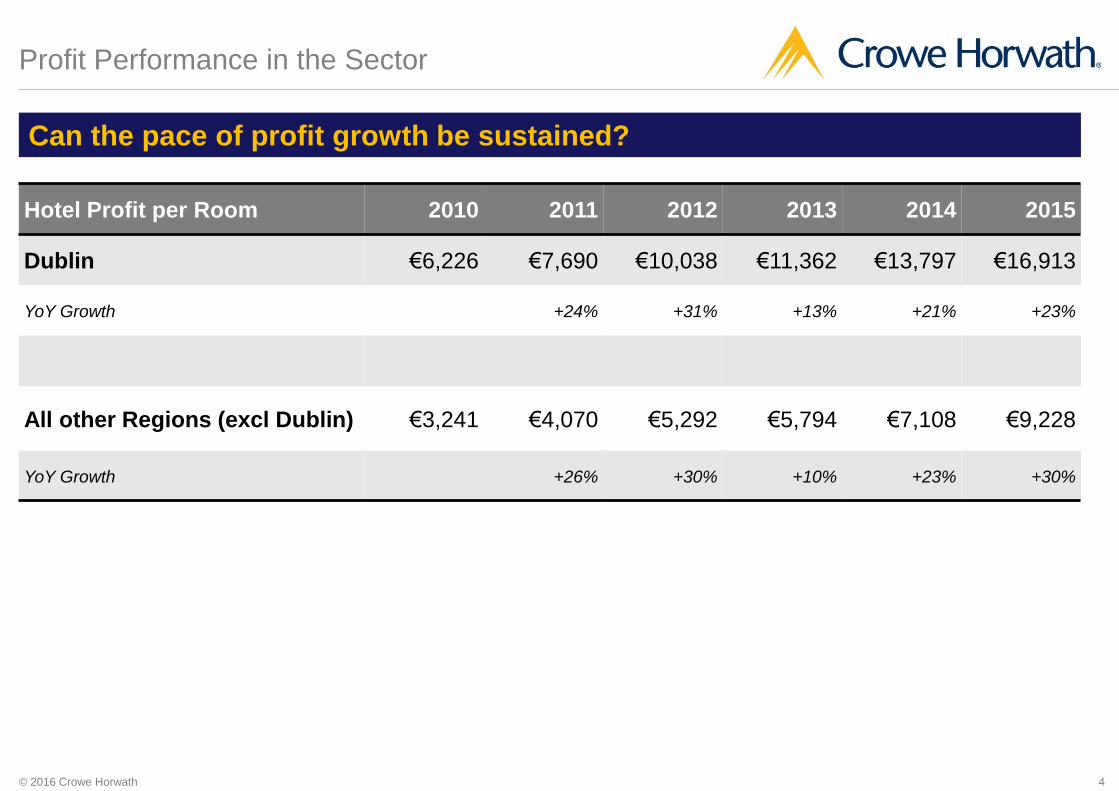
Profit Performance in the Sector
Can the pace of profit growth be sustained?
Hotel Profit per Room 2010 2011 2012 2013 2014 2015
Dublin €6,226 €7,690 €10,038 €11,362 €13,797 €16,913
YoY Growth +24% +31% +13% +21% +23%
All other Regions (excl Dublin) €3,241 €4,070 €5,292 €5,794 €7,108 €9,228
YoY Growth +26% +30% +10% +23% +30%

5 © 2016 Crowe Horwath
Constraints on the Sector
6 © 2016 Crowe Horwath
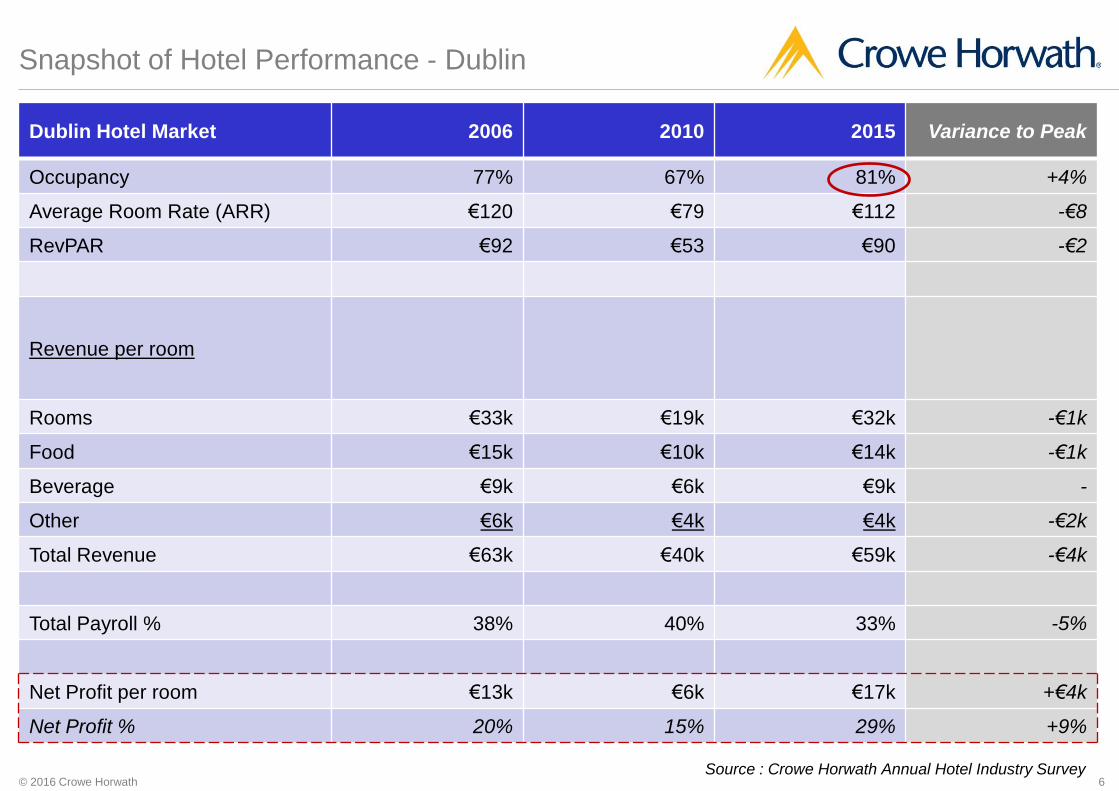
Snapshot of Hotel Performance - Dublin
Dublin Hotel Market 2006 2010 2015 Variance to Peak
Occupancy 77% 67% 81% +4%
Average Room Rate (ARR) €120 €79 €112 -€8
RevPAR €92 €53 €90 -€2
Revenue per room
Rooms €33k €19k €32k -€1k
Food €15k €10k €14k -€1k
Beverage €9k €6k €9k -
Other €6k €4k €4k -€2k
Total Revenue €63k €40k €59k -€4k
Total Payroll % 38% 40% 33% -5%
Net Profit per room €13k €6k €17k +€4k
Net Profit % 20% 15% 29% +9%
Source : Crowe Horwath Annual Hotel Industry Survey

7 © 2016 Crowe Horwath
Dublin’s Room Supply
19k
81%
50%
55%
60%
65%
70%
75%
80%
85%
5k
7k
9k
11k
13k
15k
17k
19k
21k
2000 2001 2002 2003 2004 2005 2006 2007 2008 2009 2010 2011 2012 2013 2014 2015
Trends in Room Supply - Dublin
Bedrooms Occupancy
From 2001 to 2015 room supply
increased by 58% (+7k rooms)

8 © 2016 Crowe Horwath
Review of Dublin ADR by Month
Dublin ADR (€) 2007 2013 2014 2015 Peak to 2015
Variance
January 101.66 78.04 80.89 91.37 -10
February 111.88 82.82 85.23 98.59 -13
March 112.82 89.70 90.61 102.58 -10
April 113.12 85.84 86.65 102.87 -10
May 120.80 93.53 102.82 115.17 -6
June 127.05 99.71 106.91 120.81 -6
July 122.61 97.36 102.82 121.64 -1
August 122.87 98.04 109.02 123.31 0
September 127.49 99.49 110.42 123.97 -4
October 122.93 90.88 99.91 116.82 -6
November 112.19 86.87 98.95 114.63 +2
December 110.05 85.89 92.58 107.39 -3
Month on month comparisons show Average Room Rate has only exceeded the previous peak levels for 1 month only

9 © 2016 Crowe Horwath
Comparison of Dublin Performance to EU - 2015
Dublin ADR 2015 v Other European Cities
Dublin Occupancy 2015 v Other European Cities
-
€50
€100
€150
€200
€250
€300
50%
55%
60%
65%
70%
75%
80%
85%
While Dublin’s occupancy is the highest in
Europe, ADR is mid-table (ranking 15th).
Source: STR Global

10 © 2016 Crowe Horwath
Snapshot of Hotel Performance - Regional (excl Dublin)
Regional Hotel Market 2007 2010 2015 Variance to Peak
Occupancy 66% 56% 66% -
Average Room Rate (ARR) €86 €70 €83 -€3
RevPAR €57 €39 €55 -€2
Revenue per room
Rooms €21k €14k €20k -€1k
Food €20k €15k €24k +€4k
Beverage €11k €9k €12k +€1k
Other €5k €4k €5k -
Total Revenue €57k €42k €61k +€4k
Total Payroll % 41% 43% 38% -3%
Net Profit per Room €8k €3k €9k +€1k
Net Profit % 14% 8% 15% +1%
Source : Crowe Horwath Annual Hotel Industry Survey

11 © 2016 Crowe Horwath
38k
66%
50%
52%
54%
56%
58%
60%
62%
64%
66%
68%
5k
10k
15k
20k
25k
30k
35k
40k
45k
2000 2001 2002 2003 2004 2005 2006 2007 2008 2009 2010 2011 2012 2013 2014 2015
Trends in Hotel Supply - Regions excl Dublin
Bedrooms Occupancy
Ireland’s Hotel Supply
Rooms by Region 2001 to 2015 # Rooms % Diff
Midlands and East +5k +62%
South West +2k +20%
Western Seaboard +3k +28%
Total +10k +34%

12 © 2016 Crowe Horwath
Snapshot of Hotel Performance – Midlands & East Market
Midlands & East Hotel Market 2006 2010 2015 Variance to Peak
Occupancy 63% 54% 65% +2%
Average Room Rate (ARR) €94 €76 €84 -€10
RevPAR €60 €41 €55 -€5
Revenue per room
Rooms €21k €15k €20k -€1k
Food €28k €18k €30k +€2k
Beverage €17k €10k €16k -€1k
Other €8k €6k €7k -€1k
Total Revenue €74k €49k €73k -€1k
Total Payroll % 40% 46% 38% -2%
Net Profit per room €10k €3k €11k +€1k
Net Profit % 14% 6% 15% +1%
Source : Crowe Horwath Annual Hotel Industry Survey

13 © 2016 Crowe Horwath
NI UK Source : Crowe Horwath Annual Hotel Industry Survey
Brexit – UK Visitors to Ireland as % of Total Visitors
1985 1995 2005 2015
UK Other Europe US/Canada ROW Source: CSO
21% 24%
20% 17%
23%
0%
5%
10%
15%
20%
25%
30%
All Hotels Dublin Midlands & East South West Western Seaboard
Hotel Bedroom Demand (2015) UK and NI Market Share

14 © 2016 Crowe Horwath
Survey issued September 2016, 3 months
after Brexit result
Replies from 80 hotels
82% of respondents in the Border region felt
that Brexit had directly impacted their
business in the last 3 months.
Respondents who answered “Yes” felt that
any impact to date was minimal.
Brexit Survey - Findings
Dublin 31%
Regional 54%
Border 15%
Profile of Respondents
Yes 43%
No 57%
Has the Brexit vote had a direct impact on your business in the last 3 months?

15 © 2016 Crowe Horwath
Hotelier Sentiment for next 12-15 Months
Increase / Remain the
Same 64%
Decrease 36%
Sentiment for Demand Levels
42%
21%
75%
58% 79% 25%
0%
20%
40%
60%
80%
100%
Dublin Regional Border
Demand By Region
Decrease Increase / Remain the Same
Decrease 13%
Increase / Remain the
Stay 87%
Sentiment for Average Room Rate
96% 88% 67% 0%
20%
40%
60%
80%
100%
Dublin Regional Border
Average Room Rate By Region

16 © 2016 Crowe Horwath
Conclusion and Opportunities for the Irish Hotel Sector
Demand has returned to a level which allows:
Opportunity to yield room rate
Need for additional room supply
Potential for new hotels in the Dublin market
Existing hoteliers will have the opportunity to expand
Repositioning of hotels (e.g. upgrade in hotel classifications)
Development of ground floor offering
Re-investment in the hotel product through capex programmes, lifting revenue
Barriers to entry remain – feasibility of new build, planning and funding
The above opportunities continue to drive asset value, transactions and
investment in the hotel sector.

17 © 2016 Crowe Horwath
Bastow Charleton Member Crowe Horwath International
Marine House
Clanwilliam Court
Dublin 2
Ireland
www.crowehorwath.ie
Thank You.
Aiden Murphy
Partner | Restructuring, Advisory & Insolvency
Hotel Investment Market in Ireland
Breakfast Briefing 28 September 2016

19 Cushman & Wakefield |
“Need to fast track hotel projects
in Dublin City is critical”
“€20m redevelopment of Dublin's
Ormond Hotel gets go ahead”
“New €40m, 257 bed hotel
gets green light” “Hudson Bay Group planning
new 263 bedroom hotel for
Dublin”
“Dublin faces hotel shortage as
visitor numbers rise”
“Hotel site ready to go in
Dublin city centre for €5m”
“Dublin is facing a hotel room
shortage that could stifle its
growth as a tourist hub”

Cushman & Wakefield |
Agenda Investment Market – H1 2016
• Where and what type of properties sold?
• Who’s selling?
• Who’s buying?
Development
• Need for development?
• Analysis of the supply pipeline
• Concerns
Conclusion

21 Cushman & Wakefield |
Market Transactions
0
10
20
30
40
50
60
2009 2010 2011 2012 2013 2014 2015 2016 (H1)
2 2 4
28
40
60 59
27
Number of Transactions 2009 - H1 2016

22 Cushman & Wakefield |
Source – Cushman & Wakefield Research
Type
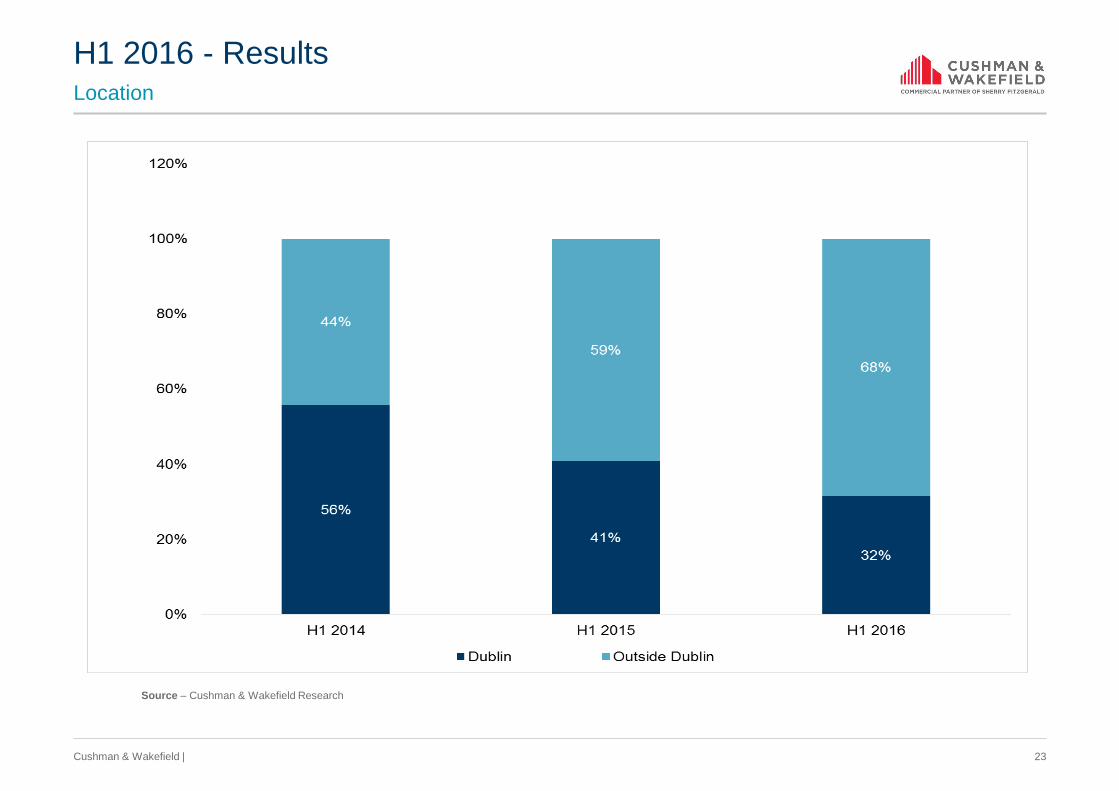
H1 2016 - Results
4 Star 52%
(14 Hotels)
3 Star 37%
(10 Hotels)
2 Star 4%
(1 Hotel)
Unknown 7%
(2 Hotels)
23 Cushman & Wakefield |
Location
Source – Cushman & Wakefield Research
H1 2016 - Results

24 Cushman & Wakefield |
Source – Cushman & Wakefield Research
Foreign 68%
Domestic 32%
Domestic 52%
Foreign 48%
H1 2015
Domestic v International Purchasers
H1 2016
74%
26%
Domestic Foreign
H1 2014

25 Cushman & Wakefield |
International buyers
27%
51% 17%
5%

26 Cushman & Wakefield |
Changing Vendors and Changing Purchasers?
Vendors of
last 5 years
Receivership Focussed
Current Vendors Consensual Sales
Purchasers of
last 5 years • Opportunity Funds
• High Net Worth Investors
• Smaller Domestic Funds
Current
Purchasers • Institutional Type
Purchasers
• Building Portfolios

27 Cushman & Wakefield |
Activity
• Sales numbers levelled off
• Few distressed properties remaining with NAMA
and main Banks
• Future activity likely to be initiated by New Loan
Holders and Resales
• Critical need for Development in Dublin

28 Cushman & Wakefield |
SUPPLY DEMAND
29 Cushman & Wakefield |
New Development - Dublin
8,850 rooms
Source: AM:PM Hotels/ CIS/ Cushman & Wakefield Research

30 Cushman & Wakefield |
Status of pipeline –
Source: AM:PM Hotels/ CIS/ Cushman & Wakefield Research
0
1000
2000
3000
4000
5000
6000
On site Plans Granted Plans Submitted
1,199
5,972
1,679
31 Cushman & Wakefield |
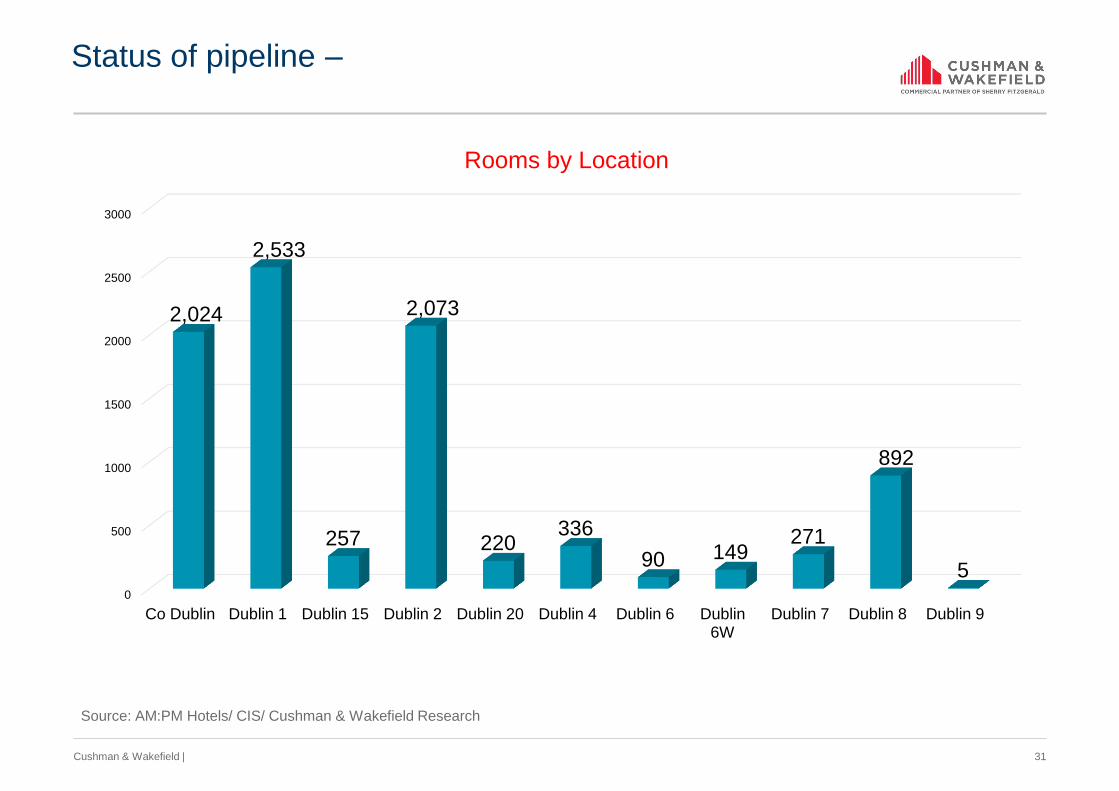
Source: AM:PM Hotels/ CIS/ Cushman & Wakefield Research
Status of pipeline –
0
500
1000
1500
2000
2500
3000
Co Dublin Dublin 1 Dublin 15 Dublin 2 Dublin 20 Dublin 4 Dublin 6 Dublin 6W
Dublin 7 Dublin 8 Dublin 9
2,024
2,533
257
2,073
220 336
90 149 271
892
5
Rooms by Location

32 Cushman & Wakefield |
Concerns
1. Timing
2. Periphery Hotels
3. Oversupply
4. Brexit

33 Cushman & Wakefield |
Conclusion
Development
• Need for Development in Dublin City Centre
• Long Term Implications
• Feasibility Studies

Kirsty Rothwell MSCSI MRICS
Director & Head of Trading Assets
Telephone: +353 1 639 9386
E-mail: [email protected]
Disclaimer information

35 Cushman & Wakefield |
2016 Irish Hotels
Market Briefing 28 September 2016