
2016 Integrated Resource Plan Report - fmtn.org
83
4401 Fair Lakes Court Fairfax, VA 22033 USA Phone: 1.703.818.9100 www.paceglobal.com Setting the Pace in energy since 1976 2016 Integrated Resource Plan Report Prepared for: City of Farmington December 9, 2016 This Report was produced by Pace Global, a Siemens business (“Pace Global”) and is meant to be read as a whole and in conjunction with this disclaimer. Any use of this Report other than as a whole and in conjunction with this disclaimer is forbidden. Any use of this Report outside of its stated purpose without the prior written consent of Pace Global is forbidden. Except for its stated purpose, this Report may not be copied or distributed in whole or in part without Pace Global’s prior written consent. This Report and the information and statements herein are based in whole or in part on information obtained from various sources as of December 9, 2016. While Pace Global believes such information to be accurate, it makes no assurances, endorsements or warranties, express or implied, as to the validity, accuracy or completeness of any such information, any conclusions based thereon, or any methods disclosed in this Report. Pace Global assumes no responsibility for the results of any actions and inactions taken on the basis of this Report. By a party using, acting or relying on this Report, such party consents and agrees that Pace Global, its employees, directors, officers, contractors, advisors, members, affiliates, successors and agents shall have no liability with respect to such use, actions, inactions, or reliance. This Report does contain some forward-looking opinions. Certain unanticipated factors could cause actual results to differ from the opinions contained herein. Forward-looking opinions are based on historical and/or current information that relate to future operations, strategies, financial results or other developments. Some of the unanticipated factors, among others, that could cause the actual results to differ include regulatory developments, technological changes, competitive conditions, new products, general economic conditions, changes in tax laws, adequacy of reserves, credit and other risks associated with City of Farmington and/or other third parties, significant changes in interest rates and fluctuations in foreign currency exchange rates. Further, certain statements, findings and conclusions in this Report are based on Pace Global’s interpretations of various contracts. Interpretations of these contracts by legal counsel or a jurisdictional body could differ.
Transcript of 2016 Integrated Resource Plan Report - fmtn.org
4401 Fair Lakes Court Fairfax, VA 22033 USA Phone: 1.703.818.9100 www.paceglobal.com
Setting the Pace in energy since 1976
2016 Integrated Resource Plan Report
Prepared for:
City of Farmington
December 9, 2016
This Report was produced by Pace Global, a Siemens business (“Pace Global”) and is meant to be read as a whole and in conjunction with this disclaimer. Any use of this Report other than as a whole and in conjunction with this disclaimer is forbidden. Any use of this Report outside of its stated purpose without the prior written consent of Pace Global is forbidden. Except for its stated purpose, this Report may not be copied or distributed in whole or in part without Pace Global’s prior written consent.
This Report and the information and statements herein are based in whole or in part on information obtained from various sources as of December 9, 2016. While Pace Global believes such information to be accurate, it makes no assurances, endorsements or warranties, express or implied, as to the validity, accuracy or completeness of any such information, any conclusions based thereon, or any methods disclosed in this Report. Pace Global assumes no responsibility for the results of any actions and inactions taken on the basis of this Report. By a party using, acting or relying on this Report, such party consents and agrees that Pace Global, its employees, directors, officers, contractors, advisors, members, affiliates, successors and agents shall have no liability with respect to such use, actions, inactions, or reliance.
This Report does contain some forward-looking opinions. Certain unanticipated factors could cause actual results to differ from the opinions contained herein. Forward-looking opinions are based on historical and/or current information that relate to future operations, strategies, financial results or other developments. Some of the unanticipated factors, among others, that could cause the actual results to differ include regulatory developments, technological changes, competitive conditions, new products, general economic conditions, changes in tax laws, adequacy of reserves, credit and other risks associated with City of Farmington and/or other third parties, significant changes in interest rates and fluctuations in foreign currency exchange rates.
Further, certain statements, findings and conclusions in this Report are based on Pace Global’s interpretations of various contracts. Interpretations of these contracts by legal counsel or a jurisdictional body could differ.

Proprietary & Confidential i
TABLE OF CONTENTS
Executive Summary ...................................................................................................................................... 5
Motivating Questions ................................................................................................................................ 5 Evaluation Process ................................................................................................................................... 6 Preferred Resource Plan .......................................................................................................................... 6
Farmington Energy Situation Assessment .................................................................................................... 8
Farmington Profile .................................................................................................................................... 8 Generation Facilities and Power Purchase Contracts .............................................................................. 8 Supply and Demand Balance ................................................................................................................... 9
Farmington Contracts Position Assessment ............................................................................................... 11
Power Purchase Contract ....................................................................................................................... 11 Gas Supply Contract ............................................................................................................................... 12 Coal Supply Contract .............................................................................................................................. 13
Farmington IRP Objectives and Metrics ..................................................................................................... 14
Cost Objectives ....................................................................................................................................... 14 Preserve Competitive Rates ............................................................................................................... 14
Risk Objectives ....................................................................................................................................... 15 Maintain Stable Rates (Price Risk) ..................................................................................................... 15 Manage Market Risks ......................................................................................................................... 15 Minimize Development Risks ............................................................................................................. 15 Minimize Control Risks ....................................................................................................................... 15
Environmental Objectives ....................................................................................................................... 15 CO2 Footprint ...................................................................................................................................... 15 Renewable Generation ....................................................................................................................... 16
Operational Objectives ........................................................................................................................... 16 Provide Reliable Service .................................................................................................................... 16 Manage and Monitor Largest Contingency ........................................................................................ 16
Clean Power Plan Cases ............................................................................................................................ 17
Load Forecast ............................................................................................................................................. 18
San Juan Basin Outlook ......................................................................................................................... 18 Load Forecast Process ........................................................................................................................... 21
Technology Screening ................................................................................................................................ 22
Technology Screening Considerations ................................................................................................... 22 Technology Assumptions........................................................................................................................ 22
Candidate Portfolios .................................................................................................................................... 24
Candidate Portfolios Construction and Screening .................................................................................. 24 Solar Integration ................................................................................................................................. 24 Portfolio Positions: Long vs. Short ..................................................................................................... 25 CPEC Project Development ............................................................................................................... 25
Candidate Portfolios for Stochastic Analysis .......................................................................................... 25

Proprietary & Confidential ii
Stochastic Assessment of Cndidate Portfolios ........................................................................................... 27
Stochastic Input Development ................................................................................................................ 27 Stochastic Load Forecasts ................................................................................................................. 27 Other Stochastic Inputs ...................................................................................................................... 29
Stochastic Assessment Results ............................................................................................................. 29 Key Findings ....................................................................................................................................... 32
Preferred Resource Plan ............................................................................................................................. 35
Appendix A: Load Forecast Methodology ................................................................................................... 36
Appendix B: Candidate Portfolios Profiles .................................................................................................. 41
Appendix C: Power Market Overview and Key Drivers .............................................................................. 50
Appendix D: Stochastic Analysis Results ................................................................................................... 60

Proprietary & Confidential iii
EXHIBITS
Exhibit 1: Farmington Existing Supply Resources .............................................................................. 9 Exhibit 2: Farmington Existing Supply Resources vs. Projected Peak Load Percentiles ................. 10 Exhibit 3: Tri-State Contract Summary ............................................................................................. 11 Exhibit 4: WAPA Contract Summary ................................................................................................ 12 Exhibit 5: Gas Contract Summary .................................................................................................... 12 Exhibit 6: Coal Contract Summary .................................................................................................... 13 Exhibit 7: Competing Stakeholder Objectives ................................................................................... 14 Exhibit 8: San Juan Basin Gas Infrastructures ................................................................................. 18 Exhibit 9: San Juan Basin Gas Production vs. Incremental Shale Production ................................. 19 Exhibit 10: San Juan Basin Gas Production and Rig Counts ............................................................. 20 Exhibit 11: San Juan Basin Gas Production Forecast ........................................................................ 20 Exhibit 12: Farmington Local Conditions ............................................................................................ 22 Exhibit 13: Technology Assumptions .................................................................................................. 23 Exhibit 14: Summary of Key Drivers in Portfolio Construction and Screening ................................... 24 Exhibit 15: Candidate Portfolios for Stochastic Analysis .................................................................... 26 Exhibit 16: Summary of Average Load Stochastic Projections ........................................................... 28 Exhibit 17: Summary of Peak Load Stochastic Projections ................................................................ 28 Exhibit 18: Average and Peak Load Percentiles (MW) ....................................................................... 29 Exhibit 19: Summary of Portfolios 1-4 ................................................................................................ 30 Exhibit 20: Summary of Portfolios 5-9 ................................................................................................ 31 Exhibit 21: Comparison of Portfolio 4 and 9 ....................................................................................... 32 Exhibit 22: Coal Retirement Decision Cost and Emission Tradeoff .................................................... 33 Exhibit 23: Key Elements of the Preferred Resource Plan ................................................................. 35 Exhibit 24: Load Forecast Process ..................................................................................................... 37 Exhibit 25: Flow Chart of the Key Elements in Load Forecasting ....................................................... 38 Exhibit 26: Upside and Downside Assumptions ................................................................................. 40 Exhibit 27: Portfolio 1 Peak Capacity vs. Peak Load .......................................................................... 41 Exhibit 28: Portfolio 2 Peak Capacity vs. Peak Load .......................................................................... 42 Exhibit 29: Portfolio 3 Peak Capacity vs. Peak Load .......................................................................... 43 Exhibit 30: Portfolio 4 Peak Capacity vs. Peak Load .......................................................................... 44 Exhibit 31: Portfolio 5 Peak Capacity vs. Peak Load .......................................................................... 45 Exhibit 32: Portfolio 6 Peak Capacity vs. Peak Load .......................................................................... 46 Exhibit 33: Portfolio 7 Peak Capacity vs. Peak Load .......................................................................... 47 Exhibit 34: Portfolio 8 Peak Capacity vs. Peak Load .......................................................................... 48 Exhibit 35: Portfolio 9 Peak Capacity vs. Peak Load .......................................................................... 49 Exhibit 36: Western Interconnect Coordinating Council (“WECC”) Footprint ..................................... 50 Exhibit 37: Expected Value Demand Projections for New Mexico ..................................................... 51 Exhibit 38: Installed Capacity Profile – New Mexico (MW) ................................................................. 52 Exhibit 39: New Mexico Zone 2016 Supply Curve.............................................................................. 53 Exhibit 40: Projected New Mexico Energy Prices ............................................................................... 54 Exhibit 41: New Resource Technology Parameters – National Average ........................................... 55 Exhibit 42: Henry Hub Price Probability Bands ................................................................................... 56 Exhibit 43: PRB Basin Price Probability Bands .................................................................................. 57

Proprietary & Confidential iv
Exhibit 44: Carbon Compliance Cost Probability Bands ..................................................................... 58 Exhibit 45: New Mexico Peak Load Probability Bands ....................................................................... 59 Exhibit 46: Portfolio 1-4 NPV Cost Ranking (2016-2035) ................................................................... 60 Exhibit 47: Portfolio 1-4 Cost Stability (95
th Percentile) NPV Costs Ranking (2016-2035) ................ 61
Exhibit 48: Portfolio 1-4 Average Energy Purchase Exposures Ranking (2016-2035) ...................... 62 Exhibit 49: Portfolio 1-4 Development Risk Assessment .................................................................... 63 Exhibit 50: Portfolio 1-4 Control Risk Assessment ............................................................................. 63 Exhibit 51: Portfolio 1-4 Risk Metric Summary ................................................................................... 64 Exhibit 52: Portfolio 1-4 CO2 Emissions in 2025 Compare to 2016 .................................................... 65 Exhibit 53: Portfolio 1-4 Renewable Generation Share Ranking in 2035 ........................................... 66 Exhibit 54: Portfolio 1-4 Environmental Metric Summary ................................................................... 67 Exhibit 55: Portfolio 1-4 Average Reserve Margin Ranking (2016-2035) ........................................... 68 Exhibit 56: Portfolio 1-4 Largest Contingency Assessment ................................................................ 69 Exhibit 57: Portfolio 1-4 Operational Metric Summary ........................................................................ 70 Exhibit 58: Portfolio 5-9 NPV Cost Ranking (2016-2035) ................................................................... 71 Exhibit 59: Portfolio 5-9 Cost Stability (95
th Percentile) NPV Costs Ranking (2016-2035) ................ 72
Exhibit 60: Portfolio 5-9 Average Energy Purchase Exposures Ranking (2016-2035) ...................... 73 Exhibit 61: Portfolio 5-9 Development Risk Assessment .................................................................... 74 Exhibit 62: Portfolio 5-9 Control Risk Assessment ............................................................................. 75 Exhibit 63: Portfolio 5-9 Risk Metric Summary ................................................................................... 76 Exhibit 64: Portfolio 5-9 CO2 Emissions in 2025 Compare to 2016 .................................................... 77 Exhibit 65: Portfolio 5-9 Renewable Generation Share Ranking in 2035 ........................................... 78 Exhibit 66: Portfolio 5-9 Environmental Metric Summary ................................................................... 79 Exhibit 67: Portfolio 5-9 Average Reserve Margin Ranking (2016-2035) ........................................... 80 Exhibit 68: Portfolio 5-9 Largest Contingency Assessment ................................................................ 81 Exhibit 69: Portfolio 5-9 Operational Metric Summary ........................................................................ 82

Proprietary & Confidential Page 5
EXECUTIVE SUMMARY
In its 2016 Integrated Resource Plan (“2016 IRP”), the City of Farmington (“Farmington” or “the City”)
identifies its preferred strategy for satisfying its electric power requirements over the 2016-2035 timeframe
(“the planning horizon”). This plan addresses Farmington’s options to best meet Farmington’s objectives
of providing for its long-term electricity needs in a reliable, cost competitive, and flexible manner under a
wide variety of market, regulatory, and economic conditions. Farmington must re-evaluate its previous
plan to build a combined cycle (“CC”) power plant in light of the increasingly stagnant load requirements
against smaller more flexible alternatives such as reciprocating engines and combustion turbines. It also
must improve the fleets’ responsiveness and to provide voltage support and spinning reserves, as well as
improving overall costs in the eastern part of its territory. In addition, the City must factor in the
requirement of the Clean Power Plan (“CPP”) into its resource plan.
Farmington is currently a net purchaser of 30-40 MW of power during peak periods. Its current peak
requirements are approximately 200 MW. It is a load serving entity (“LSE”) with an ownership share in
the coal-fired San Juan Generating Station (“SJGS”) Unit 4 and also owns hydro and natural gas-fired
capacity. Farmington is concerned with finding a least-cost, responsive, low-risk, and environmentally
responsible plan to meet its load requirements over the study period. To achieve this goal, Farmington
would also like to consider rate stability, system reliability, and future renewable generation levels. The
City is contemplating a variety of technology options including natural gas fired combined cycle capacity,
combustion turbines, reciprocating engines, solar, and combination of these options.
MOTIVATING QUESTIONS
Pace Global’s Risk-Integrated Resource Planning (“RIRP”) analysis was designed to identify solutions to
key challenges that Farmington will face over the planning horizon.
The resource planning analysis is intended to provide insight into the following key questions.
What are the prudent, cost competitive and environmentally responsible approaches in Farmington’s long term resource planning to address the trends in the energy industry and the utility space such as decreasing prices for renewables and energy storage, finalization of the carbon regulation, and the penetration of distributed energy resources?
How do these new trends impact the requirement for any new generation resources that Farmington considers adding to its fleet?
How will the potential New Mexico CPP compliance strategy impact Farmington’s choice of a Preferred Resource Plan?
Should Farmington rely on market purchases to meet a portion of its peak load given the differences of its peak and average load?
What are the pros and cons for Farmington to lock into firm supply resources either from new builds or a long term Power Purchase Agreement (“PPA”)?
Should Farmington consider solar generation additions after the expected reductions in capital costs?
How much solar capacity can Farmington integrate into its system considering the characteristics of its current generation fleet and load profile?

Proprietary & Confidential Page 6
EVALUATION PROCESS
Like most electric utilities, Farmington, has to make resource decisions under a great deal of uncertainty.
A resource decision that meets all objectives when judged only under current or best guess forecasted
conditions may prove to be a future financial burden on the utility over time if the forecasts are incorrect.
Fuel market volatility, capital cost uncertainty, load uncertainty, emission regulations, and regulatory
changes will all affect how a resource portfolio performs throughout its operational life. Understanding the
range of potential market volatility and the severity of impending regulatory changes on alternative
generation portfolios is crucial to making sound portfolio choices. For Farmington, the least expensive
resource addition may not be the best if it also exposes the organization to severe market volatility or
negative effects associated with impending regulatory change. The tradeoffs between costs, risks,
reliability, operational responsiveness and flexibility, environmental stewardship, and other utility
objectives need to be quantified for each portfolio and need to inform the selection of the portfolio that will
perform best according to those objectives the utility ranks as its highest priorities. The Pace Global RIRP
methodology addresses all above important questions through a highly structured process that consisted
of the following steps:
Identify overall objectives and metrics
Recommend two CPP compliance cases
Provide load forecast
Technology screening analysis
Formulate candidate portfolios
Stochastic risk analysis of nine shortlisted portfolios to identify the Preferred Resource Plan
o Provide stochastic distributions for key variables
o Perform risk analysis for the candidate portfolios
Develop strategy and recommendations
The major steps listed above are presented in subsequent sections in this report.
PREFERRED RESOURCE PLAN
The Preferred Resource Plan needs to be flexible to adjust to uncertainties, including the San Juan Unit 4
retirement date. As a minority owner of the San Juan Unit 4, Farmington does not have full control of the
retirement date. San Juan Unit 4 provides 43 MW base load generation to Farmington’s customers,
accounting for one third of Farmington’s current total generation capacity. The San Juan Unit could retire
in 2022 or 2027 or possibly even later. The replacement of the San Juan capacity needs to be carefully
planned to have the adequate capacity (40-60 MW) and suitable technology to best achieve Farmington’s
cost, risk, environmental and operational objectives.
Pace Global recommends a Preferred Resource Plan that includes a staged new build approach to best
satisfy its cost, risk, environmental and operational objectives. Components of the Preferred Resource
Plan include:
In the near term, Farmington could build two 8.6 MW reciprocating engines in 2018. This decision is justified by three primary factors: (1) expiration of 25 MW Tri-State contract in 2017, (2) the

Proprietary & Confidential Page 7
economics of utilizing existing gas contract, and (3) need of flexible unit for voltage support.
In the mid-term, upon getting clarification of the San Juan Unit 4 retirement date, Farmington could build a combined cycle unit (~58 MW) to replace the City’s 43 MW of San Juan Unit 4.
In the long term, Farmington could build solar project (~ 5 MW) depending on load levels and ensuring reliability to City’s distribution systems. The integration of renewables can result in several benefits: diversify Farmington’s portfolio; lower the overall supply costs; and provide environmental benefits.

Proprietary & Confidential Page 8
FARMINGTON ENERGY SITUATION ASSESSMENT
FARMINGTON PROFILE
The Farmington Electric Utility System (“FEUS”), which is owned and operated by Farmington, is located
in northwest New Mexico. Farmington’s service territory of 1,718 square miles encompasses the City of
Farmington, all of San Juan County, the City of Bloomfield, and a portion of Rio Arriba County. FEUS
also provides transmission services for the City of Aztec, which owns its own substation and distribution
facilities to Williams Field Services. Williams Field Services wheels the generation output of its Milagro
facility to the Shiprock Substation for sale in the western markets. Finally, FEUS provides transmission
services to Tri-State Generation and Transmission Association.
Farmington is a load serving entity with an ownership share in the San Juan Generation Station Unit 4. It
also owns hydro and natural gas-fired capacity. As of the fiscal year that ended June 30, 2015, the
Electric System was serving 44,627 metered customers. Farmington’s current peak requirements are
approximately 198 MW. Farmington is a net purchaser of 65 MW of power during peak periods.
The key characteristics that will drive Farmington’s needs pertaining to new generation are its load growth
and the economic conditions of the surrounding area. One of the key load uncertainties will be related to
standard regional profile questions (e.g., weather, population, and usage) and resource-based economic
development activities. The San Juan basin has experienced boom-bust cycles in the past associated
with oil and gas development. Particularly, San Juan County has had a major concentration of jobs and
income in the energy and the mining and extractives sectors. A continued weak energy market could
further slowdown Farmington’s load growth. A shutdown of SJGS one or more units could particularly
impact coal use. The loss of these economic base jobs could ripple through the local economy, resulting
in additional job losses in the industries that support the extractive industries, as well as in the service
sectors.
GENERATION FACILITIES AND POWER PURCHASE CONTRACTS
As a load serving entity, Farmington has a mix of generation assets with a total peak capacity of 133 MW.
This includes an ownership share in the coal-fired SJGS Unit 4, hydro and natural gas-fired capacity.
Exhibit 1 outlines Farmington’s existing supply resources. They can be summarized as follows:
Farmington’s Bluffview Power Plant, a 63 MW combined-cycle power plant that began its commercial operation in 2002. It uses a GE LM6000 combustion turbine and a Siemens steam turbine.
An eight percent (43 MW) ownership stake in San Juan Unit 4, which has a total capacity of 507 MW and is operated by Public Service Company of New Mexico (“PNM”)
Navajo Dam Hydro Plant Units 1 and 2, which have an average capacity of 9 MW and nameplate capacity of 30 MW.
Animas Plant, which is an 18 MW simple cycle power plant, with an inefficient heat rate of 12,124 Btu/KWh.

Proprietary & Confidential Page 9
Exhibit 1: Farmington Existing Supply Resources
Source: Farmington, Pace Global.
At its peak load requirements of approximately 198 MW, Farmington is a net purchaser of approximately
43 MW of power during peak periods from Western Area Power Administration (“WAPA”) and Tri-State.
Farmington’s power purchase contract with Tri-State and WAPA expires in 2017 and 2024, respectively.
SUPPLY AND DEMAND BALANCE
Farmington’s owned capacity portfolio is not sufficient to meet its expected peak load. For example for the
near term the reserve margin is expected to decline from its current level of negative 8 percent in 2016 to
negative 20 percent in 2019 after the Tri-State contract expires. Exhibit 2 presents the current portfolio
capacity relative to expected peak load (mean, 25 percentile, and 75 percentile levels).
Status quo conditions (i.e., relying on market purchases to fill the capacity shortage) involve significant
risk throughout the planning horizon due to high market exposure and a low reserve margin. In addition,
the status quo is not consistent with Farmington’s objective to become a net generator in serving its load
and maintaining rate stability.
Forced
OutageHeat Rate
Winter
CapacityVOM FOM
SO2
Emission
Rate
NOx
Emission
Rate
CO2
Emission
Rate
% Btu/KWh MW 2013$/MWh 2013$/MWh lbs/MMBtu lbs/MMBtu lbs/MMBtu
Animas CT 100% WECC DESERT SW 2015 Gas CT 0.50% 12,124 18.0 3.00 12.36 0 0.08 117
Bluffview 100% WECC DESERT SW 2005 Gas CC 1.07% 7,573 63.0 3.56 4.43 0 0.04 116
Navajo Dam 100% WECC DESERT SW 1989 Water HY 0% N/A 9.0 0 4.88 0 0 0
San Juan
Generating
Station Unit 4
8.48% WECC DESERT SW 1982 Coal ST 2.50% 11,000 43.0 2.50 11.16 0.08 0.28 210
Prime
MoverPlant Name
NERC
Region
NERC Sub
Region
Online
YearFuel
Percent
Owned

Proprietary & Confidential Page 10
Exhibit 2: Farmington Existing Supply Resources vs. Projected Peak Load Percentiles
Note: Above graph shows an indicative retirement of SJGS Unit 4 by the end of 2027 for illustration purposes. Source: Farmington, Pace Global.
43 43 43 43 43 43 43 43 43 43 43 43
9 9 9 9 9 9 9 9 9 9 9 9
9 9 9 9 9 9 9 9
63 63 63 63 63 63 63 63 63 63 63 63
63 63 63 63 63 63 63 63
18 18 18 18 18 18 18 18 18 18 18 18
18 18 18 18 18 18 18 18
18 18 18 18 18 18 18 18 18 18 18 18
18 18 18 18 18 18 18 18
25 25
-
25
50
75
100
125
150
175
200
225
250
2016 2017 2018 2019 2020 2021 2022 2023 2024 2025 2026 2027 2028 2029 2030 2031 2032 2033 2034 2035
MW
Farmington Status QuoPeak Capacity by Fuel/Unit Type vs. Peak Load Percentiles
San Juan (Coal) Navajo (Hydro) Bluffview (CC) Animas (CT) WAPA PPA Tri-State PPA Peak Load 25th Pct Peak Load 50th Pct Peak Load 75th Pct
No new resource additions; Coal retire after 2027

Proprietary & Confidential Page 11
FARMINGTON CONTRACTS POSITION ASSESSMENT
In addition to the existing and new generation resources, Pace Global explicitly considered Farmington’s
contract positions in this IRP. This section discusses the specific considerations of the power, gas and
coal contracts in the IRP study.
POWER PURCHASE CONTRACT
Farmington currently has two power purchase contracts. Exhibit 3 and Exhibit 4 present the terms of the
Tri-State and WAPA contracts that are considered in the IRP.
The PPA with Tri-State includes approximately 25 MW on-peak and 15 MW off-peak power. The Tri-State contract expires in 2017. While a renewal strategy could be negotiated and pursued, for planning purpose in this IRP, Pace Global does not assume renewal of this contract.
The PPA with WAPA includes approximately 18 MW capacity and power for summer and 17 MW for winter. The WAPA contract expires in 2024. Based on preliminary discussion with the City and for planning purpose in this IRP, Pace Global assumes renewal of this contract as a capacity-only PPA after 2024.
Exhibit 3: Tri-State Contract Summary
Source: Farmington.
On Peak
Contract Price
Off Peak
Contract Price
On Peak
Quantity
Off Peak
Quantity
Nominal $/MWh Nominal $/MWh MWh MWh
1/1/2016 1/31/2016 47.50 34.50 10,000 5,160
2/1/2016 2/29/2016 47.50 34.50 10,000 4,440
3/1/2016 3/31/2016 47.50 34.50 10,800 4,680
4/1/2016 4/30/2016 47.50 34.50 10,400 4,560
5/1/2016 5/31/2016 47.50 34.50 10,000 5,160
6/1/2016 6/30/2016 47.50 34.50 10,400 4,560
7/1/2016 7/31/2016 47.50 34.50 10,000 5,160
8/1/2016 8/31/2016 47.50 34.50 10,800 4,680
9/1/2016 9/30/2016 47.50 34.50 10,000 4,800
10/1/2016 10/31/2016 47.50 34.50 10,400 4,920
11/1/2016 11/30/2016 47.50 34.50 10,000 4,800
12/1/2016 12/31/2016 47.50 34.50 10,400 4,920
1/1/2017 1/31/2017 52.50 37.75 10,000 5,160
2/1/2017 2/28/2017 52.50 37.75 9,600 4,320
3/1/2017 3/31/2017 52.50 37.75 10,800 4,680
4/1/2017 4/30/2017 52.50 37.75 10,000 4,800
5/1/2017 5/31/2017 52.50 37.75 10,400 4,920
6/1/2017 6/30/2017 52.50 37.75 10,400 4,560
7/1/2017 7/31/2017 52.50 37.75 10,000 5,160
8/1/2017 8/31/2017 52.50 37.75 10,800 4,680
9/1/2017 9/30/2017 52.50 37.75 10,000 4,800
10/1/2017 10/31/2017 52.50 37.75 10,400 4,920
11/1/2017 11/30/2017 52.50 37.75 10,000 4,800
12/1/2017 12/31/2017 52.50 37.75 10,000 5,160
Begin Date* End Date

Proprietary & Confidential Page 12
Exhibit 4: WAPA Contract Summary
Begin Date End Date
Energy Contracted
Price ($/MWh)
Capacity Contracted Price
($/KW-month)
Summer Capacity
(MW)
Winter Capacity
(MW)
1/1/2016 12/31/2024 12.19 5.18 18 17
1/1/2025* 12/31/2035 N/A 5.18 18 17
*Note: The current WAPA PPA contract expires in 2024 and the post 2025 PPA extension is based on preliminary discussion with the City of Farmington. The extension is assumed as a capacity-only PPA.
Source: Farmington
GAS SUPPLY CONTRACT
Farmington has one gas supply contract for 14,700 MMBtu per day that expires by the end of 2020.
Exhibit 5 presents the gas contract terms. The gas supply contract is explicitly considered in the IRP in
the following aspects:
The portfolio constructions take into account of this gas contract position and include small new builds as early as 2018 in some candidate portfolios for the stochastic analysis.
The gas plants dispatch decisions are based on market prices, but in the post processing, the differential of the contract price and the market price is applied to the contracted quantity. This captures the total cost of gas to Farmington, without disadvantaging gas units’ economic dispatches. For any unused portion of the gas, the calculation assumes remarketing the gas at market prices.
The City will receive a credit of $0.2894/MMBtu as a result of a prepay gas arrangement with NMMEAA for 12,500 MMBtu per day that expires in July 30, 2019. The Gas Contract Summary contract price provided below does not reflect the NMMEAA arrangement credit.
Exhibit 5: Gas Contract Summary
Begin Date End Date
Contract Price
(including
delivery charge)
Contract Quantity
Nominal $/MMBtu MMBtu per day
10/1/2015 9/30/2016 4.77 14,700
10/1/2016 9/30/2017 4.80 14,700
10/1/2017 9/30/2018 4.85 14,700
10/1/2018 9/30/2019 4.90 14,700
10/1/2019 12/31/2020 4.90 14,700
Source: Farmington

Proprietary & Confidential Page 13
COAL SUPPLY CONTRACT
Farmington has one coal supply contract that expires in 2021. Exhibit 6 presents the coal contract prices
included during 2016-2021. The San Juan unit 4 dispatches are based on market prices, but in the post
processing, the differential of the contract price and the market price is applied to the consumed quantity.
This captures the total cost of coal to Farmington. After 2021, market prices are used in evaluating overall
portfolio costs.
Exhibit 6: Coal Contract Summary
Year Contract Prices
(2014$/MMBtu)
2016 2.08
2017 2.15
2018 2.63
2019 2.64
2020 2.57
2021 2.32
Note: The prices are calculated to include fixed costs and variable costs.
Source: Farmington

Proprietary & Confidential Page 14
FARMINGTON IRP OBJECTIVES AND METRICS
To properly evaluate resource decisions, Farmington identified the planning objectives very early in the
resource planning process. A consensus was developed around the Preferred Resource Plan by
selecting the portfolio that best met the planning objectives over a wide range of regulatory and market
outcomes. Metrics for each planning objective were created to form a basis for comparing different
portfolios.
Even with the appropriate metrics identified for each planning objective, the tradeoffs associated with
resource decisions represent the biggest challenge for resource planning. Exhibit 7 displays four
competing objectives, identified as priorities. As is shown, focus on any one objective can move the
resource plan away from focus on the others. In the IRP process, a wide range of metrics were used to
rank portfolios for each objective, helping Farmington to evaluate the tradeoffs associated with different
portfolio options and, ultimately, arrive at a resource plan that balances many competing goals.
Exhibit 7: Competing Stakeholder Objectives
Source: Pace Global
COST OBJECTIVES
Preserve Competitive Rates
Preserving competitive rates is a common objective for utilities. In Farmington’s case, the objective is to
select the lowest-cost supply options and, therefore, minimize the rate impact on the customers. Pace
Objectives Metrics
Cost Cost Minimize power supply costs
and rate increases
2016-2035 Cost NPV ($ million)
2016-2035 Levelized Costs
Risks Cost Stability Achieve rate stability 2016-2035 95th Percentile Cost NPV ($
million)
Development
Risks
Minimize project
development risks
Project development uncertainties
Control Risks Minimize operation risks and
other uncertainties
Operational and control risks
Market Risks Decrease energy market
purchase exposure
2016-2036 Average energy market purchase
exposure
Environmental Environmental
Stewardship
Decrease emissions and
increase renewable
generation
CO2 emission in 2025 relative to 2016;
Renewable generation percentage in 2035
Operational Reserve
Margin
Ensure reliability
requirements with native
capacity
2016-2036 Average reserve margin
Largest
Contingency
Minimize largest contingency
in the generation fleet
Size of the largest contingency unit in 2035

Proprietary & Confidential Page 15
Global used portfolio cost minimization as a proxy for maintaining competitive rates. For comparative
purposes, different portfolio options were evaluated based on the levelized net present value of all
generation-related costs associated with serving Farmington’s load (in millions of dollars and dollars per
MWh). The IRP cost metric included the variable cost of generation, fixed costs, executed contracts costs,
capital cost investments, and the cost of net market transactions (purchases minus sales).
RISK OBJECTIVES
Maintain Stable Rates (Price Risk)
Rate stability can be measured by different metrics like standard deviation or probability bands. For this
analysis, portfolios were evaluated against statistically derived distributions on key market drivers like
natural gas prices, coal prices, energy demand, carbon prices, power market prices, and capital costs.
Rather than recording portfolio costs under one set of assumptions, Pace Global measured costs under a
distribution of the key assumptions drivers. In this context, portfolios were evaluated based on the
difference between the mean of the distributions of total incremental generation costs and the 95-percent
confidence band of the distribution of these costs. This represented a metric of how wide the cost
distribution could become for each portfolio. The lower the difference between the mean and the 95-
percent confidence band, the less exposed the portfolio is to market volatility.
Manage Market Risks
Although the ability to sell and buy in the spot market represents a significant benefit to Farmington by
allowing it to optimize its resources, significant reliance on the wholesale market can constitute a risk for
Farmington. The spot market could be highly volatile and the utility’s dependence on a large volume of
market transactions increases the market uncertainty and higher market transactions is assigned with an
unfavorable score
Minimize Development Risks
The availability of certain portfolio options (such as the CPEC development project) is uncertain and out
of Farmington’s control. In contrast, Farmington has greater control of the building smaller generation
resources that is closely tailored to its contracting positions, load profile and coal retirement dates.
Minimize Control Risks
As a potential minority owner of a generation station like CPEC, Farmington is unlikely able to make dispatch decisions to best support the operational flexibility of its system. Alternatively, if Farmington outright owns a generation the City can solely decide whether a dispatch is warranted. This tradeoff should be weighed against the cost effectiveness of this portfolio, should this option materialize.
ENVIRONMENTAL OBJECTIVES
CO2 Footprint
An increasing concern regarding global climate change has put specific emphasis on the carbon footprint
associated with different power generating resource options. Although coal-fired generation remains one
of the low cost resources, its environmental impacts pose a growing concern to the public and utility
planners. Moreover, the potential advent of significant costs associated with CO2 emissions constitutes a
major risk for coal plant owners. With this context in mind, different portfolio options were evaluated
Proprietary & Confidential Page 16
based on the achieved CO2 footprint growth by 2025 from the 2016 baseline. Assuming all other metrics
remain the same, any portfolio that achieves slower CO2 emission growth will be preferable.
Renewable Generation
Although the City does not face a specific regulation concerning a renewable generation target at this
time, Farmington’s environmental goals require the addition of renewable resources to the supply mix,
especially in the long term. Analysis showed that increasing generation from renewable resources will
also directly result in reduced CO2 emissions for the portfolio. The percentage of generation from
renewable resources was the metric used to reflect greater renewable stewardship. Different portfolio
options were evaluated based on the percentage of the utility’s net energy for load to be served by
renewable generation by 2035. As such higher renewable penetration portfolio is assigned with a
favorable score.
OPERATIONAL OBJECTIVES
Provide Reliable Service
In Farmington’s case, system reliability is a primary concern. Farmington is currently short on owned
capacity and has historically relied on the wholesale market to meet a portion of its load requirements.
Going forward, one of Farmington’s primary objectives is to meet its growing native load by using
generation from locally owned resources.
To assess the associated risk, Farmington’s 20 years average supply resource availability as a
percentage of peak load between 2016 and 2035 (reserve margin) was used as a risk metric for each
portfolio. Portfolios with insufficient capacity to meet native load were assigned negative scores due to
too much exposure to the market.
Manage and Monitor Largest Contingency
Farmington seeks to add smaller more flexible generation resources to improve the fleets’
responsiveness and to provide voltage support and spinning reserves, as well as improving overall costs
in the eastern part of its territory. In the IRP analysis, we monitor the largest contingency as existing
resources are replaced with new resources. The greater share or a reliance of a single resource in a
portfolio can expose to a reliability issue.

Proprietary & Confidential Page 17
CLEAN POWER PLAN CASES
The EPA released the draft performance standards, also known as the Clean Power Plan, for existing
generating units under §111(d) of the Clean Air Act on time on June 2, 2014. The final rule was released
on August 3, 2015. The CPP establishes state by state emission targets for affected existing generation
units. States drive the approach to meet their goal, including choosing to comply as a rate goal (lb
CO2/MWh) or a mass goal (short tons of CO2). Overall, the aggregate state goals (on a mass basis)
would reduce emissions from affected sources by an estimated 32 percent below 2005 levels by 2030.
The initial compliance period under the rule would begin in 2022 with the final reduction goal to be
achieved by 2030. Trading between states would be encouraged under the CPP.
On February 9, 2016, the Supreme Court of the United States granted a request to stay the Clean Power
Plan, after the D.C. Circuit Court denied this request initially. As a result, the CPP is not in effect at this
time until the D.C. Circuit Court rules on the pending legal challenges and the stay is lifted. The deadlines
for states to submit compliance plan milestones, the earliest of which would have been September of
2016, are uncertain at this time. There is a great deal of uncertainty at this time over how the states will
formulate their compliance plans as well as the extent to which legal challenges or congressional action
will change the proposed regulations. Despite these uncertainties, Pace Global assumes that the rule is
implemented on schedule and two different compliance options that New Mexico appears likely to adopt
based on their goal defined in the final rule and the expected future generation mix of the state. These
two compliance options for New Mexico are a mass-based approach to compliance whereby New Mexico
opts into a national trading scheme and mass-based approach to compliance with New Mexico only
allowing for intrastate trading amongst affected entities within the state.
New Mexico appears to be well positioned to comply with its goal prescribed under the CPP under either
a rate or mass approach. The announced retirements of San Juan units result in a significant reduction in
projected emissions from existing generating sources covered under the CPP relative to the baseline.
Adopting a mass-based approach to CPP compliance is viewed as many to be less complicated and
therefore favorable, if from an administrative standpoint only, over a rate approach. For this reason, Pace
Global assumes mass-based compliance for New Mexico for both CPP compliance cases.
Mass-based with interstate trading: New Mexico adopts a mass-based goal and opts into the national trading program. Allowances are freely traded amongst all states that also opt into the mass-based federal trading program, regardless of geographic location. Carbon value is based on the marginal cost to comply for all states in the trading program. New Mexico is expected to be in a net long position for allowances and therefore can sell additional allowances to buyers outside of the state.
Mass-based with intrastate trading: New Mexico adopts a mass-based goal but does not opt into national trading. Trading is a compliance option for affected generators located in the state but only with other in-state parties. Carbon value is based on the marginal cost to comply for New Mexico only.
Pace Global performed stochastic analysis for the nine portfolios under both CPP cases to assess the
overall performance of the portfolios.

Proprietary & Confidential Page 18
LOAD FORECAST
As part of the 2016 IRP process, Pace Global performed a long-term load forecast for resource planning
studies. In order to do so, FEUS’s historical load data and consumption patterns were analyzed.
Historically, the average load grew at a Compounded Annual Growth Rate (“CAGR”) of 0.7 percent and
the peak load at 1.8 percent between 2000 and 2015. The analysis suggested that FEUS’s load forecast
will depend on the extent of oil and gas exploration and production (“E&P”) activities undertaken in the
region. Pace’s load forecast is aligned with the outlook for exploration activities and the opportunities for
electrification in the region.
SAN JUAN BASIN OUTLOOK
The San Juan Basin currently accounts for 3.5 percent of Lower 48 gas production (2.5 Bcf/d), down from
5.5 percent five years ago (3.2 Bcf/d). Primarily a dry gas play with little oil production but with some
incremental Natural Gas Liquid (“NGL”) production, the San Juan Basin provides gas supplies to markets
in California, Arizona, and New Mexico. 55 percent of San Juan gas comes from coal bed methane
(“CBM”) deposits, with the other 45 percent from conventional drilling. By 2030, this balance is expected
to shift to 40 percent and 60 percent, respectively. CBM and conventional supplies have faced increasing
gas-on-gas competition from new shale resources. While California remains an important premium
market and expected new Gulf Coast demand (LNG exports, etc.) will help to stabilize long-term
production, the San Juan Basin is not expected to be a region of new natural gas production growth. In
terms of infrastructure, San Juan Basin gas supply is accessed via El Paso, Transwestern,
Transcolorado, Northwest, and others as shown in Exhibit 8.
Exhibit 8: San Juan Basin Gas Infrastructures
Source: Pace Global, Energy Velocity

Proprietary & Confidential Page 19
San Juan gas production has seen steady declines since 2006. It faces increasing competition from new
shale gas sources such as the nearby Eagle Ford play but also the more distant Utica and Marcellus
plays. San Juan economics are less favorable than new shale resources. The resulting gas-on-gas
competition is crowding out the San Juan, which only a large increase in demand will help to reverse.
Exhibit 9 shows the comparison of San Juan Basin gas production vs. incremental shale gas production
since 2006.
Exhibit 9: San Juan Basin Gas Production vs. Incremental Shale Production
Source: Pace Global
In the near term to 2020, San Juan gas production will continue to decline in the absence of new drilling.
Drilling rig counts have effectively gone to zero in the San Juan Basin as production has shifted toward
low-cost shale plays. The rig count and production forecasts in Exhibit 10 takes into account the current
economic reality (i.e., forwards trading) in the San Juan Basin. Existing wells will continue to produce
over the long tail of production curves in the San Juan Basin, but absent new drilling this recent
production trend will continue.
-
5,000
10,000
15,000
20,000
25,000
0
500
1,000
1,500
2,000
2,500
3,000
3,500
4,000
4,500
2006 2007 2008 2009 2010 2011 2012 2013 2014 2015
Incre
men
tal
Sh
ale
(M
Mcf/
d)
San
Ju
an
(M
Mcf/
d)
San Juan Basin Gas Production vs. Incremental Shale since 2006 from the Eagle Ford, Marcellus, and Utica
San Juan Production Incremental Shale

Proprietary & Confidential Page 20
Exhibit 10: San Juan Basin Gas Production and Rig Counts
Source: Pace Global
Outlook for San Juan gas production depends on new demand markets and recovery in gas prices.
Under Scenario One, gas prices remain persistently low allowing San Juan production to continue a slow
decline. Under Scenario Two, anticipated new LNG demand in Gulf Coast markets, continued demand
from California, and rising consumption from gas-fired plants helps to move San Juan production back to
a slow rise. By 2030, shale plays will have matured, raising production costs and shifting production back
to conventional and CBM resources like the San Juan Basin. Exhibit 11 shows the San Juan Basin gas
production forecast scenarios.
Exhibit 11: San Juan Basin Gas Production Forecast
Source: Pace Global
-
500
1,000
1,500
2,000
2,500
3,000
3,500
4,000
4,500
Ja
n-0
6
Sep
-06
Ma
y-0
7
Ja
n-0
8
Sep
-08
Ma
y-0
9
Ja
n-1
0
Sep
-10
Ma
y-1
1
Ja
n-1
2
Sep
-12
Ma
y-1
3
Ja
n-1
4
Sep
-14
Ma
y-1
5
Ja
n-1
6
Sep
-16
Ma
y-1
7
Ja
n-1
8
Sep
-18
Ma
y-1
9
MM
cf/
d
San Juan Basin Gas Production History and Forecast (Short-Term)
Colorado San Juan New Mexico San Juan
Forecast
0
5
10
15
20
25
30
Ja
n-0
6
Oct-
06
Ju
l-0
7
Ap
r-0
8
Ja
n-0
9
Oct-
09
Ju
l-1
0
Ap
r-1
1
Ja
n-1
2
Oct-
12
Ju
l-1
3
Ap
r-1
4
Ja
n-1
5
Oct-
15
Ju
l-1
6
Ap
r-1
7
Ja
n-1
8
Oct-
18
Ju
l-1
9
Gas R
ig C
ou
nts
San Juan Basin - Gas Rig Counts
Colorado San Juan New Mexico San Juan
0
500
1,000
1,500
2,000
2,500
3,000
3,500
4,000
4,500
20
16
20
17
20
18
20
19
20
20
20
21
20
22
20
23
20
24
20
25
20
26
20
27
20
28
20
29
20
30
20
31
20
32
20
33
20
34
20
35
20
36
20
37
20
38
20
39
20
40
MM
cf/
d
San Juan Basin Gas Production - Long Term Forecast by Scenario
Scenario One Scenario Two

Proprietary & Confidential Page 21
LOAD FORECAST PROCESS
The base load forecast was driven by the San Juan Basin gas production outlook. As discussed, there
are two types of impacts to the load: direct and indirect (also called services) impacts. The former
quantifies the direct load addition to the base case forecast, due to factors like oil and gas field
electrification opportunities or compressor requirements for pumping. The latter quantifies the change in
population due to influx of people moving into Farmington’s service area or decline in population due to
people moving out (mine closure effects). These population shifts lead to changes in residential and
commercial load. Additional details can be found in Appendix A: Load Forecast Methodology.
Pace Global also considered studies performed by the Federal Energy Regulatory Commission (“FERC”)
on demand response potential. This information is publicly available. According to this study, the
expected peak reduction over a 10-year period will be 15 percent of the unadjusted peak. Pace Global
used this data in the load forecasting exercise for Farmington.

Proprietary & Confidential Page 22
TECHNOLOGY SCREENING
TECHNOLOGY SCREENING CONSIDERATIONS
The goal of the technology screening is to identify technically feasible and commercially viable generation
resources that could be used as building blocks in constructing portfolios. For this reason, the technology
screening focuses on resource options could meet Farmington’s new generation resource requirements,
including:
Size of the new generation resource, which is informed by factors including load profile, existing resources retirement, and PPA expiration, etc.
Resource type: base load, intermediate, intermittent, or peaking resources
Characteristics: ramping rates, ability to provide voltage support, flexibility
Fuel type: fossil-fueled or renewable generations
Farmington local considerations: altitude, pressure, natural wind or solar resources, etc.
The technology selection considered a combination of dispatchable fossil-fueled generation resources
and renewable technologies. Fossil-fueled resources included combustion turbines (“CTs”), combined
cycle gas turbines (“CCGTs”), reciprocating engines, as well as a conversion options that allows
development flexibility, i.e., build CT initially and add steam turbine generator (“STG”) later to convert into
a CC facility. For renewables, though both wind and solar are possible in Farmington area, marginal wind
resources, attractive solar resources, and rapidly declining solar costs favor solar.
Since the capacity and heat rate of gas turbine-based power plants significantly decreases with increases
in altitude and temperature, Farmington’s local conditions were used to derive factors for adjusting the
rated capacity and heat rate of each gas-fired technology option. The local conditions in Farmington used
to make this adjustment are presented below in Exhibit 12.
Exhibit 12: Farmington Local Conditions
Site Metric Units Measure
Altitude ft amsl 5,300
Ambient Dry Bulb Temp Deg. F 59.3
Ambient Wet Bulb Temp Deg. F 48.4
Barometric Pressure mm of Hg 1,013.3
Relative Humidity % 33.8
Source: Tutiempo Network, Pace Global
TECHNOLOGY ASSUMPTIONS
Technology performance and costs were estimated for several gas-fired and solar technologies which
could become part of the City of Farmington’s future power generation portfolio. For each technology,
capital costs were estimated to include EPC contract, required owner’s costs, and financing costs. The
estimated capital costs were somewhat higher than might be expected in the broader market areas

Proprietary & Confidential Page 23
because (1) the smaller unit size resulted in a diseconomy of scale relative to larger units, and (2) the site
elevation conditions resulted in a substantial unit derate, which in turn would require Farmington to
purchase a larger unit at a higher cost than might otherwise be necessary to generate the required
capacity.
A variety of gas-fired technologies were considered and all were sized to meet the City of Farmington’s
potential demand. Adjusted (for local conditions) performance and current capital cost estimates for gas-
fired technologies are provided in Exhibit 13 and are used as the basis for portfolios construction in this
IRP.
Exhibit 13: Technology Assumptions
Source: Pace Global estimates and analysis.
When Pace Global selected new generation options for inclusion in portfolios, a particular unit design
based on an actual product is chosen as representative of a class of similar units. In all cases, there is at
least one additional unit available from a different manufacturer with similar enough characteristics that
competitive bidding will be possible at the time a project is implemented.
Site Capacity Site Heat Rate net Capex
kW net Btu/kWh HHV $2014/kW net site
GE 1xLM6000 PF 39,386 9,299 1,319
GE 1xLM6000 PG 43,846 8,942 1,325
LM6000 PF 1X1 CC with Duct Fire, Wet Cooling 57,917 7,490 1,643
2x1 LM6000 PC SPRINT 106,589 7,628 1,296
GE J920 Flex 8,600 7,729 1,155
Wartsila 20V34SG 18,513 8,394 1,040
20 MW Aero SCGT, LM2500 PJ 18,354 10,774 1,771
Siemens SCC-800 59,309 7,515 1,872
Siemens SCC-800 with Duct Fire 71,064 7,700 1,301
Solar (Fixed Mount) N/A N/A 1,986
Solar (Tracking System) N/A N/A 2,234
Equipment Model

Proprietary & Confidential Page 24
CANDIDATE PORTFOLIOS
CANDIDATE PORTFOLIOS CONSTRUCTION AND SCREENING
Based on the technology screening assumptions as shown in Exhibit 13, Pace Global and Farmington
screened portfolios that would add gas or solar resources to the current asset base during the planning
horizon. Exhibit 14 presents a summary of the key drivers in the portfolio construction and screening.
The portfolios construction takes into account of several important considerations, including:
Near-term decision of relying on market purchases or building new resources (recips or CTs)
SJGS Unit 4 retirement: by 2022 or 2027
Different market exposures to have generation capacity long, short or at load
Different technologies for gas-fired generation resources
Acquisition (Clean Path Energy Center (“CPEC”) shares vs. new build options
Gas only new resources vs. a combination of gas and renewable generations
Exhibit 14: Summary of Key Drivers in Portfolio Construction and Screening
Source: Pace Global
Solar Integration
In constructing and screening the portfolios, the level of solar integration is considered. The ability of
Farmington’s fossil fueled peaking units to accommodate a high level of solar is prohibitive, because the
Animus simple cycle unit cannot be used for cycling purpose due to it technical limitations and inefficient
Proprietary & Confidential Page 25
heat rate. Moderate level of solar capacity ranging 5 MW to 15 MW was identified with the City and is
incorporated into certain candidate portfolios.
Portfolio Positions: Long vs. Short
Currently, markets are soft, which suggests that having an “open” position (buying power from the market)
is sound for a portion of its needs until markets strengthen. Farmington is part of the southwest reserve
sharing group and has historically procured both capacity and energy to cover short peak positions.
Because Farmington’s average load is on average 60 MW lower than the peak load in 2016 and expected
to grow over time, Farmington’s planning strategy is not to overcommit its capacity levels significantly
above its peak load. Rather rely on PPA contracts or market purchases to cover a small portion of short
term peak load shortages. This is likely a preferred path for the City because there are load uncertainties
due to distributed generation and other cogeneration opportunities that could result in lower than
anticipated load over time.
Typically, in an IRP, we consider some portfolios that are short against others that are at or long relative
to the load, so that the risks of being heavily exposed to the market are reflected in the risk analysis. An
initial cost assessment indicates that a significant surplus capacity portfolio generally commands some
cost premium for the City of Farmington. It does not reward building long portfolios. As a result of the
assessment it is explicitly reflected in the screening analysis to form the nine candidate portfolios.
CPEC Project Development
It is uncertain whether the proposed CPEC project could be sufficiently “de-risked” by early 2017 for it to
be a viable option. CPEC is an early stage development project sponsored by Wester Energy Partners
(WEP), SNC-Lavalin, and Stonepeak Infrastructure Partners. The generation facility will include combined
cycle natural gas-fired capacity of 715 MW and solar photovoltaic (“PV”) capacity of 55 MW. It will be
located in Waterflow, San Juan County, New Mexico, adjacent to Farmington’s service territory. Currently,
CPEC is aiming for Commercial Operation Date (“COD”) by April 2021, and is seeking one or more
buyers. In addition, it is uncertain whether an initial purchase of 50 MW, followed by additional purchase
of approximately 50 MW (based on the load growth and San Juan Unit 4 retirement schedule) is
commercially viable and acceptable to the project sponsors. From an operation perspective, Farmington
needs responsive and flexible units, and the potential minority ownership of the CPEC project could
compromise this objective. CPEC presents uncertainties and risks that could offset its competitiveness
from a cost perspective.
CANDIDATE PORTFOLIOS FOR STOCHASTIC ANALYSIS
Pace Global and Farmington screened to construct nine candidate portfolios as presented in Exhibit 15.
These portfolios allow for the consideration of a reasonable range of uncertainties. Each of these
portfolios is evaluated in the stochastic analysis under two CPP cases.

Proprietary & Confidential Page 26
Exhibit 15: Candidate Portfolios for Stochastic Analysis
Note: San Juan unit 4 retirement year is an assumption for the IRP modeling purpose only. The coal unit, as of the
date of this analysis, has not announced a potential retirement date. Source: Pace Global, Farmington

Proprietary & Confidential Page 27
STOCHASTIC ASSESSMENT OF CNDIDATE PORTFOLIOS
STOCHASTIC INPUT DEVELOPMENT
Stochastic inputs used in the risk integrated resource planning process were based on a combination of
historic volatility and expectations for future market trends. Pace Global’s market insight was used to
develop a view on future market trends; statistical and modeling tools were then employed to quantify the
uncertainty around the expected trends and evaluate the performance of each portfolio under different
uncertainties. The stochastic analyses required that uncertainties in these forecasts be determined. The
effects of the load, fuel prices, CO2 prices, and capital costs uncertainty on the portfolios were quantified
over the study horizon under 200 different simulations.
Stochastic Load Forecasts
For incorporation in the risk-integrated portfolio analysis, Pace Global developed a stochastic load
forecast for the average and peak load. The load forecasting process consisted of two steps: Step 1,
called the “Parametric forecast”, was performed by building a regression model using weather and
personal income as explanatory variables. This step consists of building the weather response functions
for average and peak load. To forecast future weather, a random sampling of the past weather (from 17-
years history) was performed. To predict future personal income, a Geometric Brownian Motion (“GBM”)
model was developed.
Step 2, called the “quantum forecast”, was performed to quantify the additional uncertainty due to
demand side management measures. This step captured the up and downside risks to the load forecast
developed in Step 1. Downside potential stemmed from energy efficiency and demand response
programs. Additional details on load forecast methodology can be found in Appendix A: Load Forecast
Methodology.
The inputs used for the stochastic process were based on a combination of historical volatility and growth
rate for personal income and population. They were also based on Pace Global’s expectations for future
load growth trends. These trends were aligned with the expectation of new electrification opportunities
(driven by exploration) in the San Juan basin. Statistical and modeling tools were then employed to
quantify the uncertainty around the expected trends.
Analysis revealed that Farmington’s load growth uncertainty contains nearly as much downside as upside.
For the average load, the expected case (mean) has an estimated CAGR of 0.52 percent for the time
period 2016 to 2036. The peak load’s CAGR is 0.56 percent for the same time period. Both the average
and peak loads remain more-or-less flat from 2016 to 2030, at less than 0.1 percent. Beyond 2030, the
uptick in the load growth rate is driven by expectation of new exploration & production rigs in the region.
Exhibit 16 and Exhibit 17 display the details pertaining to average and peak load stochastic projections.
Exhibit 18 displays percentile bands for the average and peak load stochastic distributions.

Proprietary & Confidential Page 28
Exhibit 16: Summary of Farmington’s Average Load Stochastic Projections
Source: Pace Global.
Exhibit 17: Summary of Farmington’s Peak Load Stochastic Projections
Source: Pace Global

Proprietary & Confidential Page 29
Exhibit 18: Farmington’s Average and Peak Load Percentiles (MW)
Source: Pace Global
Other Stochastic Inputs
Pace Global developed distributions of other key inputs to represent the probability of occurrence over a
range of outcomes. Below are some of the key drivers of the stochastic analysis, with detailed inputs
presented in Appendix B.
Capital Costs: Capital cost uncertainty was evaluated by defining stochastic bands around the capital costs of each resource addition in the portfolio for each year of the study period, based on historical commodity cost volatility and breakdowns of capital costs for different generating technologies.
Natural Gas Prices: Gas price projections were developed according to primary supply and demand drivers that influence domestic production costs as well as international market dynamics.
CO2 Price Projections: CO2 price projections were developed according to expectations for state and federal policy and regulations.
Coal Price Projections in the Region and for the San Juan Generating Station: Coal price projections were developed according to primary supply and demand drivers as well as plant-specific analysis at San Juan.
STOCHASTIC ASSESSMENT RESULTS
In performing the portfolio analysis, all cost, risk, environmental, and operational metrics were recorded for each of the options in line with the categories outlined above. Exhibit 19 and Exhibit 20 provide a summary of the portfolio performance for the cost, risk, environmental and operational metrics for the portfolios 1-4 and portfolios 5-9 separately. Detailed analysis results in each category are presented in Appendix D: Stochastic Analysis Results.
Average Load Peak Load
Mean 5th Pct 25th Pct 50th Pct 75th Pct 95th Pct Mean 5th Pct 25th Pct 50th Pct 75th Pct 95th Pct
2016 130 118 125 130 135 146 2016 193 175 184 192 200 218
2017 131 116 124 129 135 150 2017 194 172 183 191 201 223
2018 130 114 122 128 137 153 2018 193 169 181 190 202 229
2019 131 113 121 128 137 158 2019 194 168 179 190 204 236
2020 131 111 120 128 138 161 2020 194 165 178 189 205 240
2021 131 108 119 128 138 163 2021 193 161 176 188 204 244
2022 130 108 117 126 138 165 2022 193 159 173 187 206 246
2023 130 105 116 127 140 169 2023 194 155 172 188 207 253
2024 130 104 116 126 139 171 2024 193 153 171 186 206 254
2025 130 103 115 126 139 171 2025 192 152 169 186 206 256
2026 130 103 115 126 140 172 2026 193 151 170 187 209 258
2027 130 102 115 126 141 172 2027 194 151 170 187 210 258
2028 130 101 113 126 142 175 2028 193 149 168 186 210 262
2029 130 99 113 126 142 173 2029 193 147 168 187 211 261
2030 132 100 115 127 144 178 2030 196 148 170 189 215 268
2031 133 101 116 129 146 180 2031 198 150 172 192 218 270
2032 135 101 117 131 149 182 2032 201 150 174 195 221 273
2033 136 102 118 132 150 183 2033 203 150 175 196 223 275
2034 138 103 120 133 152 187 2034 204 151 176 197 225 279
2035 141 104 122 137 155 191 2035 209 153 179 203 230 288
2036 145 107 125 140 160 198 2036 216 157 186 208 240 297

Proprietary & Confidential Page 30
Exhibit 19: Summary of Portfolios 1-4
Source: Pace Global

Proprietary & Confidential Page 31
Exhibit 20: Summary of Portfolios 5-9
Source: Pace Global
Portfolio 4 and 9 ranks the best in an overall ranking when we assume two different San Juan 4
retirements. Between the two best portfolios, Portfolio 4 results in ~3% lower expected costs than
Portfolio 9. Exhibit 21 presents the comparison of Portfolio 4 and 9.

Proprietary & Confidential Page 32
Exhibit 21: Comparison of Portfolio 4 and 9
Source: Pace Global
Key Findings
Coal Retirement
Stochastic results show retiring San Juan in 2027 rather than 2022 would likely lower Farmington’s
portfolio cost. However, retiring San Juan Unit 4 earlier timeline, in 2022, reduces Farmington's carbon
footprint between 2022 and 2027.
Under the CPP mass-based with intrastate trading case, the San Juan Unit 4 is expected to provide more than 10 percent incremental generation during 2022-2027. This further lowers the costs and risks compared to the CPP mass-based with interstate trading case results. The tradeoff is that the incremental outputs result in higher CO2 emissions from the unit.
For portfolio comparison purposes, the yearly distributions of all portfolios were summarized into a levelized annuity, which is the Net Present Value (“NPV”) of total portfolio costs spread into an average dollar per MWh metric over the planning horizon. Exhibit 22 shows the tradeoff of cost and emission for both CPP cases.

Proprietary & Confidential Page 33
Exhibit 22: Coal Retirement Decision Cost and Emission Tradeoff
Source: Pace Global
Two CPP Cases
Key findings of the stochastic analysis under the two CPP cases are fairly consistent. The New Mexico
power prices are expected to be slightly lower (~2 percent) under the mass-based intrastate trading case.
The lower market prices affect Farmington’s market purchase position and result in lower overall costs for
Farmington’s portfolios.

Proprietary & Confidential Page 34
CPEC Purchase Option
Purchasing a portion of the CPEC plant provides the lowest cost portfolio option. This is largely driven by
the assumption of the plant’s advertised heat rate (~6,152 btu/KWh) over Farmington’s other smaller CCs
options considered in this study (~7,500 btu/KWh or greater). An additional benefit of this option includes
addition of solar capacity on a pro rata basis.
However, whether CPEC option could be realized is fraught with uncertainties beyond Farmington’s
control. For example, the CPEC option assumes purchasing 50 MW share from the proposed CPEC
project with a Commercial Online Date in 2021, performance guarantee, the option to buy an additional
50 MW upon San Juan Unit 4’s retirement. Several prerequisites are important when consider the CPEC
purchase option.
With the Tri-State contract expiring in 2017, it is prudent for Farmington to plan adding add generation resources to its fleet in the near term. Any delay of the CPEC project would increase Farmington’s exposure to the market.
Farmington should commercially secure an option to buy an additional 50 MW upon San Juan Unit 4 retirement. It is uncertain whether the CPEC project sponsor(s) or owner(s) are acceptable to a phased buy-in from Farmington.
Before Farmington could commit to the CPEC option, sufficient evidence must support that the project has been sufficiently de-risked and is moving forward with construction. Such evidences include financial closing, EPC contracts, acquisition of site, and offtake contracts, etc.
Finally, as a potential minority owner of a generation station like CPEC, Farmington is unlikely able to make dispatch decisions to best support the operational flexibility of its system. This tradeoff should be weighed against the cost effectiveness of this portfolio, should this option materialize.
Capital Investments
The current market outlook does not reward building long portfolios because of high capital costs incurred,
especially in the early 2020s. However, a phased approach to add smaller and incremental capacity
resources on a need basis provides overall lower cost benefits for the City as well as maintain flexibility in
the face of future uncertainties.
New Solar Generation
Addition of solar capacity to the Farmington portfolio diversifies its power generation profile and reduces
carbon emissions. Solar capacity also provides energy price hedge benefits to overall portfolio costs,
especially in late 2020s and 2030s. However, the amount of solar capacity addition is limited by the
supporting fast ramping fossil fueled peaking capacity.

Proprietary & Confidential Page 35
PREFERRED RESOURCE PLAN
Given the uncertainties of San Juan Unit 4 retirement date, Pace Global recommends the Preferred
Resource Plan that not only offers the flexibility to adjust once the San Juan Unit 4 retirement date
clarifies, but also achieves the best balance in meeting the cost, risk, environmental and operational
objectives.
The Preferred Resource Plan is comprised of building reciprocating engines in the near term, small
combined cycle gas fired generation resources in the midterm, and solar resources in the long term.
Exhibit 23 shows the key elements of the Preferred Resource Plan. The Preferred Resource Plan is
represented by Portfolios 4 and 9 of the Farmington’s 2016 IRP.
Exhibit 23: Key Elements of the Preferred Resource Plan
Source: Farmington and Pace Global

Proprietary & Confidential Page 36
APPENDIX A: LOAD FORECAST METHODOLOGY
LOAD FORECAST - HISTORICAL DRIVER ANALYSIS
Weather and economic data have historically explained changes in monthly average and peak load fairly
well. This relationship, and the impacts of external direct and indirect impacts from the energy extraction
industry, forms the basis for Pace Global’s load uncertainty analysis. The basic premise of our model is
that load can be expressed as follows:
𝐿𝑜𝑎𝑑𝑡 = 𝛼 + 𝛽1 ∗ 𝐻𝐷𝐷𝑡 + 𝛽2 ∗ 𝐶𝐷𝐷𝑡 + 𝛽3 ∗ 𝐻𝑈𝑀𝑡 + 𝛽4 ∗ 𝑃𝐼𝑡 + 𝜉𝑡
Where:
HDD (Heating Degree Days): 65 - Average daily temperature in degrees Fahrenheit or zero. HDD is never negative.
CDD (Cooling Degree Days): Average daily temperature -65 in degrees Fahrenheit or zero. CDD is never negative.
HUM (Humidity): Average daily percent humidity.
PI: Personal Income
𝜉 : A normally distributed variable with mean 0 and constant variance
𝛼 : A constant derived from the regression analysis
𝛽𝑛: Coefficients derived from the regression analysis
A stepwise regression then calibrates this model to historic data. Load uncertainty can be driven by
observed relationships as well as future efficiency, DSM Measures and Electrification opportunities.
Exhibit 24 shows the over-arching load forecasting process. Exhibit 25 is the flow chart depicting the key
elements considered in the load forecasting process.

Proprietary & Confidential Page 37
Exhibit 24: Load Forecast Process
Source: Pace Global.
Collect Historical
Load
Collect Hist. Weather,
Econ Variables
Build Regression
Model
Project Random Years Weather
(HDD, CDD, Humidity)
Project (Personal Inc.,
Population)
Forecast Future Load (2015-2035)
Ref: Case– ISO’s forecast
Develop Quantum
Dist. (DSM, PHEV)
Final Load Forecast
(each Scenario)
Use Coefficients

Proprietary & Confidential Page 38
Scenario Load Forecast Results
Exhibit 25: Flow Chart of the Key Elements in Load Forecasting
Source: Pace Global.
PARAMETRIC AND QUANTUM PROJECTIONS
Step 1: Weather and Economic Variability
To produce our load stochastics, Pace Global forecasts three independent random paths: weather data,
personal income, and a residual.
Weather data includes heating and cooling degree days and humidity. To produce reasonable weather
data projections, Pace Global samples actual yearly paths from history. On average, we use about 13
years’ worth of historical data to perform the historical driver analysis. We aggregate around 35 additional
years’ worth of weather data to enrich the variability of our forecasts.
Personal income is assumed to follow Geometric Brownian Motion. This means that a normal distribution
with constant mean and variance describes how the return on personal income will behave at any time.
Historical personal income data produces a best guess for the relevant mean and variance of this process
going forward.
𝑑𝑃𝐼 = (µ. 𝑃𝐼. 𝑑𝑡) + (𝜎. 𝑑𝑊. 𝑃𝐼) 𝑑𝑃𝐼: Change in Personal Income
µ: Mean drift rate
𝜎: Variance to the drift
𝑑𝑊: Weiner Process (Normally distributed random number N (0, 1))
Pace did an in-house study to quantify the ‘Qu u ’
T ‘Qu u ’ ‘U ’ ‘D ’ We consider two downside cases and one upside case.
The two downside cases are treated as 5th
and
25th
percentiles; the upside case is treated as
75th
percentile.
Establish Historic Relationship
Historic Weather Historic Economic Drivers
Historic Load
Parametric Distribution
Define Additional Uncertainty
Distribution
Unexplained ‘uncertainty’ in DSM and Upside Potential (FERC Studies, public Data sources etc.)
Quantum Distribution
Combined Distribution
Define Probability
1
2
3

Proprietary & Confidential Page 39
Finally, to account for unexplained variation in the observed data, Pace Global adds a normally
distributed residual with mean zero and standard deviation equal to the root mean squared error of the
previously mentioned stepwise regression.
Step 2: Additional Variability
It is Pace Global’s opinion that future power demand may differ substantially from past power demand.
To accommodate for this possibility, we add an additional “Quantum (or Efficiency) Distribution” to our
empirically derived distribution. The distribution is log-normally distributed. The fifth percentile of this
distribution is taken primarily from NERC and FERC projections (or other relevant data sources) for
statewide potential for load reduction from efficiency or other DSM measures. For example, these
measures may include advanced metering infrastructure, appliance efficiency standards or other direct
load control programs. The upper tail of this distribution is weighted to match Pace Global’s analysis of
historical high periods of load growth and our expert opinion. Note that the “Quantum Distribution”
incorporates the potential for limited or no penetration of the expected increases in the energy efficiency
of the economy embedded in the reference case. Examples include increasing residential plug load or
high energy consumption technology breakthroughs.
Pace Global expects that changes attributable to the efficiency distribution will affect load growth on a
large geographic scale. Accordingly, concurrent efficiency changes are highly correlated across areas.
Additionally, we expect incremental efficiency changes to have persistence over time. Thus, the
propagations have a high level of serial correlation as well
Farmington Stochastic Load Forecast Process
Quantum Events: One-off developments like DSM (Energy Efficiency/Demand Response) and Electric
vehicles are not reflected in historical data. Based on expert opinion and industry studies, we will adjust
the forecasts from parametric step, to take such quantum uncertainties into account. The downside
values are based on publicly available FERC reports, on expected penetration levels for different regions
in the US. Exhibit 26 shows the assumptions on the upside and downside. Downside penetrations are
treated as 5th and 25
th percentiles; and upside is treated as 75
th percentile, in order to come up with
statistical distributions which are super imposed on the parametric distributions.

Proprietary & Confidential Page 40
Exhibit 26: Upside and Downside Assumptions
Source: Pace Global

Proprietary & Confidential 41
APPENDIX B: CANDIDATE PORTFOLIOS PROFILES
Exhibit 27, Exhibit 28, Exhibit 29, Exhibit 30, Exhibit 31, Exhibit 32, Exhibit 33, Exhibit 34 and Exhibit 35
present the peak capacity vs. peak load for each of the candidate portfolios. In aggregate they total nine
portfolios.
Exhibit 27: Portfolio 1 Peak Capacity vs. Peak Load
43 43 43 43 43 43 43 43 43 43 43 43
9 9 9 9 9 9 9 9 9 9 9 9
9 9 9 9 9 9 9 9
63 63 63 63 63 63 63 63 63 63 63 63
63 63 63 63 63 63 63 63
18 18 18 18 18 18 18 18 18 18 18 18
18 18 18 18 18 18 18 18
18 18 18 18 18 18 18 18 18 18 18 18
18 18 18 18 18 18 18 18
25 2539 39 39 39 39 39 39 39 39 39
58 58 58 58 58 58 58 58
-
25
50
75
100
125
150
175
200
225
250
2016 2017 2018 2019 2020 2021 2022 2023 2024 2025 2026 2027 2028 2029 2030 2031 2032 2033 2034 2035
MW
Farmington Portfolio 1Peak Capacity by Resources vs. Peak Load Percentiles
New Build - Convert to 58 MW LM6000 PF 1x1 CC with DF in 2028 New Build - 39MW GT in 2018Tri-State PPA WAPA PPAAnimas (CT) Bluffview (CC)Navajo (Hydro) San Juan (Coal)Peak Load 25th Pct Peak Load 50th PctPeak Load 75th Pct
Coal retires after 2027; build a 39 MW GT in 2018 and convert to 58 MW 1x1 CC with Duct Fire in 2028.

Proprietary & Confidential 42
Exhibit 28: Portfolio 2 Peak Capacity vs. Peak Load

Proprietary & Confidential 43
Exhibit 29: Portfolio 3 Peak Capacity vs. Peak Load
43 43 43 43 43 43 43 43 43 43 43 43
9 9 9 9 9 9 9 9 9 9 9 9
9 9 9 9 9 9 9 9
63 63 63 63 63 63 63 63 63 63 63 63
63 63 63 63 63 63 63 63
18 18 18 18 18 18 18 18 18 18 18 18
18 18 18 18 18 18 18 18
18 18 18 18 18 18 18 18 18 18 18 18
18 18 18 18 18 18 18 18
25 25 17 17 17 17 17 17 17 17 17 17
17 17 17 17 17 17 17 17
59 59 59 59 59 59 59 59
-
25
50
75
100
125
150
175
200
225
250
2016 2017 2018 2019 2020 2021 2022 2023 2024 2025 2026 2027 2028 2029 2030 2031 2032 2033 2034 2035
MW
Farmington Portfolio 3Peak Capacity by Resources vs. Peak Load Percentiles
San Juan (Coal) Navajo (Hydro)Bluffview (CC) Animas (CT)WAPA PPA Tri-State PPANew Build - two 8.6 MW Reciprocating Engines in 2018 New Build - 58.5 MW SCC-800 1x1 CC in 2028Peak Load 25th Pct Peak Load 50th PctPeak Load 75th Pct
Coal retires after 2027; build two 8.6 MW reciprocating engines in 2018 and a 58.5 MW SCC-800 in 2028.

Proprietary & Confidential 44
Exhibit 30: Portfolio 4 Peak Capacity vs. Peak Load
43 43 43 43 43 43 43 43 43 43 43 43
9 9 9 9 9 9 9 9 9 9 9 9
9 9 9 9 9 9 9 9
63 63 63 63 63 63 63 63 63 63 63 63
63 63 63 63 63 63 63 63
18 18 18 18 18 18 18 18 18 18 18 18
18 18 18 18 18 18 18 18
25 25
18 18
18 18 18 18 18 18 18 18 18 18
18 18 18 18 18 18 18 18
17 17 17 17 17 17 17 17 17 17
17 17 17 17 17 17 17 17
58 58 58 58 58 58 58 58
2 2 2 2
-
25
50
75
100
125
150
175
200
225
250
2016 2017 2018 2019 2020 2021 2022 2023 2024 2025 2026 2027 2028 2029 2030 2031 2032 2033 2034 2035
MW
Farmington Portfolio 4Peak Capacity by Resources vs. Peak Load Percentiles
San Juan (Coal) Navajo (Hydro)
Bluffview (CC) Animas (CT)
Tri-State PPA WAPA PPA
New Build - two 8.6 MW recips in 2018 New Build - 58 MW LM6000 1x1 CC with DF in 2028
New Build - 5 MW Solar in 2032 Peak Load 25th Pct
Peak Load 50th Pct Peak Load 75th Pct
Coal retires after 2027; Build two 8.6 MW recips in 2018; 58 MW CC in 2028; and 5 MW solar in 2032.

Proprietary & Confidential 45
Exhibit 31: Portfolio 5 Peak Capacity vs. Peak Load
43 43 43 43 43 43 43
9 9 9 9 9 9 9
9 9 9 9 9 9 9 9 9 9 9 9 9
63 63 63 63 63 63 63
63 63 63 63 63 63 63 63 63 63 63 63 63
18 18 18 18 18 18 18
18 18 18 18 18 18 18 18 18 18 18 18 18
18 18 18 18 18 18 18
18 18 18 18 18 18 18 18 18 18 18 18 18
25 25
58 58 58 58 58 58 58 58 58 58 58 58 58
-
25
50
75
100
125
150
175
200
225
250
2016 2017 2018 2019 2020 2021 2022 2023 2024 2025 2026 2027 2028 2029 2030 2031 2032 2033 2034 2035
MW
Farmington Portfolio 5Peak Capacity by Resources vs. Peak Load Percentiles
San Juan (Coal) Navajo (Hydro)
Bluffview (CC) Animas (CT)
WAPA PPA Tri-State PPA
New Build - 58 MW LM6000 1x1 CC with DF in 2023 Peak Load 25th Pct
Peak Load 50th Pct Peak Load 75th Pct
Coal retires after 2022; build a 58 MW 1x1 CC with Duct Fire in 2023

Proprietary & Confidential 46
Exhibit 32: Portfolio 6 Peak Capacity vs. Peak Load
43 43 43 43 43 43 43
9 9 9 9 9 9 9
9 9 9 9 9 9 9 9 9 9 9 9 9
63 63 63 63 63 63 63
63 63 63 63 63 63 63 63 63 63 63 63 63
18 18 18 18 18 18 18
18 18 18 18 18 18 18 18 18 18 18 18 18
18 18 18 18 18 18 18
18 18 18 18 18 18 18 18 18 18 18 18 18
25 25 18 18 18 18 18
18 18 18 18 18 18 18 18 18 18 18 18 18
59 59 59 59 59 59 59 59 59 59 59 59 59
-
25
50
75
100
125
150
175
200
225
250
2016 2017 2018 2019 2020 2021 2022 2023 2024 2025 2026 2027 2028 2029 2030 2031 2032 2033 2034 2035
MW
Farmington Portfolio 6Peak Capacity by Resources vs. Peak Load Percentiles
San Juan (Coal) Navajo (Hydro)Bluffview (CC) Animas (CT)WAPA PPA Tri-State PPANew Build - 18 MW LM2500 Aeroderivative GT in 2018 New Build - 58.5 MW SCC-800 CC in 2023Peak Load 25th Pct Peak Load 50th PctPeak Load 75th Pct
Coal retires after 2022; build 18 MW LM2500 Aeroderivative GT in 2018 and 58.5 MW 1x1 CC SCC800 in 2023.

Proprietary & Confidential 47
Exhibit 33: Portfolio 7 Peak Capacity vs. Peak Load
43 43 43 43 43 43 43
9 9 9 9 9 9 9
9 9 9 9 9 9 9 9 9 9 9 9 9
63 63 63 63 63 63 63
63 63 63 63 63 63 63 63 63 63 63 63 63
18 18 18 18 18 18 18
18 18 18 18 18 18 18 18 18 18 18 18 18
18 18 18 18 18 18 18
18 18 18 18 18 18 18 18 18 18 18 18 18
25 2544 44 44 44 44
44 44 44 44 44 44 44 44 44 44 44 44 44
5 5 5 5 5 5 5 5 5 5 5 5 5
-
25
50
75
100
125
150
175
200
225
250
2016 2017 2018 2019 2020 2021 2022 2023 2024 2025 2026 2027 2028 2029 2030 2031 2032 2033 2034 2035
MW
Farmington Portfolio 7Peak Capacity by Resources vs. Peak Load Percentiles
San Juan (Coal) Navajo (Hydro) Bluffview (CC)
Animas (CT) WAPA PPA Tri-State PPA
New Build - 44 MW 1xLM6000 in 2018 New Build - 15 MW Solar in 2023 Peak Load 25th Pct
Peak Load 50th Pct Peak Load 75th Pct
Coal retires after 2022; build 44 MW 1xLM6000 in 2020 and 15 MW solar in 2023
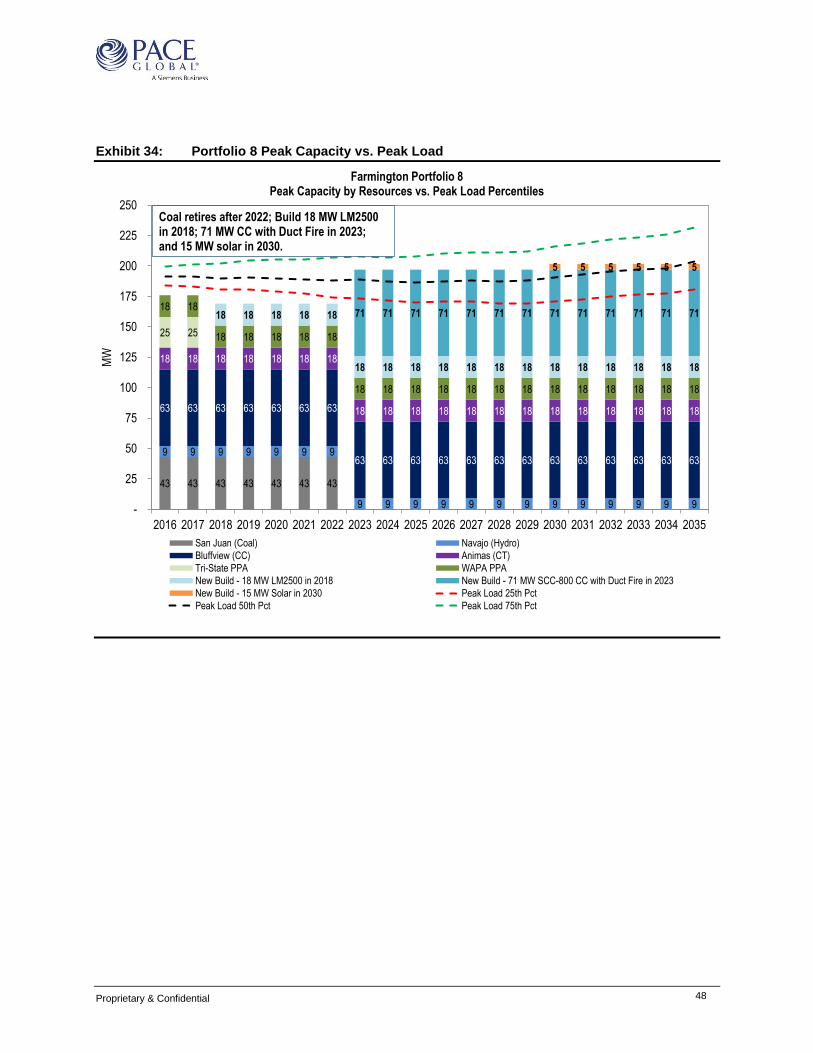
Proprietary & Confidential 48
Exhibit 34: Portfolio 8 Peak Capacity vs. Peak Load
43 43 43 43 43 43 43
9 9 9 9 9 9 9
9 9 9 9 9 9 9 9 9 9 9 9 9
63 63 63 63 63 63 63
63 63 63 63 63 63 63 63 63 63 63 63 63
18 18 18 18 18 18 18
18 18 18 18 18 18 18 18 18 18 18 18 18
25 25
18 18
18 18 18 18 18
18 18 18 18 18 18 18 18 18 18 18 18 18
18 18 18 18 18
18 18 18 18 18 18 18 18 18 18 18 18 18
71 71 71 71 71 71 71 71 71 71 71 71 71
5 5 5 5 5 5
-
25
50
75
100
125
150
175
200
225
250
2016 2017 2018 2019 2020 2021 2022 2023 2024 2025 2026 2027 2028 2029 2030 2031 2032 2033 2034 2035
MW
Farmington Portfolio 8Peak Capacity by Resources vs. Peak Load Percentiles
San Juan (Coal) Navajo (Hydro)
Bluffview (CC) Animas (CT)
Tri-State PPA WAPA PPA
New Build - 18 MW LM2500 in 2018 New Build - 71 MW SCC-800 CC with Duct Fire in 2023
New Build - 15 MW Solar in 2030 Peak Load 25th Pct
Peak Load 50th Pct Peak Load 75th Pct
Coal retires after 2022; Build 18 MW LM2500 in 2018; 71 MW CC with Duct Fire in 2023; and 15 MW solar in 2030.

Proprietary & Confidential 49
Exhibit 35: Portfolio 9 Peak Capacity vs. Peak Load
43 43 43 43 43 43 43
9 9 9 9 9 9 9
9 9 9 9 9 9 9 9 9 9 9 9 9
63 63 63 63 63 63 63
63 63 63 63 63 63 63 63 63 63 63 63 63
18 18 18 18 18 18 18
18 18 18 18 18 18 18 18 18 18 18 18 18
25 25
18 18
18 18 18 18 18
18 18 18 18 18 18 18 18 18 18 18 18 18
17 17 17 17 17
17 17 17 17 17 17 17 17 17 17 17 17 17
58 58 58 58 58 58 58 58 58 58 58 58 58
2 2 2 2
-
25
50
75
100
125
150
175
200
225
250
2016 2017 2018 2019 2020 2021 2022 2023 2024 2025 2026 2027 2028 2029 2030 2031 2032 2033 2034 2035
MW
Farmington Portfolio 9Peak Capacity by Resources vs. Peak Load Percentiles
San Juan (Coal) Navajo (Hydro)
Bluffview (CC) Animas (CT)
Tri-State PPA WAPA PPA
New Build - two 8.6 MW recips in 2018 New Build - 58 MW LM 6000 CC in 2023
New Build - 5 MW Solar in 2032 Peak Load 25th Pct
Peak Load 50th Pct Peak Load 75th Pct
Coal retires after 2022; Build two 8.6 MW recips in 2018; 58 MW CC with Duct Fire in 2023; and 5 MW solar in 2032.

Proprietary & Confidential 50
APPENDIX C: POWER MARKET OVERVIEW AND KEY DRIVERS
The RIRP portfolio analysis was centered on a fundamentals-based power market dispatch analysis that evaluated the Farmington system in the context of the wider region. This section provides an overview the region, notably the New Mexico region, and its market characteristics. Key market drivers in future are highly uncertain and to allow for this possibility, Pace Global derived distribution and incorporated them in the analysis. The section also summarizes the power price projections for the region through an integration of the market data and all key market drivers provided in this Appendix section.
NEW MEXICO MARKET OVERVIEW
Market Structure
New Mexico is part of the Desert Southwest (“DSW”), one of the eight sub-regions in the Western Electricity Coordinating Council (“WECC”). The entire WECC footprint is shown in Exhibit 36. The DSW region consists of Arizona, most of New Mexico, southern Nevada, and the westernmost part of Texas. Pace Global simulated the New Mexico market as part of the WECC power grid in our portfolio analysis.
Exhibit 36: Western Interconnect Coordinating Council (“WECC”) Footprint
Source: Pace Global and Energy Velocity.
MARKET DEMAND PROFILE
Pace Global developed an independent demand forecast for New Mexico and the wider WECC region. This is to ensure reserve margin is observed not only for the New Mexico market but also the entire WECC region, including OWI, California, Arizona and Nevada.

Proprietary & Confidential 51
Exhibit 37 summarizes the expected value energy demand projection from the analysis. The compound annual growth rate (“CAGR”) for the peak and the average demand in the New Mexico market is expected to be between 0.5 and 0.7 percent between 2016 and 2035.
Exhibit 37: Expected Value Demand Projections for New Mexico
New Mexico Demand (MW)
Year Peak Average
2016 4,433 2,719
2017 4,475 2,750
2018 4,469 2,760
2019 4,481 2,777
2020 4,493 2,775
2021 4,531 2,809
2022 4,555 2,832
2023 4,562 2,851
2024 4,641 2,874
2025 4,627 2,890
2026 4,646 2,907
2027 4,682 2,925
2028 4,708 2,947
2029 4,699 2,962
2030 4,758 2,989
2031 4,770 3,003
2032 4,798 3,026
2033 4,798 3,039
2034 4,820 3,059
2035 4,869 3,087
CAGR 0.5% 0.7%
Source: Pace Global.
MARKET SUPPLY PROFILE
Existing Generating Capacity Profile
Exhibit 38 displays the installed capacity in New Mexico. The region’s supply is largely made up of coal- and gas-fired resources, which account for more than 80 percent of the installed capacity. The balance of the supply comprises oil, renewable, and hydro capacity.

Proprietary & Confidential 52
Exhibit 38: Installed Capacity Profile – New Mexico (MW)
Source: Pace Global.
New Mexico Supply Curve
Exhibit 39 displays the existing supply curve, as of 2016, for the New Mexico zone. The supply curve illustrates the capacity of the installed resources in the zone. The curve indicates that the 2016 base load capacity is derived from renewables, some coal and efficient gas units. Less efficient gas-fired units are typically expected to set the price during peak hours.

Proprietary & Confidential 53
Exhibit 39: New Mexico Zone 2016 Supply Curve
Source: Pace Global.
Announced Builds & Retirements
Currently New Mexico and its surrounding regions do not experience shortage of capacity and as such, the market immediately responded with a limited amount of new capacity is expected to achieve commercial operation in the next few years in the DSW region. Approximately 1.5GW of new nameplate capacity is expected for the region with 80% of the new entrant from renewable generations by 2017. Beyond 2017, capacity expansion is considered in the market simulation response to economic signals in the market and should be a mix of renewable and gas-fired resources. Beyond the list of new and announced new capacity plants, Pace Global’s expectations pertaining to the capacity additions in the DSW region are driven by response to economic signals in the market, including energy margin run-ups. The general capacity mix considered for the analysis is renewable and gas-fired resources. A list of the plants that are under construction or are in an advanced stage of development in the broader WECC footprint was shared as a part of information exchange with the City of Farmington. The analysis accounted for 2.5GW of total announced retirements or the DSW region, including New Mexico, by the end of the decade. The plants are Navajo, Newman, Reid Gardner, Rio Grande and San Juan plants. In addition 75% of the retirements are coal burning power plants. A list of the plants that are announced to retire in the broader WECC footprint was provided in an excel-based workbook. Pace Global examines plant economic performance in the context of state and federal policies and regulations to determine other retirements throughout the study period.

Proprietary & Confidential 54
MARKET POWER PRICE PROJECTIONS
Exhibit 40 shows the average energy price probability bands for the New Mexico region. Generally the prices increase over time period primarily due to gradual increase in fuel and environmental compliance costs impact on power prices. While prices on the upper end of the distribution are driven by higher fuel and emission allowance costs as well as above-average load growth, prices on the lower end are driven by new low variable cost generating capacity entering the market as well as low or negative load growth. For the Farmington’s RIRP analysis, 2 CPP compliance scenarios were developed and simulated. First, Exhibit 40 displays simulated prices on the assumption New Mexico participates in a larger regional mass-based trading program. New Mexico, under the alternative CPP scenario, also assumed New Mexico to self-contain in its own state based rate program. Under the alternative scenario it generally resulted in a 2-3% lower overall power prices across the summarized distribution than what is shown in Exhibit 40.
Exhibit 40: Projected New Mexico Energy Prices
Source: Pace Global.
Pace Global’s capacity price projections for the New Mexico region was embedded into the analysis. There is no formal capacity market in New Mexico but the capacity values can be considered to be monetized or purchased through PPA-based bilateral contracts to ensure appropriate amount of capacity is available to meet forecasted peak conditions. In order to quantify the forecasted capacity prices Pace Global analyzed the supply-demand balance (or reserve margin) in a region, the cost of new entry (“CONE”), and the energy revenues that can be realized by plants operating in the market.

Proprietary & Confidential 55
CAPITAL COST PROJECTIONS FOR NEW UNITS AND RELATED UNCERTAINTY
Reference Capital Cost Projections
In evaluating potential capacity additions for meeting future demand requirements throughout the wider WECC market, Pace Global assessed several generation technologies’ maturity levels and operating histories. Based on Pace Global’s review of available generation technologies and review of other public sources for capital cost data, estimates for new technology costs were developed. Pace Global’s estimates took recent trends in commodity price inputs into account. Pace Global projected trends in technology, materials, and labor costs to value early, middle, and late time period cost estimates. The early time period reflects 2016-2020, the middle time period represents 2021-2025, and the late time period refers to 2026-2030. Exhibit 41 highlights the national average for new technology parameters.
Exhibit 41: New Resource Technology Parameters – National Average
Technology
Early Capital Cost
Mid Capital Cost
Late Capital Cost
VOM FOM
Full Load Heat Rate
Block Size
(2016-2020) (2021-2025) (2026-2030)
$/kW $/kW $/kW $/MWh $/kW-yr Btu/kWh MW
CC (7FA) 962 1011 1063 3.26 16.53 6,600 623
CT (FA) 625 657 691 0.91 14.03 9,800 206
Wind 1.5 MW 1748 1662 1581 0.00 35.00 0 50
Solar PV 1950 1658 1417 0.00 15.00 0 7
Source: Pace Global.
STOCHASTIC INPUTS
Natural Gas Prices
Given the volatility in natural gas prices observed over the last several years and the significant uncertainty in potential price outcomes going forward, Pace Global’s Henry Hub stochastic inputs (provided in Exhibit 42) are based on current market forwards, analysis of projected supply-demand fundamentals, and an examination of historical price volatility. Market drivers behind the fifth percentile include a significant renewable build out, low or negative load growth, continued strong shale gas production, and limited coal retirements. Markets drivers behind the ninety-fifth percentile include limited renewable generation subsidies, strong load growth, environmental regulations leading to significant coal retirements, and a supply choke resulting from strict drilling regulations.

Proprietary & Confidential 56
Exhibit 42: Henry Hub Price Probability Bands
Source: Pace Global
Coal Prices
The PRB price uncertainty bands in Exhibit 43 are based on current market forwards as well as an analysis of historical price volatility. Market drivers behind the fifth percentile include significant coal retirements, a large renewable build out, and limited power demand growth. Market drivers behind the ninety-fifth percentile include limited coal retirements that keep demand steady and/or rising, environmental regulations that make mining more expensive, and a limited renewable build out. Note that the values reflect basin prices only and transportation costs are added to calculate the delivered cost of coal.

Proprietary & Confidential 57
Exhibit 43: PRB Basin Price Probability Bands
Source: Pace Global
CO2 Prices
Because the outlook for comprehensive federal carbon regulation in the U.S. remains very uncertain at this time, Pace Global projects a series of potential price outcomes based on fundamental analysis and our expert opinion of the likelihood of certain policy outcomes. Pace Global’s distribution is based on a range of potential policy outcomes at the federal level (including the potential of no market price) with an internally consistent set of market feedbacks related to the demand and price responses in the natural gas and coal markets. The distribution of potential CO2 prices assessed in the analysis is provided in Exhibit 44.

Proprietary & Confidential 58
Exhibit 44: Carbon Compliance Cost Probability Bands
Source: Pace Global
Load Growth
To capture the potential variability in load growth throughout relevant power market regions, Pace Global produces a distribution of monthly average and peak loads. The weather and economic data variables largely influenced the load projections and as an example we have summarized the peak forecast data, used in the analysis, in an annual probability bands for New Mexico in Exhibit 45.

Proprietary & Confidential 59
Exhibit 45: New Mexico Peak Load Probability Bands
Source: Pace Global

Proprietary & Confidential 60
APPENDIX D: STOCHASTIC ANALYSIS RESULTS
Exhibit 46: Portfolio 1-4 NPV Cost Ranking (2016-2035)
Source: Pace Global

Proprietary & Confidential 61
Exhibit 47: Portfolio 1-4 Cost Stability (95th
Percentile) NPV Costs Ranking (2016-2035)
Source: Pace Global

Proprietary & Confidential 62
Exhibit 48: Portfolio 1-4 Average Energy Purchase Exposures Ranking (2016-2035)
Source: Pace Global

Proprietary & Confidential 63
Exhibit 49: Portfolio 1-4 Development Risk Assessment
Source: Pace Global
Exhibit 50: Portfolio 1-4 Control Risk Assessment
Source: Pace Global

Proprietary & Confidential 64
Exhibit 51: Portfolio 1-4 Risk Metric Summary
Source: Pace Global

Proprietary & Confidential 65
Exhibit 52: Portfolio 1-4 CO2 Emissions in 2025 Compare to 2016
Source: Pace Global

Proprietary & Confidential 66
Exhibit 53: Portfolio 1-4 Renewable Generation Share Ranking in 2035
Source: Pace Global

Proprietary & Confidential 67
Exhibit 54: Portfolio 1-4 Environmental Metric Summary
Source: Pace Global

Proprietary & Confidential 68
Exhibit 55: Portfolio 1-4 Average Reserve Margin Ranking (2016-2035)
Source: Pace Global

Proprietary & Confidential 69
Exhibit 56: Portfolio 1-4 Largest Contingency Assessment
Source: Pace Global

Proprietary & Confidential 70
Exhibit 57: Portfolio 1-4 Operational Metric Summary
Source: Pace Global

Proprietary & Confidential 71
Exhibit 58: Portfolio 5-9 NPV Cost Ranking (2016-2035)
Source: Pace Global

Proprietary & Confidential 72
Exhibit 59: Portfolio 5-9 Cost Stability (95th
Percentile) NPV Costs Ranking (2016-2035)
Source: Pace Global

Proprietary & Confidential 73
Exhibit 60: Portfolio 5-9 Average Energy Purchase Exposures Ranking (2016-2035)
Source: Pace Global

Proprietary & Confidential 74
Exhibit 61: Portfolio 5-9 Development Risk Assessment
Source: Pace Global

Proprietary & Confidential 75
Exhibit 62: Portfolio 5-9 Control Risk Assessment
Source: Pace Global

Proprietary & Confidential 76
Exhibit 63: Portfolio 5-9 Risk Metric Summary
Source: Pace Global

Proprietary & Confidential 77
Exhibit 64: Portfolio 5-9 CO2 Emissions in 2025 Compare to 2016
Source: Pace Global

Proprietary & Confidential 78
Exhibit 65: Portfolio 5-9 Renewable Generation Share Ranking in 2035
Source: Pace Global

Proprietary & Confidential 79
Exhibit 66: Portfolio 5-9 Environmental Metric Summary
Source: Pace Global

Proprietary & Confidential 80
Exhibit 67: Portfolio 5-9 Average Reserve Margin Ranking (2016-2035)
Source: Pace Global

Proprietary & Confidential 81
Exhibit 68: Portfolio 5-9 Largest Contingency Assessment
Source: Pace Global

Proprietary & Confidential 82
Exhibit 69: Portfolio 5-9 Operational Metric Summary
Source: Pace Global