2016 Global Outlook - TD · 2016 Global Outlook Rates, FX and Commodities Research Inflation, the...
31
10 November 2015 | TD Securities 2016 Global Outlook Rates, FX and Commodities Research Contents Market Outlook 2 View From the Top 3 Summary of Trades 4 Global Macro Themes Tracing the Terms of 5 Shock The Turn in Global Inflation 6 Central Bank Regime Shift 6 Regional Risks 8 Global Rates 9 US Rates 11 Canada Rates 14 Australia/NZ Rates 16 Europe Rates 18 Foreign Exchange 20 Emerging Markets 22 Commodities 25 Forecasts 27 Strategy Team 30 https://www.tdsresearch.com/ currency-rates 2016 Global Outlook Don't fight the Fed, ignore it. Position for moves premised on a Fed which will tighten in the coming months and look for stops that can ride the volatility of precisely how it is delivered. We think the bar has been met for a December hike and 100bps of tightening by September 2016, furthering 5s30s flattening in the US, driving convergence in NZ-US-GE 10s, and divergence in US-GE 5s and CA-US 30yr breakevens. We do not expect Fed tightening will be USD-positive much beyond the initial knee-jerk and look for its strength to peter out early in 2016. That implies only somewhat more pressure on EMs and commodities and, in fact, less downside than seems discounted in EM assets at this point. This presents opportunities which will likely grow larger through the year as each passing month of 2016 will mean falling risks of an imminent EM or Chinese crisis. Core Views Bias Asset Allocation G10 Rates Policy divergence to create opportunities in front-end; long-end rates to remain pinned. Underweight 2-5yr Treasuries against EU, NZ. Risk Assets Moderate growth and low inflation keeps us cautiously optimistic, though upside should be limited with Fed hikes and risk of USD strength. Neutral equities Foreign Exchange USD on last up-leg but pressure for EUR to persist on divergent policy. USDJPY may have already peaked while GBP poised for gains vs. commodity FX. LONG SHORT USD/CAD/JPY EUR GBP EUR/NZD/CAD CAD/SEK NZD EM 2016 will be transitional as external risks weigh in H1 but ease into H2, allowing local factors to drive relative performance. Long BRL Short TRY; Long MXN Short CAD; MXN TIIE 2s5s Flattener. Commodities Oversupply to keep oil moderating, until balanced mkt takes over H2 2016. Silver/gold to perk up later in H2 2016. Base metals dependent on China to do better in 2016. Long Au/Ag then reverse at target; Short WTI for now but reverse at target; Long Zn-Al spread. Volatility Realized vol to remain high due to regulation and increasing cost of balance sheet. High vol within a range.
Transcript of 2016 Global Outlook - TD · 2016 Global Outlook Rates, FX and Commodities Research Inflation, the...
10 November 2015 | TD Securities
2016 Global Outlook Rates, FX and Commodities Research
Contents
Market Outlook 2
View From the Top 3
Summary of Trades 4
Global Macro Themes
Tracing the Terms of 5
Shock
The Turn in Global Inflation 6
Central Bank Regime Shift 6
Regional Risks 8
Global Rates 9
US Rates 11
Canada Rates 14
Australia/NZ Rates 16
Europe Rates 18
Foreign Exchange 20
Emerging Markets 22
Commodities 25
Forecasts 27
Strategy Team 30
https://www.tdsresearch.com/currency-rates
2016 Global Outlook
Don't fight the Fed, ignore it. Position for moves premised on a Fed which will tighten in the
coming months and look for stops that can ride the volatility of precisely how it is delivered.
We think the bar has been met for a December hike and 100bps of tightening by September
2016, furthering 5s30s flattening in the US, driving convergence in NZ-US-GE 10s, and
divergence in US-GE 5s and CA-US 30yr breakevens. We do not expect Fed tightening will
be USD-positive much beyond the initial knee-jerk and look for its strength to peter out early
in 2016. That implies only somewhat more pressure on EMs and commodities and, in fact,
less downside than seems discounted in EM assets at this point. This presents opportunities
which will likely grow larger through the year as each passing month of 2016 will mean
falling risks of an imminent EM or Chinese crisis.
Core Views
Bias Asset Allocation
G10 Rates Policy divergence to create opportunities in front-end; long-end rates to remain pinned.
Underweight 2-5yr
Treasuries against EU, NZ.
Risk Assets
Moderate growth and low inflation keeps us cautiously optimistic, though upside should be limited with Fed hikes and risk of USD strength.
Neutral equities
Foreign
Exchange
USD on last up-leg but pressure for EUR to persist on divergent policy. USDJPY may have already peaked while GBP poised for gains vs. commodity FX.
LONG SHORT
USD/CAD/JPY EUR
GBP EUR/NZD/CAD
CAD/SEK NZD
EM
2016 will be transitional as external risks weigh in H1 but ease into H2, allowing local factors to drive relative performance.
Long BRL Short TRY; Long MXN Short CAD; MXN TIIE
2s5s Flattener.
Commodities
Oversupply to keep oil moderating, until balanced mkt takes over H2 2016. Silver/gold to perk up later in H2 2016. Base metals dependent on China to do better in 2016.
Long Au/Ag then reverse at
target; Short WTI for now but reverse at target; Long Zn-Al
spread.
Volatility Realized vol to remain high due to regulation and increasing cost of balance sheet.
High vol within a range.
10 November 2015 | TD Securities
2016 Global Outlook Rates, FX and Commodities Research
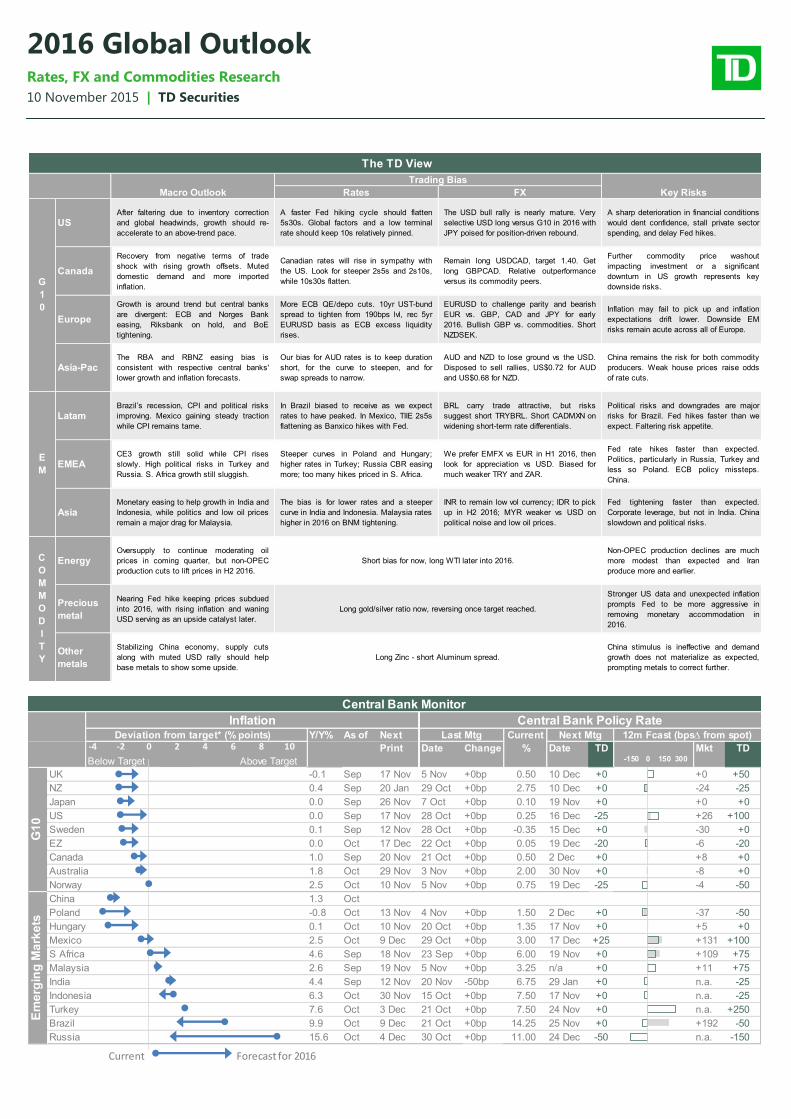
The TD View
Trading Bias
Macro Outlook Rates FX Key Risks
USAfter faltering due to inventory correction
and global headwinds, growth should re-
accelerate to an above-trend pace.
A faster Fed hiking cycle should flatten
5s30s. Global factors and a low terminal
rate should keep 10s relatively pinned.
The USD bull rally is nearly mature. Very
selective USD long versus G10 in 2016 with
JPY poised for position-driven rebound.
A sharp deterioration in financial conditions
would dent confidence, stall private sector
spending, and delay Fed hikes.
Canada
Recovery from negative terms of trade
shock with rising growth offsets. Muted
domestic demand and more imported
inflation.
Canadian rates will rise in sympathy with
the US. Look for steeper 2s5s and 2s10s,
while 10s30s flatten.
Remain long USDCAD, target 1.40. Get
long GBPCAD. Relative outperformance
versus its commodity peers.
Further commodity price washout
impacting investment or a significant
downturn in US growth represents key
downside risks.
Europe
Growth is around trend but central banks
are divergent: ECB and Norges Bank
easing, Riksbank on hold, and BoE
tightening.
More ECB QE/depo cuts. 10yr UST-bund
spread to tighten from 190bps lvl, rec 5yr
EURUSD basis as ECB excess liquidity
rises.
EURUSD to challenge parity and bearish
EUR vs. GBP, CAD and JPY for early
2016. Bullish GBP vs. commodities. Short
NZDSEK.
Inflation may fail to pick up and inflation
expectations drift lower. Downside EM
risks remain acute across all of Europe.
Asia-PacThe RBA and RBNZ easing bias is
consistent with respective central banks'
lower growth and inflation forecasts.
Our bias for AUD rates is to keep duration
short, for the curve to steepen, and for
swap spreads to narrow.
AUD and NZD to lose ground vs the USD.
Disposed to sell rallies, US$0.72 for AUD
and US$0.68 for NZD.
China remains the risk for both commodity
producers. Weak house prices raise odds
of rate cuts.
LatamBrazil’s recession, CPI and political risks
improving. Mexico gaining steady traction
while CPI remains tame.
In Brazil biased to receive as we expect
rates to have peaked. In Mexico, TIIE 2s5s
flattening as Banxico hikes with Fed.
BRL carry trade attractive, but risks
suggest short TRYBRL. Short CADMXN on
widening short-term rate differentials.
Political risks and downgrades are major
risks for Brazil. Fed hikes faster than we
expect. Faltering risk appetite.
EMEACE3 growth still solid while CPI rises
slowly. High political risks in Turkey and
Russia. S. Africa growth still sluggish.
Steeper curves in Poland and Hungary;
higher rates in Turkey; Russia CBR easing
more; too many hikes priced in S. Africa.
We prefer EMFX vs EUR in H1 2016, then
look for appreciation vs USD. Biased for
much weaker TRY and ZAR.
Fed rate hikes faster than expected.
Politics, particularly in Russia, Turkey and
less so Poland. ECB policy missteps.
China.
Asia Monetary easing to help growth in India and
Indonesia, while politics and low oil prices
remain a major drag for Malaysia.
The bias is for lower rates and a steeper
curve in India and Indonesia. Malaysia rates
higher in 2016 on BNM tightening.
INR to remain low vol currency; IDR to pick
up in H2 2016; MYR weaker vs USD on
political noise and low oil prices.
Fed tightening faster than expected.
Corporate leverage, but not in India. China
slowdown and political risks.
EnergyOversupply to continue moderating oil
prices in coming quarter, but non-OPEC
production cuts to lift prices in H2 2016.
Non-OPEC production declines are much
more modest than expected and Iran
produce more and earlier.
Precious
metal
Nearing Fed hike keeping prices subdued
into 2016, with rising inflation and waning
USD serving as an upside catalyst later.
Stronger US data and unexpected inflation
prompts Fed to be more aggressive in
removing monetary accommodation in
2016.
Other
metals
Stabilizing China economy, supply cuts
along with muted USD rally should help
base metals to show some upside.
China stimulus is ineffective and demand
growth does not materialize as expected,
prompting metals to correct further.
G
1
0
E
M
C
O
M
M
O
D
I
T
Y
Short bias for now, long WTI later into 2016.
Long gold/silver ratio now, reversing once target reached.
Long Zinc - short Aluminum spread.
Central Bank Monitor
Inflation Central Bank Policy RateDeviation from target* (% points) Y/Y% As of Next Last Mtg Current Next Mtg 12m Fcast (bps∆ from spot)
Print Date Change % Date TD Mkt TD
Below Target Above Target
n.a. -150
-50
+250
n.a. -25
+109 +75
+5
-37
Russia 15.6 Oct 4 Dec 30 Oct +0bp 11.00 24 Dec -50
14.25 25 Nov +0 +192
n.a.7.50 24 Nov +0
Brazil 9.9 Oct 9 Dec 21 Oct +0bp
Turkey 7.6 Oct 3 Dec 21 Oct +0bp
Indonesia 6.3 Oct 30 Nov 15 Oct +0bp -257.50 17 Nov +0 n.a.
India 4.4 Sep 12 Nov 20 Nov -50bp 6.75 29 Jan +0
Malaysia 2.6 Sep 19 Nov 5 Nov +0bp +753.25 n/a +0 +11
S Africa 4.6 Sep 18 Nov 23 Sep
+0
Mexico 2.5 Oct 9 Dec 29 Oct +0bp +1003.00 17 Dec +25 +131
Hungary 0.1 Oct
+0
10 Nov 20 Oct +0bp 1.35 17 Nov +0
Poland -0.8 Oct 13 Nov 4 Nov +0bp
+0bp 6.00 19 Nov
1.50 2 Dec +0
-4 -50
Em
erg
ing
Ma
rke
ts
China 1.3 Oct
+0bp 0.75 19 Dec -25
G1
0
-50
+0 -8 +02.00 30 Nov
+0bp 0.50 2 Dec
-20
Norway 2.5 Oct 10 Nov 5 Nov
Australia 1.8 Oct 29 Nov 3 Nov
US 0.0 Sep 17 Nov 28 Oct +0bp
-6 -20
Canada 1.0 Sep 20 Nov 21 Oct +8 +0+0
EZ 0.0 Oct 17 Dec 22 Oct +0bp
Sweden 0.1 Sep 12 Nov 28 Oct -30 +0+0
Japan 0.0 Sep 26 Nov 7 Oct +0 +0+0
0.25 16 Dec
+0bp 0.10 19 Nov
-24 -25+0
+0bp -0.35 15 Dec
-25 +26 +100
0.05 19 Dec
+0bp
+0 +50
NZ 0.4 Sep 20 Jan 29 Oct +0bp 2.75 10 Dec
+0bp 0.50 10 Dec +0UK -0.1 Sep 17 Nov 5 Nov
-4 -2 0 2 4 6 8 10
Forecast for 2016Current
-150 0 150 300
3
10 November 2015 | TD Securities
2016 Global Outlook Rates, FX and Commodities Research
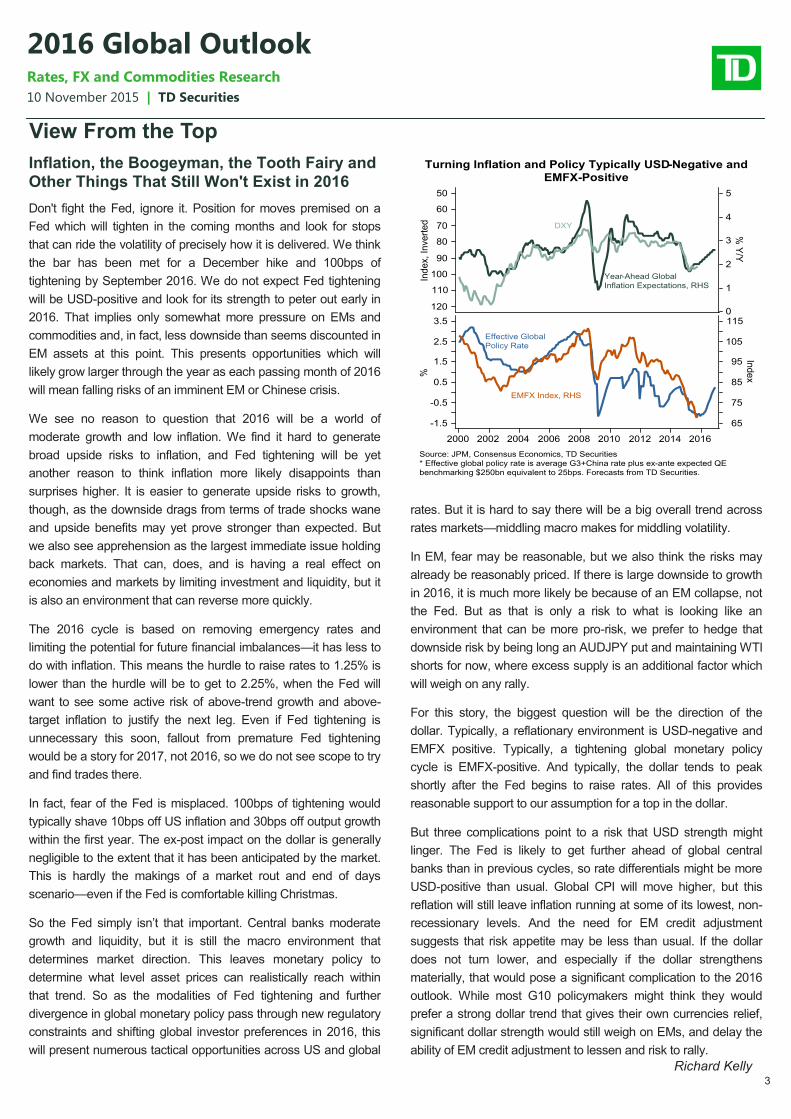
Inflation, the Boogeyman, the Tooth Fairy and
Other Things That Still Won't Exist in 2016
Don't fight the Fed, ignore it. Position for moves premised on a
Fed which will tighten in the coming months and look for stops
that can ride the volatility of precisely how it is delivered. We think
the bar has been met for a December hike and 100bps of
tightening by September 2016. We do not expect Fed tightening
will be USD-positive and look for its strength to peter out early in
2016. That implies only somewhat more pressure on EMs and
commodities and, in fact, less downside than seems discounted in
EM assets at this point. This presents opportunities which will
likely grow larger through the year as each passing month of 2016
will mean falling risks of an imminent EM or Chinese crisis.
We see no reason to question that 2016 will be a world of
moderate growth and low inflation. We find it hard to generate
broad upside risks to inflation, and Fed tightening will be yet
another reason to think inflation more likely disappoints than
surprises higher. It is easier to generate upside risks to growth,
though, as the downside drags from terms of trade shocks wane
and upside benefits may yet prove stronger than expected. But
we also see apprehension as the largest immediate issue holding
back markets. That can, does, and is having a real effect on
economies and markets by limiting investment and liquidity, but it
is also an environment that can reverse more quickly.
The 2016 cycle is based on removing emergency rates and
limiting the potential for future financial imbalances—it has less to
do with inflation. This means the hurdle to raise rates to 1.25% is
lower than the hurdle will be to get to 2.25%, when the Fed will
want to see some active risk of above-trend growth and above-
target inflation to justify the next leg. Even if Fed tightening is
unnecessary this soon, fallout from premature Fed tightening
would be a story for 2017, not 2016, so we do not see scope to try
and find trades there.
In fact, fear of the Fed is misplaced. 100bps of tightening would
typically shave 10bps off US inflation and 30bps off output growth
within the first year. The ex-post impact on the dollar is generally
negligible to the extent that it has been anticipated by the market.
This is hardly the makings of a market rout and end of days
scenario—even if the Fed is comfortable killing Christmas.
So the Fed simply isn’t that important. Central banks moderate
growth and liquidity, but it is still the macro environment that
determines market direction. This leaves monetary policy to
determine what level asset prices can realistically reach within
that trend. So as the modalities of Fed tightening and further
divergence in global monetary policy pass through new regulatory
constraints and shifting global investor preferences in 2016, this
will present numerous tactical opportunities across US and global
rates. But it is hard to say there will be a big overall trend across
rates markets—middling macro makes for middling volatility.
In EM, fear may be reasonable, but we also think the risks may
already be reasonably priced. If there is large downside to growth
in 2016, it is much more likely be because of an EM collapse, not
the Fed. But as that is only a risk to what is looking like an
environment that can be more pro-risk, we prefer to hedge that
downside risk by being long an AUDJPY put and maintaining WTI
shorts for now, where excess supply is an additional factor which
will weigh on any rally.
For this story, the biggest question will be the direction of the
dollar. Typically, a reflationary environment is USD-negative and
EMFX positive. Typically, a tightening global monetary policy
cycle is EMFX-positive. And typically, the dollar tends to peak
shortly after the Fed begins to raise rates. All of this provides
reasonable support to our assumption for a top in the dollar.
But three complications point to a risk that USD strength might
linger. The Fed is likely to get further ahead of global central
banks than in previous cycles, so rate differentials might be more
USD-positive than usual. Global CPI will move higher, but this
reflation will still leave inflation running at some of its lowest, non-
recessionary levels. And the need for EM credit adjustment
suggests that risk appetite may be less than usual. If the dollar
does not turn lower, and especially if the dollar strengthens
materially, that would pose a significant complication to the 2016
outlook. While most G10 policymakers might think they would
prefer a strong dollar trend that gives their own currencies relief,
significant dollar strength would still weigh on EMs, and delay the
ability of EM credit adjustment to lessen and risk to rally.
View From the Top
Richard Kelly
4
10 November 2015 | TD Securities
2016 Global Outlook Rates, FX and Commodities Research
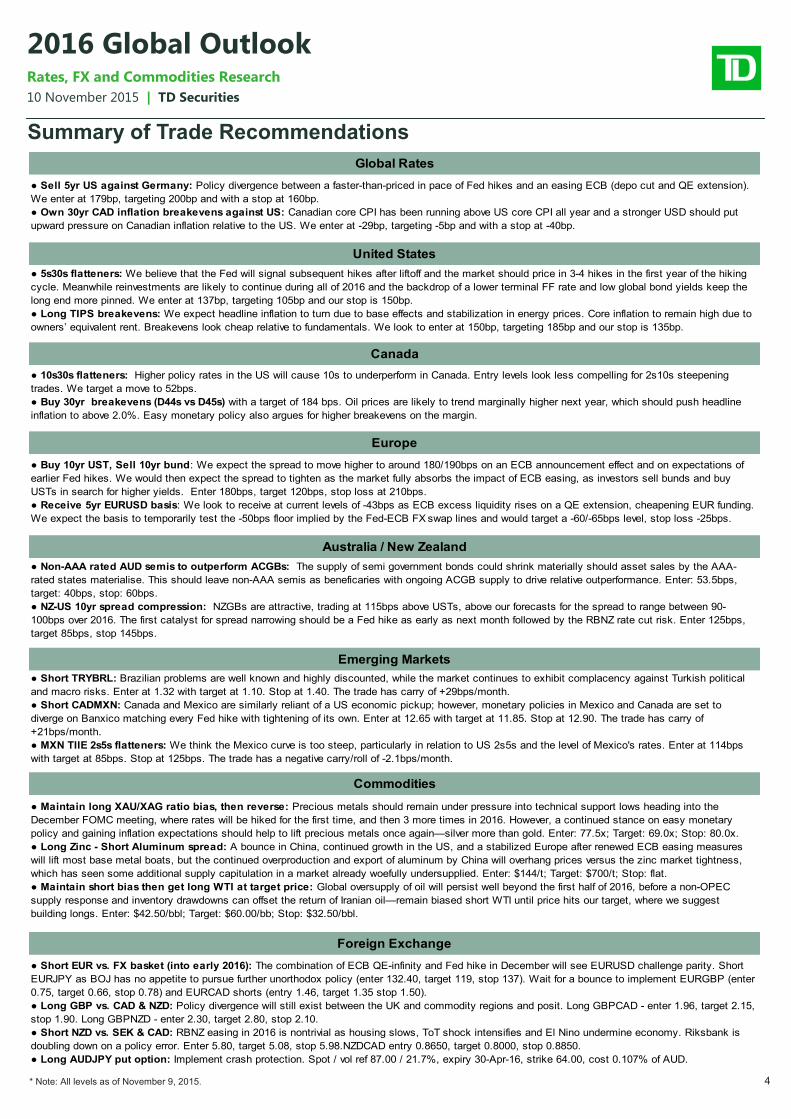
Summary of Trade Recommendations
* Note: All levels as of November 9, 2015.
Global Rates
● Sell 5yr US against Germany: Policy divergence between a faster-than-priced in pace of Fed hikes and an easing ECB (depo cut and QE extension).
We enter at 179bp, targeting 200bp and with a stop at 160bp.
● Own 30yr CAD inflation breakevens against US: Canadian core CPI has been running above US core CPI all year and a stronger USD should put
upward pressure on Canadian inflation relative to the US. We enter at -29bp, targeting -5bp and with a stop at -40bp.
United States
Canada
● Short EUR vs. FX basket (into early 2016): The combination of ECB QE-infinity and Fed hike in December will see EURUSD challenge parity. Short
EURJPY as BOJ has no appetite to pursue further unorthodox policy (enter 132.40, target 119, stop 137). Wait for a bounce to implement EURGBP (enter
0.75, target 0.66, stop 0.78) and EURCAD shorts (entry 1.46, target 1.35 stop 1.50).
● Long GBP vs. CAD & NZD: Policy divergence will still exist between the UK and commodity regions and posit. Long GBPCAD - enter 1.96, target 2.15,
stop 1.90. Long GBPNZD - enter 2.30, target 2.80, stop 2.10.
● Short NZD vs. SEK & CAD: RBNZ easing in 2016 is nontrivial as housing slows, ToT shock intensifies and El Nino undermine economy. Riksbank is
doubling down on a policy error. Enter 5.80, target 5.08, stop 5.98.NZDCAD entry 0.8650, target 0.8000, stop 0.8850.
● Long AUDJPY put option: Implement crash protection. Spot / vol ref 87.00 / 21.7%, expiry 30-Apr-16, strike 64.00, cost 0.107% of AUD.
Foreign Exchange
Commodities
● 5s30s flatteners: We believe that the Fed will signal subsequent hikes after liftoff and the market should price in 3-4 hikes in the first year of the hiking
cycle. Meanwhile reinvestments are likely to continue during all of 2016 and the backdrop of a lower terminal FF rate and low global bond yields keep the
long end more pinned. We enter at 137bp, targeting 105bp and our stop is 150bp.
● Long TIPS breakevens: We expect headline inflation to turn due to base effects and stabilization in energy prices. Core inflation to remain high due to
owners’ equivalent rent. Breakevens look cheap relative to fundamentals. We look to enter at 150bp, targeting 185bp and our stop is 135bp.
● 10s30s flatteners: Higher policy rates in the US will cause 10s to underperform in Canada. Entry levels look less compelling for 2s10s steepening
trades. We target a move to 52bps.
● Buy 30yr breakevens (D44s vs D45s) with a target of 184 bps. Oil prices are likely to trend marginally higher next year, which should push headline
inflation to above 2.0%. Easy monetary policy also argues for higher breakevens on the margin.
● Buy 10yr UST, Sell 10yr bund: We expect the spread to move higher to around 180/190bps on an ECB announcement effect and on expectations of
earlier Fed hikes. We would then expect the spread to tighten as the market fully absorbs the impact of ECB easing, as investors sell bunds and buy
USTs in search for higher yields. Enter 180bps, target 120bps, stop loss at 210bps.
● Receive 5yr EURUSD basis: We look to receive at current levels of -43bps as ECB excess liquidity rises on a QE extension, cheapening EUR funding.
We expect the basis to temporarily test the -50bps floor implied by the Fed-ECB FX swap lines and would target a -60/-65bps level, stop loss -25bps.
● Non-AAA rated AUD semis to outperform ACGBs: The supply of semi government bonds could shrink materially should asset sales by the AAA-
rated states materialise. This should leave non-AAA semis as beneficaries with ongoing ACGB supply to drive relative outperformance. Enter: 53.5bps,
target: 40bps, stop: 60bps.
● NZ-US 10yr spread compression: NZGBs are attractive, trading at 115bps above USTs, above our forecasts for the spread to range between 90-
100bps over 2016. The first catalyst for spread narrowing should be a Fed hike as early as next month followed by the RBNZ rate cut risk. Enter 125bps,
target 85bps, stop 145bps.
● Short TRYBRL: Brazilian problems are well known and highly discounted, while the market continues to exhibit complacency against Turkish political
and macro risks. Enter at 1.32 with target at 1.10. Stop at 1.40. The trade has carry of +29bps/month.
● Short CADMXN: Canada and Mexico are similarly reliant of a US economic pickup; however, monetary policies in Mexico and Canada are set to
diverge on Banxico matching every Fed hike with tightening of its own. Enter at 12.65 with target at 11.85. Stop at 12.90. The trade has carry of
+21bps/month.
● MXN TIIE 2s5s flatteners: We think the Mexico curve is too steep, particularly in relation to US 2s5s and the level of Mexico's rates. Enter at 114bps
with target at 85bps. Stop at 125bps. The trade has a negative carry/roll of -2.1bps/month.
● Maintain long XAU/XAG ratio bias, then reverse: Precious metals should remain under pressure into technical support lows heading into the
December FOMC meeting, where rates will be hiked for the first time, and then 3 more times in 2016. However, a continued stance on easy monetary
policy and gaining inflation expectations should help to lift precious metals once again—silver more than gold. Enter: 77.5x; Target: 69.0x; Stop: 80.0x.
● Long Zinc - Short Aluminum spread: A bounce in China, continued growth in the US, and a stabilized Europe after renewed ECB easing measures
will lift most base metal boats, but the continued overproduction and export of aluminum by China will overhang prices versus the zinc market tightness,
which has seen some additional supply capitulation in a market already woefully undersupplied. Enter: $144/t; Target: $700/t; Stop: flat.
● Maintain short bias then get long WTI at target price: Global oversupply of oil will persist well beyond the first half of 2016, before a non-OPEC
supply response and inventory drawdowns can offset the return of Iranian oil—remain biased short WTI until price hits our target, where we suggest
building longs. Enter: $42.50/bbl; Target: $60.00/bb; Stop: $32.50/bbl.
Emerging Markets
Australia / New Zealand
Europe
5
10 November 2015 | TD Securities
2016 Global Outlook Rates, FX and Commodities Research
Global Macro Themes for the New Year
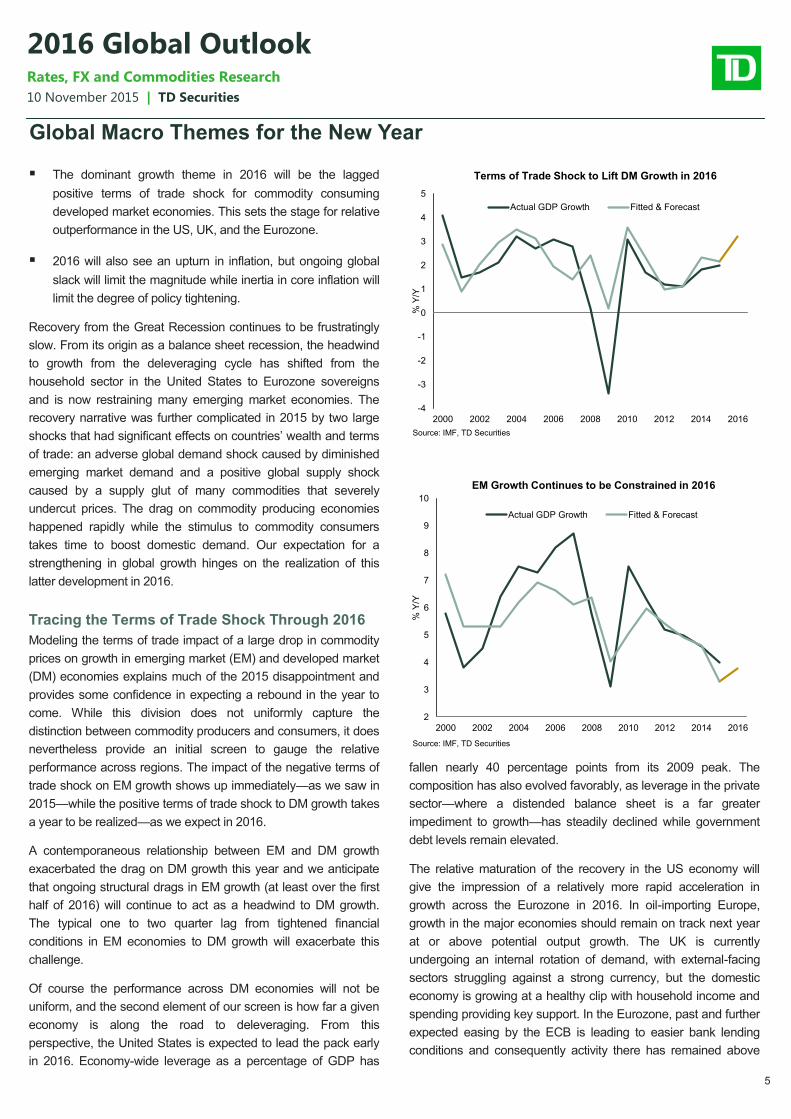
The dominant growth theme in 2016 will be the lagged
positive terms of trade shock for commodity consuming
developed market economies. This sets the stage for relative
outperformance in the US, UK, and the Eurozone.
2016 will also see an upturn in inflation, but ongoing global
slack will limit the magnitude while inertia in core inflation will
limit the degree of policy tightening.
Recovery from the Great Recession continues to be frustratingly
slow. From its origin as a balance sheet recession, the headwind
to growth from the deleveraging cycle has shifted from the
household sector in the United States to Eurozone sovereigns
and is now restraining many emerging market economies. The
recovery narrative was further complicated in 2015 by two large
shocks that had significant effects on countries’ wealth and terms
of trade: an adverse global demand shock caused by diminished
emerging market demand and a positive global supply shock
caused by a supply glut of many commodities that severely
undercut prices. The drag on commodity producing economies
happened rapidly while the stimulus to commodity consumers
takes time to boost domestic demand. Our expectation for a
strengthening in global growth hinges on the realization of this
latter development in 2016.
Tracing the Terms of Trade Shock Through 2016
Modeling the terms of trade impact of a large drop in commodity
prices on growth in emerging market (EM) and developed market
(DM) economies explains much of the 2015 disappointment and
provides some confidence in expecting a rebound in the year to
come. While this division does not uniformly capture the
distinction between commodity producers and consumers, it does
nevertheless provide an initial screen to gauge the relative
performance across regions. The impact of the negative terms of
trade shock on EM growth shows up immediately—as we saw in
2015—while the positive terms of trade shock to DM growth takes
a year to be realized—as we expect in 2016.
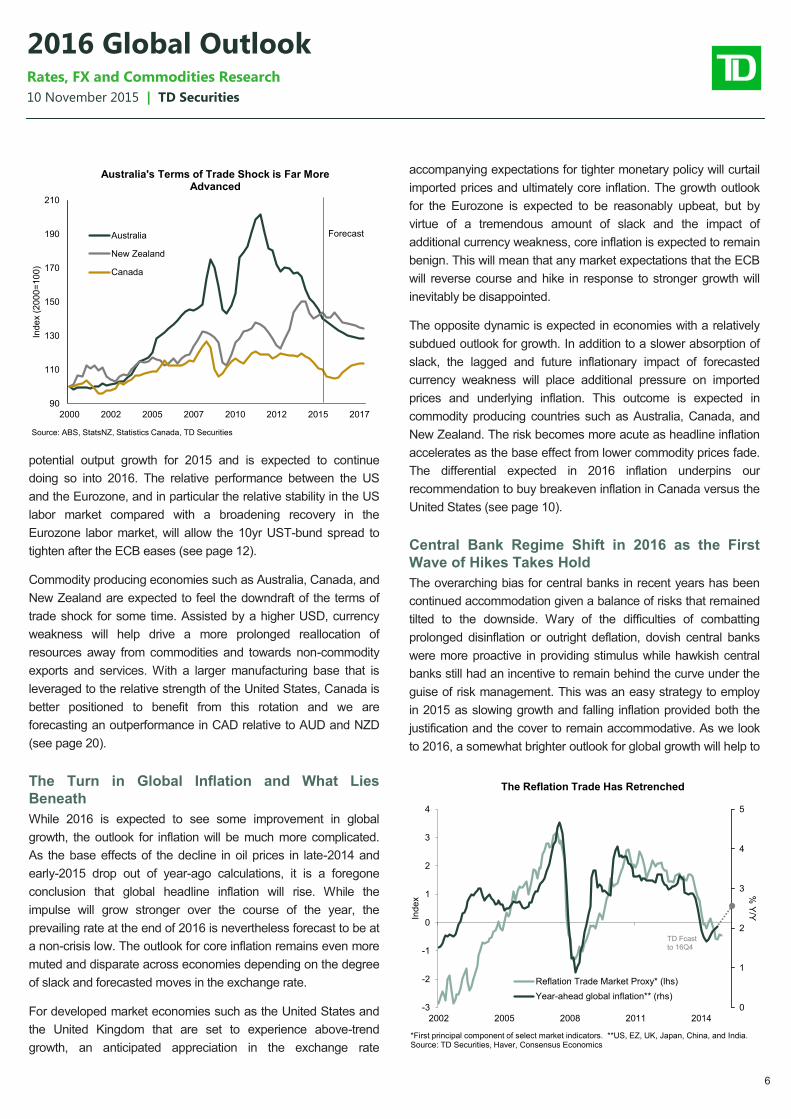
A contemporaneous relationship between EM and DM growth
exacerbated the drag on DM growth this year and we anticipate
that ongoing structural drags in EM growth (at least over the first
half of 2016) will continue to act as a headwind to DM growth.
The typical one to two quarter lag from tightened financial
conditions in EM economies to DM growth will exacerbate this
challenge.
Of course the performance across DM economies will not be
uniform, and the second element of our screen is how far a given
economy is along the road to deleveraging. From this
perspective, the United States is expected to lead the pack early
in 2016. Economy-wide leverage as a percentage of GDP has
fallen nearly 40 percentage points from its 2009 peak. The
composition has also evolved favorably, as leverage in the private
sector—where a distended balance sheet is a far greater
impediment to growth—has steadily declined while government
debt levels remain elevated.
The relative maturation of the recovery in the US economy will
give the impression of a relatively more rapid acceleration in
growth across the Eurozone in 2016. In oil-importing Europe,
growth in the major economies should remain on track next year
at or above potential output growth. The UK is currently
undergoing an internal rotation of demand, with external-facing
sectors struggling against a strong currency, but the domestic
economy is growing at a healthy clip with household income and
spending providing key support. In the Eurozone, past and further
expected easing by the ECB is leading to easier bank lending
conditions and consequently activity there has remained above
-4
-3
-2
-1
0
1
2
3
4
5
2000 2002 2004 2006 2008 2010 2012 2014 2016%
Y/Y
Source: IMF, TD Securities
Terms of Trade Shock to Lift DM Growth in 2016
Actual GDP Growth Fitted & Forecast
2
3
4
5
6
7
8
9
10
2000 2002 2004 2006 2008 2010 2012 2014 2016
% Y
/Y
Source: IMF, TD Securities
EM Growth Continues to be Constrained in 2016
Actual GDP Growth Fitted & Forecast
6
10 November 2015 | TD Securities
2016 Global Outlook Rates, FX and Commodities Research
potential output growth for 2015 and is expected to continue
doing so into 2016. The relative performance between the US
and the Eurozone, and in particular the relative stability in the US
labor market compared with a broadening recovery in the
Eurozone labor market, will allow the 10yr UST-bund spread to
tighten after the ECB eases (see page 12).
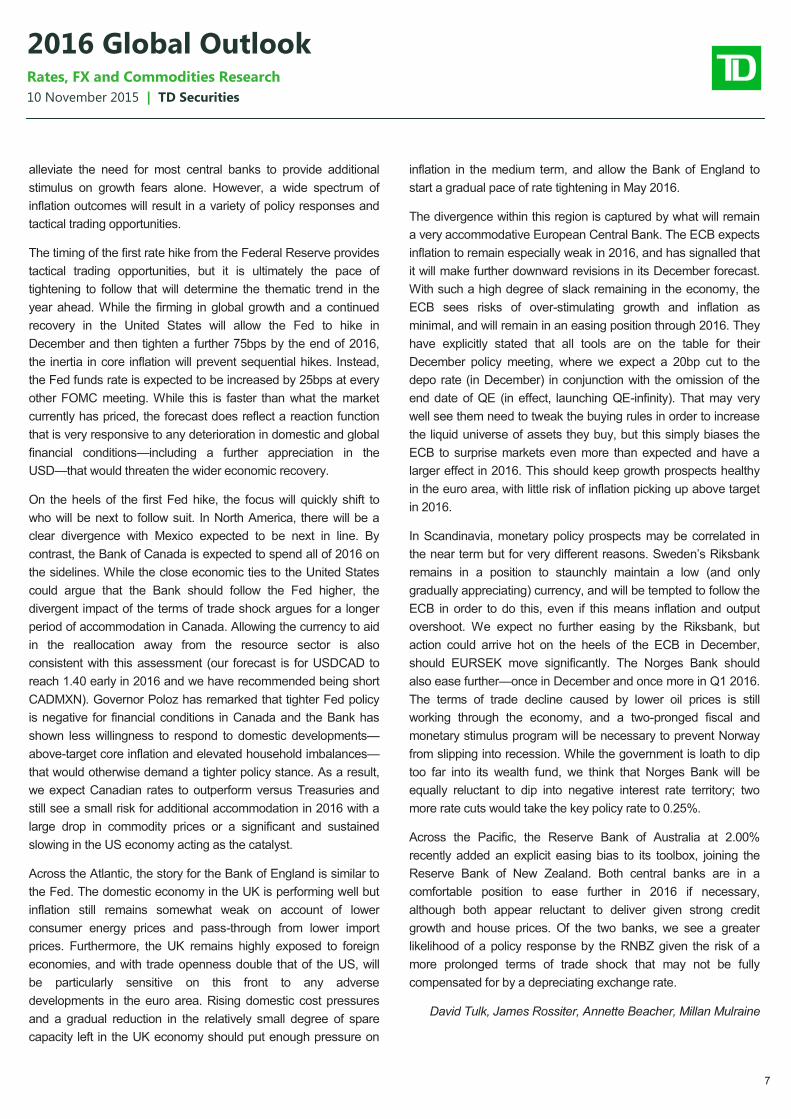
Commodity producing economies such as Australia, Canada, and
New Zealand are expected to feel the downdraft of the terms of
trade shock for some time. Assisted by a higher USD, currency
weakness will help drive a more prolonged reallocation of
resources away from commodities and towards non-commodity
exports and services. With a larger manufacturing base that is
leveraged to the relative strength of the United States, Canada is
better positioned to benefit from this rotation and we are
forecasting an outperformance in CAD relative to AUD and NZD
(see page 20).
The Turn in Global Inflation and What Lies
Beneath
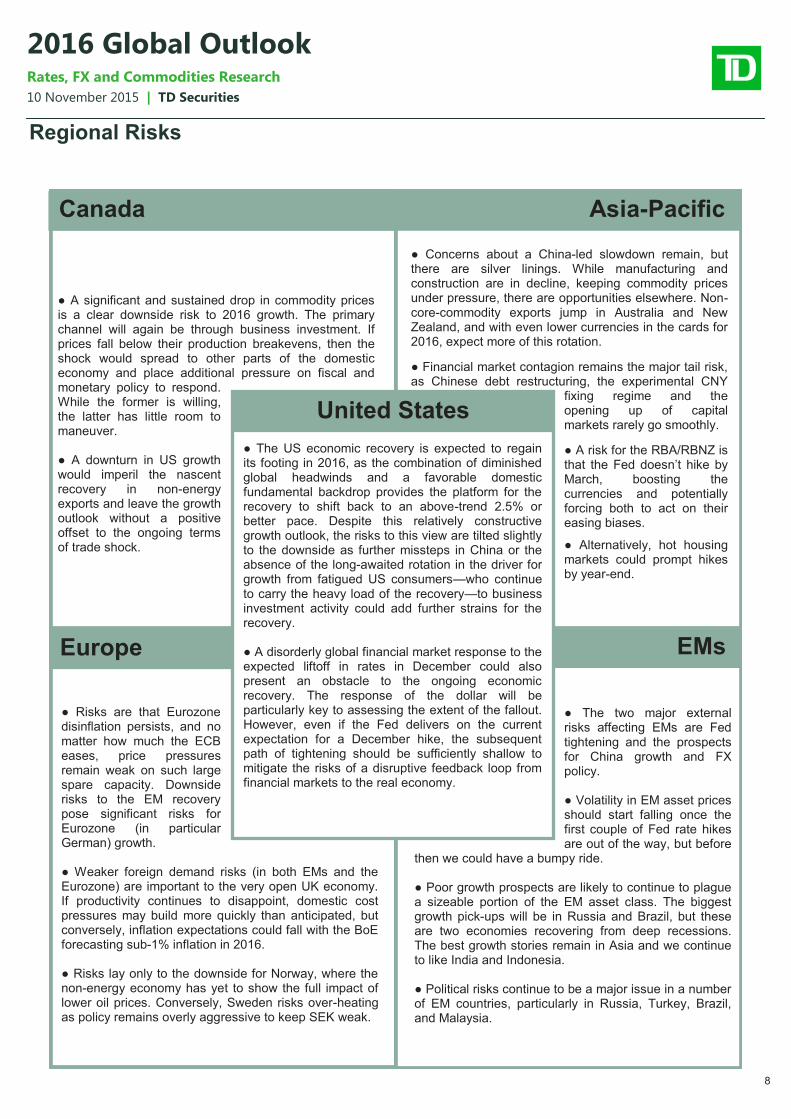
While 2016 is expected to see some improvement in global
growth, the outlook for inflation will be much more complicated.
As the base effects of the decline in oil prices in late-2014 and
early-2015 drop out of year-ago calculations, it is a foregone
conclusion that global headline inflation will rise. While the
impulse will grow stronger over the course of the year, the
prevailing rate at the end of 2016 is nevertheless forecast to be at
a non-crisis low. The outlook for core inflation remains even more
muted and disparate across economies depending on the degree
of slack and forecasted moves in the exchange rate.
For developed market economies such as the United States and
the United Kingdom that are set to experience above-trend
growth, an anticipated appreciation in the exchange rate
accompanying expectations for tighter monetary policy will curtail
imported prices and ultimately core inflation. The growth outlook
for the Eurozone is expected to be reasonably upbeat, but by
virtue of a tremendous amount of slack and the impact of
additional currency weakness, core inflation is expected to remain
benign. This will mean that any market expectations that the ECB
will reverse course and hike in response to stronger growth will
inevitably be disappointed.
The opposite dynamic is expected in economies with a relatively
subdued outlook for growth. In addition to a slower absorption of
slack, the lagged and future inflationary impact of forecasted
currency weakness will place additional pressure on imported
prices and underlying inflation. This outcome is expected in
commodity producing countries such as Australia, Canada, and
New Zealand. The risk becomes more acute as headline inflation
accelerates as the base effect from lower commodity prices fade.
The differential expected in 2016 inflation underpins our
recommendation to buy breakeven inflation in Canada versus the
United States (see page 10).
Central Bank Regime Shift in 2016 as the First
Wave of Hikes Takes Hold
The overarching bias for central banks in recent years has been
continued accommodation given a balance of risks that remained
tilted to the downside. Wary of the difficulties of combatting
prolonged disinflation or outright deflation, dovish central banks
were more proactive in providing stimulus while hawkish central
banks still had an incentive to remain behind the curve under the
guise of risk management. This was an easy strategy to employ
in 2015 as slowing growth and falling inflation provided both the
justification and the cover to remain accommodative. As we look
to 2016, a somewhat brighter outlook for global growth will help to
0
1
2
3
4
5
-3
-2
-1
0
1
2
3
4
2002 2005 2008 2011 2014
% Y
/Y
Ind
ex
The Reflation Trade Has Retrenched
Reflation Trade Market Proxy* (lhs)
Year-ahead global inflation** (rhs)
*First principal component of select market indicators. **US, EZ, UK, Japan, China, and India. Source: TD Securities, Haver, Consensus Economics
TD Fcastto 16Q4
90
110
130
150
170
190
210
2000 2002 2005 2007 2010 2012 2015 2017
Inde
x (
200
0=
10
0)
Source: ABS, StatsNZ, Statistics Canada, TD Securities
Australia's Terms of Trade Shock is Far More Advanced
Australia
New Zealand
Canada
Forecast
7
10 November 2015 | TD Securities
2016 Global Outlook Rates, FX and Commodities Research
alleviate the need for most central banks to provide additional
stimulus on growth fears alone. However, a wide spectrum of
inflation outcomes will result in a variety of policy responses and
tactical trading opportunities.
The timing of the first rate hike from the Federal Reserve provides
tactical trading opportunities, but it is ultimately the pace of
tightening to follow that will determine the thematic trend in the
year ahead. While the firming in global growth and a continued
recovery in the United States will allow the Fed to hike in
December and then tighten a further 75bps by the end of 2016,
the inertia in core inflation will prevent sequential hikes. Instead,
the Fed funds rate is expected to be increased by 25bps at every
other FOMC meeting. While this is faster than what the market
currently has priced, the forecast does reflect a reaction function
that is very responsive to any deterioration in domestic and global
financial conditions—including a further appreciation in the
USD—that would threaten the wider economic recovery.
On the heels of the first Fed hike, the focus will quickly shift to
who will be next to follow suit. In North America, there will be a
clear divergence with Mexico expected to be next in line. By
contrast, the Bank of Canada is expected to spend all of 2016 on
the sidelines. While the close economic ties to the United States
could argue that the Bank should follow the Fed higher, the
divergent impact of the terms of trade shock argues for a longer
period of accommodation in Canada. Allowing the currency to aid
in the reallocation away from the resource sector is also
consistent with this assessment (our forecast is for USDCAD to
reach 1.40 early in 2016 and we have recommended being short
CADMXN). Governor Poloz has remarked that tighter Fed policy
is negative for financial conditions in Canada and the Bank has
shown less willingness to respond to domestic developments—
above-target core inflation and elevated household imbalances—
that would otherwise demand a tighter policy stance. As a result,
we expect Canadian rates to outperform versus Treasuries and
still see a small risk for additional accommodation in 2016 with a
large drop in commodity prices or a significant and sustained
slowing in the US economy acting as the catalyst.
Across the Atlantic, the story for the Bank of England is similar to
the Fed. The domestic economy in the UK is performing well but
inflation still remains somewhat weak on account of lower
consumer energy prices and pass-through from lower import
prices. Furthermore, the UK remains highly exposed to foreign
economies, and with trade openness double that of the US, will
be particularly sensitive on this front to any adverse
developments in the euro area. Rising domestic cost pressures
and a gradual reduction in the relatively small degree of spare
capacity left in the UK economy should put enough pressure on
inflation in the medium term, and allow the Bank of England to
start a gradual pace of rate tightening in May 2016.
The divergence within this region is captured by what will remain
a very accommodative European Central Bank. The ECB expects
inflation to remain especially weak in 2016, and has signalled that
it will make further downward revisions in its December forecast.
With such a high degree of slack remaining in the economy, the
ECB sees risks of over-stimulating growth and inflation as
minimal, and will remain in an easing position through 2016. They
have explicitly stated that all tools are on the table for their
December policy meeting, where we expect a 20bp cut to the
depo rate (in December) in conjunction with the omission of the
end date of QE (in effect, launching QE-infinity). That may very
well see them need to tweak the buying rules in order to increase
the liquid universe of assets they buy, but this simply biases the
ECB to surprise markets even more than expected and have a
larger effect in 2016. This should keep growth prospects healthy
in the euro area, with little risk of inflation picking up above target
in 2016.
In Scandinavia, monetary policy prospects may be correlated in
the near term but for very different reasons. Sweden’s Riksbank
remains in a position to staunchly maintain a low (and only
gradually appreciating) currency, and will be tempted to follow the
ECB in order to do this, even if this means inflation and output
overshoot. We expect no further easing by the Riksbank, but
action could arrive hot on the heels of the ECB in December,
should EURSEK move significantly. The Norges Bank should
also ease further—once in December and once more in Q1 2016.
The terms of trade decline caused by lower oil prices is still
working through the economy, and a two-pronged fiscal and
monetary stimulus program will be necessary to prevent Norway
from slipping into recession. While the government is loath to dip
too far into its wealth fund, we think that Norges Bank will be
equally reluctant to dip into negative interest rate territory; two
more rate cuts would take the key policy rate to 0.25%.
Across the Pacific, the Reserve Bank of Australia at 2.00%
recently added an explicit easing bias to its toolbox, joining the
Reserve Bank of New Zealand. Both central banks are in a
comfortable position to ease further in 2016 if necessary,
although both appear reluctant to deliver given strong credit
growth and house prices. Of the two banks, we see a greater
likelihood of a policy response by the RNBZ given the risk of a
more prolonged terms of trade shock that may not be fully
compensated for by a depreciating exchange rate.
David Tulk, James Rossiter, Annette Beacher, Millan Mulraine
8
10 November 2015 | TD Securities
2016 Global Outlook Rates, FX and Commodities Research
Regional Risks
● A significant and sustained drop in commodity prices is a clear downside risk to 2016 growth. The primary channel will again be through business investment. If prices fall below their production breakevens, then the shock would spread to other parts of the domestic economy and place additional pressure on fiscal and monetary policy to respond. While the former is willing, the latter has little room to maneuver. ● A downturn in US growth would imperil the nascent recovery in non-energy exports and leave the growth outlook without a positive offset to the ongoing terms of trade shock.
● Concerns about a China-led slowdown remain, but there are silver linings. While manufacturing and construction are in decline, keeping commodity prices under pressure, there are opportunities elsewhere. Non-core-commodity exports jump in Australia and New Zealand, and with even lower currencies in the cards for 2016, expect more of this rotation.
● Financial market contagion remains the major tail risk, as Chinese debt restructuring, the experimental CNY
fixing regime and the opening up of capital markets rarely go smoothly.
● A risk for the RBA/RBNZ is that the Fed doesn’t hike by March, boosting the currencies and potentially forcing both to act on their easing biases.
● Alternatively, hot housing markets could prompt hikes by year-end.
● Risks are that Eurozone disinflation persists, and no matter how much the ECB eases, price pressures remain weak on such large spare capacity. Downside risks to the EM recovery pose significant risks for Eurozone (in particular German) growth. ● Weaker foreign demand risks (in both EMs and the Eurozone) are important to the very open UK economy. If productivity continues to disappoint, domestic cost pressures may build more quickly than anticipated, but conversely, inflation expectations could fall with the BoE forecasting sub-1% inflation in 2016. ● Risks lay only to the downside for Norway, where the non-energy economy has yet to show the full impact of lower oil prices. Conversely, Sweden risks over-heating as policy remains overly aggressive to keep SEK weak.
● The two major external risks affecting EMs are Fed tightening and the prospects for China growth and FX policy. ● Volatility in EM asset prices should start falling once the first couple of Fed rate hikes are out of the way, but before
then we could have a bumpy ride. ● Poor growth prospects are likely to continue to plague a sizeable portion of the EM asset class. The biggest growth pick-ups will be in Russia and Brazil, but these are two economies recovering from deep recessions. The best growth stories remain in Asia and we continue to like India and Indonesia. ● Political risks continue to be a major issue in a number of EM countries, particularly in Russia, Turkey, Brazil, and Malaysia.
● The US economic recovery is expected to regain its footing in 2016, as the combination of diminished global headwinds and a favorable domestic fundamental backdrop provides the platform for the recovery to shift back to an above-trend 2.5% or better pace. Despite this relatively constructive growth outlook, the risks to this view are tilted slightly to the downside as further missteps in China or the absence of the long-awaited rotation in the driver for growth from fatigued US consumers—who continue to carry the heavy load of the recovery—to business investment activity could add further strains for the recovery. ● A disorderly global financial market response to the expected liftoff in rates in December could also present an obstacle to the ongoing economic recovery. The response of the dollar will be particularly key to assessing the extent of the fallout. However, even if the Fed delivers on the current expectation for a December hike, the subsequent path of tightening should be sufficiently shallow to mitigate the risks of a disruptive feedback loop from financial markets to the real economy.
Canada Asia-Pacific
EMs Europe
United States
9
10 November 2015 | TD Securities
2016 Global Outlook Rates, FX and Commodities Research
Global Rates
Policy Divergence in a Recoupling World
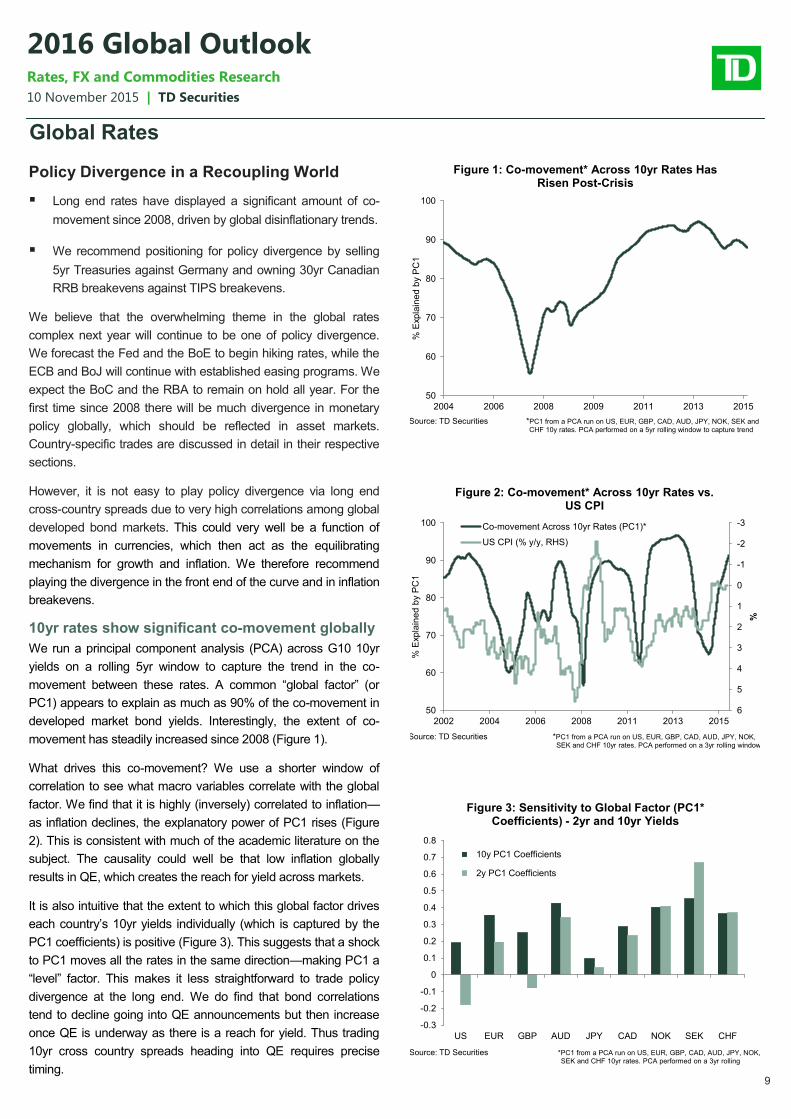
Long end rates have displayed a significant amount of co-
movement since 2008, driven by global disinflationary trends.
We recommend positioning for policy divergence by selling
5yr Treasuries against Germany and owning 30yr Canadian
RRB breakevens against TIPS breakevens.
We believe that the overwhelming theme in the global rates
complex next year will continue to be one of policy divergence.
We forecast the Fed and the BoE to begin hiking rates, while the
ECB and BoJ will continue with established easing programs. We
expect the BoC and the RBA to remain on hold all year. For the
first time since 2008 there will be much divergence in monetary
policy globally, which should be reflected in asset markets.
Country-specific trades are discussed in detail in their respective
sections.
However, it is not easy to play policy divergence via long end
cross-country spreads due to very high correlations among global
developed bond markets. This could very well be a function of
movements in currencies, which then act as the equilibrating
mechanism for growth and inflation. We therefore recommend
playing the divergence in the front end of the curve and in inflation
breakevens.
10yr rates show significant co-movement globally
We run a principal component analysis (PCA) across G10 10yr
yields on a rolling 5yr window to capture the trend in the co-
movement between these rates. A common “global factor” (or
PC1) appears to explain as much as 90% of the co-movement in
developed market bond yields. Interestingly, the extent of co-
movement has steadily increased since 2008 (Figure 1).
What drives this co-movement? We use a shorter window of
correlation to see what macro variables correlate with the global
factor. We find that it is highly (inversely) correlated to inflation—
as inflation declines, the explanatory power of PC1 rises (Figure
2). This is consistent with much of the academic literature on the
subject. The causality could well be that low inflation globally
results in QE, which creates the reach for yield across markets.
It is also intuitive that the extent to which this global factor drives
each country’s 10yr yields individually (which is captured by the
PC1 coefficients) is positive (Figure 3). This suggests that a shock
to PC1 moves all the rates in the same direction—making PC1 a
“level” factor. This makes it less straightforward to trade policy
divergence at the long end. We do find that bond correlations
tend to decline going into QE announcements but then increase
once QE is underway as there is a reach for yield. Thus trading
10yr cross country spreads heading into QE requires precise
timing.
50
60
70
80
90
100
2004 2006 2008 2009 2011 2013 2015%
Exp
lain
ed
by P
C1
Figure 1: Co-movement* Across 10yr Rates Has Risen Post-Crisis
Source: TD Securities *PC1 from a PCA run on US, EUR, GBP, CAD, AUD, JPY, NOK, SEK and
CHF 10y rates. PCA performed on a 5yr rolling window to capture trend
-3
-2
-1
0
1
2
3
4
5
650
60
70
80
90
100
2002 2004 2006 2008 2011 2013 2015
%
% E
xp
lain
ed
by P
C1
Figure 2: Co-movement* Across 10yr Rates vs. US CPI
Co-movement Across 10yr Rates (PC1)*
US CPI (% y/y, RHS)
Source: TD Securities *PC1 from a PCA run on US, EUR, GBP, CAD, AUD, JPY, NOK,
SEK and CHF 10yr rates. PCA performed on a 3yr rolling window
-0.3
-0.2
-0.1
0
0.1
0.2
0.3
0.4
0.5
0.6
0.7
0.8
US EUR GBP AUD JPY CAD NOK SEK CHF
Figure 3: Sensitivity to Global Factor (PC1* Coefficients) - 2yr and 10yr Yields
10y PC1 Coefficients
2y PC1 Coefficients
Source: TD Securities *PC1 from a PCA run on US, EUR, GBP, CAD, AUD, JPY, NOK, SEK and CHF 10yr rates. PCA performed on a 3yr rolling
10
10 November 2015 | TD Securities
2016 Global Outlook Rates, FX and Commodities Research
Trade divergence in the front end
When we perform the same PCA analysis on 2yr and 5yr yields,
we find that while the general co-movement in yields has also
risen post-crisis, the rise has been far more volatile. This is
intuitive as front end yields capture the monetary policy
divergence between regions and exhibit less of a “reach for yield”
effect. In addition, we find that the coefficient to the global factor is
not consistent across markets. A shock to PC1 moves US and
UK 2yr yields in one direction, and the other G10 yields in the
opposite direction. For 5yr rates, a shock to PC1 moves US yields
in an opposite direction to the rest of the G10—making PC1 on
2yr and 5yr yields more of a “slope” factor.
Given our expectations of divergent monetary policies between
the Fed and the ECB, we recommend selling 5yr US against
Europe. We choose the 5yr over the 2yr, as the carry/roll is less
punitive and current levels look more attractive. The 5s also carry
negatively but we believe that the risk/reward is still compelling.
A history lesson: There has been another historical period of
divergence between the Fed and the ECB. In 2004, the Fed
began to hike but the ECB began hiking only a year later. We ran
a PCA on both curves jointly from June 2002 to June 2005. We
find that from 2002-2004 (synchronised monetary policies of
easing and then hold), the global factor (PC1) impacted both the
US and European rates in the same direction. But as the Fed
began hiking, a shock to PC1 impacted US rates positively but
European rates negatively. In addition, the extent to which PC1
drove each rate was greatest for front end US rates and negative
for European rates—reflecting a hiking Fed and ECB on hold.
This was consistent with the much greater widening of 2yr and
5yr differentials than at the 10yr point (Figure 4).
Thus, we conclude that as the Fed hikes and the ECB eases
further, the volatility of the 0-5yr US yields (and therefore the
sensitivity to PC1) should not only jump, but also be considerably
higher than for European yields. This further explains why a 5yr
US/EU trade should be profitable and outweigh its negative carry.
In addition, we expect an ECB depo cut in coming months, which
would further depress front end European yield vol. For clients
expressing the trade in swaps—we expect the spread to move to
160bp from 140bp currently.
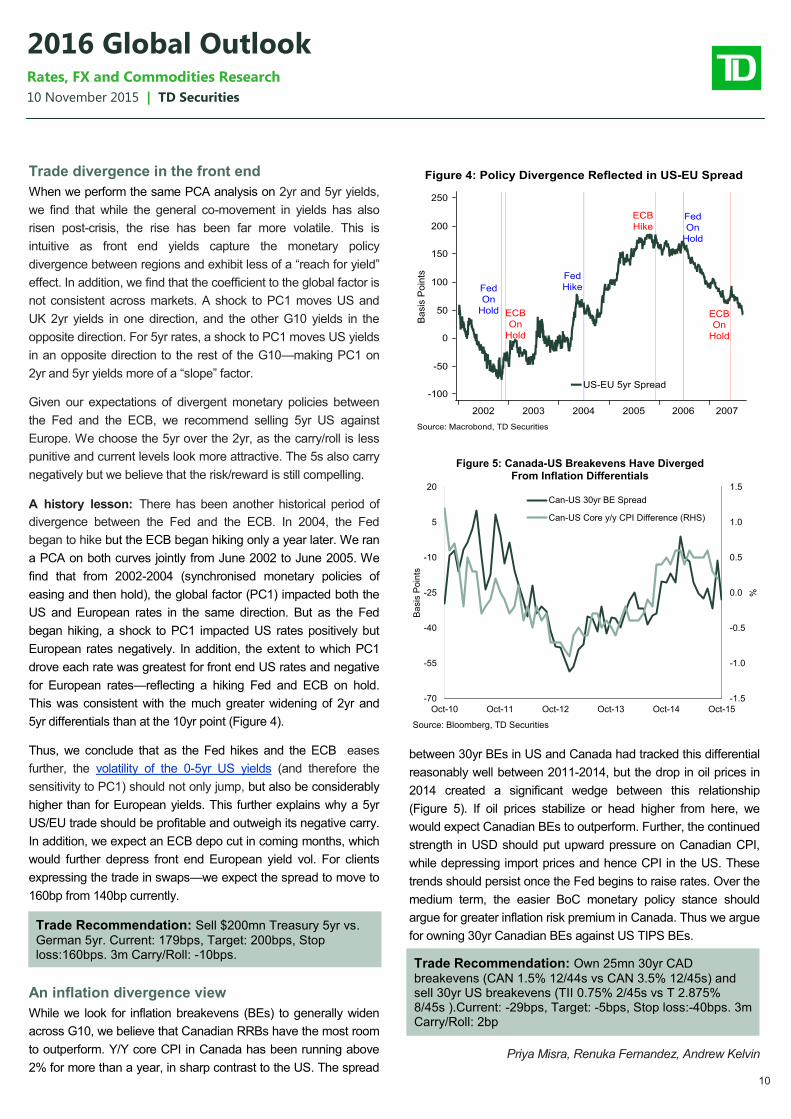
An inflation divergence view
While we look for inflation breakevens (BEs) to generally widen
across G10, we believe that Canadian RRBs have the most room
to outperform. Y/Y core CPI in Canada has been running above
2% for more than a year, in sharp contrast to the US. The spread
between 30yr BEs in US and Canada had tracked this differential
reasonably well between 2011-2014, but the drop in oil prices in
2014 created a significant wedge between this relationship
(Figure 5). If oil prices stabilize or head higher from here, we
would expect Canadian BEs to outperform. Further, the continued
strength in USD should put upward pressure on Canadian CPI,
while depressing import prices and hence CPI in the US. These
trends should persist once the Fed begins to raise rates. Over the
medium term, the easier BoC monetary policy stance should
argue for greater inflation risk premium in Canada. Thus we argue
for owning 30yr Canadian BEs against US TIPS BEs.
Priya Misra, Renuka Fernandez, Andrew Kelvin
Trade Recommendation: Own 25mn 30yr CAD
breakevens (CAN 1.5% 12/44s vs CAN 3.5% 12/45s) and sell 30yr US breakevens (TII 0.75% 2/45s vs T 2.875% 8/45s ).Current: -29bps, Target: -5bps, Stop loss:-40bps. 3m Carry/Roll: 2bp
Trade Recommendation: Sell $200mn Treasury 5yr vs.
German 5yr. Current: 179bps, Target: 200bps, Stop loss:160bps. 3m Carry/Roll: -10bps.
-1.5
-1.0
-0.5
0.0
0.5
1.0
1.5
-70
-55
-40
-25
-10
5
20
Oct-10 Oct-11 Oct-12 Oct-13 Oct-14 Oct-15
%
Ba
sis
Po
ints
Source: Bloomberg, TD Securities
Figure 5: Canada-US Breakevens Have Diverged From Inflation Differentials
Can-US 30yr BE Spread
Can-US Core y/y CPI Difference (RHS)
11
10 November 2015 | TD Securities
2016 Global Outlook Rates, FX and Commodities Research
US Rates
Start Your Engines, Fasten Your Seatbelts
We recommend positioning for a Fed hiking cycle that is
faster than currently priced in via EDH6-H7 steepeners and
5s30s flatteners. Long end rates should remain contained
amid muted productivity, demographics and low global bond
yields. TIPS BEs are cheap on a fundamental basis, but
given near term negative carry, we wait for a dip to buy.
We expect a choppy market in 2016, with significant realized
volatility as investors grapple with a hiking Fed amid
regulatory pressures that constrain dealer risk appetite. Final
NSFR rules and money fund reform will dominate the front
end. Pressure on dealer balance sheets should keep swap
spreads at the tighter end of the spectrum and the correlation
between on-balance sheet and off-balance sheet assets
should continue to decline.
It is never easy to write a year-ahead outlook, but as we put pen
to paper this year, it seems especially challenging. After seven
years of being at the zero lower bound, we forecast the Fed to
finally raise rates in December and proceed with subsequent
hikes throughout 2016. Much of the market’s attention next year
will be spent on deciphering the Fed’s next steps and the
ramifications of rate hikes globally across assets.
However memories of 2014 and 2015 are still fresh as the market
began to truly appreciate the vulnerability of the US recovery and
the impact of global forces. The overriding theme since the crisis
has been one of sub-par growth, which creates the risk of being
derailed due to global growth weakness or tighter financial
conditions. The Fed is finally able to hike due to cumulative
progress in the labor market, but longer-term questions remain
about potential growth and ability to reach the inflation target.
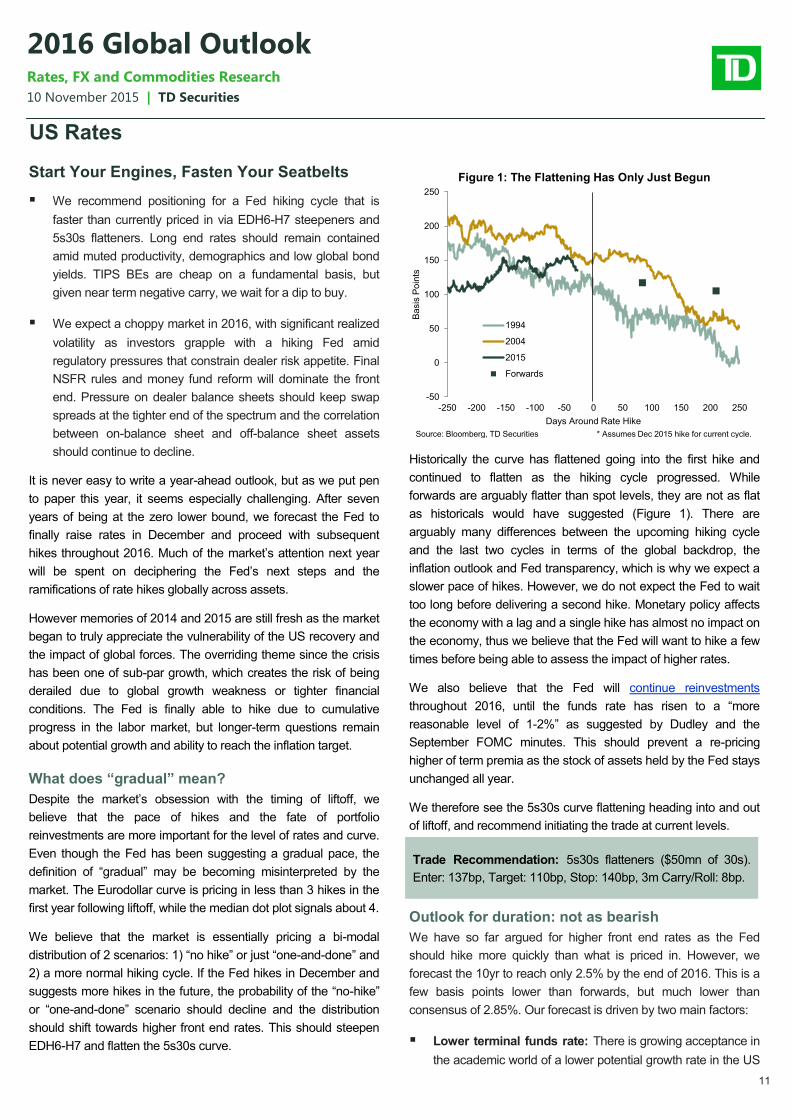
What does “gradual” mean?
Despite the market’s obsession with the timing of liftoff, we
believe that the pace of hikes and the fate of portfolio
reinvestments are more important for the level of rates and curve.
Even though the Fed has been suggesting a gradual pace, the
definition of “gradual” may be becoming misinterpreted by the
market. The Eurodollar curve is pricing in less than 3 hikes in the
first year following liftoff, while the median dot plot signals about 4.
We believe that the market is essentially pricing a bi-modal
distribution of 2 scenarios: 1) “no hike” or just “one-and-done” and
2) a more normal hiking cycle. If the Fed hikes in December and
suggests more hikes in the future, the probability of the “no-hike”
or “one-and-done” scenario should decline and the distribution
should shift towards higher front end rates. This should steepen
EDH6-H7 and flatten the 5s30s curve.
Historically the curve has flattened going into the first hike and
continued to flatten as the hiking cycle progressed. While
forwards are arguably flatter than spot levels, they are not as flat
as historicals would have suggested (Figure 1). There are
arguably many differences between the upcoming hiking cycle
and the last two cycles in terms of the global backdrop, the
inflation outlook and Fed transparency, which is why we expect a
slower pace of hikes. However, we do not expect the Fed to wait
too long before delivering a second hike. Monetary policy affects
the economy with a lag and a single hike has almost no impact on
the economy, thus we believe that the Fed will want to hike a few
times before being able to assess the impact of higher rates.
We also believe that the Fed will continue reinvestments
throughout 2016, until the funds rate has risen to a “more
reasonable level of 1-2%” as suggested by Dudley and the
September FOMC minutes. This should prevent a re-pricing
higher of term premia as the stock of assets held by the Fed stays
unchanged all year.
We therefore see the 5s30s curve flattening heading into and out
of liftoff, and recommend initiating the trade at current levels.
Outlook for duration: not as bearish
We have so far argued for higher front end rates as the Fed
should hike more quickly than what is priced in. However, we
forecast the 10yr to reach only 2.5% by the end of 2016. This is a
few basis points lower than forwards, but much lower than
consensus of 2.85%. Our forecast is driven by two main factors:
Lower terminal funds rate: There is growing acceptance in
the academic world of a lower potential growth rate in the US
-50
0
50
100
150
200
250
-250 -200 -150 -100 -50 0 50 100 150 200 250B
asis
Po
ints
Days Around Rate Hike
Figure 1: The Flattening Has Only Just Begun
1994
2004
2015
Forwards
Source: Bloomberg, TD Securities * Assumes Dec 2015 hike for current cycle.
Trade Recommendation: 5s30s flatteners ($50mn of 30s).
Enter: 137bp, Target: 110bp, Stop: 140bp, 3m Carry/Roll: 8bp.
12
10 November 2015 | TD Securities
2016 Global Outlook Rates, FX and Commodities Research
which results in a low real terminal funds rate. This could be
due to cyclical reasons (a function of the financial crisis itself)
or structural reasons (such as productivity), but the fact that
many estimates of the natural real rate have not risen despite
the recovery in the labor market tilts the balance more
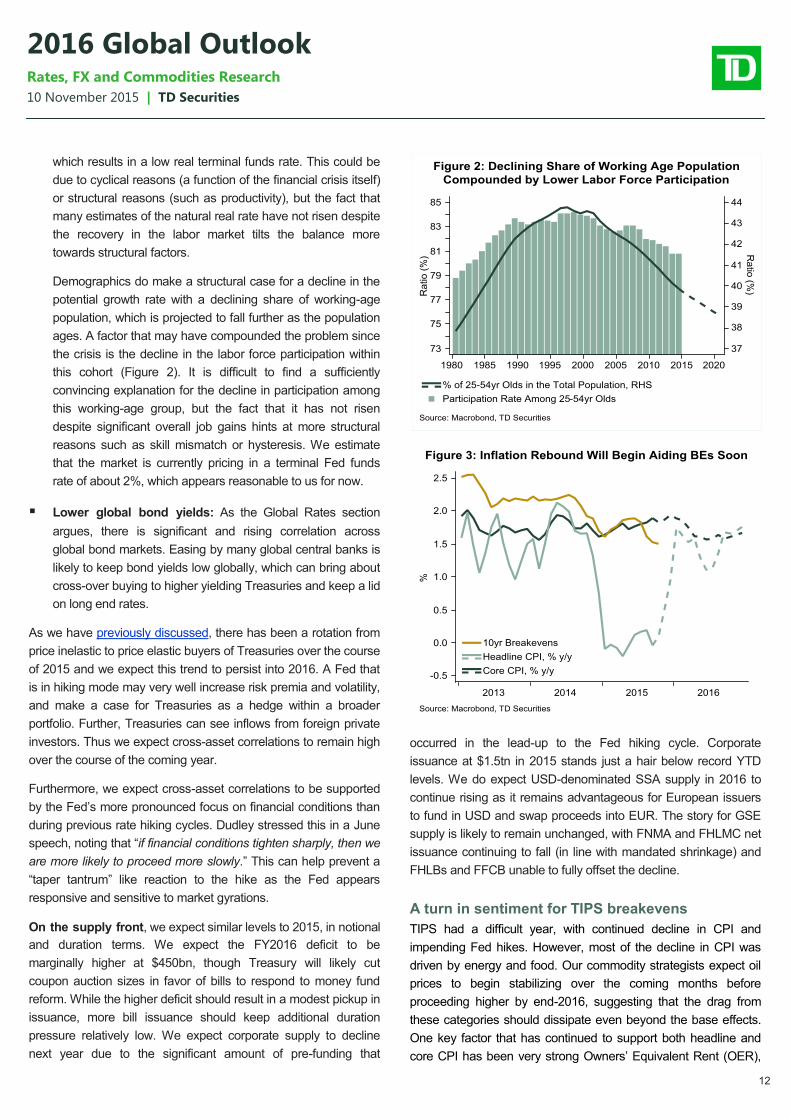
towards structural factors.
Demographics do make a structural case for a decline in the
potential growth rate with a declining share of working-age
population, which is projected to fall further as the population
ages. A factor that may have compounded the problem since
the crisis is the decline in the labor force participation within
this cohort (Figure 2). It is difficult to find a sufficiently
convincing explanation for the decline in participation among
this working-age group, but the fact that it has not risen
despite significant overall job gains hints at more structural
reasons such as skill mismatch or hysteresis. We estimate
that the market is currently pricing in a terminal Fed funds
rate of about 2%, which appears reasonable to us for now.
Lower global bond yields: As the Global Rates section
argues, there is significant and rising correlation across
global bond markets. Easing by many global central banks is
likely to keep bond yields low globally, which can bring about
cross-over buying to higher yielding Treasuries and keep a lid
on long end rates.
As we have previously discussed, there has been a rotation from
price inelastic to price elastic buyers of Treasuries over the course
of 2015 and we expect this trend to persist into 2016. A Fed that
is in hiking mode may very well increase risk premia and volatility,
and make a case for Treasuries as a hedge within a broader
portfolio. Further, Treasuries can see inflows from foreign private
investors. Thus we expect cross-asset correlations to remain high
over the course of the coming year.
Furthermore, we expect cross-asset correlations to be supported
by the Fed’s more pronounced focus on financial conditions than
during previous rate hiking cycles. Dudley stressed this in a June
speech, noting that “if financial conditions tighten sharply, then we
are more likely to proceed more slowly.” This can help prevent a
“taper tantrum” like reaction to the hike as the Fed appears
responsive and sensitive to market gyrations.
On the supply front, we expect similar levels to 2015, in notional
and duration terms. We expect the FY2016 deficit to be
marginally higher at $450bn, though Treasury will likely cut
coupon auction sizes in favor of bills to respond to money fund
reform. While the higher deficit should result in a modest pickup in
issuance, more bill issuance should keep additional duration
pressure relatively low. We expect corporate supply to decline
next year due to the significant amount of pre-funding that
occurred in the lead-up to the Fed hiking cycle. Corporate
issuance at $1.5tn in 2015 stands just a hair below record YTD
levels. We do expect USD-denominated SSA supply in 2016 to
continue rising as it remains advantageous for European issuers
to fund in USD and swap proceeds into EUR. The story for GSE
supply is likely to remain unchanged, with FNMA and FHLMC net
issuance continuing to fall (in line with mandated shrinkage) and
FHLBs and FFCB unable to fully offset the decline.
A turn in sentiment for TIPS breakevens
TIPS had a difficult year, with continued decline in CPI and
impending Fed hikes. However, most of the decline in CPI was
driven by energy and food. Our commodity strategists expect oil
prices to begin stabilizing over the coming months before
proceeding higher by end-2016, suggesting that the drag from
these categories should dissipate even beyond the base effects.
One key factor that has continued to support both headline and
core CPI has been very strong Owners’ Equivalent Rent (OER),
13
10 November 2015 | TD Securities
2016 Global Outlook Rates, FX and Commodities Research
due to a particularly low housing vacancy rate. Our analysis
points to a roughly 12m lag between the vacancy rate and OER,
suggesting the likelihood of further upward pressure on CPI in
2016 alongside dissipating drag from food and energy.
We therefore believe that TIPS look cheap on a fundamental
basis, even though Fed hikes could keep upside capped. With y/y
headline inflation set to begin turning higher in January (Figure 3),
TIPS should begin to look more attractive as carry should turn
positive in March. Despite our constructive outlook on TIPS, we
wait for a dip (150bp on 10s) before going long since breakevens
have risen recently, near-term carry remains negative and
balance sheet pressures could intensify into year-end.
Balance sheet pressures: the new normal
We believe that the market displayed clear signals of constrained
balance sheets throughout the year. We had previously
highlighted that despite rates staying largely range-bound, there
were many more 1σ and 3σ days in 2015 for Treasuries, which
may be a sign of lower liquidity conditions. Treasury futures
persistently traded rich to their underlying cash deliverables,
implying an arbitrage opportunity, assuming access to balance
sheet. Treasuries cheapened to Libor despite the absence of a
catalyst.
We believe that these market movements can be explained by a
rising cost of balance sheet due to the Supplementary Leverage
Ratio (SLR) and upcoming Net Stable Funding Ratio rules
(finalized rules due in 2016). The repo market is most inexorably
linked to the cost of balance sheet and therefore faces the brunt
of new regulations. Interestingly, the it has adjusted to this new
reality through price (wider bid-ask spreads) as well as quantity.
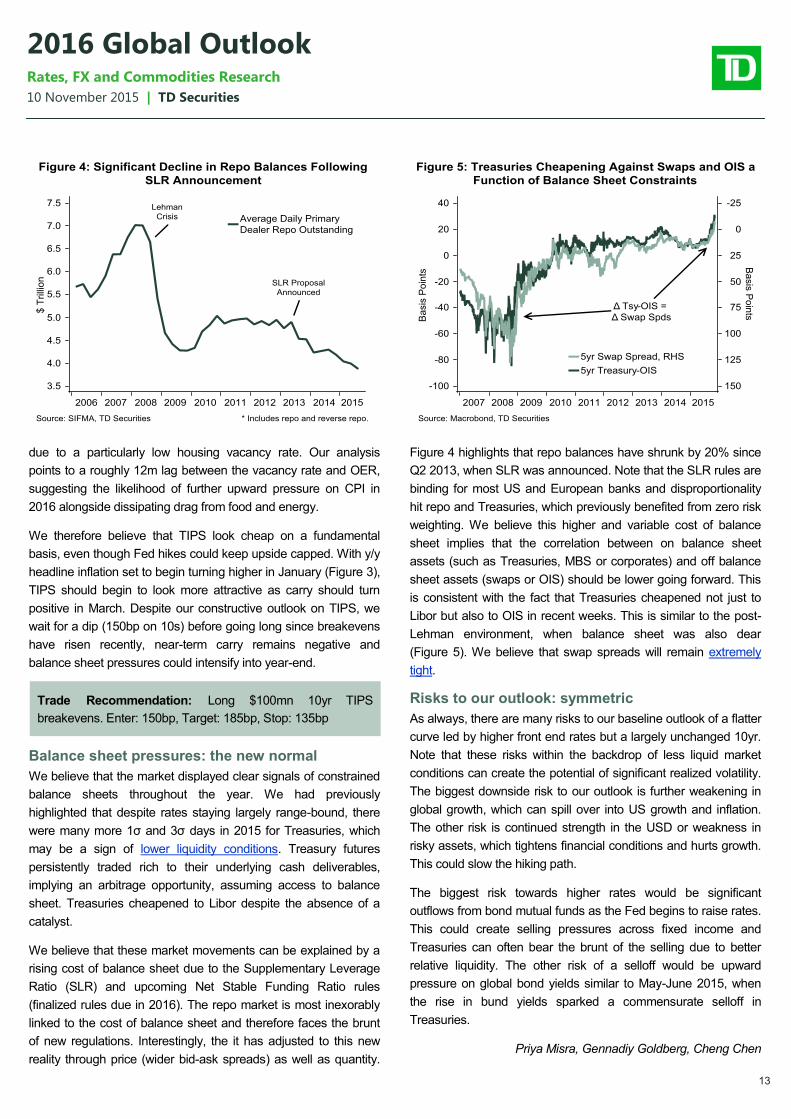
Figure 4 highlights that repo balances have shrunk by 20% since
Q2 2013, when SLR was announced. Note that the SLR rules are
binding for most US and European banks and disproportionality
hit repo and Treasuries, which previously benefited from zero risk
weighting. We believe this higher and variable cost of balance
sheet implies that the correlation between on balance sheet
assets (such as Treasuries, MBS or corporates) and off balance
sheet assets (swaps or OIS) should be lower going forward. This
is consistent with the fact that Treasuries cheapened not just to
Libor but also to OIS in recent weeks. This is similar to the post-
Lehman environment, when balance sheet was also dear
(Figure 5). We believe that swap spreads will remain extremely
tight.
Risks to our outlook: symmetric
As always, there are many risks to our baseline outlook of a flatter
curve led by higher front end rates but a largely unchanged 10yr.
Note that these risks within the backdrop of less liquid market
conditions can create the potential of significant realized volatility.
The biggest downside risk to our outlook is further weakening in
global growth, which can spill over into US growth and inflation.
The other risk is continued strength in the USD or weakness in
risky assets, which tightens financial conditions and hurts growth.
This could slow the hiking path.
The biggest risk towards higher rates would be significant
outflows from bond mutual funds as the Fed begins to raise rates.
This could create selling pressures across fixed income and
Treasuries can often bear the brunt of the selling due to better
relative liquidity. The other risk of a selloff would be upward
pressure on global bond yields similar to May-June 2015, when
the rise in bund yields sparked a commensurate selloff in
Treasuries.
Priya Misra, Gennadiy Goldberg, Cheng Chen
Trade Recommendation: Long $100mn 10yr TIPS
breakevens. Enter: 150bp, Target: 185bp, Stop: 135bp
14
10 November 2015 | TD Securities
2016 Global Outlook Rates, FX and Commodities Research
Canada Rates
Slow on the Uptick
Policy divergence will be the most important theme, as the
BoC stays on hold amid Fed hikes. Higher US rates will feed
into Canada, but the impact will be greatest in the belly of the
curve as BoC policy anchors the front-end.
2s10s should steepen materially, but the tactical backdrop for
2s10s is poor right now. For the moment, 10s30s flatteners
look like a better way to position for higher US rates. We also
see significant upside in RRBs, as 30yr real yields are at their
highs for 2015 with breakevens near post-crisis lows.
2015 was one of the more interesting years in recent memory for
Canadian fixed income, with the Bank of Canada cutting policy
rates twice in response to the collapse in oil prices. By easing, the
BoC was effectively catching up with dominant trend in the rest of
the G10; over the last 3-4 years the Fed, ECB, BoJ, and RBA
have all added varying degrees of monetary stimulus. The Bank
of Canada just looks like the last central bank to join the easing
parade—so in that sense the story for the Canadian rates space
was convergence. This was most apparent in the front-end of the
curve, where Canadian 2s went from trading 40bps wide of
Treasuries to 20bps through. By the start of the new year, the
metronome will swing back to divergence, as there is virtually no
scope for the BoC to lift policy rates in H1 2016, and even in the
second half of the year hikes feel premature.
The move to normalize monetary policy in the US will be the
driving factor in Canadian rates, and the 2011-13 period when the
Fed was adding more stimulus while the BoC remained on the
sidelines should provide us with some guidance for the upcoming
year. The most obvious implication is that correlations between
Canadian and US rates will weaken in the front-end of the curve.
The OIS curve has moved to incorporate a slight tightening bias
in sympathy with the Fed (the implied rate for July 2016 is 54bps),
but there is only the faintest hope of actually seeing tightening in
Canada by mid-2016. If anything, the risks around the BoC skew
towards lower rates as we are still in the early phase of the export
recovery and oil prices will remain depressed through H1 2016,
which makes Canadian 2s very attractive now that they offer
modest positive carry. In the very near-term we may see further
upward pressure on front-end rates, but we would revisit outright
long positions in 2s and BAXs ahead of the December 2nd Fixed
Announcement Date.
10s Will Lag Early in the Year
While cross market correlations will weaken and GoC bonds will
tighten versus Treasuries across the curve, the direction in yields
will still be higher. 10s tend to be most sensitive to movements in
the Treasury market, and we expect 2s to be well supported near
current levels. Consequently, we look for the curve to bear-
steepen through the latter half of December and into January.
This is the opposite of 2011-13, when Fed easing pushed yields
lower in the belly and long-end in Canada but BoC forward
guidance blunted the impact on 2s.
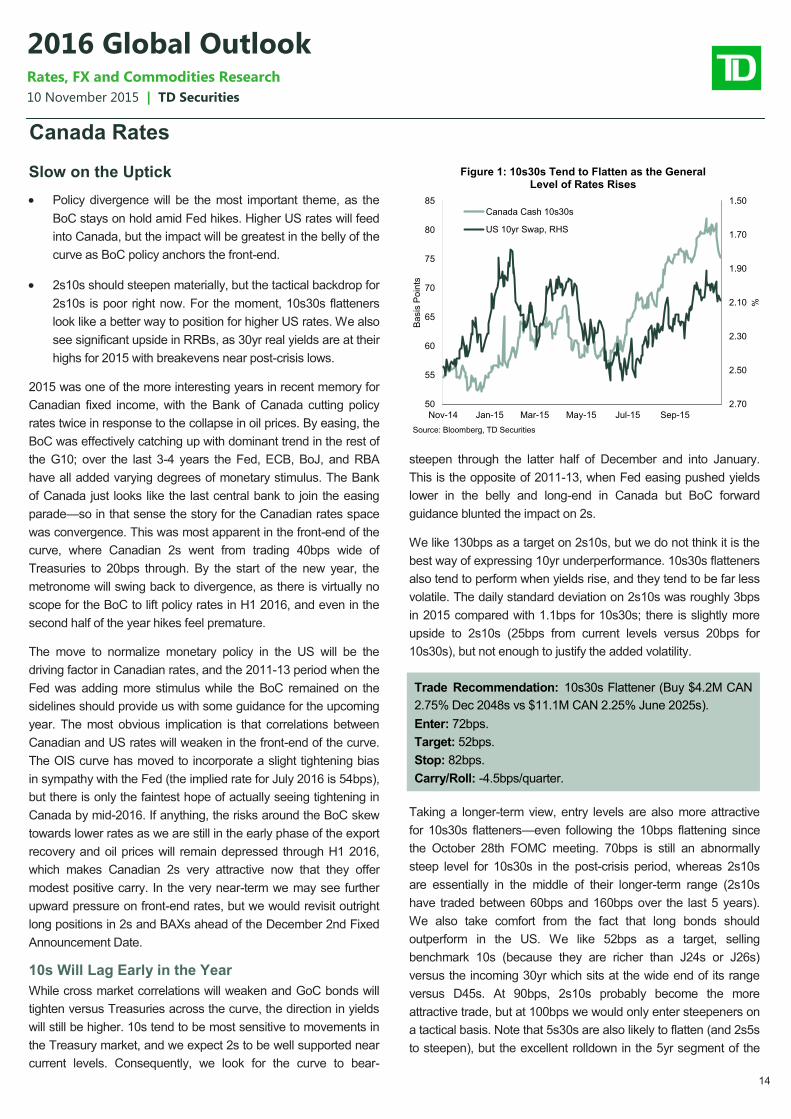
We like 130bps as a target on 2s10s, but we do not think it is the
best way of expressing 10yr underperformance. 10s30s flatteners
also tend to perform when yields rise, and they tend to be far less
volatile. The daily standard deviation on 2s10s was roughly 3bps
in 2015 compared with 1.1bps for 10s30s; there is slightly more
upside to 2s10s (25bps from current levels versus 20bps for
10s30s), but not enough to justify the added volatility.
Taking a longer-term view, entry levels are also more attractive
for 10s30s flatteners—even following the 10bps flattening since
the October 28th FOMC meeting. 70bps is still an abnormally
steep level for 10s30s in the post-crisis period, whereas 2s10s
are essentially in the middle of their longer-term range (2s10s
have traded between 60bps and 160bps over the last 5 years).
We also take comfort from the fact that long bonds should
outperform in the US. We like 52bps as a target, selling
benchmark 10s (because they are richer than J24s or J26s)
versus the incoming 30yr which sits at the wide end of its range
versus D45s. At 90bps, 2s10s probably become the more
attractive trade, but at 100bps we would only enter steepeners on
a tactical basis. Note that 5s30s are also likely to flatten (and 2s5s
to steepen), but the excellent rolldown in the 5yr segment of the
1.50
1.70
1.90
2.10
2.30
2.50
2.7050
55
60
65
70
75
80
85
Nov-14 Jan-15 Mar-15 May-15 Jul-15 Sep-15
%
Ba
sis
Po
ints
Source: Bloomberg, TD Securities
Figure 1: 10s30s Tend to Flatten as the General Level of Rates Rises
Canada Cash 10s30s
US 10yr Swap, RHS
Trade Recommendation: 10s30s Flattener (Buy $4.2M CAN
2.75% Dec 2048s vs $11.1M CAN 2.25% June 2025s).
Enter: 72bps.
Target: 52bps.
Stop: 82bps.
Carry/Roll: -4.5bps/quarter.
15
10 November 2015 | TD Securities
2016 Global Outlook Rates, FX and Commodities Research
curve and closer linkages between policy rates and 5s make the
10yr segment a much better candidate for shorts.
A possible change in issuance patterns next year is a wild card,
as 10s and 30s are the two parts of the curve where adding an
auction would be easiest given current patterns. Refinancing
needs for FY2016-17 should be roughly $215B ($129B in T-bills
and $86B in bonds), so a $10B deficit should imply a modest
increase in bond issuance—but it should be noted the
government could easily soak up the entire deficit using the T-bill
program as the T-bills stock was above $150B as recently as
FY2014-15. Canadian residents (including institutional investors)
hold roughly two-thirds of Government of Canada bonds, so the
market should be able to weather any change in flows from
foreign investors.
With Rising Rates, Swap Spreads Should Narrow
Other parts of the Canadian markets are also likely to see the
dominant trends form the financial repression era go into reverse
once the Fed begins to hike. We have already seen swap
spreads narrow materially this year, but higher bond yields should
drive further narrowing at the margin—especially if EM reserve
accumulation has in fact peaked. We are also biased to see
Provincial spreads narrow in a rising rate environment, though the
spreads seen during the great moderation/pre-crisis period are
unlikely to return any time soon.
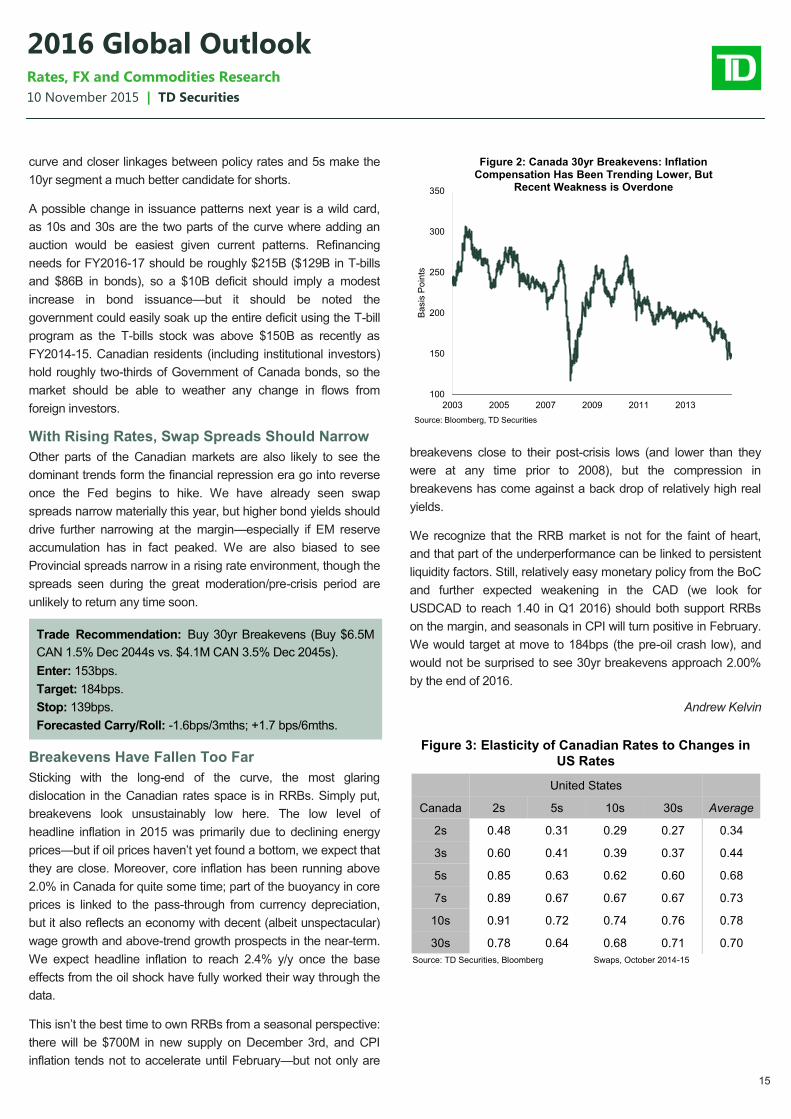
Breakevens Have Fallen Too Far
Sticking with the long-end of the curve, the most glaring
dislocation in the Canadian rates space is in RRBs. Simply put,
breakevens look unsustainably low here. The low level of
headline inflation in 2015 was primarily due to declining energy
prices—but if oil prices haven’t yet found a bottom, we expect that
they are close. Moreover, core inflation has been running above
2.0% in Canada for quite some time; part of the buoyancy in core
prices is linked to the pass-through from currency depreciation,
but it also reflects an economy with decent (albeit unspectacular)
wage growth and above-trend growth prospects in the near-term.
We expect headline inflation to reach 2.4% y/y once the base
effects from the oil shock have fully worked their way through the
data.
This isn’t the best time to own RRBs from a seasonal perspective:
there will be $700M in new supply on December 3rd, and CPI
inflation tends not to accelerate until February—but not only are
breakevens close to their post-crisis lows (and lower than they
were at any time prior to 2008), but the compression in
breakevens has come against a back drop of relatively high real
yields.
We recognize that the RRB market is not for the faint of heart,
and that part of the underperformance can be linked to persistent
liquidity factors. Still, relatively easy monetary policy from the BoC
and further expected weakening in the CAD (we look for
USDCAD to reach 1.40 in Q1 2016) should both support RRBs
on the margin, and seasonals in CPI will turn positive in February.
We would target at move to 184bps (the pre-oil crash low), and
would not be surprised to see 30yr breakevens approach 2.00%
by the end of 2016.
Andrew Kelvin
Trade Recommendation: Buy 30yr Breakevens (Buy $6.5M
CAN 1.5% Dec 2044s vs. $4.1M CAN 3.5% Dec 2045s).
Enter: 153bps.
Target: 184bps.
Stop: 139bps.
Forecasted Carry/Roll: -1.6bps/3mths; +1.7 bps/6mths.
100
150
200
250
300
350
2003 2005 2007 2009 2011 2013
Ba
sis
Po
ints
Source: Bloomberg, TD Securities
Figure 2: Canada 30yr Breakevens: Inflation Compensation Has Been Trending Lower, But
Recent Weakness is Overdone
Figure 3: Elasticity of Canadian Rates to Changes in
US Rates
United States
Canada 2s 5s 10s 30s Average
2s 0.48 0.31 0.29 0.27 0.34
3s 0.60 0.41 0.39 0.37 0.44
5s 0.85 0.63 0.62 0.60 0.68
7s 0.89 0.67 0.67 0.67 0.73
10s 0.91 0.72 0.74 0.76 0.78
30s 0.78 0.64 0.68 0.71 0.70
Source: TD Securities, Bloomberg Swaps, October 2014-15
16
10 November 2015 | TD Securities
2016 Global Outlook Rates, FX and Commodities Research
Australia/New Zealand Rates
We Can Cut, But We Don’t Really Want To
The RBA and RBNZ both have an easing bias but remain
reluctant cutters. Treasuries to drive ACGB and NZGB yields
higher in H1, but policy divergence could emerge in H2.
For Australia, we recommend investors position for non-AAA
rated semis to outperform ACGBs, while we expect NZGB
10s to outperform Treasuries.
TD forecasts the RBA to keep rates on hold at 2% for all of 2016.
However, as we have seen in the past few weeks, the market is
likely to test our resolve and price in cuts at some point, drawing
support from the RBA’s decision to adopt a contingent easing
bias. We see risks that the market trims RBA easing expectations
approaching the new year, thanks to the Fed wanting to
normalize rates and evidence that China Q3 stimulus (in the wake
of the equity meltdown) is finally beginning to bear fruit. We also
forecast a firm Australian Q3 GDP outcome that should reinforce
the RBA’s “glass half full” outlook. All in, we see the market
trimming RBA easing first before possibly entertaining RBA cuts
early next year. The bias is therefore is to keep duration short, for
the curve to steepen, and for swap spreads to narrow. Our most
recent views can be seen here.
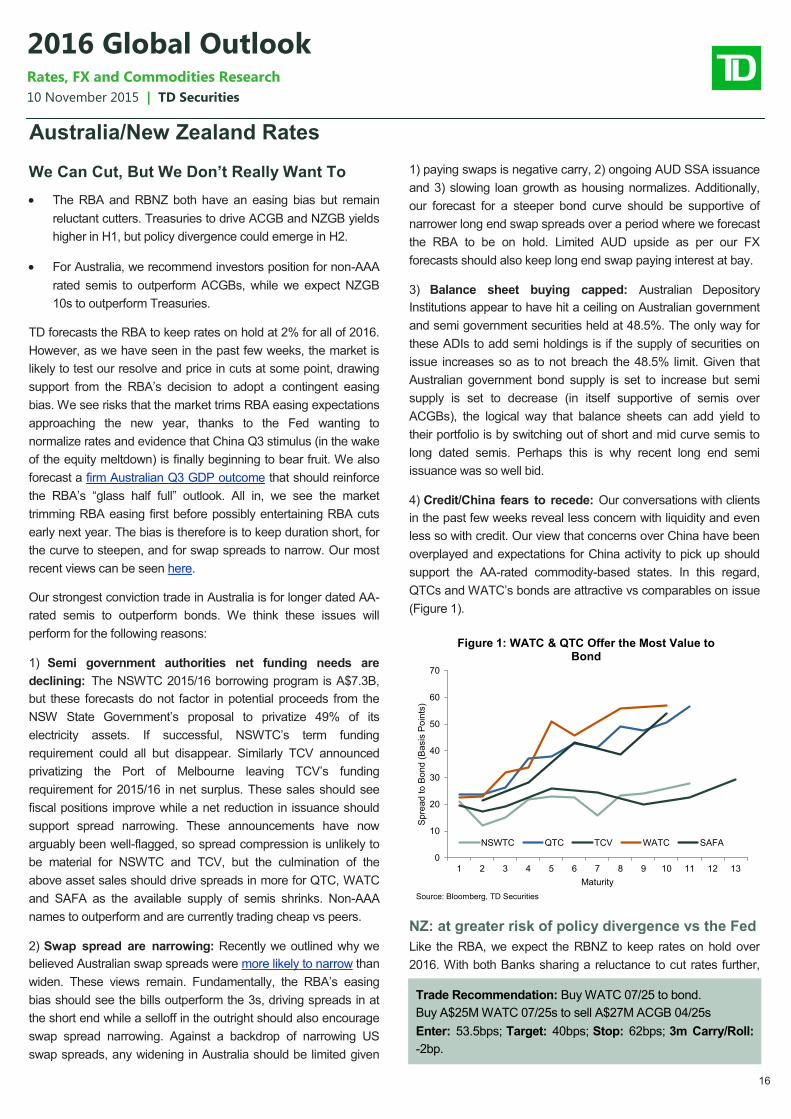
Our strongest conviction trade in Australia is for longer dated AA-
rated semis to outperform bonds. We think these issues will
perform for the following reasons:
1) Semi government authorities net funding needs are
declining: The NSWTC 2015/16 borrowing program is A$7.3B,
but these forecasts do not factor in potential proceeds from the
NSW State Government’s proposal to privatize 49% of its
electricity assets. If successful, NSWTC’s term funding
requirement could all but disappear. Similarly TCV announced
privatizing the Port of Melbourne leaving TCV’s funding
requirement for 2015/16 in net surplus. These sales should see
fiscal positions improve while a net reduction in issuance should
support spread narrowing. These announcements have now
arguably been well-flagged, so spread compression is unlikely to
be material for NSWTC and TCV, but the culmination of the
above asset sales should drive spreads in more for QTC, WATC
and SAFA as the available supply of semis shrinks. Non-AAA
names to outperform and are currently trading cheap vs peers.
2) Swap spread are narrowing: Recently we outlined why we
believed Australian swap spreads were more likely to narrow than
widen. These views remain. Fundamentally, the RBA’s easing
bias should see the bills outperform the 3s, driving spreads in at
the short end while a selloff in the outright should also encourage
swap spread narrowing. Against a backdrop of narrowing US
swap spreads, any widening in Australia should be limited given
1) paying swaps is negative carry, 2) ongoing AUD SSA issuance
and 3) slowing loan growth as housing normalizes. Additionally,
our forecast for a steeper bond curve should be supportive of
narrower long end swap spreads over a period where we forecast
the RBA to be on hold. Limited AUD upside as per our FX
forecasts should also keep long end swap paying interest at bay.
3) Balance sheet buying capped: Australian Depository
Institutions appear to have hit a ceiling on Australian government
and semi government securities held at 48.5%. The only way for
these ADIs to add semi holdings is if the supply of securities on
issue increases so as to not breach the 48.5% limit. Given that
Australian government bond supply is set to increase but semi
supply is set to decrease (in itself supportive of semis over
ACGBs), the logical way that balance sheets can add yield to
their portfolio is by switching out of short and mid curve semis to
long dated semis. Perhaps this is why recent long end semi
issuance was so well bid.
4) Credit/China fears to recede: Our conversations with clients
in the past few weeks reveal less concern with liquidity and even
less so with credit. Our view that concerns over China have been
overplayed and expectations for China activity to pick up should
support the AA-rated commodity-based states. In this regard,
QTCs and WATC’s bonds are attractive vs comparables on issue
(Figure 1).
NZ: at greater risk of policy divergence vs the Fed
Like the RBA, we expect the RBNZ to keep rates on hold over
2016. With both Banks sharing a reluctance to cut rates further,
Trade Recommendation: Buy WATC 07/25 to bond.
Buy A$25M WATC 07/25s to sell A$27M ACGB 04/25s
Enter: 53.5bps; Target: 40bps; Stop: 62bps; 3m Carry/Roll:
-2bp.
0
10
20
30
40
50
60
70
1 2 3 4 5 6 7 8 9 10 11 12 13
Sp
rea
d to
Bo
nd
(B
asis
Po
ints
)
Maturity
Figure 1: WATC & QTC Offer the Most Value to Bond
NSWTC QTC TCV WATC SAFA
Source: Bloomberg, TD Securities
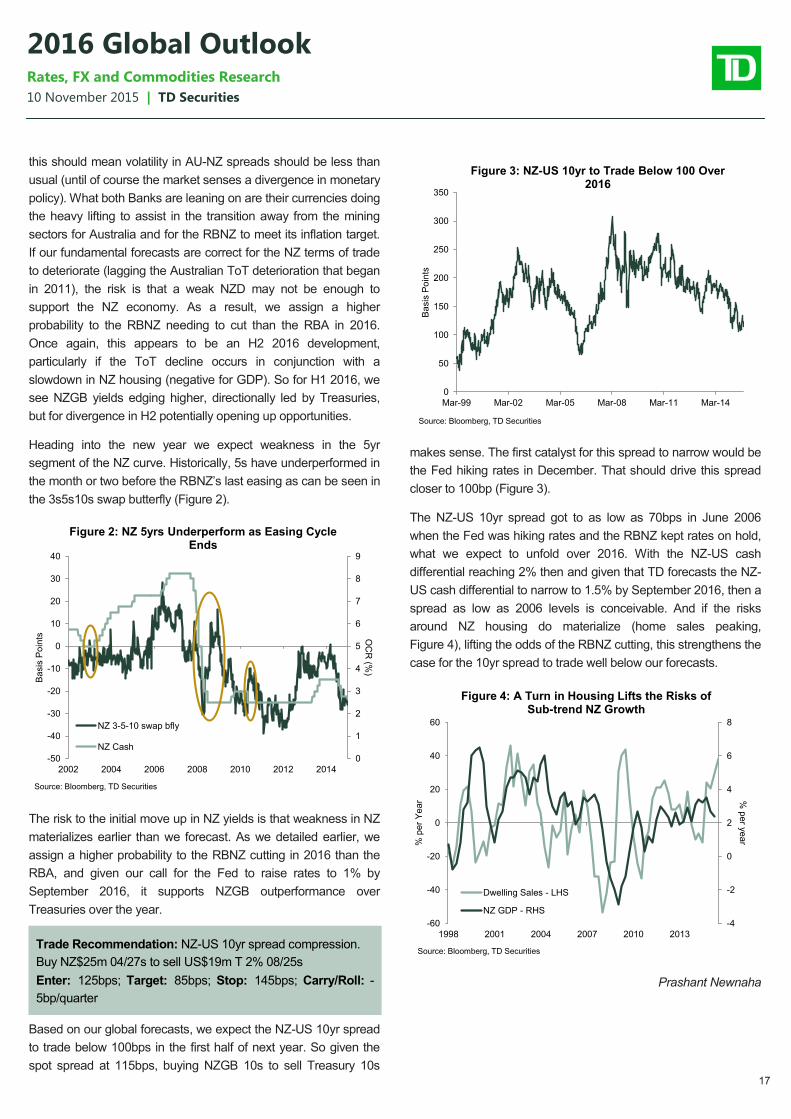
17
10 November 2015 | TD Securities
2016 Global Outlook Rates, FX and Commodities Research
this should mean volatility in AU-NZ spreads should be less than
usual (until of course the market senses a divergence in monetary
policy). What both Banks are leaning on are their currencies doing
the heavy lifting to assist in the transition away from the mining
sectors for Australia and for the RBNZ to meet its inflation target.
If our fundamental forecasts are correct for the NZ terms of trade
to deteriorate (lagging the Australian ToT deterioration that began
in 2011), the risk is that a weak NZD may not be enough to
support the NZ economy. As a result, we assign a higher
probability to the RBNZ needing to cut than the RBA in 2016.
Once again, this appears to be an H2 2016 development,
particularly if the ToT decline occurs in conjunction with a
slowdown in NZ housing (negative for GDP). So for H1 2016, we
see NZGB yields edging higher, directionally led by Treasuries,
but for divergence in H2 potentially opening up opportunities.
Heading into the new year we expect weakness in the 5yr
segment of the NZ curve. Historically, 5s have underperformed in
the month or two before the RBNZ’s last easing as can be seen in
the 3s5s10s swap butterfly (Figure 2).
The risk to the initial move up in NZ yields is that weakness in NZ
materializes earlier than we forecast. As we detailed earlier, we
assign a higher probability to the RBNZ cutting in 2016 than the
RBA, and given our call for the Fed to raise rates to 1% by
September 2016, it supports NZGB outperformance over
Treasuries over the year.
Based on our global forecasts, we expect the NZ-US 10yr spread
to trade below 100bps in the first half of next year. So given the
spot spread at 115bps, buying NZGB 10s to sell Treasury 10s
makes sense. The first catalyst for this spread to narrow would be
the Fed hiking rates in December. That should drive this spread
closer to 100bp (Figure 3).
The NZ-US 10yr spread got to as low as 70bps in June 2006
when the Fed was hiking rates and the RBNZ kept rates on hold,
what we expect to unfold over 2016. With the NZ-US cash
differential reaching 2% then and given that TD forecasts the NZ-
US cash differential to narrow to 1.5% by September 2016, then a
spread as low as 2006 levels is conceivable. And if the risks
around NZ housing do materialize (home sales peaking,
Figure 4), lifting the odds of the RBNZ cutting, this strengthens the
case for the 10yr spread to trade well below our forecasts.
Prashant Newnaha
Trade Recommendation: NZ-US 10yr spread compression.
Buy NZ$25m 04/27s to sell US$19m T 2% 08/25s
Enter: 125bps; Target: 85bps; Stop: 145bps; Carry/Roll: -
5bp/quarter
0
1
2
3
4
5
6
7
8
9
-50
-40
-30
-20
-10
0
10
20
30
40
2002 2004 2006 2008 2010 2012 2014
OC
R (%
)
Ba
sis
Po
ints
Figure 2: NZ 5yrs Underperform as Easing Cycle Ends
NZ 3-5-10 swap bfly
NZ Cash
Source: Bloomberg, TD Securities
0
50
100
150
200
250
300
350
Mar-99 Mar-02 Mar-05 Mar-08 Mar-11 Mar-14
Ba
sis
Po
ints
Figure 3: NZ-US 10yr to Trade Below 100 Over 2016
Source: Bloomberg, TD Securities
-4
-2
0
2
4
6
8
-60
-40
-20
0
20
40
60
1998 2001 2004 2007 2010 2013
% p
er y
ea
r% p
er
Ye
ar
Figure 4: A Turn in Housing Lifts the Risks of Sub-trend NZ Growth
Dwelling Sales - LHS
NZ GDP - RHS
Source: Bloomberg, TD Securities
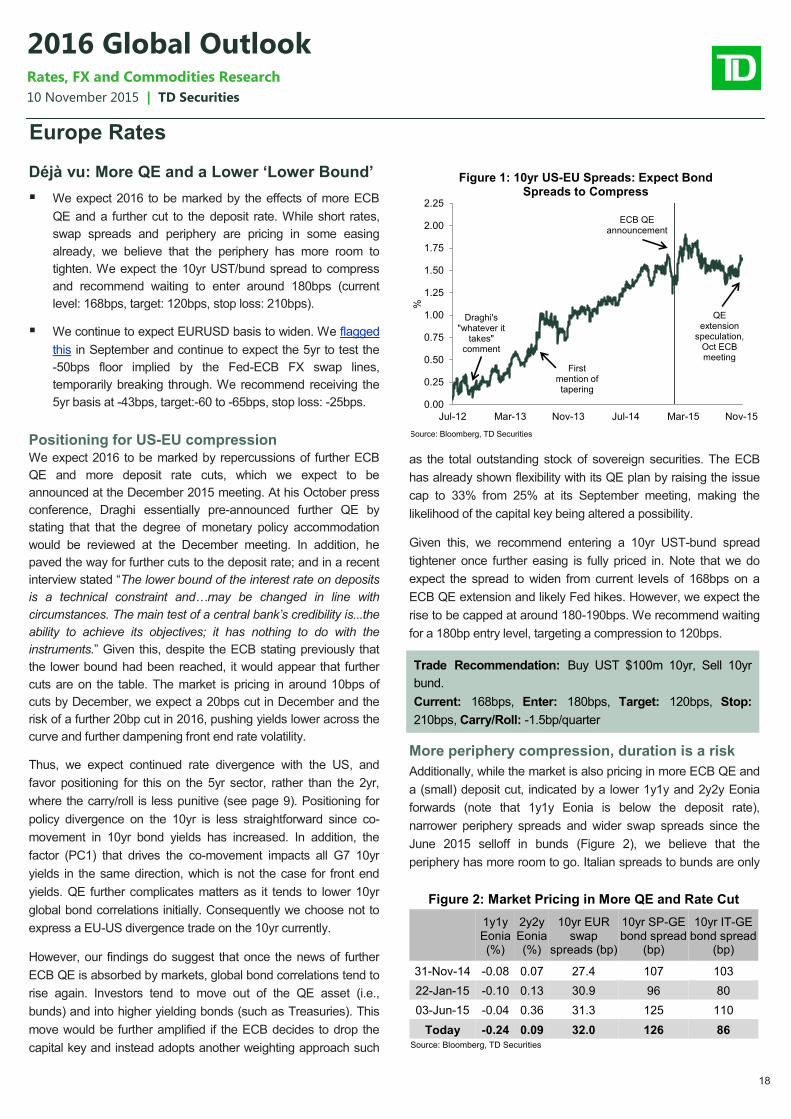
18
10 November 2015 | TD Securities
2016 Global Outlook Rates, FX and Commodities Research
Europe Rates
Déjà vu: More QE and a Lower ‘Lower Bound’
We expect 2016 to be marked by the effects of more ECB
QE and a further cut to the deposit rate. While short rates,
swap spreads and periphery are pricing in some easing
already, we believe that the periphery has more room to
tighten. We expect the 10yr UST/bund spread to compress
and recommend waiting to enter around 180bps (current
level: 168bps, target: 120bps, stop loss: 210bps).
We continue to expect EURUSD basis to widen. We flagged
this in September and continue to expect the 5yr to test the
-50bps floor implied by the Fed-ECB FX swap lines,
temporarily breaking through. We recommend receiving the
5yr basis at -43bps, target:-60 to -65bps, stop loss: -25bps.
Positioning for US-EU compression We expect 2016 to be marked by repercussions of further ECB
QE and more deposit rate cuts, which we expect to be
announced at the December 2015 meeting. At his October press
conference, Draghi essentially pre-announced further QE by
stating that that the degree of monetary policy accommodation
would be reviewed at the December meeting. In addition, he
paved the way for further cuts to the deposit rate; and in a recent
interview stated “The lower bound of the interest rate on deposits
is a technical constraint and…may be changed in line with
circumstances. The main test of a central bank’s credibility is...the
ability to achieve its objectives; it has nothing to do with the
instruments.” Given this, despite the ECB stating previously that
the lower bound had been reached, it would appear that further
cuts are on the table. The market is pricing in around 10bps of
cuts by December, we expect a 20bps cut in December and the
risk of a further 20bp cut in 2016, pushing yields lower across the
curve and further dampening front end rate volatility.
Thus, we expect continued rate divergence with the US, and
favor positioning for this on the 5yr sector, rather than the 2yr,
where the carry/roll is less punitive (see page 9). Positioning for
policy divergence on the 10yr is less straightforward since co-
movement in 10yr bond yields has increased. In addition, the
factor (PC1) that drives the co-movement impacts all G7 10yr
yields in the same direction, which is not the case for front end
yields. QE further complicates matters as it tends to lower 10yr
global bond correlations initially. Consequently we choose not to
express a EU-US divergence trade on the 10yr currently.
However, our findings do suggest that once the news of further
ECB QE is absorbed by markets, global bond correlations tend to
rise again. Investors tend to move out of the QE asset (i.e.,
bunds) and into higher yielding bonds (such as Treasuries). This
move would be further amplified if the ECB decides to drop the
capital key and instead adopts another weighting approach such
as the total outstanding stock of sovereign securities. The ECB
has already shown flexibility with its QE plan by raising the issue
cap to 33% from 25% at its September meeting, making the
likelihood of the capital key being altered a possibility.
Given this, we recommend entering a 10yr UST-bund spread
tightener once further easing is fully priced in. Note that we do
expect the spread to widen from current levels of 168bps on a
ECB QE extension and likely Fed hikes. However, we expect the
rise to be capped at around 180-190bps. We recommend waiting
for a 180bp entry level, targeting a compression to 120bps.
More periphery compression, duration is a risk
Additionally, while the market is also pricing in more ECB QE and
a (small) deposit cut, indicated by a lower 1y1y and 2y2y Eonia
forwards (note that 1y1y Eonia is below the deposit rate),
narrower periphery spreads and wider swap spreads since the
June 2015 selloff in bunds (Figure 2), we believe that the
periphery has more room to go. Italian spreads to bunds are only
0.00
0.25
0.50
0.75
1.00
1.25
1.50
1.75
2.00
2.25
Jul-12 Mar-13 Nov-13 Jul-14 Mar-15 Nov-15%
Figure 1: 10yr US-EU Spreads: Expect Bond Spreads to Compress
Source: Bloomberg, TD Securities
ECB QE announcement
Draghi's"whatever it
takes" comment
First mention of tapering
QE extension
speculation, Oct ECB meeting
Figure 2: Market Pricing in More QE and Rate Cut
1y1y Eonia (%)
2y2y Eonia (%)
10yr EUR swap
spreads (bp)
10yr SP-GE bond spread
(bp)
10yr IT-GE bond spread
(bp)
31-Nov-14 -0.08 0.07 27.4 107 103
22-Jan-15 -0.10 0.13 30.9 96 80
03-Jun-15 -0.04 0.36 31.3 125 110
Today -0.24 0.09 32.0 126 86 Source: Bloomberg, TD Securities
Trade Recommendation: Buy UST $100m 10yr, Sell 10yr
bund.
Current: 168bps, Enter: 180bps, Target: 120bps, Stop:
210bps, Carry/Roll: -1.5bp/quarter
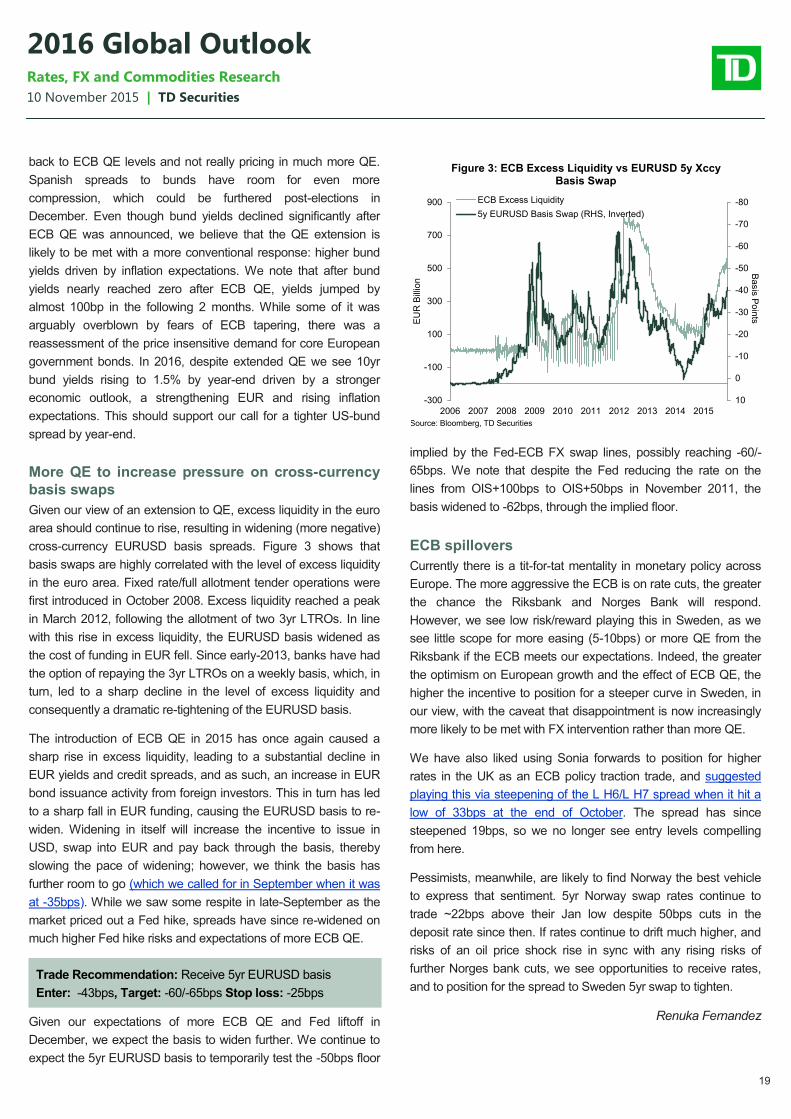
19
10 November 2015 | TD Securities
2016 Global Outlook Rates, FX and Commodities Research
back to ECB QE levels and not really pricing in much more QE.
Spanish spreads to bunds have room for even more
compression, which could be furthered post-elections in
December. Even though bund yields declined significantly after
ECB QE was announced, we believe that the QE extension is
likely to be met with a more conventional response: higher bund
yields driven by inflation expectations. We note that after bund
yields nearly reached zero after ECB QE, yields jumped by
almost 100bp in the following 2 months. While some of it was
arguably overblown by fears of ECB tapering, there was a
reassessment of the price insensitive demand for core European
government bonds. In 2016, despite extended QE we see 10yr
bund yields rising to 1.5% by year-end driven by a stronger
economic outlook, a strengthening EUR and rising inflation
expectations. This should support our call for a tighter US-bund
spread by year-end.
More QE to increase pressure on cross-currency
basis swaps
Given our view of an extension to QE, excess liquidity in the euro
area should continue to rise, resulting in widening (more negative)
cross-currency EURUSD basis spreads. Figure 3 shows that
basis swaps are highly correlated with the level of excess liquidity
in the euro area. Fixed rate/full allotment tender operations were
first introduced in October 2008. Excess liquidity reached a peak
in March 2012, following the allotment of two 3yr LTROs. In line
with this rise in excess liquidity, the EURUSD basis widened as
the cost of funding in EUR fell. Since early-2013, banks have had
the option of repaying the 3yr LTROs on a weekly basis, which, in
turn, led to a sharp decline in the level of excess liquidity and
consequently a dramatic re-tightening of the EURUSD basis.
The introduction of ECB QE in 2015 has once again caused a
sharp rise in excess liquidity, leading to a substantial decline in
EUR yields and credit spreads, and as such, an increase in EUR
bond issuance activity from foreign investors. This in turn has led
to a sharp fall in EUR funding, causing the EURUSD basis to re-
widen. Widening in itself will increase the incentive to issue in
USD, swap into EUR and pay back through the basis, thereby
slowing the pace of widening; however, we think the basis has
further room to go (which we called for in September when it was
at -35bps). While we saw some respite in late-September as the
market priced out a Fed hike, spreads have since re-widened on
much higher Fed hike risks and expectations of more ECB QE.
Given our expectations of more ECB QE and Fed liftoff in
December, we expect the basis to widen further. We continue to
expect the 5yr EURUSD basis to temporarily test the -50bps floor
implied by the Fed-ECB FX swap lines, possibly reaching -60/-
65bps. We note that despite the Fed reducing the rate on the
lines from OIS+100bps to OIS+50bps in November 2011, the
basis widened to -62bps, through the implied floor.
ECB spillovers
Currently there is a tit-for-tat mentality in monetary policy across
Europe. The more aggressive the ECB is on rate cuts, the greater
the chance the Riksbank and Norges Bank will respond.
However, we see low risk/reward playing this in Sweden, as we
see little scope for more easing (5-10bps) or more QE from the
Riksbank if the ECB meets our expectations. Indeed, the greater
the optimism on European growth and the effect of ECB QE, the
higher the incentive to position for a steeper curve in Sweden, in
our view, with the caveat that disappointment is now increasingly
more likely to be met with FX intervention rather than more QE.
We have also liked using Sonia forwards to position for higher
rates in the UK as an ECB policy traction trade, and suggested
playing this via steepening of the L H6/L H7 spread when it hit a
low of 33bps at the end of October. The spread has since
steepened 19bps, so we no longer see entry levels compelling
from here.
Pessimists, meanwhile, are likely to find Norway the best vehicle
to express that sentiment. 5yr Norway swap rates continue to
trade ~22bps above their Jan low despite 50bps cuts in the
deposit rate since then. If rates continue to drift much higher, and
risks of an oil price shock rise in sync with any rising risks of
further Norges bank cuts, we see opportunities to receive rates,
and to position for the spread to Sweden 5yr swap to tighten.
Renuka Fernandez
-80
-70
-60
-50
-40
-30
-20
-10
0
10-300
-100
100
300
500
700
900
2006 2007 2008 2009 2010 2011 2012 2013 2014 2015
Ba
sis
Po
ints
EU
R B
illio
n
Figure 3: ECB Excess Liquidity vs EURUSD 5y Xccy Basis Swap
ECB Excess Liquidity
5y EURUSD Basis Swap (RHS, Inverted)
Source: Bloomberg, TD Securities
Trade Recommendation: Receive 5yr EURUSD basis
Enter: -43bps, Target: -60/-65bps Stop loss: -25bps
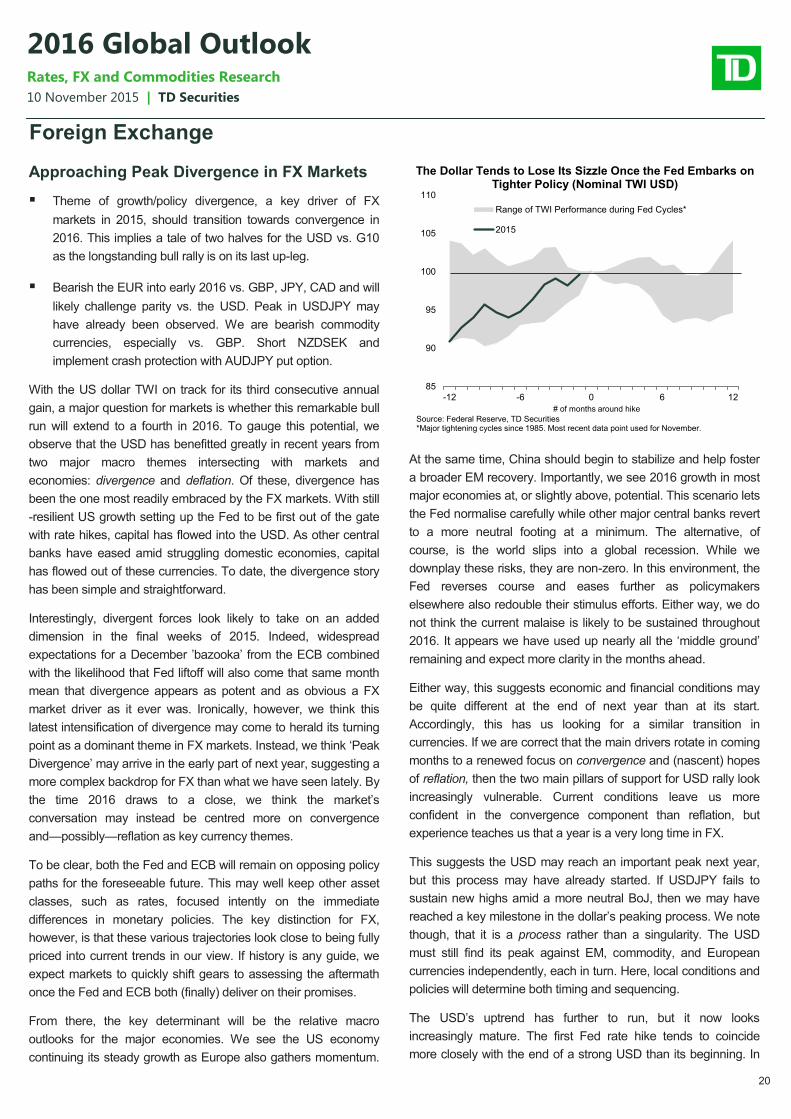
20
10 November 2015 | TD Securities
2016 Global Outlook Rates, FX and Commodities Research
Foreign Exchange
Approaching Peak Divergence in FX Markets
Theme of growth/policy divergence, a key driver of FX
markets in 2015, should transition towards convergence in
2016. This implies a tale of two halves for the USD vs. G10
as the longstanding bull rally is on its last up-leg.
Bearish the EUR into early 2016 vs. GBP, JPY, CAD and will
likely challenge parity vs. the USD. Peak in USDJPY may
have already been observed. We are bearish commodity
currencies, especially vs. GBP. Short NZDSEK and
implement crash protection with AUDJPY put option.
With the US dollar TWI on track for its third consecutive annual
gain, a major question for markets is whether this remarkable bull
run will extend to a fourth in 2016. To gauge this potential, we
observe that the USD has benefitted greatly in recent years from
two major macro themes intersecting with markets and
economies: divergence and deflation. Of these, divergence has
been the one most readily embraced by the FX markets. With still
-resilient US growth setting up the Fed to be first out of the gate
with rate hikes, capital has flowed into the USD. As other central
banks have eased amid struggling domestic economies, capital
has flowed out of these currencies. To date, the divergence story
has been simple and straightforward.
Interestingly, divergent forces look likely to take on an added
dimension in the final weeks of 2015. Indeed, widespread
expectations for a December ’bazooka’ from the ECB combined
with the likelihood that Fed liftoff will also come that same month
mean that divergence appears as potent and as obvious a FX
market driver as it ever was. Ironically, however, we think this
latest intensification of divergence may come to herald its turning
point as a dominant theme in FX markets. Instead, we think ‘Peak
Divergence’ may arrive in the early part of next year, suggesting a
more complex backdrop for FX than what we have seen lately. By
the time 2016 draws to a close, we think the market’s
conversation may instead be centred more on convergence
and—possibly—reflation as key currency themes.
To be clear, both the Fed and ECB will remain on opposing policy
paths for the foreseeable future. This may well keep other asset
classes, such as rates, focused intently on the immediate
differences in monetary policies. The key distinction for FX,
however, is that these various trajectories look close to being fully
priced into current trends in our view. If history is any guide, we
expect markets to quickly shift gears to assessing the aftermath
once the Fed and ECB both (finally) deliver on their promises.
From there, the key determinant will be the relative macro
outlooks for the major economies. We see the US economy
continuing its steady growth as Europe also gathers momentum.
At the same time, China should begin to stabilize and help foster
a broader EM recovery. Importantly, we see 2016 growth in most
major economies at, or slightly above, potential. This scenario lets
the Fed normalise carefully while other major central banks revert
to a more neutral footing at a minimum. The alternative, of
course, is the world slips into a global recession. While we
downplay these risks, they are non-zero. In this environment, the
Fed reverses course and eases further as policymakers
elsewhere also redouble their stimulus efforts. Either way, we do
not think the current malaise is likely to be sustained throughout
2016. It appears we have used up nearly all the ‘middle ground’
remaining and expect more clarity in the months ahead.
Either way, this suggests economic and financial conditions may
be quite different at the end of next year than at its start.
Accordingly, this has us looking for a similar transition in
currencies. If we are correct that the main drivers rotate in coming
months to a renewed focus on convergence and (nascent) hopes
of reflation, then the two main pillars of support for USD rally look
increasingly vulnerable. Current conditions leave us more
confident in the convergence component than reflation, but
experience teaches us that a year is a very long time in FX.
This suggests the USD may reach an important peak next year,
but this process may have already started. If USDJPY fails to
sustain new highs amid a more neutral BoJ, then we may have
reached a key milestone in the dollar’s peaking process. We note
though, that it is a process rather than a singularity. The USD
must still find its peak against EM, commodity, and European
currencies independently, each in turn. Here, local conditions and
policies will determine both timing and sequencing.
The USD’s uptrend has further to run, but it now looks
increasingly mature. The first Fed rate hike tends to coincide
more closely with the end of a strong USD than its beginning. In
85
90
95
100
105
110
-12 -6 0 6 12
Range of TWI Performance during Fed Cycles*
2015
The Dollar Tends to Lose Its Sizzle Once the Fed Embarks on Tighter Policy (Nominal TWI USD)
# of months around hike
Source: Federal Reserve, TD Securities*Major tightening cycles since 1985. Most recent data point used for November.
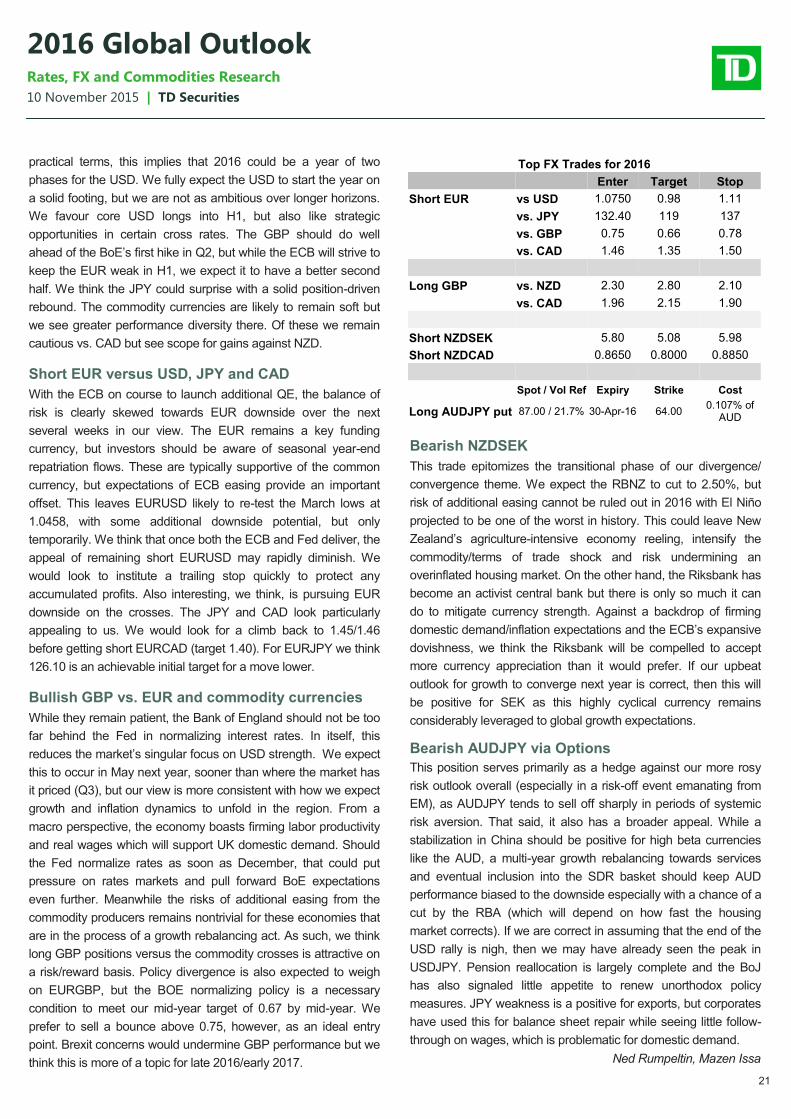
21
10 November 2015 | TD Securities
2016 Global Outlook Rates, FX and Commodities Research
practical terms, this implies that 2016 could be a year of two
phases for the USD. We fully expect the USD to start the year on
a solid footing, but we are not as ambitious over longer horizons.
We favour core USD longs into H1, but also like strategic
opportunities in certain cross rates. The GBP should do well
ahead of the BoE’s first hike in Q2, but while the ECB will strive to
keep the EUR weak in H1, we expect it to have a better second
half. We think the JPY could surprise with a solid position-driven
rebound. The commodity currencies are likely to remain soft but
we see greater performance diversity there. Of these we remain
cautious vs. CAD but see scope for gains against NZD.
Short EUR versus USD, JPY and CAD
With the ECB on course to launch additional QE, the balance of
risk is clearly skewed towards EUR downside over the next
several weeks in our view. The EUR remains a key funding
currency, but investors should be aware of seasonal year-end
repatriation flows. These are typically supportive of the common
currency, but expectations of ECB easing provide an important
offset. This leaves EURUSD likely to re-test the March lows at
1.0458, with some additional downside potential, but only
temporarily. We think that once both the ECB and Fed deliver, the
appeal of remaining short EURUSD may rapidly diminish. We
would look to institute a trailing stop quickly to protect any
accumulated profits. Also interesting, we think, is pursuing EUR
downside on the crosses. The JPY and CAD look particularly
appealing to us. We would look for a climb back to 1.45/1.46
before getting short EURCAD (target 1.40). For EURJPY we think
126.10 is an achievable initial target for a move lower.
Bullish GBP vs. EUR and commodity currencies
While they remain patient, the Bank of England should not be too
far behind the Fed in normalizing interest rates. In itself, this
reduces the market’s singular focus on USD strength. We expect
this to occur in May next year, sooner than where the market has
it priced (Q3), but our view is more consistent with how we expect
growth and inflation dynamics to unfold in the region. From a
macro perspective, the economy boasts firming labor productivity
and real wages which will support UK domestic demand. Should
the Fed normalize rates as soon as December, that could put
pressure on rates markets and pull forward BoE expectations
even further. Meanwhile the risks of additional easing from the
commodity producers remains nontrivial for these economies that
are in the process of a growth rebalancing act. As such, we think
long GBP positions versus the commodity crosses is attractive on
a risk/reward basis. Policy divergence is also expected to weigh
on EURGBP, but the BOE normalizing policy is a necessary
condition to meet our mid-year target of 0.67 by mid-year. We
prefer to sell a bounce above 0.75, however, as an ideal entry
point. Brexit concerns would undermine GBP performance but we
think this is more of a topic for late 2016/early 2017.
Bearish NZDSEK
This trade epitomizes the transitional phase of our divergence/
convergence theme. We expect the RBNZ to cut to 2.50%, but
risk of additional easing cannot be ruled out in 2016 with El Niño
projected to be one of the worst in history. This could leave New
Zealand’s agriculture-intensive economy reeling, intensify the
commodity/terms of trade shock and risk undermining an
overinflated housing market. On the other hand, the Riksbank has
become an activist central bank but there is only so much it can
do to mitigate currency strength. Against a backdrop of firming
domestic demand/inflation expectations and the ECB’s expansive
dovishness, we think the Riksbank will be compelled to accept
more currency appreciation than it would prefer. If our upbeat
outlook for growth to converge next year is correct, then this will
be positive for SEK as this highly cyclical currency remains
considerably leveraged to global growth expectations.
Bearish AUDJPY via Options
This position serves primarily as a hedge against our more rosy
risk outlook overall (especially in a risk-off event emanating from
EM), as AUDJPY tends to sell off sharply in periods of systemic
risk aversion. That said, it also has a broader appeal. While a
stabilization in China should be positive for high beta currencies
like the AUD, a multi-year growth rebalancing towards services
and eventual inclusion into the SDR basket should keep AUD
performance biased to the downside especially with a chance of a
cut by the RBA (which will depend on how fast the housing
market corrects). If we are correct in assuming that the end of the
USD rally is nigh, then we may have already seen the peak in
USDJPY. Pension reallocation is largely complete and the BoJ
has also signaled little appetite to renew unorthodox policy
measures. JPY weakness is a positive for exports, but corporates
have used this for balance sheet repair while seeing little follow-
through on wages, which is problematic for domestic demand.
Ned Rumpeltin, Mazen Issa
Top FX Trades for 2016
Enter Target Stop
Short EUR vs USD 1.0750 0.98 1.11
vs. JPY 132.40 119 137
vs. GBP 0.75 0.66 0.78
vs. CAD 1.46 1.35 1.50
Long GBP vs. NZD 2.30 2.80 2.10
vs. CAD 1.96 2.15 1.90
Short NZDSEK 5.80 5.08 5.98
Short NZDCAD 0.8650 0.8000 0.8850
Spot / Vol Ref Expiry Strike Cost
Long AUDJPY put 87.00 / 21.7% 30-Apr-16 64.00 0.107% of
AUD
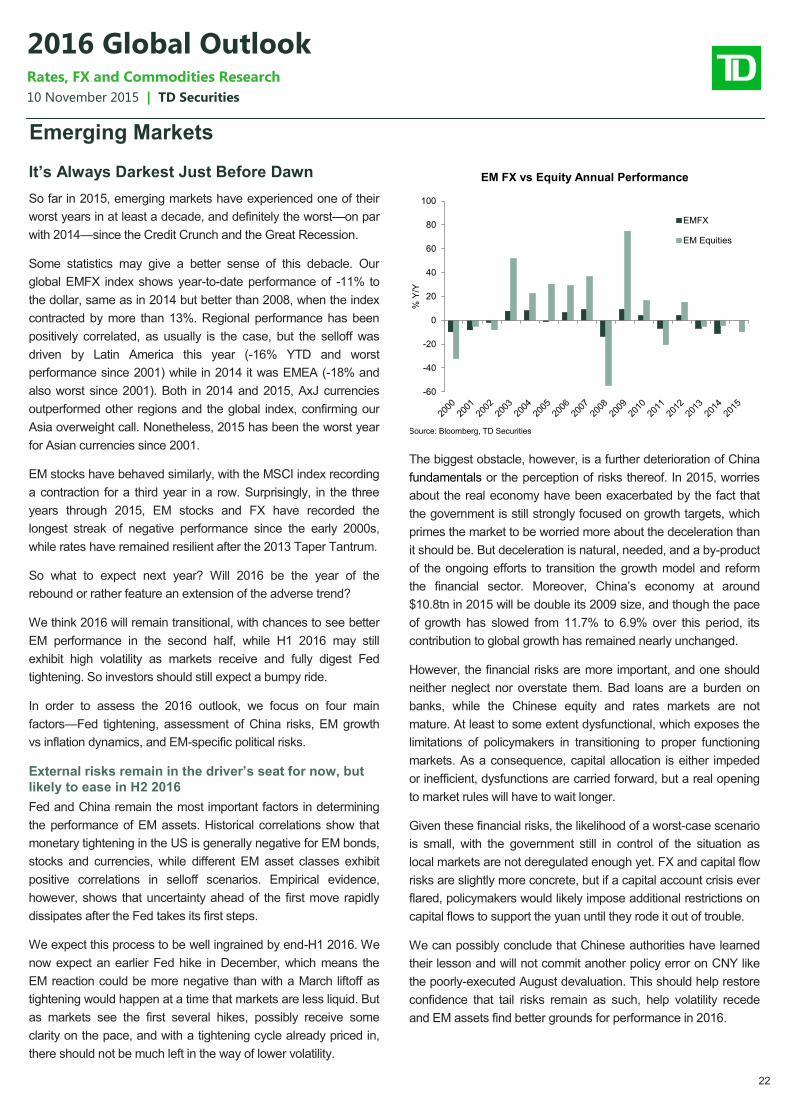
22
10 November 2015 | TD Securities
2016 Global Outlook Rates, FX and Commodities Research
Emerging Markets
It’s Always Darkest Just Before Dawn
So far in 2015, emerging markets have experienced one of their
worst years in at least a decade, and definitely the worst—on par
with 2014—since the Credit Crunch and the Great Recession.
Some statistics may give a better sense of this debacle. Our
global EMFX index shows year-to-date performance of -11% to
the dollar, same as in 2014 but better than 2008, when the index
contracted by more than 13%. Regional performance has been
positively correlated, as usually is the case, but the selloff was
driven by Latin America this year (-16% YTD and worst
performance since 2001) while in 2014 it was EMEA (-18% and
also worst since 2001). Both in 2014 and 2015, AxJ currencies
outperformed other regions and the global index, confirming our
Asia overweight call. Nonetheless, 2015 has been the worst year
for Asian currencies since 2001.
EM stocks have behaved similarly, with the MSCI index recording
a contraction for a third year in a row. Surprisingly, in the three
years through 2015, EM stocks and FX have recorded the
longest streak of negative performance since the early 2000s,
while rates have remained resilient after the 2013 Taper Tantrum.
So what to expect next year? Will 2016 be the year of the
rebound or rather feature an extension of the adverse trend?
We think 2016 will remain transitional, with chances to see better
EM performance in the second half, while H1 2016 may still
exhibit high volatility as markets receive and fully digest Fed
tightening. So investors should still expect a bumpy ride.
In order to assess the 2016 outlook, we focus on four main
factors—Fed tightening, assessment of China risks, EM growth
vs inflation dynamics, and EM-specific political risks.
External risks remain in the driver’s seat for now, but
likely to ease in H2 2016
Fed and China remain the most important factors in determining
the performance of EM assets. Historical correlations show that
monetary tightening in the US is generally negative for EM bonds,
stocks and currencies, while different EM asset classes exhibit
positive correlations in selloff scenarios. Empirical evidence,
however, shows that uncertainty ahead of the first move rapidly
dissipates after the Fed takes its first steps.
We expect this process to be well ingrained by end-H1 2016. We
now expect an earlier Fed hike in December, which means the
EM reaction could be more negative than with a March liftoff as
tightening would happen at a time that markets are less liquid. But
as markets see the first several hikes, possibly receive some
clarity on the pace, and with a tightening cycle already priced in,
there should not be much left in the way of lower volatility.
The biggest obstacle, however, is a further deterioration of China
fundamentals or the perception of risks thereof. In 2015, worries
about the real economy have been exacerbated by the fact that
the government is still strongly focused on growth targets, which
primes the market to be worried more about the deceleration than
it should be. But deceleration is natural, needed, and a by-product
of the ongoing efforts to transition the growth model and reform
the financial sector. Moreover, China’s economy at around
$10.8tn in 2015 will be double its 2009 size, and though the pace
of growth has slowed from 11.7% to 6.9% over this period, its
contribution to global growth has remained nearly unchanged.
However, the financial risks are more important, and one should
neither neglect nor overstate them. Bad loans are a burden on
banks, while the Chinese equity and rates markets are not
mature. At least to some extent dysfunctional, which exposes the
limitations of policymakers in transitioning to proper functioning
markets. As a consequence, capital allocation is either impeded
or inefficient, dysfunctions are carried forward, but a real opening
to market rules will have to wait longer.
Given these financial risks, the likelihood of a worst-case scenario
is small, with the government still in control of the situation as
local markets are not deregulated enough yet. FX and capital flow
risks are slightly more concrete, but if a capital account crisis ever
flared, policymakers would likely impose additional restrictions on
capital flows to support the yuan until they rode it out of trouble.
We can possibly conclude that Chinese authorities have learned
their lesson and will not commit another policy error on CNY like
the poorly-executed August devaluation. This should help restore
confidence that tail risks remain as such, help volatility recede
and EM assets find better grounds for performance in 2016.
-60
-40
-20
0
20
40
60
80
100
% Y
/Y
EM FX vs Equity Annual Performance
EMFX
EM Equities
Source: Bloomberg, TD Securities
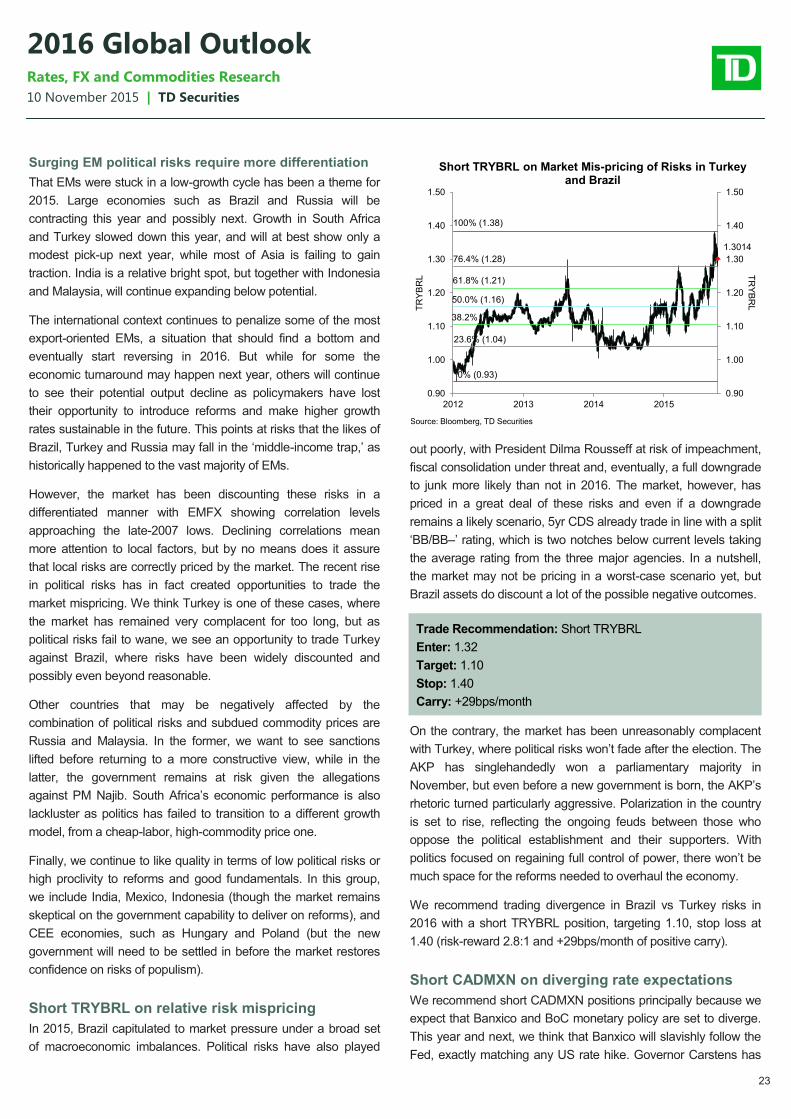
23
10 November 2015 | TD Securities
2016 Global Outlook Rates, FX and Commodities Research
Surging EM political risks require more differentiation
That EMs were stuck in a low-growth cycle has been a theme for
2015. Large economies such as Brazil and Russia will be
contracting this year and possibly next. Growth in South Africa
and Turkey slowed down this year, and will at best show only a
modest pick-up next year, while most of Asia is failing to gain
traction. India is a relative bright spot, but together with Indonesia
and Malaysia, will continue expanding below potential.
The international context continues to penalize some of the most
export-oriented EMs, a situation that should find a bottom and
eventually start reversing in 2016. But while for some the
economic turnaround may happen next year, others will continue
to see their potential output decline as policymakers have lost
their opportunity to introduce reforms and make higher growth
rates sustainable in the future. This points at risks that the likes of
Brazil, Turkey and Russia may fall in the ‘middle-income trap,’ as
historically happened to the vast majority of EMs.
However, the market has been discounting these risks in a
differentiated manner with EMFX showing correlation levels
approaching the late-2007 lows. Declining correlations mean
more attention to local factors, but by no means does it assure
that local risks are correctly priced by the market. The recent rise
in political risks has in fact created opportunities to trade the
market mispricing. We think Turkey is one of these cases, where
the market has remained very complacent for too long, but as
political risks fail to wane, we see an opportunity to trade Turkey
against Brazil, where risks have been widely discounted and
possibly even beyond reasonable.
Other countries that may be negatively affected by the
combination of political risks and subdued commodity prices are
Russia and Malaysia. In the former, we want to see sanctions
lifted before returning to a more constructive view, while in the
latter, the government remains at risk given the allegations
against PM Najib. South Africa’s economic performance is also
lackluster as politics has failed to transition to a different growth
model, from a cheap-labor, high-commodity price one.
Finally, we continue to like quality in terms of low political risks or
high proclivity to reforms and good fundamentals. In this group,
we include India, Mexico, Indonesia (though the market remains
skeptical on the government capability to deliver on reforms), and
CEE economies, such as Hungary and Poland (but the new
government will need to be settled in before the market restores
confidence on risks of populism).
Short TRYBRL on relative risk mispricing
In 2015, Brazil capitulated to market pressure under a broad set
of macroeconomic imbalances. Political risks have also played
out poorly, with President Dilma Rousseff at risk of impeachment,
fiscal consolidation under threat and, eventually, a full downgrade
to junk more likely than not in 2016. The market, however, has
priced in a great deal of these risks and even if a downgrade
remains a likely scenario, 5yr CDS already trade in line with a split
‘BB/BB–’ rating, which is two notches below current levels taking
the average rating from the three major agencies. In a nutshell,
the market may not be pricing in a worst-case scenario yet, but
Brazil assets do discount a lot of the possible negative outcomes.
On the contrary, the market has been unreasonably complacent
with Turkey, where political risks won’t fade after the election. The
AKP has singlehandedly won a parliamentary majority in
November, but even before a new government is born, the AKP’s
rhetoric turned particularly aggressive. Polarization in the country
is set to rise, reflecting the ongoing feuds between those who
oppose the political establishment and their supporters. With
politics focused on regaining full control of power, there won’t be
much space for the reforms needed to overhaul the economy.
We recommend trading divergence in Brazil vs Turkey risks in
2016 with a short TRYBRL position, targeting 1.10, stop loss at
1.40 (risk-reward 2.8:1 and +29bps/month of positive carry).
Short CADMXN on diverging rate expectations
We recommend short CADMXN positions principally because we
expect that Banxico and BoC monetary policy are set to diverge.
This year and next, we think that Banxico will slavishly follow the
Fed, exactly matching any US rate hike. Governor Carstens has
Trade Recommendation: Short TRYBRL
Enter: 1.32
Target: 1.10
Stop: 1.40
Carry: +29bps/month
0% (0.93)
23.6% (1.04)
38.2% (1.11)
50.0% (1.16)
61.8% (1.21)
76.4% (1.28)
100% (1.38)
1.3014
0.90
1.00
1.10
1.20
1.30
1.40
1.50
0.90
1.00
1.10
1.20
1.30
1.40
1.50
2012 2013 2014 2015
TR
YB
RL
TR
YB
RL
Source: Bloomberg, TD Securities
Short TRYBRL on Market Mis-pricing of Risks in Turkey and Brazil
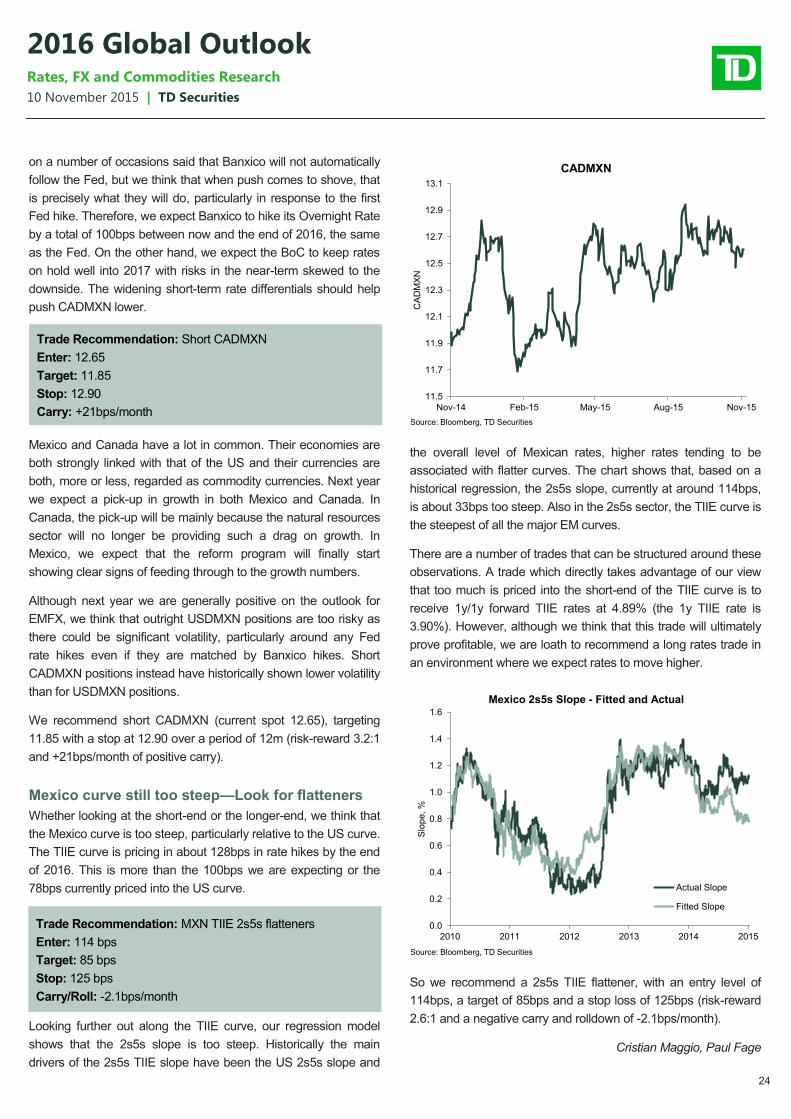
24
10 November 2015 | TD Securities
2016 Global Outlook Rates, FX and Commodities Research
on a number of occasions said that Banxico will not automatically
follow the Fed, but we think that when push comes to shove, that
is precisely what they will do, particularly in response to the first
Fed hike. Therefore, we expect Banxico to hike its Overnight Rate
by a total of 100bps between now and the end of 2016, the same
as the Fed. On the other hand, we expect the BoC to keep rates
on hold well into 2017 with risks in the near-term skewed to the
downside. The widening short-term rate differentials should help
push CADMXN lower.
Mexico and Canada have a lot in common. Their economies are
both strongly linked with that of the US and their currencies are
both, more or less, regarded as commodity currencies. Next year
we expect a pick-up in growth in both Mexico and Canada. In
Canada, the pick-up will be mainly because the natural resources
sector will no longer be providing such a drag on growth. In
Mexico, we expect that the reform program will finally start
showing clear signs of feeding through to the growth numbers.
Although next year we are generally positive on the outlook for
EMFX, we think that outright USDMXN positions are too risky as
there could be significant volatility, particularly around any Fed
rate hikes even if they are matched by Banxico hikes. Short
CADMXN positions instead have historically shown lower volatility
than for USDMXN positions.
We recommend short CADMXN (current spot 12.65), targeting
11.85 with a stop at 12.90 over a period of 12m (risk-reward 3.2:1
and +21bps/month of positive carry).
Mexico curve still too steep—Look for flatteners
Whether looking at the short-end or the longer-end, we think that
the Mexico curve is too steep, particularly relative to the US curve.
The TIIE curve is pricing in about 128bps in rate hikes by the end
of 2016. This is more than the 100bps we are expecting or the
78bps currently priced into the US curve.
Looking further out along the TIIE curve, our regression model
shows that the 2s5s slope is too steep. Historically the main
drivers of the 2s5s TIIE slope have been the US 2s5s slope and
the overall level of Mexican rates, higher rates tending to be
associated with flatter curves. The chart shows that, based on a
historical regression, the 2s5s slope, currently at around 114bps,
is about 33bps too steep. Also in the 2s5s sector, the TIIE curve is
the steepest of all the major EM curves.
There are a number of trades that can be structured around these
observations. A trade which directly takes advantage of our view
that too much is priced into the short-end of the TIIE curve is to
receive 1y/1y forward TIIE rates at 4.89% (the 1y TIIE rate is
3.90%). However, although we think that this trade will ultimately
prove profitable, we are loath to recommend a long rates trade in
an environment where we expect rates to move higher.
So we recommend a 2s5s TIIE flattener, with an entry level of
114bps, a target of 85bps and a stop loss of 125bps (risk-reward
2.6:1 and a negative carry and rolldown of -2.1bps/month).
Cristian Maggio, Paul Fage
Trade Recommendation: MXN TIIE 2s5s flatteners
Enter: 114 bps
Target: 85 bps
Stop: 125 bps
Carry/Roll: -2.1bps/month
Trade Recommendation: Short CADMXN
Enter: 12.65
Target: 11.85
Stop: 12.90
Carry: +21bps/month
11.5
11.7
11.9
12.1
12.3
12.5
12.7
12.9
13.1
Nov-14 Feb-15 May-15 Aug-15 Nov-15C
AD
MX
N
CADMXN
Source: Bloomberg, TD Securities
0.0
0.2
0.4
0.6
0.8
1.0
1.2
1.4
1.6
2010 2011 2012 2013 2014 2015
Slo
pe
, %
Mexico 2s5s Slope - Fitted and Actual
Actual Slope
Fitted Slope
Source: Bloomberg, TD Securities
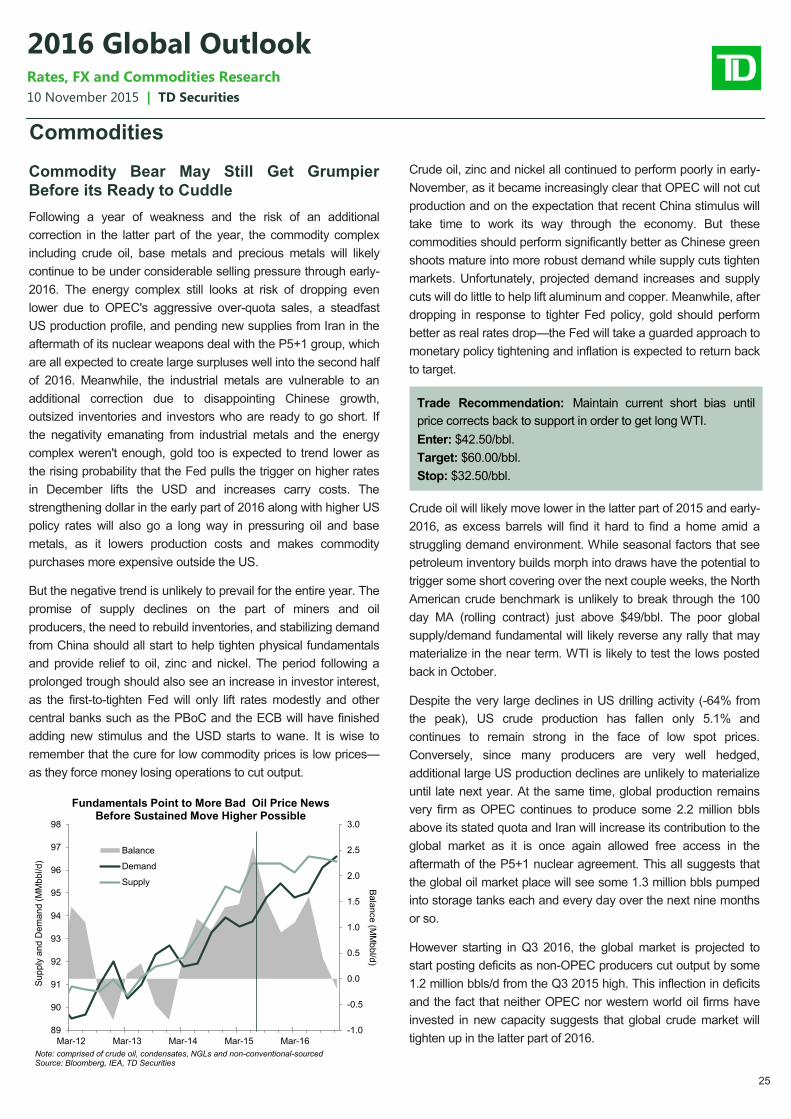
25
10 November 2015 | TD Securities
2016 Global Outlook Rates, FX and Commodities Research
Commodities
Commodity Bear May Still Get Grumpier
Before its Ready to Cuddle
Following a year of weakness and the risk of an additional
correction in the latter part of the year, the commodity complex
including crude oil, base metals and precious metals will likely
continue to be under considerable selling pressure through early-
2016. The energy complex still looks at risk of dropping even
lower due to OPEC's aggressive over-quota sales, a steadfast
US production profile, and pending new supplies from Iran in the
aftermath of its nuclear weapons deal with the P5+1 group, which
are all expected to create large surpluses well into the second half
of 2016. Meanwhile, the industrial metals are vulnerable to an
additional correction due to disappointing Chinese growth,
outsized inventories and investors who are ready to go short. If
the negativity emanating from industrial metals and the energy
complex weren't enough, gold too is expected to trend lower as
the rising probability that the Fed pulls the trigger on higher rates
in December lifts the USD and increases carry costs. The
strengthening dollar in the early part of 2016 along with higher US
policy rates will also go a long way in pressuring oil and base
metals, as it lowers production costs and makes commodity
purchases more expensive outside the US.
But the negative trend is unlikely to prevail for the entire year. The
promise of supply declines on the part of miners and oil
producers, the need to rebuild inventories, and stabilizing demand
from China should all start to help tighten physical fundamentals
and provide relief to oil, zinc and nickel. The period following a
prolonged trough should also see an increase in investor interest,
as the first-to-tighten Fed will only lift rates modestly and other
central banks such as the PBoC and the ECB will have finished
adding new stimulus and the USD starts to wane. It is wise to
remember that the cure for low commodity prices is low prices—
as they force money losing operations to cut output.
Crude oil, zinc and nickel all continued to perform poorly in early-
November, as it became increasingly clear that OPEC will not cut
production and on the expectation that recent China stimulus will
take time to work its way through the economy. But these
commodities should perform significantly better as Chinese green
shoots mature into more robust demand while supply cuts tighten
markets. Unfortunately, projected demand increases and supply
cuts will do little to help lift aluminum and copper. Meanwhile, after
dropping in response to tighter Fed policy, gold should perform
better as real rates drop—the Fed will take a guarded approach to
monetary policy tightening and inflation is expected to return back
to target.
Crude oil will likely move lower in the latter part of 2015 and early-
2016, as excess barrels will find it hard to find a home amid a
struggling demand environment. While seasonal factors that see
petroleum inventory builds morph into draws have the potential to
trigger some short covering over the next couple weeks, the North
American crude benchmark is unlikely to break through the 100
day MA (rolling contract) just above $49/bbl. The poor global
supply/demand fundamental will likely reverse any rally that may
materialize in the near term. WTI is likely to test the lows posted
back in October.
Despite the very large declines in US drilling activity (-64% from
the peak), US crude production has fallen only 5.1% and
continues to remain strong in the face of low spot prices.
Conversely, since many producers are very well hedged,
additional large US production declines are unlikely to materialize
until late next year. At the same time, global production remains
very firm as OPEC continues to produce some 2.2 million bbls
above its stated quota and Iran will increase its contribution to the
global market as it is once again allowed free access in the
aftermath of the P5+1 nuclear agreement. This all suggests that
the global oil market place will see some 1.3 million bbls pumped
into storage tanks each and every day over the next nine months
or so.
However starting in Q3 2016, the global market is projected to
start posting deficits as non-OPEC producers cut output by some
1.2 million bbls/d from the Q3 2015 high. This inflection in deficits
and the fact that neither OPEC nor western world oil firms have
invested in new capacity suggests that global crude market will
tighten up in the latter part of 2016.
Trade Recommendation: Maintain current short bias until
price corrects back to support in order to get long WTI.
Enter: $42.50/bbl.
Target: $60.00/bbl.
Stop: $32.50/bbl.
-1.0
-0.5
0.0
0.5
1.0
1.5
2.0
2.5
3.0
89
90
91
92
93
94
95
96
97
98
Mar-12 Mar-13 Mar-14 Mar-15 Mar-16
Ba
lan
ce
(MM
bb
l/d)
Su
pp
ly a
nd
Dem
an
d (
MM
bb
l/d
)
Fundamentals Point to More Bad Oil Price News Before Sustained Move Higher Possible
Balance
Demand
Supply
Note: comprised of crude oil, condensates, NGLs and non-conventional-sourcedSource: Bloomberg, IEA, TD Securities
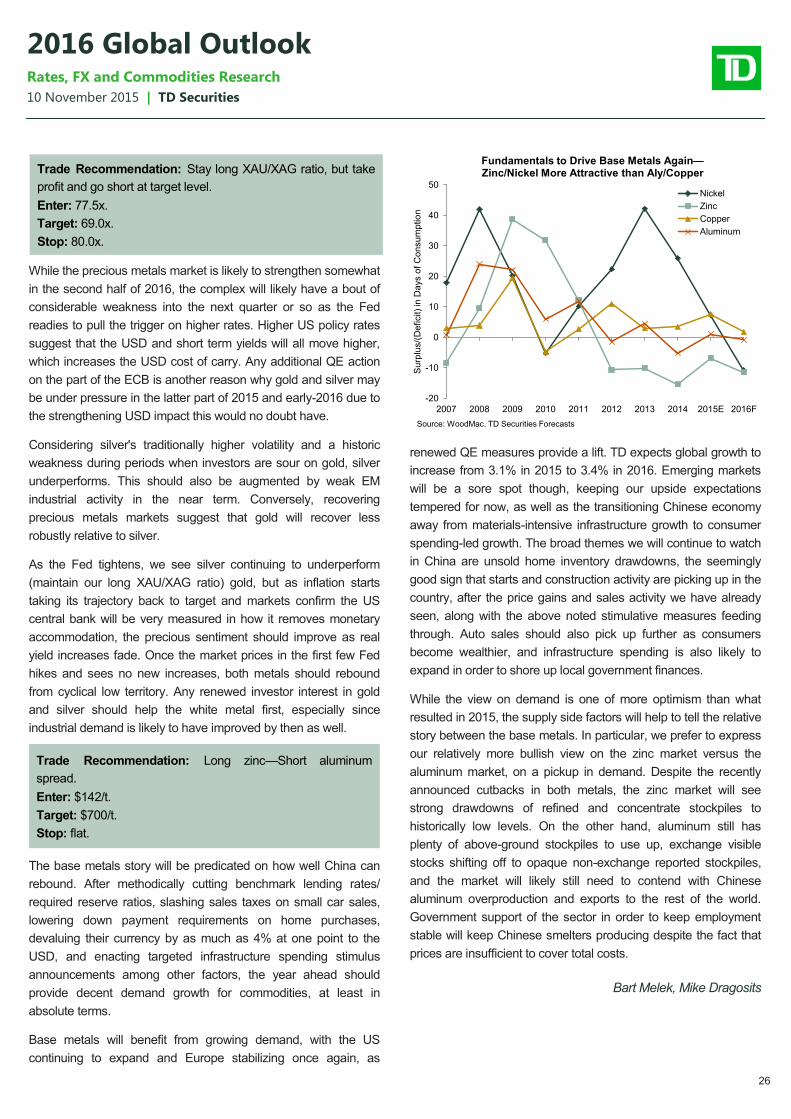
26
10 November 2015 | TD Securities
2016 Global Outlook Rates, FX and Commodities Research
While the precious metals market is likely to strengthen somewhat
in the second half of 2016, the complex will likely have a bout of
considerable weakness into the next quarter or so as the Fed
readies to pull the trigger on higher rates. Higher US policy rates
suggest that the USD and short term yields will all move higher,
which increases the USD cost of carry. Any additional QE action
on the part of the ECB is another reason why gold and silver may
be under pressure in the latter part of 2015 and early-2016 due to
the strengthening USD impact this would no doubt have.
Considering silver's traditionally higher volatility and a historic
weakness during periods when investors are sour on gold, silver
underperforms. This should also be augmented by weak EM
industrial activity in the near term. Conversely, recovering
precious metals markets suggest that gold will recover less
robustly relative to silver.
As the Fed tightens, we see silver continuing to underperform
(maintain our long XAU/XAG ratio) gold, but as inflation starts
taking its trajectory back to target and markets confirm the US
central bank will be very measured in how it removes monetary
accommodation, the precious sentiment should improve as real
yield increases fade. Once the market prices in the first few Fed
hikes and sees no new increases, both metals should rebound
from cyclical low territory. Any renewed investor interest in gold
and silver should help the white metal first, especially since
industrial demand is likely to have improved by then as well.
The base metals story will be predicated on how well China can
rebound. After methodically cutting benchmark lending rates/
required reserve ratios, slashing sales taxes on small car sales,
lowering down payment requirements on home purchases,
devaluing their currency by as much as 4% at one point to the
USD, and enacting targeted infrastructure spending stimulus
announcements among other factors, the year ahead should
provide decent demand growth for commodities, at least in
absolute terms.
Base metals will benefit from growing demand, with the US
continuing to expand and Europe stabilizing once again, as
renewed QE measures provide a lift. TD expects global growth to
increase from 3.1% in 2015 to 3.4% in 2016. Emerging markets
will be a sore spot though, keeping our upside expectations
tempered for now, as well as the transitioning Chinese economy
away from materials-intensive infrastructure growth to consumer
spending-led growth. The broad themes we will continue to watch
in China are unsold home inventory drawdowns, the seemingly
good sign that starts and construction activity are picking up in the
country, after the price gains and sales activity we have already
seen, along with the above noted stimulative measures feeding
through. Auto sales should also pick up further as consumers
become wealthier, and infrastructure spending is also likely to
expand in order to shore up local government finances.
While the view on demand is one of more optimism than what
resulted in 2015, the supply side factors will help to tell the relative
story between the base metals. In particular, we prefer to express
our relatively more bullish view on the zinc market versus the
aluminum market, on a pickup in demand. Despite the recently
announced cutbacks in both metals, the zinc market will see
strong drawdowns of refined and concentrate stockpiles to
historically low levels. On the other hand, aluminum still has
plenty of above-ground stockpiles to use up, exchange visible
stocks shifting off to opaque non-exchange reported stockpiles,
and the market will likely still need to contend with Chinese
aluminum overproduction and exports to the rest of the world.
Government support of the sector in order to keep employment
stable will keep Chinese smelters producing despite the fact that
prices are insufficient to cover total costs.
Bart Melek, Mike Dragosits
Trade Recommendation: Long zinc—Short aluminum
spread.
Enter: $142/t.
Target: $700/t.
Stop: flat.
Trade Recommendation: Stay long XAU/XAG ratio, but take
profit and go short at target level.
Enter: 77.5x.
Target: 69.0x.
Stop: 80.0x.
-20
-10
0
10
20
30
40
50
2007 2008 2009 2010 2011 2012 2013 2014 2015E 2016FS
urp
lus/(
De
ficit)
in D
ays o
f C
on
su
mp
tio
n
Fundamentals to Drive Base Metals Again—Zinc/Nickel More Attractive than Aly/Copper
Nickel
Zinc
Copper
Aluminum
Source: WoodMac, TD Securities Forecasts
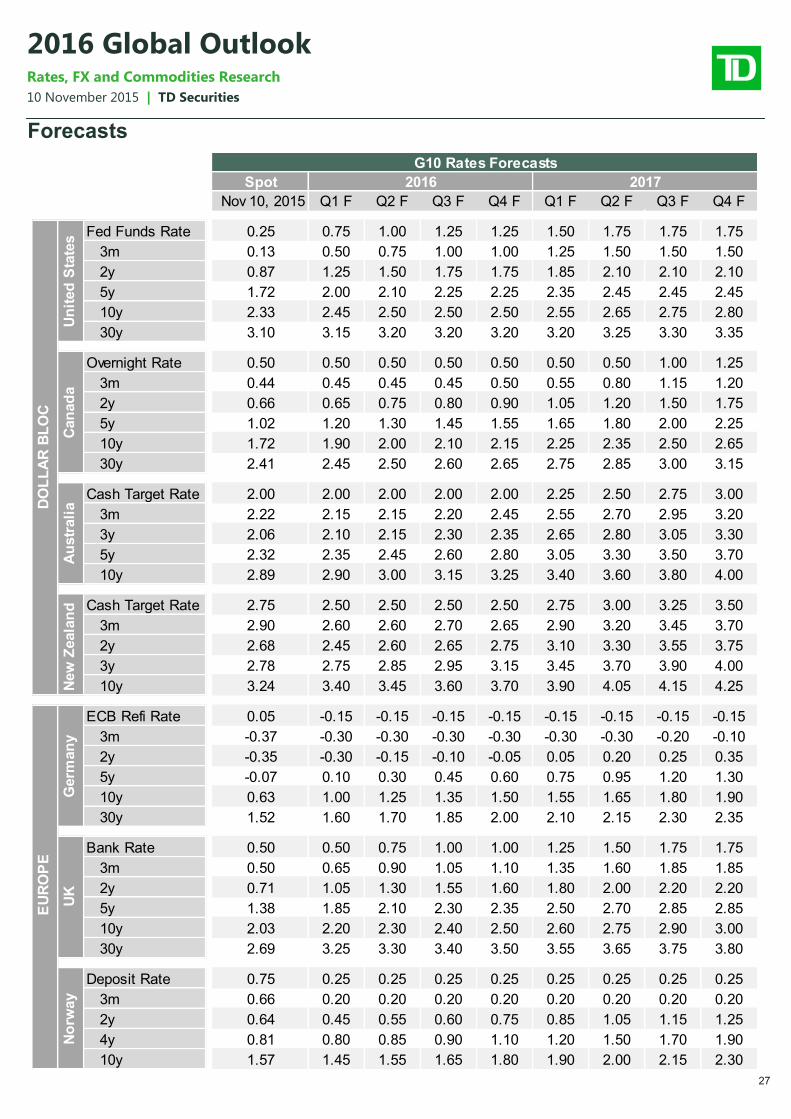
27
10 November 2015 | TD Securities
2016 Global Outlook Rates, FX and Commodities Research
Forecasts
Spot
Nov 10, 2015 Q1 F Q2 F Q3 F Q4 F Q1 F Q2 F Q3 F Q4 F
Fed Funds Rate 0.25 0.75 1.00 1.25 1.25 1.50 1.75 1.75 1.75
3m 0.13 0.50 0.75 1.00 1.00 1.25 1.50 1.50 1.50
2y 0.87 1.25 1.50 1.75 1.75 1.85 2.10 2.10 2.10
5y 1.72 2.00 2.10 2.25 2.25 2.35 2.45 2.45 2.45
10y 2.33 2.45 2.50 2.50 2.50 2.55 2.65 2.75 2.80
30y 3.10 3.15 3.20 3.20 3.20 3.20 3.25 3.30 3.35
Overnight Rate 0.50 0.50 0.50 0.50 0.50 0.50 0.50 1.00 1.25
3m 0.44 0.45 0.45 0.45 0.50 0.55 0.80 1.15 1.20
2y 0.66 0.65 0.75 0.80 0.90 1.05 1.20 1.50 1.75
5y 1.02 1.20 1.30 1.45 1.55 1.65 1.80 2.00 2.25
10y 1.72 1.90 2.00 2.10 2.15 2.25 2.35 2.50 2.65
30y 2.41 2.45 2.50 2.60 2.65 2.75 2.85 3.00 3.15
Cash Target Rate 2.00 2.00 2.00 2.00 2.00 2.25 2.50 2.75 3.00
3m 2.22 2.15 2.15 2.20 2.45 2.55 2.70 2.95 3.20
3y 2.06 2.10 2.15 2.30 2.35 2.65 2.80 3.05 3.30
5y 2.32 2.35 2.45 2.60 2.80 3.05 3.30 3.50 3.70
10y 2.89 2.90 3.00 3.15 3.25 3.40 3.60 3.80 4.00
Cash Target Rate 2.75 2.50 2.50 2.50 2.50 2.75 3.00 3.25 3.50
3m 2.90 2.60 2.60 2.70 2.65 2.90 3.20 3.45 3.70
2y 2.68 2.45 2.60 2.65 2.75 3.10 3.30 3.55 3.75
3y 2.78 2.75 2.85 2.95 3.15 3.45 3.70 3.90 4.00
10y 3.24 3.40 3.45 3.60 3.70 3.90 4.05 4.15 4.25
ECB Refi Rate 0.05 -0.15 -0.15 -0.15 -0.15 -0.15 -0.15 -0.15 -0.15
3m -0.37 -0.30 -0.30 -0.30 -0.30 -0.30 -0.30 -0.20 -0.10
2y -0.35 -0.30 -0.15 -0.10 -0.05 0.05 0.20 0.25 0.35
5y -0.07 0.10 0.30 0.45 0.60 0.75 0.95 1.20 1.30
10y 0.63 1.00 1.25 1.35 1.50 1.55 1.65 1.80 1.90
30y 1.52 1.60 1.70 1.85 2.00 2.10 2.15 2.30 2.35
Bank Rate 0.50 0.50 0.75 1.00 1.00 1.25 1.50 1.75 1.75
3m 0.50 0.65 0.90 1.05 1.10 1.35 1.60 1.85 1.85
2y 0.71 1.05 1.30 1.55 1.60 1.80 2.00 2.20 2.20
5y 1.38 1.85 2.10 2.30 2.35 2.50 2.70 2.85 2.85
10y 2.03 2.20 2.30 2.40 2.50 2.60 2.75 2.90 3.00
30y 2.69 3.25 3.30 3.40 3.50 3.55 3.65 3.75 3.80
Deposit Rate 0.75 0.25 0.25 0.25 0.25 0.25 0.25 0.25 0.25
3m 0.66 0.20 0.20 0.20 0.20 0.20 0.20 0.20 0.20
2y 0.64 0.45 0.55 0.60 0.75 0.85 1.05 1.15 1.25
4y 0.81 0.80 0.85 0.90 1.10 1.20 1.50 1.70 1.90
10y 1.57 1.45 1.55 1.65 1.80 1.90 2.00 2.15 2.30
EU
RO
PE
Germ
an
yU
KN
orw
ay
G10 Rates Forecasts
2016 2017
DO
LL
AR
BL
OC
Un
ited
Sta
tes
Can
ad
aA
ustr
ali
aN
ew
Zeala
nd
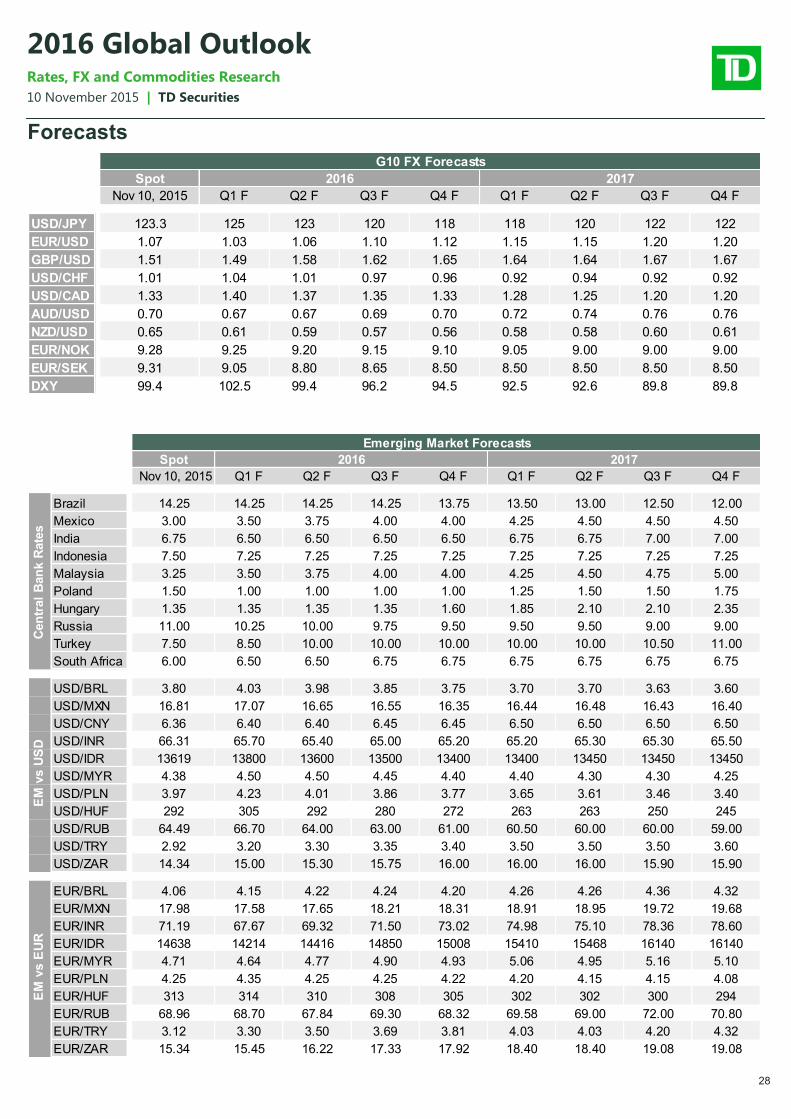
28
10 November 2015 | TD Securities
2016 Global Outlook Rates, FX and Commodities Research
Forecasts
Spot
Nov 10, 2015 Q1 F Q2 F Q3 F Q4 F Q1 F Q2 F Q3 F Q4 F
USD/JPY 123.3 125 123 120 118 118 120 122 122
EUR/USD 1.07 1.03 1.06 1.10 1.12 1.15 1.15 1.20 1.20
GBP/USD 1.51 1.49 1.58 1.62 1.65 1.64 1.64 1.67 1.67
USD/CHF 1.01 1.04 1.01 0.97 0.96 0.92 0.94 0.92 0.92
USD/CAD 1.33 1.40 1.37 1.35 1.33 1.28 1.25 1.20 1.20
AUD/USD 0.70 0.67 0.67 0.69 0.70 0.72 0.74 0.76 0.76
NZD/USD 0.65 0.61 0.59 0.57 0.56 0.58 0.58 0.60 0.61
EUR/NOK 9.28 9.25 9.20 9.15 9.10 9.05 9.00 9.00 9.00
EUR/SEK 9.31 9.05 8.80 8.65 8.50 8.50 8.50 8.50 8.50
DXY 99.4 102.5 99.4 96.2 94.5 92.5 92.6 89.8 89.8
G10 FX Forecasts
2016 2017
Spot
Nov 10, 2015 Q1 F Q2 F Q3 F Q4 F Q1 F Q2 F Q3 F Q4 F
Brazil 14.25 14.25 14.25 14.25 13.75 13.50 13.00 12.50 12.00
Mexico 3.00 3.50 3.75 4.00 4.00 4.25 4.50 4.50 4.50
India 6.75 6.50 6.50 6.50 6.50 6.75 6.75 7.00 7.00
Indonesia 7.50 7.25 7.25 7.25 7.25 7.25 7.25 7.25 7.25
Malaysia 3.25 3.50 3.75 4.00 4.00 4.25 4.50 4.75 5.00
Poland 1.50 1.00 1.00 1.00 1.00 1.25 1.50 1.50 1.75
Hungary 1.35 1.35 1.35 1.35 1.60 1.85 2.10 2.10 2.35
Russia 11.00 10.25 10.00 9.75 9.50 9.50 9.50 9.00 9.00
Turkey 7.50 8.50 10.00 10.00 10.00 10.00 10.00 10.50 11.00
South Africa 6.00 6.50 6.50 6.75 6.75 6.75 6.75 6.75 6.75
USD/BRL 3.80 4.03 3.98 3.85 3.75 3.70 3.70 3.63 3.60
USD/MXN 16.81 17.07 16.65 16.55 16.35 16.44 16.48 16.43 16.40
USD/CNY 6.36 6.40 6.40 6.45 6.45 6.50 6.50 6.50 6.50
USD/INR 66.31 65.70 65.40 65.00 65.20 65.20 65.30 65.30 65.50
USD/IDR 13619 13800 13600 13500 13400 13400 13450 13450 13450
USD/MYR 4.38 4.50 4.50 4.45 4.40 4.40 4.30 4.30 4.25
USD/PLN 3.97 4.23 4.01 3.86 3.77 3.65 3.61 3.46 3.40
USD/HUF 292 305 292 280 272 263 263 250 245
USD/RUB 64.49 66.70 64.00 63.00 61.00 60.50 60.00 60.00 59.00
USD/TRY 2.92 3.20 3.30 3.35 3.40 3.50 3.50 3.50 3.60
USD/ZAR 14.34 15.00 15.30 15.75 16.00 16.00 16.00 15.90 15.90
EUR/BRL 4.06 4.15 4.22 4.24 4.20 4.26 4.26 4.36 4.32
EUR/MXN 17.98 17.58 17.65 18.21 18.31 18.91 18.95 19.72 19.68
EUR/INR 71.19 67.67 69.32 71.50 73.02 74.98 75.10 78.36 78.60
EUR/IDR 14638 14214 14416 14850 15008 15410 15468 16140 16140
EUR/MYR 4.71 4.64 4.77 4.90 4.93 5.06 4.95 5.16 5.10
EUR/PLN 4.25 4.35 4.25 4.25 4.22 4.20 4.15 4.15 4.08
EUR/HUF 313 314 310 308 305 302 302 300 294
EUR/RUB 68.96 68.70 67.84 69.30 68.32 69.58 69.00 72.00 70.80
EUR/TRY 3.12 3.30 3.50 3.69 3.81 4.03 4.03 4.20 4.32
EUR/ZAR 15.34 15.45 16.22 17.33 17.92 18.40 18.40 19.08 19.08
EM
vs U
SD
EM
vs E
UR
Emerging Market Forecasts
2016 2017
Cen
tral
Ban
k R
ate
s
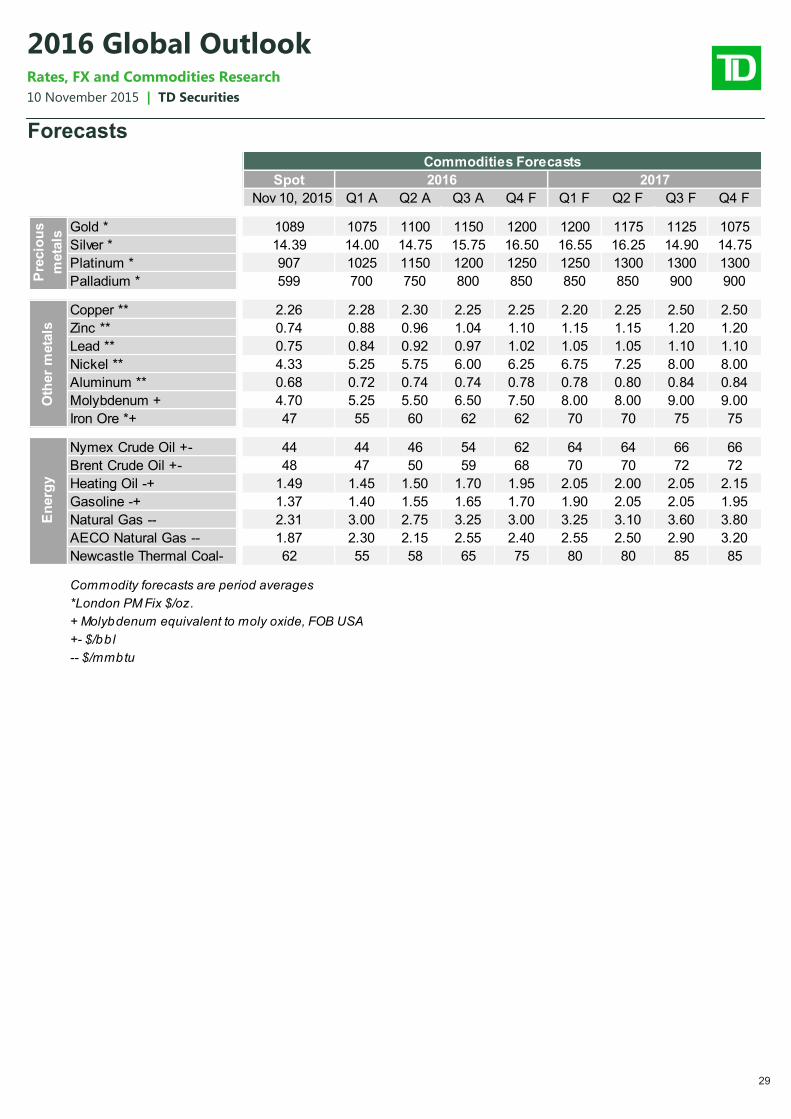
29
10 November 2015 | TD Securities
2016 Global Outlook Rates, FX and Commodities Research
Forecasts
Spot
Nov 10, 2015 Q1 A Q2 A Q3 A Q4 F Q1 F Q2 F Q3 F Q4 F
Gold * 1089 1075 1100 1150 1200 1200 1175 1125 1075
Silver * 14.39 14.00 14.75 15.75 16.50 16.55 16.25 14.90 14.75
Platinum * 907 1025 1150 1200 1250 1250 1300 1300 1300
Palladium * 599 700 750 800 850 850 850 900 900
Copper ** 2.26 2.28 2.30 2.25 2.25 2.20 2.25 2.50 2.50
Zinc ** 0.74 0.88 0.96 1.04 1.10 1.15 1.15 1.20 1.20
Lead ** 0.75 0.84 0.92 0.97 1.02 1.05 1.05 1.10 1.10
Nickel ** 4.33 5.25 5.75 6.00 6.25 6.75 7.25 8.00 8.00
Aluminum ** 0.68 0.72 0.74 0.74 0.78 0.78 0.80 0.84 0.84
Molybdenum + 4.70 5.25 5.50 6.50 7.50 8.00 8.00 9.00 9.00
Iron Ore *+ 47 55 60 62 62 70 70 75 75
Nymex Crude Oil +- 44 44 46 54 62 64 64 66 66
Brent Crude Oil +- 48 47 50 59 68 70 70 72 72
Heating Oil -+ 1.49 1.45 1.50 1.70 1.95 2.05 2.00 2.05 2.15
Gasoline -+ 1.37 1.40 1.55 1.65 1.70 1.90 2.05 2.05 1.95
Natural Gas -- 2.31 3.00 2.75 3.25 3.00 3.25 3.10 3.60 3.80
AECO Natural Gas -- 1.87 2.30 2.15 2.55 2.40 2.55 2.50 2.90 3.20
Newcastle Thermal Coal- 62 55 58 65 75 80 80 85 85
Commodity forecasts are period averages
*London PM Fix $/oz.
+ Molybdenum equivalent to moly oxide, FOB USA
+- $/bbl
-- $/mmbtu
Oth
er
meta
lsE
nerg
y
Commodities Forecasts
2016 2017
Pre
cio
us
meta
ls
30
10 November 2015 | TD Securities
2016 Global Outlook Rates, FX and Commodities Research
Global Strategy
United States
Canada
Europe
United Kingdom
Australia
New Zealand
Emerging Markets
Foreign Exchange
Commodities
Global Strategy Team
Global Strategy
Richard Kelly Head of Global Strategy 44 20 7786 8448
Global Macro Strategy
David Tulk Head of Global Macro Strategy 1 416 983 0445
Millan Mulraine Deputy Chief US Macro Strategist 1 212 827 7186
Annette Beacher Chief Asia-Pacific Macro Strategist 65 6500 8047
Jacqui Douglas Chief European Macro Strategist (On leave) 44 20 7786 8439
James Rossiter Senior Global Strategist 44 20 7786 8422
Global Rates Strategy
Priya Misra Head of Global Rates Strategy 1 212 827 7156
Gennadiy Goldberg Rates Strategist 1 212 827 7180
Cheng Chen Rates Strategist 1 212 827 7183
Andrew Kelvin Senior Rates Strategist 1 416 983 7184
Prashant Newnaha Rates Strategist 65 6500 8047
Renuka Fernandez Senior Quantitative Strategist (Contract) 44 20 7786 8408
FX Strategy
Ned Rumpeltin Head of European FX Strategy 44 20 7786 8420
Mazen Issa Senior FX Strategist 1 212 827 7182
Emerging Markets Strategy
Cristian Maggio Head of Emerging Markets Strategy 44 20 7786 8436
Paul Fage Senior Emerging Markets Strategist 44 20 7786 8424
Sacha Tihanyi Senior Emerging Markets Strategist
Commodities Strategy
Bart Melek Head of Commodity Strategy 1 416 983 9288
Mike Dragosits Senior Commodity Strategist 1 416 983 8075
Research Home Page: https://www.tdsresearch.com/currency-rates
Bloomberg Page: TDGR<GO>
Global Disclaimer: http://goo.gl/Jsf4vd
31
10 November 2015 | TD Securities
2016 Global Outlook Rates, FX and Commodities Research
Global Disclaimer This material is for general informational purposes only and is not investment advice nor does it constitute an offer, recommendation or solicitation to buy or sell a particular financial instrument. It does not have regard to the specific investment objectives, financial situation, risk profile or the particular needs of any specific person who may receive this material. No representation is made that the information contained herein is accurate in all material respects, complete or up to date, nor that it has been independently verified by TD Securities. Recipients of this analysis or report are to contact the representative in their local jurisdiction with regards to any matters or questions arising from, or in connection with, the analysis or report. Historic information regarding performance is not indicative of future results and investors should understand that statements regarding future prospects may not be realized. All investments entail risk, including potential loss of principal invested. Performance analysis is based on certain assumptions, the results of which may vary significantly depending on the modelling inputs assumed. This material, including all opinions, estimates and other information, constitute TD Securities’ judgment as of the date hereof and is subject to change without notice. The price, value of and income from any of the securities mentioned in this material can fall as well as rise. Any market valuations contained herein are indicative values as of the time and date indicated. Such market valuations are believed to be reliable, but TD Securities does not warrant their completeness or accuracy. Different prices and/or valuations may be available elsewhere and TD Securities suggests that valuations from other sources be obtained for comparison purposes. Any price or valuation constitutes TD Securities’ judgment and is subject to change without notice. Actual quotations could differ subject to market conditions and other factors. TD Securities disclaims any and all liability relating to the information herein, including without limitation any express or implied representations or warranties for, statements contained in, and omissions from, the information. TD Securities is not liable for any errors or omissions in such information or for any loss or damage suffered, directly or indirectly, from the use of this information. TD Securities may have effected or may effect transactions for its own account in the securities described herein. No proposed customer or counterparty relationship is intended or implied between TD Securities and a recipient of this document. TD Securities makes no representation as to any tax, accounting, legal or regulatory issues. Investors should seek their own legal, financial and tax advice regarding the appropriateness of investing in any securities or pursuing any strategies discussed herein. Investors should also carefully consider any risks involved. Any transaction entered into is in reliance only upon the investor’s judgment as to financial, suitability and risk criteria. TD Securities does not hold itself out to be an advisor in these circumstances, nor do any of its representatives have the authority to do so. The information contained herein is not intended for distribution to, or use by, any person in any jurisdiction where such distribution or use would be contrary to applicable law or regulation or which would subject TD Securities to additional licensing or registration requirements. It may not be copied, reproduced, posted, transmitted or redistributed in any without the prior written consent of TD Securities. If you would like to unsubscribe from our email distribution lists at any time, please contact your TD Securities Sales Contact or email us at [email protected]. You can access our Privacy Policy here (http://www.tdsecurities.com/tds/content/AU_Privacy_EandAP_en_CA).
Australia: If you receive this document and you are domiciled in Australia, please note that TD Securities is not a registered bank in Australia, is not a holder of an Australian Financial Services License (AFSL), and is exempt from the requirement to hold an Australian Financial Services License under the Corporations Act 2001 in respect of the financial services provided by the Singapore branch of The Toronto-Dominion Bank (“TD Bank”) as part of its operations in Singapore and the UK. TD Bank is regulated by the Monetary Authority of Singapore under the laws of Singapore and the Financial Conduct Authority under UK laws, which differ from Australian laws. TD Securities Limited is providing financial services to wholesale clients in Australia in reliance on Class Order CO 03/1099. Canada: Canadian clients wishing to effect transactions in any security discussed herein should do so through a qualified salesperson of TD Securities or TD Securities Inc. TD Securities Inc. is a member of the Canadian Investor Protection Fund. Hong Kong: This document, which is intended to be issued in Hong Kong only to Professional Investors within the meaning of the Securities and Futures Ordinance (the "SFO") and the Securities and Futures (Professional Investor) Rules made under the SFO, has been distributed through TD Bank, Hong Kong Branch, which is regulated by the Hong Kong Monetary Authority. India, South Korea and Other Locations in Asia: TD Bank has representative offices in Mumbai and Singapore which should be contacted for any general enquiry related to TD Securities. In locations in Asia where TD Securities does not hold a license to conduct business in financial services, it is not TD Securities’ intention to, and the information contained in this document should not be construed as conducting any regulated financial activity, including dealing in, or the provision of advice in relation to, any regulated instrument or product. Japan: For Japanese residents, please note that TD Securities is not licensed in Japan and this is being provided to you under a relevant exemption to the Financial Instruments and Exchange Law. People's Republic of China: Insofar as the document is received by any persons in the People's Republic of China (which, for such purposes, does not include Hong Kong, Macau or Taiwan), it is intended only to be issued to persons who have the relevant qualifications to engage in the investment activity mentioned in this document. The recipient is responsible for obtaining all relevant government regulatory approvals and licenses themselves, and represents and warrants to TD Securities that the recipient's investments in those securities do not violate any PRC law or regulation, including, but not limited to, any relevant foreign exchange regulations or overseas investment regulations. TD Bank has a representative office in Shanghai, which should be contacted for any general enquiry related to TD Securities. However, neither TD Securities nor the Shanghai representative office of TD Bank is permitted to conduct substantial business within the borders of the People's Republic of China. Singapore: This document is intended to be issued in Singapore only to Institutional Investors or Accredited Investors as defined under the Securities and Futures Act. Recipients of the analysis or report are to contact the financial adviser in Singapore in respect of any matters arising from, or in connection with, the analysis or report. Recommendations are intended for general circulation and do not take into account the specific investment objectives, financial situation or particular needs of any particular person. Advice should be sought from a financial adviser regarding the suitability of the investment product, taking into account the specific investment objectives, financial situation or particular needs of any person in receipt of the recommendation, before the person makes a commitment to purchase the investment product. TD Bank, Singapore Branch, is regulated by the Monetary Authority of Singapore. United Kingdom and Europe: This document is prepared, issued or approved for issuance in the UK and Europe by TD Securities Limited in respect of investment business
as agent and introducer for TD Bank. The Toronto-Dominion Bank is authorised by the Prudential Regulation Authority and subject to regulation by the Financial Conduct Authority and limited regulation by the Prudential Regulation Authority. TD Securities Limited is authorised and regulated by the Financial Conduct Authority. Insofar as the document is issued in or to the United Kingdom or Europe, it is intended only to be issued to persons who (i) are persons falling within Article 19(5) ("Investment professional") of the Financial Services and Markets Act 2000 (Financial Promotion) Order 2005 (as amended, the "Financial Promotion Order"), (ii) are persons falling within Article 49(2)(a) to (d) ("High net worth companies, unincorporated associations, etc.") of the Financial Promotion Order, or (iii) are persons to whom an invitation or inducement to engage in investment activity (within the meaning of section 21 of the Financial Services and Markets Act 2000) in connection with the issue or sale of any securities may otherwise lawfully be communicated or caused to be communicated. European clients wishing to effect transactions in any security discussed herein should do so through a qualified salesperson of TD Securities Limited. Insofar as the information in this report is issued in the U.K. and Europe, it has been issued with the prior approval of TD Securities Limited. United States: U.S. clients wishing to effect transactions in any security discussed herein must do so through a registered representative of TD Securities (USA) LLC. TD Securities is a trademark of TD Bank and represents TD Securities Inc., TD Securities (USA) LLC and TD Securities Limited and certain investment and corporate banking activities of TD Bank and its subsidiaries. © Copyright 2015 The Toronto-Dominion Bank. All rights reserved. Global Disclaimer: http://goo.gl/Jsf4vd