2016 ANNUAL - Trafigura · 18 Oil and Petroleum Products Trading 23 DT Group ... The 2016 Annual...
88
2016 ANNUAL REPORT TRAFIGURA GROUP PTE. LTD. ADVANCING TRADE
Transcript of 2016 ANNUAL - Trafigura · 18 Oil and Petroleum Products Trading 23 DT Group ... The 2016 Annual...

TR
AFIG
UR
A G
RO
UP PT
E. LTD
. AN
NU
AL R
EPORT 2016
2016ANNUAL REPORT
TRAFIGURA GROUP PTE. LTD.
ADVANCING TR ADE

FINANCIAL ANDBUSINESS HIGHLIGHTS*
* Trafigura’sfinancialyearrunsfrom1October2015to30September2016.
** Millionmetrictonnes.
*** EBITDA(earningsbeforeinterest,tax,depreciationandamortisation)isoperatingprofitexcludingtheshareinresultsofequity-accountedinvestees,depreciationandamortisation,gains/lossesondivestmentsofsubsidiaries,equity-accountedinvesteesandotherinvestments,impairmentlossesandotheroperatingincomeandexpense.
**** EmployeenumbersexcludeMATSAandPortoSudesteemployeesastheseassetsaredeconsolidatedfromTrafigura’sbalancesheet.
$98.1bn 264.4mmt $2.3bn $41.2bnGrouprevenue(2015:USD97.2billion)
Combinedvolumeofcommoditiestraded**(2015:198.4mmt)
Grossprofit(2015:USD2.6billion)
Totalassets(2015:USD39.1billion)
65% 205.4mmt 2.3% $8.5bnOilandPetroleumProductsrevenueasapercentageofGrouprevenue(2015:67percent)
OilandPetroleumProductstotalvolumetraded(2015:146.3mmt)
Grossprofitmargin(2015:2.7percent)
Totalnon-currentassets(2015:USD8.4billion)
35% 14.9mmt $0.975bn $5.5bnMetalsandMineralsrevenueasapercentageofGrouprevenue(2015:33percent)
Metalstotalvolumetraded(2015:12.8mmt)
Netprofit(2015:USD1.1billion)
Shareholders’equity(2015:USD5.6billion)
44.1mmt $1.6bn 4,107Mineralstotalvolumetraded(2015:39.3mmt)
EBITDA***(2015:USD1.9billion)
Averagenumberofemployeesoveryear****(2015:5,248)

ADVANCINGTRADE
Without trade, countries cannot develop, economies cannot grow and international business cannot function. We help make trade happen.
We move physical commodities from places where they are plentiful to where they are most needed – reliably, efficiently and responsibly.
Trafigura has been connecting its customers to the global economy for more than two decades; we are growing prosperity by advancing trade.
CONTENTS
Overview02 Trafiguraataglance
Report of the Board of Directors04 ChiefExecutive’sstatement06 Marketplacereview10 Financialreview16 Businessmodelandstructure18 Oil and Petroleum Products Trading23 DTGroup24 Metals and Minerals Trading28 ShippingandChartering30 ImpalaTerminals32 MiningGroup33 GalenaAssetManagement
Risk management and funding model34 HowTrafiguramanagesrisk38 Financetomeetdiversebusinessneeds
Corporate governance40 BoardofDirectorsandCommittees
Financial statements43 ContentsfortheFinancialStatements
The2016AnnualReportiscomplementedbythe2016ResponsibilityReport which reflects on Trafigura’s progress in implementingresponsiblebusinesspracticesandsetsoutmetricsassessingourperformance inmanagingourHealth,Safety,EnvironmentandCommunities(HSEC)impacts.
Forfurtherinformationpleasevisitwww.trafigura.com/responsibility ADVANCING
TR ADE
2016RESPONSIBILITY
REPORTTRAFIGURA GROUP PTE. LTD.
TRAFIGURA 2016 ANNUAL REPORT 01
OV
ER
VIE
W
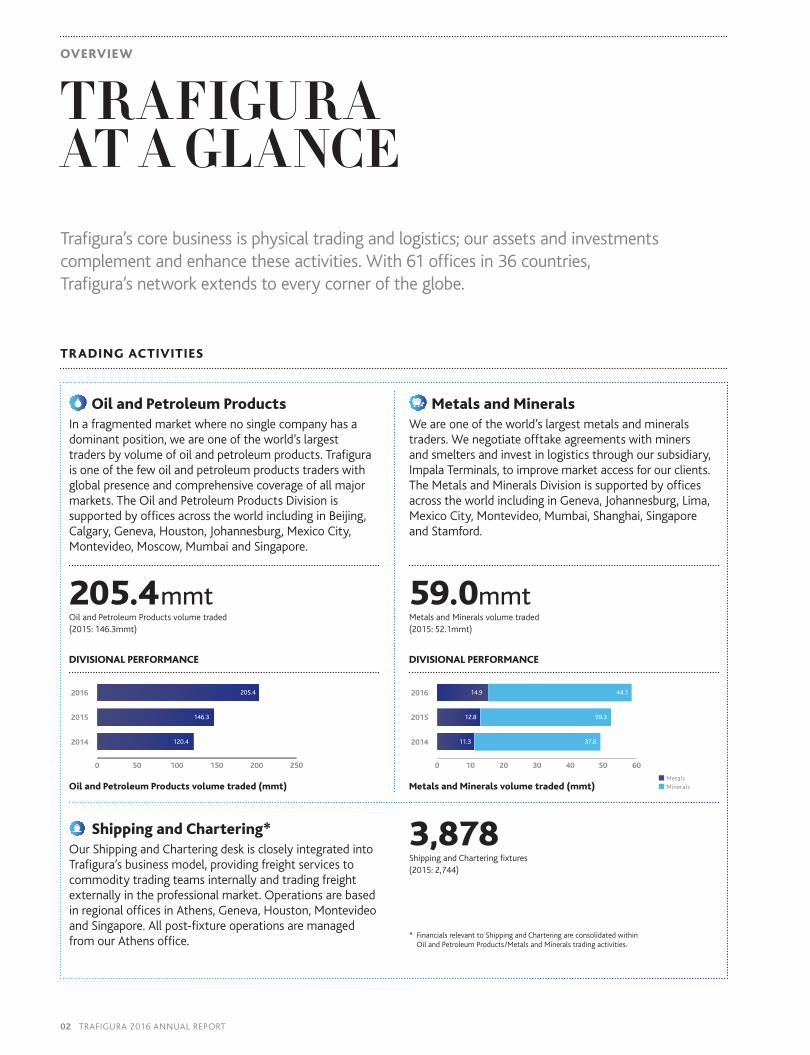
TR AFIGUR A AT A GLANCETrafigura’scorebusinessisphysicaltradingandlogistics;ourassetsandinvestmentscomplementandenhancetheseactivities.With61officesin36countries,Trafigura’snetworkextendstoeverycorneroftheglobe.
TRADING ACTIVITIES
Oil and Petroleum ProductsInafragmentedmarketwherenosinglecompanyhasadominantposition,weareoneoftheworld’slargesttradersbyvolumeofoilandpetroleumproducts.Trafiguraisoneofthefewoilandpetroleumproductstraderswithglobalpresenceandcomprehensivecoverageofallmajormarkets.TheOilandPetroleumProductsDivisionissupportedbyofficesacrosstheworldincludinginBeijing,Calgary,Geneva,Houston,Johannesburg,MexicoCity,Montevideo,Moscow,MumbaiandSingapore.
Metals and MineralsWeareoneoftheworld’slargestmetalsandmineralstraders.Wenegotiateofftakeagreementswithminersandsmeltersandinvestinlogisticsthroughoursubsidiary,ImpalaTerminals,toimprovemarketaccessforourclients.TheMetalsandMineralsDivisionissupportedbyofficesacrosstheworldincludinginGeneva,Johannesburg,Lima,MexicoCity,Montevideo,Mumbai,Shanghai,SingaporeandStamford.
205.4mmtOilandPetroleumProductsvolumetraded(2015:146.3mmt)
59.0mmtMetalsandMineralsvolumetraded(2015:52.1mmt)
DIVISIONAL PERFORMANCE DIVISIONAL PERFORMANCE
2014
2015
2016
500 100 150 200 250
120.4
146.3
205.4
12.8 39.3
14.9 44.1
11.3 37.82014
2015
2016
100 20 30 40 6050
Oil and Petroleum Products volume traded (mmt) Metals and Minerals volume traded (mmt)
Shipping and Chartering*OurShippingandCharteringdeskiscloselyintegratedintoTrafigura’sbusinessmodel,providingfreightservicestocommoditytradingteamsinternallyandtradingfreightexternallyintheprofessionalmarket.OperationsarebasedinregionalofficesinAthens,Geneva,Houston,MontevideoandSingapore.Allpost-fixtureoperationsaremanagedfromourAthensoffice.
3,878ShippingandCharteringfixtures(2015:2,744)
* FinancialsrelevanttoShippingandCharteringareconsolidatedwithinOilandPetroleumProducts/MetalsandMineralstradingactivities.
MetalsMinerals
02 TRAFIGURA 2016 ANNUAL REPORT
OVERVIEW

DT GroupDTGroupisabusinessventurebetweenTrafiguraandCochanLtd.Itdevelopsmarketsinsub-SaharanAfrica,withaparticularfocusonAngola.Itworkscloselywithinternationalandlocalpartnersinthelogistics,tradingandnaturalresourcessectors.
Impala TerminalsImpalaTerminalsisamultimodallogisticsproviderfocusedonexport-drivenemergingmarkets.Itownsandoperatesports,portterminals,warehousesandtransportassets.Ithasparticularexpertiseinprovidingefficientlogisticsolutionsinchallengingenvironmentsandhardtoreachlocations.
Mining GroupTheMiningGroupmanagesminingoperations,developsprojects,conductstechnicalauditsofexistingandpotentialpartnerprojectsandprovidesadvisoryandsupportservicestoTrafigura’stradingdesks,tradingpartnersandGalenaAssetManagement.
Galena Asset ManagementGalenaAssetManagementprovidesinvestorswithspecialisedalternativeinvestmentsolutionsthroughitscommodityfunds.Itoperatesindependently,butbenefitsfromtheGroup’sinsightsintotheglobalsupplyanddemandofcommodities.
50%ownership
100%ownership
100%ownership
100%ownership
83employees*
1,625employees
473employees
13yearsinoperation
REGIONAL INFORMATION
NORTH AMERICA
6Offices
219Employees
MIDDLE EAST
2Offices
25Employees
ASIA & AUSTRALIA
12Offices
841Employees
AFRICA
7Offices
393Employees
LATIN AMERICA
23Offices
2,059Employees
* Allemployeenumbersrepresentaverageannualtotals.
EUROPE
11Offices
570Employees
INDUSTRIAL AND FINANCIAL ASSETS
TRAFIGURA 2016 ANNUAL REPORT 03
RE
PO
RT
OF
TH
E B
OA
RD
OF
DIR
EC
TO
RS
OV
ER
VIE
W

JEREMY WEIRChiefExecutiveOfficer
A ROBUST PERFORMANCE IN CHALLENGING MARK ET CONDITIONS
$98.1bn $8.5bnGrouprevenue(2015:USD97.2billion)
Totalnon-currentassets(2015:USD8.4billion)
$2.3bn $5.5bnGrossprofit(2015:USD2.6billion)
Shareholders’equity(2015:USD5.6billion)
Group revenue (USD billion)
2014
2015
2016
0 30 60 90 120 150
98.1
97.2
126.2
Uncertaintyanddynamicchangewerethewatchwordsforcommoditiesmarketsthroughout2016,asmixedfortunesintheglobaleconomyfoundpartsoftheresourcesindustrystrugglingwithover-supplyanddepressedprices.Againstthisbackdrop,TrafiguraGroupdeliveredarobustcommercialandfinancialperformanceinthe12-monthperiodto30September2016,withsignificantgrowthintradingvolumesandstrongprofitability,albeitsomewhatreducedfromtherecordtradingresultachievedinthe2015financialyear.
NetprofitfortheyearwasUSD975million,12percentlowerthan the figure of USD1,103 million in 2015. Gross profit wasUSD2,291million,also12percentdownyear-on-year,whilerevenuewasflatatUSD98,098million,comparedtoUSD97,237millionin2015. EBITDA, which we see as the most accurate measure ofoperatingperformancesince it stripsout investmentgainsandimpairments,wasUSD1,628million,down13percentonthe2015figureofUSD1,861million.
Conditionsremainedbroadlyfavourablefortradingintheoilmarket,featuringsustainedpricevolatilityandover-supply.Themetalsmarketcontinuedtopresentsignificantchallenges,althoughsomepositivesignsbecamevisibleinsomesegmentsinthesecondhalfoftheyear.Wewereabletobuildvolumesinbothourtradingdivisions,OilandPetroleumProductsandMetalsandMinerals,thankstoourglobalreach,strongcommercialrelationshipsandanincreasinglydiversifiedglobalcustomerbase.Competitionwasintenseinallthemarketsinwhichweoperate,reflectedinareducedgrossmarginof2.3percentfrom2.7percentin2015.
Atthesametime,thedepressedpriceenvironmenthadanadverseeffectonourindustrialassets,withtheresultthatwedecidedtowritedownthebalance-sheetvalueofcertainassets.Thesumofimpairmentswemadein2016amountedtoUSD365million,andwaspartiallyoffsetbyUSD244millionfromreversingaprior-yearimpairmentonanotherasset.
GROWTH AND EFFICIENCY Ourstrategyin2016wasunchanged:togrowphysicaltradingvolumesandrevenuesbydeliveringexcellentcustomerservicewhilemanagingoperationalandfinancialriskandoptimisingefficiency.
VolumesgrewstronglyintheOilandPetroleumProductsTradingDivision,whichhandledadailyaverageof4.3millionbarrels,42percentmorethanthedailyaverageof3.0millionbarrels in2015.Thisachievementwasattributabletoanumberoffactors,includingthescaleandscopeofourpresence,theglobally integratednatureofouroperation,thestrongrelationshipswehavebuiltwithproducersandrefinersandwithourmid-anddownstreaminvestment,PumaEnergy,andourexpertisestretchingrightacrosstheproductspectrumfromcrudeandfueloiltoliquefiednaturalgas.
Thesecapabilitiesandrelationshipsarevitalfactorsforsuccessinover-suppliedmarkets,andpositioneduswelltobenefitfromincreasingdemandforcrude,refinedproductsandgas.Theyalsoenabledustotakemaximumadvantageofthedramaticchangesinproductflowsandarbitrageopportunitiesarising,forexample,fromtheemergenceoftheUSasanexporterofcrudeandthatofChinaasamajorexporterofrefinedproducts.GrowthwasespeciallystronginAsia,whichbodeswellforthefuturesincethatregionishometotheworld’smostpromisinggrowthmarketsforoil,suchasIndia.
In its 2016 financial year, Trafigura Group once again demonstrated its resilience through the economic cycle, reporting growth in trading volumes, and profit slightly lower than in 2015.
04 TRAFIGURA 2016 ANNUAL REPORT
CHIEF EXECUTIVE’S STATEMENT

InMetalsandMineralsTrading,pricesweregenerallydepressed,withtheexceptionsof coal, zincandnickelascontinuing structuraladjustmentintheChineseeconomydampenedindustrydemandandproducerscameunderincreasingpressure.Yethere,too,TrafigurawasabletogrowvolumeacrossitsMetalsandMineralsbookby13percentoverallto59.0milliontonnesfrom52.1milliontonnesin2015,furtherenhancingouralreadysignificantshareofthesemarkets.
Growthcamebothinsegmentswherewearewell-establishedsuchasnon-ferrousconcentratesandrefinedmetalsbutalsoinournewerbooks,coalandironore.Wecontinuedtodifferentiateourselvesfromthecompetitionbyofferingourbusinessrelationshipsinnovativesolutionsdrawingonourstrengthsinoperations,logisticsandfinance.Wefurtherextendedstrategicrelationshipstosupportourgrowth,forexamplewithNyrstarinEurope,inwhichTrafigurahasa24.6percentshareholding,andwithChinesesmeltersincludingJinchuanGroup’snewcoppersmelterinFangchenggangwhereweowna30percentequitystake.
Keytoourresilienceweretheefficienciesandimprovementsinriskmanagementwehavecreatedbyinvestingsignificantsumsininformationtechnologyandincreatingconsolidatedmid-andback-officesupportcentresinMumbai,MontevideoandShanghai.Theseoperationsenablethebusinesstoscaleupwithoutacorrespondingescalationincostandthusprovidesustainablesupportforthebottomline.
REDUCING CAPITAL INVESTMENT AnothervitalpillarofTrafigura’sstrategyisinvestinginindustrialandinfrastructureassetsthatsupporttrading,principallythroughourImpalaTerminalssubsidiary.In2016,thisstrategyreachedaninflectionpointasanumberofassetsinwhichwehadinvestedheavilyinrecentyearsmovedfromtheconstructionphasetocommercialoperations.
InBrazil,thePortoSudesteironoreexportterminalthatImpalajointlycontrolswithMubadalaDevelopmentCompanybuiltvolume,thoughataslowerpacethananticipatedowingtothedepressedstateoftheglobalironoremarket:ithandledabout7milliontonnesin2016,anumberthatweexpecttogrowin2017.Toreflectthefactthattheportisoperatingatapaceconsiderablybelowinstalledcapacity,wewrotedownitsbalance-sheetvaluebyUSD250millionattheyear-end.
InColombia,Impala’swetanddrybargefleetontheMagdalenaRiverramped-upcommercialoperations,exportingheavycrude,importingnaphthaandhandlingcontainertraffictoourinlandportatBarrancabermeja. Elsewhere in the country Impala exited itsinvolvementintheFDPrailway,writingdownitsinvestmentinthatprojectbyUSD43million.
Asourcycleofassetinvestmentreachesitsnaturalconclusion,capital expenditure required to complete keyprojectsdroppedsignificantlytoUSD754millionin2016,comparedwithUSD1,223millionthepreviousyear.Wealsomadeastartonreducingourleverage,partlythankstothesaleofsomenon-coreshippingassets,andleveragereductionisastrategyweexpecttocontinuethroughnextyear.
LEADERSHIP AND TRANSPARENCY WeintroducedsomechangestoTrafigura’smanagementstructureduring2016. Inparticularweestablishedtwonewmanagementcommittees,one tooversee tradingand theother to superviseinvestments.TheTradingCommitteemanagesthegroup’stradingactivitieswithinthefinancialandoperatingparametersestablishedbytheBoard.TheInvestmentCommitteeisresponsiblefordefiningandimplementing an investment strategy, as well as the portfoliomanagementandriskframeworkfortheGroupanditssubsidiaries.Boththesebodieshaveenabledustopromotetalentedindividualsfromthetradingdivisionstomoreseniorpositionsandtostartbuildingthecompany’snextgenerationofleaders.
We also continued to develop our strategies of corporateresponsibilityandtransparencyduringtheyear.InadditiontooursecondstandaloneResponsibilityReport,wepublishedageneral-interestguidetotradingandtheroleoftradingfirmsinorganisingglobalsupplychains,entitled‘Commodities Demystified’,andapaperontheregulatorychallengesfacingtradefinance.Weseetheseactivitiesasvitaltobuildingtrustinourfirmandourindustry.
LOOKING AHEADAswemoveinto2017,uncertaintyandchangeseemlikelytointensify,creatingnewchallengesaswellasopportunitiesforcommoditiestrading.Indeed,afterthepoliticalsurprisesof2016,Icannotrecallanothermomentinrecenthistoryatwhichthefutureseemedsounclearonsucharangeofsubjects.Theonesurepredictionisthatexpectationsabouteconomicandmonetarypolicy,currenciesandgeopoliticalriskwillcontinuetofluctuate,bringingtheprospectof enhanced volatility and changes in supply and demand ofkeycommodities.
AtTrafiguraGroupwewillcontinuetopositionourselvestotakeadvantageoftheopportunitiesforfurthergrowththisenvironmentwillundoubtedlycreate,whilemaintainingourfocusonresilienceandresponsibleriskmanagement.Onetransactionannouncedafterour2016year-endislikelytobeofparticularimportancein2017andafter:ourinvestmentasasignificantminorityshareholderalongsideRussia’sRosneftandinvestmentgroupUCPinMumbai-basedEssarOilLimited.ThispurchasewillyieldbroadcommercialbenefitsforTrafigura,givingusexposuretoaworld-classrefiningandinfrastructureassetwithastrategicpositionintheglobaloilmarketandoneofitsfastest-growingsegments.Onceitisconcluded,EssarOilwilljoinalargeand still-growing collection of third-party joint ventures andinvestmentswhichtogetherwithourstrongtradingplatformaredrivingourbusinessforward.
Jeremy Weir,ChiefExecutiveOfficer
TRAFIGURA 2016 ANNUAL REPORT 05
RE
PO
RT
OF
TH
E B
OA
RD
OF
DIR
EC
TO
RS

PRICE MOVEMENTSAND SHIFTING GLOBAL FLOWS
Ourlatestfiscalyearwasmarkedbysignificantpricemovementsandquiteafewsurprises.Chinagrewmorestronglythanmostanalystshadpredicted;theFederalReservechosenottohikeratesagainafterasingleincreaseinDecember2015;BritainvotedtoleavetheEU;andoilsupplieswereresilientdespitelowprices,leadingtoanOPECagreementtolimititsproductionforthefirsttimeineightyears.Inthemarketswesawcommoditypricesasawholefalltothelowestlevelsin18years1,onlyforthemtoreboundbyanywherefrom20-80percentjustafewmonthslater.Ofnoteisthefactthatthesemoveswerefairlysteadyineitherdirection,meaningthatdailyvolatilityremainedsubdueddespitethelargeoverallchanges.Inthischangingpriceenvironment,demandheldupbetterthanmostexpected,particularlyintheoilsectorbutalsoincopperandzinc,whilecoalwasthesurprisewinnerintermsofpricegrowththisyear.Globalflowshaveshifted,withtheUSbecomingamajorexporterofcrudeoil,andChinaaworld-scaleexporteroffinishedproducts,onboththeoil(dieselandgasoline)andmetals(steel,aluminium)side.Wehavealsoseenemergingmarketsbecomingmajorcentresofdemandgrowth.
Whattheseshiftstellusisthatmarketscontinuetoberesilientinchangingcircumstances,withbothdemandandsupplyadjustingtomeettherealitiesofthemoment,anddespiteuncertaintiesahead,weexpecttoseethevolumeofcommoditiestradedgloballycontinuingtoincrease.
MACROECONOMIC ENVIRONMENTOveralltheglobaleconomyheldupwellthispastyear,recordingrelativelysolidifunspectaculargrowth.Ashastendedtobethecaserecently,theUSledtheway,astheemploymentsectorcontinuedtoshowstrongjobgains,whichfedthroughintorisingincomesandultimatelyconsumption.TheUSconsumerremainstheultimatedrivingforceintheglobaleconomy,accountingforjustunderoneoutofevery10dollarsspentontheplanet,andassuchahealthyUSconsumptionratehascontinuedtolifttheglobaleconomy.Lowinterestrateshavegiventheeconomyroomtorun,asseeninthegrowthinrealestate,vehiclesalesandfuelconsumption,allimportantsectorsforTrafiguraandthecommoditysectoratlarge.
However,despitedecentstrength,theUSeconomyhasbeenunabletofullybreakoutofitstepidrecentrange,withtheresultthattheFederalReservehasbeenfacedwithacloudedoutlookasitdecidesthepathwayofmonetarypolicy.TheweaknessinheadlineGDP,whichislikelytoshowfull-year2016growthofbelow2percent,wouldsuggestthattheFederalReserveshouldbeseekingtokeeprateslowforquitesometime.Ontheotherhand,inflationisbeginningtopickup,inlinewiththerobustemploymentpictureandrisingoilprices.TheFed’sdilemmabetweenheadingoffinflationandallowingtheeconomytocontinuestrengtheninghasbeenoneofthedominantthemesinthemarketoverthelastyear.AlthoughahikeinDecember2016seemslikely,thepathforwardinto2017looksincreasinglyunclear,potentiallycausingvolatilityahead.TheincomingUSadministration’splansontaxationandspendingarealsoamajorfactorincreatinguncertainty,asthereisalackofclarityonwhichoftheinitiativesproposedtodatemayinfactbefeasible.
COMMODITIES INDEX
1September2015–27October2016
50
100
150
200
Indexed
Sep2015
Nov2015
Jan2016
Mar2016
May2016
Jul2016
Sep2016
Copper Zinc AP12 Coal Iron OreCrude
Commodity Index
Source: Bloomberg Data, Trafigura Research.
The period from October 2015 to September 2016 featured solid economic growth and market uncertainties.
SAAD RAHIMChiefEconomistandHeadofAnalysis
1.Source:BloombergCommodityIndex.
06 TRAFIGURA 2016 ANNUAL REPORT
MARKETPLACE REVIEW

Regardless,therecentbiastowardsFedtighteninghascombinedwiththelikelihoodoftheTrumpadministrationstokinginflation,togetherboostingtheUSdollar(USD)towardstheendoftheyear.ThishassenttheChineseRMBtoarecordlowandweakenedtheBritishPound(GBP)tolevelsnotseensincetheearly1980s(albeitthemajorpartofthismovewasdueto‘Brexit’,thevotetoleavetheEU).TheEurohasbouncedaroundwithinafairlynarrowrange,buthasalsocomeunderpressureinrecentmonthsaspolicyhasdivergedbetweentheUSandEU,andalsoduetorisingpoliticalrisksincludingtheupcomingelectionsinvariousEUmemberstates.ThestrongerUSDhasinturnbeenaheadwindforcommodityprices,asproductioncostshavefallenandconsumingnationsarefindingitmoreexpensivetoimportoilandmetals.
CommoditymarketsarebecomingusedtotheideathatChinesegrowthisnolongertheglobalforceitoncewas,buttheeconomyheldupmuchbetterovertheyearthanmostprojected.China’sindustrialslowdowndidcontinueinthefirstpartoftheyear,butsawareboundstartinginQ22016duetogovernmentsupport.TheChineseauthoritieshavesuppliedtheeconomywithoverUSD2.1trillionofadditionalliquidity,equivalenttothedollarvalueoftheentireIndianeconomy.Theinfusionoffundsboostedgrowth,particularlyintherealestatesector,whichsawamarkedreboundacrosstheboardaftersufferingaseverecontractionlastyear.
ThestrengthinChineserealestateandconstructionmarketswasthekeystoryoftheyearintermsofmetalsdemand.Housingpricesstartedthemove,risingfirstintheso-calledTier1cities(mainlycoastalindustrialhubs),buteventuallyseeingpricesinTier2andinterior-locatedTier3citiesmovebackintopositiveterritoryaswell.Risingpricesledtoareturnofconstructionactivityandlandsales,creatingavirtuouscircleeffectthatboosteddemandforcopper,zincandsteel.
CHINESE NEW BUILD HOUSE PRICES
Changeyear-on-year
-10
5
10
15
20
25
30
35
-5
0
Sep2010
Sep2011
Sep2012
Sep2013
Sep2014
Sep2015
Sep2016
Tier 1 Cities Tier 2 Cities Tier 3 Cities
Aluminium consumption per passenger vehicle
Source: China National Bureau of Statistics.
%
Elsewhere,EuropehasnotyetsufferedanyrealimpactsasaresultoftheUKvotingtoleavetheEU.Indeed,theUKitselfhassofardefiedmostprojectionsbycontinuingtogrowatasteadypace,althoughinflationisstartingtocreepupwardsduetothefallintheGBP.GermanyhascontinuedtopowertherestofEurope,asmanufacturingandexportshaverecovered,albeitatarelativelyslowpace.TheEuropeanCentralBankhasmaintained itsaccommodativepolicies,continuingtopurchaselargequantitiesofcorporateandsovereignbonds,keepinginterestratesatrecordlows.
However,theeventualwithdrawalofCentralBankstimulusmeasuresislikelytobeadominantheadlineoverthenextfiscalyear,bothinEuropeandglobally.WhileCentralBankratehikesarelikelytoremainmuted,bondmarketsarealreadyreactingtothepossibilityoftheliquiditytapbeingturnedoffandarepushingrateshigher.Atthesametimeinflationisstartingtoinchhigherinmostkeyregions,reversingthetrendofrecentyears,supportingtheincreaseinratesandinturnpotentiallytighteningcredit.Howmarketshandlethisnewenvironmentwillhelpdefinethenexttradingyear.
ENERGY MARKETSInoilmarkets,asupportivemacroeconomicenvironmenthasseenanotheryearofsoliddemandgrowth,albeitabitsofterthan2015’s1.9millionbarrelperdayincrement.However,evenanotheryearofdemandgrowthhasnotbeenenoughtoaddresstheissueofglobaloversupply,whichcontinuestodominatethemarket.Throughouttheyear,thesurplushasshiftedbetweenthecrudesideandrefinedproducts,meaningthatfromanoverallhydrocarbonsperspective,oversupplyremainedatrecordlevelsglobally.
DespitethefallinUSoilproductionatthebeginningofthecalendaryear,overallsuppliescontinuedtobuildasvariousproducersramped-upproduction.Iranaddedapproximately700,000barrelsperdayasitrecoveredfromsanctions-enforcedoutputcurbs,whileSaudiArabiaandRussiabothhitrecordlevelsofproduction.TheseadditionalsuppliesmorethanoffsetdisruptionsinNigeriaandCanada,andongoingdeclinesinVenezuelaandotherLatinAmericaproducers.Asaresult,totalhydrocarboninventoriesrosetoover750millionbarrels,over500millionofwhichwereintheOECDeconomies.
Theissueofoversupplywasnotlimitedtocrudehowever.Followinglastyear’sstronggasoline-leddemandgrowth,refinersover-producedgasolineandotherrefinedproducts,leadingtosignificantstockbuildsinthisareaaswell.Assuch,despiterecordlevelsofgasolinedemandintheUSthisyear,themarketstillsawgasolineinventoriesbuildingattimeswhenifthehistoricalpatternhadbeenfollowed,theyshouldhavebeen falling.The issuewasnot limited togasoline,asdistillateinventoriesalsoremainedatveryhighlevelsthroughouttheyear,althoughheretheproblemwasweakdemandmorethanoversupply.Asaresultoftheseelevatedinventories,refiningmarginswerenotasstrongastheywerelastyear,butnonethelesswerepositiveenoughtoincentiviserefinerstomaintainrunsforthemostpart,addingtotheglobaloverhang.
Asevidencedbyrefiningmarginsholdingup,demandoverallcontinuedtobehealthy,withstronggrowthinparticularintheUS,China,IndiaandMexico.Thecompositionofthatdemandhasbeenledbygasoline,asdieseldemandhasremainedsoft.Thedivergenceinthefortunesofthefuelshasresultedfromtherelativestrengtheningofconsumersglobally,boostinggasoline,whileindustrialactivityhasstagnated,weakeningdieseldemand.
Towardsthecloseoftheyear,OPECmembernationsreachedanagreementtolimittheirproduction,potentiallyloweringtotalvolumesby1.2millionbarrelsperday,inadditiontoupto600,000barrelsperdayfromnon-OPECmembers.Iftheorganisation’smembersadheretotheiragreedlimits,wewillstarttoseeatighteningmarketnextyear.Yetcompliancetraditionallyhasbeenamajorissueinthistypeofdeal,andahigherpricecouldleadtosignificantadditionalvolumesbeingproducedintheUS,China,LatinAmericaandelsewhere.Itremainstobeseenwhattheultimateimpactwillbe.
TRAFIGURA 2016 ANNUAL REPORT 07
RE
PO
RT
OF
TH
E B
OA
RD
OF
DIR
EC
TO
RS
NON-FERROUS MARKETSMetalsmarketsthisfiscalyearweremuchmoredifferentiatedintheirmovementsthantheywerein2014-15.Divergentmarketfundamentalspushedzincandnickelpricessignificantlyhigherandaluminiummoderatelyhigher,whilecopper,normallyseenasthekeybellwetheroftheglobaleconomy,remainedessentiallyflatoverthecourseoftheyear.
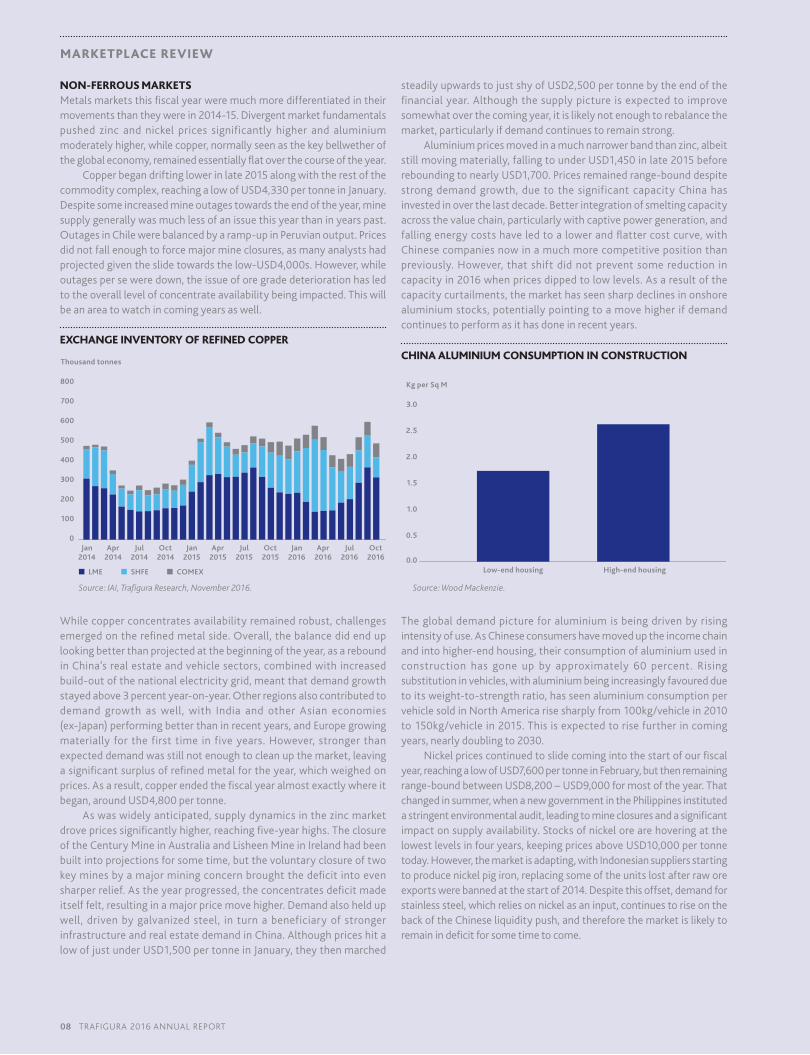
Copperbegandriftinglowerinlate2015alongwiththerestofthecommoditycomplex,reachingalowofUSD4,330pertonneinJanuary.Despitesomeincreasedmineoutagestowardstheendoftheyear,minesupplygenerallywasmuchlessofanissuethisyearthaninyearspast.OutagesinChilewerebalancedbyaramp-upinPeruvianoutput.Pricesdidnotfallenoughtoforcemajormineclosures,asmanyanalystshadprojectedgiventheslidetowardsthelow-USD4,000s.However,whileoutagesperseweredown,theissueoforegradedeteriorationhasledtotheoveralllevelofconcentrateavailabilitybeingimpacted.Thiswillbeanareatowatchincomingyearsaswell.
EXCHANGE INVENTORY OF REFINED COPPER
Jan2014
Apr2014
Apr2015
Jul2015
Oct2015
Jul2014
Oct2014
Jan2015
Apr2016
Jul2016
Jan2016
Oct2016
800
700
600
500
400
300
200
100
0
Thousand tonnes
■ SHFE ■ COMEX■ LME
Source: IAI, Trafigura Research, November 2016.
Whilecopperconcentratesavailabilityremainedrobust,challengesemergedontherefinedmetalside.Overall,thebalancedidenduplookingbetterthanprojectedatthebeginningoftheyear,asareboundinChina’srealestateandvehiclesectors,combinedwithincreasedbuild-outofthenationalelectricitygrid,meantthatdemandgrowthstayedabove3percentyear-on-year.Otherregionsalsocontributedtodemandgrowthaswell,with IndiaandotherAsianeconomies(ex-Japan)performingbetterthaninrecentyears,andEuropegrowingmateriallyforthefirsttimeinfiveyears.However,strongerthanexpecteddemandwasstillnotenoughtocleanupthemarket,leavingasignificantsurplusofrefinedmetalfortheyear,whichweighedonprices.Asaresult,copperendedthefiscalyearalmostexactlywhereitbegan,aroundUSD4,800pertonne.
Aswaswidelyanticipated,supplydynamicsinthezincmarketdrovepricessignificantlyhigher,reachingfive-yearhighs.TheclosureoftheCenturyMineinAustraliaandLisheenMineinIrelandhadbeenbuiltintoprojectionsforsometime,butthevoluntaryclosureoftwokeyminesbyamajorminingconcernbroughtthedeficitintoevensharperrelief.Astheyearprogressed,theconcentratesdeficitmadeitselffelt,resultinginamajorpricemovehigher.Demandalsoheldupwell,drivenbygalvanizedsteel,inturnabeneficiaryofstrongerinfrastructureandrealestatedemandinChina.AlthoughpriceshitalowofjustunderUSD1,500pertonneinJanuary,theythenmarched
steadilyupwardstojustshyofUSD2,500pertonnebytheendofthefinancialyear.Althoughthesupplypictureisexpectedtoimprovesomewhatoverthecomingyear,itislikelynotenoughtorebalancethemarket,particularlyifdemandcontinuestoremainstrong.
Aluminiumpricesmovedinamuchnarrowerbandthanzinc,albeitstillmovingmaterially,fallingtounderUSD1,450inlate2015beforereboundingtonearlyUSD1,700.Pricesremainedrange-bounddespitestrongdemandgrowth,duetothesignificantcapacityChinahasinvestedinoverthelastdecade.Betterintegrationofsmeltingcapacityacrossthevaluechain,particularlywithcaptivepowergeneration,andfallingenergycostshaveledtoalowerandflattercostcurve,withChinesecompaniesnowinamuchmorecompetitivepositionthanpreviously.However,thatshiftdidnotpreventsomereductionincapacityin2016whenpricesdippedtolowlevels.Asaresultofthecapacitycurtailments,themarkethasseensharpdeclinesinonshorealuminiumstocks,potentiallypointingtoamovehigherifdemandcontinuestoperformasithasdoneinrecentyears.
CHINA ALUMINIUM CONSUMPTION IN CONSTRUCTION
1.5
2.0
2.5
3.0
1.0
0.5
Kg per Sq M
0.0Low-end housing High-end housing
Source: Wood Mackenzie.
Theglobaldemandpictureforaluminiumisbeingdrivenbyrisingintensityofuse.AsChineseconsumershavemoveduptheincomechainandintohigher-endhousing,theirconsumptionofaluminiumusedinconstruction has gone up by approximately 60 percent. Risingsubstitutioninvehicles,withaluminiumbeingincreasinglyfavouredduetoitsweight-to-strengthratio,hasseenaluminiumconsumptionpervehiclesoldinNorthAmericarisesharplyfrom100kg/vehiclein2010to150kg/vehiclein2015.Thisisexpectedtorisefurtherincomingyears,nearlydoublingto2030.
Nickelpricescontinuedtoslidecomingintothestartofourfiscalyear,reachingalowofUSD7,600pertonneinFebruary,butthenremainingrange-boundbetweenUSD8,200–USD9,000formostoftheyear.Thatchangedinsummer,whenanewgovernmentinthePhilippinesinstitutedastringentenvironmentalaudit,leadingtomineclosuresandasignificantimpactonsupplyavailability.Stocksofnickelorearehoveringatthelowestlevelsinfouryears,keepingpricesaboveUSD10,000pertonnetoday.However,themarketisadapting,withIndonesiansuppliersstartingtoproducenickelpigiron,replacingsomeoftheunitslostafterraworeexportswerebannedatthestartof2014.Despitethisoffset,demandforstainlesssteel,whichreliesonnickelasaninput,continuestoriseonthebackoftheChineseliquiditypush,andthereforethemarketislikelytoremainindeficitforsometimetocome.
08 TRAFIGURA 2016 ANNUAL REPORT
MARKETPLACE REVIEW

BULK MARKETCoalwasthebigwinnerthisyear,essentiallydoublingfromUSD36.50pertonneinFebruarytooverUSD70pertonnebyyear-end,thesteepestriseon record.Thiswasdueprimarily togovernment-enforcedcurtailmentsofmineproductioninChina,asthecountrylookedtoreduceovercapacity in loss-makingsectorsoftheeconomy.Thegovernmenthas targeted closureof500million tonnesofproductioncapacityinthenextthreetofiveyears,andalsosoughttocutbackavailablecapacitybyreducingthenumberofoperatingdaysfrom300to276daysayear.
CHINA COAL OUTPUT AND THERMAL POWER GENERATION, YEAR-ON-YEAR GROWTH
-15
-10
-5
0
5
10
15
%
Jan2015
Mar2015
May2015
Jul2015
Sep2015
Nov2015
Jan2016
Mar2016
May2016
Jul2016
Aug2016
Oct2016
China Coal Output China Thermal Power Generation
-20
Inthemeantime,Chinesedemandcontinuedtomarchupwards,drivenbyeconomicactivity,itselfaresultoftheincreasedliquidityputintotheeconomyearlierthisyear.Powergenerationgrewbyoverfourpercentyear-on-year,asindustrialactivityreboundedonthebackofbanklendingandoveralldemandgrowth.RisingHenryHubpricesandrelativelystableLNGpriceshavealsoallowedcoalpricestoremainatelevatedlevels.
Ironorebenefited from rising steeldemand,which in turnwasdrivenbytheliquiditypushfromtheChinesegovernment,aswellasstronggrowthgloballyintermsofvehiclesalesandrealestate.Therun-upincokingcoalpricestowardstheendofourfiscalyearseemstohavepushedironorepriceshigheraswell,butitisunclearhowlongthiseffectmightlast.Unlikeothermarketssuchaszincorcrude,supplycutbacksbysmallerproducerswereoffsetbysignificantincreasesfrombiggerplayers,aswellasthestart-upoflargescaleprojectsinAustraliaandBrazil.Aswithmostoftheothercommodities,policydecisionsinChinaarelikelytoplayamajorpartindeterminingtheforwardpathforironore.
LOOKING AHEADCommoditymarketsaredrivenbyacomplexinterplayofphysicalfundamentals,macroeconomicdrivers,geopoliticsandpolicyevents,andassuchremainever-changing.TheconventionalwisdomatthestartofourfiscalyearwasthatmarketswouldcontinuetoslideindefinitelyasChinacontinuedasharpslowdownandoverallsuppliesfailedtoadjust.Instead,wehaveseenbetterdemandgrowth,drivenbyarobustglobalconsumerclass,andsuppliesimpactedbyproducercutsandpolicyinitiatives.Overall,marketsfeelmorebalancedthantheyhaveoverthelastfewyears,andwhilesignificantquestionmarksremainaroundCentralBankbehaviourandgovernmentpolicies,astrongerglobalconsumershouldhelppropelmarketsforward.
Staff at Trafigura’s Singapore office.
TRAFIGURA 2016 ANNUAL REPORT 09
RE
PO
RT
OF
TH
E B
OA
RD
OF
DIR
EC
TO
RS

The Trafigura Group continued its path of profitable expansion during the 2016 fiscal year, growing traded volumes but recording reduced net profit after write-downs on some industrial assets.
CHRISTOPHE SALMONChiefFinancialOfficer
Performance Indicators
$98.1bn $8.5bnGrouprevenue(2015:$97.2billion)
Totalnon-currentassets(2015:$8.4billion)
$2.3bn $41.2bnGrossprofit(2015:$2.6billion)
Totalassets(2015:$39.1billion)
2.3% $5.5bnGrossprofitmargin(2015:2.7percent)
Shareholders’equity(2015:$5.6billion)
$0.975bn $1.6bnNetprofit(2015:$1.1billion)
EBITDA*(2015:$1.9billion)
Despiteaglobalcommoditiesmarketcharacterisedbysignificantstressesandheadwinds,theTrafiguraGroupdeliveredasoundfinancialperformance in2016.Theyearhadtwokeyfeatures:continuedprofitablevolumegrowthinbothtradingdivisions,OilandPetroleumProductsandMetalsandMinerals;andwrite-downsonsomeoftheGroup’sindustrialandlogisticalassets,reflectingtheimpactofamorechallengingbusinessenvironmentonthevalueoftheseassets.ThenetresultwasaprofitfortheyearofUSD975million,adecreaseof12percentfromthefigureofUSD1,103millionrecordedin2015.
The2016performanceisbroadlyinlinewiththelevelsseenoverthepastseveralyears,albeitlowerthanthepeakachievedintheexceptionalmarketconditionsof2014-15.ItdemonstratesthestrengthsofadiversifiedbusinessmodelthatenablesTrafiguratomaintainstronglyprofitableoperationsinthewidestvarietyofmarketconditions.
In2016,bothmaintradingdivisionsmadeasignificantcontributiontoprofit.AhighlightoftheyearwasasharpincreaseintradedvolumeintheOilandPetroleumProductsTradingDivision,whichhandledadailyaveragevolumeof4.3millionbarrels–a42percentincreasefromthedailyaverageof3.0millionbarrelsin2015.VolumealsoincreasedinMetalsandMineralstrading,to59.0milliontonnesfrom52.1milliontonnesin2015.Ourinventoriesinstorageandintransitshowedacorrespondinglysharpincrease,withourabilitytofinancethisgrowthakeyindicationofTrafigura’sfinancialstrength.
TheyearsawTrafiguracompleteaphaseofintensiveinvestmentininfrastructureandlogisticalassetsthatsupportaccesstotradeflows.Anumberof importantcapital investmentprojects ramped-upcommercialoperations,butfacedchallengingcommoditymarketconditions.Inconsequencewetooksignificantimpairmentsonthevalueofcertainassets,withtotalwrite-downsofUSD365million,partiallyoffsetbyaUSD244milliongainfromreversingaprior-yearimpairmentonanotherasset.Atthesametime,wemadeastartonreducingourleveragethroughthesaleofnon-coreassets.
Wedemonstratedcontinueddisciplinedcreditriskmanagementovertheyear.Withdistressaffectingincreasingnumbersofcommodityproducers,processorsandrefinersaswellaslargepartsoftheshippingindustry,ourabilitytolimitourexposuretocrediteventswascrucial.
STRONG TRADING RESULTDRIVEN BY INCREASED VOLUMES
* EBITDA(earningsbeforeinterest,tax,depreciationandamortisation)isoperatingprofitexcludingtheshareinresultsofequity-accountedinvestees,depreciationandamortisation,gains/lossesondivestmentsofsubsidiaries,equity-accountedinvesteesandotherinvestments,impairmentlossesandotheroperatingincomeandexpense.
10 TRAFIGURA 2016 ANNUAL REPORT
FINANCIAL REVIEW

2016 2016
2015 2015
OIL AND PETROLEUM PRODUCTS
Revenuebygeography(%)METALS AND MINERALS
Revenuebygeography(%)
Region 2016 2015
Middle East 6% 5%
Africa 7% 21%
Asia & Australia 29% 15%
Europe 26% 25%
Latin America 10% 17%
North America 22% 16%
Region 2016 2015
Middle East – 0.3%
Africa 2% 2%
Asia & Australia 58% 64%
Europe 29% 21%
Latin America 4% 4%
North America 7% 9%
PROFITABILITYRevenuein2016totalledUSD98,098million,broadlycomparablewiththeUSD97,237millionrecordedin2015,reflectingsharplyincreasedvolumeoffsetbyloweraverageprices.Totalvolumeofcommoditiestradedroseby33percentto264.4milliontonnesfrom198.4milliontonnes,withoilandpetroleumproductsvolumesrising41percentto205.4milliontonnesandmetalsandmineralsvolumesincreasing13percentto59milliontonnes.
GrossprofitwasUSD2,291million,adecreaseof12percentfromthefigureofUSD2,600millionrecordedin2015.Thisrepresentedagrossprofitmarginof2.3percentcomparedtothemarginof2.7percentregistered in2015, reflectinga return tomorenormalbusinessconditions.GeneralandadministrativeexpensesincludingstaffcostswereUSD947million,a5percentdecreasefromthe2015figureofUSD995milliondespitethevolumeincreases.Thisreflectsinparttheoperatingandscaleefficiencieswehavecreatedbyestablishingconsolidatedmid- andback-office support centres inMumbai,MontevideoandShanghai.
Indivisionalterms,thegrossprofitfigurereflecteda13percentdecreaseingrossprofitinoilandpetroleumproductstoUSD1,460millionanda10percentfallingrossprofitinmetalsandminerals,withgrossprofitatUSD831millioncomparedtoUSD920millionin2015.
The‘otherincome/expense’lineshowedasignificantnegativeimpactfromimpairmentsoffinancialandnon-financialassetsandofequity-accountedinvestees.ImpairmentstofinancialassetstotalledUSD40 million. Impairments to non-financial assets totalledUSD75million.OfthisUSD43millionrepresentedawrite-offofImpala’sinvestmentintheFDPrailprojectinColombia,managementofwhichhas
beentransferredtoalocaloperator.Impairmentstoequity-accountedinvesteeswereUSD250million,representingawrite-downinthevalueofthePortoSudesteironoreexportterminalinBrazil.TheseimpairmentswerepartiallyoffsetbythereversalofaUSD244millionimpairmentthathadbeentakenin2015onthevalueoftheAEMRironoreminingprojectinAngola.Inourviewtheimpairmentstakenin2016reflectafairapproachinviewofthedistressedconditionsincommoditymarketsandtheirlikelyimpactonourassets.
Fromanoperatingprofitperspective,webelievethatEBITDAistheappropriateindicatortoassessourperformanceastheamountofdepreciationandamortisationhassteadilyincreasedfollowingthegrowthinourfixedassetportfolio.EBITDAin2016wasUSD1,628million,comparedtoUSD1,861millionthepreviousyear,adecreaseof13percentbutstillaverystrongoperatingresultinthemarketcircumstances.
NetfinancingcoststhisyeartotalledUSD121million,lessthanhalfthe2015level.Thisreductionispartlyduetothefactthatin2015,USD49millionrelatingtothedistributionsontheperpetualcapitalsecuritieswasrecordedaspartoffinancingcostsbecausethesesecuritieswerenottransferredtoTrafiguraGroupPteLtd. fromTrafiguraBeheerB.V.untiltheendof2015.In2016,thecapitalsecuritiesandtheirassociateddistributionshavebeenrecordedaspartofequity.Thereductioninnetfinancingcostsalsoreflectstheneteffectofanincreaseinfinanceexpenseduetohigherborrowingsandasignificantincreaseinfinanceincomegeneratedthroughourstructuredtradefinanceactivity.Trafigura’sfinancialincomeandexpenselineitemsincludeinterestoncashbalancesandloansrespectively,aswellasinterestfromcommercialoperations.
TRAFIGURA 2016 ANNUAL REPORT 11
RE
PO
RT
OF
TH
E B
OA
RD
OF
DIR
EC
TO
RS

MATSA mine near Seville, Spain.
CAPITAL ALLOCATIONAnimportantfocusfortheTrafiguraGroupinrecentyearshasbeeninvestinginindustrialandlogisticalassetsthatofferstrongsynergieswithourphysicaltradingbusiness.In2016,wereachedtheendofaperiodofintensiveinvestmentdatingbackto2012asourlargestinfrastructureinvestmentprojectswerecompletedandwestartedcommercialoperations.CapitalexpenditurewasUSD754million,significantlylowerthanthepreviousyear’slevelofUSD1,223million.In2017andinsubsequentyears,weexpectcapitalexpendituretocontinuetosharplyreduceasnofurthermajorinvestmentsofthiskindarecurrentlyplanned.
ASSETSAsat30September2016,totalassetsamountedtoUSD41,230million,anincreaseof5percentfromthefigureofUSD39,087millionatthesamedatein2015.Fixedandnon-currentassetswere2percenthigheratUSD8,528million,comparedtoUSD8,357millionayearearlier.ThevariancereflectstheneteffectofanumberofdevelopmentsincludingImpalaTerminals’investmentsinColombia,Paraguayandelsewhere,thedisposalofnon-coreassetsincludingthesale-and-leasebackofsixnewmedium-rangeoiltankersthathadbeenpreviouslypurchasedandvarious impairments to reflect the fairvalueofour fixed-assetinvestments. Equity-accounted investees rose by 9 percent toUSD3,464millionfromUSD3,168million,reflectingtheneteffectofadditionalcorporateinvestments,incomereceivedfrominvestments,disposalsandimpairments.AdditionsincludedTrafigura’scontributiontoacapitalincreasebyPumaEnergy,theequityinvestmentinthecopper smelting venture with China’s Jinchuan Group, and theinvestment inNyrstar.The impairmentwastheUSD250millionwrite-downonPortoSudestedescribedabove.
Pre-financingsandprepaymentswerebroadlysteadywithadecreaseinlonger-termpre-financingactivityoffsetbyanincreaseinprepaymentsof12monthsorlessduration.Loansreceivablewere
82percenthigherthanlastyearatUSD801million,dueprincipallytomoniesoutstandingfollowingthedisposalofourinterestintheAEMRironoreminingprojectinAngola.
Currentassetswere7percentupatUSD32,702millionfromUSD30,641millionin2015.Inventoriesrosebymorethan52percenttoUSD11,538millionfromUSD7,614millionayearearlier,reflectingthesignificantgrowthintradingvolumesduringtheyear.Ofthetotalinventoriesasof30September2016,USD7,069millionwereheldinstorageandUSD4,456millionwereintransit.InlinewithTrafigura’sriskmanagementpolicies,allstockwaseitherpresoldorhedgedatalltimesthroughout theyear.GroupequitywasUSD5,847millionasof30 September 2016, compared to USD5,658 million as at30September2015.Currentliabilitiesincludingshort-termbankborrowingswereupfromthe2015figureofUSD25,629milliontoUSD27,652million.
CASH FLOWOperating cash f low before working capital changes wasUSD1,615millionin2016,downfromthefigureofUSD1,886millionin2015.Trafigurabelievesitsfinancialperformanceisbestassessedonthebasisofcashflowbeforeworkingcapitalchanges,sincethelevelofworkingcapitalispredominantlydrivenbyprevailingcommoditypricesandpricevariationsarefinancedundertheGroup’sself-liquidatingfinancelines.CashflowfromoperatingactivitiesafterworkingcapitalchangeswasanetoutflowofUSD2,827millioncomparedwithanetinflowofUSD1,717millionin2015.InvestingactivitiesresultedinanetcashuseofUSD67millioncomparedtoanetuseofUSD2,198millionin2015.NetcashgeneratedfromfinancingactivitieswasUSD2,502millioncomparedtoUSD345millionin2015.Theoverallbalanceofcashandcashequivalentsasof30September2016wasUSD3,142million,adecreaseofUSD392millionfromthefigureofUSD3,534millionatthesamedatethepreviousyear.
12 TRAFIGURA 2016 ANNUAL REPORT
FINANCIAL REVIEW

PUBLIC RATINGSTrafiguradoesnotholdapublicratinganddoesnotseektoobtainone.Thereareanumberofreasonsforthis,includingthefactthatTrafigura’sstrategyhasalwaysbeentoobtainfundingfromstakeholderswhounderstanditsbusinessmodel,ratherthanmakeinvestmentdecisionsonthebasisofarating.Inaddition,holdingaratingcouldcauseTrafiguratotakemoreshort-termfocuseddecisionsinordertomaintainaparticularratinglevel.ThiswouldconflictwiththeGroup’sfocusonlong-termvaluecreationandmaintenanceofastrongbalancesheet.TrafigurahasbeenhighlysuccessfulinsecuringfundingwithoutapublicratingandhadaccesstooverUSD45billion,asat30September2016,increditfacilitiesfromdiversefundingsources.
FinancialdisciplineisinherenttoTrafigura’sbusinessandfinancemodelduetoitsrelianceondebtmarketsforcapitalandliquidity.Trafigura’ssignificantexpansionofitssourcesoffinancingovertheyearshasbeenachievedonthebasisoftheGroupmaintaininganacceptableandsustainablecreditstanding,consistentwithaninvestmentgradeprofile.TheGroup’sfinancialdisciplineisreinforcedbythefinancialcovenantsprovidedtoourunsecuredlendersandisunderlinedbythestrongsupportwereceivefromourbankinggroupandinvestors.
BANK FINANCINGAsaprivatelyownedcompany,Trafigurafundsitselfprimarilythroughthebankinganddebtcapitalmarkets,relyingonacombinationofdiversifiedfundingsourcesandstrongbankingrelationships.Foranumberofyearsandthroughoutvariouscommoditycyclesandfinancialmarketenvironments,Trafigurahascementedstrongrelationshipswithitslendingbanks.
Inspiteofthechallengesfacingcommoditymarkets,Trafigura’sbankinggroupremainedstableandconsisted,asat30September2016,of121banksacrosstheworld.Cyclicalityandvolatilityisacharacteristicofmanyindustries,notjustcommoditiestrading.Justaswerelyonanopendialoguewithourbankingpartnersattimesofincreasedstressorvolatilitywithinthebankingmarket,likewisebanksandinvestorsrelyonclearandcomprehensivecommunicationfromTrafigurawhenincreasedcommoditymarketvolatilitybringsnewquestionstothefore.
Assuch,Trafigurahassignificantlyanddemonstrablyincreaseditstransparencyoverthepastfewyears,withverypositivefeedbackindeedfromitsmainstakeholders.
AccesstodeepandconstantliquidityisakeyreasonforTrafigura’sleadingcompetitivepositionandweseecommunicationwithbanks,financialstakeholdersandtradingcounterpartiesasinstrumentaltomaintainingthisposition.Trafigurasourcesfundingfromanumberofmarkets:syndicatedbankloans,securitisationmarkets,bondmarketsandtradefinance.OftotalcurrentlinesofUSD45billion,thereisapproximatelyUSD14.4billionwhichremainsunutilised,ensuringresilienceduringvolatilemarkets.
As at 30 September 2016, the Group had USD8.0 billion(2015:USD7.8billion)ofcommittedrevolvingcreditfacilitiesofwhichUSD3.2billion(2015:USD3.2billion)remainedunutilised.TheGrouphadUSD2.0billion(2015:USD1.8billion)ofimmediately(sameday)availablecashinliquidityfunds.TheGrouphadimmediateaccesstoavailableliquiditybalancesfromliquidityfundsandcorporatefacilitiesinexcessofUSD5.2billion(2015:USD4.9billion).Over2016,Trafigurarefinancedbothofitsrevolvingcreditfacilities(RCFs)andSamurailoan,whichaltogetherrepresentthecornerstoneofTrafigura’sunsecuredfundingaswellasalargeproportionoftheGroup’sbankingpool.InOctober2015,TrafigurarefinanceditsAsianrevolvingcreditfacilitywhichcontinuestobesyndicatedmostlywithSouthAsian,AustralianandMiddleEasternbanksandclosedatUSD2.2billion.Aspartofthetransaction,the2014364-dayUSDandone-yearCNHtrancheswerebothrefinanced,alongwiththematuringthree-yearUSDtranchefrom2012.Twenty-eightbanksparticipatedinthetransactionofwhichsixwerenewcomerstothefacility.
TheAsianRCFclosingwasfollowedinearly2016bytherefinancingoftheEuropeanRCFwhichclosedon24March2016.ThisfacilitywaslaunchedatUSD4.3billion,andclosedsubstantiallyover-subscribedatUSD5.1billionwithatotalof45banks.
March2016wasaneventfulmonthforTrafigurawhenwealsorefinancedourSamurailoan,aJapaneseYendenominatedloanplacedwithdomesticJapanesebanks.TrafigurahasbeenaccessingtheSamurai
Crude oil vessel at Corpus Christi terminal, Texas, US.
TRAFIGURA 2016 ANNUAL REPORT 13
RE
PO
RT
OF
TH
E B
OA
RD
OF
DIR
EC
TO
RS

loanmarketsince2012andhasbeenabletoincreasethesizeofthefacilityoneachofthethreeoccasionsthatwehaveaccessedthemarket.TheMarch2016facilityreachedJPY50.5billion(USD450million),upfromJPY26billion(USD280millionathistoricalforeignexchangerates)in2014.Thedealalsoattractedninenewlenders,reachingatotallendingbankpoolof15Japanesefinancialinstitutions.
VALUE AT RISK
0.0
8.0
10.0
12.0
2.0
4.0
6.0
(USD million)
10.3
9.3
6.3
2014• 2015 2016
0.00%
0.20%
0.25%
0.05%
0.10%
0.15%
0.30%
0.19%
0.11%
0.16%
■ Average 1-day VaR 95 percent
–- % of Group equity
• 2014 based on equity as reported TBBV consolidated accounts. Basis: IFRS.
TheValueatRisk(VaR)metricisoneofthevariousriskmanagementtoolsthatTrafigurausestomonitorandlimititsmarketriskexposure.TrafigurausesanintegratedVaRmodelwhichcapturesrisksincludingcommodityprices,interestrates,equitypricesandcurrencyrates(seefurtherdetailsinNote27).During2016,average95percentonedayVaRforderivativepositionswasUSD6.3million(2015:USD9.3million)whichrepresentedlessthan1percentofGroupequity.
SHAREHOLDER STRUCTURETrafiguraisexclusivelyownedbyitsmanagementandabout600ofitssenioremployees,whoarethereforefocusedonthelong-termsuccessofthebusiness,promotingmanagementdepthandstability,andencouragingprudentriskmanagement.Thedecisionastowhichemployeesmaybecomeshareholdersisdiscretionarybaseduponmanagement’sevaluationoftheindividual’sperformance,seniorityandfuturepotential.
Trafigurahascontinuouslybuiltupitsshareholders’equitysinceinceptionin1993andtheGroupretainsprofitstofurtherincreaseitscapitalbase.Nodividendorprofitdistributionispaidotherthanthroughsharebuy-backs.Anysharebuy-backsarediscretionaryandeachbuy-backcanbedeferredindefinitelysubjecttosufficientliquiditybeingavailable/compliantwithfinancialcovenants.
LEVERAGE AND ADJUSTED DEBTAsaphysicaltradinggroup,Trafigurareliesonaspecificfundingmodel.Asaresult,onecannotapplythesamefinancialanalysisframeworkasforother,moretypicalindustrialcompanies.
Banksandratingagencieshavehistoricallyconsideredfinancialleverageafterexcludingsomespecificbalancesheetitems(e.g.inventories,securitisation),resultingintheuseofadjusteddebtasanoverallleveragemetric.TheadjusteddebtmetricrepresentsTrafigura’stotallong-andshort-termdebtlesscash,deposits,readilymarketableinventories,debtrelatedtotheGroup’ssecuritisationprogrammeandthenon-recourseportionofloans.ThismetricisabettermeasureoftheGroup’sfinancialleveragethanasimplegrossdebtmetric.Inparticular,thefollowingadjustmentsaremade:
• The securitisation programme is taken out on the basis it is anentirelydistinctlegalentityfromTrafigurawithnorecoursetotheGroup and is only consolidated into the financial statements inaccordancewiththeGroup’saccountingrules.
• Cashandshort-termdepositsaredeductedfromdebt.
• Pre-soldorhedgedstock isdeducted fromdebt.This reflects thegreat liquidity of the stock and the ease at which this could beconvertedtocash.Aspreviouslydescribed,Trafigura’spolicyistohave100percentofstockhedgedorpre-soldatalltimes.
• Non-recourseinvoicediscountingsorportionofloans(forexamplenon-recourse portions of bank financings used to extendprepaymentstocounterparties)aredeductedfromdebt.
Asat30September2016theratioofadjustednetdebttoGroupequitystoodat1.48x,downfrom1.56xat30September2015.Thebuild-upofourfixedassetsandinfrastructureportfolio,initiatedin2012andnowcomplete,hadweightednegativelyonthisratio.Wearenowinaprocessofde-leveringourbalancesheetbypursuingmultipleinitiatives,suchasdisposingofnon-coreassetsandcommittingtosignificantlyreducingourcapexprogrammeovertheyearstocome.Wearethuscommittedtocontinuingtoreducetheratioin2017.
TRAFIGURA ADJUSTED DEBT
0,000
4,000
5,000
1,000
2,000
3,000
6,000
7,000
(USD million)
9,000
8,000
7,26
4
8,8
46
5,55
7
5,65
8
8,6
60
5,8
47
2014• 2015 2016
■ Adjusted total debt ■ Group equity (inc. non-controlling interest)
–- Adjusted debt/Group equity
• 2014 based on equity as reported TBBV consolidated accounts. Basis: IFRS.
0.00x
0.80x
1.00x
0.20x
0.40x
0.60x
1.20x
1.40x
1.60x
1.80x
1.56x
1.48x 1.31x
TAXATIONTrafiguraoperatesinamultitudeof jurisdictionsandadherestoapplicablelocalandinternationaltaxlawinthecountriesinwhichitoperates,includinglegislationontransferpricing.TheGroup’staxpolicyis topayappropriate taxaccordingtoworkcarriedout ineachjurisdiction,asdeterminedbyafunctionalanalysisofoperationsusingstandardmeasureswhereverpossible,underpinnedbyreportspreparedtofulfillocaltransferpricingrequirements.TheGroup’seffectivetaxrate–theaveragerateatwhichconsolidatedpre-taxprofitsaretaxed–variesfromyeartoyearaccordingtocircumstances,butin2016itwas10.2percent(2015:11.3percent).
OUTLOOKWeexpectchallengingconditionstopersistincommoditiesmarketsthrough2017,withpressureincreasingonproducersandotherplayerswithlargeassetfootprints.AccordinglyTrafigurawillcontinuetofocusonrunningaresilientbusinessfocusedonphysicaltrading,logisticsandriskmanagement.Aswestatedlastyear,thatinvolvesthreekeypriorities:
14 TRAFIGURA 2016 ANNUAL REPORT
FINANCIAL REVIEW

Tradefinanceispartofthelifebloodoftheglobaleconomyaswellasavitaltoolincommoditiestrading.Butthereisgrowingconcern in the banking and tradingcommunity that changes in financialregulationcouldputthatlifebloodatrisk.
ThisconcernpromptedTrafiguratocommissiontheeconomicsfirmLlewellynConsulting toproducea studyentitled
‘Trade finance and regulation: the risk of unintended consequences’.Thestudy,writtenonthebasisofinterviewswithpolicy-makers,banksandusersoftradefinance,suggeststradefinanceisoftentakenforgrantedasawell-functioningandliquidmarketdrivenbydemand.
Butithighlightshowsomeofthedetailedchangestobankingrulesnowunderdiscussionamongregulatorscouldcallthoseassumptionsintoquestion.Atworst,thepaperargues,thesechangescouldmaketradefinancemoreexpensivefortraders,producersandconsumers,andevenpromptsomeimportanttradefinancebankstoquitthemarket.
“Disruptionstotradefinance,whileinfrequent,arehighlydamagingwhentheyoccursinceoneformoranotheroftradefinanceunderpinsaround90percentofworldtrade,”theauthorsargue.“Allthedatashowsthattradefinanceisaninherentlylow-riskactivityfeaturingverylowhistoriccreditlosses,andassuchitwarrantsbeinghandledwithcare.
“Butthereisnowgrowingconcernoverthepossibilitythattradefinancecouldbeadverselyaffectedbyover-heavy,insufficientlynuancedregulation,particularlyinanarealikecommoditytradefinancewherepolicy-makersmayperceivetherisksinvolvedtobegreaterthantheyare.Inparticular,itisimportantthatseparateregulationsintheareasofcapital,leverageandliquiditydonotadduptomorethanthesumoftheirparts.”
TrafigurahasdiscussedthepaperinrecentmonthswithleadingregulatorsincludingtheEuropeanBankingAuthority,theEuropeanCommissionandtheEuropeanCentralBank.Ouraimhasbeentoimpressonthemtheneedtopayspecialattentiontotheimpactontradefinanceastheyworkwiththeirglobalpeerstofinalisethenextroundofdetailedrules.
• First,wewillensurethatourliquiditypositionremainsrobusteveninconditionsofextremevolatilityandstress.Tothisend,wehavedevelopedcloseandtrustingrelationshipswithourmanybankingpartners,anditisahighprioritytomaintainthesebydemonstratingmaximumtransparencyonallourtransactions.
• Second, we will focus intensely on maximising efficiency andminimising cost. Trading these markets will require greateragility and financial strength than ever. By the same token, theywill offer significant opportunities to those firms that navigatethemsuccessfully.
• Third, we will continue to maintain a close eye on counterpartycreditrisktominimiseriskoflossesordefaults.
Partandparcelofthisconservativeapproach,isalsotocontinuetoreducebothourleverageandourcapitalexpenditureascomparedwiththelevelsseeninpreviousyears.Itisworthreiteratingthatthiskeyconsideration also determined our approach to the landmarktransactionweareintheprocessofcompletingtoacquireasignificantminoritystakeinEssarOilLimitedofIndia.Thiswillbefinancedonanon-recoursebasis,withalimitedequitycontributionfromTrafigurathatiswellwithinourreducedcapitalexpenditurelevelfor2017.
Christophe Salmon,ChiefFinancialOfficer
Impala Terminals and Mubadala’s Porto Sudeste export facility, Brazil.
TRAFIGURA 2016 ANNUAL REPORT 15
RE
PO
RT
OF
TH
E B
OA
RD
OF
DIR
EC
TO
RS

OUR BUSINESS MODELCREATES VALUE
Our vision is of an increasingly interconnected and prosperous world in which commodities pass seamlessly from their points of origin to points of need.
WHAT WE DO
Weconnectproducersandend-usersofcommoditiesbyperformingtransformationsinspace,timeandform.Weuseourmarketknowledge,logisticsandinfrastructure:• tomovephysicalcommoditiesfromplaceswheretheyareabundanttowheretheyareindemand(space).• tostorephysicalcommoditieswhilesupplyisunusuallyhighandreleaseinventoriesattimesofhighdemand(time).• toblendphysicalcommoditiestoaltertheirqualityorgradeaccordingtocustomerspecifications(form).
Wenegotiateofftakeagreementswithoilproducers,refiners,miningcompaniesandsmelters.Weinvestinlogisticsthatimprovemarketaccessforoursuppliers.
Westorepetroleumproductsatownedandthird-partytankage.WestoremetalsandmineralsatImpalaTerminalsandthird-party-ownedfacilities.
Weblendphysicalcommoditiestoregional,marketandcustomerspecificationsinstrategicallylocatedterminalsandwarehousesaroundtheworld.
Weoperateefficient,safeandhigh-qualitylogistics.Wemovecommoditiesbybarge,truck,rail,pipelineandvesselinsupportofourcoretradingactivitiesandforthirdparties.
SOURCE STORE BLEND DELIVER
ADVANCING TRADE: HOW WE CREATE VALUE
BY MAKING MARKETS WORKWeuseourglobalnetworkandmarketintelligencetoconnectsupplyanddemandforcommoditiesandensuredeliveryintherightplace,attherighttime,totherightspecification.
BY OPTIMISING THE SUPPLY CHAINWehavedevelopedworld-leadinglogisticalcapabilitiesenablingustosource,store,blendanddeliveroilandpetroleumproducts,metalsandmineralsreliablyandefficientlyanywhereintheworld.
BY MANAGING RISKOurbusinessmodelisresilientinthemostvolatilemarketconditions.Wesystematicallyhedgepricerisksandhavecreatedsystemsandprocessesthatenableustomanageacomplexrangeofoperationalandfinancialrisks.
BY INVESTING IN INFRASTRUCTUREWehaveinvestedinhigh-qualityinfrastructurethatsupportsourtradeflows,suchasoilstoragefacilities,warehouses,portsandtransport.
BY SUPPORTING OUR CLIENTSOurstrongfinancialresourcesgiveusthecapacitytoaddvalueforourcustomersthroughintegratedsolutionsincorporatingtrading,finance,infrastructureinvestmentandriskmanagementinthephysicalcommoditysector.
BY ACTING RESPONSIBLYWearecommittedtooperatingandgrowingourbusinessinaresponsibleandsustainableway.Responsibletradedriveseconomicandsocialprogress.
Transformationsinspace,timeandform
16 TRAFIGURA 2016 ANNUAL REPORT
BUSINESS MODEL AND STRUCTURE
OIL AND METALS PETROLEUM AND PRODUCTS MINERALS TRADING TRADING
FREIG
HTWETGROUP
DT
IMPALATERMINALS
FREIGHT
DRY
GROUPMINING
**GALENA
Private equity
Owned mines
advisoryTechnical
Credit
Tim
e ch
arte
r
terminals
Ports and
logistics
Multim
odal
Transport assets
Trading
Shipping
Investments
Ow
ned vessels
Voyage charterTime charter
Joint venture
mines
Infrastructure
Voya
ge c
hart
er
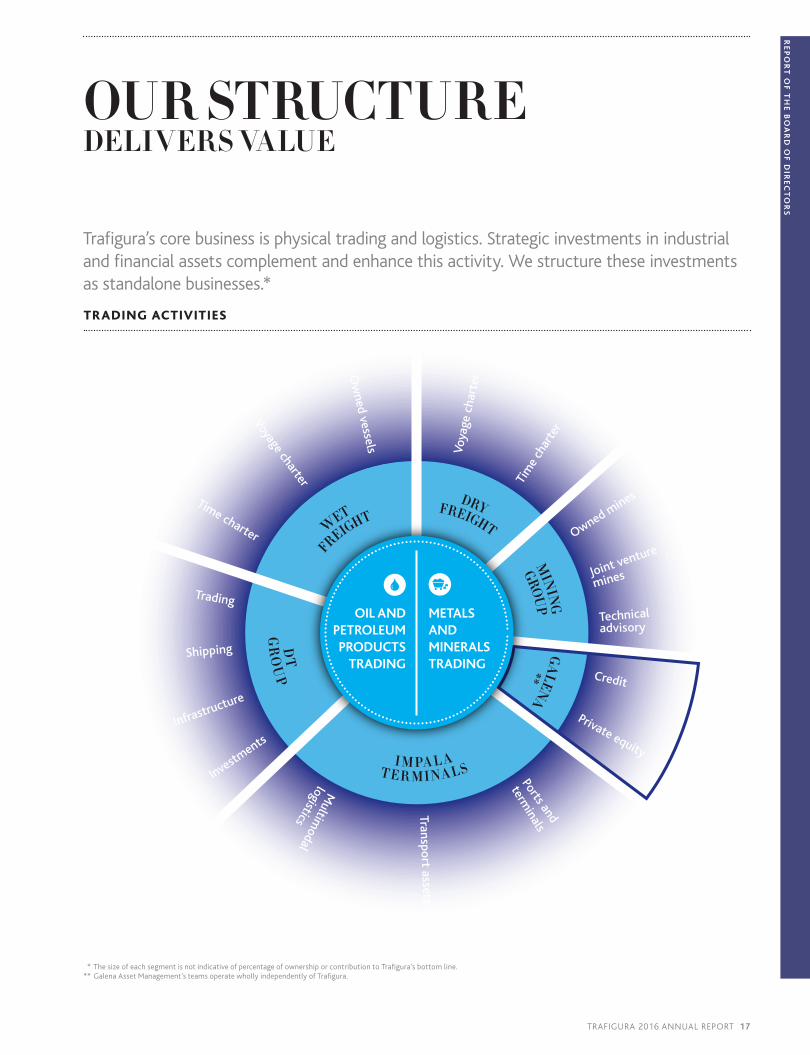
OUR STRUCTUREDELIVERS VALUE
TRADING ACTIVITIES
*ThesizeofeachsegmentisnotindicativeofpercentageofownershiporcontributiontoTrafigura’sbottomline.**GalenaAssetManagement’steamsoperatewhollyindependentlyofTrafigura.
Trafigura’s core business is physical trading and logistics. Strategic investments in industrial and financial assets complement and enhance this activity. We structure these investments as standalone businesses.*
TRAFIGURA 2016 ANNUAL REPORT 17
RE
PO
RT
OF
TH
E B
OA
RD
OF
DIR
EC
TO
RS
HIGHLIGHTS
• SalesvolumesofoilandpetroleumproductsinAsiagrowby80percent.
• Fueloilvolumesmorethantripleonlastyear.
• LNGvolumestradedincreaseby53percent.
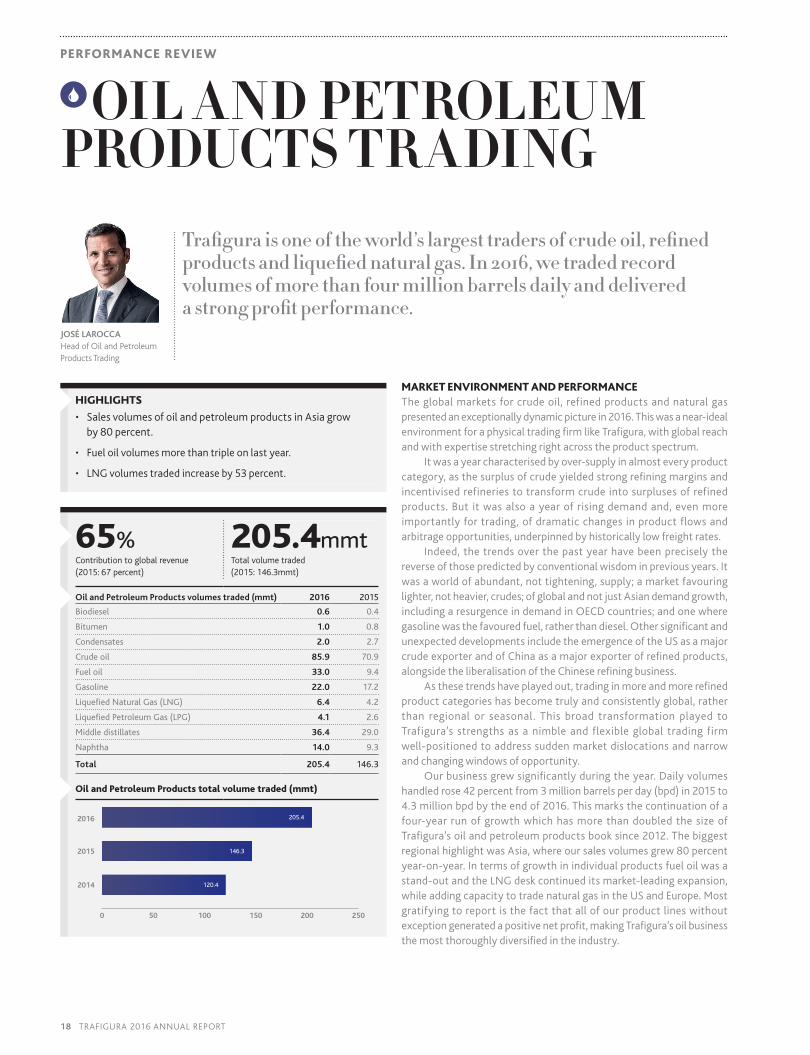
65% 205.4mmtContributiontoglobalrevenue(2015:67percent)
Totalvolumetraded(2015:146.3mmt)
Oil and Petroleum Products volumes traded (mmt) 2016 2015
Biodiesel 0.6 0.4
Bitumen 1.0 0.8
Condensates 2.0 2.7
Crude oil 85.9 70.9
Fuel oil 33.0 9.4
Gasoline 22.0 17.2
Liquefied Natural Gas (LNG) 6.4 4.2
Liquefied Petroleum Gas (LPG) 4.1 2.6
Middle distillates 36.4 29.0
Naphtha 14.0 9.3
Total 205.4 146.3
Oil and Petroleum Products total volume traded (mmt)
2014
2015
2016
0 50 100 150 200 250
205.4
146.3
120.4
MARKET ENVIRONMENT AND PERFORMANCETheglobalmarketsforcrudeoil,refinedproductsandnaturalgaspresentedanexceptionallydynamicpicturein2016.Thiswasanear-idealenvironmentforaphysicaltradingfirmlikeTrafigura,withglobalreachandwithexpertisestretchingrightacrosstheproductspectrum.
Itwasayearcharacterisedbyover-supplyinalmosteveryproductcategory,asthesurplusofcrudeyieldedstrongrefiningmarginsandincentivisedrefineriestotransformcrudeintosurplusesofrefinedproducts.Butitwasalsoayearofrisingdemandand,evenmoreimportantlyfortrading,ofdramaticchangesinproductflowsandarbitrageopportunities,underpinnedbyhistoricallylowfreightrates.
Indeed,thetrendsoverthepastyearhavebeenpreciselythereverseofthosepredictedbyconventionalwisdominpreviousyears.Itwasaworldofabundant,nottightening,supply;amarketfavouringlighter,notheavier,crudes;ofglobalandnotjustAsiandemandgrowth,includingaresurgenceindemandinOECDcountries;andonewheregasolinewasthefavouredfuel,ratherthandiesel.OthersignificantandunexpecteddevelopmentsincludetheemergenceoftheUSasamajorcrudeexporterandofChinaasamajorexporterofrefinedproducts,alongsidetheliberalisationoftheChineserefiningbusiness.
Asthesetrendshaveplayedout,tradinginmoreandmorerefinedproductcategorieshasbecometrulyandconsistentlyglobal,ratherthan regionalor seasonal.Thisbroad transformationplayed toTrafigura’sstrengthsasanimbleandflexibleglobaltradingfirmwell-positionedtoaddresssuddenmarketdislocationsandnarrowandchangingwindowsofopportunity.
Ourbusinessgrewsignificantlyduringtheyear.Dailyvolumeshandledrose42percentfrom3millionbarrelsperday(bpd)in2015to4.3millionbpdbytheendof2016.Thismarksthecontinuationofafour-yearrunofgrowthwhichhasmorethandoubledthesizeofTrafigura’soilandpetroleumproductsbooksince2012.ThebiggestregionalhighlightwasAsia,whereoursalesvolumesgrew80percentyear-on-year.Intermsofgrowthinindividualproductsfueloilwasastand-outandtheLNGdeskcontinueditsmarket-leadingexpansion,whileaddingcapacitytotradenaturalgasintheUSandEurope.Mostgratifyingtoreportisthefactthatallofourproductlineswithoutexceptiongeneratedapositivenetprofit,makingTrafigura’soilbusinessthemostthoroughlydiversifiedintheindustry.
JOSÉ LAROCCAHeadofOilandPetroleumProductsTrading
Trafigura is one of the world’s largest traders of crude oil, refined products and liquefied natural gas. In 2016, we traded record volumes of more than four million barrels daily and delivered a strong profit performance.
OIL AND PETROLEUM PRODUCTS TR ADING
18 TRAFIGURA 2016 ANNUAL REPORT
PERFORMANCE REVIEW

ThekeyeventsoftheyearweretheendoftheUSbanoncrudeexportsinDecemberandtheemergenceofChineseprivate-sectorrefinersasinternationalplayers,inthefirstinstanceaspurchasersofcrude.InbothcasesTrafigurawasattheleadingedge.WebuiltonourstrongmarketpositioninsouthernUSshalefieldsandourunrivalledaccesstoinfrastructureintheUS,EuropeandfurtherafieldtoexportsignificantvolumesofUScrude.WealsobuiltstrongrelationshipswiththeChineserefinersinadditiontothestate-ownedoilmajors,andgrewourChinesebusinesssignificantly.
Theyearsawustakingouroriginationbusinesstoanewlevelfeaturingincreasedgeographicalandproductdiversification.OurpurchasesincreasedsignificantlyfromRussia,NorthAmericaandtheMiddleEastamongotherregions,thankstostrongrelationshipswithproducers.WehavealsodevelopedanincreasinglystrongsetofcommercialrelationshipswithrefinersintheUS,EuropeandAsia.WedevotedconsiderableefforttostrengtheningourbusinessdevelopmentteaminIndiainordertocapitaliseonincreasingpaceofgrowthinIndianoildemand.
Twoimportantstrengthsofouroperationin2016,asinpreviousyears,were thequalityofourpeopleandourcultureofglobalcollaborationandteamwork–bothwithinandbetweenindividualtradingdesks.Wesawsignificantprogressionofkeytalenttoleadershippositions,drawingonourdeepbench-strengthanddevelopingthenextgenerationofseniormanagers.Thesemovementshavehelpedfosteranenvironmentinwhichthecollectiveresultisofparamountimportance,andwherecommunicationandinformationsharingbetweentradinghubsindifferentregionsareincentivised.Trafiguraseesthiscultureasasignificantcompetitiveadvantage.
Lookingahead,weexpectcrudeandproductmarketstocontinuetostrugglewithover-supplyandpricestoremainvolatile,withsentimenttornbetweenbearishfundamentalsandOPECeffortstoputafloorunderthecrudemarket.ItremainsunclearwhateffecttheagreementbytheproducercartelinDecembertolimitproductionwillhaveonthemarketin2017,towhatextentoutputwillinrealitybecurbed,andthereforewhenthemuchanticipatedbalancingofthemarketandcommencementofstockdrawdownswilloccur.
Wewillcontinuetofocusonbeingconstantlyalivetorapidchangesinthemarketandbestpositionedtoidentifynewtradingopportunities.InparticularwewillbelookingtostrengthenourpositionfurtherinkeygrowthmarketssuchasIndiaandChinaandtoenhanceourrelationshipswiththeworld’srefiners.
CRUDE OILThedominantstoryintheglobalcrudemarketin2016wasoneofover-supplyandacontinuedbuild-upofstocksdespiteoutputdeclinesinsomekeyproductioncentressuchastheUS.SaudiArabia’s2015decisiontomaintainproductioninordertowinbackmarketsharecontinuedtoplayout.Iran’sreturntointernationalmarketsfollowingthepartialliftingofsanctionsaddednewsupplies,asdidtheendingoftheUSbanoncrudeexports.Strongrefiningmarginsformuchoftheyearkeptdemandstrong,thoughtheyerodedsomewhatinthesecondhalfpromptingsometrimmingofrefineryruns.Asaresult,themuch-anticipatedbalancingofthemarketandcommencementofstockdrawdownsremainedelusiveatyear-end.OPEC’sprotracteddiscussionsoncurbingproductionremainedawildcard,butthepracticalimplicationsofthecartel’sDecember
Crude oil vessel at Corpus Christi terminal, Texas, US.
TRAFIGURA 2016 ANNUAL REPORT 19
RE
PO
RT
OF
TH
E B
OA
RD
OF
DIR
EC
TO
RS

agreementtoestablishaproductionceilingwillonlybecomeclearasthemarkethasthechancetoassesscompliancewiththeproposedoutputcutsinthecomingweeksandmonths.
AgainstthisbackdropTrafigura’scrudeoiltradingteamhadanotherstrongyear,featuringincreasedvolumes,intenseactivityinallimportantpricingcentres,andsustainedprofitabilityaftertherecordperformancein2015.Thefallintankerratestohistoriclowshelpedtoincentiviseincreasedglobalarbitragebusiness.Atthesametimewecontinuedtobuildouralreadystrongcustomerrelationshipsamongproducersandrefinerstoincreaseaccesstoandplacementofbarrels.Russiancruderemainedanimportantcomponentofthebook,thankstoourdevelopingcommercialrelationshipwithRosneft.AhighlightoftheyearwastheperformanceofourUSbusinessandthedevelopmentofEuropeanrefiningtotakeUSexportedcrude.ThiswascomplementedbyourunrivalledaccesstoportandstorageinfrastructureinCorpusChristi(Texas),StJames(Louisiana),MilfordHaven(UK)andAshkelonandEilat(Israel).WemaintainedvolumesgatheredfromtheEagleFordshaledespitedecliningproductionandaddednewbarrelsfromthePermianbasinfurtherinland.InconsequencewewereabletotakealeadingpositionintherevivedUScrudeexporttrade,shippingregularcargoestorefineriesinEuropeandbeyond.
Onthedemandside,themostimportantdevelopmentswereinChina,wherewesawincreasedbusinesswiththestate-ownedoilcorporationsandasurgeinpurchasesbyprivate-sectorrefineriesnewlylicensedtoimportcrude.Theserefineriesconstitutedanimportantnewmarketandwe reinforcedour team inChina toestablish strongrelationshipswiththem,viaadedicatednewofficeinQingdao.
Lookingforward,weexpectavolatilecrudemarkettocontinuetooffersignificanttradingopportunities.Inamarketthatwillremainhighlycompetitive,ourcompetitivestrengthsareouraccesstoglobalinfrastructure and our culture of efficient communication andinformationsharingbetweenthedifferentpricingcentres,whichbetweenthemgiveustrulyglobalreach.OurprioritieswillincludeworkingtoextendourpresenceinarbitrageflowsfromtheUSandLatinAmericaintoAsia.Havingbuiltastrongoriginationstructure,wearelookingtodevelopevencloserrelationshipswithrefineriesinordertoincreaseourcoverageofthemaincrudeshorts.
GASOLINETheglobalgasolinemarketpresentedanumberofchallengesin2016,ofwhichthemostnotablewasagrowingsurplusofsuppliesandbuild-upofstocks.Refinerymarginswerestrongformuchoftheyearonthebackoftheover-suppliedcrudeoilmarket,incentivisingincreasedgasolineproduction.Refineriesaddedtotheglutbyswitchingyieldsinfavourofgasolineattheexpenseofdieselinthefirstquarter.ThesurpluswasfurtherexacerbatedbyasharpincreaseingasolineexportsfromChina.Inconsequencegasolineremainedinalowflatpriceenvironmentformuchoftheyear.ThishadthepositiveeffectofstimulatinghealthydemandgrowthinkeyconsumptionmarketssuchastheUSwheredemandgrewbetween2and3percentyear-on-year,butdemandwasstillinsufficienttoabsorbadditionalsuppliesandeveninthepeaksummerseasonmarketstructuresremainedweak.
Fuel storage at Corpus Christi terminal, Texas, US.
20 TRAFIGURA 2016 ANNUAL REPORT
PERFORMANCE REVIEW

Trafigura’sgasolinetradingbookremaineddynamicthroughouttheyearandturnedinastrongperformancewithincreasedvolume.Keystrengthsinthisvolatilemarketwereourlargestoragefootprintaroundtheworldandourcarefullymanagedglobalsystemofphysicalshortpositionscentredonthirdpartiesandthetradingrelationshipwithdownstreaminvestment,PumaEnergy.OneofourtopprioritieswasgrowingmarketsEastofSuez.WebuiltourpresenceinbothChinaandIndia,shiftedsomekeypersonneltohubswithespeciallyhighgrowthpotentialsuchasSingapore,andsignificantlyincreasedphysicalvolumesintherapidlyevolvingFarEastmarket.InadditionweshiftedthefocusofourUSactivitytowardstheEastCoastinordertomaximiseourexposuretoincreasingUSgasolineconsumption.Bothoftheseexamplesstemfromourbeliefinaglobalportfolioandthereforesolid,stablestrengthofearningsinanevolvingglobalmarket.Wecontinuedtodevelopstrategicrelationshipswithkeyproducersandconsumers,consciousoftheneedtoaddvalueforproducersthatincreasinglymarkettheirownproductandtoprovidetop-levelserviceandperformanceforconsumers.
Lookingahead,theforwardcurveofrefinerymarginssuggestswewillseeincreasingpressureontherefiningsectorin2017.Thekeyquestioninassessingtheprospectsforsupplyanddemandishowtheglobalcrudeoilbalanceplaysoutandwhetherrisingcrudepriceswillcompress refining margins and lead to run cuts. Another keydevelopmentistheglobaltrendtowardslow-sulphurfuelastheUSshiftstoa10ppmstandardfromJanuary2017.Weexpectthistohaveastrongimpactonflowsandvaluationsandbelievewearewellpositionedtobenefit.
FUEL OILTheglobalfueloilmarketcontinuestoexperiencesignificantchangesinsupplyanddemanddynamics,andoveralltightenedin2016,inlargepartduetoadecreaseinRussianexports.Themarketrecentlytradedintobackwardationdespiteotheroilmarketsremainingincontango,reflectingtheimprovingfundamentals.
Trafigura’sfueloiltradingteamsethighexpectationsfortheyearbothintermsofvolumegrowthandprofitability.Itachieveditstargets,growingvolumesfourfoldandhiringanumberofadditionaltraderstocapitaliseonexpandingopportunities.Theteamhasbuiltaneffectiveglobalarbitrageculture,asignificantandsustainablefeedstocksbusiness,andisdevelopingclosertiestoend-usersinthebunkermarket.Russia,Singapore,theArabianGulfandUSWestCoastweresignificantgrowthareaswhilewestruggledtoachieveourgoalsintheCaribbeanmarket.
Lookingforward,wecontinuetoseenewopportunities.Althoughfueloilisadecliningproductoverall,givenimprovingefficiencyintheglobalshippingfleetandafocusinrefiningonhigher-valueproducts,wearestillseeingsomenewsourcesofdemand,notablyinpowergenerationwherefueloilcanoffermorecompetitivelogisticsthanLNGandcoalincertainlocations.Weexpectthemarkettoremaintightin2017astheglobalrefiningindustrycontinuestoupgradeandthusproducelessfueloil.Ourfocuswillbetoconsolidateourbusinessafterayearofrapidgrowthandensurewecapturethefullvalueofourmarketposition.
MIDDLE DISTILLATESThemostsignificantchangeshapingglobalMiddleDistillatesmarketsin2016wasChina’sprogresstowardsimplementingalow-sulphurfuelstandard.China,whichhashistoricallyallowedsulphurcontentofupto500ppm,isduetoreducethisto10ppminJanuary2017.ToprepareforthischangetheChineseoilmajorshavebeenprogressivelyupgradingtheirrefineriesinthelast18monthstoproducelower-sulphurfuelwithincreasingconsistency.
ThenewstandardissimilartothoseinEuropeandotherwesternmarkets, and the result of the change, together with a dip inmanufacturingdemandinChina,hasbeentocreateanexportablesurplusofdieselwhichaddedtoglobalover-supply.Overallglobaldemandwassteadyduringtheyear.InIndia,ahotsummercausedaspikeinconsumptionandareductioninexports,whileIndonesiamovedfromnetimportertobalanced.
ForTrafigura,thesedevelopmentsplayedtoourstrengthsbyturningwhathadbeenalargelyregionallow-sulphurbusinessfeaturingseasonalarbitrageopportunitiesintoatrulyglobalmarketyearround,inwhichourglobalarbitragemodelcanoperatetobesteffect.Trafigura’sMiddleDistillatesteamisatop-threeplayer,operatingaglobalnetworkwhichcanreactquicklytoshiftsinsupplyanddemandfromourhubsinSingapore,GenevaandHouston.
OurresponsetotheemergenceofsignificantChineseexportswastoaddtradingstrengthinSingaporeandtoleaseadditionalstoragecapacityinAsiainthefirsthalfofthefinancialyear,whenthemarketwasinsteepcontango.Volumehandledbythedeskgrewbymorethan25percentyear-on-year,withexportsfromChinaandincreasingflowsfromRussiamakingupsignificantpartsoftheincrease.Thegrowthintradeandmarginswerealsosignificantlysupportedbytheweakstateoffreightmarkets.
Overthecomingyearweexpectthemarkettoremainover-supplied,asexportsfromChina’sprivaterefineriesprogressivelyaddtotheflowfromthestate-ownedoilmajors.Demandwillalsogrow,drivenbyurbanisationindevelopingcountries,whilelowfreightcostswillcontinuetoprovidesupport for thebusiness.We intendtopayincreasingattentioninthecomingmonthstobuildingourpositioninjetfuel,buildingonthesignificantfootprintestablishedinthismarketbyPumaEnergy.
NAPHTHATrafiguraistheworld’sleadingindependentnaphthatraderandgrewvolumestoanall-timehighin2016,a50percentyear-on-yearincrease.TheglobalmarketwasdrivenbyasignificantreductioninAsiannetarbitragedemand–thefirstreductionofthenetAsiannaphthashortinmorethanfiveyears–asaresultofstructuralchangesintheAsianpetrochemicalsandrefiningbusiness.TheseincludedthegrowthofLPGasacompetingfeedstockinthepetrochemicalcomplex,increaseddomesticsuppliesfromChineserefineries,andnewproductioncomingonstreamfromsplittersinnorth-eastAsia,SingaporeandtheArabianGulf.
Withtheeastabsorbingsignificantlylowervolumes,westernmarketswerelong,butrisingwesternconsumptionofgasolinedroveincreaseduseofnaphthaasablendingcomponentthathelpedtoabsorbthesurplus.TheAmericasbecamemoreofaself-containedregionalmarketasnaphthaproductionfromUSshaleformationsplateaued,anddecreasedincertainregions.Thesevolumeswentintogasolinedemandandotherregionalapplications.
ThesechangingtradepatternsplacedapremiumonteamworkbothwithinournaphthadeskandwithotherTrafiguratradingteams.Ournaphthatradersworkedespeciallycloselywiththegasolinedeskinordertounderstandandreactnimblytochangesintherelativevalueofdifferentblendingcomponents.WealsoaddedtradingcapacityinHoustoninordertoderivemaximumbenefitfromthecontinuingexpansionofour footprint in southTexas,whereTrafigurahasthroughputrightsanda20percentstakeinBuckeye’sCorpusChrististorageandexportterminal.
TRAFIGURA 2016 ANNUAL REPORT 21
RE
PO
RT
OF
TH
E B
OA
RD
OF
DIR
EC
TO
RS

Lookingforward,weexpectnaphthatocontinuetolosegroundinthepetrochemicalcomplextootherfeedstockssuchasLPGandethane,withnewethanecrackerscomingonlineintheUSandelsewhere.Keytosuccesswillbefindingwaysofmaximisingotherusesofnaphthaintogasolineblending,splitting,orasadiluentforcrudeoil.Ourstrategywillthereforefocusonensuringmaximumintegrationwithinourteam,tobethefirstmoveronchangesinarbitrageflow,aswellasonworkingwithotherdeskswithintheOildivisiontomaximisetherelativevalueofproductsacrossthenaphtha/gasoline/condensate/crudeoilspace.
CONDENSATETrafiguramaintaineditsstatusasoneoftheleadinginternationalcondensatetradersin2016,capitalisingonstrongrelationshipswithwesternsuppliersandeasternend-usersandsupplyingAsianmarketsfromsourcesasdiverseastheUSGulf,WestAfrica,EuropeandLatinAmerica.Globaldemandforcondensatesisrising,withsplittingcapacityinAsiashowingespeciallystronggrowth.Butwechosetofocusonimprovingmarginsduring2016onthebasisofthestrongmarketpositionwehavealreadyachieved,ratherthanfurthergrowingvolumes.
ThedynamicsofthecondensatemarketchangedradicallyduringtheyearasaresultofthevotebytheUSCongressinDecember2015toendthe40-year-oldbanoncrudeoilexports.Priortothisdecision,exportingcondensatefromtheUS–whilepossible–wasadifficultundertakingbecauseoftheneedtodemonstratethatanexportcargocontainednocommingledcrudemolecules.Whenthebanwaslifted,crudeandcondensatebecameessentiallyinterchangeableinexportmarkets.Trafigura,with itssignificantposition ingatheringand
transportingcondensatefromtheEagleFordshaleinTexasandwithitsstakeintheCorpusChristisplitter,waswellplacedtobenefitandduring2016becamethefirstcompanytobookaVeryLargeGasCarrier(VLCC)carryingEagleFordcondensatetoAsia.
Keytothecondensateteam’ssuccessisstrongandtransparentrelationshipswithourlong-termcustomers.Weareworkinginmanynichemarkets,andsuchcommunicationallowsustobethefirstmoveronmanyopportunities.Weexpectthedynamicconditionsseenin2016topersistoverthenextyear,withthecontinuingincreaseinAsiansplittercapacityfurtherenhancingeast-westarbitrageopportunities.
LNGTheglobalLNGmarketcontinueditsrapidexpansionin2016.PricesenhancedthecompetitivenessofLNGasafuelforpowergenerationanddroveabroad-basedincreaseindemand,notablyinEgypt,Pakistan,IndiaandChina.Onthesupplyside,someimportantproductionprojectstooklongerthanexpectedtocomeonstreamandsomeexistingfacilitiesexperienceddifficulties.
Atthesametimethegrowthinliquidityobservedinthepasttwoyearsacceleratedatapacefasterthanmanyhadexpected.Moreandmoremarketparticipantsnowrealisethatmarketliquidityisasolidbasisforsecurityofsupply,creatingavirtuouscircleofincreasingconfidenceandincreasingparticipationinthespotmarket.Although,disappointingly,thegrowthinliquidityhastodatenotenabledthecreationofawidely-usedpricebenchmarkforhedgingpurposes,wecontinuetobelievethisisjustamatteroftime,andthelaunchofanLNGindexbySingapore’sSGXexchangewasapromisingstepinthisdirection.
The Golar Ice and Golar Crystal conducting an open water ship-to-ship transfer of LNG in Gibraltar. Both vessels were under Trafigura control during this operation.
22 TRAFIGURA 2016 ANNUAL REPORT
PERFORMANCE REVIEW

Trafigura,whichestablishedaleadingpositioninLNGtradingthreeyearsago,continuedtogrowitsbusiness,witha53percentyear-on-yearexpansion involumesandan increasedprofit.ThetradingteamexpandedfromitsexistingbasesinGenevaandHoustontoSingapore.InEuropeandtheUS,wehiredadditionaltraderstostartaregionalnaturalgastradingbusiness.TheintentionistoestablishasustainablephysicalgasbusinessinEuropeandtheUS,creatingsynergieswherepossiblewiththeLNGbookasenergymarketliberalisationcontinuesandLNGandnaturalgasmarketsconverge.
Inanotherinnovationduring2016,TrafigurahaslaunchedanLNGinfrastructurebusiness.Weexpectthatlowercost,modularandflexibleinfrastructurewillprovideapowerfulsupportforourtradingbusinessasinfrastructureassetshaveforotherTrafiguratradingdeskssincethecompany’sinception.
Overthecomingmonths,weexpectafurtherincreaseinglobalLNGsupplieswithpricesthatwillstimulatenewdemand.Ourprioritieswillbetocapturenewvolumes,optimiseourinfrastructureportfolioandcontinuetobuildournaturalgasbusinessforlong-termsuccess.
LPGTheglobalLPGmarketprovidedachallengingbackdropfortradingin2016owingtoalackofarbitrageopportunitiesinpropane.Inparticular,theeconomicsofsupplyingLPGfromtheUStoeasternmarketsweredifficultformuchoftheyear.
However,theTrafiguraLPGteamsucceededbothingrowingvolumesandmaintainingprofitabilityonthenewbusiness.Flowshandledgrew58percentyear-on-yearwhilemarginsremainedsteady,thankstoacombinationofnumerousnewbusinessrelationshipsandcreativeworkinoptimisingourportfolio.KeygrowthareasincludedAsia,AfricaandLatinAmerica.ThedeskwasparticularlypleasedtohavemaintainedflowsunderchallengingconditionsinChinaandVenezuela,andtohavecapturednewmarketsinEastandWestAfrica.
Tradingbenefitedoverallduringtheyearfromafallinfreightrates,resultingfromasubstantialincreaseintheglobalfleetofVLCCsinrecentyears.Ontheotherhand,managingfreightpositionsinthismarketwasnotalwaysstraightforward.Similarly,thechallengingmarketconditionsinsomekeyterritoriesledtoanincreasedfocusoncreditissues,andanincreasedemphasisonprovidingfinancialsolutionstoclientsaspartofourcommercialoffer.
Ourfocusin2017willbetocontinuegrowingthebookintermsofprofitabilityandvolumes–notleastbymaintainingthemarketscapturedin2016.Weexpectthattoentailofferingourclientsinnovativesolutionsinmarketsthatwillremainchallenging.
BIODIESELBiodieselremainedachallengingmarketin2016,withlowoilpricesessentiallyeliminatingthepotentialfordiscretionaryblendingofbiodiesel.UncertaintyconcerningregulatorymattersintheUSandEurope–rangingfromUStaxpolicyandrenewablefuelvolumerequirementstoEuropeanUnioncountervailingdutiesonvariousbiodieselimports–createdadditionalcomplicationsforthebusiness.Thecommitmentofconsumersandregulatorsaroundtheworld,however,isunwaveringincallingforincreasedpenetrationofrenewablefuelsasasourceoflow-carbonintensityenergy.Inresponsetothisenvironment,Trafiguramaintainsexpertisetoevaluateandactonmarketmovementsastheyoccur.
DT GROUP
$2.0bn $1.6bnTotalassets(2015:USD1.8billion)
Salesrevenue(2015:USD3.9billion)
DTGroupisa50-50businessventurebetweenTrafiguraandAngolanmanagementandinvestmentfirmCochan,focusedprincipallyontheAngolanmarket.ItleveragesthemarketcapabilitiesandfinancialstrengthofTrafigurawiththe localknowledgeandnetworksofCochan.
In2016,theAngolaneconomycontinuedtosufferfromtheimpactoflowoilprices.ButtheGovernmentmadeheadwayinstabilisingtheoveralleconomicsituationandlaunchedasignificantrestructuringofthenationalenergysector.DTGroupfocuseditsactivitiesduringtheyearonitscoretradingandshippingactivities.TradingentitiesDTSRefiningandDTSCommercialcontinuedtotraderefinedpetroleumproductssuchasgasoil,bitumenandjetfuelwithstateenergycompanySonangol.DTShippingcontinuedtochartervesselstoSonangolDistribuidora.InadditionourspecialistunitDTAgrosoughttodevelopitscommercialfarmingoperation,demonstratinghowmoderntechnologyandtechniquescanimproveyieldsingrowingfruitandvegetables.
In2014-15DTGroupconsolidateditsbusinessinAngola,withdrawingfromanumberofprevious linesofactivityandrefocusingoncoreactivities.Inthecomingyearweintendtomaintainthisfocus,basedonaclosecommercialrelationshipwithSonangolandonpartnershipwiththeAngolansubsidiaryofPumaEnergy,Pumangol.
Forfurtherinformationpleasevisitwww.dtsholding.com
TRAFIGURA 2016 ANNUAL REPORT 23
RE
PO
RT
OF
TH
E B
OA
RD
OF
DIR
EC
TO
RS

METALS ANDMINER ALS TR ADING
AMIN ZAHIRGlobalHeadofRefinedMetalsandConcentrates
JULIEN ROLLANDGlobalHeadofCoalandIronOre
Trafigura is one of the world’s largest metals and minerals traders. Despite challenging conditions, the division continued to grow, trading 59 million tonnes in total.
HIGHLIGHTS
• Trafiguramaintainsitspositionasmarketleaderinconcentratesandrefinedmetals.
• Volumestradedincreaseby13percent.
35% 59.0mmtContributiontoglobalrevenue(2015:33percent)
Totalvolumetraded(2015:52.1mmt)
Metals and Minerals total volume traded (mmt) 2016 2015
Non-ferrous metal concentrates 8.2 7.6
Non-ferrous refined metals 6.6 5.2
Coal 37.8 35.3
Iron ore 6.4 4.0
Total 59.0 52.1
Metals and Minerals total volume traded (mmt)
2014
2015
2016
0 2010 30 40 50 60
44.114.9
39.312.8
11.3 37.8
Metals Minerals
STRATEGY AND PERFORMANCETheglobalmetalsandmineralssectorsawaperiodofcontinuedtransitionandfluxin2016.Asageneralthemethe‘newreality’ofaslowingChineseeconomyandresultingdecreaseinconsumptionhasdramaticallyreshapedtheoutlookforproducers.Insomecasesithasalreadyledtoprimaryproductioncuts;inothers,furtherdownwardpricepressurewillberequiredtobringabouttheneededmarketadjustment.
ThepastyearhasbeenchallengingformanyindustryparticipantssoitwasparticularlyencouragingtoseethevolumesacrossourMetalsandMineralsTradingDivisiongrowby13percentto59.0milliontonnesfrom52.1millionin2015.
ThisgrowthisacontinuedtestamenttoTrafigura’scorestrategy.Weseektodifferentiateourselvesfromourcompetitorsbyofferingourbusinesspartnersinnovativesolutionsthatutiliseourvariousstrengthsinoperations,logistics,creditandfinance–allsupportedbyatrulyglobalpresence.
Althoughwedohaveassetswithpriceexposures,theseexposuresareminimalwithinthescopeofourtradingactivities.Asaresultofthiswecanoperatewithgenuineindependenceandhavegreaterflexibilitytofocusandprioritisetheinterestsofourbusinesspartners.
Asweapproach2017weseemanyheadwindsfacingthemetalscomplexandwithin thisenvironmentwehope to further forgelong-termpartnershipswithproducersandprocessorsformutualbenefitandgrowth.
COPPER CONCENTRATESTheglobalcopperconcentratesmarketfeaturedincreasesbothinminesupplyandinsmelterdemand,withthecontinuedramp-upofnewminingprojectssuchasLasBambas,CerroVerdeandToromochoinPeruandthecommissioningofseverallargenewChinesesmelters.Theresultwasamarketthatwasbroadlybalanced,withvolatilitystrongerinthefirsthalfthanthesecond.Thegrowthinmineproductionandsmeltingdemandwasevidentviaa94percentyear-on-yearincreaseinPeruvianconcentrateexportstoChinawhichstillremainsbyfarthelargestsourceofsmeltingdemandandtheonlycountrywithnewgreenfieldsmelters.AnotherpromisingstepwasthewiderimplementationoftollingbooksforChinesecoppersmeltersallowingthemtoexportrefinedcopperandsilverbullionwithoutincurringapricingbiaswhichshouldimprovetheliquidityinsomenichesegmentsofthemarket.
24 TRAFIGURA 2016 ANNUAL REPORT
PERFORMANCE REVIEW

Trafigura’scopperconcentratestradingdesk,whichistheglobalmarketleader,exceededitstargetsfortheyearandincreasedvolumeshandledaswellascontributiontonetprofityear-on-year.Wehaveastrongpositionsupportedbyworld-classinfrastructureinPeru,MexicoandSpainandstrongrelationshipsasakeyrawmaterialsupplierandoverallserviceprovidertominersandsmeltersalike.
ThecommissioningofthenewImpalaTerminalslogisticsfacilityintheSpanishPortofHuelvahasallowedthedesktodiversifyitsmarketingservicestominesintheAndaluciancopperbelt,whilegivingussignificanttradingflexibilitybothwithinEuropeandintoAsia.OurinvestmentwithJinchuanintheFangchenggangsmelterhasnowoperatedsuccessfullyforover12monthsandisaddingsignificantvalueforbothcompanies.
Asweconsidertheprospectsforcomingmonths,coppersmeltingstilllooksreasonablyhealthy,despitelowerpremiumsbeingreceivedforcoppercathodeandblister.Finaldemandforcopper,however,remainssubdued,andwithsmeltersstillincentivisedtobringonadditionalcapacity,webelievethereisapossibilitythatanover-supplyofmetalmayforcesomemarketcorrections.Ourpriorityforthecomingyearwillbetomaintainprofitablemarket leadershipbydevelopingcreativeandcompetitivesolutionsforourclientsinthefaceofincreasingcompetition.
ZINC CONCENTRATESTheglobalzincconcentratesmarketralliedstronglyduring2016asasupplydeficitemerged.Theprincipaldriverwasafallinsupplyresultingfromtheclosuresofimportantminingoperationssuchasthelargeopen-cutCenturyMineinAustraliaandLisheenMineinIreland,aswellasfromaslowdowninmineproductionbyGlencore.Demand,ontheothersideremainedrelativelystablewhilepricesmovedupthroughouttheyear.Asimportantwasasignificantshiftinmarketflows,withawiderdiversityofmaterialfromawidevarietyoforiginsbeingimported
intoEuropeaswellasa40percentdecreaseinimportsintoChina.TheTrafiguratradingteamtookahighlyanalyticalapproachtothe
evolvingmarketbalanceandonthatbasiswasabletoincreasetradedvolumes,marketshareandachievetheobjectivessetfortheyear.Wehaveahighlydiversifiedbookbygeographyaswellasbycounterparties,withEurope,Australia,SouthKoreaandJapanallplayinganimportantrolealongsideChina.For2017,thebigquestionishowquicklysupplywillcomebackonstreaminresponsetohigherpricesandinparticularwhenGlencorewillramp-upitsminesagain.Ingeneralweexpectatoughermarketenvironmentwithincreasedcompetitionaroundtheglobe.
LEAD CONCENTRATESIn2016,Trafigura’stradingteamincreasedmarketshareandachieveditsobjectivessetfortheyear.SupplywaspartiallycurtailedwiththeclosureoftheCenturyMineinAustraliaandtheLisheenMineinIrelandaswellassomeothersacrosstheglobe.Importantchangesonthedemandside,notablywiththeexpansionofprimarysmeltingcapacitybyKoreaZincduringtheyear.AtthesametimeChineseimportsreducedbyabout9percentyear-to-dateoverallbuttheappetiteforhigh-silverleadconcentratesinChinagrewasaconsequenceoftheadoptionatmid-year2016ofatollinglicenceforsilverconcentrates.Priceswerestableformuchoftheyear,withaspikeduringthelastfewmonths.Forthecomingyear,weexpectthemarkettocontinuealongsimilarlines.Wewillfocusonpreservingourmarketleadershipbyexploringnewopportunitiesandmaintainingourexistinglong-termrelationships.Themarketenvironmentislikelytobecometougherduetoincreasedcompetition,andtocontinuetobeinfluencedbystricterenvironmentalregulations–adevelopmentwefollowclosely.
Copper cathode at Jinchuan Group’s copper smelter in Fangchenggang, China.
TRAFIGURA 2016 ANNUAL REPORT 25
RE
PO
RT
OF
TH
E B
OA
RD
OF
DIR
EC
TO
RS
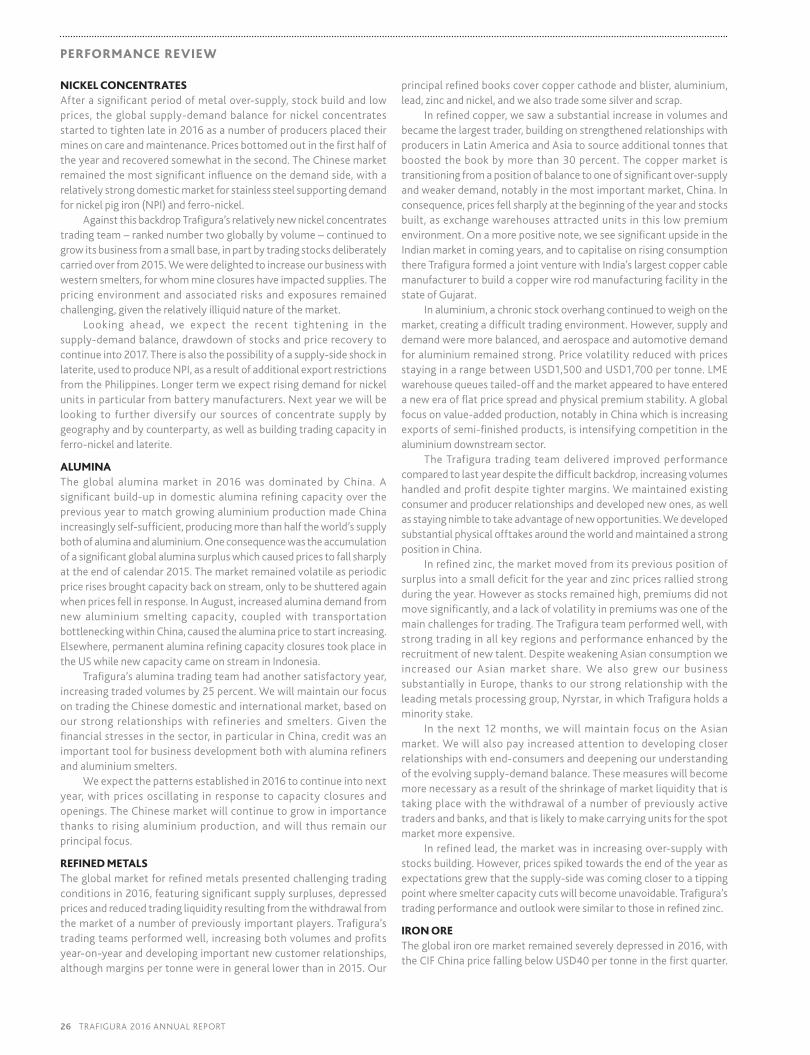
NICKEL CONCENTRATESAfterasignificantperiodofmetalover-supply,stockbuildandlowprices,theglobalsupply-demandbalancefornickelconcentratesstartedtotightenlatein2016asanumberofproducersplacedtheirminesoncareandmaintenance.Pricesbottomedoutinthefirsthalfoftheyearandrecoveredsomewhatinthesecond.TheChinesemarketremainedthemostsignificantinfluenceonthedemandside,witharelativelystrongdomesticmarketforstainlesssteelsupportingdemandfornickelpigiron(NPI)andferro-nickel.
AgainstthisbackdropTrafigura’srelativelynewnickelconcentratestradingteam–rankednumbertwogloballybyvolume–continuedtogrowitsbusinessfromasmallbase,inpartbytradingstocksdeliberatelycarriedoverfrom2015.Weweredelightedtoincreaseourbusinesswithwesternsmelters,forwhommineclosureshaveimpactedsupplies.Thepricingenvironmentandassociatedrisksandexposuresremainedchallenging,giventherelativelyilliquidnatureofthemarket.
Looking ahead, we expect the recent tightening in thesupply-demandbalance,drawdownofstocksandpricerecoverytocontinueinto2017.Thereisalsothepossibilityofasupply-sideshockinlaterite,usedtoproduceNPI,asaresultofadditionalexportrestrictionsfromthePhilippines.Longertermweexpectrisingdemandfornickelunitsinparticularfrombatterymanufacturers.Nextyearwewillbelookingtofurtherdiversifyoursourcesofconcentratesupplybygeographyandbycounterparty,aswellasbuildingtradingcapacityinferro-nickelandlaterite.
ALUMINATheglobalaluminamarket in2016wasdominatedbyChina.Asignificantbuild-upindomesticaluminarefiningcapacityoverthepreviousyeartomatchgrowingaluminiumproductionmadeChinaincreasinglyself-sufficient,producingmorethanhalftheworld’ssupplybothofaluminaandaluminium.Oneconsequencewastheaccumulationofasignificantglobalaluminasurpluswhichcausedpricestofallsharplyattheendofcalendar2015.Themarketremainedvolatileasperiodicpricerisesbroughtcapacitybackonstream,onlytobeshutteredagainwhenpricesfellinresponse.InAugust,increasedaluminademandfromnewaluminiumsmeltingcapacity, coupledwith transportationbottleneckingwithinChina,causedthealuminapricetostartincreasing.Elsewhere,permanentaluminarefiningcapacityclosurestookplaceintheUSwhilenewcapacitycameonstreaminIndonesia.
Trafigura’saluminatradingteamhadanothersatisfactoryyear,increasingtradedvolumesby25percent.WewillmaintainourfocusontradingtheChinesedomesticandinternationalmarket,basedonourstrongrelationshipswithrefineriesandsmelters.Giventhefinancialstressesinthesector,inparticularinChina,creditwasanimportanttoolforbusinessdevelopmentbothwithaluminarefinersandaluminiumsmelters.
Weexpectthepatternsestablishedin2016tocontinueintonextyear,withpricesoscillatinginresponsetocapacityclosuresandopenings.TheChinesemarketwillcontinuetogrowinimportancethankstorisingaluminiumproduction,andwillthusremainourprincipalfocus.
REFINED METALSTheglobalmarketforrefinedmetalspresentedchallengingtradingconditionsin2016,featuringsignificantsupplysurpluses,depressedpricesandreducedtradingliquidityresultingfromthewithdrawalfromthemarketofanumberofpreviouslyimportantplayers.Trafigura’stradingteamsperformedwell,increasingbothvolumesandprofitsyear-on-yearanddevelopingimportantnewcustomerrelationships,althoughmarginspertonnewereingenerallowerthanin2015.Our
principalrefinedbookscovercoppercathodeandblister,aluminium,lead,zincandnickel,andwealsotradesomesilverandscrap.
Inrefinedcopper,wesawasubstantialincreaseinvolumesandbecamethelargesttrader,buildingonstrengthenedrelationshipswithproducersinLatinAmericaandAsiatosourceadditionaltonnesthatboostedthebookbymorethan30percent.Thecoppermarketistransitioningfromapositionofbalancetooneofsignificantover-supplyandweakerdemand,notablyinthemostimportantmarket,China.Inconsequence,pricesfellsharplyatthebeginningoftheyearandstocksbuilt,asexchangewarehousesattractedunitsinthislowpremiumenvironment.Onamorepositivenote,weseesignificantupsideintheIndianmarketincomingyears,andtocapitaliseonrisingconsumptionthereTrafiguraformedajointventurewithIndia’slargestcoppercablemanufacturertobuildacopperwirerodmanufacturingfacilityinthestateofGujarat.
Inaluminium,achronicstockoverhangcontinuedtoweighonthemarket,creatingadifficulttradingenvironment.However,supplyanddemandweremorebalanced,andaerospaceandautomotivedemandforaluminiumremainedstrong.PricevolatilityreducedwithpricesstayinginarangebetweenUSD1,500andUSD1,700pertonne.LMEwarehousequeuestailed-offandthemarketappearedtohaveenteredaneweraofflatpricespreadandphysicalpremiumstability.Aglobalfocusonvalue-addedproduction,notablyinChinawhichisincreasingexportsofsemi-finishedproducts,isintensifyingcompetitioninthealuminiumdownstreamsector.
TheTrafiguratradingteamdeliveredimprovedperformancecomparedtolastyeardespitethedifficultbackdrop,increasingvolumeshandledandprofitdespitetightermargins.Wemaintainedexistingconsumerandproducerrelationshipsanddevelopednewones,aswellasstayingnimbletotakeadvantageofnewopportunities.WedevelopedsubstantialphysicalofftakesaroundtheworldandmaintainedastrongpositioninChina.
Inrefinedzinc,themarketmovedfromitspreviouspositionofsurplusintoasmalldeficitfortheyearandzincpricesralliedstrongduringtheyear.Howeverasstocksremainedhigh,premiumsdidnotmovesignificantly,andalackofvolatilityinpremiumswasoneofthemainchallengesfortrading.TheTrafigurateamperformedwell,withstrongtradinginallkeyregionsandperformanceenhancedbytherecruitmentofnewtalent.DespiteweakeningAsianconsumptionweincreased our Asian market share. We also grew our businesssubstantiallyinEurope,thankstoourstrongrelationshipwiththeleadingmetalsprocessinggroup,Nyrstar,inwhichTrafiguraholdsaminoritystake.
Inthenext12months,wewillmaintainfocusontheAsianmarket.Wewillalsopayincreasedattentiontodevelopingcloserrelationshipswithend-consumersanddeepeningourunderstandingoftheevolvingsupply-demandbalance.Thesemeasureswillbecomemorenecessaryasaresultoftheshrinkageofmarketliquiditythatistakingplacewiththewithdrawalofanumberofpreviouslyactivetradersandbanks,andthatislikelytomakecarryingunitsforthespotmarketmoreexpensive.
Inrefinedlead,themarketwasinincreasingover-supplywithstocksbuilding.However,pricesspikedtowardstheendoftheyearasexpectationsgrewthatthesupply-sidewascomingclosertoatippingpointwheresmeltercapacitycutswillbecomeunavoidable.Trafigura’stradingperformanceandoutlookweresimilartothoseinrefinedzinc.
IRON ORETheglobalironoremarketremainedseverelydepressedin2016,withtheCIFChinapricefallingbelowUSD40pertonneinthefirstquarter.
26 TRAFIGURA 2016 ANNUAL REPORT
PERFORMANCE REVIEW

PriceswereboostedtemporarilyinMarchbyincreaseddemandfromChinesesteelmillsinresponsetofinancialstimulusmeasures,buttheeffectsoonworeoffassteelpricesplateauedandariseinthecostofmetallurgicalcoaltookitstollonsteelmillmargins.Meanwhile,increasingsuppliesfromthemajors,andfromnewsourcessuchasAustralia’sRoyHill,addedtotheglutandpushedironorepricesdown.
Trafigura’sironoretradingteamhadabetteryearthanin2015.WestartedoperationsatourmajornewPortoSudesteexportterminalinBrazil,exportingnearly7milliontonnesatanacceleratingpace,andweworkedtosecurelong-termsupplyagreementsintheBrazilianminingsectorwiththesupportofstructuredfinanceofferings.Wewerealsoactiveinthird-partybusinessincountriessuchasMauritania.
Goingforward,weexpectironoretoremainadifficultmarket,withnewsuppliesstillcomingonstreamasthemajorsseektodisplacemarginalproducersandtheglobalsteelbusinessunderunremittingpressure.However,wehavegoodaccesstocost-competitivesuppliesinBrazilandexpecttoramp-upexportsthroughPortoSudesteto15milliontonnesin2017and20millionthefollowingyear.
COALAfteryearsofstructuralweakness,surplussuppliesandfallingprices,theglobalmarketforthermalcoalshowedsignsofnewlifeduring2016,principallyasaresultofmeasuresbytheGovernmentofChina,byfarthelargestcoalproducerandconsumer,tocurbproduction.Theso-called‘276-day’rulerequiredminestoreducetheiroutputby16.4percentacrosstheboard;tighterenforcementofhealthandsafetyrulesforcedtheclosureofmanyunsafemines;andarainysummerdisrupted domestic supply routes. As a result, China imported30-40milliontonnesmoreseabornethermalcoalthanexpected,catchingtheglobalmarketunawaresandsendingspotpricessoaringbetween
MarchandSeptember.ThespikeinChineseimportsredirectedtradeflows,withColombianexportsinparticularshiftingfromtheAtlanticbasintothePacific.Ontheotherhand,Indianimportdemandshrankby20milliontonnes,astheGovernmenttookmeasurestodiscourageimportsinfavourofthestate-ownedproducer,CoalIndia.InmaturemarketssuchasEurope,coalcontinuedtolosegroundtocleanerfuels.
Trafigura’scoaltradingteamhadagoodyear,increasingitscontributiontonetprofitandboostingtradedvolumeby7percentfrom35.3millionto37.3milliontonnes.Inadditionwehandled12-13milliontonnesunderourmarketingagreementwithBowieResourcePartnersintheUS.OurmostimportantcustomerswereIndiaandChina,andwesignificantly increasedpurchasesfromIndonesiaandSouthAfrica.
Market strengthhas started to ebb recently asChinahasintroducedvariousmeasurestobringsupplybacktomarket,atleastthroughtheheatingseason.Chinesedomesticpriceshavecomedownfromtheirpeaksanddemandelsewhereremainstepid.InIndia,theothergreatsourceofdemandgrowth,theGovernmentwillcontinueto promote domestic production over imports . The recent‘demonetisation’policyhasalsocreatedashort-termdemandshockinIndia,whereasignificantshareofcoaltradedinthedomesticmarketisstilldeliveredinsmallparcelsizesviacashtransactions.Furtherahead,thereismuchuncertaintyoverthefutureforcoaldemand.InChina,coalstillrepresents70percentoftheoverallenergymix,buttheGovernmenthasclearlysignalleditwantstoreducethisovertime,andthepeakinChinesecoalburnmaycomesoonerthanpreviouslyexpected.Trafiguraseesanopportunitytocontinuetogrowitscoaltradingbook,thankstodecisionsbysometradingfirmsthatusedtoplayanimportantroleinthebusinesstowithdraworreducetheirexposure.
Iron ore being dispatched in Minas Gerais region of Brazil.
TRAFIGURA 2016 ANNUAL REPORT 27
RE
PO
RT
OF
TH
E B
OA
RD
OF
DIR
EC
TO
RS

Trafiguraisaleadingplayeringlobalshippingandakeypartnerforship-ownersaroundtheworld.Ourfreightdesksworkcloselywiththecompany’stradingteams,whorelyonreal-timefreightpricingtostructurephysicalarbitrageopportunities.
Theshippingandcharteringdesksfacedachallengingenvironmentin2016inboththewetanddrysidesofthebusinessandaccordinglyreducedtheirexposureintermsofvesselsontimecharter.Thewetfreightdeskrecordedasignificantincreaseinthenumberoffixturesandinvolumescarriedwhileindryfreight,fixturesincreasedbutvolumescarriedfell.Bothsidesofthebusinessrecordedaprofitfortheyear.
WET FREIGHTThepositivemarketbackdropandsignificantlylongerfreightpositiontaken that underpinned our historically strongest wet freightperformanceinthepreviousfinancialyearwasturnedonitsheadin2016.Despitetheseveredropinfreightrates,asuccessfullyexecutedhedgingstrategyearlyintheyear,whilefreightwasstillfirm,setusupforanotherstrongyear.Weakerfreightrateswerecausedbymanyfactorsincludingincreasingvesselsupplyandlackofoilarbitragemovements.Intermsoffixingvolumes,theteamwentfromabout1,950fixturesin2015tomorethan2,970in2016.
Infurtherresponsetotheweakfundamentals,wesubstantiallyreducedourtimecharterfleetduringtheyearacrossallmarketsegments.WealsosuccessfullysoldtheremainingsixshipswehadpreviouslyorderedfromashipyardinGuangzhou,Chinatonewownersundersale-and-leasebackagreements–reducingourownershipofproducttankerstozerobytheendofthefiscalyear.
Oneofourstrategicaimsistoextractfullvalueofthecargoinfrastructurewhichsawsignificantgrowththroughouttheyear.FreightexposurehasbeenconcentratedwhereTrafigura’scargoprogrammeisstrongest– thus limitingdownside riskbymaximisingcapacityutilisation.
Withanincreasingcargoprogrammeweseecontinuedvalueinbuildingclosertieswithourbiggestfreightpartners.InMay,wehostedaneventinCopenhagenfor22chiefexecutivesandboardmembersofourlargestfreightpartnersamonggas,crudeandproducttankerowners.Theaimwastofosterfurthersenior-leveltrust,togiveship-ownersgreaterinsightintoourbusinessmodel,andtopositionTrafigurafurtherasatransparentpartnerwithalargeandgrowingvolumeofcargoesavailabletoplaceinthemarket.In2016,21percentofallTrafigurawet
SHIPPING AND CHARTERINGTrafigura Maritime Logistics arranges shipping and freight services to Trafigura’s various commodity trading teams as well as to third-party clients. It operates as a service provider securing competitive and reliable freight for in-house oil, metals and minerals traders. The Wet and Dry Freight desks also operate respectively as profit centres in their own right.
AllcommercialshippingandcharteringactivitiesaremanagedoutofTrafigura’skeyregionaloffices.Allpost-fixtureoperations,whichinclude issuing voyage orders, completing stowage plans,negotiatingwithportagentsandhandlingdemurrageclaimsaremanagedcentrallyfromourAthensoffice.
3,878ShippingandCharteringfixtures(2015:2,744)
2016 Wet and Dry Freight Activity Wet Dry
Tonnage shipped152mmt(1)
2015: 106mmt(1) 30mmt(2)
2015: 32mmt(3)
Number of fixtures2,974
2015: 1,959904
2015: 785
Average time-charter fleet(4) 65-70 2015: 85-90
35-40 2015: 40
(1)Includesthird-partytonnageandinternaltonnagefixedinternallyandexternally.(2)Includes14mmtexternalcustomertonnage.(3)Includes21mmtexternalcustomertonnage.(4)Avesselonhireforlongerthanthreemonths.
28 TRAFIGURA 2016 ANNUAL REPORT
PERFORMANCE REVIEW

cargoeswerecarriedonTrafigura-controlledtonnage–meaningthat79percentneededtofindahomewiththird-partyships.
Thecurrentrateenvironmentisverychallengingandweexpectweakerwet freightperformance for2017.Weseeweakmarketfundamentalscontinuingthrough2017,includingfurthersupplygrowthoffsetmarginallybyhigherscrappingactivityifearningsremainatcurrentlevelsincertainsegments.Forthewiderevolutionofthemarketmuchwilldependalsoonoilmarketarbitrageflowsandwewillbemonitoringthiscloselytobeabletorespondtoanyphysicalmarketshifts.Withasmallerfleetandanexpectedcontinuedgrowingcargoprogrammeweexpectourthird-partyvolumeswillincreasesignificantlyin2017.
DRY FREIGHTInthedryfreightmarket,conditionswereespeciallychallengingin2016withtheBalticDryIndexreachinganall-timelowon10February.Whileglobalseabornecargovolumesremainedhealthyandcontinuedtogrowby1.5–2percentyear-on-year,thehugeover-supplyofvesselcapacityweighedheavilyonthemarket.
Trafigura’sdryfreightdeskachievedapositiveresultfortheyear,withthekeytosuccessbeinglimitingcounterpartyexposure,retainingaleanandnimblemarketposition,andfocusingonnichemarketswherewehaveastrongcompetitiveadvantagesuchasthewestcoastofLatinAmerica,movingconcentratesfromChile,PeruandMexicoandironorefromPortoSudeste,themajorBrazilianexportterminaljointlyownedbyImpalaTerminalsandMubadala.
Asmentioned,counterpartyriskwasamajorfocusthroughtheyearandwillcontinuetobefortheforeseeablefutureinshippinggiventheimmensefinancialpressureonmanyownersandoperators.ThiswashighlightedbythebankruptcyfilingbytheSouthKoreancontainergiantHanjinShippinginAugust.WhileTrafigurahadnodirectexposuretothisevent,itunderlinedhowimportantitisindistressedmarketsforcargoownerstounderstandthetruefinancialpositionofship-ownerswithwhomtheycontractandtothisendourteamspentsignificanteffortduringtheyearvettingships,ownersandworkingwithTrafigura’screditdepartmenttocontrolexposures.
In2017,weexpectthedistressedmarketconditionstocontinueandwewillmaintainourconservativeapproach.However,therearesignsthatthemarketmaystarttoturnpositiveinthenextonetotwoyearswitharecordvolumeofdryfreighttonnagebeingscrapped,nonewshipordersbeingplacedandseabornecargocontinuingtoexpand.
Forfurtherinformationpleasevisitwww.trafigura.com/our-services/shipping-chartering/
TRAFIGURA 2016 ANNUAL REPORT 29
RE
PO
RT
OF
TH
E B
OA
RD
OF
DIR
EC
TO
RS

HIGHLIGHTS
• RecordvolumesofrefinedmetalsexportedfromtheAfricancopperbelt.
• Freightforwardingbusinesshasrecordyearmoving75,000containers.
• CompletionofthefirstphaseofconstructionoftheHuelvaterminalinSpain.
• Paranariverbargefleetdoublesinsizetomeetdemand.
$375.8m 18Salesrevenue(2015:USD340.2million)
Countriesofoperation
1,625 23Employees(2015:1,749)
Locationsworldwide
RAMPING-UP COMMERCIAL OPERATIONSIn2016,ImpalaTerminalsfocusedonramping-upcommercialoperationsatanumberofimportantnewprojects,includingourmultimodaltransportsysteminColombia,thePortoSudesteironoreterminalinBrazilandtheHuelvametalstorageandblendingfacilityinsouthernSpain.Therewasalsoanongoingemphasisonsecuringcostsavingsandefficiencyimprovementsacrossthecompany.Havingpreviouslydivestednon-coreassetsinChina,BelgiumandtheUKandrestructuredtheremainingoperatingcompanieswithinImpala,recurringbusinessesperformedwell,withEBITDAgrowingbyapproximately50percentyear-on-year.
Themarketenvironmenthasbeenchallenginginthecountriesandcommoditiesinwhichweoperate,withtheironoremarketdepressed,crudeoilproductioninColombiareduced,andrefinedmetalsfromAfricastrugglingwithlowpricesandover-suppliedmarkets.HoweverImpalawasabletosourceandhandleincreasedvolumesandgeneratemargins ineachof these regions,demonstrating the importantcontributionthatitsstronglogisticalplatformcanmaketoTrafiguraGroupbusiness.Forexample,despitetheweakpriceenvironmentforrefinedmetals,wewereabletoexportrecordvolumesfromtheAfricancopperbelt,inpartbychangingtheexportrouteoutofDRCandZambiaviatheportsofDaresSalaam,Durban,BeiraandWalvisBay.
Wealsocontinuedtoinvestinnewoperationsincludingournon-ferrousblendingandstorageterminalatHuelvainSpain,ourgrowingcontainerfreightforwardingbusinessandanewbargingprojectalongtheParanaRiverlinkingArgentina,ParaguayandBolivia.Ourfreightforwardingbusinesshadarecordyear,contributingpositivelyineachregionmoving75,000containersofwhich35percentwerethirdparty,andaddingsignificantvaluetoourexistingwarehouseoperations.
GROWTH IN LATIN AMERICA AND SPAINInColombia,wehaveinvestedmorethanUSD1billioninaninlandportatBarrancabermejaandfluvialequipment,providingmultimodallogisticsserviceslinkingtheindustrialheartlandtotheCaribbeanportsatCartagenaandBarranquilla.TheliquidterminalatBarrancabermejawillbecompletedbytheendof2016.TheportisalreadyhandlingalltypesofColombiancrudeandnaphthawithvolumesreachingapeakof40,000barrelsperdayduring2016,andwelooktoincreaseourservicesasmoretankspacecomesonlinetowardstheendof2016.Atthesametimeweareimportingnaphthabybargeforusebyoilproducersasadiluent,therebymaximisingtheassetutilisation.
Impala Terminals is a multimodal logistics provider focused on export-driven emerging markets. We own and operate ports, terminals, warehouses and transport assets which together offer end-to-end logistics solutions for dry and liquid bulk cargoes, general cargo and containers. NICOLAS KONIALIDIS
CEO,ImpalaTerminals
IMPALA TERMINALS
Impala’s barge operations on the Parana River, Argentina.
30 TRAFIGURA 2016 ANNUAL REPORT
PERFORMANCE REVIEW
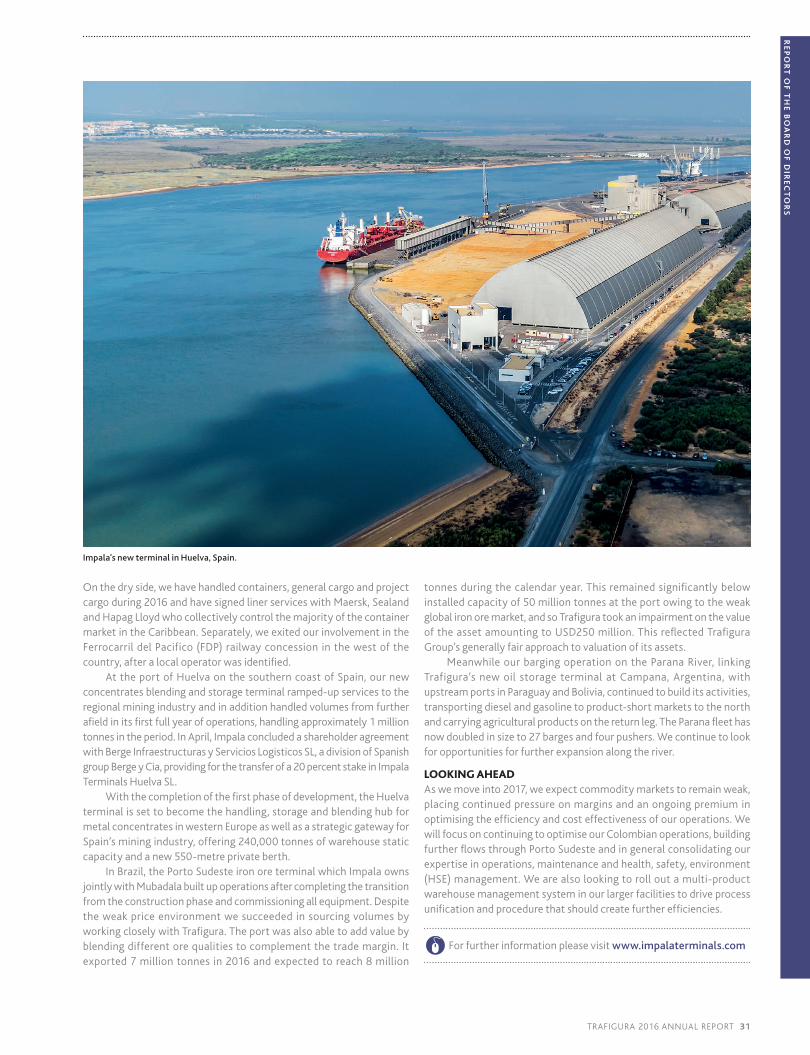
Impala’s new terminal in Huelva, Spain.
Onthedryside,wehavehandledcontainers,generalcargoandprojectcargoduring2016andhavesignedlinerserviceswithMaersk,SealandandHapagLloydwhocollectivelycontrolthemajorityofthecontainermarketintheCaribbean.Separately,weexitedourinvolvementintheFerrocarrildelPacifico(FDP)railwayconcessioninthewestofthecountry,afteralocaloperatorwasidentified.
AttheportofHuelvaonthesoutherncoastofSpain,ournewconcentratesblendingandstorageterminalramped-upservicestotheregionalminingindustryandinadditionhandledvolumesfromfurtherafieldinitsfirstfullyearofoperations,handlingapproximately1milliontonnesintheperiod.InApril,ImpalaconcludedashareholderagreementwithBergeInfraestructurasyServiciosLogisticosSL,adivisionofSpanishgroupBergeyCia,providingforthetransferofa20percentstakeinImpalaTerminalsHuelvaSL.
Withthecompletionofthefirstphaseofdevelopment,theHuelvaterminalissettobecomethehandling,storageandblendinghubformetalconcentratesinwesternEuropeaswellasastrategicgatewayforSpain’sminingindustry,offering240,000tonnesofwarehousestaticcapacityandanew550-metreprivateberth.
InBrazil,thePortoSudesteironoreterminalwhichImpalaownsjointlywithMubadalabuiltupoperationsaftercompletingthetransitionfromtheconstructionphaseandcommissioningallequipment.DespitetheweakpriceenvironmentwesucceededinsourcingvolumesbyworkingcloselywithTrafigura.Theportwasalsoabletoaddvaluebyblendingdifferentorequalitiestocomplementthetrademargin.Itexported7milliontonnesin2016andexpectedtoreach8million
tonnesduringthecalendaryear.Thisremainedsignificantlybelowinstalledcapacityof50milliontonnesattheportowingtotheweakglobalironoremarket,andsoTrafiguratookanimpairmentonthevalueoftheassetamountingtoUSD250million.ThisreflectedTrafiguraGroup’sgenerallyfairapproachtovaluationofitsassets.
MeanwhileourbargingoperationontheParanaRiver,linkingTrafigura’snewoilstorageterminalatCampana,Argentina,withupstreamportsinParaguayandBolivia,continuedtobuilditsactivities,transportingdieselandgasolinetoproduct-shortmarketstothenorthandcarryingagriculturalproductsonthereturnleg.TheParanafleethasnowdoubledinsizeto27bargesandfourpushers.Wecontinuetolookforopportunitiesforfurtherexpansionalongtheriver.
LOOKING AHEADAswemoveinto2017,weexpectcommoditymarketstoremainweak,placingcontinuedpressureonmarginsandanongoingpremiuminoptimisingtheefficiencyandcosteffectivenessofouroperations.WewillfocusoncontinuingtooptimiseourColombianoperations,buildingfurtherflowsthroughPortoSudesteandingeneralconsolidatingourexpertiseinoperations,maintenanceandhealth,safety,environment(HSE)management.Wearealsolookingtorolloutamulti-productwarehousemanagementsysteminourlargerfacilitiestodriveprocessunificationandprocedurethatshouldcreatefurtherefficiencies.
Forfurtherinformationpleasevisitwww.impalaterminals.com
TRAFIGURA 2016 ANNUAL REPORT 31
RE
PO
RT
OF
TH
E B
OA
RD
OF
DIR
EC
TO
RS

MINING GROUP
NICOLAS TREANDGlobalHeadofMiningOperations
Trafigura’s Mining Group manages mining operations, develops projects, conducts technical audits of potential partner projects and provides advisory and support services to the rest of the Group – both to generate profit and to secure access to commodities produced via long-term offtake or marketing agreements.
HIGHLIGHTS
• InvestmentprogrammetoboostefficiencyandimprovesafetymanagementinMATSA,Spain.
• ConstructioncommencesonCastellanosleadandzincmineinCuba.
Trafigura’sMiningGroupoverseesminingoperationsinEurope,LatinAmerica,AfricaandAsia.
4.4mmt 0.7mmt OreextractedatMATSAmine,Spain(2015:3.6mmt)
OreextractedatCatalinaHuanca(2015:0.7mmt)
FortheMiningGroup,2016wasayearofconsolidationandinvestment.Thetwokeythemeswereweakmetalmarketsasaresultofsurplussupplies,andafocusoninvestingtoupgradeandexecuteexistingprojects.OurkeyassetsremaintheMinasdeAguasTeñidas(MATSA)miningcomplexinsouthernSpain,a50-50jointventurewithMubadala,andthewhollyownedCatalinaHuancamineinPeru.MATSAunderwentasignificantmanagementoverhaulfollowingthechangeinownership,including an investment programme to boost efficiency andimprovementsinsafetymanagement.DuringtheyearwealsostartedworkonasignificantnewminingprojectinCubaandcontinuedtoexploreopportunitiesinBrazil.
MANAGEMENT CHANGE AND COST CONTROL IN SPAIN AND PERU TherestructuringofownershipatMATSA,withthearrivalofAbuDhabiinvestmentcompanyMubadalaasa50percentshareholderalongsideTrafigura,promptedacomprehensivereviewoftheasset’sgovernanceinordertoalignitsobjectivesandculturewiththoseofbothitsshareholders.WeappointedanewGeneralManagerinAudraWalsh,anexperiencedminingprofessionalwithastrongtrackrecordwithminingmajors,andotherwiserefreshedthemanagementteamtosharpenthefocusoncostcontrolandsafetymanagement.Theculturalchallengecameontopofaneconomicone,withthefallincopperpricescreatingafreshneedforcostefficiencies.MATSA’sanswertothelatterwastheAvanza project, an efficiency programme which improved theoperation’sEBITDAbyUSD21milliononafull-yearbasis.Byyear-endtherestructuringwascompleteandanewbasishadbeencreatedforfuturegrowth.
OurCatalinaHuancaleadandzincmineinPerualsofacedacostchallengeasaresultoflowcommodityprices.Wereducedheadcountatthemineandlaunchedanumberofsmallinvestmentprogrammestoimproveefficiency,notablyincludingtheinstallationofafilterpresstoreducethevolumeofwaterintailingsfromthemineandthuscontrolwastetransportcosts.CatalinaHuancaisnowingoodshapetoweatherthecontinuingweaknessincommoditypricesandtobenefitfromtheexpectedupturninthezincmarket.
MATSA mine near Seville, Spain.
32 TRAFIGURA 2016 ANNUAL REPORT
PERFORMANCE REVIEW: METALS AND MINERALSPERFORMANCE REVIEW

OPPORTUNITIES IN CUBA AND BRAZIL Despitethepressureonminingassets,wecontinuedtoinvestincash-generatingprojectsforthefuture.InparticularconstructionstartedontheCastellanos leadandzincmine inCuba.This isaprojectbetweenTrafiguraandtheCubangovernmentandalreadyamountstothelargestindustrialinvestmentontheisland.Giventheadditionalnearbyconcessionsweown,thishasthepotentialtobecomeasignificantpartofourminingportfolioandoftheCubanexporteconomy.Theproject isanother illustrationofTrafiguraMiningGroup’sabilitytoputitsexpertiseandinvestmenttoworkinchallengingeconomicorpoliticalenvironments.Workissofarproceedingtoplan,andthemineisexpectedtostartproductiontowardstheendof2017.
PRIORITIES FOR THE COMING YEAR Wealreadyhaveafullprogrammeofworkfor2017balancingtheneedforcostcontrolinlightofweakmarketswiththeimperativetoinvestforthefuture.Developmentsinclude:• Rolling-outthenewsafetysystemdevelopedforMATSAacross
allourassets;• Extendingthelifeofexistingassetsthroughselectiveexploration
projects;• Adjustingminingplansofexistingpolymetallicassetstomaximise
valueandincreaseproductivity.
Forfurtherinformationpleasevisitwww.trafigura.com/mining-group/
GALENA ASSET MANAGEMENT
GalenaAssetManagement,Trafigura’swhollyownedinvestmentsubsidiary,executedafundamentalchangeofstrategyduring2016,shiftingfocusfromderivativestradingandtradefinancetoprivateequity-styleinvestmentinrealassets.
InDecember2015,thedecisionwastakentowinddowntheGalenaMetalsFundandtoreviewstrategicoptionsfortheGalenaTradeFinanceFund.Afteryear-enditwasannouncedthattheSingapore-basedindependentassetmanagerEFAGroupwouldtakeoverasinvestmentmanagerofthetradefinancefund.
ThislefttheGalenaPrivateEquityResourcesFundasGalena’ssolefocus.TheResourcesFundhasraisedUSD400milliontoinvestintheequityanddebtofmetalsandminingcompanies.TodateithasinvestedUSD200millioninanumberofassetsintheDemocraticRepublicoftheCongoandtheUS,anditmadenonewtransactionsin2016.Insteaditworkedtorecapitaliseandrestructureexistinginvestmentsinlightoflowcommodityprices.
AtMawsonWest,aToronto-listedresourcecompanyinwhichtheFundheldamajoritystake,adecisionwasmadeinMarch2016toplacetheKapulomineinDRC,itssoleoperatingasset,oncareandmaintenance.TheFundsubsequentlymovedtotakeMawsonWestprivate.AnotherFundasset,itsinvestmentinBowieResourcePartners,whichoperatescoalminingassetsintheUS,requiredadditionalfinancinglaterintheyear.On30September2016,theFundtookmajorityownershipandcontrolofBowie,replacingtheCEOwithanewInterimCEO.
Lookingforward,GalenacontinuestoprospectforsuitableresourceinvestmentsofferingstrongunderlyingassetvalueandtheopportunitytoapplymanagementandfinancialcapabilitiesfromthewiderTrafiguraGroup.However,thecontinuingfloodofcheapliquidityinglobaldebtandequitymarketsatthelowendofthecommoditycyclehasincentivisedownerstosecureadditionaldebtratherthanselling.Thetransactionsthathaveoccurredhaveclosedwithvaluationsinflatedbythestrongcompetitionandmakingtheprojectedinvestmentreturnssub-optimal.
Forfurtherinformationpleasevisitwww.galena-invest.com
Mineração Morro do Ipê mine in Minas Gerais region, Brazil.
TRAFIGURA 2016 ANNUAL REPORT 33
RE
PO
RT
OF
TH
E B
OA
RD
OF
DIR
EC
TO
RS
Asarule,theGroupactivelymanagesandmitigateswhereverpossibletheidentifiableorforeseeablerisksinherenttoitsactivity–forexampleinsystematicallyhedgingexposuretoflatpricesandinextensivelyusinginsuranceandfinancialtoolssuchaslettersofcredit.
Ithasalsoensuredadegreeofdiversificationinitsbusiness–tradingawiderangeofcommoditieswithdiverseanduncorrelatedmarketdynamicsinvariousgeographicalregions–thatinitselfreducestheGroup’sexposuretorisk.Unlikemanyfinancialassets,physicalcommoditymarketsprovidemanyopportunitiesforriskdiversification.ThepremiumpaidforcopperinChina,forexample,haslittletodowiththepricingrelationshipinLPGbetweentheUSandEurope.
Diversification results in loweroverallexposureandhigherrisk-adjustedperformance.Asweextendourtradingcapabilities,wearediversifyingthebusinessfurther.
TRAFIGURA’S RISK MANAGEMENT SYSTEMTomanagethefullrangeofriskstowhichitisexposed,theGrouphasdevelopedasystemwithmultiplelinesofdefence.
Thefirstlineconsistsofmanagersofthetradingdivisionsandoperatingcompanies,overseendirectlybytheexecutivemembersoftheBoardofDirectors.
Trafigurahasaflatcorporategovernancestructurefeaturingshortanddirectchannelsofcommunicationandcontrol(seeseparatesectiononGovernanceonpage40).
TheBoardofDirectorshasprincipaloversightresponsibility,setstheriskmanagementframework,determinestheoverallriskappetiteofthebusiness,andensuresthattheappropriatestructuresandprocessesareinplacetohandleeachcategoryofrisksinanappropriatemanner.
Thesecondlineconsistsofaseriesofcorporatefunctionsthatestablishpoliciesandprocessesformanagingdifferentcategoriesofrisk,aswellasprovidinganalysis,adviceandimplementationsupport.
MARKET AND PRICE RISKRisk Committee and Chief Risk OfficerTrafigurasystematicallyhedgesallindexpriceexposureincurredasaresultofitstradingactivitieswithinaframeworksetbytheBoardofDirectorsandimplementedbytheRiskCommitteeandtheChiefRiskOfficer(CRO).
TheCROreportsdirectlytotheChiefOperatingOfficerandtheBoardofDirectors.TheCROisakeymemberoftheRiskCommittee,whichincludescompanydirectorsandseniortraders.TheCommitteemeetsatleastweeklytomanageoverallexposures,assesstheimpactofchangingmarketdynamicsandlimitriskexposuresandconcentrations.
Trafigura’songoingprogrammeofinvestmentinriskmanagementsystemsincludesareportingsystemwhichautomaticallynotifiestheriskmanagementandtradingteamswheneverabooknearsitsrisklimits.
TheCROworksproactivelywithtradingteamstoanalysechangingmarketconditionsandensurethathedgingstrategiesarefocusedoncurrentmarketdynamics.Rigorousmethodologiesformanagingmarketriskareusedacrossthecompany.TheCRO’sriskteamemploysadvancedstatisticalmodelsthatcapturethenon-normaldynamicswhichareanimportantfeatureofcommoditymarkets.
Theriskteamfocusesonaggregaterisk,payingparticularattentiontoterm-structureandintra-commodityspreads.Riskconcentrationsarecontinuouslyreviewedinthecontextofchangingmarketdynamics.TheCROmanagesstrategichedgingactivitydynamicallytoreduceriskconcentrationsandlimitcompany-wideexposure.
FINANCE AND CREDIT RISKSFinance Committee and Finance DepartmentTheFinanceDepartmentsupportstheactivitiesofthewholeGroupandisinvolvedattheearlieststageoftransactionsandprojects.OverseenbytheFinanceCommittee,itisresponsibleforassessmentoffinancialriskandhasthecapacitytovetoanytransaction.WithinFinance,theCreditDepartment’skeyroleistosafeguardthebalancesheet.Itperformsfundamentalcreditanalysis,assessingcreditriskassociatedwiththeGroup’scounterparts,settinginternallimits,monitoringexposuresandoverseeingdocumentation.
HOW TR AFIGUR AMANAGES RISKTrafigura operates in dynamic markets that pose a wide range of risks, whether financial, political, operational or environmental. In consequence, a rigorous and conservative approach to risk management is an integral element of Trafigura’s business and has been a central focus of the Group since its foundation.
34 TRAFIGURA 2016 ANNUAL REPORT
RISK MANAGEMENT

OVERVIEW OF TRAFIGURA’S RISK MANAGEMENT SYSTEM
* TheTrafiguraGroupPte.Ltd.ComplianceCommitteeischairedbyourCEO.TheGlobalHeadofCompliancechairstheComplianceCommitteesofallGroupcompanies.
INDUSTRIAL & FINANCIAL ASSETS
DT GROUP
IMPALA TERMINALSGROUP
MINING GROUP
GALENA ASSET MANAGEMENT
MARKET RISKS
RISK COMMITTEE/ CHIEF RISK OFFICER
FINANCE COMMITTEE
CORPORATE FINANCE
TRADE FINANCE
STRUCTURED FINANCE
INSURANCE
CREDIT
CORPORATE FUNCTIONS
COMPLIANCE COMMITTEE*
HSEC STEERING GROUP
IT STEERING COMMITTEE
LEGAL
INTERNAL CONTROLS
ACCOUNTING STEERING COMMITTEE
ACCOUNTING AND REPORTING
TAX
OIL & PETROLEUM PRODUCTS TRADING
METALS & MINERALS TRADING
STEERING COMMITTEE
STEERING COMMITTEE
OPERATIONS OPERATIONS
DEALS DESK DEALS DESK
SHIPPING & CHARTERING DESK
COMPLIANCE RISKSCompliance Committee and Head of ComplianceTrafigura’sGlobalHeadofComplianceoverseestheimplementationandfurtherdevelopmentofourCodeofBusinessConduct,reportingtotheCOOandtotheTrafiguraComplianceCommittee.TheComplianceDepartment focuses on financial and commercial compliance,incorporatingKYC,anti-money laundering, tradesanctionsandanti-briberyandcorruption.TheComplianceCommitteeischairedbyTrafigura’sCEOandmeetsatleasttwiceayear.
RISKS PERTAINING TO HEALTH, SAFETY, ENVIRONMENT AND COMMUNITIESHSEC Steering Group and Corporate AffairsThiscommitteeischairedbyamemberoftheBoardofDirectorsandtheHeadofCorporateAffairsandincludesTrafigura’sCEOandseniorrepresentativesfromacrosstheGroup.ItismandatedbytheBoardto
promotebestpractice,overseethemanagementofHSECrisksandensurethatTrafigura’sCorporateResponsibilityPolicyandBusinessPrinciplesareimplementedconsistentlyacrosstheorganisation.
CONTROL RISKSInternal Controls TeamTheInternalControlsteamsupportsmanagementacrosstheGroupinannuallyassessingrisksandcontrolsforthegovernance,trading,ITandsupportprocesses.ResultsoftheseactivitiesarereportedtotheBoardofDirectorsaccompaniedbyactionplanstostrengthencontrolsandfurthermitigateriskswhererequired.InternalControlsmanagetheseannualframeworkcycleactivitiesandexternalauditorsvalidatetheexistence of the Trafigura Internal Control System every year.Additionallytheteamperformssitereviewstoassesshowlocalmanagement manages risk and to identify opportunities forimprovement,andadvisesonprocessdesignfornewITapplications.
BOARD OF DIRECTORS
INVESTMENT COMMITTEE TRADING COMMITTEE
TRAFIGURA 2016 ANNUAL REPORT 35
RIS
K M
AN
AG
EM
EN
T A
ND
FU
ND
ING
MO
DE
L

KEY RISK MITIGATION AND ACTIONS
MARKETS AND PRICES
• Volatilityincommodityprices,spreads,interestandexchangerates.
• Fluctuationsinthesupplyof,ordemandfor,commoditieswhichwetrade.
• ItisafundamentalobjectiveofTrafigura’sbusinessmodeltobeabletooperatesuccessfullyinallmarketconditions.TheGroup’spolicyistohedgeallindexpriceexposurerelatedtophysicaltransactionsonadeal-by-dealbasis.
• Asamatterofpolicy,100percentofstockisatalltimeseitherpre-soldortheindexpriceishedged.
• DespitesuchhedgingTrafiguraremainsexposedtobasisrisk,ietheriskofchangesinthedifferencebetweenthepriceofthecommoditybeinghedgedandthehedginginstrument.Thegroupcarefullymonitorsallitshedgingpositionsonadailybasisinordertoavoidexcessivebasisriskresultingfromtheseimperfectcorrelations.
• Intermsofexchangeraterisks,themajorityofsalesand purchases are denominated in US dollars.ExposuretoothercurrenciesishedgedandfinancingraisedincurrenciesotherthantheUSDisimmediatelyswappedintodollars.
• Concerninginterestraterisks,ourpolicyistoborrowshort-termworkingcapitalatfloatingrates,withanyratechangespassedthroughtoourcustomers,andtofixratesformedium-andlong-termfinancingviatheswapsmarket.
• FreightcostsarehedgedbyourShippingandCharteringDeskviaForwardFreightAgreements(FFAs)andbunkercosts.
For our view of the market environment and how we are responding, please see CEO report (p04).
FINANCE AND LIQUIDITY
• Trafigurareliesonadeeppooloffinancingfrombanksforworkingcapitaltosupportitsbusiness,consistingofthreepillars:tradefinance,securitisationandunsecuredcommittedrevolvingcreditfacilities.
See CFO statement (p10 – p15).• Forlonger-termcapitalneedsweraisefundsfrom
timetotimeonpublicbondmarketsorthroughprivateplacementswithinvestmentinstitutions.Wefollowastrictpolicyofmatchingthematurityofourassetsandliabilities,withlonger-termassetssupportedbylonger-termborrowings.
• Wetakeaconservativeapproachtomanagingourfunding liquidity, with more than one-third ofcommittedfacilitiesunutilisedatalltimesundernormalmarketconditions,andimmediatelyavailablecashofaroundUSD500millionalwaysonhand.Ourtransactionalfinancingbaseallowstheunderlyingassetstobe100percentmarked-to-marketvalue,matchingliquidityneedsforanyrelatedmargincalls.
See CFO statement for a fuller account of our funding model.
COMPLIANCE AND ETHICS
• Trafigura’sComplianceDepartmentoverseesGroupactivities,inpartnershipwithfront-officefunctions,to ensure that we operate with integrity andaccordingtobestpractice,andthatourcontrolsarerelevant,rigorousandrobust.Itfocusesonpromotingasoundcompliancecultureacrosstheorganisation,in which everyone recognises their personalresponsibilityformeetingourcomplianceobjectives.Theteamadoptsarisk-basedapproach,allocatingenergyandresourcestotheissuesthatmattermosttoourcorebusinessandourstakeholders.
• TheDepartment’sactivitiesincludecounterpartydue diligence (KYC); anti-money-laundering;sanctionsandtraderestrictions;anti-briberyandcorruption;gifts,hospitalityandentertainment;political contributions; protection of whistle-blowers;financialcomplianceandmarketconduct.
See 2016 Responsibility Report (p54-p57).
ECONOMIC AND FINANCIAL SANCTIONS
• TheGrouptakesitscomplianceobligationswithregardtointernationalsanctionsextremelyseriously.Ensuringthispositionisrespectedinallourbusinessactivities,andthatwefulfiltheundertakingsonsanctionsthatwegiveaspartofourcreditfacilities,isakeyfocusforthetradingdeskswithsupportfromtheCompliance,LegalandFinancedepartments.
See 2016 Responsibility Report (p54-p57)
36 TRAFIGURA 2016 ANNUAL REPORT
RISK MANAGEMENT

KEY RISK MITIGATION AND ACTIONS
COUNTERPARTY, COUNTRY AND CREDIT RISK
• Oncounterpartyandcreditrisk,Trafigurausesinternalcredit limitsestablishedbytheCreditdepartment.
• TrafiguralaysoffpoliticalriskinrelationtocountriesbelowacertainriskratingasgaugedbyDun&Bradstreet,bypurchasingpoliticalriskinsurance.
• CreditlimitsreflectTrafigura’sownappetiteforriskandarebasedonacreditanalysisoftheclientaswellas the size of the relevant transaction whencomparedtoTrafigura’sbalancesheet.
• In lightof lowercommodityprices in2015,wepaidparticularattentiontoscreeningourportfolioof prepayment agreementswithproducers forcreditrisk.
• Exposuresinexcessofacreditlimitarecoveredthroughtheinsuranceorbankmarkets.
• TheGrouppridesitselfonhavinghadanextremelylowincidenceofcreditlossesthroughoutitshistory.
DIGITAL INFRASTRUCTURE/CYBER-SECURITY
• ThecompanytakesITsecurityextremelyseriouslyandisinvestingsignificantsumsinstate-of-the-artsystemstoprotecttheintegrityofitsITarchitectureandprocessesagainstthethreatoffraudorotherpotentialdamagefromcyber-attack.
LEGAL, TAXATION AND REGULATION
• Changesintaxationarrangementsinvariousterritories.
• Collateraleffectsofchangesinfinancialregulatoryframework.
• Trafiguraisincreasinglyfocusedonmaintaininglegal,taxationandregulatoryrisks,giventhemultiplejurisdictionsinwhichitoperatesanditsglobalscope.Trafiguraadherestoapplicablelocalandinternationaltaxlawinthecountrieswhereitoperates,includinglegislationontransferpricing.WearefollowingtheunfoldingdiscussionsonBaseErosionandProfitShifting(BEPS)withintheOrganisationforEconomicCo-operationandDevelopment,andwilladaptourreportingtorespondasandwhenthisproducesmoreconcreterecommendations.
• Wearealsofollowingcloselythediscussionsaboutpotentialnewformsofregulationthatmaybeimposedoncommoditiestradingfirms,forexampleundertheEuropeanUnion’sMiFid2legislation.Wehavemade representations to theappropriateauthoritiesabouttherisksandunnecessarycostsofintroducingpositionlimitsincommodityderivativesmarkets and of imposing regulatory capitalrequirementsoncommoditytradingfirms.
CORPORATE RESPONSIBILITY
• Eliminatingfatalitiesandreducinglost-timeinjuries.
• ImprovingGroupmanagementofrisksposedbyHeavyGoodsVehicles(HGVs).
• ImprovingTrafigura’smanagementofcontractors.
• Enhancingengagementwithnotableinternationalorganisationsinthesphereofcorporateresponsibility.
• OurCorporateResponsibilityPolicyandBusinessPrinciplesarticulatetheleadershipteam’sprioritiesandcommitmentsforsocialandenvironmentalgovernance.Attheoperationallevel,theyoutlinewhatisexpectedfromeveryoneintheGroup,itsdivisionsandoperatingcompanies.EachdivisionandoperatingcompanyisrequiredtosupplementthePolicyandPrincipleswithrelevant,sector-specificstandardsandprocedurestomanagetheimpactsoftheiroperations.
• TheHSECSteeringCommitteerequiresalldivisionsandoperatingcompaniestomaintainamaterialriskregisterdescribingthekeyissuestheyneedtomanageandmitigate.
• AllHSECincidentsarerecordedandcategorisedforseverity on Safeguard, the Group’s HSEC datamanagementsystem.Incidentsregisteredaslevels3,4or5,involvingsignificantspillsorsingleormultiplefatalities,aswellashigh-potentialnearmissesareinvestigatedandtheresultsandremedialactionsarepresentedtotheSteeringCommittee.
•Weengageactivelywithleadingindustryforums,includingtheUNGlobalCompact,theEITIandtheWorldBusinessCouncilforSustainableDevelopment(WBCSD).
See Trafigura’s 2016 Responsibility Report for further information on these activities. www.trafigura.com/responsibility.
TRAFIGURA 2016 ANNUAL REPORT 37
RIS
K M
AN
AG
EM
EN
T A
ND
FU
ND
ING
MO
DE
L

FINANCE TO MEET DIVERSE BUSINESS NEEDS
CONTINUING ACCESS TO CAPITAL
Trafigura’sactivitiesrequiresubstantialamountsofcapital.Wesource,store,blendanddelivercommoditiesaroundtheglobe.Weinvestinterminals,logisticsandphysicalinfrastructuretoimprovetheefficiencyofourtradingoperations.
Ourdiversifiedfundingmodelallowsustocontinuetooperateeffectivelyandsuccessfullyinallmarketconditions.Itsscalabilityandstructureprotectsthebusinessfrommarketshocksandprovidesflexibilityandtheabilitytocapitaliseonopportunitiesastheyarise.
Wehaveputaglobalprogrammeofflexible,short-termfacilitiesinplacetofinanceourday-to-dayoperationsandaprogrammeoflonger-term,corporatefacilitiestofinanceourassetacquisitionandothercorporaterequirements.Availablefundingexceedsoureverydayrequirements.Thisprovidesheadroomforunusualmarketconditions.Wealsomaintainsubstantialcashbalancestoensurewewillalwaysmeetday-to-daycapitalcommitments,eveninunexpectedcircumstances.
OUR APPROACH TO FUNDING
DIVERSIFICATION IMPROVES COMPETITIVENESS AND ACCESS TO CAPITALWediversifyboththesourcesandthestructureofourfinancingtominimiseriskandmaximiseoperationaleffectiveness.
WeraisefundsinavarietyofmarketsintheUS,EuropeandAsia-Pacific.Wehavelendingarrangementsinplacewith121banksaroundtheworld.Wearethereforenotconstrainedbycreditrestrictionsforspecificfinancialinstitutions,sectorsorregions.
Weraisecapitalwitharangeofrepaymentschedules,fromveryshort-termfacilitiestomaturitiesgreaterthan10years.Thisspreadsourexposureacrosstheyieldcurve.
MATCH-FUNDED, COLLATERALISED LENDING REDUCES CREDIT RISKAsamatterofpolicy,wematchthetypeoffinancingtothebusinessrequirement.Wehaveestablishedathree-pillarfundingstructuretoputthisintopractice.
Weuseshort-termfinancingfortrading.Theseloansaresecuredagainsttheunderlyingphysicalcommodities.Linesaremarked-to-marketeachweeksotheleveloffinancingtracksthevalueoftheunderlyingcollateralaspriceschange.Weraiselonger-termdebttofinancefixedassetsandinvestments.
HOW OUR FUNDING MODEL WORKS IN PRACTICE
TRANSACTION COMPONENT
DAY 1: TRADE AGREEMENT
DAYS 2 – 40: PRICING PERIOD
DAYS 41 – 45: LOADING
DAYS 46 – 100: TRANSPORTATION
DAYS 101 – 105: DELIVERY
Brent contract = $50 Dubai contract = $49
Oil major issues invoice to Trafigura
Average Brent contract = $52 Average Dubai contract = $50
Trafigura issues invoice to refinery.Invoice is securitised with SPV as beneficiary.
PHYSICAL TRADE Trafigura agrees:(1) To buy crude, (2) To sell crude(see key for trade details)
Buy 1m bbls @ Brent-$1 Counterparty draws on LC -$51m
Sell 1m bbls @ Dubai +$4 (transaction value = $54m)
NET
RES
ULT
$415
,00
0 P
ROFI
T
FINANCE PHYSICAL BUY LEG BY ISSUING LETTER OF CREDIT (LC)
Bank issues LC, drawable on loading date
Drawdown amount moves onto balance sheet as secured loan: +$51m
Loan marked-to-market (physical excess/deficit)
Securitisation programme refinances loan -$51m (principal) -$85,000 (1% interest) for 60 days
HEDGE BUY LEG WITH BRENT FUTURES Buy 1,000 Brent futures @50
-$2m (initial margin)Mark-to-market daily (variation margin)
Sell 1,000 Brent futures @52 +$2m (initial margin) (realised p/l = +$2m)
HEDGE SALES LEG WITH DUBAI FUTURES Sell 1,000 Dubai futures @49
-$2m (initial margin)Mark-to-market daily (variation margin)
Buy 1,000 Dubai futures @50 +$2m (initial margin) (realised p/l = -$1m)
FREIGHT COSTCharter tanker for 65 days @ $3.50/bbl -$3.5m
PHYSICAL SALES LEGSecuritisation vehicle receives payment for cargo from refinery +$54m on 30 days payment terms
NET CASH FLOW Initial margin: -$4m • Return of initial margin: +$4m• Realised profit on futures: +$1m• Transportation costs: -$3.5m Total: +$1.5m
• Proceeds from physical sale: +$54m• Repayment of loan principal: -$51m• Payment of loan interest: -$85,000 Total: +$2.92m
KEY:
ThechartontherightillustratestheinteractionbetweenthethreedifferenttypesoffinancingTrafigurausesduringthelifeofanexampletrade.
EXAMPLE CRUDE OIL TRANSACTION:
Trafigura agrees today: (1)Tobuyonemillionbarrelsof
crudefromanoilmajorloadingin41-45days@Brent-$1/bbl.TheBrentpriceisfixedastheaverageduringtheloadingperiod.
(2)Tosellonemillionbarrelsofcrudetoarefineryfordeliveryin101-105days@Dubai+$4/bbl.TheDubaipriceisfixedastheaverageduringtheloadingperiod.
Revolving line:Cashflowsarisingfromhedgingactivityandfreightcosts.
Transactional line:CashflowsarisingfromthephysicaltransactionanditsfinancingbytheLCissuingbank.
Securitisation line:CashflowsbetweenTrafiguraanditsseparatelycapitalisedspecialpurposevehicle(SPV).
Cashinflow
Cashoutflow
Market-contingentcashflow
38 TRAFIGURA 2016 ANNUAL REPORT
FUNDING MODEL

TRANSPARENCY PROMOTES STABILITYAsaprivatecompanyrelyingondebttofinanceitsoperations,Trafigura’sperformanceiscloselyscrutinisedbyalargegroupofbanksworldwide.Wecomplywiththefinancialcovenantsattachedtooursyndicatedbankfacilities.Membersofthefinanceteamregularlymeetourbanks.Thesemeetingsoftenincludeoperationallyfocusedpersonnel(fromCredit,ComplianceandTradingDesks)whoprovideadditionalinsightintoourbusinessmodel.Asanissuerofpubliclylisteddebt,wealsomeetthetransparencyrequirementsofourbondinvestors.Ourinterimandfull-yearreportsarepublishedonline.Weholdregularcallsandpresentationstoupdateinvestorsandrespondtospecificqueriesdirectly.
Our funding strategy matches sources of funding to financing requirements. We have developed diverse financing strategies that maximise scalability, flexibility and business resilience.
PUBLIC RATINGS
Trafiguradoesnotholdapublicratinganddoesnotseektoobtainone.TheGroupfocusesonstrengtheningitsbalancesheetthroughlong-termvaluecreation.
Weobtainourfundingfromstakeholderswhounderstandourbusinessmodelindetailandwhoseinvestmentdecisionsarenotdrivenbyratings.Wehavesignificantlyexpandedoursourcesoffinancingovertheyearsbymaintainingasustainablecreditstandingthatisconsistentwithaninvestment-gradeprofile.
Likewise,theabsenceofaratingmeansthatTrafigura’sbusinessandinvestmentdecisionsarenottakenonthebasisofmaintainingaparticularratinglevel,somethingwhichbecomesparticularlyimportantattimesofhigh-marketvolatility.
OUR THREE-PILLAR FUNDING STRUCTURE
1. TRANSACTIONAL FACILITIESAlltransaction-basedlendingisfullycollateralised.Wefundday-to-daytradingthroughone-to-one(ie,bilateral)agreementswithindividualbanks.Formosttransactions,thisstartswithabankissuinganLConbehalfofthebuyerinfavouroftheseller.ThephysicalcommoditybeingfinancedbytheLCisspecifiedassecurity.Ondelivery,thesellerofthecommoditydrawsdowntheLC,whichthenconvertsintoasecuredloanfromtheLC-issuingbank.Theloanismarked-to-marketatleastweeklyuntilmaturitysothattheamountbeingfinancedalwayscorrespondstothevalueoftheunderlyingcommodity.Thissecuredloanisrepaidbythecashflowfromtheon-saleofthecommodityfromTrafiguratotheend-buyer,withareceivablecreatedoncethesalehasbeenagreed.ThisreceivableiseitherrepaidwhenthecounterpartypaysTrafiguraaccordingtothecredittermsofthetransactionorfromthesecuritisationprogrammeifthereceivableissoldintotheprogramme.
2. SECURITISATION PROGRAMMETrafiguramanagesasecuritisationprogrammethroughaseparatelycapitalisedSPV.TheprogrammefurtherdiversifiesTrafigura’sfundingsourcesand,thankstoitsinvestment-graderatingsfromMoody’sandS&P,isacost-effectivefinancingmechanism.Mosttradesarefinancedonatrade-by-tradebasiswithbilateraltradefinanceloans,butTrafiguracanfundeligiblereceivablesonceaninvoicehasbeenissuedbysellingthemtotheSPV.Securitisingourreceivablesacceleratestherotationofexistingcreditlines,sincesecuredbilateralloanscanberepaidfasterwiththeprogrammeproceeds.
3. CORPORATE CREDIT FACILITIESTrafigurainvestsinfixedassetstosupportourtradingactivity.Wefinancethesewithlong-termdebtadheringtoourpolicyofmatchingassetswithliabilities.Weissuesecuritiesandnegotiatelendingfacilitiesindiversemarkets.Fundingsourcesincludeeurobonds,perpetuals,revolvingcreditfacilities,privateplacementsandtermloans.
CASH ON HAND
HEADROOM
TRANSACTIONALFACILITIES
SECURITISATIONPROGRAMME
CORPORATECREDIT FACILITIES
TRAFIGURA FUNDING MODEL
TRANSACTION COMPONENT
DAY 1: TRADE AGREEMENT
DAYS 2 – 40: PRICING PERIOD
DAYS 41 – 45: LOADING
DAYS 46 – 100: TRANSPORTATION
DAYS 101 – 105: DELIVERY
Brent contract = $50 Dubai contract = $49
Oil major issues invoice to Trafigura
Average Brent contract = $52 Average Dubai contract = $50
Trafigura issues invoice to refinery.Invoice is securitised with SPV as beneficiary.
PHYSICAL TRADE Trafigura agrees:(1) To buy crude, (2) To sell crude(see key for trade details)
Buy 1m bbls @ Brent-$1 Counterparty draws on LC -$51m
Sell 1m bbls @ Dubai +$4 (transaction value = $54m)
NET
RES
ULT
$415
,00
0 P
ROFI
TFINANCE PHYSICAL BUY LEG BY ISSUING LETTER OF CREDIT (LC)
Bank issues LC, drawable on loading date
Drawdown amount moves onto balance sheet as secured loan: +$51m
Loan marked-to-market (physical excess/deficit)
Securitisation programme refinances loan -$51m (principal) -$85,000 (1% interest) for 60 days
HEDGE BUY LEG WITH BRENT FUTURES Buy 1,000 Brent futures @50
-$2m (initial margin)Mark-to-market daily (variation margin)
Sell 1,000 Brent futures @52 +$2m (initial margin) (realised p/l = +$2m)
HEDGE SALES LEG WITH DUBAI FUTURES Sell 1,000 Dubai futures @49
-$2m (initial margin)Mark-to-market daily (variation margin)
Buy 1,000 Dubai futures @50 +$2m (initial margin) (realised p/l = -$1m)
FREIGHT COSTCharter tanker for 65 days @ $3.50/bbl -$3.5m
PHYSICAL SALES LEGSecuritisation vehicle receives payment for cargo from refinery +$54m on 30 days payment terms
NET CASH FLOW Initial margin: -$4m • Return of initial margin: +$4m• Realised profit on futures: +$1m• Transportation costs: -$3.5m Total: +$1.5m
• Proceeds from physical sale: +$54m• Repayment of loan principal: -$51m• Payment of loan interest: -$85,000 Total: +$2.92m
TRAFIGURA 2016 ANNUAL REPORT 39
RIS
K M
AN
AG
EM
EN
T A
ND
FU
ND
ING
MO
DE
L

MANAGEMENT STEERING COMMITTEES
BOARD OF DIRECTORS
INVESTMENT COMMITTEETRADING COMMITTEE
FINANCE ACCOUNTING ITMARKET RISK
MANAGEMENTCOMPLIANCE HSEC HR
BOARD OF DIRECTORS AND COMMITTEES
ThereferenceparentcompanyoftheGroupisTrafiguraGroupPte.Ltd.(TGPL),incorporatedinSingapore.AllGroupactivitiesandassetsgloballyareconsolidatedunderTGPL,whichisalsotheentityforallGroupcorporatereporting.
BOARD OF DIRECTORSTheprincipaloversightbodyfortheGroupistheBoardofDirectors,aunitarystructureestablishedinaccordancewithSingaporelaw.TheBoardofDirectorshasoverallresponsibilityforthestrategicdirectionandmanagementoftheGroupacrossallitsinvestmentsandactivities.ItisresponsibleforoversightoftheGroup,shareholderrelationsandcommercialandfinancingstrategy.MembersoftheBoardofDirectorsarelistedontheoppositepage.FormalmeetingsoftheBoardofDirectorstakeplaceinSingaporeataminimumoffourtimesayear.
Inpractice,thoseDirectorswithexecutiveresponsibilitiesareinconstanttouchwitheachother,andareactivelyinvolvedinarangeofmanagementsteeringcommittees,asoutlinedhere.ManagementoftheGroupischaracterisedbyshortreportinglines,flatstructures,cleardelineationandsegregationofresponsibilities,andpersonalaccountability.
EmployeeremunerationatalllevelsislinkedtoGroupperformanceaswellasindividualcontribution.Asshareholders,seniortradersandfront-andback-officepersonnelhaveapersonalstakeinthebusinessandarethereforeinvestedinitslong-termsuccess.
MANAGEMENT STEERING COMMITTEESUndertheBoardofDirectors,anumberofmanagementsteeringcommitteescoordinatetheday-to-daymanagementofTrafigura.
During2016,twonewmanagementcommitteeswereestablishedtooverseethetradingbusinessontheonehandandinvestmentsontheother.TheTradingCommitteeisresponsibleformanagingthetradingactivitiesofTrafigurawithinthefinancialandoperatingparameterssetbytheBoard.
The InvestmentCommittee is responsible fordefiningandimplementinganinvestmentstrategyandriskframeworkfortheGroupanditssubsidiaries.Theworkofthesecommitteeshasalreadyenhancedourmanagementprocess.Inadditionthefollowingsteeringcommitteescontinuetoprovidevitalsupport:• FinanceCommittee• AccountingCommittee• ITSteeringCommittee• MarketRiskManagementCommittee• ComplianceCommittee• HSECCommittee• HRGroup
Trafiguraisexclusivelyownedbyitsmanagementandactiveemployees,whoarethereforefocusedonthelong-termsuccessofthebusiness,promotingmanagementdepthandstability,andencouragingprudentriskmanagement.
40 TRAFIGURA 2016 ANNUAL REPORT
CORPORATE GOVERNANCE
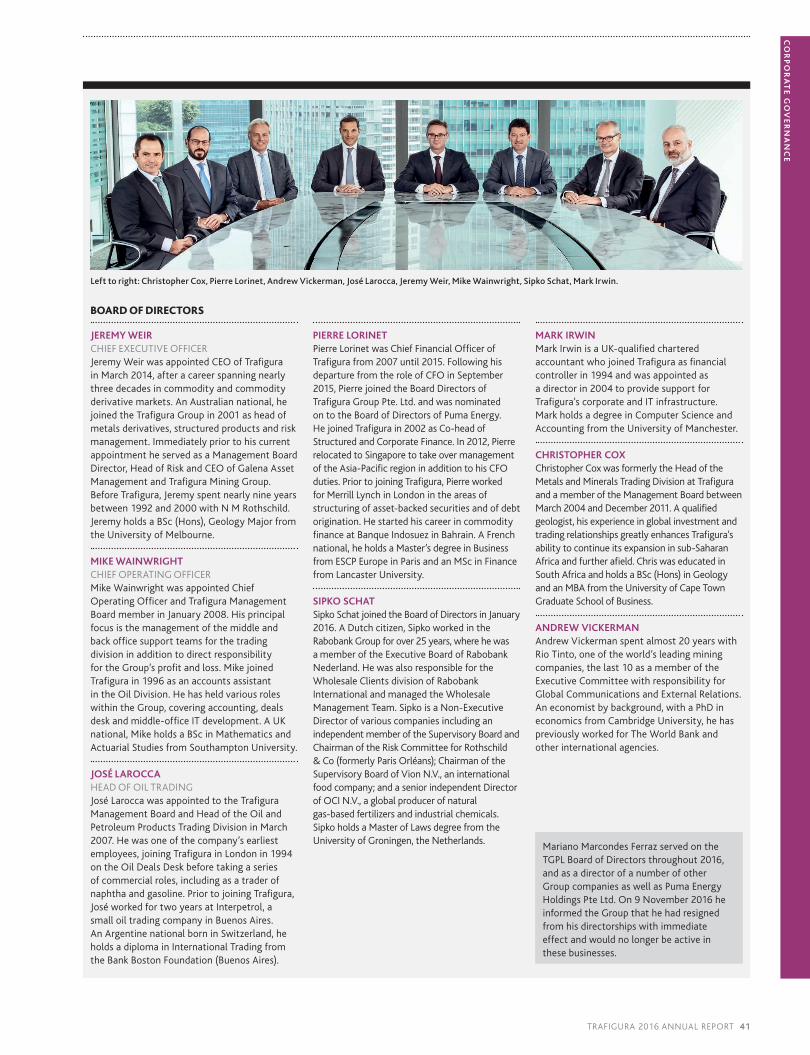
BOARD OF DIRECTORS
JEREMY WEIRCHIEFEXECUTIVEOFFICERJeremyWeirwasappointedCEOofTrafigurainMarch2014,afteracareerspanningnearlythreedecadesincommodityandcommodityderivativemarkets.AnAustraliannational,hejoinedtheTrafiguraGroupin2001asheadofmetalsderivatives,structuredproductsandriskmanagement.ImmediatelypriortohiscurrentappointmentheservedasaManagementBoardDirector,HeadofRiskandCEOofGalenaAssetManagementandTrafiguraMiningGroup.BeforeTrafigura,Jeremyspentnearlynineyearsbetween1992and2000withNMRothschild.JeremyholdsaBSc(Hons),GeologyMajorfromtheUniversityofMelbourne.
MIKE WAINWRIGHTCHIEFOPERATINGOFFICERMikeWainwrightwasappointedChiefOperatingOfficerandTrafiguraManagementBoardmemberinJanuary2008.HisprincipalfocusisthemanagementofthemiddleandbackofficesupportteamsforthetradingdivisioninadditiontodirectresponsibilityfortheGroup’sprofitandloss.MikejoinedTrafigurain1996asanaccountsassistantintheOilDivision.HehasheldvariousroleswithintheGroup,coveringaccounting,dealsdeskandmiddle-officeITdevelopment.AUKnational,MikeholdsaBScinMathematicsandActuarialStudiesfromSouthamptonUniversity.
JOSÉ LAROCCAHEADOFOILTRADINGJoséLaroccawasappointedtotheTrafiguraManagementBoardandHeadoftheOilandPetroleumProductsTradingDivisioninMarch2007.Hewasoneofthecompany’searliestemployees,joiningTrafigurainLondonin1994ontheOilDealsDeskbeforetakingaseriesofcommercialroles,includingasatraderofnaphthaandgasoline.PriortojoiningTrafigura,JoséworkedfortwoyearsatInterpetrol,asmalloiltradingcompanyinBuenosAires.AnArgentinenationalborninSwitzerland,heholdsadiplomainInternationalTradingfromtheBankBostonFoundation(BuenosAires).
PIERRE LORINETPierreLorinetwasChiefFinancialOfficerofTrafigurafrom2007until2015.FollowinghisdeparturefromtheroleofCFOinSeptember2015,PierrejoinedtheBoardDirectorsofTrafiguraGroupPte.Ltd.andwasnominatedontotheBoardofDirectorsofPumaEnergy.HejoinedTrafigurain2002asCo-headofStructuredandCorporateFinance.In2012,PierrerelocatedtoSingaporetotakeovermanagementoftheAsia-PacificregioninadditiontohisCFOduties.PriortojoiningTrafigura,PierreworkedforMerrillLynchinLondonintheareasofstructuringofasset-backedsecuritiesandofdebtorigination.HestartedhiscareerincommodityfinanceatBanqueIndosuezinBahrain.AFrenchnational,heholdsaMaster’sdegreeinBusinessfromESCPEuropeinParisandanMScinFinancefromLancasterUniversity.
SIPKO SCHAT SipkoSchatjoinedtheBoardofDirectorsinJanuary2016.ADutchcitizen,SipkoworkedintheRabobankGroupforover25years,wherehewasamemberoftheExecutiveBoardofRabobankNederland.HewasalsoresponsiblefortheWholesaleClientsdivisionofRabobankInternationalandmanagedtheWholesaleManagementTeam.SipkoisaNon-ExecutiveDirectorofvariouscompaniesincludinganindependentmemberoftheSupervisoryBoardandChairmanoftheRiskCommitteeforRothschild&Co(formerlyParisOrléans);ChairmanoftheSupervisoryBoardofVionN.V.,aninternationalfoodcompany;andaseniorindependentDirectorofOCIN.V.,aglobalproducerofnaturalgas-basedfertilizersandindustrialchemicals.SipkoholdsaMasterofLawsdegreefromtheUniversityofGroningen,theNetherlands.
MARK IRWINMarkIrwinisaUK-qualifiedcharteredaccountantwhojoinedTrafiguraasfinancialcontrollerin1994andwasappointedasadirectorin2004toprovidesupportforTrafigura’scorporateandITinfrastructure.MarkholdsadegreeinComputerScienceandAccountingfromtheUniversityofManchester.
CHRISTOPHER COX ChristopherCoxwasformerlytheHeadoftheMetalsandMineralsTradingDivisionatTrafiguraandamemberoftheManagementBoardbetweenMarch2004andDecember2011.Aqualifiedgeologist,hisexperienceinglobalinvestmentandtradingrelationshipsgreatlyenhancesTrafigura’sabilitytocontinueitsexpansioninsub-SaharanAfricaandfurtherafield.ChriswaseducatedinSouthAfricaandholdsaBSc(Hons)inGeologyandanMBAfromtheUniversityofCapeTownGraduateSchoolofBusiness.
ANDREW VICKERMAN AndrewVickermanspentalmost20yearswithRioTinto,oneoftheworld’sleadingminingcompanies,thelast10asamemberoftheExecutiveCommitteewithresponsibilityforGlobalCommunicationsandExternalRelations.Aneconomistbybackground,withaPhDineconomicsfromCambridgeUniversity,hehaspreviouslyworkedforTheWorldBankandotherinternationalagencies.
Left to right: Christopher Cox, Pierre Lorinet, Andrew Vickerman, José Larocca, Jeremy Weir, Mike Wainwright, Sipko Schat, Mark Irwin.
MarianoMarcondesFerrazservedontheTGPLBoardofDirectorsthroughout2016,andasadirectorofanumberofotherGroupcompaniesaswellasPumaEnergyHoldingsPteLtd.On9November2016heinformedtheGroupthathehadresignedfromhisdirectorshipswithimmediateeffectandwouldnolongerbeactiveinthesebusinesses.
CO
RP
OR
AT
E G
OV
ER
NA
NC
E
TRAFIGURA 2016 ANNUAL REPORT 41

42TRAFIGURA2016ANNUALREPORT
CONTENTS FOR THE
FINANCIAL STATEMENTS
FINANCIAL STATEMENTS45 ConsolidatedStatementofIncome45 ConsolidatedStatementofOtherComprehensiveIncome46 ConsolidatedStatementofFinancialPosition47 ConsolidatedStatementofChangesinEquity49 ConsolidatedStatementofCashFlows50 NotestoConsolidatedFinancialStatements
OV
ER
VIE
WF
INA
NC
IAL S
TA
TE
ME
NT
S
TRAFIGURA2016ANNUALREPORT43

FINANCIAL STATEMENTS
INDEPENDENT AUDITOR’S REPORT
To: the Shareholders and the Board of Directors of Trafigura Group Pte. Ltd.
REPORT ON THE CONSOLIDATED FINANCIAL STATEMENTSWe have audited the accompanying consolidated financial statements for the year ended 30 September 2016 of Trafigura Group Pte. Ltd., Singapore, which comprise the consolidated statement of financial position as at 30 September 2016, the consolidated statements of income, other comprehensive income, changes in equity and cash flows for the year then ended and notes comprising a summary of the significant accounting policies and other explanatory information.
MANAGEMENT’S RESPONSIBILITYManagement is responsible for the preparation and fair presentation of the consolidated financial statements and for the preparation of the report of the Board of Directors, both in accordance with International Financial Reporting Standards as issued by the IASB. Furthermore, management is responsible for such internal control as it determines is necessary to enable the preparation of consolidated financial statements that are free from material misstatement, whether due to fraud or error.
AUDITOR’S RESPONSIBILITYOur responsibility is to express an opinion on these consolidated financial statements based on our audit. We conducted our audit in accordance with Dutch law, including the Dutch Standards on Auditing. This requires that we comply with ethical requirements and plan and perform the audit to obtain reasonable assurance about whether the consolidated financial statements are free from material misstatement.
An audit involves performing procedures to obtain audit evidence about the amounts and disclosures in the consolidated financial statements. The procedures selected depend on the auditor’s judgment, including the assessment of the risks of material misstatement of the consolidated financial statements, whether due to fraud or error.
In making those risk assessments, the auditor considers internal control relevant to the entity’s preparation and fair presentation of the consolidated financial statements in order to design audit procedures that are appropriate in the circumstances, but not for the purpose of expressing an opinion on the effectiveness of the entity’s internal control. An audit also includes evaluating the appropriateness of accounting policies used and the reasonableness of accounting estimates made by management, as well as evaluating the overall presentation of the consolidated financial statements.
We believe that the audit evidence we have obtained is sufficient and appropriate to provide a basis for our audit opinion.
OPINION WITH RESPECT TO THE CONSOLIDATED FINANCIAL STATEMENTSIn our opinion, the consolidated financial statements give a true and fair view of the financial position of Trafigura Group Pte. Ltd. as at 30 September 2016, its result and its cash flows for the year then ended in accordance with International Financial Reporting Standards as issued by the IASB.
Amsterdam, 2 December 2016Ernst & Young Accountants LLPSigned by W.J. Smit
44 TRAFIGURA 2016 ANNUAL REPORT

A. CONSOLIDATED STATEMENT OF INCOME
Note 2016 2015
USD’M USD’M
Revenue 7 98,097.8 97,236.5 Cost of sales (95,806.6) (94,636.1)
Gross profit 4 2,291.2 2,600.4
Other income/(expenses) 8 (233.2) (198.4)General and administrative expenses 9 (946.7) (994.8)
Results from operating activities 1,111.3 1,407.2
Finance income 387.0 228.5 Finance expense (507.7) (479.0)
Net financing costs (120.7) (250.5)
Share of profit/(loss) of equity-accounted investees 13 94.3 87.8 Profit before tax 1,084.9 1,244.5
Income tax expense 10 (110.2) (141.1)
Profit for the year 974.7 1,103.4
Profit attributable to Owners of the Company 750.8 1,235.9 Non-controlling interests 22 223.9 (132.5)
Profit for the year 974.7 1,103.4 See accompanying notes
B. CONSOLIDATED STATEMENT OF OTHER COMPREHENSIVE INCOME
Note 2016 2015
USD’M USD’M
Profit for the year 974.7 1,103.4
Other comprehensive incomeItems that are or may be reclassified to profit or loss:Gain/(loss) on cash flow hedges 21 45.1 (69.9)Tax on comprehensive income 10 (3.3) 5.2Exchange loss on translation of foreign operations (70.0) (83.0)Share of other comprehensive income from associates (exchange loss on translation of foreign operations) (45.4) (240.6)
Items that will not be reclassified to profit or loss:Net change in fair value of financial assets at fair value through OCI 16 (31.7) (91.9)
Other comprehensive income for the year net of tax (105.3) (480.2)
Total comprehensive income for the year 869.4 623.2
Total comprehensive income attributable toOwners of the Company 631.1 766.9Non-controlling interests 238.3 (143.7)
Total comprehensive income for the year 869.4 623.2See accompanying notes
TRAFIGURA 2016 ANNUAL REPORT 45
FIN
AN
CIA
L ST
AT
EM
EN
TS

FINANCIAL STATEMENTS
C. CONSOLIDATED STATEMENT OF FINANCIAL POSITION
Note 30 September
2016 30 September
2015
USD’M USD’M
Assets Property, plant and equipment 11 2,345.0 2,400.3Intangible assets 12 230.5 245.8Equity-accounted investees 13 3,464.4 3,167.5Prepayments 14 945.3 1,067.2Loans receivable 15 801.3 440.1Other investments 16 540.3 809.2Derivatives 27 97.3 57.0Deferred tax assets 10 103.8 169.9
Total non-current assets 8,527.9 8,357.0
Inventories 17 11,537.7 7,614.4Trade and other receivables 18 15,199.9 13,902.3Derivatives 27 476.3 3,326.2Prepayments 14 2,259.8 2,110.8Income tax receivable 10 78.7 106.5Deposits 20 7.9 46.9Cash and cash equivalents 20 3,141.9 3,534.2
Total current assets 32,702.2 30,641.3
Non-current assets classified as held for sale 6 – 88.4
Total assets 41,230.1 39,086.7
Equity Share capital 21 1,503.7 1,503.7Capital securities 21 646.7 640.6Reserves 21 (558.7) (505.9)Retained earnings 21 3,956.3 3,962.5
Equity attributable to the owners of the Company 5,548.0 5,600.9Non-controlling interests 22 299.1 56.7
Total group equity 5,847.1 5,657.6
Liabilities Loans and borrowings 23 7,234.2 7,289.7Derivatives 27 237.8 173.3Provisions 24 69.3 83.9Deferred tax liabilities 10 189.5 253.1
Total non-current liabilities 7,730.8 7,800.0
Current tax liabilities 10 245.6 270.5Loans and borrowings 23 18,033.0 14,668.2Trade and other payables 25 8,952.5 9,486.3Derivatives 27 421.1 1,204.1 Total current liabilities 27,652.2 25,629.1
Total group equity and liabilities 41,230.1 39,086.7See accompanying notes
46 TRAFIGURA 2016 ANNUAL REPORT
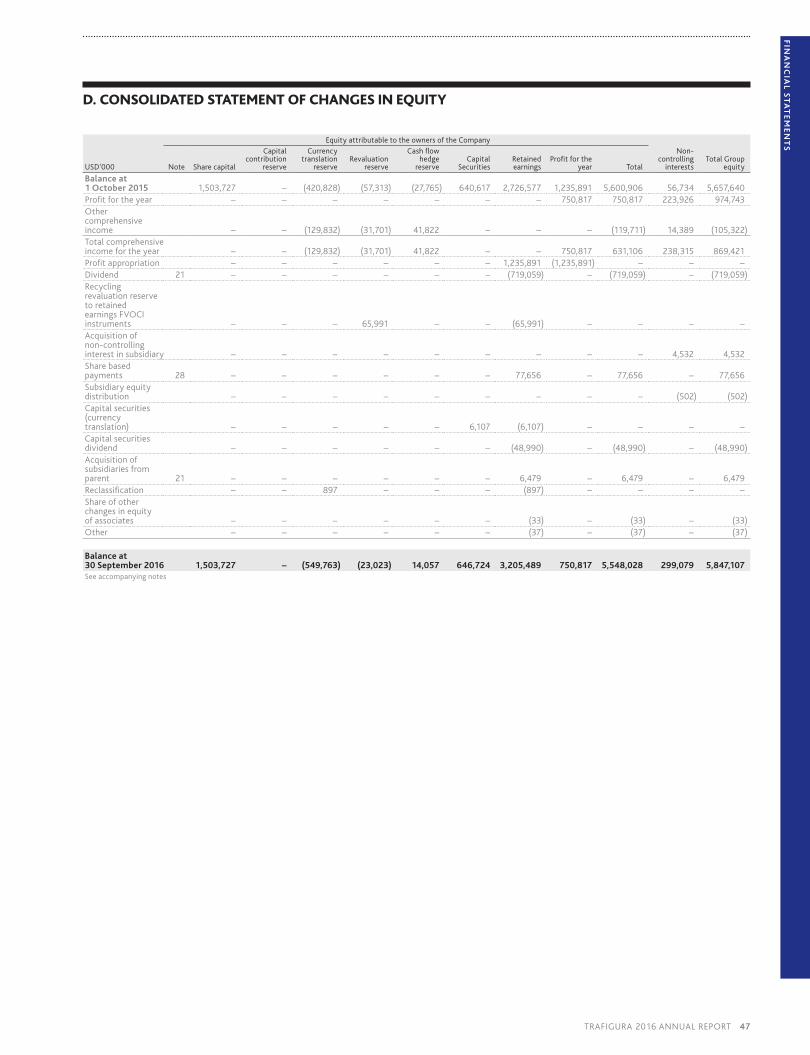
D. CONSOLIDATED STATEMENT OF CHANGES IN EQUITY
Equity attributable to the owners of the Company
USD’000 Note Share capital
Capital contribution
reserve
Currency translation
reserveRevaluation
reserve
Cash flow hedge
reserveCapital
SecuritiesRetained earnings
Profit for the year Total
Non-controlling
interestsTotal Group
equity
Balance at 1 October 2015 1,503,727 – (420,828) (57,313) (27,765) 640,617 2,726,577 1,235,891 5,600,906 56,734 5,657,640Profit for the year – – – – – – – 750,817 750,817 223,926 974,743Other comprehensive income – – (129,832) (31,701) 41,822 – – – (119,711) 14,389 (105,322)Total comprehensive income for the year – – (129,832) (31,701) 41,822 – – 750,817 631,106 238,315 869,421Profit appropriation – – – – – – 1,235,891 (1,235,891) – – –Dividend 21 – – – – – – (719,059) – (719,059) – (719,059)Recycling revaluation reserve to retainedearnings FVOCI instruments – – – 65,991 – – (65,991) – – – –Acquisition of non-controlling interest in subsidiary – – – – – – – – – 4,532 4,532Share based payments 28 – – – – – – 77,656 – 77,656 – 77,656Subsidiary equity distribution – – – – – – – – – (502) (502)Capital securities (currency translation) – – – – – 6,107 (6,107) – – – –Capital securities dividend – – – – – – (48,990) – (48,990) – (48,990)Acquisition of subsidiaries from parent 21 – – – – – – 6,479 – 6,479 – 6,479Reclassification – – 897 – – – (897) – – – –Share of other changes in equity of associates – – – – – – (33) – (33) – (33)Other – – – – – – (37) – (37) – (37)
Balance at 30 September 2016 1,503,727 – (549,763) (23,023) 14,057 646,724 3,205,489 750,817 5,548,028 299,079 5,847,107See accompanying notes
TRAFIGURA 2016 ANNUAL REPORT 47
FIN
AN
CIA
L ST
AT
EM
EN
TS
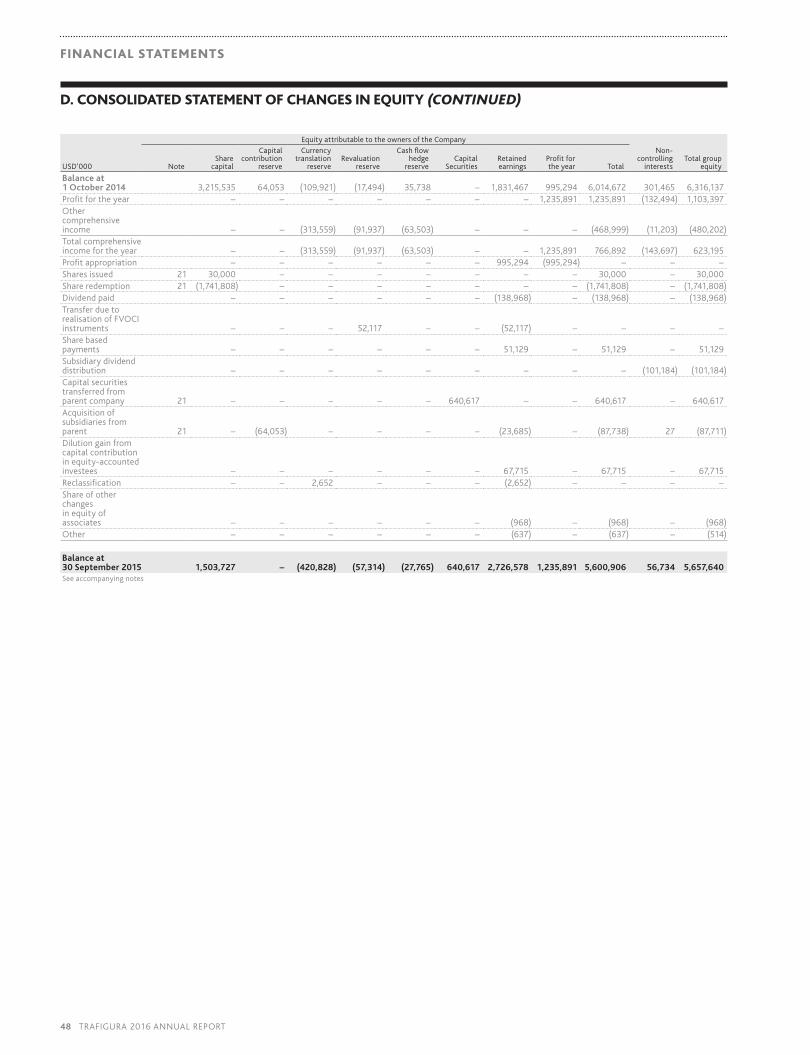
FINANCIAL STATEMENTS
Equity attributable to the owners of the Company
USD’000 NoteShare
capital
Capital contribution
reserve
Currency translation
reserveRevaluation
reserve
Cash flow hedge
reserveCapital
SecuritiesRetained earnings
Profit for the year Total
Non-controlling
interestsTotal group
equity
Balance at 1 October 2014 3,215,535 64,053 (109,921) (17,494) 35,738 – 1,831,467 995,294 6,014,672 301,465 6,316,137Profit for the year – – – – – – – 1,235,891 1,235,891 (132,494) 1,103,397Other comprehensive income – – (313,559) (91,937) (63,503) – – – (468,999) (11,203) (480,202)Total comprehensive income for the year – – (313,559) (91,937) (63,503) – – 1,235,891 766,892 (143,697) 623,195Profit appropriation – – – – – – 995,294 (995,294) – – –Shares issued 21 30,000 – – – – – – – 30,000 – 30,000Share redemption 21 (1,741,808) – – – – – – – (1,741,808) – (1,741,808)Dividend paid – – – – – – (138,968) – (138,968) – (138,968)Transfer due to realisation of FVOCI instruments – – – 52,117 – – (52,117) – – – –Share based payments – – – – – – 51,129 – 51,129 – 51,129Subsidiary dividend distribution – – – – – – – – – (101,184) (101,184)Capital securities transferred fromparent company 21 – – – – – 640,617 – – 640,617 – 640,617Acquisition of subsidiaries from parent 21 – (64,053) – – – – (23,685) – (87,738) 27 (87,711)Dilution gain from capital contribution in equity-accounted investees – – – – – – 67,715 – 67,715 – 67,715Reclassification – – 2,652 – – – (2,652) – – – –Share of other changes in equity ofassociates – – – – – – (968) – (968) – (968)Other – – – – – – (637) – (637) – (514)
Balance at 30 September 2015 1,503,727 – (420,828) (57,314) (27,765) 640,617 2,726,578 1,235,891 5,600,906 56,734 5,657,640See accompanying notes
D. CONSOLIDATED STATEMENT OF CHANGES IN EQUITY (CONTINUED)
48 TRAFIGURA 2016 ANNUAL REPORT
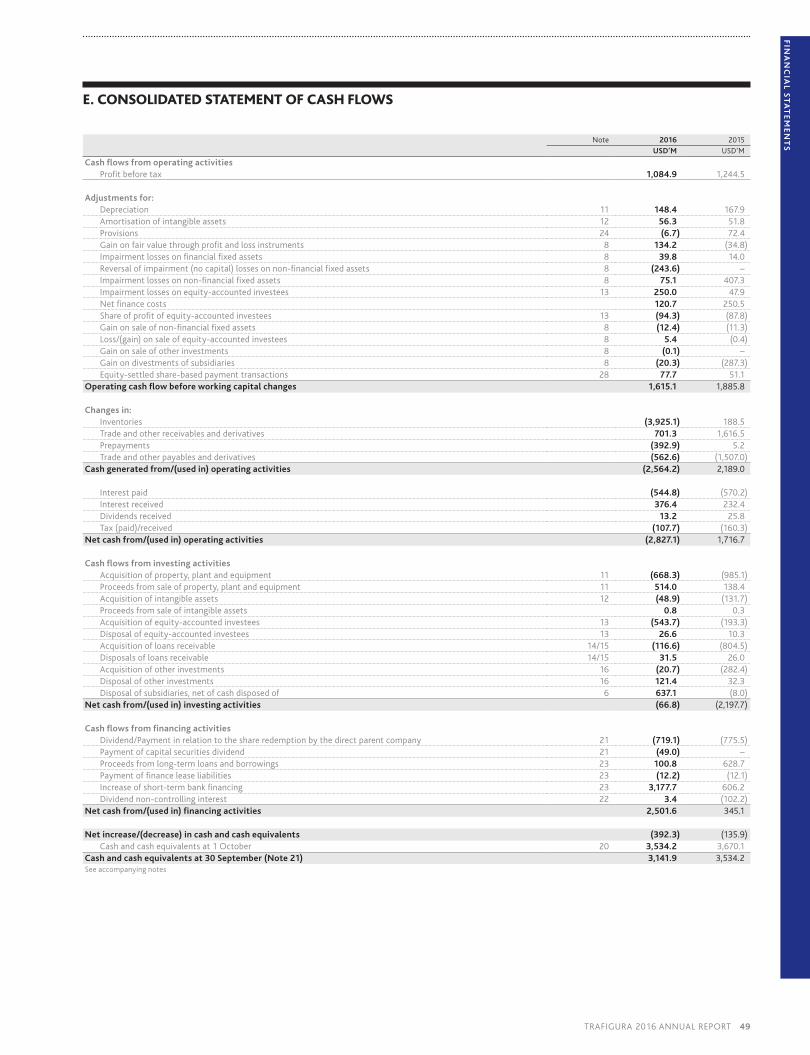
E. CONSOLIDATED STATEMENT OF CASH FLOWS
Note 2016 2015
USD’M USD’M
Cash flows from operating activities Profit before tax 1,084.9 1,244.5
Adjustments for:Depreciation 11 148.4 167.9Amortisation of intangible assets 12 56.3 51.8Provisions 24 (6.7) 72.4Gain on fair value through profit and loss instruments 8 134.2 (34.8)Impairment losses on financial fixed assets 8 39.8 14.0Reversal of impairment (no capital) losses on non-financial fixed assets 8 (243.6) –Impairment losses on non-financial fixed assets 8 75.1 407.3Impairment losses on equity-accounted investees 13 250.0 47.9Net finance costs 120.7 250.5Share of profit of equity-accounted investees 13 (94.3) (87.8)Gain on sale of non-financial fixed assets 8 (12.4) (11.3)Loss/(gain) on sale of equity-accounted investees 8 5.4 (0.4)Gain on sale of other investments 8 (0.1) –Gain on divestments of subsidiaries 8 (20.3) (287.3)Equity-settled share-based payment transactions 28 77.7 51.1
Operating cash flow before working capital changes 1,615.1 1,885.8
Changes in: Inventories (3,925.1) 188.5Trade and other receivables and derivatives 701.3 1,616.5Prepayments (392.9) 5.2Trade and other payables and derivatives (562.6) (1,507.0)
Cash generated from/(used in) operating activities (2,564.2) 2,189.0
Interest paid (544.8) (570.2)Interest received 376.4 232.4Dividends received 13.2 25.8Tax (paid)/received (107.7) (160.3)
Net cash from/(used in) operating activities (2,827.1) 1,716.7
Cash flows from investing activities Acquisition of property, plant and equipment 11 (668.3) (985.1)Proceeds from sale of property, plant and equipment 11 514.0 138.4Acquisition of intangible assets 12 (48.9) (131.7)Proceeds from sale of intangible assets 0.8 0.3Acquisition of equity-accounted investees 13 (543.7) (193.3)Disposal of equity-accounted investees 13 26.6 10.3Acquisition of loans receivable 14/15 (116.6) (804.5)Disposals of loans receivable 14/15 31.5 26.0Acquisition of other investments 16 (20.7) (282.4)Disposal of other investments 16 121.4 32.3Disposal of subsidiaries, net of cash disposed of 6 637.1 (8.0)
Net cash from/(used in) investing activities (66.8) (2,197.7)
Cash flows from financing activities Dividend/Payment in relation to the share redemption by the direct parent company 21 (719.1) (775.5)Payment of capital securities dividend 21 (49.0) –Proceeds from long-term loans and borrowings 23 100.8 628.7Payment of finance lease liabilities 23 (12.2) (12.1)Increase of short-term bank financing 23 3,177.7 606.2Dividend non-controlling interest 22 3.4 (102.2)
Net cash from/(used in) financing activities 2,501.6 345.1 Net increase/(decrease) in cash and cash equivalents (392.3) (135.9)
Cash and cash equivalents at 1 October 20 3,534.2 3,670.1Cash and cash equivalents at 30 September (Note 21) 3,141.9 3,534.2See accompanying notes
TRAFIGURA 2016 ANNUAL REPORT 49
FIN
AN
CIA
L ST
AT
EM
EN
TS

FINANCIAL STATEMENTS
1. CORPORATE INFORMATIONThe principal business activities of Trafigura Group Pte. Ltd. (the Company) and together with its subsidiaries (the Group) are trading and investing in crude and petroleum products, non-ferrous concentrates, refined metals and bulk commodities such as coal and iron ore. The Group also invests in assets, including through investments in associates, which have strong synergies with its core trading activities. These include storage terminals, service stations, metal warehouses and mines.
The Company is incorporated in Singapore and its principal business office is at 10 Collyer Quay, Ocean Financial Centre, #29-00, Singapore, 049315.
The immediate and ultimate holding companies of the Company are Trafigura Beheer B.V. and Farringford N.V., respectively. Trafigura Beheer B.V. is incorporated in The Netherlands and Farringford N.V. is incorporated in Curacao.
The consolidated financial statements for the year ended 30 September 2016 were authorised for issue by the Board of Directors on 2 December 2016.
2. BASIS OF PREPARATIONThe Company’s consolidated financial statements have been prepared in accordance with International Financial Reporting Standards (‘IFRS’) as issued by the International Accounting Standards Board (‘IASB’).
The consolidated financial statements have been prepared under the historical cost convention except for inventories, derivatives and certain other financial instruments that have been measured at fair value. The consolidated financial statements have been prepared on a going concern basis.
a. Functional and presentation currencyThe Group’s presentation currency is the US dollar (USD) and all values are rounded to the nearest tenth of a million (USD’M 0.1) except when otherwise indicated. The US dollar is the functional currency of most of the Group’s principal operating subsidiaries. Most of the markets in which the Group is involved are USD denominated.
3. SIGNIFICANT ACCOUNTING POLICIESThe consolidated financial statements have been prepared in compliance with IFRS. The company has consistently applied the accounting policies used in the preparation of its opening IFRS statement of financial position and throughout all periods presented, as if these policies had always been in effect.
a. Basis of consolidationThe consolidated financial statements include the assets, liabilities and results of operations of all subsidiaries and branch offices, which the Company, either directly or indirectly, controls. Control is achieved when the Group is exposed, or has rights, to variable returns from its involvement with the investee and has the ability to affect those returns through its power over the investee. When the Group has less than a majority of the voting or similar rights of an investee, the Group considers all relevant facts and circumstances in assessing whether it has power over an investee.
Subsidiaries are consolidated from the date on which control is obtained by the Company and cease to be consolidated from the date on which control is transferred to a person or entity outside of the control of the Company. All intra-group assets and liabilities, equity,
income, expenses and cash flows relating to transactions between members of the Group are eliminated in full on consolidation.
Changes in the Company’s interests in subsidiaries that do not result in a loss of control are accounted for as equity transactions with any difference between the amount by which the non-controlling interests are adjusted and the fair value of the consideration paid or received being recognised directly in equity and attributed to equity holders of the Company.
If the Group loses control, the Group derecognises the assets and liabilities of the subsidiary, any non-controlling interests and the other components of equity related to the subsidiary. The parent’s share of components previously recognised in other comprehensive income (OCI) is reclassified to profit and loss or retained earnings, as would be required if the Group had directly disposed of the related assets or liabilities. Any surplus or deficit arising on the loss of control is recognised in profit or loss. If the Group retains any interest in the previous subsidiary, then such interest is measured at fair value at the date that control is lost. Subsequently it is accounted for as an equity-accounted investee or as an equity investment depending on the level of influence retained.
Non-controlling interests in subsidiaries are identified separately from the Company’s equity and are initially measured either at fair value or at the non-controlling interests’ proportionate share of the fair value of the acquiree’s identifiable net assets. Subsequent to acquisition, the carrying amount of non-controlling interests is the amount of those interests at initial recognition plus the non-controlling interests’ share of subsequent changes in equity. Total comprehensive income is attributed to non-controlling interests even if this results in the non-controlling interests having a deficit balance.
b. Investments in equity-accounted investeesAssociates and joint ventures (together ‘Associates’) in which the Group exercises significant influence or joint control are accounted for using the equity method. Significant influence is the power to participate in the financial and operating policy decisions of the investee but not control those policies. Joint control is established by contractual agreement and requires unanimous consent for strategic financial and operating decisions. The considerations made in determining significant influence or joint control are similar to those necessary to determine control over subsidiaries.
Under the equity method the investment in an Associate is initially recognised at cost. The carrying amount of the investment is adjusted to recognise changes in the Group’s share in the net assets of the Associate or joint venture since acquisition date. Goodwill relating to the associate or joint venture is included in the carrying amount of the investment and is neither amortised nor individually tested for impairment. The statement of income reflects the Group’s share of the results of operations of the associate. Any change in OCI of those investees is presented as part of the Group’s OCI. In addition, when there has been a change recognised directly in the equity of the associate or joint venture, the Group recognises its share of any changes, when applicable, in the statement of changes in equity.
Unrealised gains and losses resulting from transactions between the Group and the Associate are eliminated to the extent of the interest in the Associate, unless the sale or contribution of assets constitute a business in which case the gains and losses are recognised in full.
F. NOTES TO CONSOLIDATED FINANCIAL STATEMENTS
50 TRAFIGURA 2016 ANNUAL REPORT

The aggregate of the Group’s share of profit or loss of equity-accounted investees is shown on the face of the statement of income and represents profit or loss after tax and non-controlling interests in the subsidiaries of the associate or joint venture.
The Group determines at each reporting date whether there is any objective evidence that the investment in the Associate is impaired.
The financial statements of the Associates are prepared for the same reporting period as the Group, unless otherwise indicated.
Changes in the Group’s interest in Associates are accounted for as a gain or loss on disposal with any differences between the amount by which the carrying value of the Associate is adjusted and the fair value of the consideration received being recognised directly in the statement of income.
c. Business combinationsThe Company accounts for its business combinations under the acquisition method at the acquisition date, which is the date on which control is transferred to the Group. The cost of an acquisition is measured as the aggregate of the consideration transferred measured at acquisition date fair value and the amount of any non-controlling interests in the acquiree. Transaction costs, other than those associated with the issue of debt or equity securities, that the Group incurs in connection with a business combination are expensed as incurred.
If a business combination is achieved in stages, any previously held equity interest is remeasured at its acquisition date fair value and any resulting gain or loss is recognised in profit or loss except when measured at fair value through OCI. It is then considered in the determination of goodwill.
If the consideration transferred for a business combination exceeds the fair values attributable to the Group’s share of the identifiable net assets, the difference is treated as goodwill, which is not amortised but is reviewed annually for impairment or when there is an indication of impairment. If a business combination results in a negative goodwill, the Group reassesses whether it has correctly identified and measured all assets acquired and all liabilities assumed. If the negative goodwill remains after the reassessment, it is recognised as a gain in the profit or loss.
Any contingent consideration payable is measured at fair value at the acquisition date. If the contingent consideration is classified as equity, then it is not remeasured and settlement is accounted for within equity. Otherwise, subsequent changes in the fair value of the contingent consideration are recognised in profit or loss.
d. Fair value measurementThe Group measures financial instruments, such as derivatives, and certain non-derivative financial assets, at fair value at each balance sheet date. Also, fair values of financial instruments measured at amortised cost are disclosed in Note 27i.
Fair value is the price that would be received to sell an asset or paid to transfer a liability in an orderly transaction between market participants at the measurement date. The fair value measurement is based on the presumption that the transaction to sell the asset or transfer the liability takes place either:
• In the principal market for the asset or liability, or
• In the absence of a principal market, in the most advantageous market for the asset or liability.
The principal or the most advantageous market must be accessible by the Group.
The fair value of an asset or a liability is measured using the assumptions that market participants would use when pricing the asset or liability, assuming that market participants act in their economic best interest.
A fair value measurement of a non-financial asset takes into account a market participant’s ability to generate economic benefits by using the asset in its highest and best use or by selling it to another market participant that would use the asset in its highest and best use.
The Group uses valuation techniques that are appropriate in the circumstances and for which sufficient data are available to measure fair value, maximising the use of relevant observable inputs and minimising the use of unobservable inputs.
All assets and liabilities for which fair value is measured or disclosed in the financial statements are categorised within the fair value hierarchy, described as follows, based on the lowest level input that is significant to the fair value measurement as a whole:
• Level 1 – Quoted (unadjusted) market prices in active markets for identical assets or liabilities.
• Level 2 – Valuation techniques for which the lowest level input that is significant to the fair value measurement is directly or indirectly observable.
• Level 3 – Valuation techniques for which the lowest level input that is significant to the fair value measurement is unobservable.
For assets and liabilities that are recognised in the financial statements on a recurring basis, the Group determines whether transfers have occurred between Levels in the hierarchy by reassessing categorisation (based on the lowest level input that is significant to the fair value measurement as a whole) at the end of each reporting period.
For the purpose of fair value disclosures, the Group has determined classes of assets and liabilities on the basis of the nature, characteristics and risks of the asset or liability and the level of the fair value hierarchy as explained above.
e. Foreign currency(i) Foreign currency transactionsSubsidiaries, joint ventures and equity accounted investees record transactions in the functional currency of the economic environment in which they operate. Transactions in currencies other than the functional currency of the subsidiary, joint ventures and equity investees are recorded at the rates of exchange prevailing at the date of the transaction.
Monetary assets and liabilities in currencies other than the functional currency are translated at the rates of exchange prevailing at the balance sheet date and gains and losses are reported in the statement of income.
(ii) Foreign operationsUpon consolidation, the balance sheets of subsidiaries with functional currencies other than the USD are translated at the rates of exchange prevailing at the end of the year. The statements of income denominated in currencies other than the USD are translated at the average rate for the year. The resulting exchange differences are recorded in equity through other comprehensive income and are included in the statement of income upon sale or liquidation of the underlying foreign operation.
TRAFIGURA 2016 ANNUAL REPORT 51
FIN
AN
CIA
L ST
AT
EM
EN
TS

FINANCIAL STATEMENTS
F. NOTES TO CONSOLIDATED FINANCIAL STATEMENTS (CONTINUED)
f. Financial instrumentsThe financial assets are classified in the following measurement categories:
• Those to be measured subsequently at fair value (either through other comprehensive income, or through profit or loss), and
• Those to be measured at amortised cost.
The classification depends on the Group’s business model for managing the financial assets and the contractual terms of the cash flows.
For assets measured at fair value, gains and losses will either be recorded in profit or loss or other comprehensive income. For investments in debt instruments, this will depend on the business model in which the investment is held. For investments in equity instruments, this will depend on whether the Group has made an irrevocable election at the time of initial recognition to account for the equity investment at fair value through other comprehensive income.
The Group reclassifies debt investments when and only when its business model for managing those assets changes. Reclassification takes place at the first day of the financial year following the financial year in which the business model changes.
At initial recognition, the group measures a financial asset at its fair value plus, in the case of a financial asset not at fair value through profit or loss, transaction costs that are directly attributable to the acquisition of the financial asset. Transaction costs of financial assets carried at fair value through profit or loss are expensed in profit or loss as incurred.
Purchases or sales of financial assets that require delivery of assets within a time frame established by regulation or convention in the market place (regular way trades) are recognised on the trade date i.e., the date that the Group commits to purchase or sell the asset.
Subsequent measurement of debt instruments depends on the Groups business model for managing the asset and the cash flow characteristics of the asset. There are three measurement categories into which the Group classifies its debt instruments:
(i) Amortised costThe Group classifies its financial assets as at amortised cost only if both of the following criteria are met:
• The asset is held within a business model with the objective of collecting the contractual cash flows, and
• The contractual terms give rise on specified dates to cash flows that are solely payments of principal and interest on the principal outstanding.
Financial assets at amortised cost include loans receivable, trade and other receivables, and other financial assets that are held with the objective of collecting contractual cash flows. After initial measurement at fair value, the financial assets are measured at amortised cost using the effective interest rate (EIR) method, less impairment.
Amortised cost is calculated by taking into account any discount or premium on acquisition and fees or costs that are an integral part of the EIR. The EIR amortisation is included in finance income in the statement of profit or loss. The losses arising from impairment are recognised in the statement of profit or loss in other income.
(ii) Fair value through other comprehensive income
Financial assets that are held for collection of contractual cash flows and for selling the financial assets, where the assets’ cash flows represent solely payments of principal and interest, are measured at fair value through other comprehensive income. Movements in the carrying
amount are taken through other comprehensive income, except for the recognition of impairment gains or losses, interest revenue and foreign exchange gains and losses which are recognised in profit or loss. When the financial asset is derecognised, the cumulative gain or loss previously recognised in other comprehensive income is reclassified from equity to profit or loss and recognised in other gains/(losses). Interest income from these financial assets is included in finance income using the effective interest rate method.
(iii) Financial assets at fair value through profit or loss
The Group classifies the following financial assets at fair value through profit or loss:
• Debt investments that do not qualify for measurement at amortised cost;
• Debt investments that do not qualify for measurement at fair value through other comprehensive income; and
• Debt investments that have been designated at fair value through profit or loss.
Financial assets at fair value through profit or loss include financial assets held for trading, debt securities and financial assets designated upon initial recognition at fair value through profit or loss. Financial assets at fair value through profit or loss are carried in the statement of financial position at fair value with net changes in fair value presented as other income/ (expenses) in profit or loss. Interests, dividends and gain/loss on foreign exchange on financial assets at fair value through profit or loss are included separately in finance income or other income respectively.
The Group enters into prepayment agreements where purchases of commodities are prepaid. When the prepayment agreement can be settled in cash or another financial asset, it is classified at amortised cost in line with IFRS 9. When settlement of the prepayment agreement solely occurs by having the commodities physically delivered, these agreements are not classified as financial instruments as they do not meet the definition of a financial asset. Interest received on prepayment agreements is presented in finance income in the statement of profit or loss.
The Group invested in listed equity securities and unlisted equity investments. The Group subsequently measures all equity investments at fair value. The Group classifies the following financial assets at fair value through profit or loss:
• Equity investments that are held for trading; and
• Equity investments for which the entity has not elected to recognise fair value gains and losses through other comprehensive income.
Where Group management has elected to present fair value gains and losses on equity investments in other comprehensive income, there is no subsequent reclassification of fair value gains and losses to profit or loss. Dividends from such investments continue to be recognised in profit or loss as other income when the Groups’ right to receive payments is established. There are no impairment requirements for equity investments measured at fair value through other comprehensive income. Changes in the fair value of financial assets at fair value through profit or loss are recognised in other gain/(losses) in the statement of profit or loss as applicable.
The Group derecognises a financial asset when the contractual rights to the cash flows from the asset expire, or it transfers the rights to receive the contractual cash flows in a transaction in which substantially all the risks and rewards of ownership of the financial asset are transferred.
52 TRAFIGURA 2016 ANNUAL REPORT

Any interest in such transferred financial assets that is created or retained by the Group is recognised as a separate asset or liability.
Financial assets and liabilities are offset and the net amount presented in the statement of financial position if, and only if, the Group has a legal right to offset the amounts and intends either to settle on a net basis or to realise the asset and settle the liability simultaneously.
Non-derivative financial liabilitiesThe Group measures non-derivative financial liabilities at amortised cost. The non-derivative financial liabilities are recognised initially at fair value less any directly attributable transaction costs. Subsequent to initial recognition, the financial liabilities are measured at amortised cost using the effective interest method.
The Group derecognises a financial liability when its contractual obligations are discharged, cancelled or expire.
Derivative financial instruments, including hedge accountingDerivative instruments, which include physical contracts to sell or purchase commodities that do not meet the own use exemption, are initially recognised at fair value when the Group becomes a party to the contractual provisions of the instrument and are subsequently remeasured to fair value at the end of each reporting period. Any attributable transaction costs are recognised in profit or loss as incurred.
The Group utilises derivative financial instruments (shown separately in the statement of financial position) to hedge its primary market risk exposures, primarily risks related to commodity price movements, and to a lesser extent, exposure to foreign currency exchange rates and interest rate movements. Commodity derivative contracts may be utilised to hedge against commodity price risk for fixed priced physical purchase and sales contracts, including inventory. Commodity swaps, options and futures are used to manage price and timing risks in conformity with the Company’s risk management policies.
Generally, the Group does not apply hedge accounting, but in some instances it may elect to apply hedge accounting. The Group elects to apply fair value hedge accounting to hedge certain risk components of non-financial hedged items. When applicable, the Group designates derivative hedging instruments as fair value hedges in relationship to the hedged item. The hedged item may be individual risk components which are separately identifiable and reliably measurable. The designated hedge derivatives are accounted for at fair value through profit and loss and reflected on the balance sheet as either a recognised asset or liability or an unrecognised firm commitment. Each of the identified risk components of the hedged item will be revalued at each period with its corresponding benchmark accounted for at fair value and recognised through profit and loss and reflected on the balance sheet as either a recognised asset or liability or an unrecognised firm commitment. The Group documents at the inception of the hedging transaction the economic relationship between hedging instruments and hedged items including whether the hedging instrument is expected to offset changes in cash flows of hedged items.
Those derivatives qualifying and designated as hedges are either (i) a fair value hedge of the change in fair value of a recognised asset or liability or an unrecognised firm commitment, or (ii) a cash flow hedge of the change in cash flows to be received or paid relating to a recognised asset or liability or a highly probable transaction.
A change in the fair value of derivatives designated as a fair value hedge is reflected together with the change in the fair value of the hedged item in the statement of profit or loss. A change in the fair value of
derivatives designated as a cash flow hedge is initially recognised as a cash flow hedge reserve in OCI. The deferred amount is then released to the statement of profit or loss in the same periods during which the hedged transaction affects the statement of profit or loss.
When a hedging instrument expires, or is sold or terminated, or when a hedge no longer meets the criteria for hedge accounting, any cumulative deferred gain or loss and deferred costs of hedging in equity at that time remain in equity and is reclassified to profit or loss when the forecast transaction affects in profit or loss.
If the hedge ratio for risk management purposes is no longer optimal but the risk management objective remains unchanged and the hedge continues to qualify for hedge accounting, the hedge relationship will be rebalanced by adjusting either the volume of the hedging instrument or the volume of the hedged item so that the hedge ratio aligns with the ratio used for risk management purposes. Any hedge ineffectiveness is calculated and accounted for at the time of the hedge relationship rebalancing.
Current versus non-current classificationDerivative instruments that are not designated as effective hedging instruments are classified as current or non-current or separated into current and non-current portions based on an assessment of the facts and circumstances (i.e. the underlying contractual cash flows).
Where the Group will hold a derivative as an economic hedge (and does not apply hedge accounting) for a period beyond 12 months after the reporting date, the derivative is classified as non-current (or separated into current and noncurrent portions).
g. Cash and cash equivalentsCash and cash equivalents include all cash on hand and short-term highly liquid investments such as deposits with original maturities of three months or less.
For the purpose of the consolidated statement of cash flows, cash and cash equivalent consist of cash and short-term deposits as defined above.
h. Property, plant and equipment(i) Recognition and measurementProperty, plant and equipment are measured at cost less accumulated depreciation and accumulated impairment losses except for exploration and evaluation assets (see Note i). The initial cost of an asset comprises its purchase price or construction cost, any costs directly attributable to bringing the asset into operation, the initial estimate of any decommissioning obligation, if any, and, for qualifying assets, borrowing costs. The purchase price or construction cost is the aggregate amount paid and the fair value of any other consideration given to acquire the asset.
When parts of an item of property, plant and equipment have different useful lives, they are accounted for as separate items (major components). The costs of major repairs and maintenance (dry-docking or turnarounds) are capitalised and depreciated over their useful life.
Gains or losses on disposal of an item of property, plant and equipment are recorded in the statement of income under ‘Other income/ (expense)’.
The carrying value of property and equipment is reviewed for impairment whenever events or changes in circumstances indicate the carrying value may not be recoverable.
Assets in the course of construction are capitalised as a separate component of property, plant and equipment. Upon completion, the cost of construction is transferred to the appropriate category.
TRAFIGURA 2016 ANNUAL REPORT 53
FIN
AN
CIA
L ST
AT
EM
EN
TS

FINANCIAL STATEMENTS
F. NOTES TO CONSOLIDATED FINANCIAL STATEMENTS (CONTINUED)
(ii) Subsequent costs
Subsequent expenditure is capitalised only when it is probable that the future economic benefits associated with the expenditure will flow to the Group. Ongoing repairs and maintenance are expensed as incurred.
(iii) Depreciation
Items of property, plant and equipment are depreciated on a straight-line basis over the estimated useful lives of each component. Land is not depreciated.
Items of property, plant and equipment are depreciated from the date that they are installed and are ready for use. Assets under construction are not depreciated.
Depreciation of assets held under finance leases is calculated over the shorter of the lease term or the estimated useful life of the asset.
The estimated useful lives for the current and comparative years of significant items of property, plant and equipment are as follows:
• Buildings 20-33 years
• Machinery and equipment 3-20 years
• Barges and vessels 10-20 years
• Other fixed assets 1-5 years
Depreciation methods, useful lives and residual values are reviewed at each reporting date and adjusted if appropriate.
(iv) Borrowing costs
Borrowing costs directly attributable to the acquisition, construction or production of qualifying assets, i.e. assets that necessarily take a substantial period of time to get ready for their intended use or sale, are calculated using the effective interest rate method and are capitalised as part of the cost of those assets. The capitalisation of such borrowing costs ceases when the assets are substantially ready for their intended use or sale. Investment income earned on the temporary investment of specific borrowings pending their expenditure on qualifying assets is deducted from the borrowing costs capitalised.
All other borrowing costs (including borrowing costs related to exploration and evaluation expenditures) are expensed in the period in which they are incurred. Borrowing costs consist of interest and other costs that an entity incurs directly in connection with the borrowing of funds.
i. Exploration and evaluation expenditureExploration and evaluation expenditure relates to costs incurred on the exploration and evaluation of potential mineral and petroleum resources and include costs such as the acquisition of rights to explore, topographical geological, geochemical and geophysical studies, exploratory drilling and other activities in relation to evaluating the technical feasibility and commercial viability of extracting a mineral resource. These costs are capitalised as an asset and measured at cost and recognised as a component of property, plant or equipment. Purchased exploration and evaluation assets are recognised at their fair value at acquisition.
All capitalised exploration and evaluation expenditure is monitored for indications of impairment. Where a potential impairment is indicated, an assessment is performed for each area of interest or at the cash generating unit level. To the extent that capitalised expenditure is not expected to be recovered it is charged to the statement of income.
When commercially recoverable reserves are determined and such development receives the appropriate approvals, capitalised exploration and evaluation expenditure is transferred to ‘Development Properties’.
j. Development expenditureDevelopment expenditure incurred by or on behalf of the Group are accumulated separately for each area of interest in which economically recoverable reserves have been identified, and are capitalised only if they can be measured reliably, the product or process is technically and commercially feasible, future economic benefits are probable, and the Company intends to and has sufficient resources to complete development and to use or sell the asset. They are included as a component of property, plant and equipment as ‘Development Properties’.
With regards to mines, the development property is reclassified as ‘Mining Interests’ at the end of the development phase, when the mine is capable of operating in the manner intended by management.
No depreciation is recognised in respect of development properties until they are classified as ‘Mining Interests’.
Each development property is tested for impairment, see Note 3o. Expenditure on research activities, undertaken with the prospect of gaining new scientific or technical knowledge and understanding, is recognised in profit or loss as incurred Mining interests
When further development expenditures are incurred in respect of a mining interest after the commencement of production, such expenditures are carried forward as part of the mining interests when it is probable that additional future economic benefits associated with the expenditure will flow to the consolidated entity. Otherwise such expenditures are classified as a cost of production.
Depreciation is charged using the unit of production method, with separate calculations being made for each area of interest. The unit of production basis results in a depreciation charge proportional to the depletion of proven and probable reserves.
Mining interests are tested for impairment.
k. Deferred stripping costsStripping costs incurred in the development of a mine (or pit) before production commences are capitalised as part of the cost of constructing the mine (or pit) and subsequently amortised over the life of the mine (or pit) on a unit of production basis. The removal of overburden waste is required to obtain access to the ore body.
Production stripping costs are deferred when the actual stripping ratio incurred significantly exceeds the expected long-term average stripping ratio and are subsequently amortised when the actual stripping ratio falls below the long-term average stripping ratio. Where the ore is expected to be evenly distributed, waste removal is expensed as incurred.
l. Intangible assets and goodwill(i) GoodwillGoodwill that arises on the acquisition of subsidiaries is presented with intangible assets. For the measurement of goodwill at initial recognition see Note c.
Goodwill is measured at cost less accumulated impairment losses. For the purpose of impairment testing, goodwill acquired in a business combination is, from the acquisition date, allocated to each of the Group’s cash-generating units or group of cash generating units that are expected to benefit from the combination, irrespective of whether other assets or liabilities of the acquired are assigned to those units.
54 TRAFIGURA 2016 ANNUAL REPORT

Where goodwill has been allocated to a cash-generating unit and part of the operation within that unit is disposed of, the goodwill associated with the disposed operation is included in the carrying amount of the operation when determining the gain and loss on disposal. Goodwill disposed in these circumstances is measured based on the relative values of the disposed operation and the portion of the cash-generating unit retained.
In respect of equity-accounted investees, the carrying amount of goodwill is included in the carrying amount of the investment, and any impairment loss is allocated to the carrying amount of the equity-accounted investee as a whole.
(ii) Mineral and petroleum rightsMineral and petroleum reserves, resources and rights (together ‘Mineral rights’) which can be reasonably valued, are recognised in the assessment of fair values on acquisition. Mineral rights for which values cannot be reasonably determined are not recognised. Exploitable Mineral rights are amortised using the unit of production method over the commercially recoverable reserves and, in certain circumstances, other mineral resources. Mineral resources are included in amortisation calculations where there is a high degree of confidence that they will be extracted in an economic manner.
(iii) Other intangible assetsOther intangible assets include licences and are stated at cost, less accumulated amortisation and accumulated impairment losses. Licences are amortised over the term of the licence, generally not exceeding 10 years.
An intangible asset acquired as part of a business combination is measured at fair value at the date of acquisition and is recognised separately from goodwill if the asset is separable or arises from contractual or other legal rights.
Intangible assets with finite lives are amortised over their useful economic life and assessed for impairment whenever there is an indication that the intangible asset may be impaired. The amortisation period and the amortisation method for an intangible asset with a finite useful life are reviewed at least at each reporting date. Changes in the expected useful life or the expected pattern of consumption of future economic benefits embodied in the asset are accounted for by changing the amortisation period or method, as appropriate, and treated as changes in the accounting estimates.
Gains or losses on disposal of intangible assets are recorded in the statement of income under ‘Other income/(expense)’.
m. LeasesThe Group is the lessee of equipment, buildings, vessels and terminals under various operating and finance leases. The Group classifies its leases as operating or finance leases based upon whether the lease agreement transfers substantially all the risks and rewards of ownership.
For leases determined to be finance leases, an asset and liability are recognised at an amount equal to the lower of the fair value of the leased asset or the present value of the minimum lease payments during the lease term. Such assets are amortised on a straight-line basis over the shorter of the lease term or the estimated useful life of the asset taking into account the residual value, with depreciation included in depreciation expense.
Leases that do not qualify as finance leases are classified as operating leases, and the related rental payments are expensed on a straight-line basis over the lease term.
If a sale and leaseback transaction can be classified as an operational lease, which implies that substantially all the risks and rewards of ownership of the lease agreement have been transferred, the difference between the carrying value and the consideration of the sold assets will be accounted for in the profit and loss under other income.
n. InventoriesTrading-related inventories are measured at fair value less costs to sell. Fair value movements are included in profit and loss.
Inventories of non-trading related products are measured at the lower of cost or net realisable value. Costs comprise all costs of purchases and other costs incurred.
o. Impairment of financial instrumentsNon-derivative financial assetsThe Group assesses the expected credit losses associated with its debt instruments and trade receivables carried at amortised cost and fair value through other comprehensive income. The impairment provisions for financial assets disclosed in Notes 15 and 16 are based on assumptions about risk of default and expected loss rates. The company uses judgement in making these assumptions and selecting the inputs to the impairment calculation, based on the Group’s past history, existing market conditions as well as forward looking estimates at the end of each reporting period.
Trade receivablesThe Group applies the simplified approach to providing for expected credit losses, which permits the use of the lifetime expected loss provision for all trade receivables. In calculating the expected credit loss rates for trade receivables, the company considers historical loss rates for each category of counterparties, and adjusts for forward looking macroeconomic data. Refer to Note 18 for the loss provision on trade receivables.
Loans receivableOver the term of the loans, the Group manages its credit risk by appropriately providing for expected credit losses on a timely basis. In calculating the expected credit loss rates, the Group considers historical loss rates for each category of counterparties, and adjusts for forward looking macroeconomic data. The Group classifies its loans receivable in three categories that reflect their credit risk as follows:
Category Group definition of category Basis for recognition of expected credit loss provision
Performing Customers have a low risk of default and a strong capacity to meet contractual cash flows
12 month expected losses. Where the expected lifetime of an asset is less than 12 months, expected losses are measured at its expected lifetime.
Non-performing Interest and/or principal repayments are past due and credit risk level shows a significant increase
Lifetime expected losses
Write-off Based on observable data the interest and/or principal will not be collected
Asset is written off through profit or loss to extent of expected loss
The Group recognises expected credit losses when a payment is received past it’s due date, even though it is received in full. Refer to
TRAFIGURA 2016 ANNUAL REPORT 55
FIN
AN
CIA
L ST
AT
EM
EN
TS

FINANCIAL STATEMENTS
F. NOTES TO CONSOLIDATED FINANCIAL STATEMENTS (CONTINUED)
Note 15 for the loss provision on loans receivable.
Write-offThe Group also assesses at each reporting date whether there is any objective evidence that a financial asset or a group of financial assets is impaired. A financial asset or a group of financial assets is deemed to be impaired if, and only if, there is objective evidence of impairment as a result of one or more events that has occurred after the initial recognition of the asset (an incurred ‘loss event’) and that the loss event has an impact on the estimated future cash flows of the financial asset or the group of financial assets that can be reliably estimated.
Objective evidence that financial assets are impaired may include indications that the debtors or a group of debtors is experiencing significant financial difficulty, default or delinquency in interest or principal payments, the probability that they will enter bankruptcy or other financial reorganisation and where observable data indicate that there is a measurable decrease in the estimated future cash flows, such as changes in arrears or economic conditions that correlate with defaults.
If the decrease in impairment relates to an objective event occurring after the impairment was recognised, a previously recognised impairment loss is reversed to a maximum of the amount required to carry the asset at amortised cost at the time of the reversal if no impairment had taken place while taking into consideration the expected credit losses associated to the instrument. The Group recognises in profit or loss, as an impairment gain, the amount of expected credit losses reversal that is required to adjust the loss allowance at the reporting date to the amount that is required to be recognised under the expected credit loss model.
p. Accrued turnoverAccrued turnover relates to sales made before the end of the year that have not been invoiced at the balance sheet date. Reasons for such delays include the need to determine final pricing, quantity and quality analysis. All are typical of the industry in which the Group operates.
q. Employee benefits(i) Post-employment benefitsThe Group provides direct contributions to individual employee pension schemes, which are expensed to net income in the year. Accordingly, there is no significant post-employment benefit liabilities associated with the Group.
(ii) Employee share incentive plan and employee share trustEmployees of the Group receive remuneration in the form of shares of the immediate holding company Trafigura Beheer B.V. as consideration for services rendered. This is considered an equity-settled share scheme as the Company neither has a present legal nor constructive obligation to settle in cash nor has a past practice or stated policy of settling in cash.
The cost of the equity-settled transactions is measured at fair value at the grant date taking into account the terms and conditions upon which the shares were granted. This fair value is expensed over the vesting period with a corresponding credit to equity. For shares that immediately vest, the fair value is expensed in the same accounting period corresponding to the date of grant.
r. ProvisionsThe Group recognises provisions for liabilities and onerous contracts that have been incurred as of the balance sheet date and can be reliably estimated. A provision is recognised when (i) the Group has a present
obligation (legal or constructive) as a result of a particular event; (ii) it is probable that an outflow of resources embodying economic benefits will be required to settle the obligation, and (iii) an estimate can be made of the amount of the obligation.
Provisions for claims, disputes and legal proceedings are recorded if it is probable that the Group will be liable in a proceeding, for the estimated amount at which the liability can be settled. If the amount for which the liability can be settled cannot be reliably estimated, the claim, dispute or legal proceeding is disclosed, if it is expected to be significant.
(i) Restoration, rehabilitation and decommissioningRestoration, rehabilitation and decommissioning costs arising from the installation of plant and other site preparation work, discounted to their net present value, are provided for and capitalised at the time such an obligation arises. The costs are charged to the statement of income over the life of the operation through depreciation of the asset and the unwinding of the discount on the provision. Costs for restoration of subsequent site disturbance, which a created on an ongoing basis during production, are provided for at their net present values and charged to the statement of income as extraction progresses. If the obligation results from production (e.g. extraction of reserves) these are recognised as extraction occurs.
(ii) Onerous contractsA provision for onerous contracts is recognised when the expected benefits to be derived by the Group from a contract are lower than the unavoidable cost of meeting its obligations under the contract. The provision is measured at the present value of the lower of the expected cost of terminating the contract and the expected net cost of continuing with the contract. Before a provision is established, the Group recognises any impairment loss on the assets associated with that contract.
s. Accrued costs of sales and expensesThe accrued cost of sales and expenses relate to purchases and expenses made before the year end that have not been invoiced at the balance sheet date. Reasons for such delays include the need to determine final pricing, quantity and quality analysis. All are typical of the industry in which the Group operates.
t. Revenue recognitionRevenue is measured at the fair value of the consideration received or receivable, taking into account contractually defined terms of payment and excluding taxes or duty. The Group assesses its revenue arrangements against specific criteria in order to determine if it is acting as principal or agent.
Revenue is recognised to the extent that it is probable that the economic benefits will flow to the Group and the revenue can be reliably measured, regardless of when the payment is being made. The following specific recognition criteria must also be met before revenue is recognised.
Revenue from the sale of goods which are transported in discrete cargoes is recognised when the significant risk and rewards of the goods have passed to the buyer, which is usually the date of the bill of lading. Revenue from the sale of goods which are transported in continuous systems is recognised when the goods have been delivered.
Revenue from the sale of goods which are consigned to counterparties on a sale-and-return basis is recognised when the goods are sold to the customers on a non-recourse basis. At these points the
56 TRAFIGURA 2016 ANNUAL REPORT
quantity and the quality of the goods has been determined with reasonable accuracy, the price is fixed or determinable, and collectability is reasonably assured.
Revenue from rendering of services is recognised in the statement of income in proportion to the stage of the rendered performance as at the balance sheet date.
u. Cost of salesCost of sales includes the purchase price of the products sold, as well as the costs of purchasing, storing, and transporting the products. It also includes the changes in mark to market valuation of inventories, all derivatives and forward contracts.
v. Selling, general and administrative expensesSelling, general and administrative expenses includes the Group’s corporate offices, rent and facility costs, and certain other general and administrative expenses which do not relate directly to the activities of a single business segment.
w. Finance income and finance expenseInterest income and interest expense are recognised on a time-proportion basis using the effective interest method.
x. Corporate taxesIncome tax expense comprises current and deferred tax. Current tax and deferred tax are recognised in statement of income except to the extent that it relates to a business combination, or items recognised directly in equity or in other comprehensive income.
(i) Current income taxCurrent income tax is the expected tax payable or receivable on the taxable income or loss for the year, using tax rates enacted or substantively enacted at the reporting date, and any adjustment to tax payable in respect of previous years. The charge for taxation includes Singaporean and foreign corporate income taxation. Due to the different statutory rates applicable and non-deductible expenses, the Group effective tax charge differs from the statutory tax rate applicable in Singapore.
(ii) Deferred taxDeferred tax is recognised in respect of temporary differences between the carrying amounts of assets and liabilities for financial reporting purposes and the amounts used for taxation purposes.
The measurement of deferred tax reflects the tax consequences that would follow the manner in which the Group expects, at the end of the reporting period, to recover or settle the carrying amount of its assets and liabilities.
Deferred tax is measured at the tax rates that are expected to be applied to temporary differences when they reverse, using tax rates enacted or substantively enacted at the reporting date.
Deferred tax assets and liabilities are offset if there is a legally enforceable right to offset current tax liabilities and assets, and they relate to taxes levied by the same tax authority on the same taxable entity, or on different tax entities, but they intend to settle current tax liabilities and assets on a net basis or their tax assets and liabilities will be realised simultaneously.
A deferred tax asset is recognised for unused tax losses, tax credits and deductible temporary differences to the extent that it is probable that future taxable profits will be available against which they can be utilised. Deferred tax assets are reviewed at each reporting date and are reduced to the extent that it is no longer probable that the related tax benefit will be realised.
(iii) Tax exposureIn determining the amount of current and deferred tax the Company takes into account the impact of uncertain tax positions and whether additional taxes and interest may be due. The Company believes that its accruals for tax liabilities are adequate for all open tax years based on its assessment of many factors, including interpretations of tax law and prior experience. This assessment relies on estimates and assumptions and may involve a series of judgements about future events. New information may become available that causes the Company to change its judgement regarding the adequacy of existing tax liabilities; such changes to tax liabilities will impact tax expense in the period that such a determination is made.
y. Assets held for saleNon-current assets and disposal groups are classified as held for sale if their carrying amounts will be recovered principally through a sales transaction rather than through continuing use. For this to be the case, the asset or disposal group must be available for immediate sale in its present condition subject only to terms that are usual and customary for the sale of such assets or disposal groups and its sale must be highly probable. All assets and liabilities of a subsidiary classified as a disposal group are reclassified as held for sale regardless of whether the Group retains a non-controlling interest in its former subsidiary after the sale.
Non-current assets and disposal groups (other than financial assets) classified as held for sale are measured at the lower of their carrying amounts and fair values less costs to sell. Property, plant and equipment and intangible assets classified as held for sale are not depreciated or amortised.
z. SegmentsThe Group’s operating segments are established on the basis of those components of the group that are evaluated regularly by the chief operating decision maker (CODM) in deciding how to allocate resources and in assessing performance.
aa. Use of estimates and judgementsThe preparation of the Group’s financial statements in conformity with IFRS requires management to make estimates and assumptions that affect the reported amounts of assets and liabilities and the disclosure of contingent assets and liabilities at the date of the consolidated financial statements and the reported amounts of revenues and expenses during the reporting period.
The estimates and associated assumptions are based on historical experience and other factors that are considered to be relevant. Actual outcomes could differ from those estimates. Existing circumstances and assumptions about future developments, however, may change due to market changes or circumstances arising beyond the control of the Group. Such changes are reflected in the assumptions when they occur.
The Group has identified the following areas as being critical to understanding the Company’s financial position as they require management to make complex and/or subjective judgments and estimates about matters that are inherently uncertain.
TRAFIGURA 2016 ANNUAL REPORT 57
FIN
AN
CIA
L ST
AT
EM
EN
TS

FINANCIAL STATEMENTS
F. NOTES TO CONSOLIDATED FINANCIAL STATEMENTS (CONTINUED)
(i) Valuation of derivative instrumentsDerivative instruments are carried at fair value and the Group evaluates the quality and reliability of the assumptions and data used to measure fair value in the three hierarchy levels, Level 1, 2 and 3, as prescribed by IFRS 13. Fair values are determined in the following ways: externally verified via comparison to quoted market prices in active markets (Level 1); by using models with externally verifiable inputs (Level 2); or by using alternative procedures such as comparison to comparable instruments and/or using models with unobservable market inputs requiring the Group to make market based assumptions (Level 3). For more details refer to Note 27. For assets and liabilities that are recognised in the financial statements on a recurring basis, the Group determines whether transfers have occurred between Levels in the hierarchy by re-assessing categorisation (based on the lowest level input that is significant to the fair value measurement as a whole) at the end of each reporting period.
(ii) Depreciation and amortisation of mineral rights and development costsMineral rights and development costs are amortised using UOP (unit of production). The calculation of the UOP rate of amortisation, and therefore the annual amortisation charge to operations, can fluctuate from initial estimates. This could generally result when there are significant changes in any of the factors or assumptions used in estimating mineral or petroleum reserves, notably changes in the geology of the reserves and assumptions used in determining the economic feasibility of the reserves. Such changes in reserves could similarly impact the useful lives of assets depreciated on a straight line basis, where those lives are limited to the life of the project, which in turn is limited to the life of the proven and probable mineral or petroleum reserves. Estimates of proven and probable reserves are prepared by experts in extraction, geology and reserve determination. Assessments of UOP rates against the estimated reserve and resource base and the operating and development plan are performed regularly. Refer to Note 11 and Note 12.
(iii) ImpairmentsInvestments in associates and other investments, loans receivables and property, plant and equipment and intangible assets are reviewed for impairment whenever events or changes in circumstances indicate that the carrying value may not be fully recoverable or at least annually for goodwill and other indefinite life intangible assets. If an asset’s recoverable amount is less than the asset’s carrying amount, an impairment loss is recognised. Loans and receivables are evaluated based on collectability. Future cash flow estimates which are used to calculate the asset’s fair value are based on expectations about future operations primarily comprising estimates about production and sales volumes, commodity prices, reserves and resources, operating, rehabilitation and restoration costs and capital expenditures. Changes in such estimates could impact recoverable values of these assets. Estimates are reviewed regularly by management. Refer to Note 11, Note 12, Note 13 and Note 15.
(iv) ProvisionsThe amount recognised as a provision, including tax, legal, restoration and rehabilitation, contractual and other exposures or obligations, is the best estimate of the consideration required to settle the related liability, including any related interest charges, taking into account the risks and uncertainties surrounding the obligation. The Group assesses its liabilities and contingencies based upon the best information available, relevant tax laws and other appropriate requirements. Refer to Note 24.
(v) Restoration, rehabilitation and decommissioning costsA provision for future restoration, rehabilitation and decommissioning costs requires estimates and assumptions to be made around the relevant regulatory framework, the magnitude of the possible disturbance and the timing, extent and costs of the required closure and rehabilitation activities. To the extent that the actual future costs differ from these estimates, adjustments will be recorded and the statement of income could be impacted. The provisions including the estimates and assumptions contained therein are reviewed regularly by management. Refer to Note 24.
(vi) TaxationDeferred tax assets are recognised only to the extent it is considered probable that those assets will be recoverable. This involves an assessment of when those deferred tax assets are likely to reverse, and a judgement as to whether or not there will be sufficient taxable profits available to offset the tax assets when they do reverse. These judgements are subject to risk and uncertainty and hence, to the extent assumptions regarding future profitability change, there can be an increase or decrease in the amounts recognised in income in the period in which the change occurs. The recoverability of deferred tax assets including the estimates and assumptions contained therein are reviewed regularly by management. Refer to Note 10.
(vii) Determination of control of subsidiaries and joint arrangementsJudgement is required to determine whether the Company has control or joint control, which requires an assessment of the relevant activities (those relating to establishing operating and capital decisions of the arrangement, such as: the approval of the budget including the capital expenditure programme for each year, determining the funding structure and appointing, remunerating and terminating the key management personnel or service providers of the operations) and when the decisions in relation to those activities are under the control of the Company or require unanimous consent. Judgement is also required in determining the classification of a joint arrangement between a joint venture or a joint operation through an evaluation of the rights and obligations arising from the arrangement. Differing conclusions around these judgements, may materially impact how these businesses are presented in the consolidated financial statements – under the full consolidation method, equity method or proportionate share of assets and liabilities. Refer to Note 6.
4. OPERATING SEGMENTSThe Group’s operating businesses are organised and managed separately according to the nature of the products, with each segment representing a strategic unit that offers different products and serves different markets.
Segment results that are reported to the Group’s Chief Executive Officer (CEO) (the chief operating decision maker) include items directly attributable to a segment as well as those that can be allocated on a reasonable basis.
• The Oil and Petroleum Products segment is engaged in the sourcing, provision and storage of oil, at all stages from crude to finished products such as naphtha and gasoline. This includes the blending required to make gasoline in the various grades suitable for the different specifications relevant in different countries.
• The Metals and Minerals segment trades copper, lead, zinc, aluminium, iron ore and coal in all forms including ores, concentrates, and refined
58 TRAFIGURA 2016 ANNUAL REPORT

metals. There is involvement in all the various stages from mining through smelting to the finished metal. This segment also includes the Mining group and Impala Warehousing and Logistics and includes the blending of metal concentrates, iron ore, coal and alumina, as well as warehousing and transportation.
• All other segments includes holding companies, and some smaller operating companies.
Information regarding the results of each reportable segment is included below. Performance is measured based on segment gross profit, as included in the internal management reports that are reviewed by the Group’s CEO. Segment gross profit is used to measure performance as management believes that such information is the most relevant in evaluating the results of certain segments relative to other entities that operate within these industries.
The accounting policies of the operating segments are the same as those described in the summary of significant accounting policies. Trafigura accounts for inter-segment sales and transfers where applicable as if the sales or transfers were to third parties, i.e. at arm’s length commercial terms.
Reconciliations of reportable segment revenues, profit or loss, assets and liabilities, and other material items:
Oil and Petroleum
Metals and Minerals
All other segments Total
2016 USD’M USD’M USD’M USD’M
Revenue from external customers 63,831.3 34,266.5 – 98,097.8 Gross profit 1,460.3 830.9 2,291.2
Other income/(expenses) (233.2)General and administrative expenses (946.7)Finance income 387.0 Finance expense (507.7)Share of profit/(loss) of equity-accounted investees 94.3 Income tax expense (110.2)
Profit for the year 974.7
Oil and Petroleum
Metals and Minerals
All other segments Total
2016 USD’M USD’M USD’M USD’M
Segment assetsEquity-accounted investees 2,345.6 1,109.4 9.4 3,464.4 Other assets 20,184.3 12,417.6 5,163.8 37,765.7Total segment assets 22,529.9 13,527.0 5,173.2 41,230.1
Segment liabilitiesTotal segment liabilities (14,678.0) (10,444.0) (10,261.0) (35,383.0)
Other segment informationCapital expenditure 302.7 326.4 125.1 754.2Depreciation and amortisation 39.8 75.3 89.6 204.7Impairment of non-financial assets 0.8 (169.3) – (168.5)Impairment of financial assets 8.0 25.5 6.3 39.8Impairment of equity-accounted investees – 250.0 – 250.0
Oil and Petroleum
Metals and Minerals
All other segments Total
2015 USD’M USD’M USD’M USD’M
Revenue from external customers 65,262.7 31,973.8 – 97,236.5Gross profit 1,680.3 920.1 2,600.4
Other income/(expenses) (198.4)General and administrative expenses (994.8)Finance income 228.5Finance expense (479.0)Share of profit/(loss) of equity-accounted investees 87.8Income tax expense (141.1)
Profit for the year 1,103.4
Oil and Petroleum
Metals and Minerals
All other segments Total
2015 USD’M USD’M USD’M USD’M
Segment assetsEquity-accounted investees 2,091.8 1,074.5 1.2 3,167.5Other segment assets 20,610.9 11,831.1 3,477.2 35,919.2 Total segment assets 22,702.7 12,905.6 3,478.4 39,086.7
Segment liabilitiesTotal segment liabilities (17,720.4) (7,894.1) (7,814.6) (33,429.1)
Other segment informationCapital expenditure 152.7 851.2 219.5 1,223.4Depreciation and amortisation 40.5 114.3 64.9 219.7Impairment of non-financial assets – 407.3 – 407.3Impairment of financial assets – 14.0 – 14.0Impairment of equity-accounted investees 2.0 45.9 – 47.9
Geographical informationThe following table sets out information about the geographical location of the Group’s revenue from external customers:
Oil and Petroleum
Metals and Minerals Total
2016 USD’M USD’M USD’M
Revenue from external customersEurope 16,559.4 9,805.8 26,365.2Asia 17,744.1 19,673.6 37,417.7North America 13,791.3 2,348.8 16,140.1Latin America 6,516.6 1,346.9 7,863.5Africa 4,775.8 745.8 5,521.6Australia 573.0 225.3 798.3Middle East 3,871.1 120.3 3,991.4
Total revenue from external customers 63,831.3 34,266.5 98,097.8
TRAFIGURA 2016 ANNUAL REPORT 59
FIN
AN
CIA
L ST
AT
EM
EN
TS
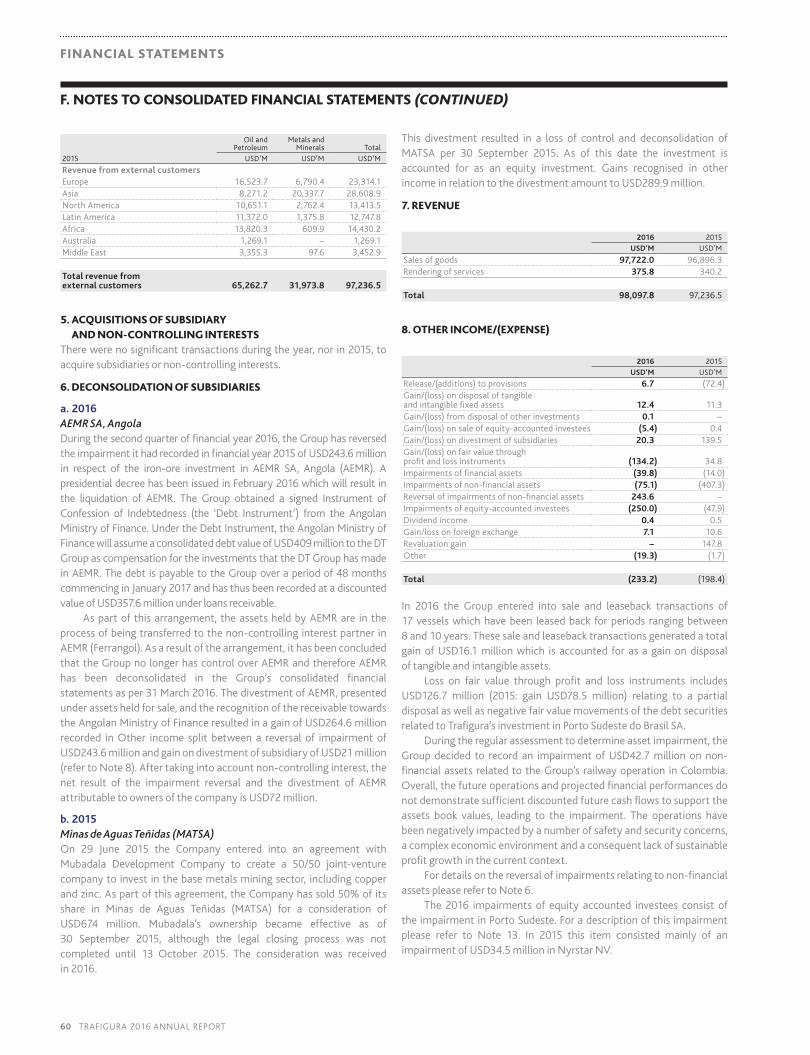
FINANCIAL STATEMENTS
F. NOTES TO CONSOLIDATED FINANCIAL STATEMENTS (CONTINUED)
Oil and Petroleum
Metals and Minerals Total
2015 USD’M USD’M USD’M
Revenue from external customersEurope 16,523.7 6,790.4 23,314.1Asia 8,271.2 20,337.7 28,608.9North America 10,651.1 2,762.4 13,413.5Latin America 11,372.0 1,375.8 12,747.8Africa 13,820.3 609.9 14,430.2Australia 1,269.1 – 1,269.1Middle East 3,355.3 97.6 3,452.9
Total revenue from external customers 65,262.7 31,973.8 97,236.5
5. ACQUISITIONS OF SUBSIDIARY AND NON-CONTROLLING INTERESTS
There were no significant transactions during the year, nor in 2015, to acquire subsidiaries or non-controlling interests.
6. DECONSOLIDATION OF SUBSIDIARIES
a. 2016AEMR SA, AngolaDuring the second quarter of financial year 2016, the Group has reversed the impairment it had recorded in financial year 2015 of USD243.6 million in respect of the iron-ore investment in AEMR SA, Angola (AEMR). A presidential decree has been issued in February 2016 which will result in the liquidation of AEMR. The Group obtained a signed Instrument of Confession of Indebtedness (the ‘Debt Instrument’) from the Angolan Ministry of Finance. Under the Debt Instrument, the Angolan Ministry of Finance will assume a consolidated debt value of USD409 million to the DT Group as compensation for the investments that the DT Group has made in AEMR. The debt is payable to the Group over a period of 48 months commencing in January 2017 and has thus been recorded at a discounted value of USD357.6 million under loans receivable.
As part of this arrangement, the assets held by AEMR are in the process of being transferred to the non-controlling interest partner in AEMR (Ferrangol). As a result of the arrangement, it has been concluded that the Group no longer has control over AEMR and therefore AEMR has been deconsolidated in the Group’s consolidated financial statements as per 31 March 2016. The divestment of AEMR, presented under assets held for sale, and the recognition of the receivable towards the Angolan Ministry of Finance resulted in a gain of USD264.6 million recorded in Other income split between a reversal of impairment of USD243.6 million and gain on divestment of subsidiary of USD21 million (refer to Note 8). After taking into account non-controlling interest, the net result of the impairment reversal and the divestment of AEMR attributable to owners of the company is USD72 million.
b. 2015Minas de Aguas Teñidas (MATSA)On 29 June 2015 the Company entered into an agreement with Mubadala Development Company to create a 50/50 joint-venture company to invest in the base metals mining sector, including copper and zinc. As part of this agreement, the Company has sold 50% of its share in Minas de Aguas Teñidas (MATSA) for a consideration of USD674 million. Mubadala’s ownership became effective as of 30 September 2015, although the legal closing process was not completed until 13 October 2015. The consideration was received in 2016.
This divestment resulted in a loss of control and deconsolidation of MATSA per 30 September 2015. As of this date the investment is accounted for as an equity investment. Gains recognised in other income in relation to the divestment amount to USD289.9 million.
7. REVENUE
2016 2015
USD’M USD’M
Sales of goods 97,722.0 96,896.3 Rendering of services 375.8 340.2
Total 98,097.8 97,236.5
8. OTHER INCOME/(EXPENSE)
2016 2015
USD’M USD’M
Release/(additions) to provisions 6.7 (72.4)Gain/(loss) on disposal of tangible and intangible fixed assets 12.4 11.3Gain/(loss) from disposal of other investments 0.1 –Gain/(loss) on sale of equity-accounted investees (5.4) 0.4Gain/(loss) on divestment of subsidiaries 20.3 139.5Gain/(loss) on fair value through profit and loss instruments (134.2) 34.8Impairments of financial assets (39.8) (14.0)Impairments of non-financial assets (75.1) (407.3)Reversal of impairments of non-financial assets 243.6 –Impairments of equity-accounted investees (250.0) (47.9)Dividend income 0.4 0.5Gain/loss on foreign exchange 7.1 10.6Revaluation gain – 147.8Other (19.3) (1.7)
Total (233.2) (198.4)
In 2016 the Group entered into sale and leaseback transactions of 17 vessels which have been leased back for periods ranging between 8 and 10 years. These sale and leaseback transactions generated a total gain of USD16.1 million which is accounted for as a gain on disposal of tangible and intangible assets.
Loss on fair value through profit and loss instruments includes USD126.7 million (2015: gain USD78.5 million) relating to a partial disposal as well as negative fair value movements of the debt securities related to Trafigura’s investment in Porto Sudeste do Brasil SA.
During the regular assessment to determine asset impairment, the Group decided to record an impairment of USD42.7 million on non-financial assets related to the Group’s railway operation in Colombia. Overall, the future operations and projected financial performances do not demonstrate sufficient discounted future cash flows to support the assets book values, leading to the impairment. The operations have been negatively impacted by a number of safety and security concerns, a complex economic environment and a consequent lack of sustainable profit growth in the current context.
For details on the reversal of impairments relating to non-financial assets please refer to Note 6.
The 2016 impairments of equity accounted investees consist of the impairment in Porto Sudeste. For a description of this impairment please refer to Note 13. In 2015 this item consisted mainly of an impairment of USD34.5 million in Nyrstar NV.
60 TRAFIGURA 2016 ANNUAL REPORT

In 2015, Trafigura reduced its stake in Minas de Aguas Teñidas (MATSA) as described in Note 6. The gain of USD142.1 million from divestment of the 50% interest is included as a gain on divestment of subsidiaries. The gain of USD147.8 million from remeasuring the retained interest at fair value was recorded as a revaluation gain.
For details on the impairments of non-financial assets, refer to Notes 11 and 12.
For the additions to provisions we refer to Note 24.
9. GENERAL AND ADMINISTRATIVE EXPENSES
2016 2015
USD’M USD’M
Depreciation and amortisation 204.7 219.7Staff costs 513.5 504.3General and other 228.5 270.8
Total 946.7 994.8
The total fees in respect to the procedures applied to the Group by Ernst & Young Accountants LLP, the Netherlands (‘EY’), the external auditor, and other member firms of EY including their tax services and advisory groups amounted to USD5.7 million in 2016 (2015: USD6.6 million), which included USD0.2 million (2015: USD0.1 million) for assurance related services, USD1.2 million (2015: USD1.0 million) for tax advisory and compliance services, and USD0.2 (2015: USD nil) for transaction support services.
The financial statements audit fees include the aggregate fees in each of 2016 and 2015 financial years for professional services rendered for the audit of the Group’s annual financial statements. Assurance related fees include the fees in relation to the annual statutory financial statement audit of subsidiaries or services that are normally provided by the auditor in connection with the audits. Transaction support fees relate to due diligence and assurance services in respect of potential acquisitions and/or divestitures.
Refer to Note 28, employee benefits, for a breakdown of the staff costs.
10. TAX
a. Tax expenseIncome tax expense recognised in the statement of income consists of the following:
2016 2015
USD’M USD’M
Current income tax expense 102.0 184.4Adjustments in relation to current income tax of previous year (9.4) (1.2)Deferred tax expense/(income) 14.0 (47.6)Withholding tax in the current year 3.6 5.5
Total 110.2 141.1
b. Tax recognised in other comprehensive incomeThe tax credit/ (charge) relating to components of other comprehensive income and equity is as follows:
2016 2015
USD’M USD’M
Tax expense/(income) on cash flow hedges (3.3) (5.2)
Total (3.3) (5.2)
c. Reconciliation of effective tax rateThe Group’s effective tax rate differs from the statutory income tax rate of the Singapore which was 17% in 2016 (2015: 17%).
The reconciliation between tax expense and the result of accounting profit multiplied by the Company’s statutory income tax rate for the years ended 30 September 2016 and 2015 is as follows:
2016 2015
USD’M % USD’M %
Profit before tax 1,084.9 1,244.5Income tax expense at expected statutory blended tax rate 203.1 18.7% 205.5 17.8% Tax effect of adjustments to arrive at the effective income tax rate:Effect of unrecognised and unused tax losses, not recognised as deferred tax assets 51.7 58.3Income exempt or subject to specific tax holidays (141.9) (160.7)Non-deductible expenses 3.1 33.7Adjustments in relation to income tax of previous years (9.4) (1.2)Withholding tax 3.6 5.5 110.2 141.1
Effective tax rate 10.2% 11.3%
d. Deferred tax assets and liabilities
2016 2015
USD’M USD’M
Property, plant and equipment and other assets (161.3) (161.1)Derivatives – 13.7Losses 96.5 152.9Other temporary differences (20.9) (88.7)
Deferred tax liability, net (85.7) (83.2)
2016 2015
USD’M USD’M
Reflected in the consolidated balance sheet as follows:Deferred tax assets 103.8 169.9Deferred tax liabilities (189.5) (253.1) Deferred tax liability, net (85.7) (83.2)
2016 2015
USD’M USD’M
Opening balance as at 1 October (83.2) (171.5)Tax expense during the period recognised in profit or loss (13.9) 47.6Other comprehensive income (2.8) 5.2Deferred taxes deconsolidated business combinations – 107.1Foreign currency differences and other 14.2 (71.6)
Closing balance as at 30 September (85.7) (83.2)
TRAFIGURA 2016 ANNUAL REPORT 61
FIN
AN
CIA
L ST
AT
EM
EN
TS
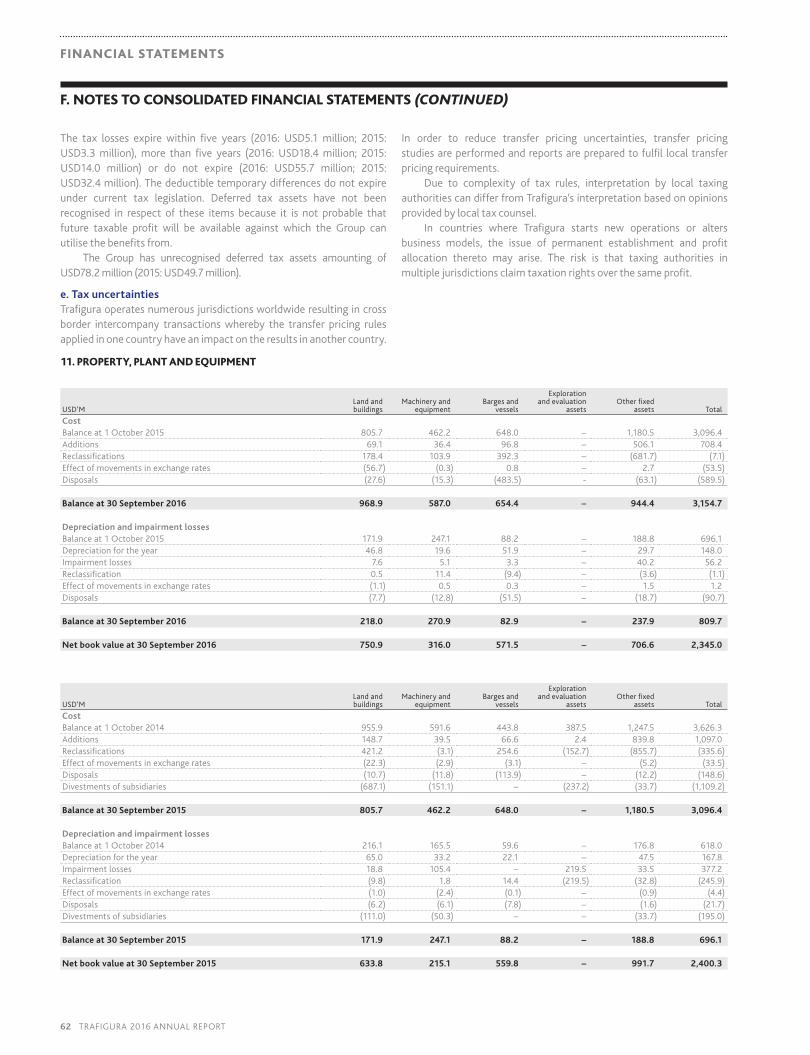
FINANCIAL STATEMENTS
F. NOTES TO CONSOLIDATED FINANCIAL STATEMENTS (CONTINUED)
The tax losses expire within five years (2016: USD5.1 million; 2015: USD3.3 million), more than five years (2016: USD18.4 million; 2015: USD14.0 million) or do not expire (2016: USD55.7 million; 2015: USD32.4 million). The deductible temporary differences do not expire under current tax legislation. Deferred tax assets have not been recognised in respect of these items because it is not probable that future taxable profit will be available against which the Group can utilise the benefits from.
The Group has unrecognised deferred tax assets amounting of USD78.2 million (2015: USD49.7 million).
e. Tax uncertaintiesTrafigura operates numerous jurisdictions worldwide resulting in cross border intercompany transactions whereby the transfer pricing rules applied in one country have an impact on the results in another country.
In order to reduce transfer pricing uncertainties, transfer pricing studies are performed and reports are prepared to fulfil local transfer pricing requirements.
Due to complexity of tax rules, interpretation by local taxing authorities can differ from Trafigura’s interpretation based on opinions provided by local tax counsel.
In countries where Trafigura starts new operations or alters business models, the issue of permanent establishment and profit allocation thereto may arise. The risk is that taxing authorities in multiple jurisdictions claim taxation rights over the same profit.
11. PROPERTY, PLANT AND EQUIPMENT
USD’M Land and buildings
Machinery and equipment
Barges and vessels
Exploration and evaluation
assets Other fixed
assets Total
Cost Balance at 1 October 2015 805.7 462.2 648.0 – 1,180.5 3,096.4 Additions 69.1 36.4 96.8 – 506.1 708.4 Reclassifications 178.4 103.9 392.3 – (681.7) (7.1)Effect of movements in exchange rates (56.7) (0.3) 0.8 – 2.7 (53.5)Disposals (27.6) (15.3) (483.5) - (63.1) (589.5)
Balance at 30 September 2016 968.9 587.0 654.4 – 944.4 3,154.7
Depreciation and impairment lossesBalance at 1 October 2015 171.9 247.1 88.2 – 188.8 696.1 Depreciation for the year 46.8 19.6 51.9 – 29.7 148.0 Impairment losses 7.6 5.1 3.3 – 40.2 56.2 Reclassification 0.5 11.4 (9.4) – (3.6) (1.1)Effect of movements in exchange rates (1.1) 0.5 0.3 – 1.5 1.2 Disposals (7.7) (12.8) (51.5) – (18.7) (90.7)
Balance at 30 September 2016 218.0 270.9 82.9 – 237.9 809.7
Net book value at 30 September 2016 750.9 316.0 571.5 – 706.6 2,345.0
USD’M Land and buildings
Machinery and equipment
Barges and vessels
Exploration and evaluation
assets Other fixed
assets Total
Cost Balance at 1 October 2014 955.9 591.6 443.8 387.5 1,247.5 3,626.3Additions 148.7 39.5 66.6 2.4 839.8 1,097.0Reclassifications 421.2 (3.1) 254.6 (152.7) (855.7) (335.6)Effect of movements in exchange rates (22.3) (2.9) (3.1) – (5.2) (33.5)Disposals (10.7) (11.8) (113.9) – (12.2) (148.6)Divestments of subsidiaries (687.1) (151.1) – (237.2) (33.7) (1,109.2)
Balance at 30 September 2015 805.7 462.2 648.0 – 1,180.5 3,096.4
Depreciation and impairment losses Balance at 1 October 2014 216.1 165.5 59.6 – 176.8 618.0Depreciation for the year 65.0 33.2 22.1 – 47.5 167.8Impairment losses 18.8 105.4 – 219.5 33.5 377.2Reclassification (9.8) 1.8 14.4 (219.5) (32.8) (245.9)Effect of movements in exchange rates (1.0) (2.4) (0.1) – (0.9) (4.4)Disposals (6.2) (6.1) (7.8) – (1.6) (21.7)Divestments of subsidiaries (111.0) (50.3) – – (33.7) (195.0)
Balance at 30 September 2015 171.9 247.1 88.2 – 188.8 696.1
Net book value at 30 September 2015 633.8 215.1 559.8 – 991.7 2,400.3
62 TRAFIGURA 2016 ANNUAL REPORT

Machinery and equipment mainly consists of specialised industrial equipment.
Included in the Other fixed assets category is assets under construction, which relates to assets not yet in use. Total balance at 30 September 2016 amounted to USD618.7 million (2015: USD886.3 million). Once the assets under construction come into operation they are reclassified to the appropriate asset category and it is from that point that they are depreciated. Further other fixed assets mainly consist of small equipment, computer hardware, software licences, office equipment and refurbishment.
The net book value of property, plant and equipment acquired under finance leases at 30 September 2016 was USD38.8 million (2015: USD48.8 million).
Certain items of property, plant and equipment are pledged as collateral for an amount of USD545.9 million (2015: USD662.5 million).
Depreciation expenses are included in general and administrative expenses. Impairment charges are included in other income and expense.
During the financial year ended 30 September 2016, the Company has capitalised borrowing cost of a total amount of USD35.8 million under other fixed assets (2015: USD86.6 million) which mainly relates to the multimodal logistics and infrastructure project along the Magdelena river in Colombia. These borrowing costs are based upon a capitalisation rate of 5.50% – 8.00% of the eligible assets.
In 2016 the Group entered into sale and leaseback transactions of 17 vessels which have been leased back for periods ranging between
8 and 10 years. Under these agreements three of the vessels are still due, with delivery expected in the first and second quarter of 2017. The sale and leaseback transactions have generated proceeds in 2016 of USD449.0 million and a gain of USD16.1 million. The sale and leaseback transactions can be classified as an operational lease. The gain is accounted for under other operating income. The lease agreements are in line with market rent for longer-term charters. The future charter commitments of these leases are included in the outstanding commitments under Note 27.
During the regular assessment to determine asset impairment, the Group decided to record an impairment of USD42.7 million on non-financial assets related to the Group’s railway operation in Colombia. The operations have been negatively impacted by a number of safety and security concerns, a complex economic environment and a consequent lack of sustainable profit growth in the current context. The investment has been impaired up until the value we expect to receive on the remaining asset.
In 2015, during the regular assessment in determining an indication of asset impairment or whether a previously recorded impairment may no longer be required the evaluation of projects and forecasts and mining assets resulted in an impairment charge of USD323.6 million in relation to Impala Terminals Burnside and the iron-ore investment in AEMR SA, Angola. The net result of the impairment on result attributable to owners of the company is USD167.1 million after taking into account non-controlling interests.
12. INTANGIBLE ASSETS
USD’M Goodwill Licences Mineral rights
Other intangible
assets Total
Cost Balance at 1 October 2015 8.1 40.5 – 306.1 354.7 Additions – – – 45.8 45.8 Reclassifications – – – 6.7 6.7 Effect of movements in exchange rates – 1.3 – (3.0) (1.7)Disposals – (5.4) – (12.4) (17.8)
Balance at 30 September 2016 8.1 36.4 – 343.2 387.7
Amortisation and impairment lossesBalance at 1 October 2015 2.2 1.9 – 104.8 108.9 Amortisation for the year – 0.2 – 56.1 56.3 Impairment losses – 5.4 – 2.0 7.4 Effect of movements in exchange rates – – – (0.9) (0.9)Reclassification – – – 2.3 2.3 Disposals – (5.4) – (11.4) (16.8)
Balance at 30 September 2016 2.2 2.1 – 152.9 157.2
Net book value at 30 September 2016 5.9 34.3 – 190.3 230.5
TRAFIGURA 2016 ANNUAL REPORT 63
FIN
AN
CIA
L ST
AT
EM
EN
TS

FINANCIAL STATEMENTS
F. NOTES TO CONSOLIDATED FINANCIAL STATEMENTS (CONTINUED)
USD’M Goodwill Licences Mineral rights
Other intangible
assets Total
Cost Balance at 1 October 2014 2.2 14.1 420.5 276.4 713.2Acquisitions through business combinations – – – 1.0 1.0Additions 5.9 41.0 – 79.5 126.4Reclassifications – 2.3 (56.6) (41.0) (95.3)Effect of movements in exchange rates – (12.4) – (1.5) (13.9)Disposals – (4.5) – – (4.5)Divestments of subsidiaries – – (363.9) (8.3) (372.2)
Balance at 30 September 2015 8.1 40.5 – 306.1 354.7
Amortisation and impairment losses Balance at 1 October 2014 2.2 3.1 84.5 90.3 180.1Amortisation for the year – 0.2 5.8 46.0 52.0Impairment losses – 1.2 20.0 1.5 22.7Reclassification – 0.5 (60.9) (22.8) (83.2)Disposals – (3.1) – – (3.1)Divestments of subsidiaries – – (49.4) (10.2) (59.6)
Balance at 30 September 2015 2.2 1.9 – 104.8 108.9
Net book value at 30 September 2015 5.9 38.6 – 201.3 245.8
Goodwill is the only intangible asset with an indefinite life. All other intangible assets are amortised as follows:
• Licence fees paid are amortised evenly over their respective periods, for which the licences have been granted, generally not exceeding 10 years;
• Other intangible assets are amortised evenly over their estimated useful economic life. Other intangibles mainly consist of software, payments made under exclusivity contracts with clients for petroleum fuels and lubricants and exploration costs.
Amortisation expenses and impairment charges are included in general and administrative expenses.
Intangible assets with finite lives are tested for impairment when impairment indicators exist. Goodwill is tested for impairment annually either individually or at the cash-generating unit (CGU) level. Annually, development costs are evaluated on a project-by-project basis by reviewing current status and project details.
For the purpose of impairment testing, goodwill is allocated to the CGUs, or groups of CGUs.
In 2015, during the regular assessment of whether there was an indication of asset impairment or whether a previously recorded impairment may no longer be required, the evaluation of projects and forecasts and mining assets resulted in impairment charges of USD20 million in relation to mining licences/mineral rights in the Central Africa Region.
13. EQUITY-ACCOUNTED INVESTEES
2016
USD’M
1 October 2015 3,167.5Effect of movements in exchange rates (42.5)Additions 553.9Disposals (44.1)Impairments (250.0)Share of net income/(loss) 94.3Dividends received (13.7)Other (1.0)
30 September 2016 3,464.4
The Group’s share of profit in its equity-accounted investees for the year was a gain of USD94.3 million (2015: USD87.8 million).
In 2016, the Group received dividends of USD13.7 million from its investments in equity-accounted investees (2015: USD25.8 million).
In October 2015, Trafigura made an additional capital contribution of USD275 million in Puma Energy Holdings Pte Ltd. to enable further growth. During 2016, the company invested USD141.6 million in a copper smelting company in China. In February 2016, Trafigura subscribed to the rights offering by Nyrstar N.V. allowing it to increase its investment in Nyrstar N.V. by USD70 million. Also during 2016 Trafigura made an additional investment of USD36.9 million in PT Servo Meda Sejahtera, a coal trading partner located in Indonesia.
The reduction in equity accounted investees in 2016 was as a result of the sale of a minor stake in Puma Energy Holding Pte Ltd. of USD41.8 million. Besides that an impairment of USD250.0 million was made on Trafigura’s equity investment in Porto Sudeste, as described below.
64 TRAFIGURA 2016 ANNUAL REPORT

During the regular assessment to determine asset impairment or whether a previously recorded impairment may no longer be required, the Group decided that due to the continued low iron ore price environment, strong competition on logistics fees and low international freight rates, that an impairment of USD250.0 million in relation to Trafigura’s investment in Porto Sudeste do Brasil SA was required. Impairment exists when the carrying value of an asset or CGU exceeds its recoverable amount, which the company has defined as the higher of value in use and fair value less costs of disposal. As the majority of the specific assets related to Porto Sudeste do not have independent associated cash flows, Porto Sudeste represents one CGU. The recoverable amount of the property, plant, and equipment were measured based on value in use, determined using the discounted cash flow technique (level 3), where possible, market forecasts and assumptions discounted using operation specific discount factors. Discount rates used in determining the value in use were 12.6% (2015: 12.6%). The recoverable amount of the CGU was determined to be USD254 million. The value-in-use methodology inherently includes elements of judgement and estimations; including in relation to future throughput volumes and associated terminal rates. Management has made these judgements based on their best estimates and the information available. The sensitivity analyses on the valuations show that an increase/decrease in the discount rate of 0.5% has an impact on our valuation of minus USD95 million/plus USD102 million. A change in the throughput volume of the Port of 5% causes a change of USD28 million to the valuation and a change of the terminal rates of 5% has an impact of USD90 million.
Name
Place of incorporation/ registration Activities
Percentage of equity
attributable to the Group
2016
Percentage of equity
attributable to the Group
2015
Buckeye Texas Partners LLC
United States Terminalling20.0% 20.0%
Empresa Minera del Caribe S.A.
Caribbean Mining49.0% 49.0%
Guangxi Jinchuan Nonferrous Metals Co., Ltd
China Smelter
30.0% –Napoil Limited Bermuda Oil trading 49.0% 49.0%Osmunda Limited Isle of Man Oil trading – 33.0%Porto Sudeste do Brasil S.A. (joint venture)
Brazil Port services
47.4% 47.3%PT Servo Meda Sejahtera
Indonesia Coal trading46.5% 40.0%
Puma Energy Holdings Pte. Ltd.
Singapore Mid- and downstream oil activities 49.6% 48.6%
Transportadora Callao S.A.
Peru Transportation30.0% 30.0%
ATALAYA MINING PLC (previously known as EMED MINING PUBLIC LIMITED)
Cyprus Mining
22.0% 22.0%Nyrstar N.V. Belgium Mining, Metal
processing 24.6% 23.7%TM Mining Ventures, S.L. (joint venture) Spain Mining 50.0% 50.0%
2016 2015
Name Segment USD’M USD’M
Oil and Petroleum:Puma Energy Holdings Pte. Ltd.
Oil and Petroleum2,059.8 1,819.7
Buckeye Texas Partners LLC
Oil and Petroleum276.0 260.9
Napoil Limited Oil and Petroleum 8.7 8.7Osmunda Limited Oil and Petroleum – 1.4Others Oil and Petroleum 1.1 1.1
Total 2,345.6 2,091.8
Metals and Minerals:TM Mining Ventures, S.L. (MATSA)
Metals and Minerals407.3 422.2
Porto Sudeste do Brasil S.A.
Metals and Minerals256.1 377.5
Nyrstar N.V.* Metals and Minerals 161.9 165.3 Guangxi Jinchuan Nonferrous Metals Co., Ltd 141.7 –ATALAYA MINING PLC (previously known as EMED MINING PUBLIC LIMITED)*
Metals and Minerals
53.8 55.8 PT Servo Meda Sejahtera
Metals and Minerals56.2 23.3
Empresa Minera del Caribe S.A.
Metals and Minerals16.8 16.8
Transportadora Callao S.A.
Metals and Minerals8.7 10.5
Others Metals and Minerals 6.9 3.1 Total 1,109.4 1,074.5
All other segments:Others Corporate and Others 9.4 1.2
Total 9.4 1.2
Total 3,464.4 3,167.5* Listed investments. Fair value as at 30 September 2016 based upon level 1 valuation:
Nyrstar N.V. 168.7ATALAYA MINING PLC (previously known as EMED MINING PUBLIC LIMITED) 28.8
Individually significant associate Puma Energy Holdings Pte. Ltd. is shown separate from the other associates.
TRAFIGURA 2016 ANNUAL REPORT 65
FIN
AN
CIA
L ST
AT
EM
EN
TS

FINANCIAL STATEMENTS
F. NOTES TO CONSOLIDATED FINANCIAL STATEMENTS (CONTINUED)
Puma Energy Holdings Pte. Ltd.2016 2015
USD’M USD’M
Non-current assets 5,019.1 4,645.4 Current assets 2,070.9 2,069.6 Non-current liabilities 2,916.8 2,545.6 Current liabilities 2,273.0 2,634.0 The above assets and liabilities include: Cash and cash equivalents 474.0 281.2Current financial liabilities 475.0 645.6Revenue 12,725.6 12,567.6 Profit/(loss) for the year 120.4 187.5 Dividends paid – 17.0 Other comprehensive income (109.7) (484.2)Total comprehensive income 10.7 (296.8)Net assets 1,900.3 1,535.4Trafigura’s ownership interest 49.6% 48.6% Acquisition fair value and other adjustments 1,117.3 1,074.1Carrying value 2,059.8 1,819.7
Other equity accounted investees2016 2015
Other associates USD’M USD’M
Assets 4,683.4 3,685.8Liabilities 3,335.6 2,502.5Revenue 1,484.2 762.1Profit/(loss) for the year 33.9 (2.8)
14. PREPAYMENTSUnder the prepayments category we account for the prepayments of commodity deliveries. The contractually outstanding prepayments amount decreases in size with each cargo that is delivered, until maturity. Once the contractually agreed total cargo has been fully delivered, the prepayment agreement falls away leaving no remaining contractual obligations on Trafigura or the supplier. As the economic benefit of the prepayments is the receipt of goods rather than the right to receive cash or another financial asset, the prepayments are not classified as a financial asset under IFRS. The Company monitors the commodity prices in relation to the prepayment contracts and manages the credit risk together with its financial assets as described in Note 27. The prepayments are split in non-current prepayments (due > 1 year) and current prepayments (due < 1 year). A portion of the long-term prepayments, as well as short-term prepayments, is on a limited recourse basis. Interest on the repayments is added to the prepayments balance.
15. LOANS RECEIVABLE
2016 2015 USD’M USD’M
Loans to associates and related parties 433.9 251.8Other non-current loans receivable 367.4 188.3
Total 801.3 440.1
Loans to associates and related parties consist of a shareholder loan receivable from Minas de Aguas Teñidas (MATSA) of USD251.8 million (2015: USD251.8 million). This loan is held to collect contractual cash flows and generates a fixed income for the Group. Also included under this line is a loan receivable from Empressa Minera del Caribe S.A. of USD140.0 million (2015: USD54.0 million under other non-current loans receivable).
In determining the impairment provision of these loans, the Group included the amount of the loans in the invested amounts in these companies under equity accounted investees. The impairment assessment of these investments has been performed on the total investments including loans issued. Based on these assessments no impairment needs to be recorded at 30 September 2016.
Other non-current loans receivable includes various loans which are granted to counterparties with which Trafigura trades. This line also includes the long-term portion (USD280.9 million) of the debt agreement with the Angolan Ministry of Finance which is further described in Note 6. Considering the diversity of these loans, Trafigura decided to assess the Expected Credit Loss (‘ECL’) of these loans individually based on different scenarios of probability of default (‘PD’) and loss given default (‘LGD’). Based upon the individual analysis of these loans, the recorded expected losses on these loans amount USD2.5 million (2015: USD nil).
The Group also assessed whether the present value of the outstanding amounts assuming on time receipt, is significantly higher than the present value of the receivables that are past due. This difference was concluded to be insignificant.
16. OTHER INVESTMENTS
2016 2015 USD’M USD’M
Listed equity securities – Fair value through OCI 97.6 145.3Listed debt securities – Fair value through profit or loss 327.0 528.3Unlisted equity investments – Fair value through profit and loss 59.4 71.2Unlisted equity investments – Fair value through OCI 56.3 64.4
Total 540.3 809.2
The Group’s long-term investments consist of listed equity securities, listed debt securities and unlisted equity securities. The listed equity securities have no fixed maturity or coupon rate. The fair values of listed equity investments are based on quoted market prices while the fair value of the unlisted equity securities is determined based on a Level 3 valuation as prepared by management.
The decrease in other investments is mainly due to the sale of the listed Pacific Exploration and Production shares (USD73.3 million), the partial sale of the debt instrument related to Porto Sudeste (USD91.7 million) and downward valuation of USD125.9 million based upon level 3 valuation of the same debt instruments.
The listed debt securities consist of a financial instrument related to the investment in Porto Sudeste do Brasil SA which is accounted for under equity accounted investees in Note 13. These instruments are held to collect cash flows. Since the payments on these debt instruments are dependent on the port’s throughput, they are classified as fair value through profit or loss. Since the free float of these listed debt instruments is extremely thin and in the absence of normal market activity, it has been concluded that no active market exists and therefore the fair value is determined using a level 3 valuation. The holders of the instrument will be directly dependent on the business risk of Porto Sudeste. Therefore the fair value of this instrument is based on a discounted cash flow calculation using the business plan of Porto
66 TRAFIGURA 2016 ANNUAL REPORT

Sudeste. Revenues are calculated over a period ending in 2064 and are held constant from 2022 onwards. In this calculation management used a discount rate of 12.6% (2015: 12.6%). Due to the limited liquidity of the port asset, a discount factor of 26% is applied (2015: 38%) relating to the lack of marketability. This input is based on a put option model and volatilities of comparable companies. Due to the adjustments made in the projections of the throughput of the Port in 2016, an impairment has been recorded on our investment in Porto Sudeste (see Note 13). As a consequence, the level 3 valuation of the debt securities also decreased which led to a downward valuation on the debt securities of USD125.9 million. The sensitivity analysis on this valuation shows that an increase/decrease of the discount rate by 0.5% has an impact on our valuation of USD23 million. A change in the discount due to lack of marketability by 5% has an effect of USD21 million on the valuation.
Throughout the financial year, no dividend has been recognised related to the equity securities held at 30 September 2016. The net change in fair value in equity securities measured at fair value through other comprehensive income (‘OCI’) was negative USD31.7 million (2015: negative USD91.9 million). A cumulative loss of USD66.0 million (2015: USD52.1 million) was transferred within equity from OCI to retained earnings due to disposals and the reclassification of items to equity-accounted investees.
17. INVENTORIES
2016 2015
Carrying amount USD’M USD’M
Storage inventories 7,069.1 4,961.4Floating inventories 4,455.7 2,633.8Supplies 12.9 19.2
Total 11,537.7 7,614.4
As at 30 September 2016 (and 30 September2015) all of the inventory has either been pre-sold or hedged. The Group is committed to financing its day-to-day trading activity through self-liquidating transactional lines, whereby the financing banks retain security on the goods purchased. The percentage of total inventories financed in this way is carefully monitored.
18. TRADE AND OTHER RECEIVABLES
2016 2015
USD’M USD’M
Trade debtors 6,725.7 5,787.4Provision for bad and doubtful debts (56.6) (43.5)Accrued turnover 5,403.7 4,554.2Broker balances 1,212.1 380.9Other debtors 333.2 851.3Loans to third parties 217.3 694.1 Loans to related parties 104.2 284.4 Other taxes 222.5 193.7Prepaid expenses 147.2 165.4Related parties 890.6 1,034.4
Total 15,199.9 13,902.3
All financial instruments included in trade and other receivables are held to collect the contractual cash flows. Furthermore, the cash flows that the Group receives on these instruments are solely payments of principal and interest.
Of the USD6,725.7 million trade debtors, USD1,516.0 million (2015: USD1,038.8 million) had been sold on a non-recourse basis under the securitisation programme. Refer to Note 19. As at 30 September 2016, 17.7% (2015: 14.6%) of receivables were between 1-60 days overdue, and 17.8% (2015: 11.9%) were greater than 60 days overdue. Most of the overdue amounts are related to state owned counterparties. Such receivables, although contractually past their due dates, are not considered impaired as there has not been a significant change in credit quality of the relevant counterparty, and the amounts are still considered recoverable taking into account customary payment patterns and in many cases, offsetting accounts payable balances. Trafigura applied the simplified method in assessing expected credit losses. The accounts receivables have been divided in aging buckets and based on a historical analysis on defaults and recovery rates a percentage for expected credit losses has been determined. Trafigura manages to limit credit losses by renegotiating contracts in the case of a default. From the above analysis, an expected credit loss as at 30 September 2016 of USD5.9 million has been taken into account (30 September 2015: USD nil). The provision for doubtful debtors at 30 September 2016 amounts to USD56.6 million (2015: USD43.5 million). The primary character of this provision is that it is in line to resolve demurrage claims and commercial disputes with our clients. Accrued turnover represent receivable balances for sales which have not yet been invoiced. They have similar risks and characteristic as trade debtors. Trade debtors and accrued turnover have similar cashflow characteristics and are therefore considered to be a homogeneous group of financial assets.
19. SECURITISATION PROGRAMMEThe Group operates a Securitisation Programme which enables the Group to sell eligible receivables. The securitisation vehicle, Trafigura Securitisation Finance plc., is consolidated as part of the Group and consequently the receivables sold to the programme are included within the consolidated trade debtor balances.
Over time the external funding has increased significantly in size while incorporating a longer term committed funding element, principally through the issuance of Medium Term Notes (MTN), as well as retaining a significant proportion of variable funding purchased by bank sponsored conduits.
As at 30 September 2016, the maximum available amount of external funding of the programme was USD1,888 million (2015: USD2,133 million). The utilised external funding of the programme as at 30 September 2016 was USD1,485 million (2015: USD1,258 million).
The available external funding of the securitisation programme consists of:
2016 2015
Interest rate Maturity USD’M USD’M
AAA MTN Libor + 0.95% 2017 – October 279.0 279.0BBB MTN Libor + 2.25% 2017 – October 21.0 21.0AAA VFN See note below Various throughout
the year 1,425.4 1,644.3BBB VFN See note below Various throughout
the year 107.2 123.4Senior subordinated debt Libor + 4.25% 2017 – March 55.4 65.7
Total 1,888.0 2,133.4
TRAFIGURA 2016 ANNUAL REPORT 67
FIN
AN
CIA
L ST
AT
EM
EN
TS

FINANCIAL STATEMENTS
F. NOTES TO CONSOLIDATED FINANCIAL STATEMENTS (CONTINUED)
a. Interest rate noteThe rate of interest applied to the AAA Variable Funding Notes is defined in the securitisation facility documentation and is principally determined by the demand for Commercial paper issued by six bank-sponsored conduits. The Group benchmarked the rate provided against overnight Libor. In the case of the rate of interest applicable to the BBB Variable Funding Notes, the rate of interest is principally determined by the liquidity of the interbank market.
b. Maturity noteThe maturity of the AAA Variable Funding Notes has been staggered so as to diversify the maturity profile of the AAA funding. This aims to mitigate the ‘liquidity wall’ risk associated with a single maturity date for a significant funding amount.
20. CASH AND CASH EQUIVALENTSCash at bank earns interest at floating rates based on daily bank deposit rates. Short-term deposits are made for varying periods of between one day and three months depending on the immediate cash requirements of the Group and earn interest at the respective short-term deposit rates. The fair value of cash and cash equivalents approximates the carrying value. An amount of USD43.1 million (2015: USD34.0 million) of cash at bank is restricted and can be collected when fixed asset construction invoices are presented to the banks.
2016 2015
USD’M USD’M
Cash at bank and in hand 2,786.4 3,116.1Short-term deposits 355.5 418.1
Total 3,141.9 3,534.2
As at 30 September 2016, the Group has USD8.0 billion (2015: USD7.8 billion) of committed revolving credit facilities of which USD3.2 billion (2015: USD3.2 billion) remained unutilised. The Group had USD2.0 billion (2015: USD1.8 billion) of immediately (same day) available cash in liquidity funds. The Group had immediate access to available liquidity balances from liquidity funds and corporate facilities in excess of USD5.2 billion (2015: USD4.9 billion). Short-term deposits made for periods longer than three months are separately shown in the statement of financial position and earn interest at the respective short-term deposit rates.
21. CAPITAL AND RESERVES
a. Share capitalAs at 30 September 2016 the company has 25,000,000 ordinary shares outstanding and a capital of USD1,504 million. During 2016 no changes took place in the outstanding share capital.
The holders of ordinary shares are entitled to receive dividends as and when declared by the Company. All ordinary shares carry one vote per share without restriction. The ordinary shares have no par value.
b. Capital contribution reserveThe capital contribution reserve relates to share capital and share premium of investments in subsidiaries contributed by the parent company to the Company. The contributions of these subsidiaries qualified as transactions under common control and have been accounted for under the pooling method of accounting. Under the pooling method of accounting the subsidiaries contributed have been consolidated in the Company’s financial statements as if they were included in the Company’s group structure as at the opening balance sheet of 1 October 2013. At the date of actual contribution by the parent company to the Company, any amount paid in excess of the carrying value of the subsidiary at the date of transfer has been recorded as a reduction in retained earnings. In 2016 an adjustment was made on the 2015 acquisitions of subsidiaries from the parent company of USD6.5 million.
c. Capital SecuritiesAs part of the financing of the Company and its subsidiaries, the Company has taken over two capital securities instruments from its immediate parent Trafigura Beheer B.V. at the carrying value of USD640.6 million with a par value of SGD200 million and USD500 million. This substitution of issuer and subsequent transfer is in accordance with the trust deed of the SGD200 million and USD500 million capital securities.
The SGD200 million capital security was originally issued in February 2014. The distribution on the security is 7.5% and is listed on the Singapore Stock Exchange. The capital security may be redeemed at the Company’s option in whole, but not in part, on the distribution payment date in February 2019 or any distribution date thereafter on not less than 30 and not more than 60 days’ notice to the holders.
The USD500 million capital security was originally issued on 19 April 2013. The distribution on the capital security is 7.625% per annum and it is listed on the Singapore Stock Exchange. The capital security may be redeemed at the Company’s option in whole, but not in part, on the distribution payment date in April 2018 or any distribution date thereafter on not less than 30 and not more than 60 days’ notice to the holders.
68 TRAFIGURA 2016 ANNUAL REPORT

The securities are perpetual in respect of which there is no fixed redemption date. The distribution on the capital securities is per annum, payable semi-annually in arrears every six months from the date of issue. The company may elect to defer (in whole but not in part) any distribution in respect of these capital securities.
In the event of a winding-up, the rights and claims of the holders in respect of the capital securities shall rank ahead of claims in respect of the Company’s shareholders, but shall be subordinated in right of payment to the claims of all present and future unsubordinated obligations, except for obligations of the Company that are expressed to rank pari passu with, or junior to, its obligations under the capital securities.
According to the trust deed obligations of the Substitute under the Securities and the Coupons shall be unconditionally and irrevocably guaranteed by Trafigura Group Pte. Ltd.
d. Currency translation reserveThe currency translation reserve comprises all foreign currency differences arising from the translation of the financial statements of foreign operations, as well as from the translation of liabilities that hedge the Company’s net investment in a foreign operation.
e. Revaluation reserveThe revaluation reserve comprises the fair value measurements movements of the equity investments which are accounted for at fair value through other comprehensive income. On realisation of these gains or losses, for example the sale of an equity instrument, the cumulative amounts of this reserve are transferred to retained earnings. Included in the revaluation reserve is a loss of USD23.0 million (2015: USD57.3 million) related to the mark to market valuation of equity investments.
f. Cash flow hedge reserveIncluded in the cash flow hedge reserve is a gain of USD14.1 million (2015: USD27.8 million loss) related to the effective portion of the changes in fair value of cash flow hedges, net of tax.
g. Retained earningsRetained earnings comprise the share-based payment reserves and revaluation reserves.
h. DividendsThe value of the dividends declared on the ordinary shares amounts to USD719.1 million representing USD28.8 per share.
22. MATERIAL PARTLY-OWNED SUBSIDIARIESFinancial information of subsidiaries that have material non-controlling interest is provided below. The information is based on amounts before intercompany eliminations.
The Company has control over DTS Holdings Pte Ltd with a 50% equity interest (2015: 50%). DTS Holdings PTE Ltd is a business venture between Trafigura and Cochan and is the main holding company of the DT Group. The DT Group’s activities span trading, shipping, infrastructure, asset management, logistics and mining. Summarised statement of income:
2016 2015
USD’M USD’M
Revenue 1,617.7 3,876.2Cost of sales (1,533.4) (3,725.2)General and administrative expenses (18.2) (33.0)Other income/expense 263.4 (244.3)Net financing income/expense 8.9 (3.6)Profit/(loss) before tax 338.4 (129.9)Income tax expense (2.1) (7.1)Profit/(loss) for the period 336.3 (137.0)Attributable to non-controlling interest 226.4 (124.0)
The OCI related to non-controlling interest is disclosed in the consolidated statement of changes in equity.
During 2016, DTS Holdings Pte. Ltd. paid no dividend (2015: USD200 million).
Summarised statement of financial position as at 30 September:
2016 2015
USD’M USD’M
Total non-current assets 428.7 267.6Total current assets 1,659.6 1,524.5Total non-current liabilities (5.5) (9.1)Total current liabilities (1,494.5) (1,534.6)Total equity 588.3 248.4
Attributable to Non-controlling interests 292.3 65.8Owners of the Company 296.0 182.6
23. LOANS AND BORROWINGSThis note provides information about the contractual terms of the Group’s interest-bearing loans and borrowings, which are measured at amortised cost. For more information about the Group’s exposure to interest rate, foreign currency and liquidity risk, see Note 27.
2016 2015
Carrying value of loans and borrowings USD’M USD’M
Non-current Revolving credit facilities 3,960.0 4,160.0Private placements 331.0 331.0Eurobond 1,231.7 1,296.6Other loans 1,685.0 1,469.5Finance leases 26.5 32.6Total non-current 7,234.2 7,289.7
CurrentRevolving credit facilities 685.0 215.0Private placements – 44.0Other loans 364.6 335.4Finance leases 12.3 16.2Short-term bank borrowings 16,971.1 14,057.6Total current 18,033.0 14,668.2
Total 25,267.2 21,957.9
TRAFIGURA 2016 ANNUAL REPORT 69
FIN
AN
CIA
L ST
AT
EM
EN
TS

FINANCIAL STATEMENTS
F. NOTES TO CONSOLIDATED FINANCIAL STATEMENTS (CONTINUED)
a. Terms and debt repayment scheduleTerms and conditions of outstanding loans were as follows:
Floating/fixed 0-1 year 1-5 years > 5 years Total
Principal Interest Maturity rate debt USD’M USD’M USD’M USD’M
Revolving credit facilities USD 3,190.0 Libor + 0.85% 2019 – March Floating – 2,810.0 – 2,810.0USD 1,910.0 Libor + 0.65% 2017 – March Floating 250.0 – – 250.0USD 435.0 Libor + 1.70% 2016 – October Floating 435.0 – – 435.0USD 435.0 Libor + 1.30% 2017 – October Floating – 435.0 – 435.0USD 625.0 Libor + 1.10% 2018 – October Floating – 625.0 – 625.0USD 90.0 Libor + 2.35% 2018 – October Floating – 90.0 – 90.0
685.0 3,960.0 – 4,645.0Private placements USD 88.0 6.50% 2018 – April Fixed – 88.0 – 88.0USD 98.0 7.11% 2021 – April Fixed – 98.0 – 98.0USD 36.0 4.38% 2018 – March Fixed – 36.0 – 36.0USD 51.5 4.89% 2020 – March Fixed – 51.5 – 51.5USD 57.5 5.53% 2023 – March Fixed – – 57.5 57.5
– 273.5 57.5 331.0Eurobonds EUR 593.0 5.25% 2018 – November Fixed – 669.0 – 669.0EUR 500.8 5.00% 2020 – April Fixed – 562.7 – 562.7
– 1,231.7 – 1,231.7Other loans USD 279.0 Libor + 0.95% 2017 – October Floating – 279.0 – 279.0USD 21.0 Libor + 2.25% 2017 – October Floating – 21.0 – 21.0USD 150.0 Libor + 2.65% 2020 – September Floating 21.5 107.9 – 129.4USD 200.0 Libor + 3.15% 2022 – March Floating 12.3 153.1 7.1 172.5USD 55.5 Libor + 4.25% 2017 – March Floating 55.5 – – 55.5JPY 50,500.0 Libor + 1.0% 2019 – March Floating – 498.3 – 498.3USD 200.0 6.33% 2036 – July Fixed 5.3 23.1 171.7 200.1EUR 150.0 Euribor + 0.9% 2017 – January Floating 167.7 – – 167.7EUR 200.0 5.50% 2020 – July Fixed – 224.7 – 224.7USD 30.0 Libor + 3.25% 2018 – March Floating – 30.0 – 30.0USD 60.0 Libor + 1.6% 2017 – March Floating 47.3 – – 47.3USD 120.0 Libor + 4% 2021 – August Floating 20.0 80.0 5.0 105.0MXN 415.7 Libor + 5.70% 2023 – June Floating 3.2 14.1 5.7 23.0USD 39.6 Libor + 2.95% 2019 – October Floating 3.5 21.3 – 24.8Various 28.4 41.0 1.9 71.3
364.7 1,493.5 191.4 2,049.6
Finance leases 12.3 26.5 – 38.8
Total 1,062.0 6,985.2 248.9 8,296.1
For long-term assets pledged under loans and borrowings agreements, refer to Note 11 (Property, plant and equipment).
Finance lease commitments are principally for machinery and equipment. Original terms range from two years to five years, some containing renewal options.
At the time of entering into finance lease agreements, the commitments are recorded at their present value using the interest rate then applicable for long-term funding. At 30 September 2016, existing finance lease commitments are recorded at the remaining present value using the interest rate applied at commencement of the lease.
24. PROVISIONSThe carrying amount of provisions made is as follows:
2016 2015
Carrying amount of provisions USD’M USD’M
Opening balance 1 October 83.9 23.9Additions 7.1 74.5Amount charged against provisions (10.5) (0.8)Unwinding of discount 0.4 3.9Remeasurements and other movements (11.6) (1.1)Divestments of subsidiaries – (16.5)Closing balance 30 September 69.3 83.9
Non-current portion 13.3 9.8Current portion 56.0 74.1Closing balance 30 September 69.3 83.9
70 TRAFIGURA 2016 ANNUAL REPORT

Provisions consist of Decommissioning, rehabilitation and restoration USD10.9 million (2015: USD10.0 million), Litigation, disputes USD45.5 million (2015: USD45.5 million), Onerous contracts USD5.0 million (2015: USD20.0 million) and others USD7.9 million (2015: USD8.4 million).
Provisions for decommissioning, rehabilitation and restoration costs are recognised due to the environmental commitment the Group has made with local authorities and for its obligations to undertake site reclamation and remediation in connection with its mining activities. Provisions for litigation and disputes at 30 September 2016, relate to two situations connected with the Company’s trading and storage activities in China. Further information is presented in Note 26. Under the Onerous contracts the wind up of some long-term lease contracts are accounted for as well as onerous capital expenditure commitments. The expected outflow of resources is mainly to happen within one year.
25. TRADE AND OTHER PAYABLES
2016 2015
USD’M USD’M
Trade creditors 2,100.3 2,368.1Accrued costs of sales and expenses 6,825.4 6,593.6Broker balances 18.3 520.8Related parties 8.5 3.8
Total 8,952.5 9,486.3
The Group’s exposure to currency and liquidity risk related to trade and other payables is disclosed in Note 27.
26. CONTINGENCIES AND COMMITMENTSThe following contingent liabilities exist in respect of trade financing:
2016 2015
USD’M USD’M
Letters of credit 4,702.3 3,840.7Guarantees 312.7 151.8
Total 5,015.0 3,992.5
The Company and its subsidiaries are parties to a number of legal claims and proceedings arising out of their business operations. The Company believes that the ultimate resolution of these claims and proceedings will not, in the aggregate, have a material adverse effect on The Company’s financial position, consolidated income or cash flows. Such legal claims and proceedings, however, are subject to inherent uncertainties and the outcome of individual matters is unpredictable. It is possible that the Company could be required to make expenditures, in excess of established provisions, in amounts that cannot reasonably be estimated.
As reported in the press, at certain warehouses in China, notably for the Company at Qingdao, Pinglai and Yingkou, there have been rumours that fraudulent warehouse certificates are in circulation. The Company’s subsidiary Impala has issued warehouse certificates, and also has a limited number of collateral management agreements in place, regarding metal stored at these locations. The position remains that it has not been possible to independently verify the quantity and ownership of the metal stored at these locations and consequently legal proceedings have been commenced in England and China relating to ownership of the metal and potential liabilities regarding the storage arrangements. In view of the uncertainties surrounding (a) the volume
of material in the warehouses; (b) its correct ownership; and (c) the approach the majority of the customers will ultimately take, it remains premature to speculate on Impala’s likely net total exposure in relation to this matter. Looking at hypothetical yet realistic scenarios, it is considered unlikely that a potential liability for Impala would be material for the Group.
The Company has a potential financial exposure resulting from certain oil trading and risk management activities of its counterparty’s representative. These activities are the subject of on-going actions, claims and disputes against the Company. The underlying circumstances regarding these actions, claims and disputes are complex and opaque and consequently how these disputes and actions will be resolved is uncertain.
Guarantees include guarantees to trading partners in the normal course of the business. In addition the Company has given a financial guarantee on the full recourse tranches of the syndicated bank facility held by Trafigura Investment Sarl. This company holds a USD1 billion prepayment facility in favour of Rosneft which was syndicated with a pool of international banks. The shares of Trafigura Investment Sarl are held by an independent Foundation incorporated in the Netherlands in which Trafigura has no control and thus has been deconsolidated since 30 September 2014. The maximum exposure under this guarantee as of 30 September 2016 amounted to USD285 million (2015: USD300 million). The expiry of this guarantee is September 2018.
The Company had outstanding commitments at the end of 30 September 2016 and 30 September 2015 as follows:
2016 2015
USD’M USD’M
Storage rental 2,731.5 2,759.0Time charters 1,133.3 1,176.8Office rent 122.8 156.1
3,987.6 4,091.9Assets under construction 378.4 671.0
Total 4,366.0 4,762.9
Non-cancellable operating lease rentals are payable as follows:
2016 2015
USD’M USD’M
Less than one year 1,222.3 1,210.2Later than one year and less than five years 2,340.6 2,302.6Later than five years 424.7 579.1
Total 3,987.6 4,091.9
Amount under Assets under construction includes an amount of USD236.5 million (2015: USD421.5 million) as commitments for vessels under construction.
27. FINANCIAL INSTRUMENTS
a. Financial risk managementThe Group is exposed to a number of different financial risks arising from normal business exposures as well as its use of financial instruments including: market risks relating to commodity prices, foreign currency exchange rates and interest rates; credit risk; and liquidity risk.
TRAFIGURA 2016 ANNUAL REPORT 71
FIN
AN
CIA
L ST
AT
EM
EN
TS

FINANCIAL STATEMENTS
F. NOTES TO CONSOLIDATED FINANCIAL STATEMENTS (CONTINUED)
Prudently managing these risks is an integral element of Trafigura’s business and has been institutionalised since the Group’s foundation. Risk management guidelines are established at senior management level. The various risks the Group is exposed to are managed through a combination of internal procedures, such as strict control mechanisms and policies, as well as external third parties such as the derivative, insurance and bank markets. As a rule, Trafigura actively manages and lays off where possible a large majority of the risks inherent to its activity. Trafigura’s conservative risk management process is designed to:
• Provide a full and accurate awareness of risks throughout the Group.
• Professionally evaluate and monitor these risks through a range of risk metrics.
• Limit risks via a dynamic limit setting framework.
• Manage risks using a wide range of hedging instruments and strategies.
• Ensure a constant dialogue between trading desks, risk managers and senior management.
The three main, reinforcing, components of Trafigura’s risk management process are the Chief Risk Officer (CRO), the Risk Committee, and the trading teams.
The Chief Risk Officer is independent of the revenue-producing units and reports to the Chief Operating Officer and the Board of Directors. The CRO has primary responsibility for assessing and monitoring Trafigura’s market risks. The CRO’s team liaises directly with the trading teams to analyse new opportunities and ensures that risk assessments adapt to changing market conditions. The CRO’s team also ensures Trafigura’s risk management capabilities incorporate ongoing advances in technology and risk management modelling capabilities.
The Risk Committee, which is comprised of members of the Board of Directors and the Chief Risk Officer is responsible for applying Trafigura’s risk management capabilities towards improving the overall performance of the Group. In 2016, the Risk Committee met weekly to discuss and set risk and concentration limits, review changing market conditions, and analyse new market risks and opportunities.
Trafigura’s trading teams provide deep expertise in hedging and risk management in the specific markets each team operates in. While the trading teams have front line responsibility for managing the risks arising from their activities, our process ensures a strong culture of escalation and accountability, with well-defined limits, automatic notifications of limit overages and regular dialogue with the CRO and Risk Committee.
b. Market riskMarket risk is the risk of loss in the value of Trafigura’s positions due to changes in market prices. Trafigura holds positions primarily to ensure our ability to meet physical supply commitments to our customers, to hedge exposures arising from these commitments, and to support our investment activities. Our positions change due to changing customer requirements and investment opportunities. The value of our positions is accounted for at fair value and therefore fluctuates on a daily basis due to changes in market prices. Categories of market risk we are exposed to include:
• Commodity price risk results from exposures to changes in spot prices, forward prices and volatilities of commodities, such as crude oil, petroleum products, natural gas, base metals, coal and iron ore.
• Currency rate risk results from exposures to changes in spot prices, forward prices and volatilities of currency rates.
• Interest rate risk results from exposures to changes in the level, slope and curvature of yield curves, the volatilities of interest rates, and credit spreads.
• Equity price risk results from exposures to changes in prices and volatilities of individual equities and equity indices.
Trafigura hedges a large majority of price risks arising from its activities. When there is a difference in the characteristics of available hedging instruments and the corresponding commodity price exposures, Trafigura remains exposed to a residual price risk referred to as basis risk. Dynamically managing the basis risk that arises from Trafigura’s activities requires specialist skills and is a core focus of our trading and risk management teams.
Value at RiskValue at Risk (VaR) is a statistical estimate of the potential loss in value of our positions and unsold in-transit material due to adverse market movements. Trafigura calculates VaR over a one-day time horizon with a 95% confidence level. We use an integrated VaR model which captures risks including commodity prices, interest rates, equity prices and currency rates. Trafigura’s integrated VaR model facilitates comparison of VaR across portfolios comprised of a range of different risk exposures.
As of 30 September 2016, Trafigura’s one day market risk VaR was USD4.5 million (2015: USD6.0 million). Average market risk VaR (1 day 95%) during the fiscal year was USD6.3 million compared to USD9.3 million in the previous fiscal year. Trafigura’s Board has set a target of maintaining VaR (1 day 95%) below 1% of Group equity.
Trafigura is aware of the inherent limitations to VaR and therefore uses a variety of risk measures and risk management techniques to create a robust risk management process. Limitations of VaR include:
• VaR does not estimate potential losses over longer time horizons where the aggregate moves may be extreme.
• VaR does not take account of the liquidity of different risk positions and therefore does not estimate the losses that might arise if Trafigura liquidated large positions over a short period of time.
• VaR is based on statistical analysis of historical market data. If this historical data is not reflective of futures market prices movements, VaR may not provide accurate predictions of future possible losses.
Trafigura’s VaR calculation covers its trading businesses in the crude oil, refined oil products, petrochemical, natural gas, metals, concentrates, coal, iron ore, and freight markets and assesses the open-priced positions which are those subject to price risk, including inventories of these commodities. Trafigura’s VaR model is based on historical simulations, with full valuation of more than 5,000 market risk factors.
VaR is calculated based on simultaneously shocking these risk factors. More recent historical price data is more heavily weighted in these simulations, which enables the VaR model to adapt to more recent market conditions and improves the accuracy of our estimates of potential losses.
72 TRAFIGURA 2016 ANNUAL REPORT

Trafigura’s VaR model utilises advanced statistical techniques that incorporate the non-normal price dynamics that are an important feature of commodity markets. Our VaR model is continuously and automatically calibrated and back-tested to ensure that its out-of-sample performance adheres to well defined targets. In addition, our VaR model is regularly updated to ensure it reflects the current observed dynamics of the markets Trafigura is active in.
Trafigura has made a significant, ongoing investment in risk management systems, including a reporting system which automatically distributes customised risk reports throughout the Group on a daily basis. These reports provide up-to-date information on each team’s risk using industry standard measures such as 95% and 99% Value at Risk and performance indicators such as Sharpe ratios.
All trading books have well defined VaR risk limits and management and the trading teams are automatically notified whenever a book nears its risk limit, as well as whenever a VaR overage occurs. In addition, Trafigura’s Deals Desk Management Team is automatically notified whenever statistically anomalous changes occur in the profit and loss of any deal.
For senior management, the daily reports provide a comprehensive view of Trafigura’s risk, classified according to various risk factors. These reports emphasise the risk diversification created by the Group’s varied activities and highlight any excessive risk concentrations.
c. Credit riskCredit risk is the risk of financial loss to the Group if a customer or counterparty to a financial instrument or physical contract fails to meet its contractual obligations, and arises principally from the Group’s receivables from customers and investment securities.
The Company has a formalised credit process with credit officers in the key locations around the world. Strict credit limits are set up for each counterparty on the basis of detailed financial and business analysis. These limits are constantly monitored and revised in light of counterparty or market developments and the amount of exposure relative to the size of the Group’s balance sheet. The Company makes extensive use of the banking and insurance markets to cover any counterparty or country risks that are in excess of its credit limits.
The risk management monitoring and decision-making functions are centralised and make extensive use of the Company’s integrated bespoke IT system. The Company conducts transactions with the following major types of counterparties:
• Physical commodity counterparties spread across the vertical chains for both oil and bulk, e.g. producers, refiners/smelters and end-users. Sales to investment grade and non-investment grade counterparties are made on open terms up to internally approved credit limits. Exposures above such limits are subject to payment guarantees.
• Payment guarantee counterparties, i.e. prime financial institutions from which the Company obtains payment guarantees.
• Hedge counterparties comprising a number of prime financial institutions and physical participants in the relevant markets. There is no significant concentration of risk with any single counterparty or group of counterparties. Collateral is obtained from counterparties when the Company’s exposure to them exceeds approved credit limits. It is the Company’s policy to have ISDA Master Agreements or ISDA-based Long-Form Confirmation Agreements in place with all hedging counterparties.
The Company trades in all major geographic regions. Where appropriate, guarantees, insurance and letters of credit are used to reduce payment or performance risk. The Company has gross credit exposure in locations across the world with a concentration in emerging markets. Most of this exposure is laid off with third parties while the Company retains between 10% to 20% on average of the individual exposures.
The Company’s maximum exposure to credit risk, without considering netting agreements or without taking into account of any collateral held or other credit enhancements, is equal to the carrying amount of Trafigura’s financial assets as indicated in the balance sheet plus the guarantees to third parties and associates. The Company’s objective is to seek continued revenue growth while minimising losses incurred due to increased credit risk exposure.
The Group has amounts and guarantees outstanding related to countries that are impacted by sanctions currently imposed by the US and EU. The Group analysed the sanctions and exposures and concluded that these do not materially impact the Group’s positions.
(i) Concentration of credit riskConcentrations of credit risk exist when changes in economic, industry or geographical factors similarly affect the Company’s counterparties whose aggregate credit exposure is significant in relation to the Company’s total credit exposure. The carrying amount of financial assets represents the maximum credit exposure. The Company determines concentrations of credit risk by monitoring the country profile of its third-party trade receivables on an ongoing basis.
Trafigura has a diverse customer base, with no customer representing more than 5.3% (2015: 6.0%) of its revenues over the year ended 2016.
Refer to Note 18 for the aging of trade and other receivables at the reporting date that were not impaired.
(ii) Financial assets that are neither past due nor impairedTrade and other receivables that are neither past due nor impaired are creditworthy debtors with good payment record with the Company. Cash and cash equivalents and derivatives that are neither past due nor impaired are placed with or entered into with reputable financial institutions or companies with high credit ratings and no history of default. The credit quality of trade and other receivables is assessed based on a strict credit policy. The Group has monitored customer credit risk, by grouping trade and other receivables based on their characteristics.
Based on the Group’s monitoring of customer credit risk, the Group believes that, except as indicated above, no impairment allowance is necessary in respect of trade receivables not past due.
Financial assets that are either past due or impairedInformation regarding financial assets that are either past due or impaired is disclosed in Note 18 (Trade and other receivables).
(iii) GuaranteesThe Group’s policy is to provide financial guarantees only to wholly-owned subsidiaries. As part of the Group’s ordinary physical commodity trading activities, Trafigura Group PTE Ltd. may act as guarantor by way of issuing guarantees accepting responsibility for subsidiaries’ contractual obligations.
TRAFIGURA 2016 ANNUAL REPORT 73
FIN
AN
CIA
L ST
AT
EM
EN
TS

FINANCIAL STATEMENTS
F. NOTES TO CONSOLIDATED FINANCIAL STATEMENTS (CONTINUED)
d. Liquidity riskLiquidity risk is the risk that the Company is unable to meet its payment obligations when due, or that it is unable, on an on-going basis, to borrow funds in the market on an unsecured or secured basis at an acceptable price to fund actual or proposed commitments.
The Group’s approach to managing liquidity is to ensure, as far as possible, that it will always have sufficient cash and cash equivalents and ready sources of committed funding available to meet anticipated and unanticipated funding needs. Sound financial management with a focus on liquidity has been instrumental to the Group’s success. The Company has demonstrated the ability to raise the appropriate types of financing to match the needs of the business and to tap various investor bases (e.g. syndicated loan markets, trade finance markets, bond markets, USPP, securitisation etc.), maturities and geographies.
The Company manages its treasury and liquidity risks maintaining a strong liquidity position through the following:
• Targeting immediately-available cash on hand of minimum USD500 million under normal conditions (higher in the case of extreme volatility);
• Maintaining bilateral lines which allow the Group to mark-to-market financings to the value of the underlying physical assets. Mark to market financing is performed weekly (or intra-weekly in the case of extreme volatility) and provides an additional source of liquidity which is not available to competitors which are financed purely from revolving credit facilities;
• Committed unsecured credit facilities;
• Maintaining headroom under bilateral trade finance lines and committed revolving credit facilities ; and
• Limited distribution of profit (significant retained earnings) and subordination of repurchased equity.
The Group provided a financial guarantee for an amount of USD285 million as of 30 September 2016 (2015: USD300 million) that will expire in 2018.
The maturity analysis of the Groups financial liabilities based on the contractual terms is as follows:
Total 0-1 years 1-5 years > 5 years
USD’M USD’M USD’M USD’M
30 September 2016 Financial liabilities Current and non-current loans and borrowings 25,267.2 18,033.0 6,985.3 248.9 Trade and other payables 8,952.5 8,952.5 – – Expected future interest payments 835.7 214.5 420.6 200.6Derivative financial liabilities 658.9 421.2 230.7 7.0Total financial liabilities 35,714.3 27,621.2 7,636.6 456.5
Total 0-1 years 1-5 years > 5 years
USD’M USD’M USD’M USD’M
30 September 2015 Financial liabilities Current and non-current loans and borrowings 21,957.9 14,668.2 6,742.8 546.9Trade and other payables 9,486.3 9,486.3 – –Expected future interest payments 950.7 208.7 511.5 230.5Derivative financial liabilities 1,377.4 1,204.1 171.7 1.6Total financial liabilities 33,772.3 25,567.3 7,426.0 779.0
e. Interest rate riskTrafigura is not exposed to significant interest rate risk. Interest rate risk of the Group is mainly applicable on the long-term funding of the Group, although a majority of debt, whether long-term or short-term, is floating rate.
As at 30 September 2016, assuming the amount of floating rate liabilities (excluding working capital financing) were outstanding for the whole year, interest rates were 50 basis points higher/lower and all other variables held constant, the Group’s profit, other comprehensive income and group equity for the year ended 30 September 2016 would decrease/increase by USD24.2 million (2015: USD21.8 million).
From time to time the Group enters into interest rate derivatives transactions to lock-in current interest rate levels, for instance, interest rate swaps provide a method of reducing the Group’s exposure to floating interest rates arising from its corporate funding programmes. To realise the desired matching of derivative results with the hedged interest rate payments, cash flow hedge accounting is applied and the derivatives are designated as hedging instruments. The derivatives are carried on balance and their effectiveness is tested on a quarterly basis.
f. Currency riskTrafigura has few exposures to foreign currency risk on its trading activities and those that do exist are hedged out. The Group does not use financial instruments to hedge the translation risk related to equity and earnings of foreign subsidiaries and non-consolidated companies.
The Group uses cross-currency swaps to hedge currency risk on the principal and related payments of foreign currency denominated loans and bonds for which cash-flow hedge accounting is applied. The periods when the cash flows are expected to occur are similar to the periods when the cash flows on the foreign currency denominated loans and bonds occur as indicated in Note 23 and 27d.
Notionals Fair values
USD’M 2016 2015 2016 2015
Cross-currency swap 1,670.2 1,670.2 (115.7) (156.8)Cross-currency interest rate swap 506.2 279.6 (11.5) (70.3) Total 2,176.4 1,949.8 (127.2) (227.1)
74 TRAFIGURA 2016 ANNUAL REPORT

g. Fair value hedge accountingIn some instances, The Group elects to apply fair value hedge accounting to hedge certain risk components of non-financial hedged items. These non-financial hedged items are the tolling agreements which Trafigura has entered into for the processing of Eagle Ford crude oil into petroleum by-products. Ultimately, the derivative hedging instruments (splitter hedges) are aimed to hedge the spread between purchasing Eagle Ford crude oil and selling refined product. When applicable, The Group designates derivative hedging instruments as fair value hedges in relationship to the hedged item. The hedged item may be individual risk components which are separately identifiable and reliably measurable. The designated hedge derivatives are accounted for at fair value through profit and loss and reflected on the balance sheet as either a recognised asset or liability or an unrecognised firm commitment. Each of the identified risk components of the hedged item will be revalued at each period with its corresponding benchmark accounted for at fair value and recognised through profit and loss and reflected on the balance sheet as either a recognised asset or liability or an unrecognised firm commitment. Ineffectiveness will occur as a result of basis differences between the valuation of designated hedge instruments used and valuation of the designated risk component benchmarks considered to best represent the risk component.
2016 2015
Fair Value Hedge Accounting USD’M USD’M
LTD PnL hedging instruments as basis for hedge ineffectiveness 127.1 154.0Carrying value of hedged item (151.8) (168.3)
LTD Hedge Ineffectiveness (recognised in Profit and Loss) (24.7) (14.3)
YTD Hedge Ineffectiveness (recognised in Profit and Loss) (10.4) (14.3)
h. Capital managementThe Board’s policy is to maintain a strong capital base so as to maintain investor, creditor and market confidence and to sustain future development of the business.
The Company’s immediate parent, Trafigura Beheer B.V., is exclusively owned by its employees. This shareholding arrangement leads to an alignment of the long-term interests of the Company and its management team. By virtue of having its own capital at risk, senior management is incentivised to take a long-term view of the Company’s overall performance and to protect its capital.
The Company’s capital management aims to ensure that it meets financial covenants attached to the interest-bearing loans and borrowings that define capital structure requirements. Breaches in meeting the financial covenants would permit the bank to immediately call loans and borrowings. There have been no breaches in the financial covenants of any interest-bearing loans and borrowing in the current period.
The Company monitors capital using an adjusted debt to equity ratio, which is adjusted total debt divided by the Company’s equity. For this purpose, the adjusted debt metric represents the Company’s total long and short-term debt less cash, deposits, readily marketable inventories, debt related to the Company’s securitisation programme and the non-recourse portion of loans to third-parties.
The Company’s long-term average target adjusted debt to equity ratio is 1.0x. The Company’s adjusted net debt to equity ratio at the end of the reporting period was as follows:
2016 2015
USD’M USD’M
Non-current loans and borrowings 7,234.2 7,289.7Current loans and borrowings 18,033.0 14,668.2Total debt 25,267.2 21,957.9
AdjustmentsCash and cash equivalents 3,141.9 3,534.2Deposits 7.9 46.9Inventories 11,537.7 7,614.4Securitisation debt 1,516.0 1,258.3Non-recourse debt 434.8 658.0Adjusted total debt 8,628.9 8,846.1
Group equity 5,847.1 5,657.6
Adjusted debt to Group equity ratio at 30 September 1.48 1.56
As at 30 September 2016, the ratio of adjusted net debt to Group equity stood at 1.48x. The decrease of the ratio at year-end compared to 30 September 2015 is a combination of a decrease in adjusted total debt and an increase in Group Equity.
The nature of the ratio means it fluctuates between quarters, but Trafigura’s long-term commitment is to maintain a disciplined approach to leverage with the aim of ensuring it does not remain significantly above its target of 1.0x on a long-term basis. We expect this ratio to revert to our stated target in the medium-term.
TRAFIGURA 2016 ANNUAL REPORT 75
FIN
AN
CIA
L ST
AT
EM
EN
TS

FINANCIAL STATEMENTS
F. NOTES TO CONSOLIDATED FINANCIAL STATEMENTS (CONTINUED)
i. Fair value(i) Fair values versus carrying amountsThe fair values of inventories, financial assets and liabilities, together with the carrying amounts shown in the statement of financial position, are as follows:
Carrying value Fair value
2016 USD’M USD’M
Assets Listed equity securities – Fair value through OCI 97.6 97.6Listed debt securities – Fair value through profit or loss 327.0 311.9Unlisted equity investments – Fair value through profit and loss 59.4 74.5Unlisted equity investments – Fair value through OCI 56.3 56.3Loans receivable and advances 801.3 (*)Inventories 11,537.7 11,537.7Trade and other receivables 15,199.9 (*)Derivatives 573.6 573.6Deposits 7.9 (*)Cash and cash equivalents 3,141.9 (*)Total financial assets and inventories 31,802.6 12,651.6
LiabilitiesLoans and borrowingsFloating rate borrowings 23,241.0 (*)Fixed rate borrowings 1,987.4 2,039.2Finance lease and purchase contract 38.8 (*)Trade and other payables 8,952.6 (*)Derivatives 658.9 658.9Total financial liabilities 34,878.7 2,698.1
Carrying value Fair value
2015 USD’M USD’M
Assets Listed equity securities – Fair value through OCI 145.3 145.3 Listed debt securities – Fair value through profit or loss 528.3 528.3 Unlisted equity investments – Fair value through profit and loss 71.2 71.2 Unlisted equity investments – Fair value through OCI 64.4 64.4 Loans receivable and advances 440.1 (*) Inventories 7,614.4 7,614.4 Trade and other receivables 13,902.3 (*) Derivatives 3,383.2 3,383.2 Deposits 46.9 (*) Cash and cash equivalents 3,534.2 (*) Total financial assets and inventories 29,730.3 11,806.8
LiabilitiesLoans and borrowingsFloating rate borrowings 19,813.6 (*) Fixed rate borrowings 2,095.2 1,842.9 Finance lease and purchase contract 48.8 (*) Trade and other payables 9,486.3 (*) Derivatives 1,377.3 1,377.3 Total financial liabilities 32,821.2 3,220.2
(*)Management has determined that the carrying amounts of trade and other receivables, cash and cash equivalents, deposits and trade and other payables reasonably approximate their fair values because these are mostly short-term in nature and are re-priced regularly.
The fair value of the guarantee disclosed in Note 26 was calculated based on level 3 valuation inputs taking into account current illiquid market conditions; which include sanctions enacted by the US and EU.
Offsetting of financial assets and liabilitiesIn accordance with IAS 32 the Group reports financial assets and liabilities on a net basis in the consolidated statement of financial position only if there is a legally enforceable right to set off the recognised amounts and there is intention to settle on a net basis, or to realise the asset and settle the liability simultaneously. The financial assets and liabilities subject to offsetting, enforceable master netting and similar agreements as at 30 September 2016 and 2015 were as follows:
Amounts eligible for set off under netting agreements Amounts not subject
to netting agreements
Net amounts presented in
the statement of financial position
Gross amount
Amounts offset
Net amount
2016 USD’M USD’M USD’M USD’M USD’M
Related parties 914.2 (23.6) 890.6 – 890.6Derivative assets 916.6 (678.6) 238.0 335.6 573.6
Related parties (32.1) 23.6 (8.5) – (8.5)Derivative assets (943.6) 678.6 (265.0) (394.0) (659.0)
Amounts eligible for set off under netting agreements Amounts not subject
to netting agreements
Net amounts presented in
the statement of financial position
Gross amount
Amounts offset
Net amount
2015 USD’M USD’M USD’M USD’M USD’M
Related parties 1,080.8 (46.2) 1,034.6 – 1,034.6Broker balances 398.0 (102.4) 295.6 85.3 380.9Derivative assets 22,701.9 (19,491.4) 3,210.5 172.7 3,383.2
Related parties (50.1) 46.2 (3.9) – (3.9)Broker balances (563.7) 102.4 (461.3) (59.6) (520.9)Derivative liabilities (20,328.6) 19,491.4 (837.2) (540.2) (1,377.4)
76 TRAFIGURA 2016 ANNUAL REPORT

For the financial assets and liabilities subject to enforceable master netting or similar arrangements above, each agreement between the Group and the counterparty allows for net settlement of the relevant financial assets and liabilities when both elect to settle on a net basis. In the absence of such an election, financial assets and liabilities may be settled on a gross basis, however, each party to the master netting or similar agreement will have the option to settle all such amounts on a net basis in the event of default of the other party.
(ii) Fair value hierarchyThe table below analyses financial instruments carried at fair value, by valuation method. The different levels have been defined as follows:
• Level 1: quoted prices (unadjusted) in active markets for identical assets or liabilities.
• Level 2: inputs other than quoted prices included within Level 1 that are observable for the asset or liability, either directly (i.e. as prices) or indirectly (i.e. derived from prices).
• Level 3: inputs for the asset or liability that are not based on observable market data (unobservable inputs).
Level 1 classifications primarily include futures with a maturity of less than one year. Level 2 classifications primarily include swaps and physical forward transactions which derive their fair value primarily from exchange quotes and readily observable broker quotes. Level 3 classifications primarily include physical forward transactions which derive their fair value predominately from calculations that use broker quotes and applicable market based estimates surrounding location, quality and credit differentials. In circumstances where Trafigura cannot verify fair value with observable market inputs (Level 3 fair values), it is possible that a different valuation model could produce a materially different estimate of fair value. It is Trafigura’s policy to hedge significant market risk, therefore sensitivity to fair value movements is limited. Trafigura manages its market risk using the Value at Risk (VaR) as disclosed in Note 27b.
Other financial assets and inventories
Level 1 Level 2 Level 3 Total
USD’M USD’M USD’M USD’M
30 September 2016Listed equity securities – Fair value through OCI 97.6 97.6Listed debt securities – Fair value through profit or loss 15.1 311.9 327.0Unlisted equity investments – Fair value through profit and loss 59.4 59.4Unlisted equity investments – Fair value through OCI 56.3 56.3Futures 24.1 24.1OTC derivatives 213.1 213.1Physical forwards 6.5 175.6 182.1Cross-currency swaps 28.5 28.5Interest rate swaps 20.8 20.8Other financial derivatives 104.9 104.9Inventories 11,537.7 11,537.7Total 136.8 11,911.5 603.2 12,651.5
Level 1 Level 2 Level 3 Total
Financial liabilities USD’M USD’M USD’M USD’M
30 September 2016Futures 15.6 – – 15.6OTC derivatives – 148.9 – 148.9Physical forwards – 1.0 227.9 228.9Cross-currency swaps – 144.2 – 144.2Interest rate swaps – 30.9 – 30.9Other financial derivatives – 90.6 – 90.6Fixed rate borrowings – 2,039.2 – 2,039.2Total 15.6 2,454.8 227.9 2,698.3
Other financial assets and inventories
Level 1 Level 2 Level 3 Total
USD’M USD’M USD’M USD’M
30 September 2015Listed equity securities – Fair value through OCI 145.3 – – 145.3 Listed debt securities – Fair value through profit or loss – – 528.3 528.3 Unlisted equity investments – Fair value through profit and loss – – 71.2 71.2 Unlisted equity securities – Fair value through OCI – – 64.4 64.4 Futures 1,311.6 – – 1,311.6OTC derivatives – 1,365.7 – 1,365.7Physical forwards – 530.7 126.1 656.8Cross-currency swaps – – – –Interest rate swaps – – – –Other financial derivatives – 49.0 – 49.0Inventories – 7,614.4 – 7,614.4Total 1,456.9 9,559.8 790.0 11,806.7
Level 1 Level 2 Level 3 Total
Financial liabilities USD’M USD’M USD’M USD’M
30 September 2015Futures 27.1 – – 27.1 OTC derivatives – 242.6 – 242.6 Physical forwards – 552.5 283.8 836.3 Cross-currency swaps – 156.8 – 156.8 Interest rate swaps – 70.3 – 70.3 Other financial derivatives – 44.4 – 44.4 Fixed rate borrowings – 1,842.9 – 1,842.9 Total 27.1 2,909.5 283.8 3,220.4
The overview of the fair value hierarchy and applied valuation methods can be specified as follows:
2016 2015
Listed equity securities – Fair value through profit or loss USD’M USD’M
Level 1 Assets: 97.6 145.3Liabilities: –
Valuation techniques and key inputs:
Quoted prices in an active market.
Significant unobservable inputs:
None.
2016 2015
Listed debt securities – Fair value through profit or loss USD’M USD’M
Level 1 Assets: 15.1 –Liabilities: – –
Valuation techniques and key inputs:
Quoted prices in an active market.
Significant unobservable inputs:
None.
2016 2015
Futures USD’M USD’M
Level 1 Assets: 24.1 1,311.6Liabilities: 15.6 27.1
Valuation techniques and key inputs:
Quoted prices in an active market.
Significant unobservable inputs:
None.
TRAFIGURA 2016 ANNUAL REPORT 77
FIN
AN
CIA
L ST
AT
EM
EN
TS

FINANCIAL STATEMENTS
F. NOTES TO CONSOLIDATED FINANCIAL STATEMENTS (CONTINUED)
2016 2015
OTC derivatives USD’M USD’M
Level 2 Assets: 213.1 1,365.7Liabilities: 148.9 242.6
Valuation techniques and key inputs:
Reference prices.
Significant unobservable inputs:
Inputs include observable quoted prices sourced from traded reference prices or recent traded prices indices in an active market for identical assets or liabilities.
2016 2015
Physical forwards USD’M USD’M
Level 2 Assets: 6.5 530.7Liabilities: 1.0 552.5
Valuation techniques and key inputs:
Reference prices.
Significant unobservable inputs:
Inputs include observable quoted prices sourced from traded reference prices or recent traded prices indices in an active market for identical assets or liabilities.
2016 2015
Cross-currency swaps USD’M USD’M
Level 2 Assets: 32.5 –Liabilities: 160.3 156.8
Valuation techniques and key inputs:
Reference prices.
Significant unobservable inputs:
Inputs include observable quoted prices sourced from exchanges or recent traded prices indices in an active market for identical assets or liabilities.
2016 2015
Interest rate swaps USD’M USD’M
Level 2 Assets: 16.8 –Liabilities: 14.8 70.3
Valuation techniques and key inputs:
Discounted cash flow model.
Significant unobservable inputs:
Inputs include observable quoted prices sourced from exchanges or traded reference indices in an active market for identical assets or liabilities. Prices are adjusted by a discount rate which captures the time value of money and counterparty credit considerations.
2016 2015
Other financial derivatives USD’M USD’M
Level 2 Assets: 104.9 49.0Liabilities: 90.6 44.4
Valuation techniques and key inputs:
Discounted cash flow model.
Significant unobservable inputs:
Inputs include observable quoted prices sourced from exchanges or traded reference indices in an active market for identical assets or liabilities. Prices are adjusted by a discount rate which captures the time value of money and counterparty credit considerations.
2016 2015
Inventories USD’M USD’M
Level 2 Assets: 11,537.7 7,614.4 Liabilities: – –
Valuation techniques and key inputs:
Quoted prices in an active market.
Significant unobservable inputs:
Premium discount on quality and location.
2016 2015
Fixed rate borrowings USD’M USD’M
Level 2 Assets: – –Liabilities: 2,039.2 1,842.9
Valuation techniques and key inputs:
Discounted cash flow model.
Significant unobservable inputs:
Cash flows discounted at current borrowing rates for similar instruments.
2016 2015
Listed debt securities – Fair value through profit or loss USD’M USD’M
Level 3 Assets: 311.9 528.3Liabilities: – –
Valuation techniques and key inputs:
Discounted cash flow model.
2016 2015
Listed debt securities – Fair value through profit or loss USD’M USD’M
Significant unobservable inputs:
• Forecast throughput• Discount rates using weighted average cost of capital
Significant unobservable inputs:
• Market illiquidity• Operating cost and capital expendituresThe resultant asset is a discounted cash flow of the underlying throughput. Increase/decrease of the forecasted throughput will result in an increase/decrease of the value of the asset. There are no reasonable changes in assumptions which will result in material change to the fair value of the asset.
Unlisted equity investments – Fair value through profit and loss
2016 2015
USD’M USD’M
Level 3 Assets: 59.4 71.2 Liabilities: – –
Valuation techniques and key inputs:
Quoted prices obtained from the asset managers of the funds.
Significant unobservable inputs:
• Market illiquidity• Price of commodities
Unlisted equity investments – Fair value through OCI
2016 2015
USD’M USD’M
Level 3 Assets: 56.3 64.4Liabilities: – –
Valuation techniques and key inputs:
Quoted prices obtained from the asset managers of the funds.
Significant unobservable inputs:
• Market illiquidity• Price of commodities
2016 2015
Physical forwards USD’M USD’M
Level 3 Assets: 175.6 126.1 Liabilities: 227.9 283.8
Valuation techniques and key inputs:
Discounted cash flow model.
Significant unobservable inputs:
Prices are adjusted by differentials including:• Quality• LocationAn increase/decrease in one input resulting in an opposite movement in another input, resulting in no material change in the underlying value.
During 2015 the fair value hierarchy of our investment in the listed debt securities related to our investment in Porto Sudeste do Brasil has been transferred from a Level 1 valuation to a Level 3 valuation. The main reason for this change is that since its issuance there has been very limited trading activity of these securities. The trading volumes underpin the illiquidity of the market with daily trading volumes in percent of total shares of maximum 0.3 percent. The illiquidity of the market and limited availability of insight information to investors may lead to behavioural biases. Therefore management has decided to change the fair value hierarchy from level 1 to level 3. For the level 3 parameters of this valuation we refer to Note 17. The movements in the Level 3 hierarchy can be summarized as follows:
USD’M Physical
forwardsEquity/Debt
securities Total
1 October 2015 (157.7) 664.0 506.3Total gain/(loss) recognised in income statement 171.4 (135.1) 36.3Total gain/(loss) recognised in OCI – (12.1) (12.1)Invested – 5.5 5.5Disposals – (94.8) (94.8)Total realised (66.0) – (66.0)
30 September 2016 (52.3) 427.5 375.2
78 TRAFIGURA 2016 ANNUAL REPORT

USD’M Physical
forwardsEquity/Debt
securities Total
1 October 2014 (234.2) 79.3 (154.9)Total gain/(loss) recognised in income statement (46.6) 34.8 (11.8)Total gain/(loss) recognised in OCI – 8.4 8.4Invested – 123.4 123.4Disposals – (10.0) (10.0)Total realised 123.1 – 123.1Transfer from Level 1 – 428.1 428.1
30 September 2015 (157.7) 664.0 506.3
There have been no transfers between fair value hierarchy Levels in 2016. Materially all level 3 physical forwards are settled in the next year.
28. EMPLOYEE BENEFITS
a. Equity participation planThe immediate parent of the Company, Trafigura Beheer B.V., has an equity participation plan (EPP) which is open to employees of the Group. Shares issued to employees, are preference shares of the immediate holding company Trafigura Beheer B.V which give rights to economic benefits with limited voting rights. The value of the shares is based on the net asset value of an ordinary share as set out in Articles of Association of Trafigura Beheer B.V which management believe is a fair approximation of the fair value. Beheer Malta Limited, a parent company of Trafigura Beheer B.V., together with the Board of Directors of the Company decide on the share awards to be issued to employees. Shares awarded under the EPP may vest immediately or over a period of several years. If employment is ceased prior to the end of the vesting period the shares will be forfeited except otherwise determined by Beheer Malta Limited.
Employees do not have the right to sell shares that have vested unless a purchase offer has been made by Trafigura Control Holdings SARL (a 100% subsidiary of Beheer Malta Ltd and direct controlling shareholder of Trafigura Beheer B.V.) Upon termination of employment, employees must transfer all of their shares at the direction of Trafigura Control Holdings SARL.
Neither Trafigura Beheer B.V and nor the Company have neither a legal nor constructive obligation to settle the shares held by employees in cash.
The Group accounts for the EPP as an equity-settled plan; the fair value of the shares granted, determined at the grant date, is recorded in the statement of income rateably over the vesting period of the shares.
During 2016, 5,613 immediately vesting shares were granted to employees representing a value of USD24.0 million (2015: 5,139 shares representing a value of USD13.8 million) and 28,251 shares were granted with a vesting period of 1-5 years representing a value of USD120.8 million (2015: 12,430 shares representing a value of USD33.5 million).
Compensation in respect of share based payments recognised in staff costs amounted to USD77.7 million in 2016 (2015: USD51.1 million).
Unrecognised staff costs in respect of rateably vesting shares expected to be recognised from 2017 to 2020 amount to USD107.0 million at 30 September 2016 (2015: USD44.9 million).
b. Personnel expenses
2016 2015
USD’M USD’M
Salaries and bonuses 395.4 408.1Social security costs 25.0 26.9Pension costs 15.4 18.2Share-based payments 77.7 51.1
Total 513.5 504.3
The average number of employees split geographically is depicted below:
Oil and Petroleum
Metals and Minerals
All other segments Total
2016 FTE FTE FTE FTE
North, Central and South America 201 1,929 148 2,278Europe and Africa 248 470 245 963Asia, Middle East and Australia 205 301 360 866
Total 654 2,700 753 4,107
Oil and Petroleum
Metals and Minerals
All other segments Total
2015 FTE FTE FTE FTE
North, Central and South America 197 2,043 192 2,432Europe and Africa 205 1,313 330 1,848Asia, Middle East and Australia 192 369 407 968
Total 594 3,725 929 5,248
29. RELATED PARTIESIn the normal course of business, the Company enters into various arm’s length transactions with related parties including fixed price commitments to sell and to purchase commodities, forward sale and purchase contracts, agency agreements and management service agreements. Outstanding balances at period end are unsecured and settlement occurs in cash. There have been no guarantees provided or received for any related party receivables or payables.
All transactions between the Company and its subsidiaries are eliminated on consolidation along with any unrealised profits and losses between its subsidiaries, associates and joint ventures.
a. Transactions with key management personnel(i) Key management personnel compensationThe Management team consists of the Board of Directors and members of the Trading Committee and Investment Committee. In addition to their salaries, the Group also provides non-cash benefits to members of the Management team. Members of the Management team also participate in the Group’s share participation programme (see Note 28). Compensation of the Management team comprised of the following:
2016 2015
USD’M USD’M
Short-term employee benefits 18.1 3.8Post-employment benefits 0.5 0.3Share-based payments 22.0 5.4
Total 40.6 9.5
TRAFIGURA 2016 ANNUAL REPORT 79
FIN
AN
CIA
L ST
AT
EM
EN
TS

FINANCIAL STATEMENTS
F. NOTES TO CONSOLIDATED FINANCIAL STATEMENTS (CONTINUED)
(ii) Key management personnel and director transactionsAs at 30 September 2016, loans receivable from the members of the Management team total USD11.6 million (2015: USD3.1 million). Interest is charged on the loans at approximately LIBOR + 1% and the loans are repayable within the 1-3 year bracket.
b. Other related-party transactions
2016 2015
Related-party receivables/(payables) USD’M USD’M
Trafigura Beheer B.V. 352.6 202.8Puma Energy Holding 374.1 747.7PT Servo Meda Sejahtera 122.5 147.0Farringford N.V. 17.2 (60.4)Beheer Malta Ltd (7.2) 1.2Ecore B.V. 16.4 28.9Emincar 150.0 –Buckeye Partners LLC – 0.1JINCHUAN Group Co. Ltd. 31.4 –Minas de Aguas Teñidas, S.A.U (MATSA) 262.2 498.7Other 100.9 1.1
Total 1,420.2 1,567.1
2016 2015
USD’M USD’M
Sales (mainly Puma Energy) 6,697.4 5,798.3Purchases 1,456.1 594.8Terminalling & dockage fees 148.1 60.0Interest income 35.7 32.0Interest expense 13.6 17.5
Transactions between related parties are made on terms equivalent to those that prevail in arm’s length transactions.
Below table summarises the nature of relationship and nature of transactions entered with the related party:
Party Nature of relationship Nature of transaction
Farringford N.V. Ultimate parent Loans and cost rechargesTrafigura Beheer B.V. Parent company Loans and cost rechargesBeheer Malta Ltd. Parent company Buy back of treasury sharesEcore B.V. Cousin group Cost recharges,
trading and hedgingBuckeye Partners LLC Equity-accounted investee Lease agreementsEMINCAR Equity-accounted investee Financing and
trading agreementJINCHUAN Group Co. Ltd. Equity-accounted investee Trading agreementMinas de Aguas Teñidas, S.A.U (MATSA)
Equity-accounted investee Financing and trading agreement
PT Servo Meda Sejahtera Equity-accounted investee LoanPuma Energy Holding Equity-accounted investee Financing and
trading agreementPorto Sudeste do Brasil S.A. Equity-accounted investee Loans and cost recharges
A list of consolidated subsidiaries and associates is included in Note 32.
30. NEW STANDARDS AND INTERPRETATIONS NOT YET ADOPTEDThe Group has not applied the following new and revised IFRSs, which have been issued but are not yet effective, in these financial statements.
• IFRS 14 Regulatory Deferral Accounts, effective 1 January 2016. Will not be endorsed for use in the EU
• IFRS 15 Revenue from Contracts with Customers including amendments to IFRS 15, effective 1 January 2018
• IFRS 16 Leases, effective 1 January 2019
• Amendments to IAS 1 Presentation of Financial Statements – Disclosure Initiative, effective 1 January 2016
• Amendments to IFRS 10 Consolidated Financial Statements and IAS 28 Investments in Associates and Joint Ventures – Sale or Contribution of Assets between an Investor and its Associate or Joint Venture, effective 1 January 2016
• Amendments to IFRS 10 Consolidated Financial Statements and IFRS 12 Disclosure of Interests in other entities and IAS 28 Investments in Associates and Joint Ventures – Applying the Consolidation Exception, effective 1 January 2016
• Amendments to IFRS 11 Joint Arrangements – Accounting for Acquisitions of Interests in Joint Operations, effective 1 January 2016
• Amendments to IAS 16 Property, Plant and Equipment and IAS 38 Intangible Assets – Clarification of Acceptable Methods of Depreciation and Amortisation, effective 1 January 2016
• Amendments to IAS 16 Property, Plant and Equipment and IAS 41 Agriculture – Bearer Plants, effective 1 January 2016
• Amendments to IAS 27 Separate Financial Statements – Equity Method in Separate Financial Statements, effective 1 January 2016
• Annual Improvements to IFRSs 2012-2014 Cycle (Issued September 2014), effective 1 January 2016
• Amendments to IAS 12 Income Taxes – Recognition of Deferred Tax Assets for Unrealised Losses, effective 1 January 2017.
• Amendments to IAS 7 Statement of Cash Flows – Disclosure Initiative, effective 1 January 2017
• Clarifications to IFRS 15 Revenue from Contracts with Customers, effective 1 January 2018.
• Amendments to IFRS2 Share-based Payment – Classification and Measurement of Share-based Payment Transactions, effective 1 January 2018.
In 2015 the Group early adopted IFRS 9 – Financial Instruments.
The Group is in the process of making an assessment of the impact of these new and revised IFRSs upon initial application. There have been no material new IFRS standards or amendments on IFRS standards which have been applied for the first time in 2016.
31. SUBSEQUENT EVENTSOn 15 October 2016 a consortium was formed between the Company (49%), United Capital Partners (UCP) (49%) and Essar (2%). Through a holding structure, the consortium has agreed to purchase a 49% stake in Mumbai-based Essar Oil Limited from Essar Energy Holdings Limited.
Essar Oil Limited (EOL) owns India’s second largest private refinery and world-class storage and import/export facilities located near Vadinar city, as well as a domestic retail network business consisting of over 2,700 retail stations.
The transaction is supported by an efficient capital structure involving non-recourse bank finance. The agreement, which is targeted to close by the end of 2016, is subject to anti-trust and other regulatory clearances. Trafigura has a commitment for a capital contribution under the transaction of a maximum USD320 million.
Essar Oil Limited has plans to expand its oil refining capacity and to build a petrochemical complex. The deregulation of pricing of the Indian retail market is expected to bring potential growth opportunities for the company’s retail network.
80 TRAFIGURA 2016 ANNUAL REPORT

32. CONSOLIDATED SUBSIDIARIES AND ASSOCIATESFor entities where legal shareholding is less than 50%, the Group has consolidated based on the definition of control under IFRS. Certain entities with a percentage of effective economic interest below 50% are held through intermediate holding companies controlled by the Group.
Principal consolidated operating subsidiaries
% Owned
Location 2016 2015
Angola Exploration Mining Resources S.A.
Angola 0.0% 30.0%
AngoRecycling Industry, Lda. Angola 25.0% 25.0%Boyaca Navigation Inc. Panama 100.0% 100.0%Catalina Huanca Sociedad Minera S.A.C.
Peru 100.0% 100.0%
DT Trading Ltd. Bahamas 50.5% 50.5%DTS Commercial Pte. Ltd. Singapore 50.0% 50.0%DTS Refining Pte. Ltd. Singapore 50.0% 50.0%Edenfield Procurement DMCC United Arab
Emirates100.0% 100.0%
Empresa de Recolha de Residuos de Angola, Lda. (Errangol)
Angola 25.0% 25.0%
Fangchenggang Guo Tong Import and Export Co. Ltd.
China 100.0% 100.0%
Galena Asset Management B.V. Netherlands 100.0% 100.0%Galena Asset Management Limited United Kingdom 100.0% 100.0%Galena Investments 2 Limited Malta 100.0% 100.0%Galena Investments 2 S.à r.l. Luxembourg 100.0% 100.0%Galena Investments Limited Malta 100.0% 100.0%Galena Investments S.à r.l. Luxembourg 100.0% 100.0%Genghis Holding Company Limited Malta 100.0% 100.0%Iberian Minerals Corp. Switzerland 100.0% 100.0%Impala Holdings Limited Malta 100.0% 100.0%Impala Logistics (Shanghai) Company Limited
China 100.0% 100.0%
Impala Terminals Barrancabermeja S.A.
Colombia 100.0% 100.0%
Impala Terminals Burnside LLC United States 100.0% 100.0%Impala Terminals Colombia SAS Colombia 100.0% 100.0%Impala Terminals DRC SARL Congo, The
Democratic Republic of the
100.0% 100.0%
Impala Terminals Mexico, S.A. de C.V. Mexico 100.0% 100.0%Impala Terminals Middle East FZE United Arab
Emirates100.0% 100.0%
Impala Terminals Peru S.A.C Peru 100.0% 100.0%Impala Terminals UK Limited United Kingdom 100.0% 100.0%IWL (Luxembourg) S.à r.l. Luxembourg 100.0% 100.0%IWL Capital LLC Marshall Islands 100.0% 100.0%IWL Holding B.V. Netherlands 100.0% 100.0%IWL Holdings (Luxembourg) S.à r.l. Luxembourg 100.0% 100.0%IWL Investments (Luxembourg) S.à r.l Luxembourg 100.0% 100.0%IWL River Inc. Panama 100.0% 100.0%Luna Mining SARL Congo, The
Democratic Republic of the
100.0% 100.0%
Manatee Holding Company Limited Malta 100.0% 100.0%Meteor Ltd. Isle of Man 100.0% 100.0%Ningbo Minghui Recycling Resources Co., Ltd.
China 95.0% 95.0%
Petromining S.A. Argentina 100.0% 100.0%Puma Energy Holdings Malta Limited Malta 100.0% 100.0%Shanghai Trafigura Energy and Resource Trading Co., Ltd.
China 100.0% 100.0%
TAG ECO Recycling (UK) Limited United Kingdom 100.0% 100.0%Trafigura B.V. Netherlands 100.0% 100.0%
Principal consolidated operating subsidiaries
% Owned
Location 2016 2015
Trafigura Canada General Partnership Canada 100.0% 100.0%Trafigura Chile Limitada Chile 100.0% 100.0%Trafigura Corpus Christi Holdings LLC United States 100.0% 100.0%Trafigura Derivatives Limited United Kingdom 100.0% 100.0%Trafigura DMCC United Arab
Emirates100.0% 100.0%
Trafigura Eurasia LLC Russian Federation 100.0% 100.0%Trafigura Funding S.A. Luxembourg 100.0% 100.0%Trafigura Holdings Limited Malta 100.0% 100.0%Trafigura India Private Limited India 100.0% 100.0%Trafigura Investment (China) Co., Ltd. China 100.0% 100.0%Trafigura Limited United Kingdom 100.0% 100.0%Trafigura Maritime Ventures Limited Malta 100.0% 100.0%Trafigura Marketing Inc. United States 100.0% 100.0%Trafigura Marketing Ltd. Canada 100.0% 100.0%Trafigura Mexico, S.A. de C.V. Mexico 100.0% 100.0%Trafigura Nat Gas Limited Malta 100.0% 100.0%Trafigura Overseas Projects Pte. Ltd. Singapore 100.0% 100.0%Trafigura Peru S.A.C. Peru 100.0% 100.0%Trafigura Pte. Ltd. Singapore 100.0% 100.0%Trafigura Services Pte. Ltd. Singapore 100.0% 100.0%Trafigura Services South Africa (Pty) Ltd.
South Africa 100.0% 100.0%
Trafigura Trade Investments B.V. Netherlands 100.0% 100.0%Trafigura Trading LLC United States 100.0% 100.0%Trafigura Trading Yangshan Co., Ltd. China 100.0% 100.0%Trafigura Ventures Trading Ltd. Mauritius 100.0% 100.0%Urion Holdings (Malta) Limited Malta 100.0% 100.0%Impala Middle East General Warehousing L.L.C.
United Arab Emirates
100.0% 100.0%
Leeuwin Holding Co. Ltd. Bahamas 100.0% 100.0%Trafigura Holding GmbH Switzerland 100.0% 100.0%Trafigura Trade Holdings B.V. Netherlands 100.0% 100.0%DSA Ventures I LLC Marshall Islands 100.0% 100.0%Trafigura Holdings Pte. Ltd. Singapore 100.0% –Urion Mining International B.V. Netherlands 100.0% 100.0%
Equity-accounted investees carried at net equity value
% owned
Location 2016 2015
Buckeye Texas Partners LLC United States 20.0% 20.0%Empresa Minera del Caribe S.A. Caribbean 49.0% 36.6% Guangxi Jinchuan Nonferrous Metals Co., Ltd
China 30.0% –
Napoil Limited Bermuda 49.0% 49.0%Osmunda Limited Isle of Man – 33.0%Porto Sudeste do Brasil S.A. Brazil 47.4% 47.3%PT Servo Meda Sejahtera Indonesia 46.5% 40.0%Puma Energy Holdings Pte. Ltd. Singapore 49.6% 48.6%Transportadora Callao S.A. Peru 30.0% 30.0%ATALAYA MINING PLC (previously known as EMED MINING PUBLIC LIMITED)
Cyprus 22.0% 22.0%
Nyrstar N.V. Belgium 24.6% 23.7%TM Mining Ventures, S.L. Spain 50.0% 50.0%
33. BOARD OF DIRECTORS
THE BOARD OF DIRECTORS
Christopher Cox Sipko SchatMark Irwin Andrew VickermanJosé Larocca Mike WainwrightPierre Lorinet Jeremy Weir
Singapore, 2 December 2016.
TRAFIGURA 2016 ANNUAL REPORT 81
FIN
AN
CIA
L ST
AT
EM
EN
TS

NOTES
82 TRAFIGURA 2016 ANNUAL REPORT

TRAFIGURA 2016 ANNUAL REPORT 83
FIN
AN
CIA
L ST
AT
EM
EN
TS

Printed by Pureprint on Vision Superior which is FSC certified.
Pureprint is certified to ISO 14001 environmental management system, is registered to EMAS the Eco Management Audit Scheme, is a Carbon Neutral Company and has been awarded the Queens Award for Enterprise: Sustainable Development.
Designed and produced by SALTERBAXTER MSLGROUP. Photography by Charlescannon, Edwin Koo, MATSA, Golar, William Martin, Nitro, Grupo TMS
Trafigura Group Pte. Ltd. and the companies in which it directly or indirectly owns investments in are separate and distinct entities. In this publication, the collective expressions ‘Trafigura’, ‘Trafigura Group’, ‘the Company’ and ‘the Group’ may be used for convenience where reference is made in general to those companies. Likewise, the words ‘we’, ‘us’, ‘our’ and ‘ourselves’ are used in some places to refer to the companies of the Trafigura Group in general. These expressions are also used where no useful purpose is served by identifying any particular company or companies.


Trafigura Group Pte. Ltd.
10 Collyer Quay #29-00 Ocean Financial Centre Singapore 049315 Email: [email protected]
www.trafigura.com TG/0207.1e
TR
AFIG
UR
A G
RO
UP PT
E. LTD
. AN
NU
AL R
EPORT 2016
![Trafigura Probo Koala [Corporate Release on the Abidjan (Ivory Coast) Toxic Wastes - Trafigura]](https://static.fdocuments.in/doc/165x107/55720c6f497959fc0b8c4200/trafigura-probo-koala-corporate-release-on-the-abidjan-ivory-coast-toxic-wastes-trafigura.jpg)