2016-2017 Investment Plan Update for the Alternative … · ii ABSTRACT The 2016-2017 Investment...
89
California Energy Commission COMMISSION REPORT 2016-2017 Investment Plan Update for the Alternative and Renewable Fuel and Vehicle Technology Program California Energy Commission Edmund G. Brown Jr., Governor May 2016 | CEC-600-2015-014-CMF
Transcript of 2016-2017 Investment Plan Update for the Alternative … · ii ABSTRACT The 2016-2017 Investment...

California Energy Commission
COMMISSION REPORT
2016-2017 Investment Plan Update for the Alternative and Renewable Fuel and Vehicle Technology Program
California Energy Commission Edmund G. Brown Jr., Governor
May 2016 | CEC-600-2015-014-CMF


California Energy Commission
Robert B. Weisenmiller, Ph.D.
Chair
Commissioners
Karen Douglas, J.D.
J. Andrew McAllister, Ph.D.
David Hochschild
Janea A. Scott
Jacob Orenberg
Primary Author
Jacob Orenberg
Project Manager
Jim McKinney
Program Manager
John P. Butler II
Office Manager
ZERO EMISSION VEHICLE INFRASTRUCTURE OFFICE
John Y. Kato
Deputy Director
FUELS AND TRANSPORTATION DIVISION
Robert P. Oglesby
Executive Director
i
ACKNOWLEDGEMENTS
The following California Energy Commission staff members contributed to the
development of this investment plan update:
Jennifer Allen
Jean Baronas
Leslie Baroody
Elán Bond
Eva Borges
John Butler
Phil Cazel
Elyse Cheung-Sutton
Donald Coe
Al Estrada
Andre Freeman
Tami Haas
Andrew Hom
Elizabeth John
Akasha Kaur Khalsa
Bill Kinney
Samuel Lerman
Thanh Lopez
Jim McKinney
Darren Nguyen
Hieu Nguyen
David Nichols
Tim Olson
Matthew Ong
Larry Rillera
Gordon Schremp
Lindsee Tanimoto
Eric VanWinkle
Gary Yowell
ii
ABSTRACT
The 2016-2017 Investment Plan Update for the Alternative and Renewable Fuel and
Vehicle Technology Program guides the allocation of program funding for fiscal year
2016-2017. This 2016-2017 Investment Plan Update covers the eighth year of the
program and reflects laws, executive orders, and policies to reduce greenhouse gas
emissions, petroleum dependence, and criteria emissions. It details how the California
Energy Commission determines the goal-driven priorities of the program by
incorporating input from stakeholders and the program Advisory Committee and
analyzing project opportunities for funding. These priorities are consistent with the
overall goal of the program “to develop and deploy innovative technologies that
transform California’s fuel and vehicle types to help attain the state’s climate change
policies.”
This 2016-2017 Investment Plan Update establishes recommended funding allocations
based on the identified needs and opportunities of a variety of alternative fuels and
vehicle technologies. As an update, the 2016-2017 Investment Plan Update relies on the
narrative and analyses developed in previous investment plans, most recently the 2015-
2016 Investment Plan Update.
This commission report represents the final step in the development of the 2016-2017
Investment Plan Update.
Keywords: California Energy Commission, Alternative and Renewable Fuel and Vehicle
Technology Program, AB 118, AB 8, funding program, alternative transportation fuels,
investment plan, electric vehicles, hydrogen, biofuels, biomethane, biodiesel, renewable
diesel, diesel substitutes, gasoline substitutes, renewable gasoline, ethanol, natural gas,
federal cost-sharing, workforce training, sustainability, fueling stations, fuel production,
alternative fuel infrastructure
Please use the following citation for this report:
Orenberg, Jacob. 2016. 2016-2017 Investment Plan Update for the Alternative and
Renewable Fuel and Vehicle Technology Program. California Energy Commission,
Fuels and Transportation Division. Publication Number: CEC-600-2015-014-CMF.

iii

iv
TABLE OF CONTENTS Page
Acknowledgements ............................................................................................................................ i
Abstract ................................................................................................................................................ ii
Table of Contents ............................................................................................................................. iv
List of Figures ..................................................................................................................................... v
List of Tables ....................................................................................................................................... v
Executive Summary .......................................................................................................................... 1
CHAPTER 1: Introduction .................................................................................................................. 7
CHAPTER 2: Context of the 2016-2017 Investment Plan Update........................................... 11
Implementation of the Alternative and Renewable Fuel and Vehicle Technology
Program .......................................................................................................................................... 11Alternative Financing Mechanisms and Leveraged Funding ............................................................ 13Program Outreach and Inclusion ........................................................................................................... 15Program Metrics ........................................................................................................................................ 17
Summary of Program Funding .................................................................................................. 17
ARFVTP Benefits and Evaluation .............................................................................................. 22Benefit-Cost Assessments ....................................................................................................................... 22National Renewable Energy Laboratory Program Benefits Guidance Report ............................... 22
Related Policies and Programs .................................................................................................. 26Air Quality Improvement Program/Low Carbon Transportation Program ................................... 26AB 32/Greenhouse Gas Reduction Fund .............................................................................................. 27Low-Carbon Fuel Standard ...................................................................................................................... 28Renewable Fuel Standard ........................................................................................................................ 30Executive Order on Sustainable Freight ............................................................................................... 31Executive Order on Zero-Emission Vehicles ........................................................................................ 31Charge Ahead California Initiative ........................................................................................................ 32CPUC Alternative-Fueled Vehicle Proceedings .................................................................................... 32
CHAPTER 3: Alternative Fuel Production and Supply .............................................................. 33
Biofuel Production and Supply .................................................................................................. 33
Summary of Alternative Fuel Production and Supply Allocations .................................... 39
CHAPTER 4: Alternative Fuel Infrastructure .............................................................................. 40
Electric Charging Infrastructure ............................................................................................... 40
Hydrogen Refueling Infrastructure .......................................................................................... 45
Natural Gas Fueling Infrastructure ........................................................................................... 51
Summary of Alternative Fuel Infrastructure Allocations .................................................... 53

v
CHAPTER 5: Alternative Fuel and Advanced Technology Vehicles ....................................... 54
Medium- and Heavy-Duty Vehicle Technology Demonstration and Scale-Up ................. 54
Natural Gas Vehicles .................................................................................................................... 58
Light-Duty Electric Vehicles ....................................................................................................... 63
Summary of Alternative Fuel and Advanced Technology Vehicles Allocations ............. 67
CHAPTER 6: Related Needs and Opportunities ......................................................................... 68
Manufacturing ............................................................................................................................... 68
Emerging Opportunities ............................................................................................................. 69
Workforce Training and Development .................................................................................... 71
Regional Readiness ...................................................................................................................... 73
Summary of Related Needs and Opportunities Allocations ............................................... 76
CHAPTER 7: Summary of Funding Allocations .......................................................................... 77
LIST OF FIGURES Page
Figure 1: Schematic of ARFVTP Implementation ...................................................................... 13
Figure 2: Summary of GHG Emissions Reductions From the Expected Benefits of 223
Projects Through 2025 ................................................................................................................... 24
Figure 3: GHG Reductions From Expected and Market Transformation Benefits in
Comparison to Required Market Growth Benefits .................................................................... 26
Figure 4: Low-Carbon Fuel Standard Credit Spot Market Prices ............................................ 29
Figure 5: California and National Sales of PEVs ........................................................................ 64
LIST OF TABLES Page
Table ES-1: Previous ARFVTP Awards as of December 31, 2015 .............................................. 2
Table ES-2: Most Recent and Current Investment Plan Allocations (in millions) .................. 5
Table 1: Greenhouse Gas, Fuel, and Air Quality Goals and Milestones ................................... 8
Table 2: ARFVTP Awards by Fuel Type as of December 31, 2015 ......................................... 19
Table 3: Previous ARFVTP Awards as of December 31, 2015 ................................................ 20
Table 4: Most Recent and Current Investment Plan Allocations (in millions) .................... 21
vi
Table 5: Benefit Categories in NREL Program Benefits Guidance .......................................... 23
Table 6: Summary of GHG Emission and Petroleum Fuel Reduction Benefits Based on
262 Projects ....................................................................................................................................... 25
Table 7: FY 2015-2016 AQIP and Low Carbon Transportation GGRF Allocations ............. 28
Table 8: Projected Fuel Volumes and Proposed RFS Percentages for 2014 – 2017 ........... 30
Table 9: Summary of Biofuel Production Awards to Date ...................................................... 35
Table 10: GHG Emission Reduction Potential of Commercial-Scale ARFVTP Projects ...... 36
Table 11: Sample of Precommercial ARFVTP Projects ............................................................. 37
Table 12: FY 2016-2017 Funding for Alternative Fuel Production and Supply .................. 39
Table 13: Charging Stations Funded by ARFVTP as of December 31, 2015 ........................ 40
Table 14: Additional Charging Units Needed for 2017 and 2018 ......................................... 42
Table 15: Proposed and Approved Utility EVCS Investments ................................................ 44
Table 16: Publicly Available Hydrogen Refueling Stations ..................................................... 46
Table 17: Related Projects for Hydrogen Refueling ................................................................. 47
Table 18: Future Hydrogen Refueling Station Priority Areas and Purpose ......................... 49
Table 19: FY 2016-2017 Funding for Alternative Fuel Infrastructure .................................. 53
Table 20: Demonstration Projects Supported by ARFVTP ...................................................... 55
Table 21: ARFVTP Funding for Natural Gas Vehicle Deployment ......................................... 62
Table 22: ARFVTP Funding for CVRP ........................................................................................... 66
Table 23: FY 2016-2017 Funding for Alternative Fuel and Advanced Technology Vehicles
............................................................................................................................................................. 67
Table 24: Summary of Manufacturing Projects ......................................................................... 68
Table 25: Summary of ARFVTP Agreements From Emerging Opportunities Category .... 70
Table 26: Historical Workforce Training Funding From FY 2008-2009 Through FY 2015-
2016 .................................................................................................................................................... 72
Table 27: Regional Alternative Fuel Readiness Planning and Implementation Awards ... 75
Table 28: FY 2016-2017 Funding for Related Needs and Opportunities ............................. 76
Table 29: Summary of Funding Allocations for FY 2016-2017 .............................................. 77

vii

1
EXECUTIVE SUMMARY
California has adopted several aggressive goals for reducing greenhouse gas (GHG) emissions,
including:
A near-term goal of reducing GHG emissions to 1990 levels by 2020.
An interim goal of reducing GHG emissions to 40 percent below 1990 levels by 2030.
A long-term goal of reducing GHG emissions to 80 percent below 1990 levels by 2050.
Achieving these goals will require significant technological and market changes within the
transportation sector, which accounts for 37 percent of state greenhouse gas emissions. Both
California and the federal government have also established numerous goals and mandates to
reduce criteria air pollution and increase the prevalence of alternative fuels and vehicles.
To help address these goals, the California Legislature passed Assembly Bill 118 (Núñez, Chapter
750, Statutes of 2007). This legislation created the Alternative and Renewable Fuel and Vehicle
Technology Program (ARFVTP), administered by the California Energy Commission. With funds
collected from vehicle and vessel registration, vehicle identification plates, and smog-abatement
fees, the ARFVTP provides up to $100 million per year for projects that will "transform
California’s fuel and vehicle types to help attain the state’s climate change policies." The statute
also calls for the Energy Commission to “develop and deploy technology and alternative and
renewable fuels in the marketplace, without adopting any one preferred fuel or technology.”
Assembly Bill 8 (Perea, Chapter 401, Statutes of 2013) subsequently extended the collection of
fees that support the ARFVTP through January 1, 2024.
As part of the ARFVTP, the Energy Commission prepares and adopts an annual investment plan
update that identifies the funding priorities for the coming fiscal year. The funding allocations
reflect the potential for each alternative fuel and vehicle technology to contribute to the goals of
the program; the anticipated barriers and opportunities associated with each fuel or technology;
the effect of other entities’ investments, policies, programs, and statutes; and a portfolio-based
approach that avoids adopting any preferred fuel or technology. This commission report of the
2016-2017 Investment Plan Update is the final version of the document.
Context of the 2016-2017 Investment Plan Update The 2016-2017 Investment Plan Update builds on the analyses and recommendations contained
in previously adopted investment plans and investment plan updates. Since the first investment
plan, the Energy Commission has invested $606 million in projects that will support alternative
and renewable fuels and advanced vehicle technologies. These existing projects provide direct
feedback on how the ARFVTP can maximize value in reducing near-term greenhouse gas
emissions while supporting the transformation of the California transportation sector toward
fuels and technologies that can meet the more drastic emission reductions required by 2050.
Projects funded by the ARFVTP are summarized in Table ES-1 and support a broad portfolio of
fuel types, supply chain phases, and commercialization phases.

2
Table ES-1: Previous ARFVTP Awards as of December 31, 2015
Category Funded Activity Cumulative
Awards to Date(in millions)*
# of Projects or Units
Alternative Fuel Production
Biomethane Production $50.9 16 Projects
Gasoline Substitutes Production $27.2 14 Projects
Diesel Substitutes Production $57.4 20 Projects
Alternative Fuel Infrastructure
Electric Vehicle Charging Infrastructure $40.7 7,490 Charging Stations
Hydrogen Refueling Infrastructure $96.0 49 Fueling Stations
E85 Fueling Infrastructure $13.7 158 Fueling Stations
Upstream Biodiesel Infrastructure $4.0 4 Infrastructure Sites
Natural Gas Fueling Infrastructure $21.0 65 Fueling Stations
Alternative Fuel and Advanced
Technology Vehicles
Natural Gas Vehicle Deployment** $56.6 2,809 Vehicles
Propane Vehicle Deployment** $6.0 514 Trucks
Light-Duty Electric Vehicle Deployment $25.1 10,700 Cars
Medium- and Heavy-Duty Electric Vehicle Deployment $4.0 150 Trucks
Medium- and Heavy-Duty Vehicle Technology Demonstration and Scale-Up
$93.7 44 Demonstrations
Related Needs and Opportunities
Manufacturing $57.0 22 Manufacturing Projects
Emerging Opportunities † †
Workforce Training and Development $27.7 83 Recipients
Fuel Standards and Equipment Certification $3.9 1 Project
Sustainability Studies $2.1 2 Projects
Regional Alternative Fuel Readiness and Planning $7.6 34 Regional Plans
Centers for Alternative Fuels $5.8 5 Centers
Technical Assistance and Program Evaluation $5.6 n/a
Total $606.0
Source: California Energy Commission. *Includes all projects and agreements that have been executed or approved at an Energy Commission business meeting or are expected for business meeting approval following a notice of proposed award. Does not include cancelled projects that received no funding from ARFVTP. **Funding includes both completed and pending vehicle incentives. †Previous awards from this category have been reclassified by project type into other rows.
3
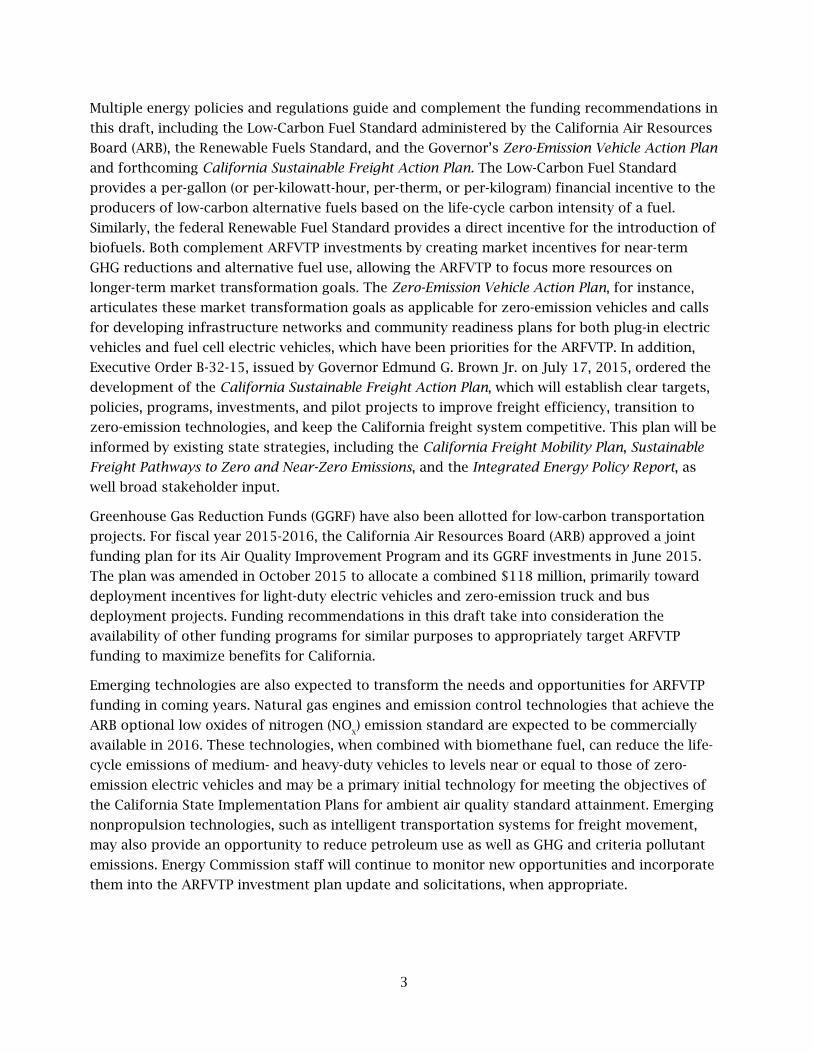
Multiple energy policies and regulations guide and complement the funding recommendations in
this draft, including the Low-Carbon Fuel Standard administered by the California Air Resources
Board (ARB), the Renewable Fuels Standard, and the Governor’s Zero-Emission Vehicle Action Plan
and forthcoming California Sustainable Freight Action Plan. The Low-Carbon Fuel Standard
provides a per-gallon (or per-kilowatt-hour, per-therm, or per-kilogram) financial incentive to the
producers of low-carbon alternative fuels based on the life-cycle carbon intensity of a fuel.
Similarly, the federal Renewable Fuel Standard provides a direct incentive for the introduction of
biofuels. Both complement ARFVTP investments by creating market incentives for near-term
GHG reductions and alternative fuel use, allowing the ARFVTP to focus more resources on
longer-term market transformation goals. The Zero-Emission Vehicle Action Plan, for instance,
articulates these market transformation goals as applicable for zero-emission vehicles and calls
for developing infrastructure networks and community readiness plans for both plug-in electric
vehicles and fuel cell electric vehicles, which have been priorities for the ARFVTP. In addition,
Executive Order B-32-15, issued by Governor Edmund G. Brown Jr. on July 17, 2015, ordered the
development of the California Sustainable Freight Action Plan, which will establish clear targets,
policies, programs, investments, and pilot projects to improve freight efficiency, transition to
zero-emission technologies, and keep the California freight system competitive. This plan will be
informed by existing state strategies, including the California Freight Mobility Plan, Sustainable
Freight Pathways to Zero and Near-Zero Emissions, and the Integrated Energy Policy Report, as
well broad stakeholder input.
Greenhouse Gas Reduction Funds (GGRF) have also been allotted for low-carbon transportation
projects. For fiscal year 2015-2016, the California Air Resources Board (ARB) approved a joint
funding plan for its Air Quality Improvement Program and its GGRF investments in June 2015.
The plan was amended in October 2015 to allocate a combined $118 million, primarily toward
deployment incentives for light-duty electric vehicles and zero-emission truck and bus
deployment projects. Funding recommendations in this draft take into consideration the
availability of other funding programs for similar purposes to appropriately target ARFVTP
funding to maximize benefits for California.
Emerging technologies are also expected to transform the needs and opportunities for ARFVTP
funding in coming years. Natural gas engines and emission control technologies that achieve the
ARB optional low oxides of nitrogen (NOX) emission standard are expected to be commercially
available in 2016. These technologies, when combined with biomethane fuel, can reduce the life-
cycle emissions of medium- and heavy-duty vehicles to levels near or equal to those of zero-
emission electric vehicles and may be a primary initial technology for meeting the objectives of
the California State Implementation Plans for ambient air quality standard attainment. Emerging
nonpropulsion technologies, such as intelligent transportation systems for freight movement,
may also provide an opportunity to reduce petroleum use as well as GHG and criteria pollutant
emissions. Energy Commission staff will continue to monitor new opportunities and incorporate
them into the ARFVTP investment plan update and solicitations, when appropriate.

4
2016-2017 Investment Plan Update
Assembly Bill 1314 (Wieckowski, Chapter 487, Statutes of 2011) reduced the scope of the annual
ARFVTP investment plan to an update. The update builds on the work of previous investment
plans while highlighting differences from those previous years. The resulting funding allocations
are intended to reflect the unique technological and market conditions for each of these fuels
and technologies. These funding allocations are discussed in detail in Chapters 3 through 6 of
this commission report, which describe the barriers and opportunities associated with
alternative fuel production, alternative fuel distribution infrastructure, alternative fuel and
advanced technology vehicles, and related activities that can accelerate progress in these areas.
Table ES-2 outlines the funding allocations of the two most recent investment plan updates, in
comparison to the funding allocations for FY 2016-2017.

5
Table ES-2: Most Recent and Current Investment Plan Allocations (in millions)
Category Funded Activity 2014-2015 2015-2016 2016-2017
Alternative Fuel Production
Biofuel Production and Supply $20 $20 $20
Alternative Fuel Infrastructure
Electric Charging Infrastructure $15 $17 $17
Hydrogen Refueling Infrastructure $20 $20 $20
Natural Gas Fueling Infrastructure $1.5 $5 $2.5
Alternative Fuel and Advanced
Technology Vehicles
Natural Gas Vehicle Incentives $10 $10 $10
Light-Duty Electric Vehicle Deployment $5 - -
Medium- and Heavy-Duty Vehicle Technology Demonstration and Scale-Up
$15 $20* $23*
Related Needs and Opportunities
Manufacturing $5
Emerging Opportunities $6 $3 $3
Workforce Training and Development Agreements $2.5 $3 $2.5
Regional Alternative Fuel Readiness and Planning - $2 $2
Total $100 $100 $100
Source: California Energy Commission. *See the text of these respective sections in Chapters 5 and 6 for details on the proposal to combine these funding allocations.

6

7
CHAPTER 1: Introduction
“We must demonstrate that reducing carbon is compatible with an abundant economy
and human well‐being.”
– Governor Edmund G. Brown Jr.1
California has been at the forefront of national efforts to reduce greenhouse gas (GHG)
emissions for nearly a decade since the Global Warming Solutions Act of 2006 was signed into law.2 With the passage of that law, California established a goal of reducing statewide GHG
emissions to 1990 levels by 2020. In addition, Executive Order S-3-05 set a longer-term goal to
reduce GHG emissions to 80 percent below 1990 levels by 2050. Governor Brown subsequently
issued Executive Order B-30-15, which set an interim goal to reduce statewide GHG emissions to
40 percent below 1990 levels by 2030 to ensure California meets the targets of Executive Order
S-3-05.
The California Greenhouse Gas Emission Inventory, prepared annually by the California Air
Resources Board (ARB), indicates that the transportation sector is responsible for 37 percent of in-state GHG emissions, making it the largest emitter in the state.3 Though low-carbon
alternative fuel use has steadily increased in recent years, petroleum-based gasoline and diesel
fuel account for more than 90 percent of California ground transportation fuel use. California
will need to continue to reduce petroleum fuel use to meet state GHG emission targets.
Accordingly, Governor Brown set an objective during his 2015 inaugural address of reducing
petroleum use in cars and trucks by up to 50 percent by 2030. An ARB analysis suggests these
reductions are possible by expanding existing efforts, which include increasing vehicle
efficiency, reducing fuel carbon intensity, and providing support for zero-emission vehicles and renewable fuel production.4
Other aspects of the transportation sector similarly challenge future health and economic
prosperity in California. In the American Lung Association 2015 State of the Air report,
California metropolitan areas represented the top five “Most Polluted Cities,” with the worst
1 Office of Governor Edmund G. Brown Jr. Governor Brown Sworn In, Delivers Inaugural Address. January 5, 2015. Available at https://www.gov.ca.gov/news.php?id=18828.
2 Assembly Bill 32, Núñez, Chapter 488, Statutes of 2006.
3 California Air Resources Board. California Greenhouse Gas Emission Inventory. June 30, 2015. Available at http://www.arb.ca.gov/cc/inventory/data/data.htm.
4 California Air Resources Board. Cutting Petroleum Use in Half by 2030. Available at http://www.arb.ca.gov/newsrel/petroleum_reductions.pdf.
8
pollution from both ozone and particle pollution (including Fresno-Madera, Visalia-Porterville-Hanford, Bakersfield, Los Angeles-Long Beach, Modesto-Merced and Sacramento-Roseville).5 In
the future, to meet federal Clean Air Act standards in two of the most heavily polluted air basins
in California, the transportation sector may need to reduce oxides of nitrogen (NOX) by almost 90
percent below 2010 levels by 2032.6 These air quality impacts may be exacerbated by drier,
hotter weather caused by climate change.
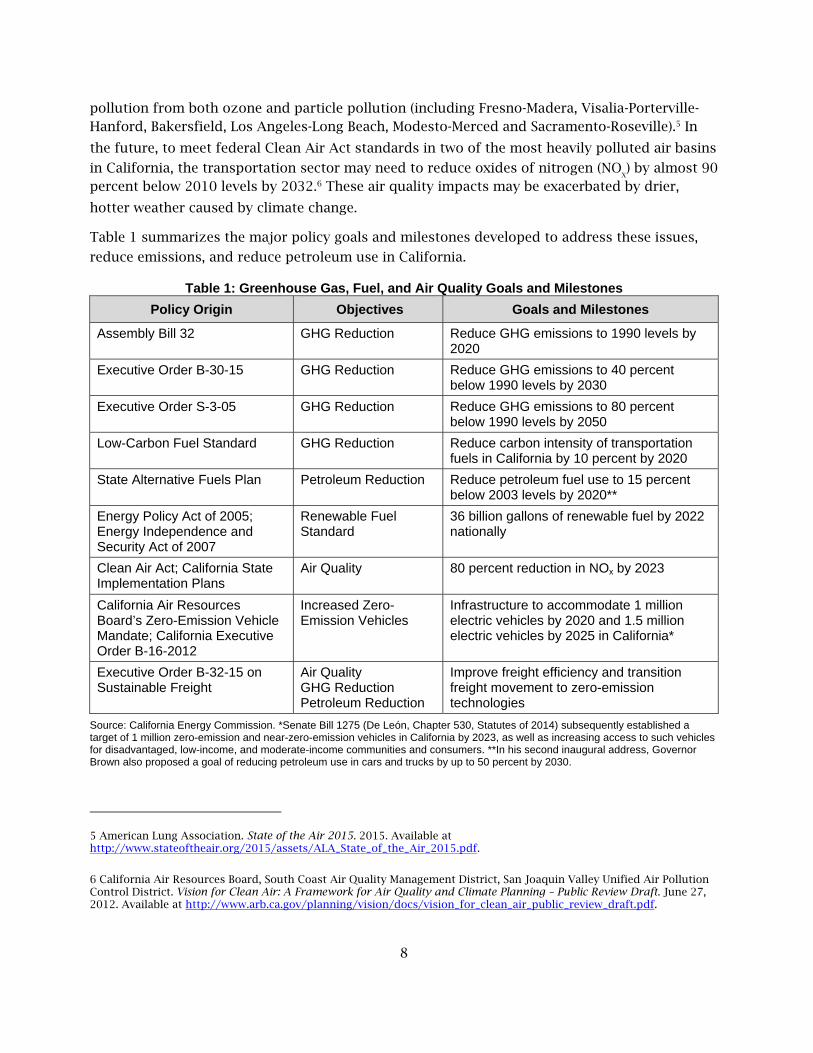
Table 1 summarizes the major policy goals and milestones developed to address these issues,
reduce emissions, and reduce petroleum use in California.
Table 1: Greenhouse Gas, Fuel, and Air Quality Goals and Milestones
Policy Origin Objectives Goals and Milestones
Assembly Bill 32 GHG Reduction Reduce GHG emissions to 1990 levels by 2020
Executive Order B-30-15 GHG Reduction Reduce GHG emissions to 40 percent below 1990 levels by 2030
Executive Order S-3-05 GHG Reduction Reduce GHG emissions to 80 percent below 1990 levels by 2050
Low-Carbon Fuel Standard GHG Reduction Reduce carbon intensity of transportation fuels in California by 10 percent by 2020
State Alternative Fuels Plan Petroleum Reduction Reduce petroleum fuel use to 15 percent below 2003 levels by 2020**
Energy Policy Act of 2005; Energy Independence and Security Act of 2007
Renewable Fuel Standard
36 billion gallons of renewable fuel by 2022 nationally
Clean Air Act; California State Implementation Plans
Air Quality 80 percent reduction in NOx by 2023
California Air Resources Board’s Zero-Emission Vehicle Mandate; California Executive Order B-16-2012
Increased Zero-Emission Vehicles
Infrastructure to accommodate 1 million electric vehicles by 2020 and 1.5 million electric vehicles by 2025 in California*
Executive Order B-32-15 on Sustainable Freight
Air Quality GHG Reduction Petroleum Reduction
Improve freight efficiency and transition freight movement to zero-emission technologies
Source: California Energy Commission. *Senate Bill 1275 (De León, Chapter 530, Statutes of 2014) subsequently established a target of 1 million zero-emission and near-zero-emission vehicles in California by 2023, as well as increasing access to such vehicles for disadvantaged, low-income, and moderate-income communities and consumers. **In his second inaugural address, Governor Brown also proposed a goal of reducing petroleum use in cars and trucks by up to 50 percent by 2030.
5 American Lung Association. State of the Air 2015. 2015. Available at http://www.stateoftheair.org/2015/assets/ALA_State_of_the_Air_2015.pdf.
6 California Air Resources Board, South Coast Air Quality Management District, San Joaquin Valley Unified Air Pollution Control District. Vision for Clean Air: A Framework for Air Quality and Climate Planning – Public Review Draft. June 27, 2012. Available at http://www.arb.ca.gov/planning/vision/docs/vision_for_clean_air_public_review_draft.pdf.
9
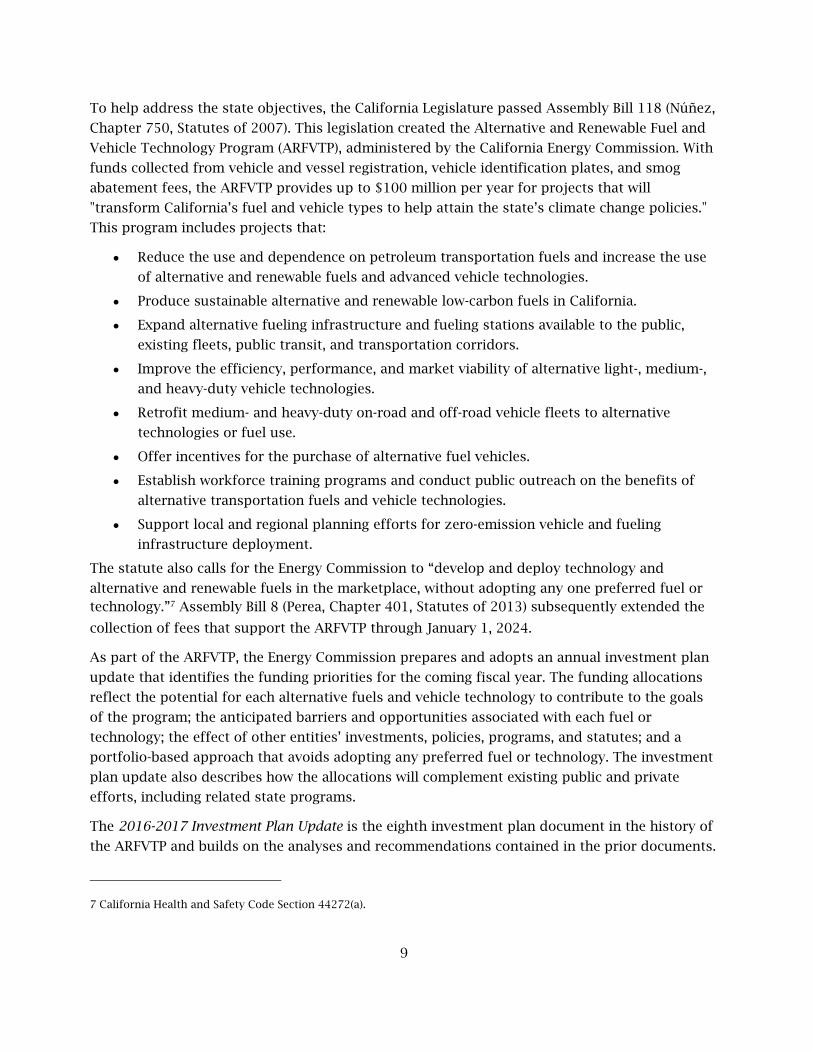
To help address the state objectives, the California Legislature passed Assembly Bill 118 (Núñez,
Chapter 750, Statutes of 2007). This legislation created the Alternative and Renewable Fuel and
Vehicle Technology Program (ARFVTP), administered by the California Energy Commission. With
funds collected from vehicle and vessel registration, vehicle identification plates, and smog
abatement fees, the ARFVTP provides up to $100 million per year for projects that will
"transform California’s fuel and vehicle types to help attain the state’s climate change policies."
This program includes projects that:
Reduce the use and dependence on petroleum transportation fuels and increase the use
of alternative and renewable fuels and advanced vehicle technologies.
Produce sustainable alternative and renewable low-carbon fuels in California.
Expand alternative fueling infrastructure and fueling stations available to the public,
existing fleets, public transit, and transportation corridors.
Improve the efficiency, performance, and market viability of alternative light-, medium-,
and heavy-duty vehicle technologies.
Retrofit medium- and heavy-duty on-road and off-road vehicle fleets to alternative
technologies or fuel use.
Offer incentives for the purchase of alternative fuel vehicles.
Establish workforce training programs and conduct public outreach on the benefits of
alternative transportation fuels and vehicle technologies.
Support local and regional planning efforts for zero-emission vehicle and fueling
infrastructure deployment.
The statute also calls for the Energy Commission to “develop and deploy technology and
alternative and renewable fuels in the marketplace, without adopting any one preferred fuel or technology.”7 Assembly Bill 8 (Perea, Chapter 401, Statutes of 2013) subsequently extended the
collection of fees that support the ARFVTP through January 1, 2024.
As part of the ARFVTP, the Energy Commission prepares and adopts an annual investment plan
update that identifies the funding priorities for the coming fiscal year. The funding allocations
reflect the potential for each alternative fuels and vehicle technology to contribute to the goals
of the program; the anticipated barriers and opportunities associated with each fuel or
technology; the effect of other entities’ investments, policies, programs, and statutes; and a
portfolio-based approach that avoids adopting any preferred fuel or technology. The investment
plan update also describes how the allocations will complement existing public and private
efforts, including related state programs.
The 2016-2017 Investment Plan Update is the eighth investment plan document in the history of
the ARFVTP and builds on the analyses and recommendations contained in the prior documents.
7 California Health and Safety Code Section 44272(a).
10
This commission report is the final version of the 2016-2017 Investment Plan Update. The
Energy Commission held public workshops with the ARFVTP Advisory Committee on November
6, 2015, in Sacramento and January 21, 2016, in Long Beach. Representatives from fuel and
technology industry groups, nongovernmental entities, other state agencies, and the public
discussed and commented on this document during these workshops. Comments on the 2016-2017 Investment Plan Update were also provided using the Energy Commission’s docket system.8
State law requires the Energy Commission to submit a draft of the investment plan update to the
Legislature concurrent with the Governor’s budget in January and an adopted investment plan
update concurrent with the Governor’s revised budget in May.
Chapter 2 of this document provides an update on Energy Commission implementation of the
ARFVTP to date, as well as a review of the most relevant programs, policies, and regulations that
affect the allocations of this investment plan update. The subsequent chapters are organized
according to the traditional supply chain of alternative fuels. Chapter 3 addresses the barriers
and opportunities associated with alternative fuel production and supply within California.
Chapter 4 focuses on the distribution of that alternative fuel and associated refueling
infrastructure, and Chapter 5 focuses on the vehicles that will use the alternative fuels and
advanced technologies. Chapter 6 identifies related activities and investments that can expedite
the development and deployment of alternative fuels and advanced technology vehicles. Finally,
Chapter 7 summarizes the funding allocations.
All allocations assume a complete $100 million appropriation for the ARFVTP, and the Energy
Commission expects to be fully funded for fiscal year 2016-2017. In the event that less than
$100 million is available, the allocations in this document may be revised in subsequent versions
or amended after final adoption. Future developments, including the potential availability of
funding from the Greenhouse Gas Reduction Fund for these or related categories, may also
prompt a need for modifications to these allocations.
8 The Energy Commission encourages written comments on the 2016-2017 Investment Plan Update. Please include your name or the name of your organization in the name of the attached file. Send your comments as either a Microsoft Word® document or a Portable Document Format file (PDF) to [email protected]. In the subject line, please include the docket number 15-ALT-01.

11
CHAPTER 2: Context of the 2016-2017 Investment Plan Update
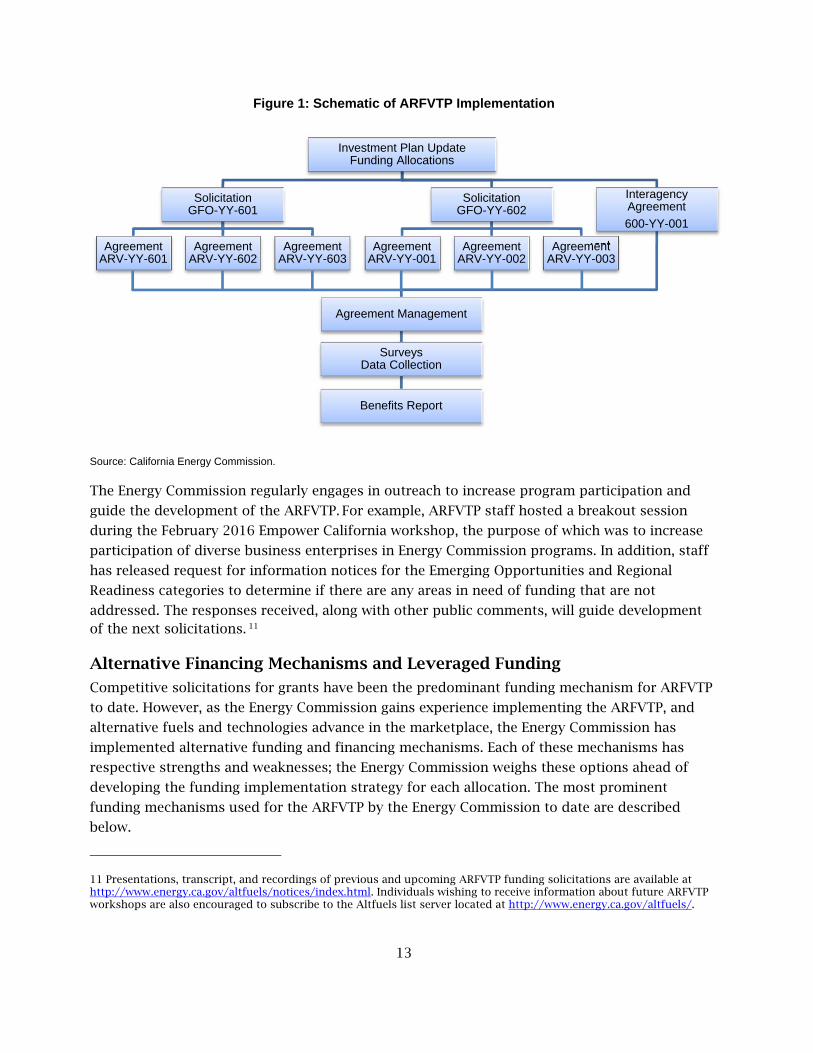
Implementation of the Alternative and Renewable Fuel and Vehicle Technology Program Since the beginning of the ARFVTP, the Energy Commission has developed a consistent approach
toward program implementation, which is summarized in Figure 1. An annual investment plan
update determines the coming fiscal-year funding allocation for categories of projects and is adopted at an Energy Commission business meeting.9 Energy Commission staff initially
proposes funding allocations based on the GHG emission reduction potential of alternative fuels
and technologies (both near-term and long-term), identification of the primary market and/or
technological opportunities and barriers, evaluation of complementary funding or regulations,
consideration of policy priorities, and a statutory directive to maintain a "portfolio-based
approach." Prior to official adoption by the Energy Commission, the investment plan update is
proposed and revised across several drafts and incorporates stakeholder input from public
Advisory Committee workshops.
Each investment plan update identifies funding allocations for particular segments of the supply
chain for alternative fuel or vehicle technologies. They typically do not, however, determine the
specific focus of future funding solicitations. Based on these funding allocations, the Energy
Commission subsequently issues a series of competitive solicitations, known as grant funding
opportunities (GFOs, designated as “GFO-[Year]-XXX”; formerly program opportunity notices, or
PONs). Each solicitation has a set of scoring criteria that reflect project selection preferences established by statute.10 Cost-related scoring criteria are generally given more weight for
commercially mature technologies. Priority is also given to projects that will benefit
economically disadvantaged areas or areas with poor air quality. Some solicitations are first-
come, first-served and establish minimum requirements that must be achieved to be eligible for
funding.
Energy Commission staff reviews, scores, and ranks the proposals for each solicitation using the
evaluation criteria developed for that particular solicitation. Outside agencies and contractors
may also provide technical assessments of the proposals. Based on the total scores of each
application, the Energy Commission releases a notice of proposed awards (NOPA) for each
9 The most recently adopted investment plan update, covering fiscal year 2015-2016, was adopted at the April 8, 2015, Energy Commission Business Meeting. It is available at http://energy.ca.gov/2014-ALT-01/documents/.
10 These preference criteria are listed in Health and Safety Code Section 44272 (c) and (d).
12
solicitation. The NOPA ranks each application by score and provides a proposed funding amount
for each proposal in order of score until available funding within the solicitation has been
recommended for award. For specialized agreements with certain partner agencies, including,
but not limited, to the California Employment Training Panel, the University of California
campuses, and the Division of Measurement Standards, the Energy Commission has the
discretion to develop interagency agreements without using the solicitation process.
AB 8 added a “benefit-cost score” element to the selection of projects for ARFVTP funding. This
addition factors into the scoring and selection of projects during the proposal review period of a
solicitation. The benefit-cost score is defined as “…a project’s expected or potential greenhouse
gas emissions reduction per dollar awarded by the commission to the project.” AB 8 requires the
Energy Commission to rank applications for funding based on existing solicitation scoring
criteria, with “additional preference to funding those projects with higher benefit-cost scores.”
In recent solicitations, this preference has been incorporated both as part of the general scoring
criteria and as a potential tie-breaker in the event of proposals receiving equal scores.
Each funded application becomes an agreement (usually designated as “ARV-[Year]-XXX”) once it
has been executed by the Energy Commission and the applicant. Energy Commission staff
oversees the completion of these agreements according to the respective schedules, budgets,
scopes of work, and terms and conditions of these agreements.
Data collection and project review are also key parts of ARFVTP implementation. The Energy
Commission periodically surveys funding recipients on the anticipated results of their projects,
with a broad array of questions relating to alternative fuel use, petroleum displacement, GHG
emission reductions, and in-state economic benefits. The Energy Commission also continues to
collect data from funding recipients after completion of a project, typically for six months.
Information from all these efforts feeds into the development of a biennial ARFVTP benefits
report, as well as other ARFVTP measurement, verification, and evaluation efforts.
13
Figure 1: Schematic of ARFVTP Implementation
Source: California Energy Commission.
The Energy Commission regularly engages in outreach to increase program participation and
guide the development of the ARFVTP. For example, ARFVTP staff hosted a breakout session
during the February 2016 Empower California workshop, the purpose of which was to increase
participation of diverse business enterprises in Energy Commission programs. In addition, staff
has released request for information notices for the Emerging Opportunities and Regional
Readiness categories to determine if there are any areas in need of funding that are not
addressed. The responses received, along with other public comments, will guide development of the next solicitations. 11
Alternative Financing Mechanisms and Leveraged Funding
Competitive solicitations for grants have been the predominant funding mechanism for ARFVTP
to date. However, as the Energy Commission gains experience implementing the ARFVTP, and
alternative fuels and technologies advance in the marketplace, the Energy Commission has
implemented alternative funding and financing mechanisms. Each of these mechanisms has
respective strengths and weaknesses; the Energy Commission weighs these options ahead of
developing the funding implementation strategy for each allocation. The most prominent
funding mechanisms used for the ARFVTP by the Energy Commission to date are described
below.
11 Presentations, transcript, and recordings of previous and upcoming ARFVTP funding solicitations are available at http://www.energy.ca.gov/altfuels/notices/index.html. Individuals wishing to receive information about future ARFVTP workshops are also encouraged to subscribe to the Altfuels list server located at http://www.energy.ca.gov/altfuels/.
Investment Plan UpdateFunding Allocations
SolicitationGFO-YY-601
AgreementARV-YY-601
AgreementARV-YY-602
AgreementARV-YY-603
SolicitationGFO-YY-602
AgreementARV-YY-001
AgreementARV-YY-002
AgreementARV-YY-003
InteragencyAgreement
600-YY-001
Agreement Management
SurveysData Collection
Benefits Report

14
Competitive Solicitation for Grants – This type of solicitation represents the most
common funding mechanism for the ARFVTP to date. It is flexible, as project
requirements and scoring criteria can be adapted for a broad variety of commercial and
technological maturity levels. Competitive scoring allows for increased scrutiny on key
issues for each project type. Because of the amount of time and attention required to
review each application (and oversee each subsequent award), this approach is more
manageable when funding larger projects (typically at least several hundreds of
thousands of dollars). The specific time window for applying under these solicitations, as
well as the uncertainty of receiving an award, may also provide greater uncertainty for
project investors and applicants.
Competitive Solicitation for Federal Cost-Sharing – This is similar to above, but with a
specific emphasis on applications that can demonstrate federal cost-sharing
opportunities. This solicitation can provide an additional economic benefit to the
ARFVTP portfolio by encouraging federal investment within the state; however, it is also
more difficult to coordinate and plan, as federal solicitations come and go throughout
the year.
First-Come, First-Served – This type of funding mechanism has been used primarily for
vehicle incentives by both the Energy Commission ARFVTP and the ARB Air Quality
Improvement Program. Once eligibility requirements are established, the funding can be
administered relatively quickly and can provide greater market certainty for a project
type. Without a method for evaluating the funding need for each project, however, these
incentives may fund activities that would have already occurred without public
investment. The first applicants in line for funding are likely to be those who are already
the most interested in the activity.
Production or Operation Incentives – To date, the Energy Commission has used these
types of incentives for both in-state ethanol production and hydrogen refueling station
operation and maintenance. The primary aim of these incentives is to provide greater
market certainty, which allows for further outside investment. This funding typically
requires commercial operation and would be poorly suited for projects focused more on
technological research, development, or demonstration. It is also important that the
ARFVTP seek options that limit such support to finite amounts of time or funding and
avoid providing a perpetual subsidy without encouraging market expansion.
Loan Loss Reserve/Loan Guarantees – Being tested by the ARFVTP, these financing
types may increase the opportunity to leverage private financing and transition
alternative fuel and vehicle investments from public to private sources. These funding
mechanisms become more appropriate as technologies and markets mature and are
being considered for the biofuel production and electric vehicle charging categories.
In general, the most important factor in considering the appropriate funding mechanism for an
activity has been the technological and market maturity of the fuel or technology. Public
subsidies, most commonly in the form of grants, are vital to advance early stage technologies
since private financiers are often unwilling to accept the high risks associated with these

15
projects. As a technology or market matures, however, alternative financing mechanisms
become a more effective method of support and can better leverage public funds with private
financing. The Energy Commission will continue to explore alternative financing strategies for
the ARFVTP, such as loans, loan loss reserves, loan guarantees, and property assessment
financing, as appropriate.
The Energy Commission is funding a $2 million pilot financing program with the California
Pollution Control Authority to administer a loan loss reserve for electric vehicle charging station
loans. A loan loss reserve provides funds to cover losses on defaulted or nonpaying loans,
thereby reducing risk to lenders. This financing program will use ARFVTP funds to motivate
lenders to finance the acquisition and installation of electric vehicle charging stations by eligible
small businesses in California. The initial $2 million investment is expected to leverage up to
$10 million in private sector loans. This leveraged fund ratio is significantly higher than what is
typical for a grant program.
Program Outreach and Inclusion
The Energy Commission is committed to ensuring that a diverse range of applicants have the
opportunity to participate in ARFVTP projects, including small businesses, women, minorities,
and disabled veterans, and is similarly committed to increasing their ARFVTP participation rates.
During legislative testimony and at other public forums, Commissioner Janea Scott has
reiterated her commitment of targeted outreach to these communities to ensure a broad and
diverse range of applicants in the ARFVTP. The Energy Commission also seeks to increase the
participation of disadvantaged and underrepresented communities from a diverse range of
geographical regions while implementing the ARFVTP. This includes:
Initiating and implementing an outreach plan to ensure that a diverse range of potential
applicants know about, and understand how to participate in, ARFVTP activities,
especially solicitations for projects.
Targeting particular geographic regions within the state for certain program activities
(for example, job training or workforce planning in economically depressed
communities).
Including initiatives addressing transportation energy-related challenges and
opportunities in economically depressed communities.
Reaching out to women, minority, and disabled veteran groups, sharing information from
the ARFVTP Web page and encouraging their presence and participation in ARFVTP
workshops. These groups included:
o All 35 local air districts.
o Legislative staff, to share with their constituents.
o The African American, Hispanic, and Asian chambers of commerce in California.
o The Association of Women in Water, Energy, and Environment.
o California Association of Black Lawyers.

16
o California Minority Counsel Program staff.
o Hispanic Bar Association of Orange County.
o National Association of Black Accountants.
o National Society of Black Engineers.
o Southern California Chapter of American Association of Blacks in Energy.
Hosting five public outreach workshops around the state (Sacramento, Fresno, Oakland,
Los Angeles, and San Bernardino) in October 2014, explaining the ARFVTP application
process and highlighting Energy Commission commitment to diversity in the ARFVTP.
Distributing ARFVTP information at key expositions and conferences throughout the
state.
Developing and posting online “Grant Funding Opportunities 101,” a presentation on how to apply for ARFVTP funding.12
Hosting a breakout session during the February 2016 Empower California workshop to
increase participation of diverse business enterprises in the ARFVTP.
In addition to the above actions, the Energy Commission has also provided a scoring preference
for projects located in or benefitting disadvantaged communities, as defined by the
CalEnviroScreen 2.0 tool available online from the California Office of Environmental Health Hazard Assessment.13 These preferences were used in recent solicitations, including:
Advanced Vehicle Technology Manufacturing (PON-14-604).
Medium- and Heavy-Duty Advanced Vehicle Technology Demonstration (PON-14-605).
Centers for Alternative Fuels and Advanced Vehicle Technology in Central California
(PON-14-606).
Natural Gas Fueling Infrastructure (PON-14-608).
The Energy Commission plans to continue and enhance existing efforts and implement new
activities to ensure that participation in the ARFVTP reflects the rich and diverse characteristics
of California and its people. These plans include, but are not limited to:
Targeting particular geographic regions within California for a variety of program
activities that will further Energy Commission outreach efforts, especially in Southern
California and the Central Valley.
12 California Energy Commission. Grant Funding Opportunities 101: Alternative and Renewable Fuels and Vehicle Technology Program. October 2014. Available at http://www.energy.ca.gov/altfuels/notices/2014-10_workshops/ARFVTP_Solicitation_Grant_Tutorial.pdf.
13 Office of Environmental Health Hazard Assessment. CalEnviroScreen 2.0. October 2014. Available at http://oehha.ca.gov/ej/ces2.html.

17
Continuing to meet with small businesses, veteran, women, minority, and other
interested groups to provide informational materials on partnering for success through
the ARFVTP. The materials will also be available on the Energy Commission website.
Continuing to hold preapplication and prebid workshops to explain requirements for
grant and contract funding opportunities, answer questions, and encourage networking
and partnering among potential applicants.
Program Metrics
State statutes provide directives and preferences that are used as metrics to measure and
evaluate the benefits of the ARFVTP. These metrics include petroleum and GHG emission
reductions, market transformation, technology advancement, sustainability, air quality benefits,
economic development, and benefit-cost assessments. Of these metrics, measuring the near- and
long-term reductions in petroleum fuel use and GHG emissions from the transportation sector is
of primary importance for evaluating the effectiveness of the ARFVTP.
The ARFVTP considers these metrics when evaluating potential projects for funding by using a
series of weighted scoring factors. The extent to which these scoring factors are applied to each
solicitation varies, depending on the characteristics of each technology area. Given the ARFVTP
legislative requirement not to adopt any one preferred fuel or technology for the program, the
metrics cannot be applied equally to all project types. To do so could lead to a preference for
certain fuels or technologies while neglecting other project types that provide different but
important benefits.
The Energy Commission has investigated how best to apply metrics to the selection of projects
and for the evaluation of the program. In June 2014, the Energy Commission hosted a public
workshop to discuss the use of metrics in the ARFVTP, the findings of which are discussed in
Chapter 4 of the 2014 Integrated Energy Policy Report Update and are integrated into subsequent ARFVTP solicitations.14 In addition, contracts with the National Renewable Energy
Laboratory (NREL) and the RAND Corporation have been developed to analyze and assess the
benefits attributable to the ARFVTP. The NREL contract is discussed in greater detail in the
ARFVTP Benefits and Evaluation section of this chapter.
Summary of Program Funding Through December 2015, the Energy Commission has issued or proposed roughly $606 million
in ARFVTP funding across 545 agreements. A summary of these agreements by fuel type is
provided in Table 2, and these agreements are further summarized by project type in Table 3.
The agreements support a broad portfolio of fuel types, supply chain phases, and
commercialization phases. In most cases, projects are still in progress: production facilities are
14 California Energy Commission. 2015. 2014 Integrated Energy Policy Report Update. Publication Number: CEC-100-2014-001-CMF. Available at http://energy.ca.gov/2014publications/CEC-100-2014-001/CEC-100-2014-001-CMF.pdf.

18
still being sited and constructed, infrastructure is still being installed, and vehicles are still being
demonstrated or deployed. Major highlights of the ARFVTP funding portfolio to date include:
50 projects to promote the production of sustainable, low-carbon biofuels within
California. Most will use waste-based feedstocks, which have some of the lowest carbon-
intensity pathways recognized under the Low-Carbon Fuel Standard. Furthermore, 19 of
these projects are commercial-scale operations that will expand in-state biofuel
production capacity by a combined 88 million diesel-equivalent gallons per year.
7,490 installed and planned charging stations for plug-in electric vehicles, including
4,176 residential charging stations, 3,194 commercial and workplace charging stations,
and 120 direct current (DC) fast chargers.
49 new or upgraded hydrogen refueling stations that will help serve a nascent population
of fuel cell electric vehicles, plus the development of retail fueling standards to enable
hydrogen sales on a per-kilogram basis. Once built, these stations will represent nearly
half of the initial network of 100 hydrogen refueling stations called for by Assembly Bill 8.
44 projects to demonstrate zero- and near-zero-emission advanced technologies and
alternative fuels in a variety of medium- and heavy-duty vehicle applications.
2,809 natural gas vehicles now or soon to be in operation in a variety of applications.
65 natural gas fueling stations to support a growing population of natural gas vehicles.
These include at least six stations that will incorporate low-carbon biomethane into
some, if not all, of the dispensed fuel.
$49.1 million to fund nearly 21,000 incentives for all-electric and plug-in hybrid electric
vehicles via the Air Resources Board Clean Vehicle Rebate Project (CVRP), accounting for
more than one out of every six rebates issued or reserved through the end of FY 2014-
2015.
22 manufacturing projects that will support in-state economic growth while reducing the
supply-side barriers for alternative fuels and advanced technology vehicles, primarily in
electric drive-related components and vehicles.
Workforce training for 14,762 trainees and more than 240 businesses that will translate
clean technology investments into sustained employment opportunities.
Five Centers for Alternative Fuels and Advanced Vehicle Technologies, located
throughout the state, which are dedicated to expanding the role of alternative fuels and
advanced vehicle technologies in California.
34 alternative fuels readiness planning and implementation grants to help regions plan
for vehicle deployment, new fueling infrastructure, and permit streamlining. These
grants include 25 electric vehicle readiness plans, five hydrogen readiness plans, and six
multifuel readiness plans.
The ARFVTP has funded projects throughout California. About 20 percent of funds have been
awarded to projects in the Central Valley, 21 percent in Northern California, 35 percent in
Southern California, and 24 percent with a statewide focus. The details associated with each
project type are discussed further in respective sections of this investment plan update. In

19
addition, Table 4 outlines the funding allocations of the two most recent investment plan
updates, in comparison to the funding allocations for FY 2016-2017.
Table 2: ARFVTP Awards by Fuel Type as of December 31, 2015
Fuel Type Cumulative Awards
to Date (in millions)
Cumulative Number of Projects to Date
Biomethane $50.9 16
Ethanol $43.6 19
Biodiesel $49.3 19
Renewable Diesel $12.1 5
Electricity $199.2 153
Hydrogen $113.0 72
Natural Gas $88.9 154
Propane $6.0 31
Multiple/Other* $43.0 76
Total $606.0 545
Source: California Energy Commission. *Some agreements, such as those for multifuel regional readiness plans or workforce training, cannot be readily categorized by fuel type.

20
Table 3: Previous ARFVTP Awards as of December 31, 2015
Category Funded Activity Cumulative
Awards to Date(in millions)*
# of Projects or Units
Alternative Fuel Production
Biomethane Production $50.9 16 Projects
Gasoline Substitutes Production $27.2 14 Projects
Diesel Substitutes Production $57.4 20 Projects
Alternative Fuel Infrastructure
Electric Vehicle Charging Infrastructure $40.7 7,490 Charging Stations
Hydrogen Refueling Infrastructure $96.0 49 Fueling Stations
E85 Fueling Infrastructure $13.7 158 Fueling Stations
Upstream Biodiesel Infrastructure $4.0 4 Infrastructure Sites
Natural Gas Fueling Infrastructure $21.0 65 Fueling Stations
Alternative Fuel and Advanced Technology Vehicles
Natural Gas Vehicle Deployment** $56.4 2,809 Vehicles
Propane Vehicle Deployment** $6.0 514 Trucks
Light-Duty Electric Vehicle Deployment $25.1 10,700 Cars
Medium- and Heavy-Duty Electric Vehicle Deployment $4.0 150 Trucks
Medium- and Heavy-Duty Vehicle Technology Demonstration and Scale-Up
$93.7 44 Demonstrations
Related Needs and Opportunities
Manufacturing $57.0 22 Manufacturing Projects
Emerging Opportunities † †
Workforce Training and Development $27.7 83 Recipients
Fuel Standards and Equipment Certification $3.9 1 Project
Sustainability Studies $2.1 2 Projects
Regional Alternative Fuel Readiness and Planning $7.6 34 Regional Plans
Centers for Alternative Fuels $5.8 5 Centers
Technical Assistance and Program Evaluation $5.6 n/a
Total $606.0
Source: California Energy Commission. *Includes all agreements that have been approved at an Energy Commission business meeting, or are expected for business meeting approval following a notice of proposed award. For canceled and completed projects, includes only funding received from ARFVTP, which may be smaller than initial award. **Funding includes both completed and pending vehicle incentives, as well as encumbered funds for future incentives. †Previous awards have been reclassified by project type into other rows.

21
Table 4: Most Recent and Current Investment Plan Allocations (in millions)
Category Funded Activity 2014-2015 2015-2016 2016-2017
Alternative Fuel Production
Biofuel Production and Supply $20 $20 $20
Alternative Fuel Infrastructure
Electric Charging Infrastructure $15 $17 $17
Hydrogen Refueling Infrastructure $20 $20 $20
Natural Gas Fueling Infrastructure $1.5 $5 $2.5
Alternative Fuel and Advanced Technology Vehicles
Natural Gas Vehicle Incentives $10 $10 $10
Light-Duty Electric Vehicle Deployment $5 - -
Medium- and Heavy-Duty Vehicle Technology Demonstration and Scale-Up
$15 $20* $23*
Related Needs and Opportunities
Manufacturing $5
Emerging Opportunities $6 $3 $3
Workforce Training and Development Agreements $2.5 $3 $2.5
Regional Alternative Fuel Readiness and Planning - $2 $2
Total $100 $100 $100
Source: California Energy Commission. *See the text of these respective sections in Chapters 5 and 6 for details on the combination of these funding allocations.
22
ARFVTP Benefits and Evaluation The Energy Commission periodically reviews and evaluates its implementation of the ARFVTP to
improve program efficiency, identify future funding needs, and select higher-quality projects.
Much of this can be done in-house by reviewing previous investment plans, reviewing funding
solicitations, comparing past awards, visiting sites, surveying ARFVTP grantees, and performing
other program analyses.
Benefit-Cost Assessments AB 8 introduced the GHG benefit-cost score as a new element into the list of policy and scoring
preferences for ARFVTP. It is defined as “…a project’s expected or potential greenhouse gas emissions reduction per dollar awarded by the Commission to the project.”15 AB 8 also directs
the Energy Commission to “give additional preference to funding those projects with higher benefit-cost scores.”16 The benefit-cost provision preference is applied when evaluating
proposals for similar types of projects during funding solicitations.
Cost-benefit measurements and scoring are incorporated into the development of solicitations
and the review of proposals for the ARFVTP. The “benefit” is calculated as the amount of
conventional fuel displaced per year by the resulting alternative fuel or technology, multiplied by the carbon intensity of that fuel or technology relative to conventional fuel.17 This results in
an estimate of direct GHG reduction benefits from a proposed project. The “cost” is based on
the requested ARFVTP funding amount. Dividing the “benefit” by the “cost” produces a benefit-
cost ratio that staff uses in ranking similar proposals within a competitive solicitation.
The benefit-cost ratio is one of several project selection criteria established in statute and is
accordingly just one of several criteria used to evaluate project applications. The benefit-cost
ratio is given greater scoring weight in solicitations that focus on technologically mature and
commercially established project types. Conversely, the benefit-cost ratio is given smaller
weighting in solicitations that focus on precommercial or evolving technologies. In recent
solicitations, this preference has also been incorporated both as part of the general scoring
criteria and as a potential tie-breaker in the event of proposals receiving equal scores.
National Renewable Energy Laboratory Program Benefits Guidance Report
The Energy Commission has also worked with the NREL to develop an approach for quantifying
the petroleum displacement, GHG reduction, and air quality benefits of projects funded by the
ARFVTP, which is required by Assembly Bill 109 (Núñez, Chapter 313, Statutes of 2008). In June
2014, NREL issued a Program Benefits Guidance draft report that describes its method for
15 California Health and Safety Code, Sec. 44270.3(a).
16 California Health and Safety Code, Sec. 44272(d).
17 Carbon intensity is defined here as the amount of carbon dioxide equivalent greenhouse gasses by weight emitted per unit of energy consumed.

23
categorizing and assessing a series of benefit categories. 18 The methods and results of this
report are discussed in the 2014 Integrated Energy Policy Report Update. For 2015, NREL
analyzed updated ARFVTP project data for 262 projects totaling $552 million, representing the
ARFVTP project portfolio technical projects as of June 30, 2015. In reviewing ARFVTP benefits,
NREL identified four relevant categories, as summarized in Table 5. These categories range from
benefits with relatively high levels of certainty about past trends and near-term projects to
benefits with high levels of uncertainty regarding technological innovation and market
transformation. The first category, Baseline Benefits, is a conceptual category that represents
GHG reductions without ARFVTP projects. Since its report focused on benefits associated with
ARFVTP, NREL focused on other categories within the report.
Table 5: Benefit Categories in NREL Program Benefits Guidance
Benefits Category Description
Baseline Benefits Expected to accrue without support from ARFVTP.
Expected Benefits Directly associated with vehicles and fuels deployed by projects receiving ARFVTP funds.
Market Transformation Benefits
Accrued due to influence of ARFVTP projects on future market conditions to accelerate the adoption of new technologies.
Required Carbon Market Growth Benefits
Projections of future market growth trends comparable to those needed for deep GHG reductions by 2050.
Source: California Energy Commission, based on categories developed by NREL.
The second category, Expected Benefits, is defined as the benefits most likely to occur from
ARFVTP projects being executed successfully, assuming a one-to-one substitution of existing
fuel or technology with a new fuel or technology. Figure 2 summarizes the estimated GHG
emission reductions from the Expected Benefits category through 2025.
18 Melaina, Marc, Ethan Warner, Yongling Sun, Emily Newes, and Adam Ragatz (National Renewable Energy Laboratory). 2014. Program Benefits Guidance: Analysis of Benefits Associated With Projects and Technologies Supported by the Alternative and Renewable Fuel and Vehicle Technology Program. CEC-600-2014-005-D. Available at http://www.energy.ca.gov/2014publications/CEC-600-2014-005/CEC-600-2014-005-D.pdf.

24
Figure 2: Summary of GHG Emissions Reductions From the Expected Benefits of 223 Projects Through 2025
Source: NREL.

25
The third category of benefits considered by NREL, Market Transformation Benefits,
corresponds to the core mission of ARFVTP to transform the California transportation
system into a low-carbon, low-emission system of alternative fuel and vehicle
technologies. Market transformation benefits are tangible but more challenging to
quantify because they are assessments of how ARFVTP-funded projects will contribute
to reducing the barriers of future alternative fuel and technology deployments. Because
of the greater uncertainty from this type of benefit, NREL incorporated a low and high
range.
Table 6: Summary of GHG Emission and Petroleum Fuel Reduction Benefits Based on 262 Projects
Category Project
Class/Range
GHG Reductions (thousand tonnes CO2e)
Petroleum Reductions
(million gallons)
2015 2020 2025 2015 2020 2025
Expected Benefits
Fueling Infrastructure 79.9 518.8 529.2 18.7 96.6 98.4
Vehicles 106.9 605.0 1,119.3 25.1 81.3 141.9
Fuel Production 39.2 589.8 782.5 3.5 55.0 73.2
TOTAL 226.0 1,713.7 2,431.0 47.4 232.8 313.5
Market Transformation
Benefits
Low Case 214.8 378.1 802.6 24.8 48.7 93.6
High Case 483.9 2,038.3 3,184.0 65.3 245.2 364.6
Required Carbon Market Growth
Low Case - 2,333 6,375 - 237.2 957.3
High Case - 6,397 15,189 - 665.4 1,959
Source: NREL.
The estimates for Expected Benefits and Market Transformation Benefits are
summarized in Table 6. Expected Benefits for all project classes by 2025 total about
2.43 million metric tons of carbon dioxide equivalent (MMTCO2e). The range of Market
Transformation Benefits by 2025 range from 802,600 metric tons CO2e in the Low Case
to 3.18 MMTCO2e in the High Case. Combining this range of benefits with the Expected
Benefits category yields a GHG reduction range of 3.2 MMTCO2e to 5.6 MMTCO
2e by
2025. Cumulative petroleum reductions for Expected and Market Transformation
Benefits range from 407.1 million to 678.1 million gallons by 2025.
These categories can be compared against the fourth category, Required Market Growth
Benefits. This category represents an approximate trajectory for how California will
need to reduce GHG emissions to meet its 2050 goal. Total Expected Benefits and
Market Transformation Benefits represent a significant contribution to overall efforts to
reduce transportation-related GHG emissions; more than half of the roughly 7 MMTCO2e
needed in the 2020 to 2025 time frame is indicated by Figure 3. Another comparative

26
reference is that the high case GHG reduction estimate of 5.6 MMTCO2e would represent
one-third of the 15 MMTCO2e in transportation GHG emissions reductions projected for
the Low Carbon Fuel Standard program in 2020.19 The comparisons are shown in Figure
3, which depicts steady progress along this trajectory but with a clear need for future
investments as well.
Figure 3: GHG Reductions From Expected and Market Transformation Benefits in Comparison to Required Market Growth Benefits
Source: NREL.
Related Policies and Programs
Air Quality Improvement Program/Low Carbon Transportation Program
In addition to the ARFVTP, AB 118 also created the Air Quality Improvement Program
(AQIP), to be administered by the ARB. While the ARFVTP focuses primarily on achieving
state GHG reduction goals within the transportation sector, the AQIP is primarily
responsible for reducing air pollutants from the transportation sector. The two
19 California Air Resources Board. 2014 LCFS Advisory Panel. May 19, 2014. Available at http://www.arb.ca.gov/fuels/lcfs/workgroups/advisorypanel/051914advisorypanelpresentation.pdf.

27
programs have worked in concert to maximize the benefits to the state and avoid
duplication of efforts. For instance, the ARFVTP has invested in light-duty electric
vehicle charging infrastructure, regional planning, and manufacturing projects, while
the AQIP has provided deployment incentives for light-duty electric vehicles through the
CVRP. Similarly, the Energy Commission has supported the demonstration of early
hybrid and electric truck and bus models, while the AQIP has provided deployment
incentives for such vehicles through the Hybrid and Zero-Emission Truck and Bus
Voucher Incentive Project (HVIP) and other planned larger-scale pilot deployment
projects. Finally, AQIP has also provided loans to assist fleets in modernizing their
diesel trucks.
Prior to the availability of greenhouse gas reduction funds, the ARFVTP provided $49.1
million in funding to backfill CVRP needs, as well as an additional $4 million in HVIP
incentives. Beginning with FY 2014-2015, ARB combined the AQIP and the Low-Carbon
Transportation Investments into one funding plan, as discussed in the AB
32/Greenhouse Gas Reduction Fund section below. The joint funding plan is meant to
ensure synergistic investments between the two programs.
AB 32/Greenhouse Gas Reduction Fund
Assembly Bill 32 (Núñez, Chapter 488, Statutes of 2006), also known as the Global
Warming Solutions Act of 2006, required the ARB to adopt a statewide GHG emission
limit for 2020 equivalent to the statewide GHG emission levels in 1990. Executive Order
S-3-05 also set an objective of reducing emissions to 80 percent below 1990 levels by
2050, which is consistent with an Intergovernmental Panel on Climate Change analysis
of the emissions trajectory that would stabilize atmospheric GHG concentrations at
450 parts per million CO2e and reduce the danger of catastrophic climate change. In
addition, Executive Order B-30-15 set an interim goal to reduce statewide GHG
emissions to 40 percent below 1990 levels by 2030, to ensure California meets the
targets of Executive Order S-3-05.
As part of its regulation, the ARB developed a cap-and-trade program that set a limit on
the amount of permissible GHG emissions from regulated sectors. Covered entities must
then pay an allowance price for their GHG emissions from those sectors. Revenue from
these payments goes into the Greenhouse Gas Reduction Fund (GGRF) and is
appropriated by the Legislature each year in the annual budget act.
The ARB allocated a combined $118 million in its AQIP and Low Carbon Transportation
investments funding plan, as amended in October 2015. Table 7 summarizes this funding plan.20,21
20 California Air Resources Board. Proposed Fiscal Year 2015-16 Funding Plan for Low Carbon Transportation Investments and the Air Quality Improvement Program. May 21, 2015. Available at http://www.arb.ca.gov/msprog/aqip/fundplan/proposed_fy15-16_funding_plan.pdf.

28
Table 7: FY 2015-2016 AQIP and Low Carbon Transportation GGRF Allocations
Project Category AQIP Funding for FY 15-16 (in millions)
GGRF Funding for FY 15-16 (in millions)
Light-Duty Vehicle Projects
Clean Vehicle Rebate Project $3 $75
Light-Duty Pilot Projects to Benefit Disadvantaged Communities
- $10
Heavy-Duty Vehicle and Equipment Projects
Hybrid and Zero-Emission Truck and Bus Voucher Incentive Project
$2 $5
Low NOx Truck Incentives $2 -
Truck Loan Assistance Program $15 -
Reserve for Revenue Uncertainty $1 -
State Operations for Low Carbon Transportation - $5
Total $23 $95
Source: California Air Resources Board.
The first three project categories listed in Table 7 have particular importance to the
goals and strategies of the ARFVTP and are further discussed in the Light-Duty Electric
Vehicle subsection and Medium- and Heavy-Duty Vehicle Technology Demonstration
and Scale-Up subsection of this investment plan update.
Low-Carbon Fuel Standard The ARB adopted the Low-Carbon Fuel Standard (LCFS) regulation in April 2009, with a goal of reducing the overall carbon intensity of fuel within the transportation sector by 10 percent by 2020. Since then, regulated parties have had to slowly reduce the carbon intensity of their fuel.
A “credit” under the LCFS is equivalent to the reduction of 1 metric ton of CO2e, roughly
equivalent to the amount of CO2e released from the combustion of 90 gallons of
gasoline. The cost of credits has been volatile in recent years, as shown in Figure 4, ranging from an average high of nearly $80 in November 2013 to a low of nearly $20 in early April 2014. The price per credit began rising in the third quarter of 2015, increasing to an average of $105 in January 2016.22 This is most likely because ARB
21 California Air Resources Board, Notice of Public Meeting to Consider a Modification to the Fiscal Year 2015-16 Funding Plan for Low Carbon Transportation Investments and the Air Quality Improvement Program. October 15, 2015. Available at http://www.arb.ca.gov/msprog/aqip/fundplan/final_meeting_notice_october15.pdf.
22 California Air Resources Board. Monthly LCFS Credit Transfer Activity Report for January 2016. February 9, 2016. Available at http://www.arb.ca.gov/fuels/lcfs/credit/20160209_jancreditreport.pdf.

29
readopted the LCFS with amendments in September 2015, with an effective date of January 1, 2016. As of March 2015, there were 286 transportation fuel pathways available for use under the LCFS, and as of May 2015, more than 193 parties have registered transactions under the LCFS, including oil refiners, biofuel producers, and electric and natural gas utilities.23,24
Figure 4: Low-Carbon Fuel Standard Credit Spot Market Prices
Source: Argus Media Ltd.
The LCFS has significance for the ARFVTP in several ways. Most importantly, the Energy Commission frequently relies on LCFS-derived carbon intensity numbers in numerous phases of ARFVTP implementation. This is due to the LCFS program life-cycle analysis of GHG emissions, the specificity to California, and the consistent method across multiple fuel pathways. The life-cycle GHG emission numbers are used in assessing the opportunities from different alternative fuels within the investment plan update, estimating the GHG reduction potential from applicants during solicitations, and analyzing ARFVTP benefits.
The LCFS also provides a direct financial incentive per gallon, kilowatt-hour, therm, or kilogram to the producers and distributors of low-carbon alternative fuels. At the recent average price of $105 per credit, the LCFS value of an alternative fuel offering a 50 percent GHG emission reduction compared to gasoline would be roughly $0.63 per
23 Yeh, Sonia, Julie Witcover, James Bushnell. 2015. Status Review of California's Low Carbon Fuel Standard - April 2015 Issue (Revised Version). Institute of Transportation Studies, University of California, Davis. UCD-ITS-RR-15-07.
24 California Air Resources Board. Parties Reporting Transactions in the LCFS Reporting Tool. May 8, 2015. Available at http://www.arb.ca.gov/fuels/lcfs/regulatedpartiesreporting20150508.pdf.
$-
$20
$40
$60
$80
$100
$120
$140
$/to
n C
O2e

30
gasoline gallon equivalent (GGE).25 This complements the investments of the ARFVTP by
creating market incentives for near-term GHG reductions, allowing the ARFVTP to focus more resources on longer-term market transformation goals.
Renewable Fuel Standard The federal Energy Policy Act of 2005 established the Renewable Fuel Standard Program (RFS), which was revised under the Energy Independence and Security Act of 2007 into the RFS2. The RFS2 mandates 36 billion gallons of renewable fuel to be blended into transportation fuels nationwide by 2022. Within this volume, the RFS2 also establishes four categories of renewable fuel, each with a target for 2022. These categories include cellulosic, biomass-based diesel, advanced biofuel, and total renewable fuels.
Renewable fuels are assigned renewable identification numbers (RINs) to track trading and record compliance with the RFS. The U.S. Environmental Protection Agency (U.S. EPA) establishes annual RIN requirements in consideration of the expected available volumes of renewable fuels. In July 2015, the U.S. EPA released projected volumes and proposed percentages for renewable fuels in Table 8.26
Table 8: Projected Fuel Volumes and Proposed RFS Percentages for 2014 – 2017
Category Projected Volume
Proposed Percentage of Fuels
2014 2015 2016 2017 2014 2015 2016
Cellulosic Biofuel
33 million 123 million 230 million n/a 0.019% 0.069% 0.128%
Biomass-Based Diesel
1.63 billion 1.73 billion 1.90 billion 2.00 billion 1.41% 1.49% 1.59%
Advanced Biofuel
2.67 billion 2.88 billion 3.61 billion n/a 1.51% 1.62% 2.01%
Total RenewableFuels
16.28 billion 16.93 billion 18.11 billion n/a 9.19% 9.52% 10.10%
Source: U.S. EPA. *All volume is reported in ethanol-equivalent gallons, except for biomass-based diesel, which is in U.S. gallons.
As with the LCFS, the RFS provides a per-gallon subsidy for alternative fuels through
saleable RINs that complements the goals of the ARFVTP by encouraging regulated
parties (and credit-generating parties) to invest in the lowest-cost means of increasing
alternative fuel use. The market value of these RINs can be volatile and recently has
ranged from about $0.40 to $0.70 per RIN, with one RIN representing the energy content
25 Based on assumptions of $105 per MT of CO2e and 0.012 MT of CO2e per GGE.
26 United States Environmental Protection Agency. Final Renewable Fuel Standards for 2014, 2015, and 2016, and the Biomass-Based Diesel Volume for 2017. November 30, 2015. Accessed February 23, 2016. Available at http://www.epa.gov/renewable-fuel-standard-program/final-renewable-fuel-standards-2014-2015-and-2016-and-biomass-based.

31
of a gallon of ethanol (or, in the case of the biomass-based diesel category, one U.S.
gallon). This volatility affects the income of biofuel producers and can negatively affect
investments in projects.
In summer 2014, the U.S. EPA also classified biomethane under the “Cellulosic Biofuel”
category, which thereby expanded the eligibility of biomethane from landfills,
wastewater treatment facilities, agricultural digesters, and municipal solid waste
digesters and nearly doubled the projected volume of cellulosic biofuel for 2014. This
should further encourage the growth of biomethane production both within and outside
California.
Executive Order on Sustainable Freight Executive Order B-32-1527, issued by Governor Brown on July 17, 2015, ordered the
development of an integrated action plan to improve freight efficiency, transition to
zero-emission technologies, and increase the competitiveness of California’s freight
system. The plan, known as the California Sustainable Freight Action Plan, will identify
state policies, programs, and investments to achieve these targets. The plan is due to be
completed by July 2016 and will be developed as a combined effort by the California
State Transportation, California Environmental Protection, and California Natural
Resources Agencies, including ARB, California Department of Transportation, Energy
Commission, and Governor’s Office of Business and Economic Development, in
partnership with the public and stakeholders. In addition, the executive order directs
the Energy Commission and other state agencies to initiate work on corridor-level
freight pilot projects within the state primary trade corridors that integrate advanced
technologies, alternative fuels, freight and fuel infrastructure, and local economic
development opportunities.
Executive Order on Zero-Emission Vehicles On March 23, 2012, Governor Brown issued Executive Order B-16-1228, which set a target
of 1.5 million zero-emission vehicles on the road by 2025 and tasked various state
agencies with specific actions needed to support this goal. The ZEV Action Plan, issued in 2013, includes actions that apply directly to the funding categories of the ARFVTP.29
For instance, the ZEV Action Plan calls for developing infrastructure networks and
community readiness plans for both plug-in electric vehicles and fuel cell electric
vehicles, which have been priorities in the ARFVTP. The ZEV Action Plan also highlights
27 Available at https://www.gov.ca.gov/news.php?id=19046.
28 Available at https://www.gov.ca.gov/news.php?id=17472.
29 Governor’s Interagency Working Group on Zero-Emission Vehicles. 2013 ZEV Action Plan: A Roadmap Toward 1.5 Million Zero-Emission Vehicles on California Roadways by 2025. February 2013. Available at http://opr.ca.gov/docs/Governor's_Office_ZEV_Action_Plan_(02-13).pdf.

32
the importance of economic development that can result from growth of the zero-
emission vehicle (ZEV) sector, specifically calling on the need for public investment into
workforce training and advanced technology manufacturing. Both of these have been
captured in the ARFVTP annual investment plans since the inception of the program. An
updated draft version of the ZEV Action Plan was released in April 2015, which
discusses state progress to date and identifies new actions to be undertaken.
In addition, the Governor’s Office of Planning and Research released the Zero-Emission
Vehicles in California: Community Readiness Guidebook in 2013. This guidebook helps
local planning and permitting agencies familiarize themselves with ZEVs and support
these vehicles in their communities. The guidebook includes an overview of ZEV
technologies, specific suggestions for how these agencies can better prepare for ZEVs, as
well as a collection of tools that can help streamline ZEV infrastructure permitting,
prepare for increased electricity demand, and develop ZEV-friendly building codes.
Charge Ahead California Initiative
Senate Bill 1275 (De León, Chapter 530, Statutes of 2014) established the Charge Ahead
California Initiative, administered by the ARB in consultation with the Energy
Commission and related agencies. The new statute establishes a goal of placing
1 million zero-emission and near-zero-emission vehicles in service by January 1, 2023,
as well as increased access to these vehicles by disadvantaged, low-income, and
moderate-income communities and consumers. In implementing the initiative, the ARB
must include a three-year funding forecast for near zero- and zero-emission vehicles in
each funding plan, beginning with FY 2016-2017. The ARB also adopted revisions to the
Clean Vehicle Rebate Project, which can phase down rebate levels based on cumulative
sales, limit eligibility based on income, and consider other methods of incentives.
CPUC Alternative-Fueled Vehicle Proceedings
In 2014, the California Public Utilities Commission (CPUC) adopted a decision in
Rulemaking R.13-11-007, which allows for the consideration of utility ownership of
electric vehicle charging stations (EVCS) and infrastructure on a case-specific basis. This
decision is expected to encourage the expansion of EVCS within the CPUC-regulated
utility service territories. Since the decision was adopted, the three major investor-
owned utilities within the state have announced plans to introduce up to 12,600 new
EVCS installations within their territories. This is described further in the Charging
Infrastructure section. The Energy Commission has worked and will continue to work
closely with other agencies to ensure the strategic deployment of EVCS and avoid
redundant investments in infrastructure.
33
CHAPTER 3: Alternative Fuel Production and Supply
Biofuel Production and Supply Biofuels, defined here to include nonpetroleum diesel substitutes, gasoline substitutes,
and biomethane, represent the largest existing stock of alternative fuel in the California transportation sector.30 Of the roughly 29.1 million vehicles on California roads, almost
93 percent rely exclusively on gasoline or diesel for fuel. Low-carbon biofuels that can
directly displace the roughly 13 billion gallons of gasoline and 3.4 billion gallons of
diesel used per year in California represent both an immediate and long-term opportunity to reduce GHG emissions and petroleum dependence.31 One goal of the
ARFVTP is to help build the capacity of California companies to produce economically
competitive biofuels from waste-based and renewable feedstocks. In addition to the
production of low-carbon fuels, ARFVTP investments in this area often provide
employment benefits in economically disadvantaged regions of the state.
Renewable diesel was the most common diesel substitute used in California in 2014, the
majority of which was supplied through overseas imports. Two additional in-state
renewable diesel producers were funded by the ARFVTP and are expected to come on-
line in 2016, producing a combined 17.5 million gallons per year. This additional
capacity is expected to further increase renewable diesel use in California. Renewable
diesel that meets the fuel specification requirements of ASTM International standard
D975 is fungible, or interchangeable, with conventional diesel fuel and can be used in
existing diesel engines and fuel infrastructure.
Biodiesel is another diesel substitute that, though not fully fungible with conventional
diesel fuel, can be blended up to 5 percent in diesel fuel without special modifications
to the vehicle. The recent ARB Alternative Diesel Fuel Regulation allows biodiesel blends
up to 5 percent to be sold without restriction. For biodiesel blends in excess of 5
percent, the regulation requires addition action, such as blending with additives, due to
concerns with higher NOX emissions. Higher blends of biodiesel are commercially
available; however, these may not be compatible with all retail infrastructure and may
interfere with vehicle warranty provisions. California has eight biodiesel production
30 The term gasoline substitutes refers to any liquid fuel that can directly displace gasoline in internal combustion engines, including ethanol and renewable drop-in gasoline substitutes. The term diesel substitutes refers to any liquid fuel that can significantly displace diesel fuel, including biodiesel, renewable diesel, and renewably derived dimethyl ether (assuming fuel system modifications). These definitions differ from similar terms used by ARB under the LCFS, which are broader and include fuels such as electricity, natural gas, and hydrogen.
31 Based on analysis from California Energy Commission Demand Analysis Office, with data from the California Department of Motor Vehicles.

34
facilities with a combined production capacity of 74 million gallons per year.32 Three of
these eight facilities received ARFVTP funding to expand production capacity by a
cumulative 26 million gallons of fuel per year. Both renewable diesel and biodiesel have
lower carbon intensities than diesel fuel and accounted for about 40 percent of LCFS credits from a combined total of about 181 million gallons of fuel in 2014.33
Ethanol is the only widely available gasoline substitute, and it is used primarily as a fuel
additive with gasoline. California limits ethanol blends in conventional gasoline to 10
percent, although the U.S. Environmental Protection Agency does permit blends of up to
15 percent. Flex-fuel vehicles (FFVs) are capable of running on higher blends of up to 85
percent ethanol and 15 percent gasoline, referred to as E85. Nearly 1 million FFVs are registered in California, which, during 2014, used a total of 11 million gallons of E85.34
While sales of E85 continue to increase as ARFVTP-funded fueling stations come on-line,
E85 accounts for only about 1 percent of the total fuel used by FFVs. Though ethanol
continues to be the largest volume alternative fuel used in California, in-state ethanol
use has not substantially changed since 2011. The state has the capacity to produce
about 220 million gallons of ethanol per year, using primarily corn or sorghum as a feedstock.35
The Energy Commission has previously provided support for E85 distribution
infrastructure in an effort to reduce petroleum dependence and decrease greenhouse
gas emissions. Through FY 2012-2013, the ARFVTP provided more than $16.4 million in
grants to fund the construction of 205 E85 fueling stations throughout the state. Many
of these projects, however, have proceeded with fewer stations than originally proposed
or have not yet proceeded at all. In addition, corn- and sorghum-derived E85 provides
only a modest reduction in carbon intensity compared to other biofuels, and recent
average E85 prices have ranged from 13 to 20 percent higher than gasoline on an energy-equivalent basis, which makes it difficult for E85 to compete with gasoline.36 For
these reasons, the Energy Commission discontinued funding for E85 infrastructure
beginning with the 2013-2014 Investment Plan Update. After existing agreements are
32 Comments submitted by California Biodiesel Alliance to Energy Commission docket 15-ALT-01, TN 210127. February 2, 2016.
33 California Air Resources Board. LCFS Quarterly Data. July 20, 2015. Available at http://www.arb.ca.gov/fuels/lcfs/lrtqsummaries.htm.
34 Based on analysis from California Energy Commission Demand Analysis Office.
35 California Air Resources Board. LCFS Quarterly Data. September 22, 2015. http://www.arb.ca.gov/fuels/lcfs/media_request_092215.xls.
36 Energy equivalent pricing derived from California average fuel price data for E10 and E85 between December 2014 and December 2015 from http://e85prices.com/california.html. Accessed December 3, 2015. E85 prices were adjusted to account for differences in energy density of 114,300 BTU/gallon for E10 and 81,655 BTU/gallon for E85.

35
complete and project performance can be analyzed, the Energy Commission may
reconsider E85 infrastructure funding.
Renewable gasoline is a potential gasoline substitute, although it is undergoing research
and development and is not commercially available. Similar to renewable diesel, it will
need to conform to relevant ASTM standard specifications to operate in unmodified
spark ignition (for example, gasoline) engines. The petroleum and GHG reduction
potential from a low-carbon renewable gasoline would be enormous and has the
potential to significantly contribute to the environmental and energy goals of the state.
Similarly, renewable crude oil products can serve as a fully fungible substitute for
petroleum crude oil at refineries. Renewable crude oil is in the research, development,
and demonstration phases and, if developed into a commercially viable product, may
also significantly contribute to California’s environmental and energy goals.
Biomethane is a prominent biofuel that, in addition to serving as a low-carbon substitute
for conventional natural gas, can also be used as a source for renewable hydrogen.
According to the most recently listed LCFS carbon intensity values, biomethane from
anaerobic digestion of wastewater sludge can reduce GHG emissions by as much as 92
percent below diesel, and biomethane derived from high-solids anaerobic digestion possesses a negative carbon intensity roughly 125 percent below diesel.37 Assembly Bill
341 (Chesbro, Chapter 476, Statutes of 2011) set a state goal of reducing, recycling, or
composting 75 percent of solid waste by 2020. This goal should support prelandfill
biomethane production by increasing the availability of organic waste feedstocks. The
Energy Commission prioritizes prelandfill biomethane production in solicitations, while
still allowing landfill gas projects to compete.
To date, the Energy Commission has awarded more than $135 million to 50 biofuel
production projects. These awards are summarized by fuel type in Table 9.
Table 9: Summary of Biofuel Production Awards to Date
Fuel Type Qualifying Proposals* Submitted
Funds Requested by Qualifying
Proposals* (in millions)
Awards Made
Funds Awarded
(in millions)
Gasoline Substitutes 24 $53.6 14 $27.2
Diesel Substitutes 51 $143.6 20 $57.4
Biomethane 39 $123.0 16 $50.9
Total 114 $320.2 50 $135.5
Source: California Energy Commission. *Qualifying proposals refers to proposals that received at least a passing score.
37 California Air Resources Board. Low Carbon Fuel Standard Final Regulation Order (Table 6). 2015. Available at http://www.arb.ca.gov/regact/2015/lcfs2015/finalregorderlcfs.pdf.

36
The carbon intensities of the above-mentioned biofuels can vary significantly,
depending on the feedstocks and conversion processes used in production. Biofuels
derived from waste-based feedstocks typically have the lowest carbon intensity of all
biofuels and often among all alternative fuels. Maximizing biofuel production from
these lowest-carbon options represents a key opportunity to reduce near-term GHG
emissions in combustion engines. Low GHG emissions, as well as other sustainability
considerations, have been a primary factor in determining ARFVTP funding for biofuel
production projects.
Table 10 shows a selection of the commercial-scale projects by fuel type that either
received or are proposed to receive ARFVTP funding. While the pathway used for these
projects may not have the lowest carbon intensity, the technologies used are sufficiently
developed to allow for considerable annual production.
Table 10: GHG Emission Reduction Potential of Commercial-Scale ARFVTP Projects
Fuel Type Pathway
Descriptions
Average GHG
Emission Reduction38
# of Projects
Range of Annual Capacity for
Individual Projects
Total Annual
Capacity Increase
Biomethane
Food, green, yard, and mixed municipal waste
110% 5 394,000 – 2,870,000 DGE
6.0 Million DGE per Year
Diesel Substitutes
Waste oils (various)
81%* 10 4,600,000 – 20,000,000 DGE
74.9 Million DGE per Year
Gasoline Substitutes
Grain sorghum 31% 3 2,600,000 – 3,000,000 GGE
8.6 Million GGE per Year
Source: California Energy Commission. *Several diesel substitute production projects will use a mixture of waste-based oils and conventional vegetable oils (for example, canola or soy).
Recent ARFVTP biofuel production solicitations have also funded precommercial
projects. Though these projects do not yet produce as much fuel as the commercial-
scale projects, these precommercial projects focus on pathways that have either a
greater potential for production or lower carbon intensity. The ARFVTP funds these
pilot and demonstration projects with the expectation that, after successful operations
at this scale, the technology will be suitable for commercial use. While not producing the
same immediate increase in annual production capacity as commercial-scale projects,
38 Compared to California diesel (98.03g CO2e/MJ) for biomethane and diesel substitutes, and California gasoline (99.18g CO2e/MJ) for ethanol. All GHG emission reductions will vary depending on the specific feedstock and production process used by each project. Based on a mix of established LCFS values and applicants’ LCFS-derived estimates.

37
these precommercial projects are focused on advanced new technologies and
approaches that can subsequently be expanded into wider markets. A sample of
precommercial ARFVTP projects is shown in Table 11, including pathways and
greenhouse gas emission reduction potential.
Table 11: Sample of Precommercial ARFVTP Projects
Fuel Type Pathway
Description
Estimated GHG
Emission Reduction39
# of Projects
Annual Capacity for Individual Projects (Diesel or Gasoline Gallon Equivalent)
Biomethane Wastewater 88% 1 160,000
Diesel Substitutes Algae 66%-122% 2 1,200 – 5,000
Diesel Substitutes Green Waste 66% 1 365,000
Gasoline Substitutes Woodchips and Switchgrass
76% 1 21,000
Gasoline Substitutes Sugar Beets 82% 1 215,000
Source: California Energy Commission.
The most recent biofuel production and supply solicitation, PON-14-602, was released in
October 2014 and was limited to early and precommercial technology development
projects. Though 12 eligible applicants requested a total of $9.2 million, only 4 projects
were selected for a total of $2.9 million in awards. Similar to previous solicitations, PON-
14-602 illustrated a continuing need for and interest in ARFVTP funding in this sector as
the number of qualified applications received and the amount of funding requested far
exceeded the available funding in the solicitation.
Recently, several biofuel production projects funded in previous years by the ARFVTP
have completed. These projects provide a good cross-section of the type and scale of
facilities funded by the ARFVTP:
EdeniQ, Inc. developed a precommercial cellulosic ethanol production technology
in Visalia (Tulare County) with a $3.9 million ARFVTP grant. The mechanism
developed with grant funds uses corn stover to produce ethanol with a carbon
intensity of up to 90 percent less than gasoline.
39 Ibid.

38
Springboard Biodiesel, LLC built a pilot-scale biodiesel production plant in Chico
(Butte County), funded in part by a $758,000 ARFVTP grant. The facility
processes used cooking oil to produce up to 365,000 gallons of ASTM-certified
biodiesel per year. Construction of this facility resulted in 15 short-term jobs,
and the continued operation of the plant created an additional 8 long-term jobs.
Pixley Biogas, LLC constructed a commercial-scale anaerobic digestion plant in
Pixley (Kern County) using a $4.7 million ARFVTP grant. The facility processes
manure from local dairies to produce low-carbon biogas. The construction
created an estimated 73 short-term jobs, and the ongoing operation of the
facility resulted in 2 long-term jobs.
Past funding solicitations have taken various approaches to biofuel types, either
combining all biofuel projects into one category or separating projects by fuel type.
Upcoming solicitations may use the combined category approach when scoring
applications to maximize cost-effectiveness per dollar of ARFVTP funding. As such, this
investment plan will retain the single allocation for all biofuels as used in previous years
to allow for greatest flexibility for funding solicitations.
Other state and federal programs may also provide support and incentives to biofuel
producers. For example, the California Department of Resources Recycling and Recovery
(CalRecycle) Organics Grant Program awarded $8.9 million to three biomethane-
producing projects in 2014. The Governor’s proposed budget for fiscal year 2016-2017
proposes a $100 million GGRF allocation for CalRecycle, some of which may be made
available for a new cycle of grants from the Organics Grant Program. In addition, the
budget proposes a $55 million GGRF allocation to the California Department of Food
and Agriculture, part of which is expected to fund anaerobic digesters at dairies. The
budget also proposes a $25 million GGRF allocation to the Energy Commission for
biofuel program activities, and a $40 million allocation to ARB to develop a low carbon
fuels incentive program. The Energy Commission will work with these agencies to
ensure future funding awards are complementary rather than duplicative. In addition,
the LCFS and RFS requirements can support biofuel producers by creating markets for
carbon credits and renewable fuels.
In September 2015, the Energy Commission hosted a Lead Commissioner Technology
Merit Review workshop for biofuel and biomethane. Biofuel producers and experts
presented examples of ARFVTP-funded projects and discussed key elements for project
success. The workshop discussion indicated that some biofuel business models are
evolving to incorporate new revenue streams that are not dependent on government
subsidies. Many biofuel producers, however, noted a need for biofuel production
incentives to stabilize and expand in-state biofuel production.
The need for production incentives stems largely from extended volatility in the price of
petroleum fuels. Biofuels are linked in price to that of gasoline, diesel fuel, and
conventional natural gas since they are substitutes for those fuels. During times of low
petroleum prices or high feedstock prices, biofuel producers may have no choice but to

39
sell at a loss. Energy Commission staff has considered biofuel production incentives as a
remedy for these problems. Staff determined, however, that the amount of funding
necessary for these incentives far exceeds the limited amount available under the
ARFVTP, given the correspondent need for funding from other fuel types and
technologies. As such, biofuel production incentives are not viable under the ARFVTP.
Given the enormous petroleum and GHG emission reduction potential of any low-
carbon, drop-in gasoline or petroleum replacement, future ARFVTP solicitations under
this category may emphasize renewable gasoline, renewable crude oil, and similar
products in an attempt to accelerate development. In addition, given the ultimately
limited quantities of common feedstocks such as waste vegetable oil and food waste,
future solicitations may also emphasize underused and emerging feedstocks such as
woody biomass.
Some fuel types and pathways have shown minimal improvement in carbon intensity or
cost-effectiveness in recent funding solicitations, which may indicate that the
technology or process has fully developed. The Energy Commission may evaluate
biofuel types and production pathways to determine when state incentives are no longer
necessary. To this end, incentives may be reduced or altered by placing a higher
emphasis on using cost-effectiveness scoring criteria or pathway efficiency, or requiring
increased benefits from repeat applicants. As the market for biofuels continues to
develop, the Energy Commission may also consider alternative funding mechanisms,
such as revolving loan or loan guarantee programs, which may be more suitable for
large projects and developed industries. For FY 2016-2017, the Energy Commission
maintains a $20 million allocation for biofuel production and supply to continue
support for new and expanded biofuel production plants in California.
Summary of Alternative Fuel Production and Supply Allocations
Table 12: FY 2016-2017 Funding for Alternative Fuel Production and Supply Biofuel Production and Supply Relevant Policy Goals:
GHG Reduction
Petroleum Reduction
In-State Biofuels Production
Low Carbon Fuel Standard
$20 Million No change relative to FY 2015-2016
Total $20 Million
Source: California Energy Commission.

40
CHAPTER 4: Alternative Fuel Infrastructure
Electric Charging Infrastructure Electric vehicles are expected to be a key component of achieving zero-emission vehicle
deployment and greenhouse gas reduction goals in California. Cumulative sales of plug-
in electric vehicles (PEVs), which include both battery electric vehicles (BEVs) and plug-in
hybrid electric vehicles (PHEVs), are steadily growing in California with more than 184,000 sold through January 2016.40 Most PEVs, however, are restricted in electric-drive
range by the current limitations of battery technology. A convenient, reliable network of
public EVCS is critical to address these limitations and support the expansion of PEV
ownership in California.
The Energy Commission has supported the rollout of PEVs by awarding more than $40
million in ARFVTP funding for EVCS. Due in part to these investments, California
possesses the largest network of nonresidential chargers in the nation, accounting for nearly one out of every four public charging stations.41 ARFVTP investments have
funded multiple categories of EVCS, as detailed in Table 13.
Table 13: Charging Stations Funded by ARFVTP as of December 31, 2015
Residential
Multi-unit Dwelling
Commercial Workplace* DC Fast
Chargers Total
Installed 3,937 143 1,777 170 30 6,057
Planned - 96 1,041 206 90 1,433
Total 3,937 239 2,818 376 120 7,490
Source: California Energy Commission. Does not include projects that have yet to be approved at a Commission business meeting. *An unspecified number of additional workplace charging stations are included in the commercial column, which were funded before workplace was tracked separately.
To date, the majority of PEV owners have relied on residential EVCS for their charging
needs. Residential projects account for half of all charging stations funded by the
ARFVTP, with the majority installed at detached single-family homes. While at-home
chargers are now readily available and more affordable, chargers for multiunit dwellings
still face market barriers. Although multiunit dwellings account for nearly 40 percent of
the state housing stock, only 4 percent of PEV owners reside in an apartment or
40 California Plug-In Electric Vehicle Collaborative. Detailed Monthly Sales Chart, February 3, 2016. http://www.pevcollaborative.org/sites/all/themes/pev/files/1_jan_2016_Dashboard_PEV_Sales.pdf.
41 U.S. Department of Energy. Alternative Fueling Station Counts by State. September 15, 2015. http://www.afdc.energy.gov/fuels/stations_counts.html.

41
condominium.42 Despite efforts to target incentives toward EVCS installation in multi-
unit dwellings, this area has been historically underrepresented by project applicants,
with only 2 of the 41 projects funded in PON-13-606 installing EVCS at multiunit
dwellings. Since PEV sales tend to be higher in more urbanized areas, where multiunit
dwellings are also more common, it is important to address the market barriers that are
preventing EVCS deployment at multiunit dwellings. The Energy Commission may
consider funding technical assistance programs such as an “Expert Advisor” program to
advise and guide multiunit dwelling owners and facility managers through the process
of planning and constructing charging infrastructure. Multiunit dwelling owners would
then be better prepared to respond to funding solicitations or financing opportunities.
In addition to residential charging, workplace charging represents another priority in
the ARFVTP portfolio of charging infrastructure. When residents of multiunit dwellings
are unable to charge at home, having a dedicated site to charge at work can serve as an
alternative. If located far from home, workplace charging can also help BEV owners
extend their range and PHEV owners increase their electric miles driven. Furthermore,
electric vehicle charging with demand-side management can reduce electricity use
during peak times and shift use to periods of excess electricity supply. As more
intermittent renewable energy is available to the electricity grid, the electricity supply
available during the day will increase and possibly result in overgeneration. Daytime PEV
charging, most likely at workplaces and other public locations, has the opportunity to
reduce the effects of overgeneration.
Publicly accessible charging stations are also important to extend the range and improve
the convenience of PEVs to increase adoption. Commercial charging, as identified in
Table 13, includes stores, parking garages, universities, municipal governments, and
other common, publicly accessible destinations. To ensure open access to EVCS, Senate
Bill 454 (Corbett, Chapter 418, Statutes of 2013) created the Electric Vehicle Charging
Stations Open Access Act, which prohibits requiring subscription fees or memberships
as a condition of use for publicly accessible chargers. A 2014 survey conducted by the
Center for Sustainable Energy survey notes that 71 percent of respondents expressed
some level of dissatisfaction with public charging infrastructure, indicating substantial opportunities for improvement.43 Possible causes of the low satisfaction include
congestion at popular charging stations, as well as many areas of the state with few
EVCS.
A complete PEV charging network will also require fast chargers, which can fully
recharge a BEV in 15 to 30 minutes instead of several hours with less powerful chargers.
When located along major interregional corridors, these chargers can enable long-
42 Center for Sustainable Energy. February 2014 Survey Report, February 19, 2014. Available at http://energycenter.org/clean-vehicle-rebate-project/vehicle-owner-survey/feb-2014-survey.
43 Ibid.
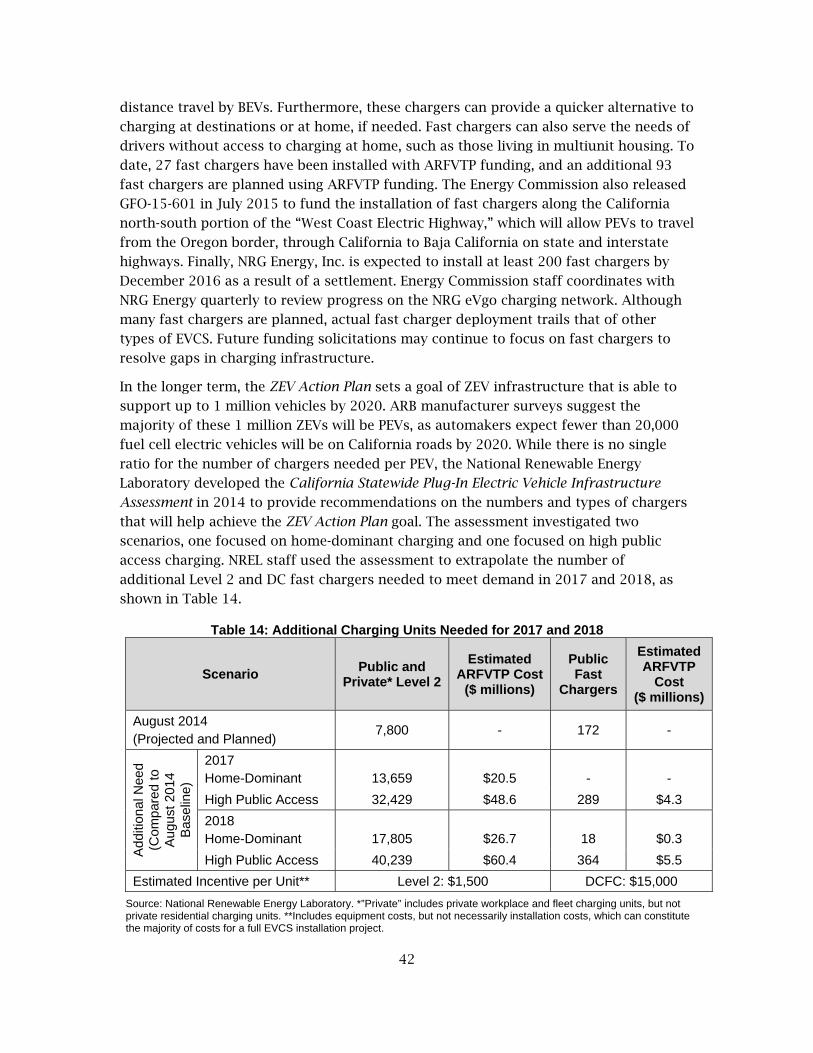
42
distance travel by BEVs. Furthermore, these chargers can provide a quicker alternative to
charging at destinations or at home, if needed. Fast chargers can also serve the needs of
drivers without access to charging at home, such as those living in multiunit housing. To
date, 27 fast chargers have been installed with ARFVTP funding, and an additional 93
fast chargers are planned using ARFVTP funding. The Energy Commission also released
GFO-15-601 in July 2015 to fund the installation of fast chargers along the California
north-south portion of the “West Coast Electric Highway,” which will allow PEVs to travel
from the Oregon border, through California to Baja California on state and interstate
highways. Finally, NRG Energy, Inc. is expected to install at least 200 fast chargers by
December 2016 as a result of a settlement. Energy Commission staff coordinates with
NRG Energy quarterly to review progress on the NRG eVgo charging network. Although
many fast chargers are planned, actual fast charger deployment trails that of other
types of EVCS. Future funding solicitations may continue to focus on fast chargers to
resolve gaps in charging infrastructure.
In the longer term, the ZEV Action Plan sets a goal of ZEV infrastructure that is able to
support up to 1 million vehicles by 2020. ARB manufacturer surveys suggest the
majority of these 1 million ZEVs will be PEVs, as automakers expect fewer than 20,000
fuel cell electric vehicles will be on California roads by 2020. While there is no single
ratio for the number of chargers needed per PEV, the National Renewable Energy
Laboratory developed the California Statewide Plug-In Electric Vehicle Infrastructure
Assessment in 2014 to provide recommendations on the numbers and types of chargers
that will help achieve the ZEV Action Plan goal. The assessment investigated two
scenarios, one focused on home-dominant charging and one focused on high public
access charging. NREL staff used the assessment to extrapolate the number of
additional Level 2 and DC fast chargers needed to meet demand in 2017 and 2018, as
shown in Table 14.
Table 14: Additional Charging Units Needed for 2017 and 2018
Scenario Public and
Private* Level 2
Estimated ARFVTP Cost
($ millions)
Public Fast
Chargers
Estimated ARFVTP
Cost ($ millions)
August 2014 (Projected and Planned)
7,800 - 172 -
Add
ition
al N
eed
(Com
pare
d to
A
ugus
t 201
4 B
asel
ine)
2017 Home-Dominant
13,659
$20.5
-
-
High Public Access 32,429 $48.6 289 $4.3
2018 Home-Dominant
17,805
$26.7
18
$0.3
High Public Access 40,239 $60.4 364 $5.5
Estimated Incentive per Unit** Level 2: $1,500 DCFC: $15,000
Source: National Renewable Energy Laboratory. *”Private” includes private workplace and fleet charging units, but not private residential charging units. **Includes equipment costs, but not necessarily installation costs, which can constitute the majority of costs for a full EVCS installation project.
43
The home-dominant and high public access scenarios can be respectively considered a
low-end and high-end estimate of the number of nonresidential chargers required. The
actual number of chargers required will be determined by consumer preference and
market forces and is likely to fall somewhere between the two estimates. Moreover, not
all of these charging units will necessarily require state funding. Nevertheless, a clear
need for continued incentives is shown in the NREL data since projects receiving fiscal
year 2016-2017 funding will not likely enter service until late 2017 or 2018.
Freight and fleet vehicles present another opportunity for transportation electrification;
however, these vehicles may have special requirements or restrictions for charging
infrastructure. EVCS for fleet vehicles, for example, may be located in areas that cannot
provide public access because of security or safety concerns. In addition, standardized
light-duty EVCS may be inadequate for medium- and heavy-duty freight and transit PEVs
since these vehicles have higher capacity battery systems than those in passenger
vehicles. Medium- and heavy-duty PEV manufacturers have not yet agreed to
standardize EVCS for such vehicles, and many use specialized charging systems, which
can be significantly more expensive than light-duty EVCS.
As the market for PEVs becomes more developed, financing for electric vehicle charging
stations will eventually need to shift from government incentives to private sector
lending. Electric vehicle chargers, however, are a relatively new technology with
uncertain long-term payoffs and risks. This uncertainty may reduce the willingness of
lenders to fund EVCS with competitive financing terms. In an effort to validate the
profitability and feasibility of financing EVCS, the ARFVTP funds the Electric Vehicle
Charging Station Financing Program, which is administered by the California Pollution
Control Financing Authority. This demonstration-scale financing program can be used
by eligible lenders to reduce risk and increase options for financing in-state EVCS. Other
advanced financing mechanisms may also be considered as EVCS technologies and
markets continue to mature.
The ARFVTP has undertaken additional efforts to ensure adequate charging
infrastructure for future PEVs in California, such as allowing recipients to purchase
maintenance plans lasting up to five years using grant funds. By providing prepaid
maintenance from a designated service provider, charger downtime can be minimized in
the event of equipment damage or malfunction. Further activities beyond those
described in this section may be needed to ensure adequate charging infrastructure.
Coordination of and support for the effective deployment of EVCS signage throughout
the state may be necessary to enable long-distance PEV travel. The ARFVTP may also be
able to enhance ARB pilot projects that deploy light-duty PEVs in disadvantaged
communities by funding complimentary electric charging infrastructure projects.
Moreover, there may be future opportunities for the state to demonstrate the value of
vehicle-to-grid technologies in expanding the business case for PEVs.

44
In December 2014, the CPUC adopted Decision D.14-12-079, which permits utility
ownership of EVCS, contingent upon an examination of the utility program through a balancing test.44 A prior CPUC decision had prohibited utility ownership of charging
infrastructure; however, utilities may now apply for ownership approval on a case-
specific basis. To date, three investor-owned utilities have applied to install electric
vehicle chargers or supporting infrastructure in their respective service territories. Table
15 summarizes the objective and status of these programs. In addition, NRG Energy, Inc.
is expected to install 10,000 Level 2 electric vehicle chargers and 200 DC fast chargers
statewide under a settlement with the CPUC. The Energy Commission will closely
monitor developments related to the CPUC rulemaking and applications and other EVCS
projects to continue the strategic deployment of electric vehicle infrastructure under the
ARFVTP. Despite these proposed investments, Energy Commission funding is still
expected to be needed within each of the investor-owned utilities service territories.
Table 15: Proposed and Approved Utility EVCS Investments
Investor-Owned Utility
Proposed # of EVCS
Proposed Type of Infrastructure and Location
Estimated Cost
Status
Pacific Gas and Electric Company*
7,500 L2 100 DCFC
EVCS at Commercial and Public Locations, including Multi-unit Dwellings
$160 million Pending
San Diego Gas & Electric
3,500 EVCS at Workplaces and Multi-unit Dwellings
$45 million Approved
Southern California Edison Company
1,500 Supporting Infrastructure for Customer-Owned EVCS
$22 million Approved
Source: Pacific Gas and Electric Company, San Diego Gas & Electric, and Southern California Edison. *PG&E originally proposed 25,000 L2 and 100 DCFC EVCS; however, the most recent proposed PG&E settlement following a CPUC ruling reduced this to the above-listed amount for a first phase, which is under consideration by the CPUC.
In the most recently completed EVCS solicitation, PON-13-606, the Energy Commission
funded all 41 proposals that received a passing score, awarding a total of $13.7 million
in grants. For FY 2016-2017, the Energy Commission maintains a $17 million allocation
for electric charging infrastructure. This allocation is necessary to keep pace with
expected deployment of PEVs in the state and meet the goals of the ZEV Action Plan as
benchmarked by the California Statewide Plug-In Electric Vehicle Infrastructure
Assessment. Though EVCS investments by utilities are expected to make significant
contributions to EVCS deployment, Energy Commission funding is still necessary, given
that parts of the state do not fall within the service territories of the aforementioned
utility programs, and each utility program is expected to have restrictions on eligible
project types, location, and equipment.
44 California Public Utilities Commission. CPUC Takes Steps to Encourage Expansion of Electric Vehicles. December 18, 2014 Available at http://docs.cpuc.ca.gov/PublishedDocs/Published/G000/M143/K627/143627882.PDF.
45
Hydrogen Refueling Infrastructure Fuel cell electric vehicles (FCEVs), using hydrogen fuel, offer another opportunity for transportation with zero tailpipe emissions. Like electricity, hydrogen can be produced
from a broad variety of pathways, including the use of renewable sources of energy. When produced with one-third renewable energy, the hydrogen for a passenger FCEV
can reduce GHG emissions by 55 to 70 percent compared to gasoline for a conventional vehicle, which is comparable to the GHG emissions benefits of BEVs.45 FCEVs can also
travel farther and be refueled more quickly than BEVs. Fuel cells enable electrification of a broad range of vehicles, from midsize sedans to SUVs, vans, trucks, and transit buses.
For this reason, FCEVs can complement BEVs in the marketplace by offering a portfolio of zero-emission vehicles to drivers who want or need a larger vehicle, more range,
and/or faster refueling.
Several automakers have already announced their near- and long-term plans for launching FCEVs in early markets. In 2014, Hyundai became the first automaker to lease
production model FCEVs to private customers in California. Toyota also released a production FCEV, the Mirai, in October 2015. Moreover, several teams of major
automakers have entered into agreements to further develop FCEVs and related technologies in new or expanded partnerships.46 Toyota and Honda have also offered
loans to hydrogen refueling station provider FirstElement Fuel to support the construction of new hydrogen refueling stations within California.47
The Energy Commission is working with hydrogen station developers to create a network of stations needed to support the initial deployment of hydrogen fuel cell
vehicles from Hyundai, Toyota, and Honda. As of December 2015, 23 hydrogen refueling stations in California were operational, including 14 stations funded by ARFVTP. An
additional 21 stations are expected to come on-line in the first quarter 2016 and 9 more in the second quarter 2016. Through the ARFVTP, the Energy Commission has thus far
provided funding to install or upgrade 49 publicly available hydrogen stations capable of light-duty vehicle refueling. This network of stations will support the initial 10,500
45 Based on a range of potential fuel pathways hydrogen established by the LCFS. This includes an energy economy ratio of for 2.5 FCEVs and a range of 76.1-110.2 grams CO2e/MJ for hydrogen with one-third renewable content. Sources: ARB’s LCFS carbon intensity look-up tables (available at http://www.arb.ca.gov/fuels/lcfs/lu_tables_11282012.pdf) and LCFS Final Regulation Order (available at http://www.arb.ca.gov/fuels/lcfs/CleanFinalRegOrder112612.pdf).
46 “Three Automakers Combine Forces on Fuel-Cell Cars." The New York Times. January 28, 2013. Available at http://wheels.blogs.nytimes.com/2013/01/28/three-automakers-combine-forces-on-fuel-cell-cars/. AutoblogGreen. Honda, GM Fuel-Cell Partnership Wants to Reduce Hydrogen Refueling Cost. February 26, 2014. Available at http://green.autoblog.com/2014/02/26/honda-gm-fuel-cell-partnership-reduce-hydrogen-refueling-costs/. Bloomberg. “Toyota Joins Hydrogen Station Funding Push in California.” May 24, 2014. Available at http://www.bloomberg.com/news/articles/2014-05-01/california-awards-46-6-million-for-hydrogen-car-stations.
47 “Honda to Loan First Element $14 Million for Hydrogen Fueling Stations.” Green Car Reports. November 19, 2014. Available at http://www.greencarreports.com/news/1095563_honda-to-loan-first-element-14-million-for-hydrogen-fueling-stations.
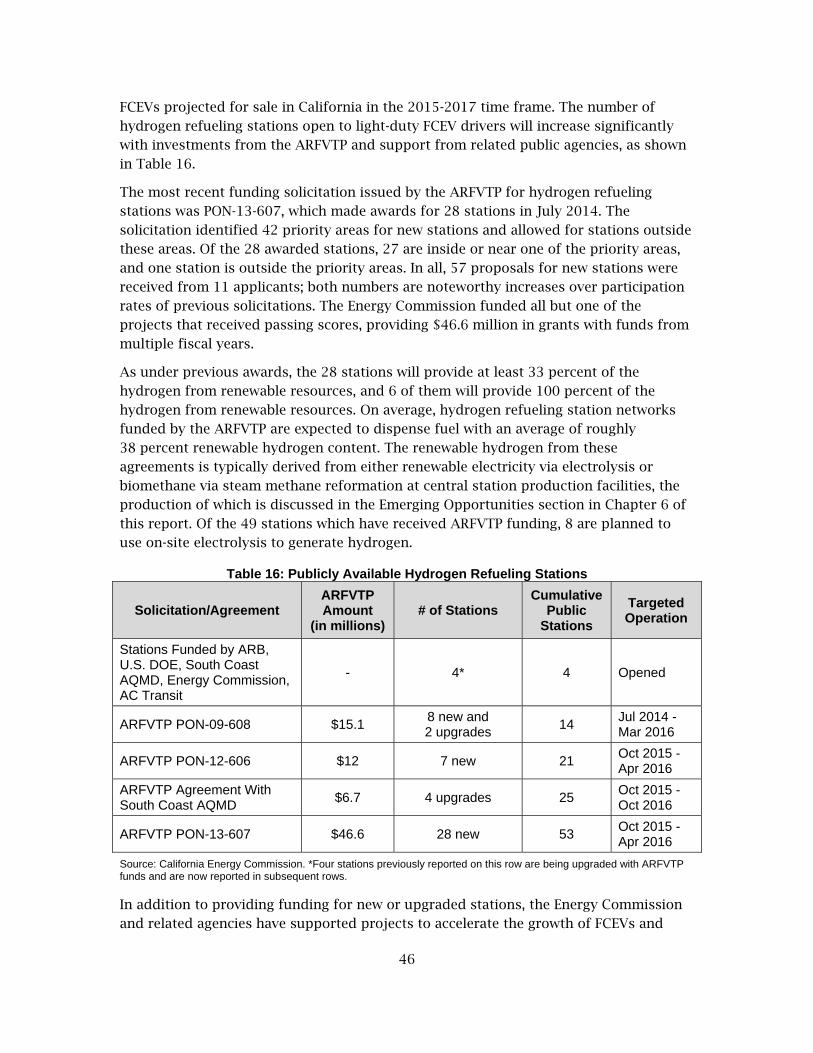
46
FCEVs projected for sale in California in the 2015-2017 time frame. The number of
hydrogen refueling stations open to light-duty FCEV drivers will increase significantly with investments from the ARFVTP and support from related public agencies, as shown
in Table 16.
The most recent funding solicitation issued by the ARFVTP for hydrogen refueling stations was PON-13-607, which made awards for 28 stations in July 2014. The
solicitation identified 42 priority areas for new stations and allowed for stations outside these areas. Of the 28 awarded stations, 27 are inside or near one of the priority areas,
and one station is outside the priority areas. In all, 57 proposals for new stations were received from 11 applicants; both numbers are noteworthy increases over participation
rates of previous solicitations. The Energy Commission funded all but one of the projects that received passing scores, providing $46.6 million in grants with funds from
multiple fiscal years.
As under previous awards, the 28 stations will provide at least 33 percent of the hydrogen from renewable resources, and 6 of them will provide 100 percent of the
hydrogen from renewable resources. On average, hydrogen refueling station networks funded by the ARFVTP are expected to dispense fuel with an average of roughly
38 percent renewable hydrogen content. The renewable hydrogen from these agreements is typically derived from either renewable electricity via electrolysis or
biomethane via steam methane reformation at central station production facilities, the production of which is discussed in the Emerging Opportunities section in Chapter 6 of
this report. Of the 49 stations which have received ARFVTP funding, 8 are planned to use on-site electrolysis to generate hydrogen.
Table 16: Publicly Available Hydrogen Refueling Stations
Solicitation/Agreement ARFVTP Amount
(in millions) # of Stations
Cumulative Public
Stations
Targeted Operation
Stations Funded by ARB, U.S. DOE, South Coast AQMD, Energy Commission, AC Transit
- 4* 4 Opened
ARFVTP PON-09-608 $15.1 8 new and 2 upgrades
14 Jul 2014 -Mar 2016
ARFVTP PON-12-606 $12 7 new 21 Oct 2015 - Apr 2016
ARFVTP Agreement With South Coast AQMD
$6.7 4 upgrades 25 Oct 2015 - Oct 2016
ARFVTP PON-13-607 $46.6 28 new 53 Oct 2015 - Apr 2016
Source: California Energy Commission. *Four stations previously reported on this row are being upgraded with ARFVTP funds and are now reported in subsequent rows.
In addition to providing funding for new or upgraded stations, the Energy Commission and related agencies have supported projects to accelerate the growth of FCEVs and
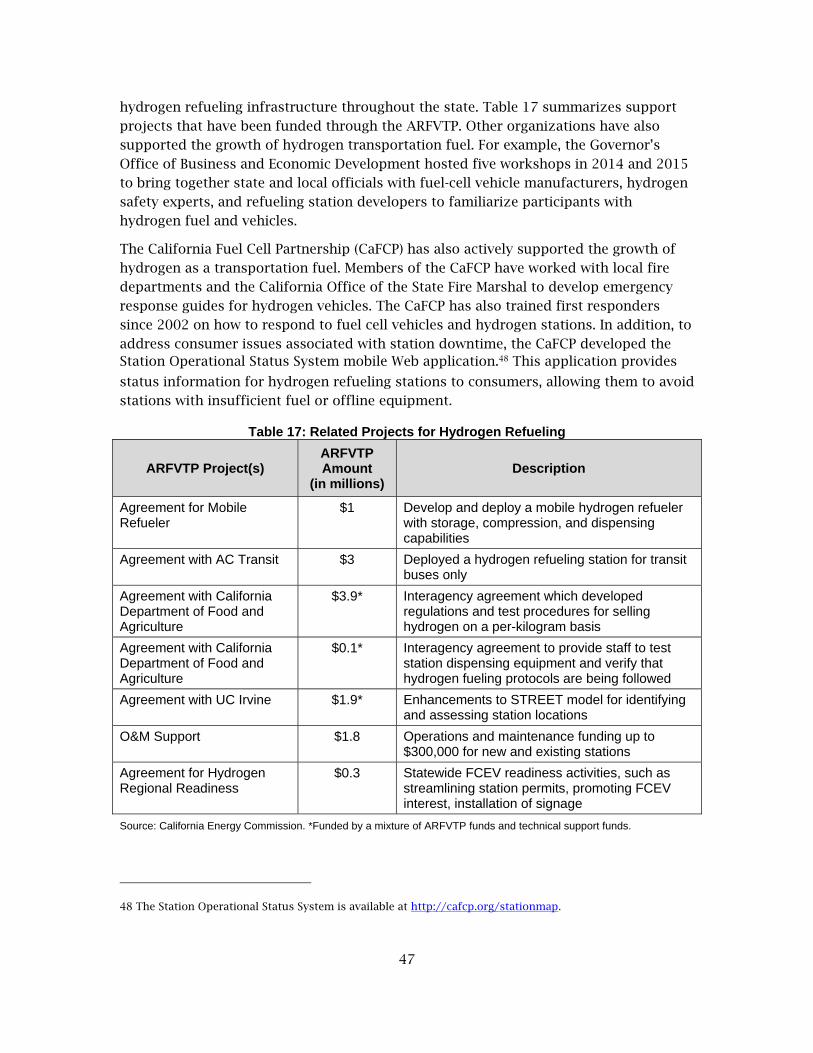
47
hydrogen refueling infrastructure throughout the state. Table 17 summarizes support
projects that have been funded through the ARFVTP. Other organizations have also supported the growth of hydrogen transportation fuel. For example, the Governor’s
Office of Business and Economic Development hosted five workshops in 2014 and 2015 to bring together state and local officials with fuel-cell vehicle manufacturers, hydrogen
safety experts, and refueling station developers to familiarize participants with hydrogen fuel and vehicles.
The California Fuel Cell Partnership (CaFCP) has also actively supported the growth of
hydrogen as a transportation fuel. Members of the CaFCP have worked with local fire departments and the California Office of the State Fire Marshal to develop emergency
response guides for hydrogen vehicles. The CaFCP has also trained first responders since 2002 on how to respond to fuel cell vehicles and hydrogen stations. In addition, to
address consumer issues associated with station downtime, the CaFCP developed the Station Operational Status System mobile Web application.48 This application provides
status information for hydrogen refueling stations to consumers, allowing them to avoid stations with insufficient fuel or offline equipment.
Table 17: Related Projects for Hydrogen Refueling
ARFVTP Project(s) ARFVTP Amount
(in millions) Description
Agreement for Mobile Refueler
$1 Develop and deploy a mobile hydrogen refueler with storage, compression, and dispensing capabilities
Agreement with AC Transit $3 Deployed a hydrogen refueling station for transit buses only
Agreement with California Department of Food and Agriculture
$3.9* Interagency agreement which developed regulations and test procedures for selling hydrogen on a per-kilogram basis
Agreement with California Department of Food and Agriculture
$0.1* Interagency agreement to provide staff to test station dispensing equipment and verify that hydrogen fueling protocols are being followed
Agreement with UC Irvine $1.9* Enhancements to STREET model for identifying and assessing station locations
O&M Support $1.8 Operations and maintenance funding up to $300,000 for new and existing stations
Agreement for Hydrogen Regional Readiness
$0.3 Statewide FCEV readiness activities, such as streamlining station permits, promoting FCEV interest, installation of signage
Source: California Energy Commission. *Funded by a mixture of ARFVTP funds and technical support funds.
48 The Station Operational Status System is available at http://cafcp.org/stationmap.

48
Assembly Bill 8 requires the ARB to evaluate the need annually for additional publicly
available hydrogen-fueling stations for the subsequent three years. This evaluation
includes quantity of fuel needed for the actual and projected number of hydrogen-
fueled vehicles (based on DMV registrations and automaker projections), geographic
areas where fuel will be needed, and station coverage. Based on this evaluation, ARB
reports to the Energy Commission the number of stations, geographic areas where
additional stations will be needed, and minimum operating standards, such as number
of dispensers, filling protocols, and pressure.
ARB released the 2015 Annual Evaluation of Fuel Cell Electric Vehicle Deployment and Hydrogen Fuel Station Network Development in July 2015.49 Based on automaker
responses, the 2015 analysis indicated the number of hydrogen-fueled vehicles in
California may increase more rapidly than previously projected, reaching 10,500
vehicles by the end of 2018 and 34,400 vehicles by the end of 2021. The estimate for
2021 is nearly double last year’s estimate for 2020 of 18,465 vehicles. The annual
evaluation uses these vehicle projections to project the future adequacy of hydrogen
fueling station capacity and coverage. This year’s report anticipates the funded stations
will be sufficient to meet demand only through 2017, with several counties experiencing
capacity shortfalls as early as 2018. Assuming continued investment in hydrogen
stations at the maximum of $20 million per year, the evaluation projects sufficient
capacity through 2020, with statewide supply shortfalls beginning in 2021.
The annual evaluation is also complemented by a separate Energy Commission-ARB
joint report, titled Joint Agency Staff Report on Assembly Bill 8 Report: Assessment of
Time and Cost Needed to Attain 100 Hydrogen Fueling Stations in California. The joint
report evaluates progress in establishing a network of 100 hydrogen refueling stations,
the factors resulting in current high station cost, the potential for future station cost
reductions, how much time and public funding will be needed to reach the 100-station
milestone, and the ability of the hydrogen refueling network to serve the anticipated
34,000 FCEVs projected by the end of 2021.
The joint report found that overall hydrogen refueling station development timelines
have decreased from an average of 4.9 years for stations funded in 2009 to 1.6 years for
the six operational stations funded in 2013. The costs for early market hydrogen
refueling stations remain high, ranging from $2.1 million to more than $3 million, and
are not expected to decrease significantly in the near term. The joint report concludes
that California will attain the 100 hydrogen refueling station goal between 2020 and
2024, and that $160 million to $170 million in cumulative ARFVTP funding will be
needed. The report also expects that current ARFVTP funding for hydrogen refueling
49 California Air Resources Board. 2015 Annual Evaluation of Fuel Cell Electric Vehicle Deployment and Hydrogen Fuel Station Network Development. July 2015. Available at http://www.arb.ca.gov/msprog/zevprog/ab8/ab8_report_2015.pdf.
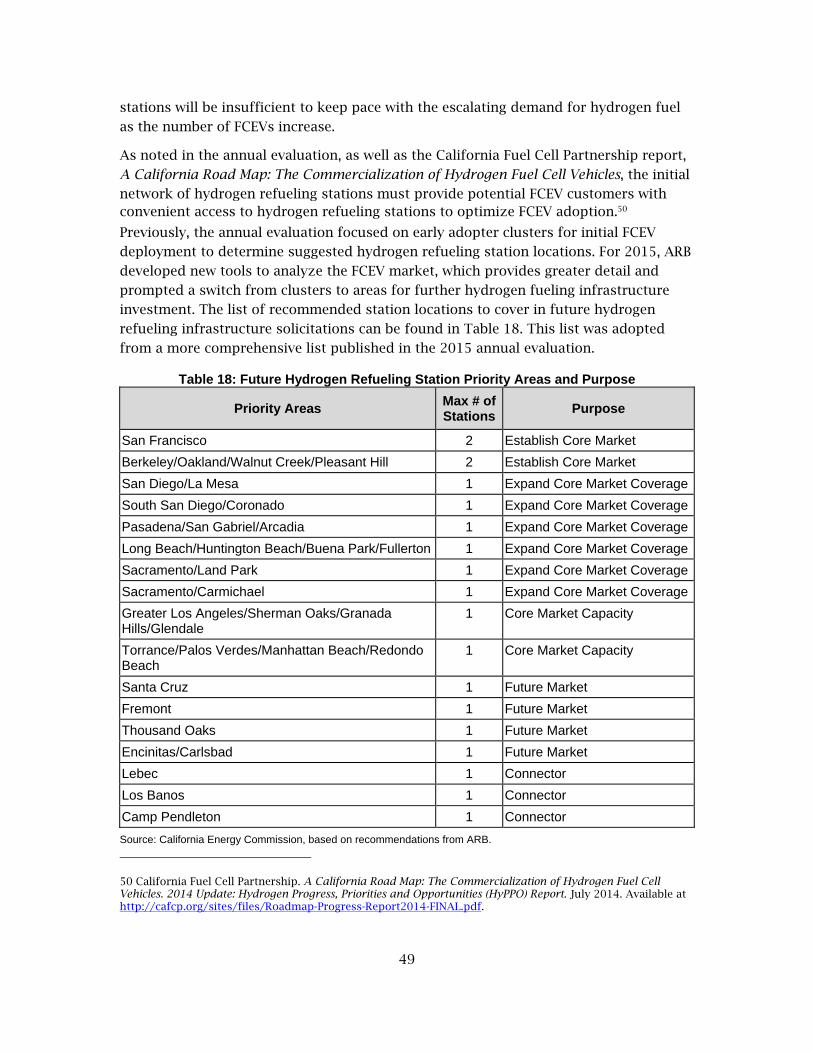
49
stations will be insufficient to keep pace with the escalating demand for hydrogen fuel
as the number of FCEVs increase.
As noted in the annual evaluation, as well as the California Fuel Cell Partnership report,
A California Road Map: The Commercialization of Hydrogen Fuel Cell Vehicles, the initial
network of hydrogen refueling stations must provide potential FCEV customers with convenient access to hydrogen refueling stations to optimize FCEV adoption.50
Previously, the annual evaluation focused on early adopter clusters for initial FCEV
deployment to determine suggested hydrogen refueling station locations. For 2015, ARB
developed new tools to analyze the FCEV market, which provides greater detail and
prompted a switch from clusters to areas for further hydrogen fueling infrastructure
investment. The list of recommended station locations to cover in future hydrogen
refueling infrastructure solicitations can be found in Table 18. This list was adopted
from a more comprehensive list published in the 2015 annual evaluation.
Table 18: Future Hydrogen Refueling Station Priority Areas and Purpose
Priority Areas Max # of Stations
Purpose
San Francisco 2 Establish Core Market
Berkeley/Oakland/Walnut Creek/Pleasant Hill 2 Establish Core Market
San Diego/La Mesa 1 Expand Core Market Coverage
South San Diego/Coronado 1 Expand Core Market Coverage
Pasadena/San Gabriel/Arcadia 1 Expand Core Market Coverage
Long Beach/Huntington Beach/Buena Park/Fullerton 1 Expand Core Market Coverage
Sacramento/Land Park 1 Expand Core Market Coverage
Sacramento/Carmichael 1 Expand Core Market Coverage
Greater Los Angeles/Sherman Oaks/Granada Hills/Glendale
1 Core Market Capacity
Torrance/Palos Verdes/Manhattan Beach/Redondo Beach
1 Core Market Capacity
Santa Cruz 1 Future Market
Fremont 1 Future Market
Thousand Oaks 1 Future Market
Encinitas/Carlsbad 1 Future Market
Lebec 1 Connector
Los Banos 1 Connector
Camp Pendleton 1 Connector
Source: California Energy Commission, based on recommendations from ARB.
50 California Fuel Cell Partnership. A California Road Map: The Commercialization of Hydrogen Fuel Cell Vehicles. 2014 Update: Hydrogen Progress, Priorities and Opportunities (HyPPO) Report. July 2014. Available at http://cafcp.org/sites/files/Roadmap-Progress-Report2014-FINAL.pdf.
50
In addition to funding for infrastructure development, the Energy Commission
recognizes the need for operation and maintenance (O&M) funding for the initial
network of hydrogen refueling stations. This funding improves the business case of
station developers who build and operate stations prior to the mass introduction of
FCEVs and should sustain the stations until profitable. In the previous solicitation, the
Energy Commission offered up to $300,000 for three years’ worth of O&M funding for
each existing or planned station, once operational. As of August 2015, 15 stations have
been eligible for this funding. This number will increase to about 50 as recently funded
hydrogen refueling stations come on-line in the next few years.
This increase will be most notable during fiscal years 2015/2016, 2016/2017, and
2017/2018. Assuming all stations are completed as expected, and $100,000 per station
is available each year for O&M support for the new stations, the ARFVTP might provide
roughly $5 million to $6 million per year in O&M support in each of these three fiscal years.51 The O&M support is expected to reduce the amount of funding available for new
hydrogen station development by roughly two to four stations per fiscal year, to an
estimated seven or eight stations. Given the potential for future shortfalls in station
capacity, the Energy Commission will continue discussions with ARB and stakeholders
to ensure that all available funding for hydrogen refueling is used in the most effective
manner for encouraging early FCEV adoption.
If the average Energy Commission share of station infrastructure development cost
remains at $1.8 million to $2.1 million for each station, and one year’s worth of O&M
funding is needed for all of the stations operational in FY 2016/2017, the Energy
Commission estimates that a $20 million allocation will be able to fund the installation
of roughly seven new stations. This scenario is expected to result in capacity shortfalls
by 2021 and delay the completion of the initial network of 100 stations until 2023. To
avoid such situations, the Energy Commission may alter the requirements and funding
structure of future solicitations, such as offering incentives for higher capacity and
more cost-effective stations. The Energy Commission may also consider alternative
financing mechanisms and options to further encourage private investment as the
market for hydrogen fuel matures. Legacy stations, which have outdated or inoperable
equipment, may also be eligible for upgrade funding to return the stations to full
usability.
For FY 2016-2017, the Energy Commission allocates the maximum of $20 million
permitted under AB 8 for hydrogen refueling infrastructure. This funding will provide
O&M support for operational stations and continue the deployment of hydrogen
refueling infrastructure in preparation for increased FCEV sales.
51 The amount of funding to be provided for O&M support for future stations is still under evaluation. To the extent that O&M costs are less than estimated, or station operators are able to recoup O&M costs from increasing retail sales, the amount may be reduced in the future.
51
Natural Gas Fueling Infrastructure Natural gas vehicles in California depend on a mix of public and private fueling stations
capable of dispensing compressed natural gas (CNG) and/or liquefied natural gas (LNG).
California leads the United States in the number of CNG and LNG fueling stations, with
more than 500 public or private CNG stations and roughly 45 public or private LNG stations.52 Relative to most other alternative fuels, natural gas fueling is commercially
mature and relies on an existing natural gas pipeline infrastructure throughout the
state.
The cost of a natural gas fueling station depends on many factors, including compressor
size, storage capacity, and LNG or CNG dispensing capabilities. Costs generally range
from $500,000 for smaller CNG-only stations to several million dollars for large
combined LNG-CNG fueling stations. Based on this range of costs and the needs of
funding recipients, the Energy Commission has offered up to $500,000 in ARFVTP
funding to support CNG stations and up to $600,000 for stations dispensing LNG.
Particularly in the case of private stations for individual fleets, the cost of installing a
natural gas fueling station can be built into the long-term fuel savings that result from
switching to natural gas vehicles. Other financing methods, such as the Compression
Services Tariff offered by the Southern California Gas Company (SoCal Gas), are also
available. This tariff allows SoCal Gas to plan, design, procure, construct, own, operate,
and maintain compression equipment on customer premises in exchange for a fee on
natural gas dispensed. As the cost of compressors can range from 25 to 50 percent of
the total station cost, financing methods such as this may be viable solution to pay for
station costs. The ability of many station operators to obtain financing is reflected in
recent investment plans, with funding allocations for natural gas vehicles significantly
higher than funding allocations for fueling infrastructure.
For this reason, the Energy Commission has prioritized its ARFVTP natural gas fueling
infrastructure funding toward entities that may not have access to the necessary capital
for such long-term investments. The most recent solicitation for natural gas fueling
infrastructure projects, PON-14-608, limited applicants exclusively to public K-12 school
districts and other public entities located in California. Of the 13 applicants that
received funding under this solicitation, 10 were California school districts, and 3 were
other public entities such as California cities and sanitary districts. These 13 awards,
totaling nearly $5.5 million, represented all the qualifying applications received during
the solicitation. Future natural gas fueling infrastructure solicitations will likely
continue to limit applicants to school districts and municipal governments to assist in
the conversion or replacement of older diesel vehicles. This will provide public health
52 Comments submitted by California Natural Gas Vehicle Coalition to Energy Commission docket 14-ALT-01, TN 74034. November 21, 2014.
52
benefits, most notably to school children, who are disproportionately affected by the
emissions of these vehicles and are more susceptible to the adverse effects of pollutant
exposure.
Conventional natural gas may offer modest GHG reductions compared to gasoline and
diesel and has been an early source of GHG reductions for ARFVTP investments. In the
NREL benefits analysis of the ARFVTP, natural gas fueling infrastructure accounted for
about two-thirds of the estimated near-term GHG reduction benefits under the fueling
infrastructure category, despite a comparatively small ARFVTP investment of $21
million to install 54 CNG and 11 LNG stations. This result is due primarily to the high
amount of fuel dispensed, as well as the small number of stations that are dispensing
renewable natural gas. The potential for upstream methane leakage, however, risks
undermining any GHG advantages of conventional natural gas. In addition, as diesel
engines have become cleaner, natural gas may no longer provide any significant NOX
reduction benefits, except in the case of low NOX engines. These issues are discussed in
greater depth in the Natural Gas Vehicles section, although the same concerns apply to
natural gas fueling infrastructure.
Despite the above mentioned concerns, the risk of methane leakage is significantly
reduced with the use of biomethane. Unlike conventional natural gas, biomethane can
have one of the lowest carbon intensities of any alternative fuel and is often produced at
or near the point of fuel distribution. Given these considerations, future natural gas
fueling infrastructure solicitations may place a greater emphasis on or contain specific
requirements for the incorporation of biomethane.
In FY 2015-2016, the Energy Commission allocated $5 million to natural gas
infrastructure, which was more than triple the amount allocated for FY 2014-2015. This
level of funding was not intended to continue in subsequent years, but rather was meant
to provide a purposeful opportunity for school districts and municipal governments to
upgrade out-of-date infrastructure. In using this funding in the most recent natural gas
infrastructure solicitation, PON-14-608, the Energy Commission was able to fund all
eligible projects, totaling 13 grants for $5.5 million.
For FY 2016-2017, the Energy Commission allocates $2.5 million for natural gas fueling
infrastructure. Staff believes future demand for natural gas infrastructure funding will
be adequately served by the funding levels proposed in this investment plan update.
While natural gas is expected to continue to play a role in reducing emissions and
petroleum use, the fuel is maturing, and ARFVTP incentives have less of an effect as
other financing options become available.

53
Summary of Alternative Fuel Infrastructure Allocations
Table 19: FY 2016-2017 Funding for Alternative Fuel Infrastructure Electric Charging Infrastructure Relevant Policy Goals:
GHG Reduction
Petroleum Reduction
Low-Carbon Fuel Standard
Air Quality
ZEV Mandate
$17 Million No change relative to FY 2015-2016
Hydrogen Refueling Infrastructure Relevant Policy Goals:
GHG Reduction
Petroleum Reduction
Low-Carbon Fuel Standard
Air Quality
ZEV Mandate
$20 Million No change relative to FY 2015-2016
Natural Gas Fueling Infrastructure Relevant Policy Goals:
Petroleum Reduction
Air Quality
Low-Carbon Fuel Standard
GHG Reduction (with incorporation of biomethane)
$2.5 Million $2.5 million decrease relative to FY 2015-2016
Total $39.5 Million
Source: California Energy Commission.

54
CHAPTER 5: Alternative Fuel and Advanced Technology Vehicles
Medium- and Heavy-Duty Vehicle Technology Demonstration and Scale-Up Medium- and heavy-duty vehicles, defined here as vehicles with a gross vehicle weight
rating (GVWR) above 10,000 lbs., represent a small share of California registered vehicle stock: about 952,000 out of 29.1 million, or 3 percent.53 Because of the lower fuel
efficiency and higher number of miles traveled per year, medium- and heavy-duty vehicles are responsible for about 23 percent of on-road GHG emissions.54 For this
reason, they represent a significant opportunity to reduce GHG emissions while focusing
on a comparatively small number of vehicles.
In addition to reducing GHG emissions, transitioning to zero- and near-zero-emission
medium- and heavy-duty vehicles will provide significant air quality benefits, especially
near ports and along freight corridors that have high traffic of these vehicles. Executive
Order B-32-15, issued by Governor Brown in July 2015, notes the effects that freight
transportation has on GHG emissions and air quality and orders the development of a
plan to improve freight efficiency, transition to zero-emission technologies, and increase
the competitiveness of the California freight system. The Energy Commission is also
working in collaboration with five ports throughout California, including the ports of
Hueneme, Long Beach, Los Angeles, Oakland, and San Diego. The collaboration will
identify and implement transportation project concepts that help attain California’s
climate and clean air goals while meeting the needs of the ports. ARFVTP funding under
this category will be necessary to support sustainable freight and implement the
objectives of Executive Order B-32-15, and is expected to support the ports collaborative
efforts.
Providing zero- and near-zero-emission options for medium- and heavy-duty vehicles is
challenging, however, because the fuel and technology must be closely matched to the
needs of the particular vehicle application. For example, a low-emission solution such as
a hybrid electric system might be appropriate for urban delivery trucks with many stops
53 Based on analysis from California Energy Commission Demand Analysis Office, with data from California Department of Motor Vehicles.
54 California Air Resources Board. California Greenhouse Gas Inventory for 2000-2013. April 24, 2015. Available at http://www.arb.ca.gov/cc/inventory/data/tables/ghg_inventory_scopingplan_2000-13_20150424_1.pdf.

55
and starts but will provide little benefit to long-haul trucks. Similarly, a battery electric
system might be appropriate for a vehicle that can recharge all night but inappropriate
for trucks that operate at irregular hours or have unpredictable travel routes. Providing
the right solution for the right application is, therefore, a key element in reducing GHG
emissions from this vehicle sector. Though certain fuels and technologies may result in
lower per-vehicle emission reductions than those of ZEV technologies, they nevertheless
provide an early market, cost-effective option for emission reductions when such
advanced technologies are not practical.
The Energy Commission has provided $93.7 million in ARFVTP funding for a wide
variety of fuel and technology types that can be incorporated into California trucks and
buses. Table 20 summarizes the portfolio of advanced vehicle technology
demonstration projects that the ARFVTP has supported in the medium- and heavy-duty
vehicle sector. Financial support for demonstration and precommercial projects can lead
to reduced costs for future generations of advanced technology vehicles. Furthermore,
by demonstrating the feasibility and reliability of such technologies in the field, these
projects can increase interest from potential fleet adopters. The projects can also
inform the development of future standards for truck emission reductions and fuel efficiency.55
Table 20: Demonstration Projects Supported by ARFVTP
Vehicle/Technology Type # of
Projects# of Units
ARFVTP Funding(in millions)
Medium-Duty Hybrids, PHEVs and BEVs 8 164 $15.8
Heavy-Duty Hybrids, PHEVs and BEVs 10 30 $23.3
Electric Buses 7 35 $14.6
Natural Gas Trucks 5 11 $11.3
Fuel Cell Trucks and Buses 7 13 $14.5
Vehicle-to-Grid 4 6 $7.0
Off-Road Hybrids 2 2 $4.5
E85 Hybrids 1 1 $2.7
Total 44 262 $93.7
Source: California Energy Commission.
The most recent solicitation for medium- and heavy-duty advanced vehicle technology
demonstration projects, PON-14-605, was released in December 2014. The solicitation
55 Through their jointly developed Heavy-Duty National Program, the U.S. Environmental Protection Agency and the National Highway Transportation Safety Administration have developed a five-year plan for reducing GHG emissions and improving fuel efficiency among medium- and heavy-duty vehicles for model years 2014-2018. The next phase of standards, extending beyond model year 2018, is expected by March 2016.

56
provided more than $31 million to 11 projects, which will demonstrate precommercial
alternative fuel engines and propulsion technologies in vehicles with a gross vehicle
weight of more than 10,000 pounds. Seventeen additional qualifying proposals
requesting $40 million were received but could not be funded, which resulted in an
oversubscription rate of 130 percent for the solicitation. Projects funded under PON-14-
605 included several innovative vehicle types that have not previously been funded by
the ARFVTP, such as all-electric refuse trucks, hydrogen fuel cell Class 8 drayage trucks,
and natural gas-powered armored cargo vehicles. In addition, all projects funding under
this solicitation are being conducted in disadvantaged communities, as determined by
the CalEnviroScreen 2.0 tool.
The majority of qualified projects submitted to PON-14-605 requested awards at or near
the maximum funding levels. While earlier solicitations predominantly funded hybrid
and medium-duty vehicles, the technologies and powertrain capabilities available to
vehicle manufacturers have progressed. Many of the projects funded through PON-14-
605 are demonstrating zero-emission powertrain technologies in the early stages of
commercialization or are installing advanced powertrains in larger and more capable
vehicles. While projects funded by this category are expected to significantly reduce
GHG and criteria pollutant emissions on a unit basis, thereby providing public health
benefits, the vehicles have much higher differential costs than conventional gasoline or
diesel vehicles. Supporting advanced technology vehicles at these early development
stages when the differential cost is high may be costly, but it will increase the likelihood
of further development. As the vehicle technologies and markets mature, owners and
operators will be able to undertake larger demonstration and deployment projects,
further reducing emissions. Eventually the most promising and suitable vehicle
technologies will reach commercial maturity, allowing the vehicles to have a significant
impact on statewide GHG emissions and criteria pollution.
In future solicitations, the Energy Commission may consider opening ARFVTP funding
for enabling technology development and demonstration projects that do not
necessarily involve propulsion. Examples of such projects may include intelligent
transportation systems and autonomous vehicle demonstrations, which can reduce
emissions and fuel use without requiring alternative fuel systems. Future solicitations
may also focus on freight corridors in an effort to comprehensively reduce emissions
and petroleum use and improve sustainability. These projects may include both
propulsion and nonpropulsion aspects, such as alternative fuel vehicles, infrastructure,
and other advanced freight technologies.
The large power sources in medium- and heavy-duty battery and fuel cell electric
vehicles may be able to serve as a vehicle-to-grid asset for load balancing and disaster
response. To assess the economic and technical viability of PEVs participating in vehicle-
to-grid services, the Energy Commission funded a vehicle-to-grid demonstration project
at the Los Angeles Air Force Base. The demonstration project converted a portion of the
nontactical vehicle fleet to PEVs that are capable of optimizing vehicle-grid interactions

57
to capitalize on demand response and ancillary services markets. Data collected from
this project will support the vehicle-to-grid use of PEVs and associated technologies in
California.
Many alternatively fueled medium- and heavy-duty vehicles also require specialized
refueling infrastructure. For example, while light-duty electric vehicles use standard
Level 1, Level 2, or DC fast chargers, heavy-duty electric vehicles often require systems
that provide significantly higher voltage and power levels. In past solicitations, this
refueling infrastructure was not eligible for funding. Since specialized refueling
infrastructure can add significant cost and affect the financial viability of demonstration
projects, the Energy Commission may consider making this infrastructure eligible for
funding in combination with the associated vehicles.
In December 2015, the Energy Commission hosted a Lead Commissioner Technology
Merit Review Workshop for medium- and heavy-duty vehicles. Manufacturers and
assemblers of alternative fuel vehicles and components participated in the workshop,
providing overviews of ARFVTP-funded projects and discussing the key elements of
project success. The discussion indicated that many alternative fueled vehicle types
have progressed from the proof-of-concept phase to an early adopter phase of
development, allowing manufacturers to reach a larger market.
While the Energy Commission has focused its ARFVTP funding on demonstration
projects, the Hybrid and Zero-Emission Truck and Bus Voucher Incentive Project (HVIP)
administered by the ARB provides deployment incentives for hybrid, battery electric,
and fuel cell trucks and buses. These two activities are regularly coordinated to ensure
that applicants are not “double-dipping” into both funding sources, as well as to
promote the ability of funding recipients to graduate from small-scale demonstration
projects to full-scale deployment projects over time. Since its launch in 2010, HVIP has
provided $70 million in incentives to help California fleets purchase about 450 zero-
emission trucks and buses and 2,000 hybrid trucks, with each incentive averaging $28,773.56
In addition to the HVIP, ARB also funds other heavy-duty vehicle demonstration and
deployment projects through its Low-Carbon Transportation Investments. Senate Bill
1204 (Lara, Chapter 524, Statutes of 2014) allows ARB to fund development,
demonstration, precommercial pilot, and early commercial deployment of zero- and
near-zero-emission truck, bus, and off-road vehicle and equipment technologies. The
Energy Commission will continue to monitor and consider future GGRF allocations when
developing the ARFVTP investment plan update and solicitations.
56 California Air Resources Board. Discussion Document for the Third Public Workshop on the Development of the Fiscal Year (FY) 2016-17 Funding Plan for Low Carbon Transportation Investments and the Air Quality Improvement Program (AQIP). March 25, 2016. Available at http://www.arb.ca.gov/msprog/aqip/meetings/040416_discussion_doc.pdf.
58
Any influx of new funds will improve the ability of ARFVTP awardees to shift from
initial vehicle demonstrations toward greater commercialization. The pilot and
demonstration projects funded under GGRF target medium- to large-scale projects. By
comparison, ARFVTP-funded demonstration projects focus on smaller numbers of
vehicles per project, as reflected in Table 20. Accordingly, ARFVTP funding is needed to
support demonstration projects for advanced technologies that are not yet able to scale
up to the larger projects funded through the ARB Low-Carbon Transportation
Investments.
Unlike major vehicle manufacturers with broader access to private financing and larger
federal programs, these companies often seek Energy Commission support to bridge the
span between initial capital funding for prototype development and revenue from early
commercialization. Unless this financing is paired with additional funding to expand
manufacturing after successful demonstrations, companies may find themselves unable
to advance from small demonstrations funded by the ARFVTP and larger precommercial
deployment activities funded by the ARB. For this reason, the Energy Commission
merged the previous Manufacturing Facilities, Equipment, and Working Capital
allocation into this category, beginning with the FY 2015-2016 Investment Plan Update.
The broadened scope of this allocation will provide applicants an opportunity to
conduct small-scale demonstration projects, with the possibility to scale-up or retool
manufacturing or assembly lines, as appropriate.
For FY 2016-2017, the Energy Commission allocates $23 million for this category. This
increased allocation relative to previous years is appropriate based on the significant
oversubscription of previous solicitations. Additional funding for this category is also
necessary to adequately address upcoming sustainable freight activities, nonpropulsion
technologies, and the higher costs associated with more advanced powertrains and more
capable vehicles. Solicitations funded with this allocation are expected to focus on the
demonstration and scale-up of advanced vehicles and technologies for freight, as
sustainable freight is expected to play a more prominent role in achieving California
GHG and criteria pollutant emission reduction goals. The additional funding will also be
needed if future solicitations fund specialized refueling infrastructure.
Natural Gas Vehicles Natural gas vehicles represent a readily available and economically competitive
nonpetroleum alternative fuel. Medium- and heavy-duty natural gas vehicles represent
the largest number of alternative fuel vehicles in each class, with more than 17,000 on
California roads; however, this is still fewer than 2 percent of all such vehicles.
Furthermore, there are more than 25,000 light-duty natural gas cars, trucks, and vans within the state.57 While gasoline and diesel fuel prices have fluctuated in recent years,
57 Based on analysis from the California Energy Commission Demand Analysis Office, with data from the California Department of Motor Vehicles.

59
the retail price of CNG has stabilized at lower levels. In October 2015, the average price
of CNG per diesel-gallon equivalent (DGE) in West Coast states was roughly $2.68,
compared to $2.80 per gallon of diesel, resulting in a favorable price difference of $0.12 per DGE.58 While still advantageous, this is one-tenth the price difference seen in
October 2014 and may negatively affect the cost-effectiveness of natural gas vehicles.
As a result, vehicle owners may be less likely to shift from conventional fuels to CNG,
while the price of petroleum fuels remains low. Fleets, however, may be able to obtain
significantly lower CNG prices than those offered at retail stations by contracting directly with local natural gas providers.59 Energy Commission staff will continue to
monitor the price difference between CNG and gasoline, including how it affects the
need for incentives and demand for CNG vehicles.
In response to growing supply and demand for natural gas, the Legislature passed
Assembly Bill 1257 (Bocanegra, Chapter 749, Statutes of 2013), also referred to as the
“Natural Gas Act.” This law tasks the Energy Commission with developing a report to
“identify strategies to maximize the benefits obtained from natural gas, including
biomethane for purposes of this section, as an energy source, helping the state realize the environmental costs and benefits afforded by natural gas.”60 This includes the use of
natural gas as a fuel within the transportation sector. The Energy Commission held two
workshops in 2015 to seek comments on how natural gas and biomethane will affect the transportation sector, as well as development of the 2015 AB 1257 report in general.61
The first of these reports was completed by November 1, 2015, and the report will be
updated every four years thereafter.
In September 2015, the ARB readopted the LCFS, which included a switch from
California Greenhouse Gases, Regulated Emissions, and Energy Use in Transportation
Model (CA-GREET) 1.8b to CA-GREET 2.0. As part of the revised calculations in CA-
GREET 2.0, the carbon intensity values for conventional natural gas have increased
because of higher pipeline energy intensity, higher methane leakage estimates, and higher tailpipe emissions.62 Though the revised carbon intensity value for CNG is less
58 U.S. Department of Energy, Clean Cities Alternative Fuel Report, October 2015. Available athttp://www.afdc.energy.gov/uploads/publication/alternative_fuel_price_report_october_2015.pdf.
59 U.S. Department of Energy, Clean Cities Alternative Fuel Report, July 2015. Available at http://www.afdc.energy.gov/uploads/publication/alternative_fuel_price_report_july_2015.pdf.
60 California Public Resources Code Section 25303.5(b).
61 Presentations, comments, and the transcript from this workshop are available at http://www.energy.ca.gov/2014_energypolicy/documents/#06232014.
62 CA-GREET 1.8b lists EER-adjusted carbon intensity values of 98.03 g/MJ for ultra-low sulfur diesel and 75.57 g/MJ for North American CNG. Data obtained from the California Air Resources Board’s CA-GREET 1.8b versus 2.0 CI Comparison Table, available at http://www.arb.ca.gov/fuels/lcfs/lcfs_meetings/040115_pathway_ci_comparison.pdf. CA-GREET 2.0 lists EER-Adjusted (0.9 EER for natural gas) carbon intensity values of 102.01 g/MJ for ultra-low
60
beneficial than previously assumed, it still provides GHG reductions compared to
gasoline and diesel fuel. These life-cycle GHG emissions can also be significantly
reduced with the introduction of biomethane, which possesses some of the lowest
carbon intensity values established by the LCFS. CNG from wastewater biogas offers life-
cycle GHG emission reductions of as much as 92 percent compared to diesel, while
biomethane derived from high solids anaerobic digestion can reduce life-cycle GHG emissions by upward of 125 percent.63 Biomethane use for transportation has steadily
increased, accounting for 49 percent of natural gas LCFS credits in the second quarter of
2015. The potential for in-state fuel production is high, and companies offer renewable
natural gas products on a commercial basis, such as Redeem by Clean Energy Fuels.
Redeem is advertised as a renewable natural gas product with up to 90 percent lower
carbon emissions than diesel fuel.
Ongoing research into methane leakage from production and transmission
infrastructure will provide opportunities to further refine the GHG emission reduction
potential of natural gas and biomethane, as well as the potential to identify and
eliminate fugitive methane emissions in the future. The Environmental Defense Fund,
for instance, is partnering with multiple universities, natural gas producers, and utilities to identify the extent of methane leakage throughout the natural gas supply chain.64
Natural gas vehicles may also offer the opportunity for lower criteria pollution
emissions. Though natural gas trucks historically held an edge in reduced NOX and other
emissions, the 2010 diesel emission standards have made emissions from the two fuel
types roughly equal in new medium- and heavy-duty vehicles. In 2013, the ARB adopted
an optional reduced NOX emission standard for heavy-duty vehicles that can encourage
engine manufacturers to demonstrate their emission reductions. The standard includes
NOX levels that are 50, 75, and 90 percent lower than the current 0.20 grams per brake
horsepower-hour emission standard. The initial statement of reasons for the voluntary
standard suggests that heavy-duty natural gas engines may be the primary initial
technology for meeting the more aggressive 75 percent and 90 percent NOX reduction
targets.65 In September 2015, a Cummins Westport Inc. natural gas engine became the
sulfur diesel and 87.08 g/MJ for North American CNG. Data obtained from the Low Carbon Fuel Standard Final Regulation Order, available at http://www.arb.ca.gov/regact/2015/lcfs2015/finalregorderlcfs.pdf.
63 California Air Resources Board. Low Carbon Fuel Standard Final Regulation Order (Table 6). 2015. Available at: http://www.arb.ca.gov/regact/2015/lcfs2015/finalregorderlcfs.pdf.
64 Environmental Defense Fund. What Will It Take to Get Sustained Benefits From Natural Gas?. http://www.edf.org/methaneleakage.
65 Air Resources Board. Staff Report: Initial Statement of Reasons for Proposed Rulemaking. October 23, 2013. Available at http://www.arb.ca.gov/regact/2013/hdghg2013/hdghg2013isor.pdf.

61
first to receive emission certifications from both the U.S. EPA and ARB at the 90 percent NO
X reduction level of 0.02 grams per brake horsepower-hour.66 The engine is expected
to be made available as soon as April 2016. Technologies such as these have the
potential to further support the market deployment of medium- and heavy-duty natural
gas trucks. By using both biomethane and low NOX engines, natural gas trucks have the
potential to reduce criteria pollutant and GHG emissions to levels near those of zero-
emission BEVs and FCEVs. CR&R Incorporated is expected to operate the first fleet in the
country that combines biomethane fuel and low NOX natural gas trucks. This project will
take place at its anaerobic digester facility in Riverside County, which was partially
funded by the ARFVTP.
The ARFVTP has provided significant support to date for the deployment of natural gas
vehicles, as summarized in Table 21. Two large awards for natural gas vehicle
deployment came from the ARFVTP cost-sharing of successful projects under the
American Recovery and Reinvestment Act of 2009. After that, the Energy Commission
released two solicitations (PON-10-604 and PON-11-603) that offered first-come, first-
served buydown incentives for the sale of natural gas cars and trucks. Vehicle incentives
were tailored to vehicle weight classes, to reflect the increasing incremental costs of
natural gas vehicles as gross vehicle weight (GVW) increases. As a result, these
investments have favored heavier-duty vehicle classes (both in terms of numbers and
funding), which offer the largest per-vehicle opportunities for petroleum displacement.
In addition, the Energy Commission issued a third solicitation (PON-13-610) for
buydown incentives. For this solicitation, staff reconfigured vehicle incentive levels
based on the estimated fuel displacement for each GVW class per ARFVTP dollar, as well
as comparisons to other vehicle incentives. Applicants under this solicitation have
reserved or been paid more than $13.3 million for nearly 1,000 natural gas vehicle incentives.67
66 Cummins Westport Inc. ISL G Near Zero Natural Gas Engine Certified to Near Zero - First MidRange Engine in North America to Reduce NO
X Emissions by 90% From EPA 2010~. October 5, 2015. Available at
http://www.cumminswestport.com/press-releases/2015/isl-g-near-zero-natural-gas-engine-certified-to-near-zero.
67 This number reflects incentive reservations, which may or may not become fully used. In the event that a company does not use all of its reserved incentive funding, the remaining amount then becomes available for the next eligible company to reserve.
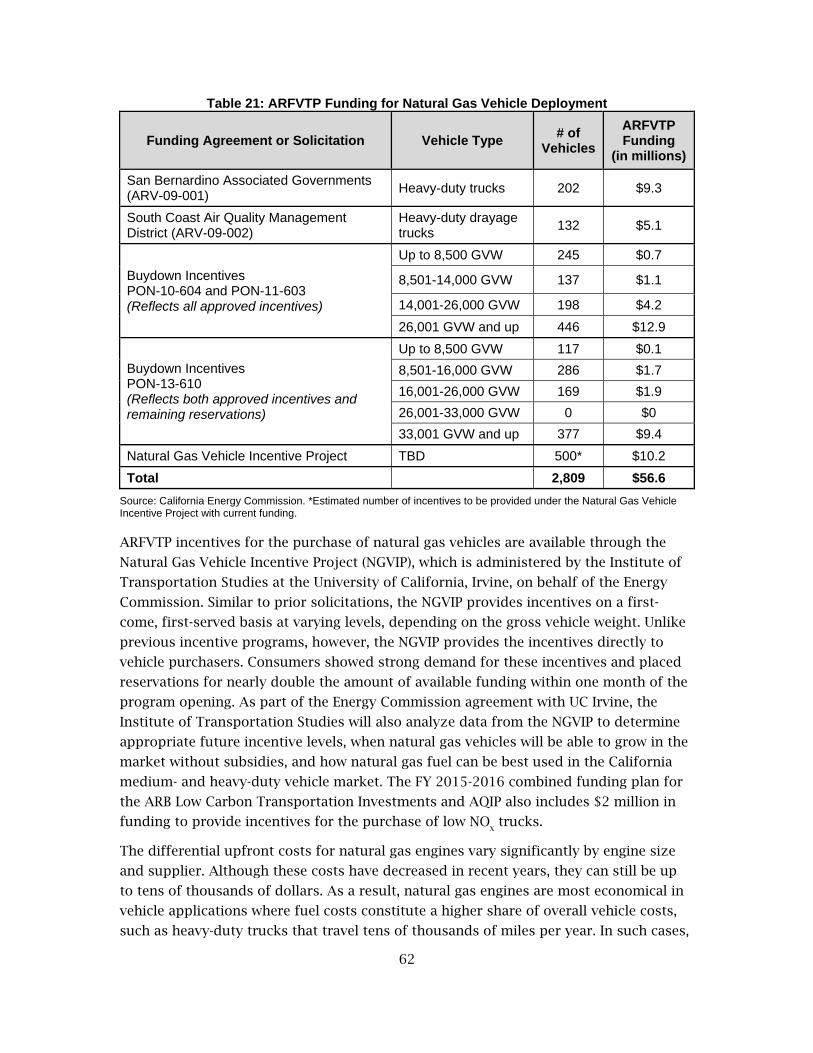
62
Table 21: ARFVTP Funding for Natural Gas Vehicle Deployment
Funding Agreement or Solicitation Vehicle Type # of
Vehicles
ARFVTP Funding
(in millions)
San Bernardino Associated Governments (ARV-09-001)
Heavy-duty trucks 202 $9.3
South Coast Air Quality Management District (ARV-09-002)
Heavy-duty drayage trucks
132 $5.1
Buydown Incentives PON-10-604 and PON-11-603 (Reflects all approved incentives)
Up to 8,500 GVW 245 $0.7
8,501-14,000 GVW 137 $1.1
14,001-26,000 GVW 198 $4.2
26,001 GVW and up 446 $12.9
Buydown Incentives PON-13-610 (Reflects both approved incentives and remaining reservations)
Up to 8,500 GVW 117 $0.1
8,501-16,000 GVW 286 $1.7
16,001-26,000 GVW 169 $1.9
26,001-33,000 GVW 0 $0
33,001 GVW and up 377 $9.4
Natural Gas Vehicle Incentive Project TBD 500* $10.2
Total 2,809 $56.6
Source: California Energy Commission. *Estimated number of incentives to be provided under the Natural Gas Vehicle Incentive Project with current funding.
ARFVTP incentives for the purchase of natural gas vehicles are available through the
Natural Gas Vehicle Incentive Project (NGVIP), which is administered by the Institute of
Transportation Studies at the University of California, Irvine, on behalf of the Energy
Commission. Similar to prior solicitations, the NGVIP provides incentives on a first-
come, first-served basis at varying levels, depending on the gross vehicle weight. Unlike
previous incentive programs, however, the NGVIP provides the incentives directly to
vehicle purchasers. Consumers showed strong demand for these incentives and placed
reservations for nearly double the amount of available funding within one month of the
program opening. As part of the Energy Commission agreement with UC Irvine, the
Institute of Transportation Studies will also analyze data from the NGVIP to determine
appropriate future incentive levels, when natural gas vehicles will be able to grow in the
market without subsidies, and how natural gas fuel can be best used in the California
medium- and heavy-duty vehicle market. The FY 2015-2016 combined funding plan for
the ARB Low Carbon Transportation Investments and AQIP also includes $2 million in
funding to provide incentives for the purchase of low NOX trucks.
The differential upfront costs for natural gas engines vary significantly by engine size
and supplier. Although these costs have decreased in recent years, they can still be up
to tens of thousands of dollars. As a result, natural gas engines are most economical in
vehicle applications where fuel costs constitute a higher share of overall vehicle costs,
such as heavy-duty trucks that travel tens of thousands of miles per year. In such cases,

63
the payback period for investing in a natural gas engine can be two years or less. Lower
petroleum fuel prices, however, will extend the payback period. Once the differential
cost is paid off, the truck owner can benefit from significant savings in fuel costs over
the useful life of the truck and engine.
Although the carbon intensity of CNG is higher than previously believed, the fuel can
still provide GHG emission reductions compared to gasoline and diesel fuel. In addition,
the use of biomethane and low NOX engine technologies can substantially reduce GHG
and criteria pollutant emissions, providing important contributions to California’s
climate change and air quality goals. For these reasons, the Energy Commission
maintains a $10 million allocation to support natural gas vehicle deployment for FY
2016-2017. The Energy Commission may consider limiting future incentives to low NOX
vehicles, if an appropriate low NOX engine is available for the specific vehicle type and
weight class. In addition, funds from this category may be made available, separate from
existing incentive programs, for fleet purchases of low NOX natural gas vehicles that
exclusively use biomethane for fuel. In using these funds, staff will continue to monitor
revisions to life-cycle GHG emissions and seek opportunities for more efficient per-
vehicle incentives. The long-term goal for ARFVTP vehicle incentives is to increase
consumer familiarity and supplier production to a point where various natural gas
vehicle types can grow in the market without subsidies.
Light-Duty Electric Vehicles The steadily increasing number of light-duty PEVs sold in California has been an early
success in the goal to deploy 1.5 million ZEVs by 2025, as well as to decrease
greenhouse gas emissions, criteria pollution emissions, and petroleum use. Cumulative
PEV sales in California totaled more than 100,000 vehicles from December 2010 through
August 2014, reached 150,000 vehicles only 12 months later in August 2015, and exceeded 184,000 in January 2016.68 Nineteen battery-electric and plug-in hybrid-electric
vehicle models are available for sale in California, and additional high-volume new or
redesigned models are expected to be released over the coming year.
68 California Plug-In Electric Vehicle Collaborative. Detailed Monthly Sales Chart, February 3, 2016. http://www.pevcollaborative.org/sites/all/themes/pev/files/1_jan_2016_Dashboard_PEV_Sales.pdf.

64
Figure 5: California and National Sales of PEVs
Source: California Plug-in Electric Vehicle Collaborative.
Despite this impressive beginning, there are still significant room and need for market
expansion of PEVs. Nearly 28.1 million light-duty vehicles are registered within
California, and annual sales have increased every year since 2010, reaching 1.8 million
vehicles for 2014. PEVs account for less than 1 percent of light-duty vehicles in
California. To meet the 80 percent greenhouse gas reduction target for 2050, California
will need to transition most of its light-duty fleet to ZEVs. In the October 2015 ARB
Mobile Source Strategy report, updated Vision scenarios assume all light-duty vehicle
sales by 2050 are ZEVs and PHEVs, which results in roughly two-thirds of the on-road fleet being ZEVs or PHEVs.69 California, along with 13 other state, provincial, and
national governments, announced in December 2015 a goal to make all new passenger
vehicles ZEVs by no later than 2050. The announcement by these governments, which
are participants in the International ZEV Alliance, illustrates the global momentum
driving a transition to a cleaner, more sustainable transportation system.
69 California Air Resources Board. Mobile Source Strategy. October 2015. Available at http://www.arb.ca.gov/planning/sip/2016sip/2016mobsrc.htm.

65
To help sustain growth of both PEVs and FCEVs, the ARB administers the Clean Vehicle
Rebate Project as part of the AQIP. The CVRP provides first-come, first-served incentives
to encourage the purchase or lease of light-duty BEVs, PHEVs, and FCEVs. To date, the
CVRP has provided incentives for more than 136,000 BEVs and PHEVs and more than 140 FCEVs.70 Current incentives include $2,500 for BEVs, $1,500 for PHEVs, and $5,000
for FCEVs, though some consumers will soon be eligible for increased rebates. In
response to Senate Bill 1275 (De León, Chapter 530, Statues of 2014), ARB made several
changes to the CVRP for FY 2015-2016, including an income cap for higher-income
consumers and increased rebate levels for low- and moderate-income consumers. ARB
staff projects that the income cap will reduce rebate demand by a small amount. The
reduction may be offset by increased demand from low- and moderate-income
consumers from larger rebates.
Based on these assumptions and revised rebate values, the ARB approved a funding plan
for FY 2015-2016 that supports the CVRP using money from both the AQIP fund as well
as the GGRF. Between the two funding sources, the ARB allocated a total of $78 million
to support the current CVRP, as well as an additional $10 million to expand pilot
projects introduced in FY 2014-2015 that support early PEV deployment in
disadvantaged communities.
The Energy Commission has also helped sustain CVRP incentives by providing
supplemental funding in previous investment plans. The Energy Commission strongly
supports the CVRP goal of deploying more PEVs within California and has provided a
combined $24.5 million in previous investment plans to sustain the availability of the
CVRP rebate. These transfers represent a mix of initial investment plan allocations and
subsequent reallocations and are summarized in Table 22. This funding provided
incentives for about 10,700 PEVs. In September 2013, the Legislature also approved the
transfer of $24.55 million from the ARFVTP fund to the AQIP fund, which provided incentives for roughly 10,300 more.71
70 Center for Sustainable Energy. California Air Resources Board Clean Vehicle Rebate Project, Rebate Statistics. Accessed February 23, 2016. Available at https://cleanvehiclerebate.org/rebate-statistics.
71 Assembly Bill 101 (Committee on Budget, Chapter 354, Statutes of 2013). Senate Bill 359 (Corbett, Chapter 415, Statutes of 2013).
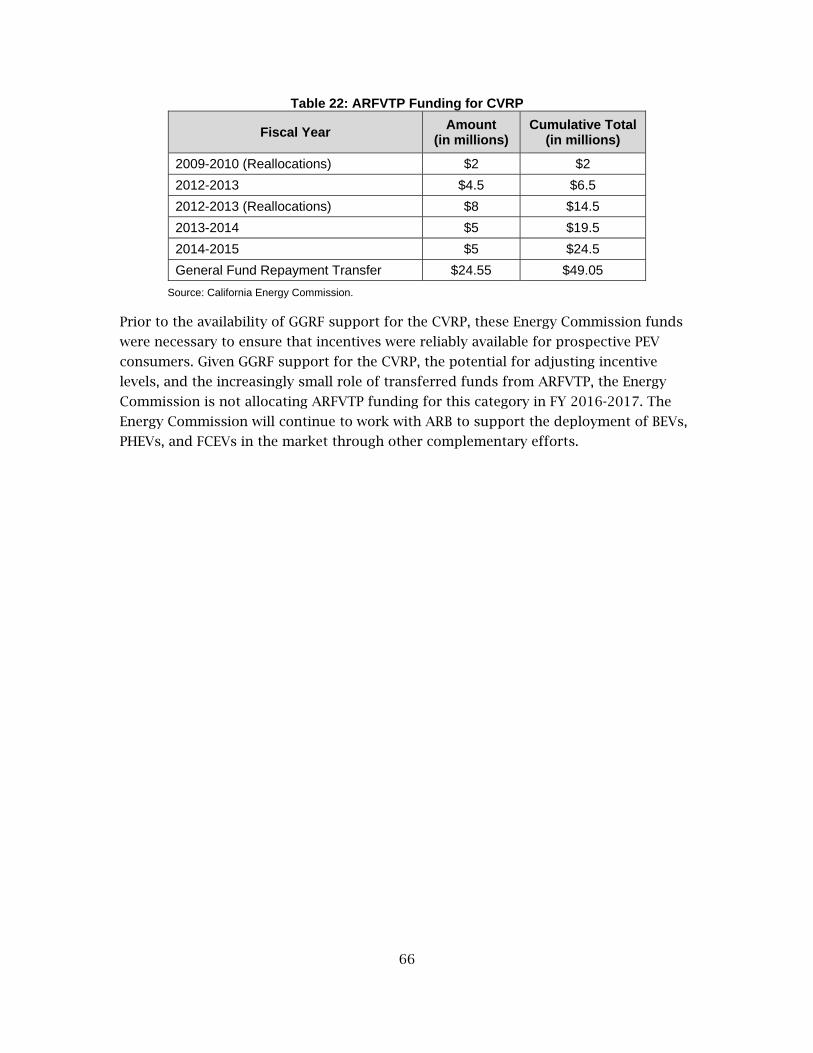
66
Table 22: ARFVTP Funding for CVRP
Fiscal Year Amount
(in millions) Cumulative Total
(in millions)
2009-2010 (Reallocations) $2 $2
2012-2013 $4.5 $6.5
2012-2013 (Reallocations) $8 $14.5
2013-2014 $5 $19.5
2014-2015 $5 $24.5
General Fund Repayment Transfer $24.55 $49.05
Source: California Energy Commission.
Prior to the availability of GGRF support for the CVRP, these Energy Commission funds
were necessary to ensure that incentives were reliably available for prospective PEV
consumers. Given GGRF support for the CVRP, the potential for adjusting incentive
levels, and the increasingly small role of transferred funds from ARFVTP, the Energy
Commission is not allocating ARFVTP funding for this category in FY 2016-2017. The
Energy Commission will continue to work with ARB to support the deployment of BEVs,
PHEVs, and FCEVs in the market through other complementary efforts.

67
Summary of Alternative Fuel and Advanced Technology Vehicles Allocations
Table 23: FY 2016-2017 Funding for Alternative Fuel and Advanced Technology Vehicles Medium- and Heavy-Duty Vehicle Technology Demonstration and Scale-Up Relevant Policy Goals:
GHG Reduction
Air Quality
Petroleum Reduction
Low-Carbon Fuel Standard
$23 Million $3 million increase relative to FY 2015-2016
Natural Gas Vehicle Deployment Relevant Policy Goals:
Petroleum Reduction
Air Quality
Low-Carbon Fuel Standard
GHG Reduction (with incorporation of biomethane)
$10 Million No change relative to FY 2015-2016
Total $33 Million
Source: California Energy Commission.
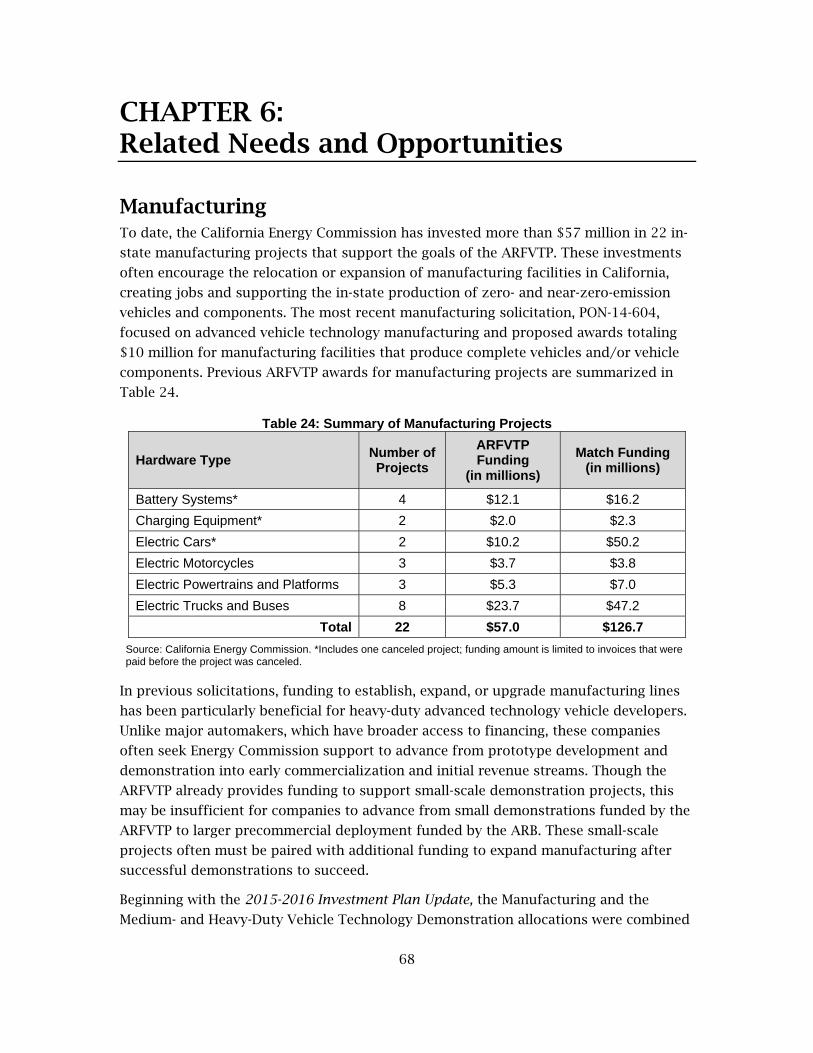
68
CHAPTER 6: Related Needs and Opportunities
Manufacturing To date, the California Energy Commission has invested more than $57 million in 22 in-
state manufacturing projects that support the goals of the ARFVTP. These investments
often encourage the relocation or expansion of manufacturing facilities in California,
creating jobs and supporting the in-state production of zero- and near-zero-emission
vehicles and components. The most recent manufacturing solicitation, PON-14-604,
focused on advanced vehicle technology manufacturing and proposed awards totaling
$10 million for manufacturing facilities that produce complete vehicles and/or vehicle
components. Previous ARFVTP awards for manufacturing projects are summarized in
Table 24.
Table 24: Summary of Manufacturing Projects
Hardware Type Number of Projects
ARFVTP Funding
(in millions)
Match Funding (in millions)
Battery Systems* 4 $12.1 $16.2
Charging Equipment* 2 $2.0 $2.3
Electric Cars* 2 $10.2 $50.2
Electric Motorcycles 3 $3.7 $3.8
Electric Powertrains and Platforms 3 $5.3 $7.0
Electric Trucks and Buses 8 $23.7 $47.2
Total 22 $57.0 $126.7
Source: California Energy Commission. *Includes one canceled project; funding amount is limited to invoices that were paid before the project was canceled.
In previous solicitations, funding to establish, expand, or upgrade manufacturing lines
has been particularly beneficial for heavy-duty advanced technology vehicle developers.
Unlike major automakers, which have broader access to financing, these companies
often seek Energy Commission support to advance from prototype development and
demonstration into early commercialization and initial revenue streams. Though the
ARFVTP already provides funding to support small-scale demonstration projects, this
may be insufficient for companies to advance from small demonstrations funded by the
ARFVTP to larger precommercial deployment funded by the ARB. These small-scale
projects often must be paired with additional funding to expand manufacturing after
successful demonstrations to succeed.
Beginning with the 2015-2016 Investment Plan Update, the Manufacturing and the
Medium- and Heavy-Duty Vehicle Technology Demonstration allocations were combined

69
into one category with a broader scope. (See the previous “Medium- and Heavy-Duty
Vehicle Technology Demonstration and Scale-Up” section.) The combination of these
two allocations allows greater flexibility in developing solicitations that combine both
elements of vehicle technology demonstration and facility retooling. For FY 2016-2017,
the Energy Commission is continuing the combined allocation.
Emerging Opportunities The Emerging Opportunities allocation of the investment plan was created to withhold a
small amount of funding for project types that were not anticipated during the
development of that year’s investment plan. This category also has been used to provide
matching funds for projects seeking federal funding.
To date, the Energy Commission has developed six agreements through this funding
category. The first three rows in Table 25 are partnerships with other government
agencies to develop advanced fuel production technologies, explore vehicle-to-grid
capabilities, and demonstrate the integration of hybrid electric trucks with over-the-road
charging. Each of these projects will contribute to the goals of the ARFVTP. The last
three rows in Table 25 represent successful projects from solicitation PON-13-604,
which focused specifically on federal cost-sharing projects. Federal solicitations are
offered throughout each year in a variety of subjects related to the goals of the ARFVTP.

70
Table 25: Summary of ARFVTP Agreements From Emerging Opportunities Category
Primary Partners Description ARFVTP Funding
(in millions)
Outside Funding
(in millions)
California Institute of Technology; U.S. DOE
Develop methods to generate fuels directly from sunlight as part of U.S. DOE Energy Innovation Hub program.
$5 Up to $122
Lawrence Berkeley National Laboratory; Concurrent Technologies Corporation; U.S. Department of Defense
Three projects to demonstrate the viability of an all-electric, nontactical vehicle fleet, integrate vehicle charging with local building loads, and explore the possibility of the vehicles participating in the California Independent System Operator’s ancillary services markets.
$7 TBD
South Coast Air Quality Management District
Two projects to demonstrate the use of hybrid-electric trucks with the ability to use an overhead electric line for charging and as a range extender and to demonstrate a zero-emission fuel cell electric hybrid Class 8 transport vehicle.
$5.4 $10.5
Center for Transportation and the Environment
Develop and demonstrate fuel cell hybrid walk-in delivery vans. Expand to a limited deployment of 4 (out of 16) additional vehicles in Phase II.
$1.1 $3.4
CALSTART, Inc. Develop and demonstrate a battery-dominant fuel cell hybrid transit bus and compare operation against previous fuel cell bus generations.
$0.9 $7.6
The Regents of the University of California, Davis Campus
Establish a center for research on strategies for promoting alternative fuels and advanced vehicle technologies, increase system efficiency, and reduce single-occupant driving.
$1.1 $5.6
Source: California Energy Commission.
The ARFVTP may also use the Emerging Opportunities category for projects that have
the potential to achieve the goals of the program but do not readily fit within other
funding categories. One such potential project type is hydrogen production from
renewable power sources in California. Through electrolysis, 100 percent renewable
hydrogen can be produced from water and renewable electricity. Several ARFVTP
projects use electrolysis to generate modest volumes of hydrogen at fueling stations.
Using surplus renewable energy, however, can potentially produce large volumes of
renewable hydrogen for use as a transportation fuel or pipeline injection.
According to the California Independent System Operator (California ISO), increasing
amounts of renewable power generation may result in overgeneration as California
renewable power requirements grow from 33 percent to 50 percent. Renewable
hydrogen is being investigated as a viable technology for storage of this surplus

71
renewable energy, including for the CPUC proceeding on storage, which stems from
Assembly Bill 2514 (Skinner, Chapter 469, Statutes of 2010) and sets an initial target of 1,325 megawatts (MW) of storage for California investor-owned utilities by 2020.72 The
U.S. Department of Energy is also investigating technology options and business cases
for hydrogen-based storage. In addition, the Energy Commission’s Energy Research and
Development Division, NREL, and ARB are studying early market business cases for the
use of hydrogen as a storage medium that can be used for transportation fuels or grid
storage.
For FY 2016-2017, the Energy Commission allocates $3 million for the Emerging
Opportunities category based on historical demand for funding from this category.
Workforce Training and Development The ARFVTP continues to support clean fuels workforce training throughout California
by using interagency agreements with other state agencies. The Energy Commission has
two continuing agreements with the Employment Development Department (EDD) for
$7.25 million and the Employment Training Panel (ETP) for $11.5 million, which deliver
workforce training in alternative fuels and advanced vehicle technologies. A third
agreement with the California Community Colleges Chancellor’s Office (CCCCO) for $5.5
million closed on June 30, 2015, and delivered recommendations for funding curriculum
development, “train-the-trainers” programs, and specialized equipment needs for 14
community college programs.
The ETP agreement focuses primarily on incumbent training across multiple businesses
that include first responders, producers of alternative fuels, and manufacturers of
advanced technology in transportation. ETP reaches out to organizations that would
benefit from ARFVTP funding and invites their participation. To receive ARFVTP funds,
ETP training contracts require employers to commit matching funds and prove the
retention of employees on the 91st day after completion of their training.
The EDD agreement focuses on current and future green transportation workforce
training needs. The Labor Market Information Division completed surveys, with the
results informing the Energy Commission on future workforce training opportunities. In
addition, the California Workforce Development Board (CWDB), through the EDD
Regional Industry Clusters of Opportunity efforts, helped develop regional market
support for alternative fuels and advanced vehicle transportation companies.
Apprenticeship training has been identified as an opportunity to advance ARFVTP
workforce efforts. Through the CWDB and the CCCCO, the Energy Commission has
72 California Public Utilities Commission, Order Instituting Rulemaking R.15-03-011 and Decisions (D.)13-10-040 and D.14-10-045. Available at http://www.cpuc.ca.gov/PUC/energy/storage.htm.

72
entered into two new agreements to develop and deliver apprenticeship training. Each
agreement will focus on different aspects of apprenticeship training delivery.
California community colleges are leaders in alternative fuels and advanced vehicle
technology training. To further support workforce training across the California
community college system, the Energy Commission is developing a $2 million
agreement with the Advanced Transportation Technology and Energy (ATTE) Center.
The ATTE Center will be responsible for implementing and advancing transportation
and renewable energy efforts throughout the California community college system.
Table 26: Historical Workforce Training Funding From FY 2008-2009 Through FY 2015-2016
Partner Agency
Funded Training (in millions)
Match Contributions
(in millions) Trainees
Businesses Assisted
Municipalities Assisted
ETP $11.50 $10.8 13,763 142+ 14+
EDD $8.20 $7.5 999 36+ -
CCCCO $5.50 N/A N/A 68+ -
CWDB $0.25** N/A N/A** N/A** -
CCCCO $0.25** N/A N/A** N/A** -
ATTE $2.00** N/A N/A** N/A** -
Total $27.70 $18.3 14,762 246+ 14+
Source: California Energy Commission. *The number of trainees includes completed, partially completed, and anticipated participants from approved contracts. **These are new agreements that will fund training. Not enough time has elapsed to provide participant data.
Examples of previous workforce training funding recipients include the following:
ETP/Atlas Disposal Industries, LLC was approved for up to $9,360 to train nine
team members in recycled waste to renewable CNG technologies. Maintenance
technicians and a fleet manager will receive training to increase CNG engine
knowledge, learn maintenance efficiency, and prepare staff for the CNG Fuel
System Inspector certification examination.
ETP/Calgren Renewable Fuels, LLC was approved for $28,652 in an amended
contract to train 29 employees in ethanol production. Training included
specialized lab skills, operation and maintenance procedures, reporting
parameters and tools, sampling techniques, and ethanol production chemistry.
ETP/Foothill-DeAnza Community College District was approved for $363,636
to train up to 378 students in courses that include vehicle inspection,
maintenance, and safety; equipment repair and modification; understanding
regulatory mandates and trends; and new technologies that support the
transportation of goods and cargo. This project targeted local government
entities and companies that needed training support to ensure that their workers
can service and repair alternative fuel vehicles.

73
ETP/Agility Fuel Systems, Inc. was approved for $79,920 to train 74 workers in
alternative fuel storage and delivery systems for heavy-duty trucks, buses, and
specialty vehicles. Training will include techniques for improving the assembly
production processes, productive lab processes, and the operation of highly
sophisticated equipment.
ETP/Los Angeles Community College District was approved for $379,308 to
train up to 438 participants in clean fuel technologies. The training included
courses in vehicle inspection, maintenance, safety, equipment repair and
modifications, understanding regulatory mandates and trends, and new
technologies that support goods and cargo movement.
Based on input received from partners in workforce delivery and private sector
professionals, the Energy Commission will continue to fund workforce training
opportunities for alternative fuels and advanced vehicle technologies for the coming
fiscal year. The Energy Commission will also continue to work with partner agencies to
determine how ARFVTP funding can be implemented to maximize workforce and
training needs. Based on expectations of needed funds from partner agencies in FY
2016-2017, the Energy Commission allocates $2.5 million for workforce training and
development projects.
Regional Readiness In addition to alternative fuel infrastructure and vehicles, the Energy Commission has
also provided funding to regions to prepare for and expedite deployment. Using
comparatively small amounts of funding, the Energy Commission has helped regions
identify and implement policies and practices that reduce the barriers to expanding
alternative fuel vehicles, particularly PEVs and FCEVs, into the market. These include,
but are not limited to:
Streamlining of permitting and inspection processes to promote installations.
Updating building codes, zoning, and parking.
Training, education, and outreach.
Setting regional priorities for charging and refueling locations.
With these goals in mind, the Energy Commission released an initial solicitation for PEV
regional readiness planning in 2011. Funding recipients from this solicitation included
combinations of local planning entities, air districts, government associations, and
nongovernmental organizations. The awardees covered 40 counties and all major
metropolitan areas. All these awards, including those for three major metropolitan
areas, have been completed. The Energy Commission continues to play a role in
overseeing and coordinating these plans.
The California PEV Collaborative subsequently received a $1 million award from the U.S.
Department of Energy to develop a statewide, multiregional approach for planning and
implementing charging infrastructure. The PEV Collaborative has developed multiple

74
materials for regions to use in developing their own plans, including resources on multi-
unit dwelling charging and workplace charging.
A second solicitation in this area was released in 2013. Unlike the previous solicitation,
this one was open to multiple alternative fuel types. Proposals were accepted on a first-
come, first-served basis with eight successful applications submitted. These successful
applications included the first planning award for hydrogen refueling, which will cover
early FCEV adopter markets identified by automakers throughout the state.
In 2014, the Energy Commission released PON-14-603, its third solicitation in this area.
Funding in this solicitation was divided into three categories pertaining to PEVs and
FCEVs. The first category focuses on implementation activities identified in previous
regional PEV planning awards, such as implementing improvements to EVCS installation
processes, installation of local EVCS signage, hosting PEV awareness events, and/or local
government code adoption and training. The second category provides for the
development of regional PEV readiness plans in areas where no such plans have yet
been developed. The third category allows funding for FCEV readiness activities, such as
streamlining the permitting process for hydrogen stations, promoting interest in FCEV
adoption, installation of local hydrogen refueling signage, and identifying preferred
sites for future hydrogen stations. The results of PON-14-603 were released in January
2015, and all eight applications with passing scores were funded.
The results of all three regional readiness solicitations are summarized in Table 27.

75
Table 27: Regional Alternative Fuel Readiness Planning and Implementation Awards
Readiness Plan Fuel Type
Agreements in Progress
Agreements Completed
Location of Regional Awards ARFVTP Funding
(in millions)
Electricity Planning
2 10
San Francisco Bay Area, Central Coast, Coachella Valley, Davis, Glenn-Colusa, Monterey Bay, North Coast, Sacramento, San Diego, San Joaquin Valley, Southern California, Tahoe-Truckee
$2.35
Electricity Implementation
11 -
San Francisco Bay Area, Coachella Valley, Corona, North Coast, San Diego, City & County of San Francisco, San Joaquin Valley, Solano, South Bay, Southern California, Palo Alto
$2.35
Electricity Planning & Implementation
1 - Mt. Shasta $0.3
Hydrogen Planning
4 -
North Coast, San Francisco, Santa Barbara Tri-county, Statewide (Early FCEV markets)
$0.8
Multiple Fuels/ Other Planning
6 -
Central Coast, Monterey Bay, North Coast, City & County of San Francisco, San Diego, San Mateo
$1.8
Total 24 10 $7.6
Source: California Energy Commission.
PON-14-603 was significantly oversubscribed, and as a result, the Energy Commission
subsequently revised and reissued the previous solicitation as PON-14-607, with $1.375
million available from previous fiscal years’ funds. The second solicitation was
oversubscribed as well.
In the 2015-2016 Investment Plan Update, the Energy Commission allocated $2 million
for regional alternative fuel readiness and planning due to interest expressed by local
governments in developing and implementing local plans for zero-emission vehicles.
Energy Commission staff believes this allocation is necessary given that previous
solicitations were oversubscribed and there is an ongoing need to support local
governments as they prepare for increasing numbers of zero-emission vehicles.

76
Summary of Related Needs and Opportunities Allocations
Table 28: FY 2016-2017 Funding for Related Needs and Opportunities Emerging Opportunities Relevant Policy Goals:
GHG Reduction
$3 Million No change relative to FY 2015-2016
Workforce Training and Development Relevant Policy Goals:
GHG Reduction
$2.5 Million $0.5 million decrease relative to FY 2015-2016
Regional Readiness Relevant Policy Goals:
GHG Reduction
$2 Million No change relative to FY 2015-2016
Total $7.5 Million
Source: California Energy Commission.
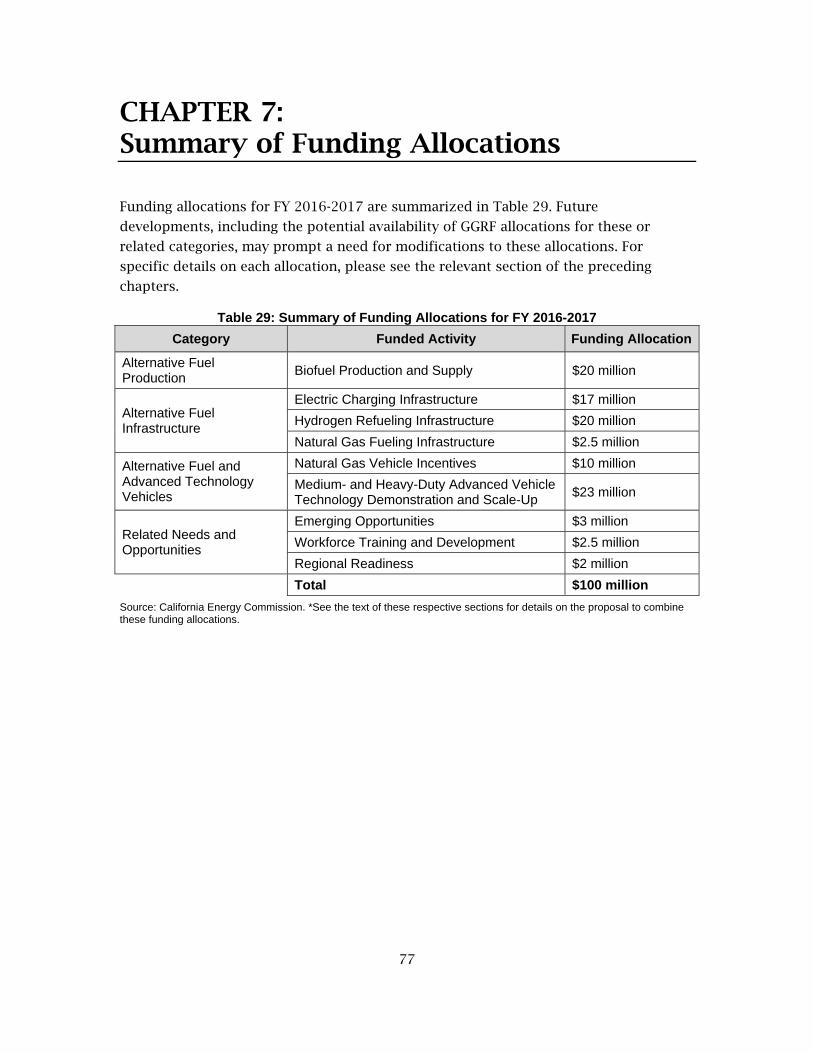
77
CHAPTER 7: Summary of Funding Allocations
Funding allocations for FY 2016-2017 are summarized in Table 29. Future
developments, including the potential availability of GGRF allocations for these or
related categories, may prompt a need for modifications to these allocations. For
specific details on each allocation, please see the relevant section of the preceding
chapters.
Table 29: Summary of Funding Allocations for FY 2016-2017
Category Funded Activity Funding Allocation
Alternative Fuel Production
Biofuel Production and Supply $20 million
Alternative Fuel Infrastructure
Electric Charging Infrastructure $17 million
Hydrogen Refueling Infrastructure $20 million
Natural Gas Fueling Infrastructure $2.5 million
Alternative Fuel and Advanced Technology Vehicles
Natural Gas Vehicle Incentives $10 million
Medium- and Heavy-Duty Advanced Vehicle Technology Demonstration and Scale-Up
$23 million
Related Needs and Opportunities
Emerging Opportunities $3 million
Workforce Training and Development $2.5 million
Regional Readiness $2 million
Total $100 million
Source: California Energy Commission. *See the text of these respective sections for details on the proposal to combine these funding allocations.
78
Glossary
AB Assembly bill
AQIP Air Quality Improvement Program
AQMD Air Quality Management District
ARB California Air Resources Board
ARFVTP Alternative and Renewable Fuel and Vehicle Technology Program
ATTE Center Advanced Transportation Technology and Energy Center
BEV battery electric vehicle
CaFCP California Fuel Cell Partnership
CA-GREET California Greenhouse Gases, Regulated Emissions, and Energy
Use in Transportation Model
California ISO California Independent System Operator
CalRecycle California Department of Resources Recycling and Recovery
CCCCO California Community Colleges Chancellor’s Office
CNG compressed natural gas
CO2e carbon dioxide-equivalent
CPUC California Public Utilities Commission
CVRP Clean Vehicle Rebate Project
CWDB California Workforce Development Board
DC direct current
DGE diesel gallon-equivalent
EDD Employment Development Department
ETP Employment Training Panel
EVCS electric vehicle charging station
FCEV fuel cell electric vehicle
FFV flex-fuel vehicle
FY fiscal year
GFO grant funding opportunity
GGE gasoline gallon-equivalent
GGRF Greenhouse Gas Reduction Fund
gCO2e/MJ grams of carbon dioxide-equivalent per megajoule
GVW gross vehicle weight
GVWR gross vehicle weight rating
GHG greenhouse gas
HVIP Hybrid and Zero-Emission Truck and Bus Voucher Incentive Project
IEPR Integrated Energy Policy Report
LCFS Low Carbon Fuel Standard
LNG liquefied natural gas
MJ megajoule
MMTCO2e million metric tons of carbon dioxide-equivalent
NGVIP Natural Gas Vehicle Incentive Project
NOX
oxides of nitrogen

79
NOPA notice of proposed award
NREL National Renewable Energy Laboratory
O&M operations and maintenance
PEV plug-in electric vehicle
PHEV plug-in hybrid electric vehicle
PON program opportunity notice
RFS Renewable Fuel Standard
RIN renewable identification number
SoCal Gas Southern California Gas Company
U.S. DOE United States Department of Energy
U.S. EPA United States Environmental Protection Agency
ZEV zero-emission vehicle