
2015_01_09_SAN_Short term pain to restore sustainability
40
Unauthorized redistribution of this report is prohibited. This report is intended for [email protected] from [email protected] IMPORTANT DISCLOSURE FOR U.S. INVESTORS: This document is prepared by Mediobanca Securities, the equity research department of Mediobanca S.p.A. (parent company of Mediobanca Securities USA LLC (“MBUSA”)) and it is distributed in the United States by MBUSA which accepts responsibility for its content. The research analyst(s) named on this report are not registered / qualified as research analysts with Finra. Any US person receiving this document and wishing to effect transactions in any securities discussed herein should do so with MBUSA, not Mediobanca S.p.A.. Please refer to the last pages of this document for important disclaimers. Santander 09 January 2015 Banks Update Short term pain to restore sustainability Andrea Filtri Equity Analyst €7.5bn ABB to address CET1 issues and normalize the dividend anomaly Yesterday, SAN announced €7.5bn accelerated bookbuild and the return to 3/4 2015 dividends in cash and 30-40% cash payout thereafter for 2% yield in 2015 and c.3% onwards. Lower than expected fully loaded 2014 CET1 (8.3%) implies SAN hitting 10% in 2015 and closing the gap with EU peers. Underperformance in the short term is the price to pay to correct the distortions from the €60c scrip DPS commitment and gain future flexibility, in our view. Our note excludes the ABB impact and analyses the impact from in-market M&A. ABB to fix a standalone issue, not to satisfy M&A ambitions The ABB reflects a strategic U-turn implemented by the new SAN management. In this note we analyze why SAN had to review its capital strategy and conclude that in-market M&A offers scope for accretion to address revenue pressure while allowing for geographical capital redeployment. The market is already speculating on the M&A use of the new capital, but our estimates show today‟s ABB merely serves standalone needs calling for more capital action to satisfy any potential external growth ambitions. There was enough to re-assess capital allocation SAN invested the last five years to repair the balance sheet and equip it for the new regulatory environment. The introduction of the scrip dividend raised €15bn new capital and boosted CET1 and share count by 30% and 40%, respectively. Yet, capital ratios remained well below peers. Meanwhile, we estimate SAN‟s exposure to GDP growth is down by 1/3 vs pre-crisis and cost of equity (COE) is essentially flat. Global/Local regulation remain potential issues but the implementation of Banking Union could be good news for EU operations. This justified a re-assessment of capital allocation as confirmed by the ABB. In-market M&A is on the cards: Bankia is a very good fit We benchmark the SAN-BKIA combination to the other European national champions and find that the Spanish mammoth would not differ, discharging worries of antitrust. We assess the potential synergies and identify cost, funding and capital synergies. We estimate €0.6bn cost cuts, €145m funding cost savings and €3bn writeback from BKIA‟s written off DTA. We model three potential operations assuming 15% premium to BKIA‟s market price: 1) a full share-for- share offer, 2) a cash bid complemented by €10bn rights issue, 3) a cash bid funded by the sale of Brazil. The deal would result in double digit 3-yr ROI, 4- 17% accretion to 3-yr EPS with neutral to positive (+110bp) impact to capital ratios. The latter option prevails in the comparison as it would not only provide the highest EPS accretion, but would also boost resolve the capital stretch – fully reinstating cash dividends - and could be one of the possible answers to the question of geographical capital reallocation. 7-26% upside to Target Price – Brazilian sale prevailing on other alternatives We estimate the three SAN-BKIA combinations would have a positive impact to valuation of 7-26% to our €7.6 SAN TP. The sale of Brazil offers the highest upside from: a) 50bp contraction of COE to 8.2%, b) over €7bn reduction in capital shortfall, c) €9.5bn NPV of synergies. The other alternatives fair the same on COE (8.5%), CET1 ratio (9.7-9.8%) and economic capital requirement (10.8% of RWAs), but the cash bid + €10bn rights issue provides double the accretion (14% vs 7%) as the higher SAN rating implies lower share count dilution. +44 203 0369 571 [email protected] Andres Williams Equity Analyst +44 203 0369 577 [email protected] Source: Mediobanca Securities Price: € 6.86 Target price: € 7.60 Neutral 2013 2014E 2015E 2016E EPS Adj (€) 0.42 0.50 0.55 0.58 DPS (€) 0.60 0.60 0.60 0.60 TBVPS (€) 5.02 4.66 4.77 4.89 Avg. RoTE Adj (%) 6.9% 8.9% 10.0% 10.3% P/E Adj (x) 16.4 13.7 12.4 11.8 Div.Yield(%) 8.8% 8.8% 8.8% 8.8% P/TBV (x) 1.4 1.5 1.4 1.4 Market Data Market Cap (€m) Shares Out (m) (%) Free Float (%) 100% 52 week range (€) 7.90-6.22 Rel Perf vs STOXX EUROPE 600 (%) -1m -4.3% -3m -9.0% -12m -2.6% 21dd Avg. Vol. 106,126,161 Reuters/Bloomberg SAN.MC / SAN SM
-
Upload
andrea-filtri -
Category
Documents
-
view
28 -
download
0
Transcript of 2015_01_09_SAN_Short term pain to restore sustainability

Un
auth
ori
zed
red
istr
ibu
tio
n o
f th
is r
epo
rt is
pro
hib
ited
.T
his
rep
ort
is in
ten
ded
fo
r A
nd
rea.
Filt
ri@
med
iob
anca
.co
m f
rom
MB
.An
dre
a.F
iltri
@m
edio
ban
ca.c
om
IMPORTANT DISCLOSURE FOR U.S. INVESTORS: This document is prepared by Mediobanca Securities, the equity research department of Mediobanca S.p.A. (parent company of Mediobanca Securities USA LLC (“MBUSA”)) and it is distributed in the United States by MBUSA which accepts responsibility for its content. The research analyst(s) named on this report are not registered / qualified as research analysts with Finra. Any US person receiving this document and wishing to effect transactions in any securities discussed herein should do so with MBUSA, not Mediobanca S.p.A.. Please refer to the last pages of this document for important disclaimers.
Santander
09 January 2015 Banks Update
Short term pain to restore sustainability Andrea Filtri
Equity Analyst
€7.5bn ABB to address CET1 issues and normalize the dividend anomaly
Yesterday, SAN announced €7.5bn accelerated bookbuild and the return to 3/4
2015 dividends in cash and 30-40% cash payout thereafter for 2% yield in 2015
and c.3% onwards. Lower than expected fully loaded 2014 CET1 (8.3%) implies
SAN hitting 10% in 2015 and closing the gap with EU peers. Underperformance in
the short term is the price to pay to correct the distortions from the €60c scrip
DPS commitment and gain future flexibility, in our view. Our note excludes the
ABB impact and analyses the impact from in-market M&A.
ABB to fix a standalone issue, not to satisfy M&A ambitions
The ABB reflects a strategic U-turn implemented by the new SAN management.
In this note we analyze why SAN had to review its capital strategy and conclude
that in-market M&A offers scope for accretion to address revenue pressure while
allowing for geographical capital redeployment. The market is already
speculating on the M&A use of the new capital, but our estimates show today‟s
ABB merely serves standalone needs calling for more capital action to satisfy any
potential external growth ambitions.
There was enough to re-assess capital allocation
SAN invested the last five years to repair the balance sheet and equip it for the
new regulatory environment. The introduction of the scrip dividend raised €15bn
new capital and boosted CET1 and share count by 30% and 40%, respectively.
Yet, capital ratios remained well below peers. Meanwhile, we estimate SAN‟s
exposure to GDP growth is down by 1/3 vs pre-crisis and cost of equity (COE) is
essentially flat. Global/Local regulation remain potential issues but the
implementation of Banking Union could be good news for EU operations. This
justified a re-assessment of capital allocation as confirmed by the ABB.
In-market M&A is on the cards: Bankia is a very good fit
We benchmark the SAN-BKIA combination to the other European national
champions and find that the Spanish mammoth would not differ, discharging
worries of antitrust. We assess the potential synergies and identify cost, funding
and capital synergies. We estimate €0.6bn cost cuts, €145m funding cost savings
and €3bn writeback from BKIA‟s written off DTA. We model three potential
operations assuming 15% premium to BKIA‟s market price: 1) a full share-for-
share offer, 2) a cash bid complemented by €10bn rights issue, 3) a cash bid
funded by the sale of Brazil. The deal would result in double digit 3-yr ROI, 4-
17% accretion to 3-yr EPS with neutral to positive (+110bp) impact to capital
ratios. The latter option prevails in the comparison as it would not only provide
the highest EPS accretion, but would also boost resolve the capital stretch – fully
reinstating cash dividends - and could be one of the possible answers to the
question of geographical capital reallocation.
7-26% upside to Target Price – Brazilian sale prevailing on other alternatives
We estimate the three SAN-BKIA combinations would have a positive impact to
valuation of 7-26% to our €7.6 SAN TP. The sale of Brazil offers the highest
upside from: a) 50bp contraction of COE to 8.2%, b) over €7bn reduction in
capital shortfall, c) €9.5bn NPV of synergies. The other alternatives fair the
same on COE (8.5%), CET1 ratio (9.7-9.8%) and economic capital requirement
(10.8% of RWAs), but the cash bid + €10bn rights issue provides double the
accretion (14% vs 7%) as the higher SAN rating implies lower share count dilution.
+44 203 0369 571
Andres Williams
Equity Analyst
+44 203 0369 577
Source: Mediobanca Securities
Price: € 6.86 Target price: € 7.60 Neutral
2013 2014E 2015E 2016E
EPS Adj (€) 0.42 0.50 0.55 0.58
DPS (€) 0.60 0.60 0.60 0.60
TBVPS (€) 5.02 4.66 4.77 4.89
Avg. RoTE Adj (%) 6.9% 8.9% 10.0% 10.3%
P/E Adj (x) 16.4 13.7 12.4 11.8
Div.Yield(%) 8.8% 8.8% 8.8% 8.8%
P/TBV (x) 1.4 1.5 1.4 1.4
Market Data
Market Cap (€m)
Shares Out (m)
(%)
Free Float (%) 100%
52 week range (€) 7.90-6.22
Rel Perf vs STOXX EUROPE 600 (%)
-1m -4.3%
-3m -9.0%
-12m -2.6%
21dd Avg. Vol. 106,126,161
Reuters/Bloomberg SAN.MC / SAN SM

Un
auth
ori
zed
red
istr
ibu
tio
n o
f th
is r
epo
rt is
pro
hib
ited
.T
his
rep
ort
is in
ten
ded
fo
r A
nd
rea.
Filt
ri@
med
iob
anca
.co
m f
rom
MB
.An
dre
a.F
iltri
@m
edio
ban
ca.c
om
Santander
09 January 2015 ◆ 2
Price: € 6.86 Target price: € 7.60 Neutral
Valuation Matrix
Source: Mediobanca Securities
Source: Mediobanca Securities
Profit & Loss Acc(€ m) 2013 2014E 2015E 2016E Multiples 2013 2014E 2015E 2016E
Net Interest Income 28,419 29,522 30,837 32,531 P/E 17.0 13.3 11.5 11.0
Growth (%) -5.7% 3.9% 4.5% 5.5% P/E Adj. 16.4 13.7 12.4 11.8
Non-Interest Income 13,512 12,949 12,713 13,075 P/Net Op.Income 3.6 3.5 3.7 3.8
Growth (%) -0.1% -4.2% -1.8% 2.8% P/Revenues 1.9 1.8 2.0 2.0
of which Fee Income 9,622 9,609 9,846 10,150 P/TBV 1.4 1.5 1.4 1.4
of which Financial Income 3,496 2,896 2,598 2,617 P/Total Deposits (%) 12.8% 11.3% 12.1% 12.6%
Total Income 41,931 42,471 43,551 45,606 Yield (%) 8.8% 8.8% 8.8% 8.8%
Growth (%) -4.0% 1.3% 2.5% 4.7%
Total Costs -20,158 -19,952 -20,301 -21,083
Growth (%) 0.2% -1.0% 1.7% 3.9%
of which Personnel Costs -10,276 -10,128 -10,352 -10,693
Net Operating Income 21,773 22,518 23,250 24,524
Growth (%) -7.6% 3.4% 3.2% 5.5%
Provisions&Write-downs -12,864 -11,299 -10,718 -10,691 Per Share Data (€) 2013 2014E 2015E 2016E
Extraordinary Items -15 -15 -16 -16 EPS 0.40 0.51 0.60 0.62
Pre-tax profit 7,637 9,594 11,102 12,495 EPS growth (%) 76.0% 27.4% 16.0% 4.3%
Tax -2,075 -2,672 -3,043 -3,409 EPS Adj. 0.42 0.50 0.55 0.58
Tax rate(%) 27.2% 27.8% 27.4% 27.3% EPS Adj. growth (%) -20.2% 19.2% 10.8% 5.4%
Minorities and others -1,177 -1,081 -936 -997 TBVPS 5.02 4.66 4.77 4.89
Net profit 4,370 5,827 7,108 8,073 DPS Ord 0.60 0.60 0.60 0.60
Growth (%) 98.2% 33.3% 22.0% 13.6%
Adjusted net profit 4,370 5,827 7,108 8,073
Growth (%) 98.2% 33.3% 22.0% 13.6%
Balance Sheet (€ m) 2013 2014E 2015E 2016E Key Figures & Ratios 2013 2014E 2015E 2016E
Customer Loans 666,356 725,873 747,704 778,998 Avg. N° of Shares (m) 11,333 11,333 12,508 13,456
Growth(%) -4.3% 8.9% 3.0% 4.2% EoP N° of Shares (m) 11,333 11,333 12,508 13,456
Customer Deposits 607,836 686,598 710,362 734,267 Avg. Market Cap. (m) 65,912 77,702 85,755 92,252
Growth(%) -3.0% 13.0% 3.5% 3.4%
Shareholders' Funds 80,559 86,341 93,174 100,940 NII/Total Income (%) 67.8% 69.5% 70.8% 71.3%
Minorities 9,972 11,053 11,988 12,985 Fees/Total Income (%) 22.9% 22.6% 22.6% 22.3%
Total Assets 1,134,014 1,226,515 1,261,052 1,296,735 Trading/Total Income (%) 8.3% 6.8% 6.0% 5.7%
Cost Income ratio 48.1% 47.0% 46.6% 46.2%
Personnel costs/Total costs 51.0% 50.8% 51.0% 50.7%
Impairment/Average Loans 1.9% 1.6% 1.5% 1.4%
NPLs ratio 4.7% 4.3% 4.2% 4.1%
Provisions/Loans 1.3% 1.4% 1.4% 1.2%
Avg. RoTE Adj. (%) 6.9% 8.9% 10.0% 10.3%
ROA (%) 0.36% 0.46% 0.54% 0.60%
Tier 1 ratio 12.6% 12.2% 13.0% 13.7%
Basel III Core Tier 1 ratio 9.2% 9.0% 9.9% 10.8%
6.20
6.40
6.60
6.80
7.00
7.20
7.40
7.60
7.80
8.00
J F M A M J J A S O N D J
Santander STOXX EUROPE 600
8/01/15

Un
auth
ori
zed
red
istr
ibu
tio
n o
f th
is r
epo
rt is
pro
hib
ited
.T
his
rep
ort
is in
ten
ded
fo
r A
nd
rea.
Filt
ri@
med
iob
anca
.co
m f
rom
MB
.An
dre
a.F
iltri
@m
edio
ban
ca.c
om
Santander
09 January 2015 ◆ 3
Price: € 6.86 Target price: € 7.60 Neutral
Table of Contents
Executive Summary 4
€7.5bn capital increase: normalising the story 9
Cost-cutting consolidation to fight revenue attrition 11
SAN yet to cash in from domestic consolidation 15
Rethinking capital allocation 17
SAN-BKIA: cost, funding and capital synergies 23
7-26% TP upside potential from the transformation 32

Un
auth
ori
zed
red
istr
ibu
tio
n o
f th
is r
epo
rt is
pro
hib
ited
.T
his
rep
ort
is in
ten
ded
fo
r A
nd
rea.
Filt
ri@
med
iob
anca
.co
m f
rom
MB
.An
dre
a.F
iltri
@m
edio
ban
ca.c
om
Santander
09 January 2015 ◆ 4
Price: € 6.86 Target price: € 7.60 Neutral
Executive Summary This note analyses the reasons why SAN had to review its capital strategy and follows with the
potential simulation of a SAN-BKIA combination as a potential way to address revenue pressure
and geographical capital redeployment. Yesterday’s €7.5bn ABB announcement by the company
supports our analysis and confirms the new management is empowered to implement its
strategy even if this is in sharp contrast to the one implemented thus far by the bank. The
market already started to speculate about the potential use of the new funds. To us the ABB
simply addresses SAN’s own issues and does not automatically steamroll them into an M&A
scenario which could potentially require further resources. We believe any M&A option would
be mainly driven by considerations over the potential benefits from cost synergies, supporting
our favor for in-market combinations. Our note and SAN-BKIA simulations exclude the impact of
the ABB.
€7.5bn ABB announced yesterday fixing capital stretch and normalising SAN’s DPS
Yesterday SAN announced €7.5bn accelerated bookbuild (ABB) and a 2015 dividend policy returning
to three cash dividends and one scrip dividend from the current policy of four scrip dividends. Yet,
each cash dividend is capped at €0.05 per share, implying a material cut to expected payout and
likely upsetting some income-driven investors. The deal should boost CET1 ratio by 140bp, taking
SAN to c.10% Basel III fully loaded ratio in 2015E, largely closing the gap vs peers, but also reflecting
a materially lower than expected 2014 starting point (8.3% vs 8.5-8.6% target provided on Q314
results). We estimate only 2% EPS dilution from the deal as the issuance of c.10% new shares is
largely offset by the future cancellation of the scrip dividends and of the shares which would be
issued under this scheme. This normalizes SAN dividend policy correcting the distortions brought by
the €0.60 scrip DPS commitment (120% payout). The announcement of the ABB is a U-turn in capital
strategy at Santander. We highlight this change reflects the strong grip the newly appointed
management has on the bank. Yet, we see the stock trading at 12.6x 2015E PE and 1.3x P/TE for
11% RoTE post capital increase, confirming our Neutral rating on the stock.

Un
auth
ori
zed
red
istr
ibu
tio
n o
f th
is r
epo
rt is
pro
hib
ited
.T
his
rep
ort
is in
ten
ded
fo
r A
nd
rea.
Filt
ri@
med
iob
anca
.co
m f
rom
MB
.An
dre
a.F
iltri
@m
edio
ban
ca.c
om
Santander
09 January 2015 ◆ 5
Price: € 6.86 Target price: € 7.60 Neutral
SAN ABB simulation
2014E 2015E 2016E 2017E
Pre rights issue
Adj. net profit 5,954 7,183 8,148 9,053
Average diluted shares outstanding 11,914 12,962 13,929 14,857
Adj. EPS 0.50 0.55 0.58 0.61
DPS 0.60 0.60 0.60 0.60
Cash DPS payout 19% 17% 16% 51%
Cash DPS yield 1.7% 1.5% 1.4% 4.5%
Adj. P/E 13.7 12.4 11.7 11.3
TBVPS 4.7 4.8 4.9 4.9
P/TBVPS 1.47 1.43 1.40 1.39
ROTE 10.3% 11.7% 12.1% 12.4%
CET1 Basel III fully loaded 8.3% 9.2% 10.2% 10.3%
Post rights issue
Capital raising
7,500 7,500 7,500
New shares in issue @5% discount
1,258 1,258 1,258
Average diluted shares outstanding
13,250 13,250 13,250
Adj. EPS
0.54 0.61 0.68
EPS dilution
-2% 5% 12%
DPS @ 35% payout
0.19 0.22 0.24
Cash DPS payout
79% 100% 100%
Cash DPS yield
2.2% 3.2% 3.5%
Adj. P/E
12.6 11.1 10.0
TBVPS
5.4 5.8 6.2
P/TBVPS
1.3 1.2 1.1
ROTE
10.8% 11.1% 11.4%
CET1 Basel III fully loaded 9.7% 10.6% 11.0% 11.4%
Source: Mediobanca Securities, company data
The collapse in Spanish revenues triggered cost cutting via M&A...
Spanish NII is down 42% from its peak level. Banks have cut costs and staff by 21% and branches by
29% to compensate, mainly through domestic M&A so that 50 banks consolidated into today‟s 12
banking groups. Yet, SAN‟s operating profits are down 37%.
...while banks used short term fixes to support capital ratios...
The DTA to DTC conversion circumvented the limitation to 15% of CET coming from DTA. The move,
which propped capital ratios up in the short term and ahead of the Comprehensive Assessment,
could come under pressure under the new ECB regulatory regime.
...so that more consolidation is likely
Spanish NII is down 42% from its peak level. Banks have cut costs and staff by 21% and branches by
29% to compensate, mainly through domestic M&A so that 50 banks consolidated into today‟s 12
banking groups. Yet, operating profits are down 37%, signaling more consolidation could be due.

Un
auth
ori
zed
red
istr
ibu
tio
n o
f th
is r
epo
rt is
pro
hib
ited
.T
his
rep
ort
is in
ten
ded
fo
r A
nd
rea.
Filt
ri@
med
iob
anca
.co
m f
rom
MB
.An
dre
a.F
iltri
@m
edio
ban
ca.c
om
Santander
09 January 2015 ◆ 6
Price: € 6.86 Target price: € 7.60 Neutral
Consolidation cost SAN €1.5bn without any direct benefit...
Santander (SAN) directly spent c.€1.5bn through the FGD and Sareb to subsidize the restructuring of
the Spanish banking sector, implicitly transferring value to its fiercest competitors: BBVA, CABK,
SAB, BKIA. This implies SAN is yet to cash in its „credit‟ towards the system / the state.
…SAN’s structural exposure to GDP growth has been impaired…
We see the SAN‟s post crisis exposure to GDP 1/3 below the pre crisis level (lhs chart below),
mainly coming from a marked slowdown in Latina America (Latam, chart below rhs) , which is now
expected to underperform the rest of SAN‟s geographies.
SAN weighted average GDP YoY growth, %
Source: Mediobanca Securities, company data
SAN LATAM vs rest of the group ex-corporate centre and
R.E. profit growth YoY 2005-16E, %
Source: Mediobanca Securities, company data
…while COE stayed essentially stable…
While growth has slowed down, we see the SAN‟s perspective COE remaining largely flat when
compared to pre crisis levels (see chart below).
SAN COE, %
Source: Mediobanca Securities, Bloomberg
…and the capital stretch and regulatory issues remained pre-ABB
Despite five years of scrip dividend policy, which raised €15bn of new equity for SAN (30% of CET1
capital) and diluted share count by 40%, SAN‟s Basel III fully loaded capital ratio remained well
below EU peers ahead of the announcement of the capital increase. This is even more relevant
when considering SAN‟s GSIFI status and the ongoing process to introduce TLAC regulation. The
European Banking Union implementation is the only potentially positive regulatory development as
this should come with full capital and liquidity fungibility within the Union.
-4.00
-3.00
-2.00
-1.00
0.00
1.00
2.00
3.00
4.00
5.00
2005 2006 2007 2008 2009 2010 2011 2012 2013 2104E 2015E 2016E
0%
20%
40%
60%
80%
100% LATAM RoG ex-Corp centre, R.E.
0
2
4
6
8
10
12
14
2005 2006 2007 2008 2009 2010 2011 2012 2013 2104E 2015E

Un
auth
ori
zed
red
istr
ibu
tio
n o
f th
is r
epo
rt is
pro
hib
ited
.T
his
rep
ort
is in
ten
ded
fo
r A
nd
rea.
Filt
ri@
med
iob
anca
.co
m f
rom
MB
.An
dre
a.F
iltri
@m
edio
ban
ca.c
om
Santander
09 January 2015 ◆ 7
Price: € 6.86 Target price: € 7.60 Neutral
Basel III fully loaded CET1 ratio H114
Source: Mediobanca Securities, company data
…so that a re-assessment of capital allocation was due
With the progressive stabilization of the regulatory framework, the implementation of the Banking
Union, the slowdown in structural GDP growth exposure of the group, the further consolidation of
the Spanish market and the protracted capital stretch vs peers, we believe a revision of SAN‟s
capital allocation strategy was due and yesterday‟s ABB announcement confirms this.
SAN-BKIA: a combination worth cost, funding and capital synergies
We benchmark the SAN-BKIA combination to the other large national champions around Europe and
find that the Spanish mammoth – reaching c.23-25% market share in loans, deposits and mutual
funds - would not differ from others around the Continent, implying a low risk of antitrust issues, in
our view.
We identify €0.6bn and €145m cost and funding synergies by averaging out three bottom-up and
top-down methodologies, justifying €1.5bn restructuring charges.
SAN-BKIA synergy benchmark
Revenue Costs
Average in-market merger synergies 163 537
Average Spanish merger synergies 51 624
Cost composition 622
Average 107 594
MB Synergy Estimate 145 594
Source: Mediobanca Securities
Brazilian sale prevailing over €10bn rights issue or share-for-share deal options
We model three potential ways to deliver the deal, all assuming 15% premium to BKIA‟s share price:
1) a full share-for-share offer, 2) a cash bid complemented by €10bn rights issue, 3) a cash bid
funded by the sale of Brazil. We estimate the deal would deliver double digit 3-yr ROI with 4-17% 3-
yr EPS accretion and a neutral to positive impact to capital ratios, with the latter option emerging
as winner in the comparison with both the highest EPS accretion and the highest resulting CET1
ratio.
0%
2%
4%
6%
8%
10%
12%
14%
16%
18%
20%
SW
ED
A
SEB
SH
B
DAN
SKE
ND
A
ISP
CABK
CA
ALPH
A
BPM
DN
B
DBK
BP
NBG
HSBA
BPCE
LLO
Y
UBI
EBS
TPEIR
KBC
ING
UCG
PO
P
RBI
GLE
RBS
BBVA
BN
P
BAR
CBK
SAN
EU
RO
BAN
K

Un
auth
ori
zed
red
istr
ibu
tio
n o
f th
is r
epo
rt is
pro
hib
ited
.T
his
rep
ort
is in
ten
ded
fo
r A
nd
rea.
Filt
ri@
med
iob
anca
.co
m f
rom
MB
.An
dre
a.F
iltri
@m
edio
ban
ca.c
om
Santander
09 January 2015 ◆ 8
Price: € 6.86 Target price: € 7.60 Neutral
Summary of ROI, P/E, EPS and CET1 swings under SAN-BKIA simulations pre-ABB
Share for share Cash and capital raise
Cash and BRA sale
and scrip DVD cancellation
Premium to BKIA market price, % 15% 15% 15%
ROI, % 11.5% 11.5% 11.5%
3-yr EPS accretion, % 4% 10% 17%
2017E P/E SAN stand alone, x 11.3 11.3 11.3
2017E P/E SAN-BKIA, x 10.8 10.3 9.7
2015E CET1 SAN stand alone, % 9.6% 9.6% 9.6%
2015E CET1 SAN-BKIA, % 9.8% 9.7% 10.7%
Source: Mediobanca Securities
7-26% potential upside to €7.6 Target Price
We look at the implications of the three different SAN-BKIA combinations on SAN‟s valuation. We
find 7-26% potential upside to our €7.6 Target Price. The sale of Brazil offers the highest upside on
account of over €7bn reduction in capital shortfall, 50bp contraction in COE and €9.5bn NPV of
synergies. The other two alternatives fair the same on COE, CET1 ratio and economic capital
requirement, we see the cash bid complemented by a rights issue more accretive to valuation than
the share swap as the higher rating of SAN shares implies a lower share count dilution (c.1bn
shares).
SAN valuation range for the different simulations of the BKIA combination
Stand alone Share-for-share Cash bid + K hike Cash bid + BRA sale
Share count 13,306 15,940 14,823 12,510
COE 8.7% 8.5% 8.5% 8.2%
CET1 2015e 9.6% 9.8% 9.7% 10.7%
MB econ. capital requirement 11.0% 10.8% 10.8% 10.5%
RWAs 575,327 667,929 667,929 572,773
Excess capital -7,605 -9,007 -9,563 -318
MB 2015E Target Price (TP) 7.6 7.6 7.6 7.6
MB 2015E Fair Value 8.1 8.7 9.6
Implied P/AC 2015e 1.6 1.8 1.8 2.0
RoAC 2017e* 14% 15% 15% 14%
Implied P/E 2017e* 11.9 11.8 11.8 13.9
Upside to MB TP 7% 14% 26%
Source: Mediobanca Securities

Un
auth
ori
zed
red
istr
ibu
tio
n o
f th
is r
epo
rt is
pro
hib
ited
.T
his
rep
ort
is in
ten
ded
fo
r A
nd
rea.
Filt
ri@
med
iob
anca
.co
m f
rom
MB
.An
dre
a.F
iltri
@m
edio
ban
ca.c
om
Santander
09 January 2015 ◆ 9
Price: € 6.86 Target price: € 7.60 Neutral
€7.5bn capital increase: normalising the story We see the €7.5bn capital increase announced yesterday by SAN as a radical change in strategy.
This reduces the capital gap SAN has vs European peers and allows – with a limited short term
EPS dilution – the normalisation of SAN story, correcting the anomaly of a dilutive 120%
dividend payout paid in shares. We expect a negative reaction short term, given the EPS
dilution and the cut in dividend yield. Yet, this puts SAN in a more sustainable position going
forward, in our view.
€7.5bn accelerated bookbuild to close the CET1 ratio gap...
Yesterday SAN approved a capital increase in the form of €7.5bn accelerated bookbuild (ABB). This
should boost CET1 ratio by 140bp, taking 2014E Basel III fully loaded CET1 ratio to c.10% in 2015,
largely closing the capital adequacy gap vs peers (see Chart 9). This reflects a lower than expected
2014E level of 8.3% vs 8.5% target disclosed on Q314 results and 8.7% we estimated in our model.
...and normalise the SAN story
The tight capital position of SAN pre-capital increase required the quasi cancellation of cash
dividends, taking dividend yield on the cash component to 1.5%. The capital increase is triggering a
change in the 2015 dividend policy whereby three out of four dividends will be paid entirely in cash,
with a cumulative cap of €0.15 per share. From 2016 the cash dividend will hover between 30-40%
payout. We estimate this should take the cash DPS yield to 2% in 2015 and 3% thereafter.
2% estimated EPS dilution in 2015E, accretion in 2016E...
Table 1 estimates the impact of the capital increase to SAN‟s key metrics. We simulate the ABB to
take place at 5% discount, for new 1,258m shares or 10% of shares outstanding. Yet, we estimate a
an EPS dilution limited to 2% in 2015E as a result of the changed scrip dividend policy which should
materially reduce the number of new shares to be issues over the next three years. Thereafter we
see an accretive impact.
...leaving SAN on 12.6x 2015E PE, 1.3x P/TE and 11% ROTE
As a result, we see SAN post capital increase trading on 12.6x 2015E PE and 1.3x P/TE for 11% RoTE,
an unappealing level considering also the limited dividend appeal in the short term.
A marked change in strategy confirming strong leadership of the new management
The announcement of the ABB is a U-turn in capital strategy at Santander. We highlight this change
reflects the strong grip the newly appointed management has on the bank.

Un
auth
ori
zed
red
istr
ibu
tio
n o
f th
is r
epo
rt is
pro
hib
ited
.T
his
rep
ort
is in
ten
ded
fo
r A
nd
rea.
Filt
ri@
med
iob
anca
.co
m f
rom
MB
.An
dre
a.F
iltri
@m
edio
ban
ca.c
om
Santander
09 January 2015 ◆ 10
Price: € 6.86 Target price: € 7.60 Neutral
Table 1: SAN ABB simulation
2014E 2015E 2016E 2017E
Pre rights issue
Adj. net profit 5,954 7,183 8,148 9,053
Average diluted shares outstanding 11,914 12,962 13,929 14,857
Adj. EPS 0.50 0.55 0.58 0.61
DPS 0.60 0.60 0.60 0.60
Cash DPS payout 19% 17% 16% 51%
Cash DPS yield 1.7% 1.5% 1.4% 4.5%
Adj. P/E 13.7 12.4 11.7 11.3
TBVPS 4.7 4.8 4.9 4.9
P/TBVPS 1.47 1.43 1.40 1.39
ROTE 10.3% 11.7% 12.1% 12.4%
CET1 Basel III fully loaded 8.3% 9.2% 10.2% 10.3%
Post rights issue
Capital raising
7,500 7,500 7,500
New shares in issue @5% discount
1,258 1,258 1,258
Average diluted shares outstanding
13,250 13,250 13,250
Adj. EPS
0.54 0.61 0.68
EPS dilution
-2% 5% 12%
DPS @ 35% payout
0.19 0.22 0.24
Cash DPS payout
79% 100% 100%
Cash DPS yield
2.2% 3.2% 3.5%
Adj. P/E
12.6 11.1 10.0
TBVPS
5.4 5.8 6.2
P/TBVPS
1.3 1.2 1.1
ROTE
10.8% 11.1% 11.4%
CET1 Basel III fully loaded 9.7% 10.6% 11.0% 11.4%
Source: Mediobanca Securities, company data
Un
auth
ori
zed
red
istr
ibu
tio
n o
f th
is r
epo
rt is
pro
hib
ited
.T
his
rep
ort
is in
ten
ded
fo
r A
nd
rea.
Filt
ri@
med
iob
anca
.co
m f
rom
MB
.An
dre
a.F
iltri
@m
edio
ban
ca.c
om
Santander
09 January 2015 ◆ 11
Price: € 6.86 Target price: € 7.60 Neutral
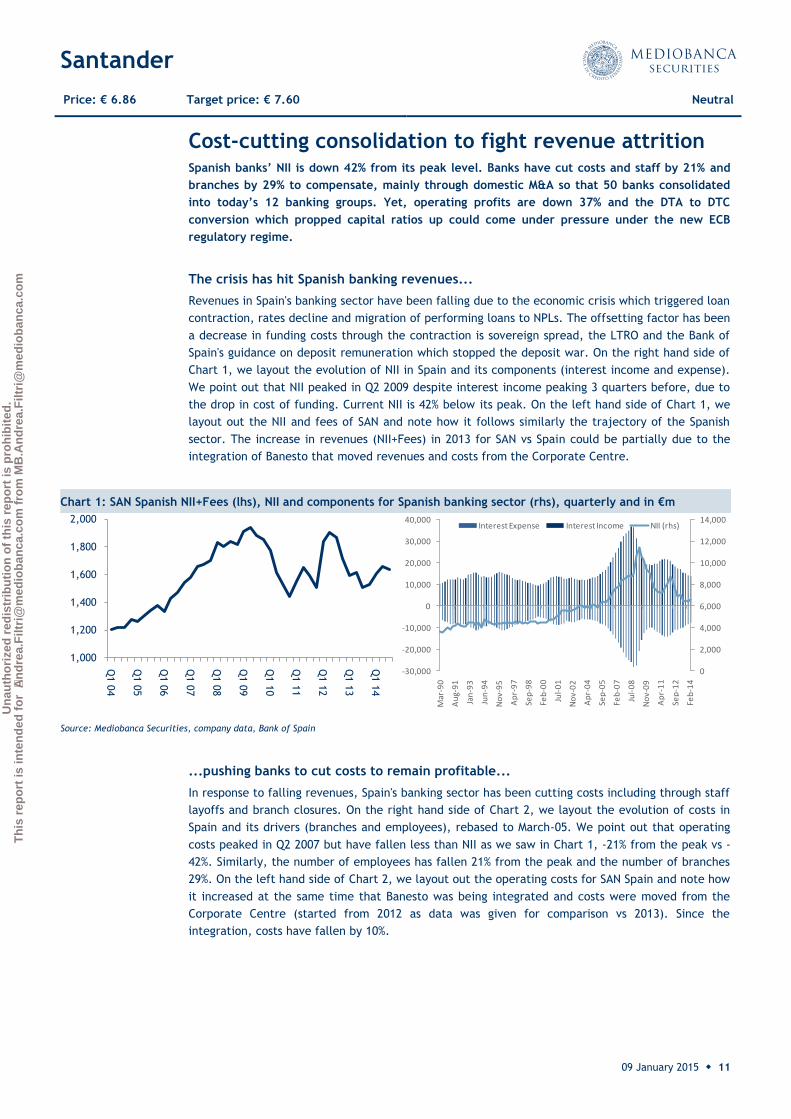
Cost-cutting consolidation to fight revenue attrition Spanish banks’ NII is down 42% from its peak level. Banks have cut costs and staff by 21% and
branches by 29% to compensate, mainly through domestic M&A so that 50 banks consolidated
into today’s 12 banking groups. Yet, operating profits are down 37% and the DTA to DTC
conversion which propped capital ratios up could come under pressure under the new ECB
regulatory regime.
The crisis has hit Spanish banking revenues...
Revenues in Spain's banking sector have been falling due to the economic crisis which triggered loan
contraction, rates decline and migration of performing loans to NPLs. The offsetting factor has been
a decrease in funding costs through the contraction is sovereign spread, the LTRO and the Bank of
Spain's guidance on deposit remuneration which stopped the deposit war. On the right hand side of
Chart 1, we layout the evolution of NII in Spain and its components (interest income and expense).
We point out that NII peaked in Q2 2009 despite interest income peaking 3 quarters before, due to
the drop in cost of funding. Current NII is 42% below its peak. On the left hand side of Chart 1, we
layout out the NII and fees of SAN and note how it follows similarly the trajectory of the Spanish
sector. The increase in revenues (NII+Fees) in 2013 for SAN vs Spain could be partially due to the
integration of Banesto that moved revenues and costs from the Corporate Centre.
Chart 1: SAN Spanish NII+Fees (lhs), NII and components for Spanish banking sector (rhs), quarterly and in €m
Source: Mediobanca Securities, company data, Bank of Spain
...pushing banks to cut costs to remain profitable...
In response to falling revenues, Spain's banking sector has been cutting costs including through staff
layoffs and branch closures. On the right hand side of Chart 2, we layout the evolution of costs in
Spain and its drivers (branches and employees), rebased to March-05. We point out that operating
costs peaked in Q2 2007 but have fallen less than NII as we saw in Chart 1, -21% from the peak vs -
42%. Similarly, the number of employees has fallen 21% from the peak and the number of branches
29%. On the left hand side of Chart 2, we layout out the operating costs for SAN Spain and note how
it increased at the same time that Banesto was being integrated and costs were moved from the
Corporate Centre (started from 2012 as data was given for comparison vs 2013). Since the
integration, costs have fallen by 10%.
1,000
1,200
1,400
1,600
1,800
2,000
Q1 0
4
Q1 0
5
Q1 0
6
Q1 0
7
Q1 0
8
Q1 0
9
Q1 1
0
Q1 1
1
Q1 1
2
Q1 1
3
Q1 1
4
0
2,000
4,000
6,000
8,000
10,000
12,000
14,000
-30,000
-20,000
-10,000
0
10,000
20,000
30,000
40,000
Mar
-90
Au
g-9
1
Jan
-93
Jun
-94
No
v-9
5
Ap
r-9
7
Sep
-98
Feb
-00
Jul-
01
No
v-0
2
Ap
r-0
4
Sep
-05
Feb
-07
Jul-
08
No
v-0
9
Ap
r-1
1
Sep
-12
Feb
-14
Interest Expense Interest Income NII (rhs)

Un
auth
ori
zed
red
istr
ibu
tio
n o
f th
is r
epo
rt is
pro
hib
ited
.T
his
rep
ort
is in
ten
ded
fo
r A
nd
rea.
Filt
ri@
med
iob
anca
.co
m f
rom
MB
.An
dre
a.F
iltri
@m
edio
ban
ca.c
om
Santander
09 January 2015 ◆ 12
Price: € 6.86 Target price: € 7.60 Neutral
Chart 2: SAN Operating Costs, €m (lhs), Oper. costs, branches and employees for Spanish sector, rebased to 100 (rhs)
Source: Mediobanca Securities, company data, Bank of Spain
...with consolidation as the main way to extract higher efficiency…
The main way Spanish banks have used to squeeze higher efficiency out of their distribution
networks has been M&A. In Table 2, we have laid out the banks and cajas that have been part of
the consolidation in Spain (excluding the Co-op Caja Rurales). On the left hand side we can see that
the 52 banks that used to exist in Spain have given birth to today‟s 12 much larger banking groups.
500
600
700
800
900
1,000
1,100
Q1 0
4
Q1 0
5
Q1 0
6
Q1 0
7
Q1 0
8
Q1 0
9
Q1 1
0
Q1 1
1
Q1 1
2
Q1 1
3
Q1 1
4
60
80
100
120
140
160
180
Mar-0
5
Mar-0
6
Mar-0
7
Mar-0
8
Mar-0
9
Mar-1
0
Mar-1
1
Mar-1
2
Mar-1
3
Mar-1
4
Oper Costs Branches Employees

Un
auth
ori
zed
red
istr
ibu
tio
n o
f th
is r
epo
rt is
pro
hib
ited
.T
his
rep
ort
is in
ten
ded
fo
r A
nd
rea.
Filt
ri@
med
iob
anca
.co
m f
rom
MB
.An
dre
a.F
iltri
@m
edio
ban
ca.c
om
Santander
09 January 2015 ◆ 13
Price: € 6.86 Target price: € 7.60 Neutral
SAN’s operating profit is 37% down from the peak
Chart 3 shows the evolution of Spanish core revenues (NII+fees), costs and operating profits of SAN
rebased to Q104 (lhs) and in absolute value. These show that:
Cost cutting has almost caught up with revenues attrition but not fully;
So that operating profit is down 37% from the peak, i.e. €1.7bn lower on annualized basis
or 8% of the 2014E group estimate.
Table 2: Consolidation of the Spanish banking sector and loan market share Q314
Before After Mkt share Before After Mkt share
La Caixa
CaixaBank 17%
Caixa Sabadell
BBVA 18%
Caixa Girona Caixa Terrassa
Cajasol Caixa Manlleu
Caja de Guadalajara Caixa Catalunya
Caja Navarra Caixa Tarragona
Caja de Burgos Caixa Manresa
Caja Canarias Unicaja
Unicaja Banco 4% Banco de Valencia Caja Jaen
Barclays Caja España
Caja Madrid
Bankia 13%
Caja Duero
Bancaja Caixa Galicia Banesco NA
La Caja de Canarias Caixanova
Caixa Laietana CCM
Liberbank 2% Caja de Avila Cajastur
Caja Segovia Caja de Extremadura
Caja Rioja Caja Cantabria
CAM Banco Sabadell 8%
Caja Inmaulada de Aragon
Ibercaja Banco 3% Caixa Penedes Circulo de Burgos
Cajasur
Kutxabank 3%
Caja de Badajoz
BBK Ibercaja
Kutxa Banco Popular
Banco Popular 8% Vital Kutxa Banco Pastor
Caja Murcia
BMN 2%
Citibank España
Caja Granada Banco Santander
Santander 16% Banesto
Sa Nostra
Source: Mediobanca Securities

Un
auth
ori
zed
red
istr
ibu
tio
n o
f th
is r
epo
rt is
pro
hib
ited
.T
his
rep
ort
is in
ten
ded
fo
r A
nd
rea.
Filt
ri@
med
iob
anca
.co
m f
rom
MB
.An
dre
a.F
iltri
@m
edio
ban
ca.c
om
Santander
09 January 2015 ◆ 14
Price: € 6.86 Target price: € 7.60 Neutral
Chart 3: SAN evolution of Spanish revenues, costs, operating profit rebased to Q104 (lhs) and absolute (rhs)
Source: Mediobanca Securities,
DTA/DTC could come under pressure as a capital item with the Common Regulator...
The recognition of deferred tax assets (DTA) are limited to 15% of CET1, after the application of all
deductions, including other specified items (investments in financial institutions, mortgage servicing
rights) under Basel 3 regulatory framework. However, Spanish legislation in December 2013 that
approved the conversion of the majority of DTAs into tax credits (DTC). This change in legal
framework, alleviated BKIA the most in meeting Basel 3 requirements. As we can see in the chart
below, BKIA had the highest amount of DTA as a percentage of regulatory capital ratios in Spain,
followed by SAB and CABK.
We believe that now that the ECB has taken over as bank regulator, BKIA's large reliance on tax
assets/tax credits could be taken into question as the new common regulator looks at harmonizing
the quality of capital across banks in the Banking Union.
138140
133
80
100
120
140
160
180
200
220
Q1 0
4Q
3 0
4Q
1 0
5Q
3 0
5Q
1 0
6Q
3 0
6Q
1 0
7Q
3 0
7Q
1 0
8Q
3 0
8Q
1 0
9Q
3 0
9Q
1 1
0Q
3 1
0Q
1 1
1Q
3 1
1Q
1 1
2Q
3 1
2Q
1 1
3Q
3 1
3Q
1 1
4Q
3 1
4
Core revenues Costs Operating profit
1,662
908
733
200
700
1,200
1,700
2,200
Q1 04
Q4 04
Q3 05
Q2 06
Q1 07
Q4 07
Q3 08
Q2 09
Q1 10
Q4 10
Q3 11
Q2 12
Q1 13
Q4 13
Q3 14
Core revenues Costs
Operating profit
Chart 4: Basel III fully loaded 2014E and
Source: Mediobanca Securities, company data
0%
2%
4%
6%
8%
10%
12%
14%
BANKIA POP BBVA BKT SAN CABK SAB
Fully-Loaded Basel III CET1 - 2014E DTA derecognition

Un
auth
ori
zed
red
istr
ibu
tio
n o
f th
is r
epo
rt is
pro
hib
ited
.T
his
rep
ort
is in
ten
ded
fo
r A
nd
rea.
Filt
ri@
med
iob
anca
.co
m f
rom
MB
.An
dre
a.F
iltri
@m
edio
ban
ca.c
om
Santander
09 January 2015 ◆ 15
Price: € 6.86 Target price: € 7.60 Neutral
SAN yet to cash in from domestic consolidation Santander (SAN) directly spent c.€1.5bn through the FGD and Sareb to subsidize the
restructuring of the Spanish banking sector, implicitly transferring value to its fiercest
competitors: BBVA, CABK, SAB, BKIA. This implies SAN is yet to cash in its ‘credit’ towards the
system / the state.
Deposit Guarantee Fund in negative equity…
Chart 5 shows the evolution of the capital of the Spanish Deposit Guarantee Fund (DGF) from 1980
to 2013. We highlight the following points:
1. The harsh 1993 crisis only implied €0.8bn hit to the DGF, compared with €10bn hit taken in
the 2009-13 period;
2. In 2012-13 losses were so large to require €2.4bn extraordinary contributions from policy
holders;
3. The DGF has remained with negative funds for three straight years.
The DGF was utilised as the initial tool to restructure the Spanish banking bust. This provided Asset
Protection Schemes (APS) for Caja Castilla y la Mancha (CCM), Unnim Banc and Banco CAM.
…despite 5x increase in annual contributions...
Chart 6 shows the annual contribution of Spanish banks to the DGF. These averaged €300m per
annum from 1980-2009, implying c.6% of the outstanding capital from 1997-2009. With the
bankruptcy of the Spanish banking sector, annual contributions demanded from banks have
increased fivefold to €1.5bn to restore loss absorption capacity at the DGF‟s.
Chart 5: DGF capital and extraordinary contributions, € m
Source: Mediobanca Securities, DGF data
-2,000
-1,000
0
1,000
2,000
3,000
4,000
5,000
6,000
7,000
8,000
1980
1981
1982
1983
1984
1985
1986
1987
1988
1989
1990
1991
1992
1993
1994
1995
1996
1997
1998
1999
2000
2001
2002
2003
2004
2005
2006
2007
2008
2009
2010
2011
2012
2013
Extraordinary contribution Fund capital

Un
auth
ori
zed
red
istr
ibu
tio
n o
f th
is r
epo
rt is
pro
hib
ited
.T
his
rep
ort
is in
ten
ded
fo
r A
nd
rea.
Filt
ri@
med
iob
anca
.co
m f
rom
MB
.An
dre
a.F
iltri
@m
edio
ban
ca.c
om
Santander
09 January 2015 ◆ 16
Price: € 6.86 Target price: € 7.60 Neutral
...implying c.€0.7bn higher bill for SAN...
We calculate SAN‟s market share in deposits stands at 14%. Taking the pro-rata share of DGF fees
for the 2010-13 period, we calculate SAN disbursed €0.84bn, i.e. €0.68bn more than it would have
paid has DGF fees not been multiplied to fund the rescues of bank bailouts.
...confirmed by latest DGF developments on contributions
The Spanish DGF approved the new EBA-dictated rules which will link individual bank contributions
to their risk profile based on five parameters:
1. Capital (leverage, excess capital, CET1 ratio)
2. Liquidity (LCR, NSFR, liquid assets/total assets)
3. Asset quality (NPL ratio, funding costs)
4. Business model (RWA/assets, ROA)
5. Maximum loss (assets/deposits)
National authorities will be able to emphasise more some parameters than others. The changes will
be implemented by June 2016 at the latest and national funds will have to make sure they reach
resources for 0.8% of insured deposits by 2024.
The new rules confirm that sounder banks have been subsidizing the bank sector‟s restructuring in
Spain also through the FGD. Yet, while BBVA, SAB and CABK increased their FGD contributions, and
then benefitted from these through the subsidised acquisitions of Unnim and CAtalunya Banc, CAM
and Banca Civica and Banco de Valencia, so far Santander only took part to the contributors‟ group
with no membership to the beneficiaries‟ one.
€0.8bn invested into Sareb, taking subsidy to competitors to €1.5bn
With 17.3% stake in Sareb‟s equity and sub. debt, SAN is the largest private investor in the „bad
bank‟. The investment required €0.8bn injection by the bank €0.2bn on the equity, €0.6bn in bonds.
This takes SAN‟s subsidy to restructure the Spanish banking sector to €1.5bn so far, largely
benefitting Bankia, CABK, BBVA and SAB.
Chart 6: annual contributions to the DGF, € m
Source: Mediobanca Securities, DGF data
0
500
1,000
1,500
2,000
2,500
3,000
1980
1981
1982
1983
1984
1985
1986
1987
1988
1989
1990
1991
1992
1993
1994
1995
1996
1997
1998
1999
2000
2001
2002
2003
2004
2005
2006
2007
2008
2009
2010
2011
2012
2013

Un
auth
ori
zed
red
istr
ibu
tio
n o
f th
is r
epo
rt is
pro
hib
ited
.T
his
rep
ort
is in
ten
ded
fo
r A
nd
rea.
Filt
ri@
med
iob
anca
.co
m f
rom
MB
.An
dre
a.F
iltri
@m
edio
ban
ca.c
om
Santander
09 January 2015 ◆ 17
Price: € 6.86 Target price: € 7.60 Neutral
Rethinking capital allocation Despite five years of scrip dividends, which raised €15bn new capital and boosted CET1 capital
by 30% vs 40% higher share count, SAN shows a higher than peer balance sheet gearing,
suggesting a change in strategy could be evaluated. We estimate SAN’s GDP growth exposure
has been structurally impaired during the crisis, while COE stayed essentially flat. We see Latin
American growth slowing down in coming years and regulation remaining a potential burden.
Yet, the advent of Banking Union should favour liquidity and capital fungibility within the
Union, improving the opportunity cost of onshoring capital back to Europe. We believe this
could suffice to promote a re-assessment of SAN’s capital allocation.
Lower growth, same COE: SAN’s model is less attractive post crisis but the capital increase could change the picture
Post-crisis SAN-weighted GDP exposure down 1/3 vs pre-crisis...
Chart 7 shows the exposure of Santander to GDP, weighted for the capital allocated to the
geographies the group in each given year of the 2005-16E period. This shows a pre-crisis (2005-08)
average of 3.1%, dropping sharply to 0.8% in the worst of the crisis (2009-13) and stabilising at 2% in
the post crisis (2014-16E). This suggests the crisis impaired the overall growth profile of the group.
...with COE essentially flat
Chart 8 shows the evolution of SAN‟s COE calculated by holding the beta (1.1) and the risk premium
constant and applying the risk free rate weighted by the geographical capital allocation of SAN in
each given year. We conclude that the COE corresponding to the weighted GDP growth rates above
stand at: 10%, 11.4% and 10.3%, suggesting that the overall picture has structurally worsened, with
COE up and GDP down.
Chart 7: SAN weighted average GDP YoY growth, %
Source: Mediobanca Securities, Bloomberg
-4.00
-3.00
-2.00
-1.00
0.00
1.00
2.00
3.00
4.00
5.00
2005 2006 2007 2008 2009 2010 2011 2012 2013 2104E 2015E 2016E

Un
auth
ori
zed
red
istr
ibu
tio
n o
f th
is r
epo
rt is
pro
hib
ited
.T
his
rep
ort
is in
ten
ded
fo
r A
nd
rea.
Filt
ri@
med
iob
anca
.co
m f
rom
MB
.An
dre
a.F
iltri
@m
edio
ban
ca.c
om
Santander
09 January 2015 ◆ 18
Price: € 6.86 Target price: € 7.60 Neutral
Capital significantly more geared than peers, despite scrip
Capital was stretched vs peers...
Chart 9 shows the Basel III fully loaded comparison for European banks. With c.8.5% pre-capital
increase, SAN positioned at the end of the spectrum, over 200bp below the peer group average
(10.9%, see No need to stress, 8 Sept 2014).
...despite five years of scrip dividends...
Table 3 shows the breakdown of SAN‟s DPS from 2007 to H114 between cash and scrip. The bank
introduced the first scrip option in 2009, paying 20% of the annual dividend in shares. Over the
years, this progressively went to 100% in 2012 and there has remained till today and has been
confirmed for the whole of 2014E.
Chart 8: SAN COE, %
Source: Mediobanca Securities, Bloomberg
Chart 9: Basel III fully loaded CET1 ratio H114
Source: Mediobanca Securities, company data
0
2
4
6
8
10
12
14
2005 2006 2007 2008 2009 2010 2011 2012 2013 2104E 2015E
0%
2%
4%
6%
8%
10%
12%
14%
16%
18%
20%
SW
ED
A
SEB
SH
B
DAN
SKE
ND
A
ISP
CABK
CA
ALPH
A
BPM
DN
B
DBK
BP
NBG
HSBA
BPCE
LLO
Y
UBI
EBS
TPEIR
KBC
ING
UCG
PO
P
RBI
GLE
RBS
BBVA
BN
P
BAR
CBK
SAN
EU
RO
BAN
K

Un
auth
ori
zed
red
istr
ibu
tio
n o
f th
is r
epo
rt is
pro
hib
ited
.T
his
rep
ort
is in
ten
ded
fo
r A
nd
rea.
Filt
ri@
med
iob
anca
.co
m f
rom
MB
.An
dre
a.F
iltri
@m
edio
ban
ca.c
om
Santander
09 January 2015 ◆ 19
Price: € 6.86 Target price: € 7.60 Neutral
...raising €15bn (30% of 2009 CET1 capital) net new capital vs 40% share dilution...
Table 4 shows the average shares outstanding at SAN and the corresponding split of cash and scrip
dividends paid to shareholders from 2007 to H114, together with the RWA evolution. We highlight
the following:
Since the introduction of scrip dividends, SAN paid €8bn cash dividends and €23bn scrip
dividends, implying €15bn net capital retention...
...equivalent to 30% of the 2009 CT1 capital. From 2009 to H114, SAN‟s core capital has
only grown by €5bn, which includes the negative hit from the implementation of Basel 3
rules this year. We estimate a positive gross capital creation of €14bn by 2014YE, in line
with the estimated capital retention through scrip dividends;
The numbers of outstanding shares inflated by 40%, outpacing the capital creation in
percentage terms;
We estimate RWAs to be down 1% at 2014YE vs 2009.
...for over 20% TBVPS dilution, 30 p.p. below EU banks
This above analysis suggests that, despite the huge capital effort made, the scrip dividend policy
has not fixed SAN‟s capital stretch. At the same time, the large issuance of new shares has brought
about over 20% dilution in SAN‟s TBVPS vs 2009, comparing with 11% accretion for European banks,
despite the latter have suffered from very significant and dilutive rights issues.
Table 3: SAN DPS split, cash vs scrip, 2007-H114, € per share
DPS analysis 2007 2008 2009 2010 2011 2012 2013 2014E
Scrip 0.000 0.000 0.120 0.236 0.465 0.604 0.602 0.304
Cash 0.651 0.651 0.480 0.364 0.135 0.000 0.000
Total DPS 0.651 0.651 0.600 0.600 0.600 0.604 0.602 0.304
Cash share of DPS 100% 100% 80% 61% 23% 0% 0% 0%
Source: Mediobanca Securities, company data
Table 4: SAN DPS split, cash vs scrip, 2007-H114, € per share
DPS analysis 2007 2008 2009 2010 2011 2012 2013 2014E
Avg share count 6,254 7,124 8,111 8,279 8,619 9,615 10,827 11,333
Cash 4,070 4,636 3,893 3,014 1,165 0 0 0
Scrip 0 0 973 1,954 4,008 5,808 6,518 3,445
RWAs 515,050 514,013 561,684 604,885 528,048 557,030 489,736 555,740
Source: Mediobanca Securities

Un
auth
ori
zed
red
istr
ibu
tio
n o
f th
is r
epo
rt is
pro
hib
ited
.T
his
rep
ort
is in
ten
ded
fo
r A
nd
rea.
Filt
ri@
med
iob
anca
.co
m f
rom
MB
.An
dre
a.F
iltri
@m
edio
ban
ca.c
om
Santander
09 January 2015 ◆ 20
Price: € 6.86 Target price: € 7.60 Neutral
LATAM is slowing and getting more volatile
Rest of the group outpacing LATAM profit growth post crisis makes it less appealing
Chart 11 shows the YoY net profit growth from 2005 to 2016E for SAN‟s LATAM division and for the
rest of the group excluding the corporate centre and the R.E. runoff (ROG). The analysis includes
changes to the group‟s perimeter both in LATAM and in ROG, yet, over the period this should
provide a feel for the directional trends ongoing at the bank. We note that:
Before the crisis, LATAM delivered average annual profit growth of 27%, 3x ROG;
During the crisis, LATAM maintained its annual profits flat, while ROG fell by 10% annually,
on average;
Post crisis, we expect ROG to outperform LATAM average annual profit growth by 4x.
This naturally makes the LATAM presence relatively less attractive than in the past, in our view.
Chart 10: TBVPS evolution, SAN vs European Banks, 2009-H114
Source: Bloomberg
70
75
80
85
90
95
100
105
110
115
Dec-0
9
Feb-1
0
Apr-
10
Jun-1
0
Aug-1
0
Oct-
10
Dec-1
0
Feb-1
1
Apr-
11
Jun-1
1
Aug-1
1
Oct-
11
Dec-1
1
Feb-1
2
Apr-
12
Jun-1
2
Aug-1
2
Oct-
12
Dec-1
2
Feb-1
3
Apr-
13
Jun-1
3
Aug-1
3
Oct-
13
Dec-1
3
Feb-1
4
Apr-
14
Jun-1
4
SAN SX7P

Un
auth
ori
zed
red
istr
ibu
tio
n o
f th
is r
epo
rt is
pro
hib
ited
.T
his
rep
ort
is in
ten
ded
fo
r A
nd
rea.
Filt
ri@
med
iob
anca
.co
m f
rom
MB
.An
dre
a.F
iltri
@m
edio
ban
ca.c
om
Santander
09 January 2015 ◆ 21
Price: € 6.86 Target price: € 7.60 Neutral
Regulation could continue to be a burden...
GSIFI and TLAC: bigger is no longer better…
The Financial Stability Board (FSB) has been introducing regulation on banks to limit their „too big
to fail risk‟. These lead to Global Systemically Important Financial Institutions (GSIFI) buffers (see
below) and will lead to the introduction of „Total Loss-Absorbing Capacity‟ (TLAC) in February 2015.
Chart 11: SAN LATAM vs rest of the group ex-corporate centre and R.E. profit growth YoY
2005-16E, %
Source: Mediobanca Securities, company data
Table 5: GSIFI buffer, Nov 2014
GSIFI buffer
HSBA 2.50%
BARC 2.00%
BNPP 2.00%
DBK 2.00%
RBS 1.50%
CA 1.00%
UBS 1.00%
BBVA 1.00%
Group BPCE 1.00%
ING 1.00%
NDA 1.00%
SAN 1.00%
GLE 1.00%
STAN 1.00%
UCG 1.00%
Source: Financial Stability Board
-60%
-40%
-20%
0%
20%
40%
60%
80%
100%
LATAM RoG ex-Corp centre, R.E.

Un
auth
ori
zed
red
istr
ibu
tio
n o
f th
is r
epo
rt is
pro
hib
ited
.T
his
rep
ort
is in
ten
ded
fo
r A
nd
rea.
Filt
ri@
med
iob
anca
.co
m f
rom
MB
.An
dre
a.F
iltri
@m
edio
ban
ca.c
om
Santander
09 January 2015 ◆ 22
Price: € 6.86 Target price: € 7.60 Neutral
TLAC aims at setting a Pillar 2 buffer for GSIFI banks to reduce the overall resources available in a
resolution, limiting the potential systemic damage. In „TLAC: dividends over earnings risk, 24 Oct
2014‟, we estimated an average 6.5% risk to 2016E EPS of European GSIFIs. We therefore concluded
that TLAC would represent more a risk to DPS than EPS.
From the information released so far, we understand TLAC requirements will be imposed only on
GSIFI names, providing a potential competitive advantage for smaller, domestic banks given a
resulting lower cost of funding. This would only compensate if COE contraction for „safer‟ TLAC
compliant banks would drop so much to compensate the extra interest expenses to service the
newly issued funding instruments.
...and global banks continue to put up with mounting requests from local regulators
On top of FSB-imposed regulation, large global banks are having to put up with mounting requests
from local regulators on the requirements of the group‟s subsidiaries in the different jurisdictions.
Each local regulator is toughening rules on local capital, liquidity, compliance, making it relatively
more costly and risky to be a multinational group, in our view.
...but Banking Union could be a catalyst to rethink capital allocation
One regulator, larger shoulders...
While being a multinational bank is getting more and more difficult, the ongoing implementation of
the Banking Union in Europe could be making things easier as a single regulatory contact point with
a single rule book should at least simplify banks‟ life and reduce compliance costs.
...capital and liquidity synergies and lower COE...
In a longer term horizon, the implementation of real free mobility of capital and liquidity across the
Union should offer maximisation opportunities with positive reflection on structural RoTE. Also, the
Banking Union‟s Common Resolution and Deposit Insurance schemes should grant for lower Cost of
Equity (COE) over the longer term.
...provides an incentive to repatriate capital back to the Banking Union
If the above assumptions materialise, ceteris paribus, we could assist to a progressive
reconsideration of the geographical capital allocation of international groups with large non-
Eurozone operations.

Un
auth
ori
zed
red
istr
ibu
tio
n o
f th
is r
epo
rt is
pro
hib
ited
.T
his
rep
ort
is in
ten
ded
fo
r A
nd
rea.
Filt
ri@
med
iob
anca
.co
m f
rom
MB
.An
dre
a.F
iltri
@m
edio
ban
ca.c
om
Santander
09 January 2015 ◆ 23
Price: € 6.86 Target price: € 7.60 Neutral
SAN-BKIA: cost, funding and capital synergies Market speculation on the potential use of the new capital at SAN has already started, with
potential M&A targets across borders up strongly in yesterday’s trading day. We believe the
operation addresses SAN’s stand alone issues but in an M&A scenario would favour in-market
options such as BKIA. We benchmark the SAN-BKIA combination to the other large national
champions around Europe and find that the Spanish mammoth would not differ from others
around the Continent. We identify €0.6bn and €145m cost and funding synergies by averaging
out three bottom-up and top-down methodologies, justifying €1.5bn restructuring charges. We
model three potential ways to deliver the deal, all assuming 15% premium to BKIA’s share price:
1) a full share-for-share offer, 2) a cash bid complemented by €10bn rights issue, 3) a cash bid
funded by the sale of Brazil. We estimate the deal would deliver double digit 3-yr ROI with 4-
17% 3-yr EPS accretion and a neutral to positive impact to capital ratios, with the latter option
emerging as winner in the comparison with both the highest EPS accretion and the highest
resulting CET1 ratio. This analysis does not take into account the freshly announced capital
increase.
A ‘national champion’ like others in Europe
Table 2 shows the loan, deposit and AUM market share of the various „national champions‟ around
Europe, comparing these with the potential SAN-BKIA combination. We estimate the Spanish
conglomerate would hit 24%, 23% and 25% share, respectively, a very homogeneous level across
products. The deposit share – usually the most sensitive for antitrust purposes – would stand in line
with UK‟s Lloyds Banking Group and well below Credit Agricole‟s 31%. This would imply the deal is
likely doable from an antitrust standpoint.
€622m bottom up cost cuts...
Table 7 shows our cost synergy estimates for the SAN-BKIA combination. We assume:
100% cut of marketing, IT and Communication G&A;
50% cut of depreciation,
15% cut of staff costs,
No savings from rent/insurance/procurement
We believe this is conservative particularly on the staff cost side, where we have seen much harsher
targets from the integrations announced so far in Spain.
This totals €622m cost savings, or 32.6% of BKIA‟s 2013 cost base.
Table 6: comparison of national champions market shares, Q314
SAN BKIA SAN+BKIA ISP LLOY CA
Loans 13% 11% 24% 15% 19% 29%
Deposits 14% 9% 23% 16% 22% 31%
Mutual Funds 20% 5% 25% 22% 10% 17%
Source: Mediobanca Securities, company data

Un
auth
ori
zed
red
istr
ibu
tio
n o
f th
is r
epo
rt is
pro
hib
ited
.T
his
rep
ort
is in
ten
ded
fo
r A
nd
rea.
Filt
ri@
med
iob
anca
.co
m f
rom
MB
.An
dre
a.F
iltri
@m
edio
ban
ca.c
om
Santander
09 January 2015 ◆ 24
Price: € 6.86 Target price: € 7.60 Neutral
...and up to €290m funding savings...
Table 8 shows an estimate of the potential funding cost savings of the SAN-BKIA combination. We
conservatively estimate c.30bp lower deposit costs (excluding all other funding sources). This alone
would generate €290m lower funding costs.
...in line with Spanish and European benchmarks...
Table 9 shows the summary of the revenues and cost synergy targets of the main banking M&A deals
of the last ten years as a percentage of the target‟s revenues and costs. We note that:
We calculate an average of 24% cost cuts and 4% revenue boost in our sample;
As expected, in-market deals have targeted higher cost savings (31%) and similar revenue
boost;
Table 7: BKIA’s cost synergies
Bankia's Cost Structure 2013 % Synergy Targeted
Total Cost 1,905 100% 622
Staff Cost 1,117 59% 168
G&A 613 32%
Rent 246 13%
... o/w property, fixture, supplies 170 9%
... o/w Security 22 1%
... o/w Insurance 54 3%
Non-staff and rent 366 19% 366
... o/w IT & Communication 179 9%
... o/w Marketing 44 2%
... o/w Taxes 4 0%
... o/w Technical reports 62 3%
... o/w Other 77 4%
Depreciation 175 9% 88
Source: Mediobanca Securities
Table 8: potential funding cost savings in the SAN-BKIA combination, €
BKIA SAN Delta
Cost of time deposit, front book 0.85% 0.55% 0.30%
Cost of time deposit, back book 1.83% 1.20% 0.63%
CUSTOMER DEPOSIT COST 1.08% 0.75% 0.33%
Deposits 87,975 178,000
o/w time deposits 75,320 78,000
o/w demand deposits 12,655 99,000
o/w retail commercial paper 0 1,000
Potential savings
290
Source: Mediobanca Securities, company data

Un
auth
ori
zed
red
istr
ibu
tio
n o
f th
is r
epo
rt is
pro
hib
ited
.T
his
rep
ort
is in
ten
ded
fo
r A
nd
rea.
Filt
ri@
med
iob
anca
.co
m f
rom
MB
.An
dre
a.F
iltri
@m
edio
ban
ca.c
om
Santander
09 January 2015 ◆ 25
Price: € 6.86 Target price: € 7.60 Neutral
Isolating the recent Spanish M&A, targets skewed towards more aggressive cost savings
(36%) and minimal revenue synergies (1%).
Table 9: summary of the revenue and costs synergy targets as % of the target, 2004-2014
Date Revenue Costs
RBS/Charter One May-04 12% 24%
Santander/Abbey Nov-04 5% 17%
Danske/Irish NAB Dec-04 0% 19%
ABN AMRO/Antonveneta Mar-05 5% 15%
UCG/HVB Jul-05 1% 15%
Commerzbank/Eurohypo Oct-05 5% 15%
BNP/BNL Feb-06 7% 14%
Natixis Mar-06 9% 9%
BCP/BPI Apr-06 0% 40%
BIN-SPI Aug-06 3% 19%
BIN-SPI (realised) Aug-06 3% 27%
BPVN-BPI Oct-06 17% 22%
Credit Agricole / Cariparma Oct-06 5% 9%
Danske/Sampo Bank Nov-06 0% 18%
BPU/ BL Nov-06 0% 21%
UCG/CAP May-07 6% 24%
RBS/ABN Amro Jul-07 2% 8%
MPS/Antonveneta Nov-07 6% 25%
ISP/Carifirenze Jun-08 9% 29%
DBK/DPB Sep-08 6% 25%
Lloyds/HBOS Sep-08 0% 15%
BNP/Fortis Oct-08 3% 20%
Bankia May-11 0% 17%
POP/Pastor Oct-11 0% 40%
SAB/CAM Dec-11 4% 32%
BBVA/Unnim Mar-12 3% 40%
CABK/BdV Nov-12 0% 38%
SAN/Banesto Dec-12 4% 51%
BBVA/CX Jul-14 0% 40%
POP/Citi Jun-14 0% 20%
CABK/BARC Sep-14 0% 42%
Average (Mean) 4% 24%
Average in-market (Mean) 4% 31%
Average in Spain (Mean) 1% 36%
Source: Mediobanca Securities
Un
auth
ori
zed
red
istr
ibu
tio
n o
f th
is r
epo
rt is
pro
hib
ited
.T
his
rep
ort
is in
ten
ded
fo
r A
nd
rea.
Filt
ri@
med
iob
anca
.co
m f
rom
MB
.An
dre
a.F
iltri
@m
edio
ban
ca.c
om
Santander
09 January 2015 ◆ 26
Price: € 6.86 Target price: € 7.60 Neutral
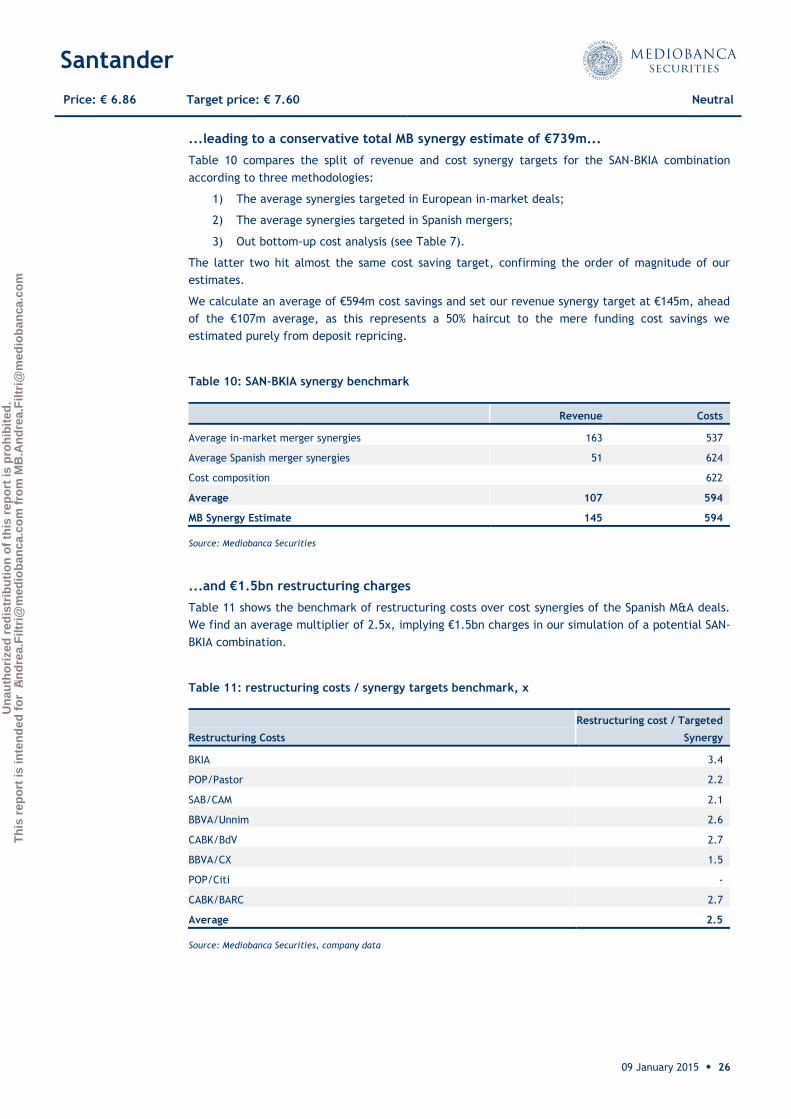
...leading to a conservative total MB synergy estimate of €739m...
Table 10 compares the split of revenue and cost synergy targets for the SAN-BKIA combination
according to three methodologies:
1) The average synergies targeted in European in-market deals;
2) The average synergies targeted in Spanish mergers;
3) Out bottom-up cost analysis (see Table 7).
The latter two hit almost the same cost saving target, confirming the order of magnitude of our
estimates.
We calculate an average of €594m cost savings and set our revenue synergy target at €145m, ahead
of the €107m average, as this represents a 50% haircut to the mere funding cost savings we
estimated purely from deposit repricing.
...and €1.5bn restructuring charges
Table 11 shows the benchmark of restructuring costs over cost synergies of the Spanish M&A deals.
We find an average multiplier of 2.5x, implying €1.5bn charges in our simulation of a potential SAN-
BKIA combination.
Table 10: SAN-BKIA synergy benchmark
Revenue Costs
Average in-market merger synergies 163 537
Average Spanish merger synergies 51 624
Cost composition 622
Average 107 594
MB Synergy Estimate 145 594
Source: Mediobanca Securities
Table 11: restructuring costs / synergy targets benchmark, x
Restructuring Costs
Restructuring cost / Targeted
Synergy
BKIA 3.4
POP/Pastor 2.2
SAB/CAM 2.1
BBVA/Unnim 2.6
CABK/BdV 2.7
BBVA/CX 1.5
POP/Citi -
CABK/BARC 2.7
Average 2.5
Source: Mediobanca Securities, company data

Un
auth
ori
zed
red
istr
ibu
tio
n o
f th
is r
epo
rt is
pro
hib
ited
.T
his
rep
ort
is in
ten
ded
fo
r A
nd
rea.
Filt
ri@
med
iob
anca
.co
m f
rom
MB
.An
dre
a.F
iltri
@m
edio
ban
ca.c
om
Santander
09 January 2015 ◆ 27
Price: € 6.86 Target price: € 7.60 Neutral
Three simulations: share-for-share, cash and Brazilian sale We run three simulations covering three alternative options of how the SAN-BKIA combination could
be structured:
1) A full share-for-share deal, limiting the capital impact but entailing controversial
governance issues;
2) A full cash deal, highly accretive from an EPS standpoint but bringing along a high balance
sheet gearing, complemented by a €10bn rights issue aimed at keeping SAN‟s CET1 ratio
unchanged;
3) A full cash deal, highly accretive from an EPS standpoint but bringing along a high balance
sheet gearing, supported by the redeployment of the proceeds from the sale of the
Brazilian unit.
Double digit 3-yr ROI, 4-17% EPS accretion and neutral-positive to CET1
Table 12 summarises the main results from our three simulations. Assuming a 15% premium to the
current BKIA share price, we see the 3-yr ROI at 11.5%, with 4-17% accretion to the 3-yr EPS and
neutral to positive (up to 110bp) impact to CET1 ratio. Among the three simulations, the numbers
suggest the following pecking order:
1) Brazilian sale the best option on paper – the BKIA cash takeover funded by the sale of
Brazil results in 110bp CET1 boost, taking SAN to 10.7%, closer to the peer average and
100bp north of the two alternative options. This should allow the cancellation of the scrip
dividend, resulting in an overall 2017E EPS accretion of 17%, 4x and 70% ahead of the
alternatives;
2) Cash and €10bn capital raise – this simulation positions #2, with a similar CET1 ratio of
the share for share option but with 10% EPS upgrade vs 4%;
3) Share for share the least likely option – the share-for-share option is the one which on
paper emerges with the least appealing outcome as – compared to the cash option – results
in: higher PE, lower EPS accretion, same CET1 ratios. Also, we regard this option the least
likely given the governance implications this would have, i.e. the FROB would become the
largest SAN shareholder with c.10% ownership.
Table 12: Summary of ROI, P/E, EPS and CET1 swings under SAN-BKIA simulations pre-ABB
Share for share Cash and capital raise
Cash and BRA sale
and scrip DVD cancellation
Premium to BKIA market price, % 15% 15% 15%
ROI, % 11.5% 11.5% 11.5%
3-yr EPS accretion, % 4% 10% 17%
2017E P/E SAN stand alone, x 11.3 11.3 11.3
2017E P/E SAN-BKIA, x 10.8 10.3 9.7
2015E CET1 SAN stand alone, % 9.6% 9.6% 9.6%
2015E CET1 SAN-BKIA, % 9.8% 9.7% 10.7%
Source: Mediobanca Securities

Un
auth
ori
zed
red
istr
ibu
tio
n o
f th
is r
epo
rt is
pro
hib
ited
.T
his
rep
ort
is in
ten
ded
fo
r A
nd
rea.
Filt
ri@
med
iob
anca
.co
m f
rom
MB
.An
dre
a.F
iltri
@m
edio
ban
ca.c
om
Santander
09 January 2015 ◆ 28
Price: € 6.86 Target price: € 7.60 Neutral
Share deal: 4% accretive in yr-3, no capital impact and 11.5% ROI
Table 13 shows the simulation of the SAN-BKIA merger in a full share-for-share deal. The simulation
assumes 15% premium to BKIA‟s share price embedded in the swap ratio and the cost and revenues
synergies and restructuring charges, net of tax, as per Table 10 and Table 11.
This leads to 2,450m new SAN shares vis-a-vis €0.8bn, €1.4bn and €1.9bn additional profit
contribution in 2015-17E. As a result we see an EPS-neutral deal in year 2 and 4% EPS accretion for
SAN in year 3 (from 11.3x to 10.8x 2017E P/E), 11.5% ROI and a stable CET1 ratio in the first two
years, becoming 30bp accretion in year 3.
Table 13: SAN-BKIA 100% share for share merger pre-ABB
Impact on Earnings, € Mn 2013 2014E 2015E 2016E 2017E
SAN standalone adj. net profit 4,618 5,954 7,183 8,148 9,053
SAN diluted shares, €m 11,333 12,510 13,461 14,485 15,356
SAN diluted EPS before rights issue, €sh 0.41 0.48 0.53 0.56 0.59
BKIA net profit 982 1,231 1,359 1,319
Restructuring cost, net -730 -365 0
Cost synergy, net 223 334 446
Revenue synergy (lower funding cost), net 27 82 109
BKIA Net profit contribution 751 1,410 1,873
SAN+BKIA adj. net profit 4,618 5,954 7,934 9,558 10,926
SAN diluted shares, €m 11,333 12,510 13,461 14,485 15,356
Additional SAN shares from swap 2,450 2,450 2,450
SAN new EPS, €/sh 0.41 0.48 0.50 0.56 0.61
EPS impact 0% 0% -7% 0% 4%
ROI and Implicit PE
ROI
4.6% 8.7% 11.5%
SAN P/E pre-merger 14.0 12.5 11.8 11.3
Implied PE post-synergies 13.3 11.8 10.8
Impact in capital ratios, €Mn
SAN old RWAs 515,829 555,740 575,327 602,138 634,064
SAN old Core tier 1 capital 43,211 48,351 55,458 63,532 67,903
Core Tier 1 ratio pre 8.4% 8.7% 9.6% 10.6% 10.7%
BKIA RWAs 88,892 90,695 92,602 96,769 101,607
SAN new RWAs 604,720 646,435 667,929 698,907 735,671
SAN tier 1 capital, pre 55,458 63,532 67,903
+Capital from BKIA 10,556 10,556 10,556
-Total goodwill / badwill 4,569 4,569 4,569
+BKIA net profit contribution 751 2,161 4,034
+Recognition of unrecognised BKIA DTAs 3,000 3,000 3,000
SAN core tier 1 capital, post 65,196 74,679 80,924
Core Tier 1 ratio 9.8% 10.7% 11.0%
Source: Mediobanca Securities, company data

Un
auth
ori
zed
red
istr
ibu
tio
n o
f th
is r
epo
rt is
pro
hib
ited
.T
his
rep
ort
is in
ten
ded
fo
r A
nd
rea.
Filt
ri@
med
iob
anca
.co
m f
rom
MB
.An
dre
a.F
iltri
@m
edio
ban
ca.c
om
Santander
09 January 2015 ◆ 29
Price: € 6.86 Target price: € 7.60 Neutral
Cash deal + €10bn rights issue: 10% accretive in yr-3, 11.5% ROI
Table 14 shows the simulation of the SAN-BKIA merger in a full cash deal, complemented by a €10bn
rights issue to maintain capital ratios. The simulation assumes 15% premium to BKIA‟s share price
and the cost and revenues synergies and restructuring charges, net of tax, as per Table 10 and
Table 11.
This leads to 1,362m new SAN shares vis-a-vis €0.7bn, €1.4bn and €1.9bn additional profit
contribution in 2015-17E. As a result we see an EPS-neutral deal in year 1 and 10% EPS accretion for
SAN in year 3 (from 11.3x to 10.3x 2017E P/E), 10% ROI and a 20bp dilution of CET1 ratio in the first
two years, becoming neutral in year 3.
Table 14: SAN-BKIA 100% cash bid and €10bn rights issue pre-ABB
Impact on Earnings, € Mn 2013 2014E 2015E 2016E 2017E
SAN standalone adj. net profit 4,618 5,954 7,183 8,148 9,053
SAN diluted shares, €m 11,333 12,510 13,461 14,485 15,356
SAN diluted EPS before rights issue, €sh 0.41 0.48 0.53 0.56 0.59
BKIA net profit 982 1,231 1,359 1,319
Restructuring cost, net -730 -365 0
Cost synergy, net 223 334 446
Revenue synergy (lower funding cost),
net 27 82 109
BKIA Net profit contribution 751 1,410 1,873
SAN+BKIA adj. net profit 4,618 5,954 7,934 9,558 10,926
SAN diluted shares, €m 11,333 12,510 13,461 14,485 15,356
Additional SAN shares from swap 1,504 1,504 1,504
SAN new EPS, €/sh 0.41 0.48 0.53 0.60 0.65
EPS impact 0% 0% -1% 6% 10%
ROI and Implicit PE
ROI 0.0% 4.6% 8.7% 11.5%
SAN P/E pre-merger 14.0 12.5 11.8 11.3
Implied PE post-synergies 14.0 12.5 11.1 10.3
Impact in capital ratios, €Mn
SAN old RWAs 515,829 555,740 575,327 602,138 634,064
SAN old Core tier 1 capital 43,211 48,351 55,458 63,532 67,903
Core Tier 1 ratio pre 8.4% 8.7% 9.6% 10.6% 10.7%
BKIA RWAs 88,892 90,695 92,602 96,769 101,607
SAN new RWAs 604,720 646,435 667,929 698,907 735,671
SAN tier 1 capital, pre 55,458 63,532 67,903
-Total goodwill / badwill 4,569 4,569 4,569
+BKIA net profit contribution 751 2,161 4,034
+Recognition of unrecognised BKIA DTAs 3,000 3,000 3,000
+Capital raised 10,000 10,000 10,000
SAN core tier 1 capital, post 64,640 74,123 80,368
Core Tier 1 ratio 9.7% 10.6% 10.9%
Source: Mediobanca Securities, company data

Un
auth
ori
zed
red
istr
ibu
tio
n o
f th
is r
epo
rt is
pro
hib
ited
.T
his
rep
ort
is in
ten
ded
fo
r A
nd
rea.
Filt
ri@
med
iob
anca
.co
m f
rom
MB
.An
dre
a.F
iltri
@m
edio
ban
ca.c
om
Santander
09 January 2015 ◆ 30
Price: € 6.86 Target price: € 7.60 Neutral
Cash deal + BRA sale: 17% accretive in yr-3, +80bp to CET1
Table 15 shows the simulation of the SAN-BKIA merger in a full cash deal, complemented by the sale
of the Brazilian unit. The simulation assumes 15% premium to BKIA‟s share price and the cost and
revenues synergies and restructuring charges, net of tax, as per Table 10 and Table 11. On the
Brazilian sale, we assume a 35% control premium.
The €9bn gain from the Brazilian sale and the RWA deconsolidation generate 80bp additional CET1
ratio taking this to 10.4% and closing a large part of the current gap on capital adequacy vs peers.
We envisage this could lead to the cancellation of the scrip dividend, which would save the issuance
of an estimated 2,846m shares over three years. The Brazilian sale would imply €1.8bn, €2bn,
€2.3bn profit deconsolidation 41%, 69%, 81% offset by earnings consolidation from BKIA. So, while in
the short term, restructuring charges and deconsolidation of Brazilian profits would imply 8% EPS
dilution, this would jump to 7% accretion in year 2 and 17% in year three, reflecting in a 2017E EPS
drop from 12.4x to 10.7x, significantly improving the appeal of SAN shares, in our view.

Un
auth
ori
zed
red
istr
ibu
tio
n o
f th
is r
epo
rt is
pro
hib
ited
.T
his
rep
ort
is in
ten
ded
fo
r A
nd
rea.
Filt
ri@
med
iob
anca
.co
m f
rom
MB
.An
dre
a.F
iltri
@m
edio
ban
ca.c
om
Santander
09 January 2015 ◆ 31
Price: € 6.86 Target price: € 7.60 Neutral
Table 15: SAN-BKIA funded by sale of Brazil pre-ABB
Impact on Earnings, € Mn 2013 2014E 2015E 2016E 2017E
SAN standalone adj. net profit 4,618 5,954 7,183 8,148 9,053
SAN diluted shares, €m 11,333 12,510 13,461 14,485 15,356
SAN diluted EPS before rights issue, €sh 0.41 0.48 0.53 0.56 0.59
BKIA net profit 982 1,231 1,359 1,319
Restructuring cost, net -730 -365 0
Cost synergy, net 223 334 446
Revenue synergy (lower funding cost), net 27 82 109
BKIA Net profit contribution 751 1,410 1,873
SAN+BKIA adj. net profit 5,954 7,934 9,558 10,926
- SAN Brazil net profit MB estimate 1,818 2,037 2,306
SAN diluted shares, €m 12,510 12,510 12,510 12,510
SAN new EPS, €/sh 0.48 0.49 0.60 0.69
EPS impact 0% -8% 7% 17%
EPS impact excl. Scrip cancellation -15% -8% -5%
ROI and Implicit PE
ROI 4.6% 8.7% 11.5%
SAN P/E pre-merger 14.0 12.5 11.8 11.3
Implied PE post-synergies 14.0 13.6 11.1 9.7
Impact in capital ratios, €Mn
SAN old RWAs 555,740 575,327 602,138 634,064
SAN old Core tier 1 capital 48,351 55,458 63,532 67,903
Core Tier 1 ratio pre 8.7% 9.6% 10.6% 10.7%
+ BKIA RWAs
90,695 92,602 96,769 101,607
- SAN Brazil RWAs 86,000 86,000 86,000 86,000
SAN new RWAs 558,327 572,773 595,187 621,579
SAN tier 1 capital, pre 55,458 63,532 67,903
-Total goodwill / badwill 4,569 4,569 4,569
+BKIA net profit contribution 751 2,161 4,034
- SAN Brazil net profit MB estimate 1,818 3,855 6,161
+Gain from selling SAN Brazil 8,693 8,693 8,693
+Recognition of unrecognised BKIA DTAs 3,000 3,000 3,000
SAN core tier 1 capital, post 61,515 68,961 72,900
Core Tier 1 ratio 10.7% 11.6% 11.7%
Source: Mediobanca Securities, company data

Un
auth
ori
zed
red
istr
ibu
tio
n o
f th
is r
epo
rt is
pro
hib
ited
.T
his
rep
ort
is in
ten
ded
fo
r A
nd
rea.
Filt
ri@
med
iob
anca
.co
m f
rom
MB
.An
dre
a.F
iltri
@m
edio
ban
ca.c
om
Santander
09 January 2015 ◆ 32
Price: € 6.86 Target price: € 7.60 Neutral
7-26% TP upside potential from the transformation We look at the implications of the three different SAN-BKIA combinations on SAN’s valuation.
We find 7-26% potential upside to our €7.6 Target Price excluding the impact of the ABB. The
sale of Brazil offers the highest upside on account of over €7bn reduction in capital shortfall,
50bp contraction in COE and €9.5bn NPV of synergies. The other two alternatives fair the same
on COE, CET1 ratio and economic capital requirement, we see the cash bid complemented by a
rights issue more accretive to valuation than the share swap as the higher rating of SAN shares
implies a lower share count dilution (c.1bn shares).
Up to 26% upside to Target Price from BKIA combination
Table 16 shows the summary of the valuation sensitivity of SAN under the different simulations of
combinations with BKIA:
Share-for-share;
Cash bid + €10bn capital hike;
Cash bid + sale of Brazil.
We see the latter providing the highest theoretical upside to our €7.6 Target Price (TP) with 26% on
account of:
1) 50bp lower COE due to the disposal of Brazil (10.7% COE) and the bulk-up of Spain (7.6%
COE);
2) 110bp higher CET1 ratio and 50bp lower economic capital requirement given the lower risk
of Spain vs Brazil imply the effective closing of the capital deficit at SAN, i.e. over €7bn
positive impact for valuation;
3) 2x P/Allocated capital.
The result would be €9.6 fair value including the NPV of the synergies discounted back by two years
at the cost of equity (COE).
A similar RoTE to the other alternatives combined with a lower COE and lower capital deficit would
command a higher valuation multiple (2x P/AC and 14x PE).
Table 16: SAN valuation range for the different simulations of the BKIA combination pre-ABB
Stand alone Share-for-share Cash bid + K hike Cash bid + BRA sale
Share count 13,306 15,940 14,823 12,510
COE 8.7% 8.5% 8.5% 8.2%
CET1 2015e 9.6% 9.8% 9.7% 10.7%
MB econ. capital requirement 11.0% 10.8% 10.8% 10.5%
RWAs 575,327 667,929 667,929 572,773
Excess capital -7,605 -9,007 -9,563 -318
MB 2015E Target Price (TP) 7.6 7.6 7.6 7.6
MB 2015E Fair Value 8.1 8.7 9.6
Implied P/AC 2015e 1.6 1.8 1.8 2.0
RoAC 2017e* 14% 15% 15% 14%
Implied P/E 2017e* 11.9 11.8 11.8 13.9
Upside to MB TP 7% 14% 26%
Source: Mediobanca Securities

Un
auth
ori
zed
red
istr
ibu
tio
n o
f th
is r
epo
rt is
pro
hib
ited
.T
his
rep
ort
is in
ten
ded
fo
r A
nd
rea.
Filt
ri@
med
iob
anca
.co
m f
rom
MB
.An
dre
a.F
iltri
@m
edio
ban
ca.c
om
Santander
09 January 2015 ◆ 33
Price: € 6.86 Target price: € 7.60 Neutral
€9.6 fair value from Brazilian disposal
Table 17 shows the sum of the parts valuation for the simulation of the SAN-BKIA combination under
the cash bid + Brazilian sale case pre-ABB. We estimate a fair value of €9.6, 26% above our SAN
Target Price on account of:
1) 10.5% capital requirement;
2) 10.1% ROAC;
3) 8.2% COE;
4) Virtually no capital shortfall;
5) €9.5bn NPV from synergies.
The lower COE and capital requirements stem from the capital reallocation from Brazil (10.7%) to
Spain (7.6%) while the virtual cancellation of the capital shortfall derives from the CET1 boost from
the Brazilian sale (80bp) and the reduction in allocated capital requirement (from 11% to 10.5%).
€8.7 fair value from cash bid + rights issue
Table 17 shows the sum of the parts valuation for the simulation of the SAN-BKIA combination under
the cash bid + rights issue case pre-ABB. We estimate a fair value of €8.7, 14% above our SAN
Target Price on account of:
6) 10.8% capital requirement;
7) 10.9% ROAC;
8) 8.5% COE;
9) €9.5bn capital shortfall;
10) €9.5bn NPV from synergies.
Table 17: SAN valuation for the BKIA combination and Brazilian sale pre-ABB
Net
profit
C.C. re-
dist
MB adj.
profit RWAs MB K alloc Alloc. K ROAC
Sust.
ROAC COE P/TBV Value
K deficit/
excess
NPV of
synergies
Per
share
CONT. EU 3,385 -839 2,546 292,569 10.2% 29,603 8.6% 15.1% 7.6% 2.x 60,368
SPAIN 2,441 -605 1,836 195,719 10.0% 19,572 9.4% 16.5% 7.6% 2.2x 42,492
...RUN_OFF -496 123 -373 7,118 10.0% 712 -52.4% 0.0% 7.7% .x 0
CONSUMER 906 -225 681 51,502 10.0% 5,150 13.2% 16.0% 7.1% 2.3x 11,606
PORTUGAL 94 -23 71 16,109 10.0% 1,611 4.4% 10.0% 8.6% 1.2x 1,873
POLAND 373 -92 281 17,306 12.0% 2,077 13.5% 16.0% 8.9% 1.8x 3,733
R.O. CONT. EU 66 -16 50 4,815 10.0% 482 10.4% 10.0% 7.3% 1.4x 664
UK 1,766 -438 1,328 102,307 10.0% 10,231 13.0% 16.0% 7.7% 2.1x 21,398
LATAM - EUR 1,872 -464 1,408 76,959 13.0% 10,005 14.1% 16.6% 11.3% 1.5x 16,401
MEXICO - EUR 691 -171 520 30,330 13.0% 3,943 13.2% 18.5% 9.5% 2.x 7,719
CHILE - EUR 639 -158 481 30,551 13.0% 3,972 12.1% 16.0% 10.7% 1.5x 5,939
REST OF LATAM 543 -134 408 16,078 13.0% 2,090 19.5% 21.0% 16.0% 1.3x 2,743
USA - EUR 1,034 -256 778 67,147 10.0% 6,715 11.6% 15.0% 8.0% 1.9x 12,590
C. Centre -1,997 33,791 10.0% 3,379 0.0% 0.0% 7.6% .x 0
GROUP 6,060 -1,997 6,060 572,773 10.5% 59,932 10.1% 14.8% 8.2% 1.8x 110,757 -318 9,588 9.6
Source: Mediobanca Securities

Un
auth
ori
zed
red
istr
ibu
tio
n o
f th
is r
epo
rt is
pro
hib
ited
.T
his
rep
ort
is in
ten
ded
fo
r A
nd
rea.
Filt
ri@
med
iob
anca
.co
m f
rom
MB
.An
dre
a.F
iltri
@m
edio
ban
ca.c
om
Santander
09 January 2015 ◆ 34
Price: € 6.86 Target price: € 7.60 Neutral
The marginally lower COE (8.5% vs 8.7%) and capital requirements (10.8% vs 11%) stem from the
marginal capital reallocation from Brazil (10.7%) to Spain (7.6%), partially compensated by the
increase in the capital shortfall by c.€2bn.
€8.1 fair value from share-for-share
Table 19 shows the sum of the parts valuation for the simulation of the SAN-BKIA combination under
the share-for-share case. We estimate a fair value of €8.1, 7% above our SAN Target Price on
account of:
11) 10.8% capital requirement;
12) 10.9% ROAC;
13) 8.5% COE;
14) €9.0bn capital shortfall;
15) €9.5bn NPV from synergies.
Table 18: SAN valuation for the BKIA cash takeover and €10bn rights issue pre-ABB
Net
profit C.C. re-dist
MB adj.
profit RWAs
MB K
alloc Alloc. K ROAC
Sust.
ROAC COE P/TBV Value
K deficit/
excess
NPV of
synergies
Per
share
CONT. EU 3,385 -684 2,700 292,569 10.2% 29,603 9.1% 15.1% 7.6% 2.x 60,368
SPAIN 2,441 -494 1,948 195,719 10.0% 19,572 10.0% 16.5% 7.6% 2.2x 42,492
...RUN_OFF -496 100 -396 7,118 10.0% 712 -55.6% 0.0% 7.7% .x 0
CONSUMER 906 -183 723 51,502 10.0% 5,150 14.0% 16.0% 7.1% 2.3x 11,606
PORTUGAL 94 -19 75 16,109 10.0% 1,611 4.7% 10.0% 8.6% 1.2x 1,873
POLAND 373 -75 298 17,306 12.0% 2,077 14.3% 16.0% 8.9% 1.8x 3,733
R.O. CONT. EU 66 -13 53 4,815 10.0% 482 11.0% 10.0% 7.3% 1.4x 664
UK 1,766 -357 1,409 102,307 10.0% 10,231 13.8% 16.0% 7.7% 2.1x 21,398
LATAM - EUR 3,691 -746 2,944 172,115 13.0% 22,375 13.2% 16.6% 5.1% 3.3x 34,321
BRAZIL - EUR 1,818 -368 1,451 95,156 13.0% 12,370 11.7% 15.5% 10.7% 1.4x 17,920
MEXICO - EUR 691 -140 551 30,330 13.0% 3,943 14.0% 18.5% 9.5% 2.x 7,719
CHILE - EUR 639 -129 510 30,551 13.0% 3,972 12.8% 16.0% 10.7% 1.5x 5,939
REST OF LATAM 543 -110 433 16,078 13.0% 2,090 20.7% 21.0% 16.0% 1.3x 2,743
USA - EUR 1,034 -209 825 67,147 10.0% 6,715 12.3% 15.0% 8.0% 1.9x 12,590
C. Centre -1,997 33,791 10.0% 3,379 0.0% 0.0% 7.6% .x 0
GROUP 7,879 -1,997 7,879 667,929 10.8% 72,302 10.9% 14.8% 8.5% 1.7x 128,677 -9,563 9,525 8.7
Source: Mediobanca Securities

Un
auth
ori
zed
red
istr
ibu
tio
n o
f th
is r
epo
rt is
pro
hib
ited
.T
his
rep
ort
is in
ten
ded
fo
r A
nd
rea.
Filt
ri@
med
iob
anca
.co
m f
rom
MB
.An
dre
a.F
iltri
@m
edio
ban
ca.c
om
Santander
09 January 2015 ◆ 35
Price: € 6.86 Target price: € 7.60 Neutral
The marginally lower COE (8.5% vs 8.7%) and capital requirements (10.8% vs 11%) stem from the
marginal capital reallocation from Brazil (10.7%) to Spain (7.6%), partially compensated by the
increase in the capital shortfall by c.€1.5bn.
€7.6 stand alone Target Price confirmed
We confirm our SAN stand alone Target Price of €7.6 and our Neutral rating. We see SAN‟s fully
loaded capital ratio as the main obstacle with c.150-200bp capital deficit vs peers and resulting in
c.€7.5bn capital shortfall in our sum of the parts valuation, which excludes the newly announced
capital increase for an equivalent amount.
Table 19: SAN valuation for the BKIA share-for-share merger pre-ABB
Net
profit
C.C.
re-dist
MB adj.
profit RWAs
MB K
alloc
Alloc.
K ROAC
Sust.
ROAC COE P/TBV Value
K deficit/
excess
NPV
synergies Per share
CONT. EU 3,385 -684 2,700 292,569 10.2% 29,603 9.1% 15.1% 7.6% 2.x 60,368
SPAIN 2,441 -494 1,948 195,719 10.0% 19,572 10.0% 16.5% 7.6% 2.2x 42,492
...RUN_OFF -496 100 -396 7,118 10.0% 712 -55.6% 0.0% 7.7% .x 0
CONSUMER 906 -183 723 51,502 10.0% 5,150 14.0% 16.0% 7.1% 2.3x 11,606
PORTUGAL 94 -19 75 16,109 10.0% 1,611 4.7% 10.0% 8.6% 1.2x 1,873
POLAND 373 -75 298 17,306 12.0% 2,077 14.3% 16.0% 8.9% 1.8x 3,733
R.O. CONT. EU 66 -13 53 4,815 10.0% 482 11.0% 10.0% 7.3% 1.4x 664
UK 1,766 -357 1,409 102,307 10.0% 10,231 13.8% 16.0% 7.7% 2.1x 21,398
LATAM - EUR 3,691 -746 2,944 172,115 13.0% 22,375 13.2% 16.6% 5.1% 3.3x 34,321
BRAZIL - EUR 1,818 -368 1,451 95,156 13.0% 12,370 11.7% 15.5% 10.7% 1.4x 17,920
MEXICO - EUR 691 -140 551 30,330 13.0% 3,943 14.0% 18.5% 9.5% 2.x 7,719
CHILE - EUR 639 -129 510 30,551 13.0% 3,972 12.8% 16.0% 10.7% 1.5x 5,939
REST OF
LATAM 543 -110 433 16,078 13.0% 2,090 20.7% 21.0% 16.0% 1.3x 2,743
USA - EUR 1,034 -209 825 67,147 10.0% 6,715 12.3% 15.0% 8.0% 1.9x 12,590
C. Centre -1,997 33,791 10.0% 3,379 0.0% 0.0% 7.6% .x 0
GROUP 7,879 -1,997 7,879 667,929 10.8% 72,302 10.9% 14.8% 8.5% 1.7x 128,677 -9,007 9,525 8.1
Source: Mediobanca Securities

Un
auth
ori
zed
red
istr
ibu
tio
n o
f th
is r
epo
rt is
pro
hib
ited
.T
his
rep
ort
is in
ten
ded
fo
r A
nd
rea.
Filt
ri@
med
iob
anca
.co
m f
rom
MB
.An
dre
a.F
iltri
@m
edio
ban
ca.c
om
Santander
09 January 2015 ◆ 36
Price: € 6.86 Target price: € 7.60 Neutral
Table 20: SAN 2015E sum of the parts valuation pre-ABB
Net
profit
C.C. re-
allocation
MB
adj.
profit
RWA
MB
capital
weight
Weight
applied
Allocated
capital ROAC
Sustainable
ROAC
Cost of
capital P/TBV Value
Capital
deficit/exc
ess, excl.
MB Basel III
adj.
Per share
value
CONT. EU 2,617 -541 2,076 199,967 10.2% 20,343 10.2% 15.1% 7.7% 2.x 41,114
SPAIN 1,673 -335 1,338 103,117 10.0% 6-9% 10,312 13.0% 16.5% 7.6% 2.2x 22,387
RUN OFF -496 99 -397 7,118 10.0% 6-9% 712 -55.8% 0.0% 7.1% .x 0
CONSUMER 906 -179 727 51,502 10.0% 6-9% 5,150 14.1% 16.0% 7.1% 2.3x 11,606
PORTUGAL 94 -18 77 16,109 10.0% 6-9% 1,611 4.8% 10.0% 8.6% 1.2x 1,873
POLAND 373 -95 278 17,306 12.0% 6-9% 2,077 13.4% 16.0% 7.3% 2.2x 4,583
R.O. CONT. EU 66 -14 53 4,815 10.0% 6-9% 482 11.0% 10.0% 7.3% 1.4x 664
UK 1,766 -346 1,420 102,307 10.0% 10,231 13.9% 16.0% 7.7% 2.1x 21,398
LATAM 3,691 -857 2,834 172,115 13.0% 22,375 12.7% 16.6% 11.0% 1.5x 34,321
BRAZIL 1,818 -410 1,408 95,156 13.0% 10-13% 12,370 11.4% 15.5% 10.7% 1.4x 17,920
MEXICO 691 -186 505 30,330 13.0% 10-13% 3,943 12.8% 18.5% 9.5% 2.x 7,719
CHILE 639 -147 492 30,551 13.0% 10-13% 3,972 12.4% 16.0% 10.7% 1.5x 5,939
R.E. LATAM 543 -113 429 16,078 13.0% 10-13% 2,090 20.5% 21.0% 16.0% 1.3x 2,743
SOVEREIGN 1,034 -253 781 67,147 10.0% 6-7% 6,715 11.6% 15.0% 8.0% 1.9x 12,590
C.C. -1,997 0 0 33,791 10.0% 6-8% 3,379 7.6%
SANTANDER 7,108 -1,997 7,111 575,327 11.0% 63,042 11.3% 14.8% 8.7% 1.7x 109,422 -7,584 7.6
Source: Mediobanca Securities

Un
auth
ori
zed
red
istr
ibu
tio
n o
f th
is r
epo
rt is
pro
hib
ited
.T
his
rep
ort
is in
ten
ded
fo
r A
nd
rea.
Filt
ri@
med
iob
anca
.co
m f
rom
MB
.An
dre
a.F
iltri
@m
edio
ban
ca.c
om
Santander
09 January 2015 ◆ 37
Price: € 6.86 Target price: € 7.60 Neutral
GENERAL DISCLOSURES
This research report is prepared by Mediobanca - Banca di credito finanziario S.p.A. (“Mediobanca S.p.A.”), authorized and supervised by Bank of Italy and Consob to provide financial services, and is compliant with the relevant European Directive provisions on investment and ancillary services (MiFID Directive) and with the implementing law.
Unless specified to the contrary, within EU Member States, the report is made available by Mediobanca S.p.A. The distribution of this document by Mediobanca S.p.A. in other jurisdictions may be restricted by law and persons into whose possession this document comes should inform themselves about, and observe, any such restrictions. All reports are disseminated and available to all clients simultaneously through electronic distribution and publication to our internal client websites. The recipient acknowledges that, to the extent permitted by applicable securities laws and regulations, Mediobanca S.p.A. disclaims all liability for providing this research, and accepts no liability whatsoever for any direct, indirect or consequential loss arising from the use of this document or its contents. This research report is provided for information purposes only and does not constitute or should not be construed as a provision of investment advice, an offer to buy or sell, or a solicitation of an offer to buy or sell, any financial instruments. It is not intended to represent the conclusive terms and conditions of any security or transaction, nor to notify you of any possible risks, direct or indirect, in undertaking such a transaction. Not all investment strategies are appropriate at all times, and past performance is not necessarily a guide to future performance. Mediobanca S.p.A. recommends that independent advice should be sought, and that investors should make their own independent decisions as to whether an investment or instrument is proper or appropriate based on their own individual judgment, their risk-tolerance, and after consulting their own investment advisers. Unless you notify Mediobanca S.p.A. otherwise, Mediobanca S.p.A. assumes that you have sufficient knowledge, experience and/or professional advice to undertake your own assessment. This research is intended for use only by those professional clients to whom it is made available by Mediobanca S.p.A. The information contained herein, including any expression of opinion, has been obtained from or is based upon sources believed to be reliable but is not guaranteed as to accuracy or completeness although Mediobanca S.p.A. considers it to be fair and not misleading. Any opinions or estimates expressed herein reflect the judgment of the author(s) as of the date the research was prepared and are subject to change at any time without notice. Unless otherwise stated, the information or opinions presented, or the research or analysis upon which they are based, are updated as necessary and at least annually. Mediobanca S.p.A. may provide hyperlinks to websites of entities mentioned in this document, however the inclusion of a link does not imply that Mediobanca S.p.A. endorses, recommends or approves any material on the linked page or accessible from it. Mediobanca S.p.A. does not accept responsibility whatsoever for any such material, nor for any consequences of its use. Neither Mediobanca S.p.A. nor any of its directors, officers, employees or agents shall have any liability, howsoever arising, for any error, inaccuracy or incompleteness of fact or opinion in this report or lack of care in its preparation or publication.
Our salespeople, traders, and other professionals may provide oral or written market commentary or trading strategies to our clients and our proprietary trading desks that reflect opinions that are contrary to the opinions expressed in this research. Our proprietary trading desks and investing businesses may make investment decisions that are inconsistent with the recommendations or views expressed in this research. The analysts named in this report may have from time to time discussed with our clients, including Mediobanca S.p.A. salespersons and traders, or may discuss in this report, trading strategies that reference catalysts or events that may have a near-term impact on the market price of the equity securities discussed in this report, which impact may be directionally counter to the analysts' published price target expectations for such stocks. Any such trading strategies are distinct from and do not affect the analysts' fundamental equity rating for such stocks, which rating reflects a stock's return potential relative to its coverage group as described herein.
ADDITIONAL DISCLAIMERS TO U.S. INVESTORS: This research report is prepared by Mediobanca S.p.A. and distributed in the United States by Mediobanca Securities USA LLC, which is a wholly owned subsidiary of Mediobanca S.p.A., is a member of Finra and is registered with the US Securities and Exchange Commission. 565 Fifth Avenue - New York NY 10017. Mediobanca Securities USA LLC accepts responsibility for the content of this report. Any US person receiving this report and wishing to effect any transaction in any security discussed in this report should contact Mediobanca Securities USA LLC at 001(212) 991-4745. Please refer to the contact page for additional contact information. All transactions by a US person in the securities mentioned in this report must be effected through Mediobanca Securities USA LLC and not through a non-US affiliate. The research analyst(s) named on this report are not registered / qualified as research analysts with Finra. The research analyst(s) are not associated persons of Mediobanca Securities USA LLC and therefore are not subject to NASD rule 2711 and incorporated NYSE rule 472 restrictions on communications with a subject company, public appearances and trading securities held by a research analyst.
ADDITIONAL DISCLAIMERS TO U.K. INVESTORS: Mediobanca S.p.A. provides investment services in the UK through a branch established in the UK (as well as directly from its establishment(s) in Italy) pursuant to its passporting rights under applicable EEA Banking and Financial Services Directives and in accordance with applicable Financial Services Authority requirements.
ADDITIONAL DISCLAIMERS TO U.A.E. INVESTORS: This research report has not been approved or licensed by the UAE Central Bank, the UAE Securities and Commodities Authority (SCA), the Dubai Financial Services Authority (DFSA) or any other relevant licensing authorities in the UAE, and does not constitute a public offer of securities in the UAE in accordance with the commercial companies law, Federal Law No. 8 of 1984 (as amended), SCA Resolution No.(37) of 2012 or otherwise. This research report is strictly private and confidential and is being issued to sophisticated investors.
REGULATORY DISCLOSURES
Mediobanca S.p.A. does and seeks to do business with companies covered in its research reports. As a result, investors should be aware that the firm may have a conflict of interest that could affect the objectivity of this report. Mediobanca S.p.A. or its affiliates or its employees may effect transactions in the securities described herein for their own account or for the account of others, may have long or short positions with the issuer thereof, or any of its affiliates, or may perform or seek to perform securities, investment banking or other services for such issuer or its affiliates. The organisational and administrative arrangements established by Mediobanca S.p.A. for the management of conflicts of interest with respect to investment research are consistent with rules, regulations or codes applicable to the securities industry. The compensation of the analyst who prepared this report is determined exclusively by research management and senior
Disclaimer

Un
auth
ori
zed
red
istr
ibu
tio
n o
f th
is r
epo
rt is
pro
hib
ited
.T
his
rep
ort
is in
ten
ded
fo
r A
nd
rea.
Filt
ri@
med
iob
anca
.co
m f
rom
MB
.An
dre
a.F
iltri
@m
edio
ban
ca.c
om
Santander
09 January 2015 ◆ 38
Price: € 6.86 Target price: € 7.60 Neutral
management (not including investment banking). Analyst compensation is not based on investment banking revenues, however, compensation may relate to the revenues of Mediobanca S.p.A. as a whole, of which investment banking, sales and trading are a part.
For a detailed explanation of the policies and principles implemented by Mediobanca S.p.A. to guarantee the integrity and independence of researches prepared by Mediobanca's analysts, please refer to the research policy which can be found at the following link: http://www.mediobanca.it/static/upload/b5d/b5d01c423f1f84fffea37bd41ccf7d74.pdf
Unless otherwise stated in the text of the research report, target prices are based on either a discounted cash flow valuation and/or comparison of valuation ratios with companies seen by the analyst as comparable or a combination of the two methods. The result of this fundamental valuation is adjusted to reflect the analyst's views on the likely course of investor sentiment. Whichever valuation method is used there is a significant risk that the target price will not be achieved within the expected timeframe. Risk factors include unforeseen changes in competitive pressures or in the level of demand for the company's products. Such demand variations may result from changes in technology, in the overall level of economic activity or, in some cases, from changes in social values. Valuations may also be affected by changes in taxation, in exchange rates and, in certain industries, in regulations. All prices are market close prices unless differently specified.
Since 1 July 2013, Mediobanca uses a relative rating system, based on the following judgements: Outperform, Neutral, Underperform and Not Rated.
Outperform (O). The stock‟s total return is expected to exceed the average total return of the analyst‟s industry (or industry team‟s) coverage universe, on a risk-adjusted basis, over the next 6-12 months.
Neutral (N). The stock‟s total return is expected to be in line with the average total return of the analyst‟s industry (or industry team‟s) coverage universe, on a risk-adjusted basis, over the next 6-12 months.
Underperform (U). The stock‟s total return is expected to be below the average total return of the analyst‟s industry (or industry team‟s) coverage universe, on a risk-adjusted basis, over the next 6-12 months.
Not Rated (NR). Currently the analyst does not have adequate confidence about the stock‟s total return relative to the average total return of the analyst‟s industry (or industry team‟s) coverage, on a risk-adjusted basis, over the next 6-12 months. Alternatively, it is applicable pursuant to Mediobanca policy in circumstances when Mediobanca is acting in any advisory capacity in a strategic transaction involving this company or when the company is the target of a tender offer.
Our recommendation relies upon the expected relative performance of the stock considered versus its benchmark. Such an expected relative performance relies upon a valuation process that is based on the analysis of the company's business model / competitive positioning / financial forecasts. The company's valuation could change in the future as a consequence of a modification of the mentioned items.
Please consider that the above rating system also drives the portfolio selections of the Mediobanca's analysts as follows: long positions can only apply to stocks rated Outperform and Neutral; short positions can only apply to stocks rated Underperform and Neutral; portfolios selection cannot refer to Not Rated stocks; Mediobanca portfolios might follow different time horizons.
Proportion of all recommendations relating to the last quarter
Outperform Neutral Underperform Not Rated
52.07% 43.55% 3.69% 0.69%
Proportion of issuers to which Mediobanca S.p.A. has supplied material investment banking services relating to the last quarter:
Outperform Neutral Underperform Not Rated
12.50% 12.86% 12.50% 50.00%
The current stock ratings system has been used since 1 July 2013. Before then, Mediobanca S.p.A. used a different system, based on the following ratings: outperform, neutral, underperform, under review, not rated. For additional details about the old ratings system, please access research reports dated before 1 July 2013 from the restricted part of the “MB Securities” section of the Mediobanca S.p.A. website at www.mediobanca.com.
Disclaimer
Un
auth
ori
zed
red
istr
ibu
tio
n o
f th
is r
epo
rt is
pro
hib
ited
.T
his
rep
ort
is in
ten
ded
fo
r A
nd
rea.
Filt
ri@
med
iob
anca
.co
m f
rom
MB
.An
dre
a.F
iltri
@m
edio
ban
ca.c
om
Santander
09 January 2015 ◆ 39
Price: € 6.86 Target price: € 7.60 Neutral
COMPANY SPECIFIC REGULATORY DISCLOSURES
MARKET MAKER Mediobanca S.p.A. is currently acting as market maker on equity instruments, or derivatives whose underlying financial instruments are materially represented by equity instruments, issued by Santander.
RATING The present rating in regard to Santander has not been changed since 08/09/2014. In the past 12 months, the rating on Santander has been changed. The previous rating, issued on 06/06/2012, was Underperform.
INITIAL COVERAGE
Santander initial coverage as of 30/06/2010.
COPYRIGHT NOTICE
No part of the content of any research material may be copied, forwarded or duplicated in any form or by any means without the prior consent of Mediobanca S.p.A., and Mediobanca S.p.A. accepts no liability whatsoever for the actions of third parties in this respect. END NOTES
The disclosures contained in research reports produced by Mediobanca S.p.A. shall be governed by and construed in accordance with Italian law. Additional information is available upon request.
Disclaimer Disclaimer Disclaimer Disclaimer Disclaimer

Un
auth
ori
zed
red
istr
ibu
tio
n o
f th
is r
epo
rt is
pro
hib
ited
.T
his
rep
ort
is in
ten
ded
fo
r A
nd
rea.
Filt
ri@
med
iob
anca
.co
m f
rom
MB
.An
dre
a.F
iltri
@m
edio
ban
ca.c
om
Santander
09 January 2015 ◆ 40
Price: € 6.86 Target price: € 7.60 Neutral
Mediobanca S.p.A. Antonio Guglielmi
Head of European Equity Research +44 203 0369 570
[email protected] ANALYSTS
European Banks
Alain Tchibozo France/IBK +44 203 0369 573 [email protected]
Adam Terelak France/IBK +44 203 0369 574 [email protected]
Andrea Filtri Spain/Italy +44 203 0369 571 [email protected]
Andreas Williams Spain +44 203 0369 577 [email protected]
Riccardo Rovere Italy/Scandinavia/CEE/Germany +39 02 8829 604 [email protected]
European Insurance
Gianluca Ferrari Italy and Reinsurance +39 02 8829 482 [email protected]
Simonetta Chiriotti Nordics +39 02 8829 933 [email protected]
Italian Research
Alessandro Tortora Building Materials/Industrials/Capital Goods +39 02 8829 673 [email protected]
Andrea Scauri Oil & Oil Related/Capital Goods +39 02 8829 496 [email protected]
Chiara Rotelli Branded Goods/Consumers Goods +39 02 8829 931 [email protected]
Fabio Pavan Media/Telecommunications/Consumer Goods +39 02 8829 633 [email protected]
Javier Suárez Utilities +39 028829 036 [email protected]
Massimo Vecchio Auto & Auto Components/Industrials/Holdings +39 02 8829 541 [email protected]
Niccolò Storer Auto & Auto Components/Industrials/Holdings +39 02 8829 444 [email protected]
Nicolò Pessina Consumer Goods/Infrastructure +39 02 8829 796 [email protected]
Simonetta Chiriotti Real Estate/ Industrials +39 02 8829 933 [email protected]
FOR NON US PERSON receiving this document and wishing to effect transactions in any securities discussed herein, please contact:
Mediobanca S.p.A. Charlotte Roden
Head of Equity Sales +44 203 0369 537
[email protected] SALES
Angelo Vietri
+39 02 8829 989 [email protected]
Christopher Seidenfaden
+44 203 0369 610 [email protected]
Lorenzo Angeloni
+39 02 8829 507 [email protected]
Timothy Pedroni
+44 203 0369 635 [email protected]
Stephane Langlois
+44 203 0369 582 [email protected]
European Spec Sales
Gaelle Jarrousse Banks +44 203 0369 530 [email protected]
Carlo Pirri Banks +44 203 0369 531 [email protected]
Gert-Jaap Kraan Insurance +44 203 0369 510 [email protected]
Mediobanca S.p.A. Dominic Bidwell
Head of Equity Trading and Sales Trading +44 203 0369 627
[email protected] SALES/TRADERS
Alessandro Gobbi
+39 02 8829 263 [email protected]
Matteo Agrati
+44 203 0369 629 [email protected]
Michael Sherry
+44 203 0369 605 [email protected]
Roberto Riboldi +39 02 8829 639 [email protected]
FOR US PERSON receiving this document and wishing to effect transactions in any securities discussed herein, please contact:
Mediobanca Securities USA LLC Pierluigi Gastone
Head of Mediobanca Securities USA LLC +1 212 991 4745
Massimiliano Pula
+1 646 839 4911 [email protected]
Robert Perez
+1 646 839 4910 [email protected]
MEDIOBANCA – Banca di Credito Finanziario S.p.A. Piazzetta Enrico Cuccia, 1 - 20121 Milano - T. +39 02 8829.1 33 Grosvenor Place – London SW1X 7HY – T. +44 (0) 203 0369 530


![Elbow Pain - Healthshare[ 6 ] Elbow Pain Wrist extension stretches These can be used to gently restore the length of the muscle and tendon complex prior to the eccentric loading exercise](https://static.fdocuments.in/doc/165x107/5e9ff843cf8c667efc2b836d/elbow-pain-healthshare-6-elbow-pain-wrist-extension-stretches-these-can-be.jpg)