2015 Virginia Assessment Sales Ratio Study of Virginia, the Virginia Department of Taxation conducts...
42
THE 2015 VIRGINIA ASSESSMENT/SALES RATIO STUDY Virginia Department of Taxation P.O. Box 565 Richmond, Virginia 23218-0565 May 2017
Transcript of 2015 Virginia Assessment Sales Ratio Study of Virginia, the Virginia Department of Taxation conducts...

THE 2015 VIRGINIA ASSESSMENT/SALES
RATIO STUDY
Virginia Department of Taxation P.O. Box 565
Richmond, Virginia 23218-0565
May 2017

Table of Contents
Page
Introduction 1
Results of the 2015 Assessment/Sales Ratio Study 2
Figure 1 Frequency Distribution of the Median Ratio - 2015 2
Figure 2 Frequency Distribution of the Coefficient of Dispersion - 2015 2
Figure 3 Frequency Distribution of the Nominal Tax Rate - 2015 3
Figure 4 Frequency Distribution of the Effective Tax Rate - 2015 4
Table 1 Latest Effective Reassessment, Number of Sales, Median 5 Assessment/Sales Ratio, Coefficient of Dispersion, & Total Fair Market Value for Virginia Localities - 2015
Table 2 Ratios of 2015 Assessed Valuations to 2015 Selling Prices of 8 Real Estate for Selected Classifications of Property
Table 3 Nominal and Effective True Real Property Tax Rates in Virginia 25 Counties and Cities - 2014 & 2015
Table 4 Estimated True Full Value of Locally Taxed Property in Virginia 28 Counties and Cities - 2015, Real Estate and Public Service Corporations
Table 5 Estimated True Value Per Capita of Locally Taxed Property in 31 Virginia Counties and Cities - 2015, Real Estate and Public Service Corporations
Appendix 1 Methodology and Terms 34
Appendix 2 Number of Sales Included in the 2015 Assessment/Sales 37 Ratio Study
Appendix 3 Computations for State Median Ratio 40

THE 2015 VIRGINIA ASSESSMENT/SALES RATIO STUDY
Introduction
In accordance with Section 207 of Title 58.1 of the Code of Virginia, the Virginia Department of Taxation conducts an annual real property Assessment/Sales Ratio Study covering every city and county in the Commonwealth. This report summarizes the results of the 2015 Study. The Study estimates the existing assessment/sales ratio for each locality by comparing assessed values to the selling prices of bona fide sales of real property. A locality's total fair market value of real estate, divided by its assessment/sales ratio, produces an estimate of the locality's total true (full) value of real estate. The local true values developed in this Study are used as a factor in Virginia's basic school aid distribution formula. The Study also determines the effective local true tax rates across the State. The effective true tax rate (expressed per $100 of true value) provides an appropriate means of comparing tax rates on similar properties in different taxing jurisdictions. The Study also serves as an element in the determination of assessment levels of public service corporation property in each locality of the State. Finally, the Study evaluates the level of uniformity in the assessment of real property within and across jurisdictions of the State.
The 2015 assessment/sales ratios are calculated from a statistical sample of all fair market real estate sales in tax year 2015, with all bona fide sales used in the case of smaller localities. The Department of Taxation allows localities to file all of their real estate transactions directly with the Department in a prescribed format. Approximately 94,379 sales are used in this Study. For each selected parcel, its assessed value in 2015 is compared to its sale price to calculate an assessment/sales ratio. The best indicator of a locality's overall assessment/sales ratio is the median, or midpoint of the ratios when ordered by value. The median ratio captures the performance of the real estate market; a low median ratio indicates a strong market. However, a median ratio close to or in excess of 100 percent (where assessed values closely approximate sales prices) may indicate that a reassessment has been undertaken recently, or may indicate a weak market.
The Study uses standard statistical measures, such as the coefficient of dispersion and the regression index, to examine the level of uniformity in the assessment of real property within and across jurisdictions in Virginia. The coefficient of dispersion is based on the average absolute deviation as recommended by the International Association of Assessing Officers (IAAO). It measures how closely individual ratios are grouped around the median; the smaller the measure of dispersion, the greater the uniformity of the ratios. The regression index compares the treatment of less expensive property with that of more expensive property. It evaluates the relative tax burdens of owners of low and high valued properties. The statistical terms, methodology used for computation, and the sources of data are detailed in the appendices.
1

Results of the 2015 Assessment/Sales Ratio Study
Median Ratio and Coefficient of Dispersion
Table 1 contains the median assessment/sales ratio and the coefficient of dispersion for every county and city in the Commonwealth. Table 1 also shows the total fair market value of real estate, the number of sales in the sample, and the latest year of reassessment, which are among the several factors that affect the median ratio and the coefficient of dispersion. Figure 1 indicates that the 2015 median ratio ranges between 80 and 100 percent for 69 of Virginia's 95 counties and 32 of its 38 cities. Figure 2 indicates that the coefficient of dispersion is less than 20 percent in 46 counties and 34 cities, and is less than 10 percent in 13 counties and 13 cities.
2

In addition to the 31 localities that undertake annual reassessments, 26 other localities (18 counties and 8 cities) had reassessments effective for 2015. Reassessments typically result in higher or lower median ratios as assessed values are brought into line with selling prices. Title 58.1, Sections 3201 and 3259 of the Code of Virginia require that real estate reassessments be at 100 percent of fair market value.
The sample used in this Study consists of 94,379 sales, covering six classes of property. Table 2 examines the variation in median ratios across localities for all six classes: (1) single-family residential urban, (2) single-family residential suburban, (3) multi-family residential, (4) commercial and industrial, (5) agricultural / undeveloped 20 -100 acres, (6) agricultural / undeveloped over 100 acres. Sales in the single-family residential urban and suburban classes dominate the total sample, with 62,163 urban and 27,252 suburban property sales. A breakdown of sample points, by locality and property class, is given in Appendix 2.
Nominal and Effective Tax Rates
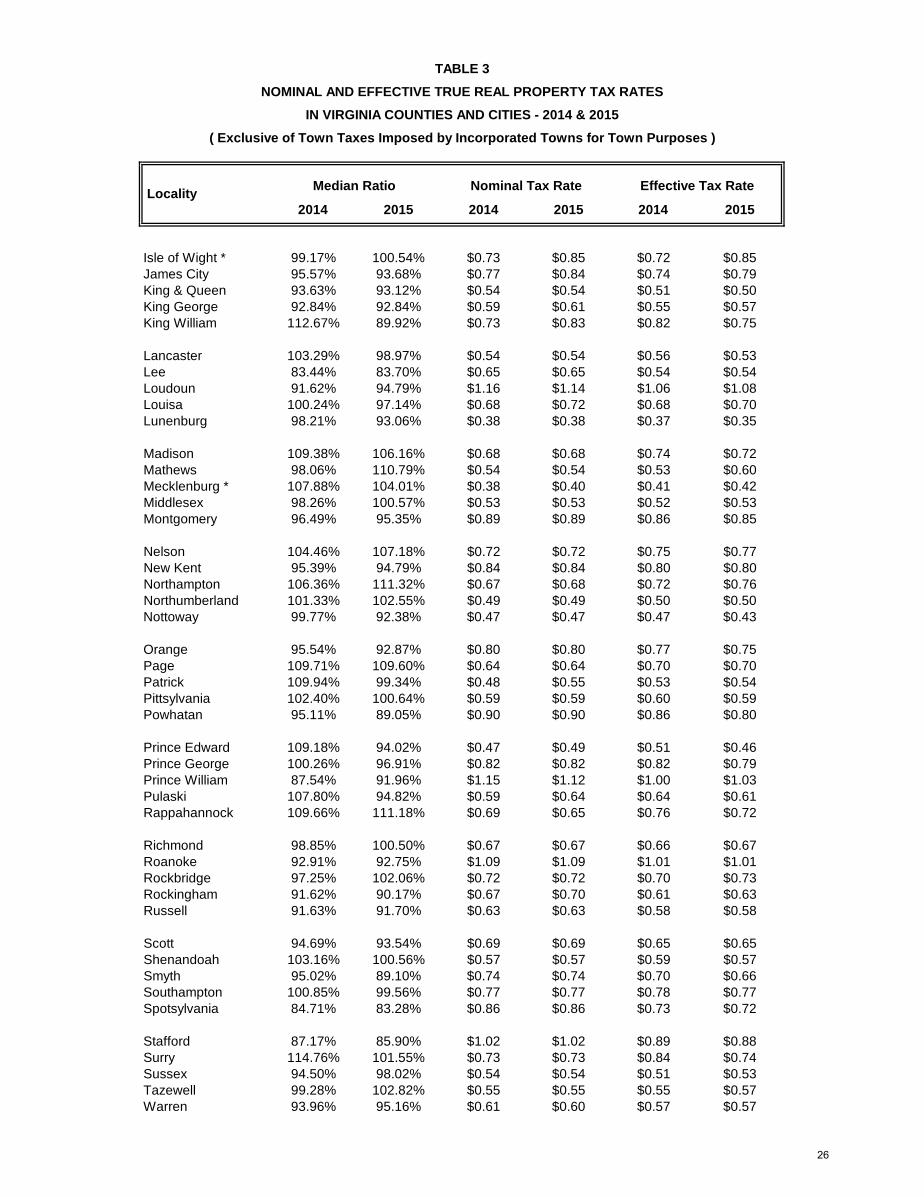
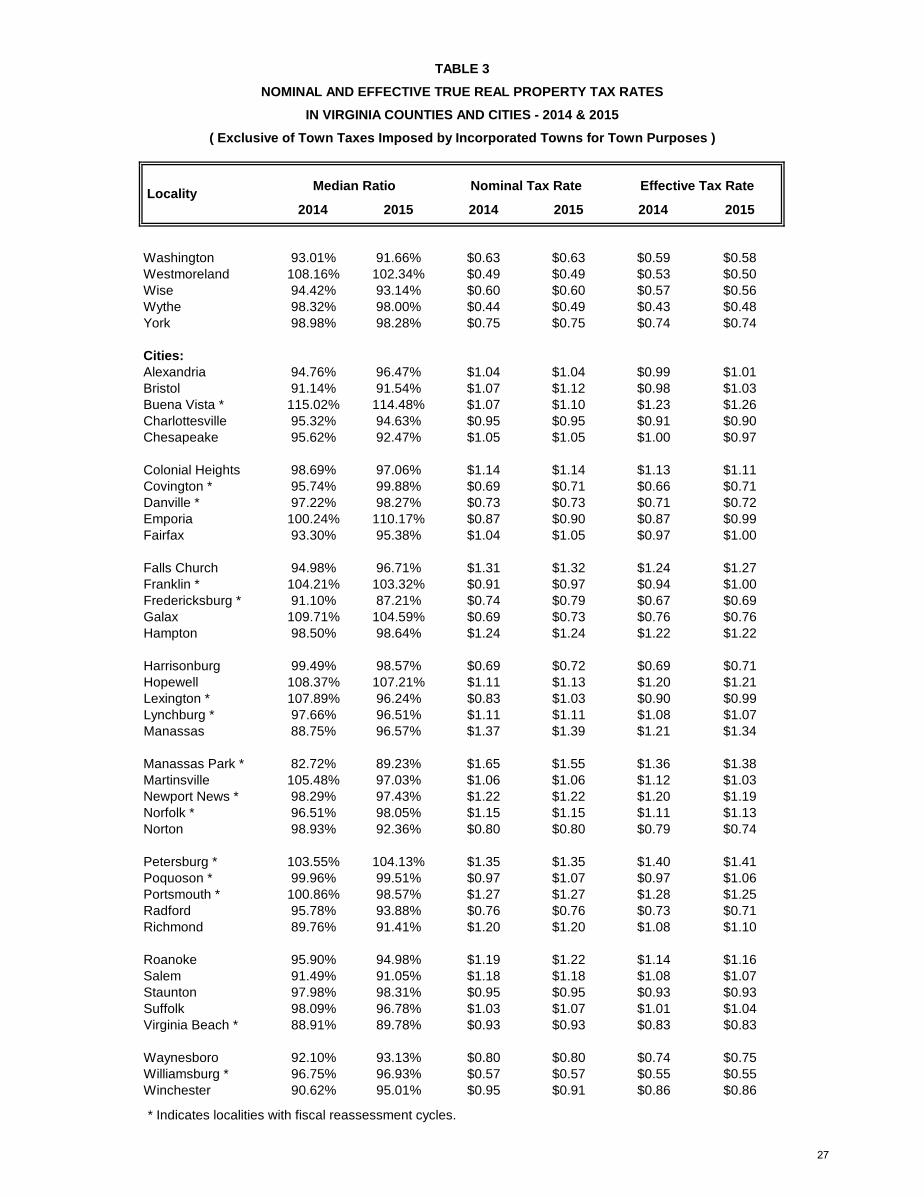
Table 3 provides the nominal and effective true tax rates for 2014 and 2015 for each locality. The 2015 median assessment/sales ratio for Virginia was 91.47%, an increase from 90.24% in 2014. The steps in the computation of the state median ratio are detailed in Appendix 3. The statewide nominal tax rate for 2015 was equal to $0.9665 per $100 of assessed value,while the estimated effective tax rate for the state was $0.8841 per $100 of true value. Figure 3shows that the nominal tax rate for 72 of Virginia's 95 counties was less than $0.80 per $100 ofassessed value. The nominal rate was greater than or equal to $1.00 per $100 of assessedvalue in 23 of Virginia’s 38 cities.
3

Localities' effective true tax rates tend to be somewhat lower than their nominal tax rates. Figure 4 shows that effective tax rates were less than $0.80 per $100 of true value for 80 of the 95 counties, and were greater than or equal to $1.00 per $100 of true value for 22 of the 38 cities.
Estimated True Value of Property
Table 4 provides the total estimated true full value of locally taxed property for real estate and public service corporations. The total estimated true value for the State was over $1.170 trillion in 2015, which is approximately 1.6% higher than the figure for 2014. The estimated true value of real estate excluding public service corporations (the total fair market value reported in the local land book divided by the median assessment/sales ratio for the locality) was over $1.125 trillion, which is approximately 1.7% higher than in 2014. Total estimated true value for public service corporations was over $45 billion; that figure includes the value reported by the State Corporation Commission, as well as, the estimated true value of railroad and interstate pipeline transmission property.
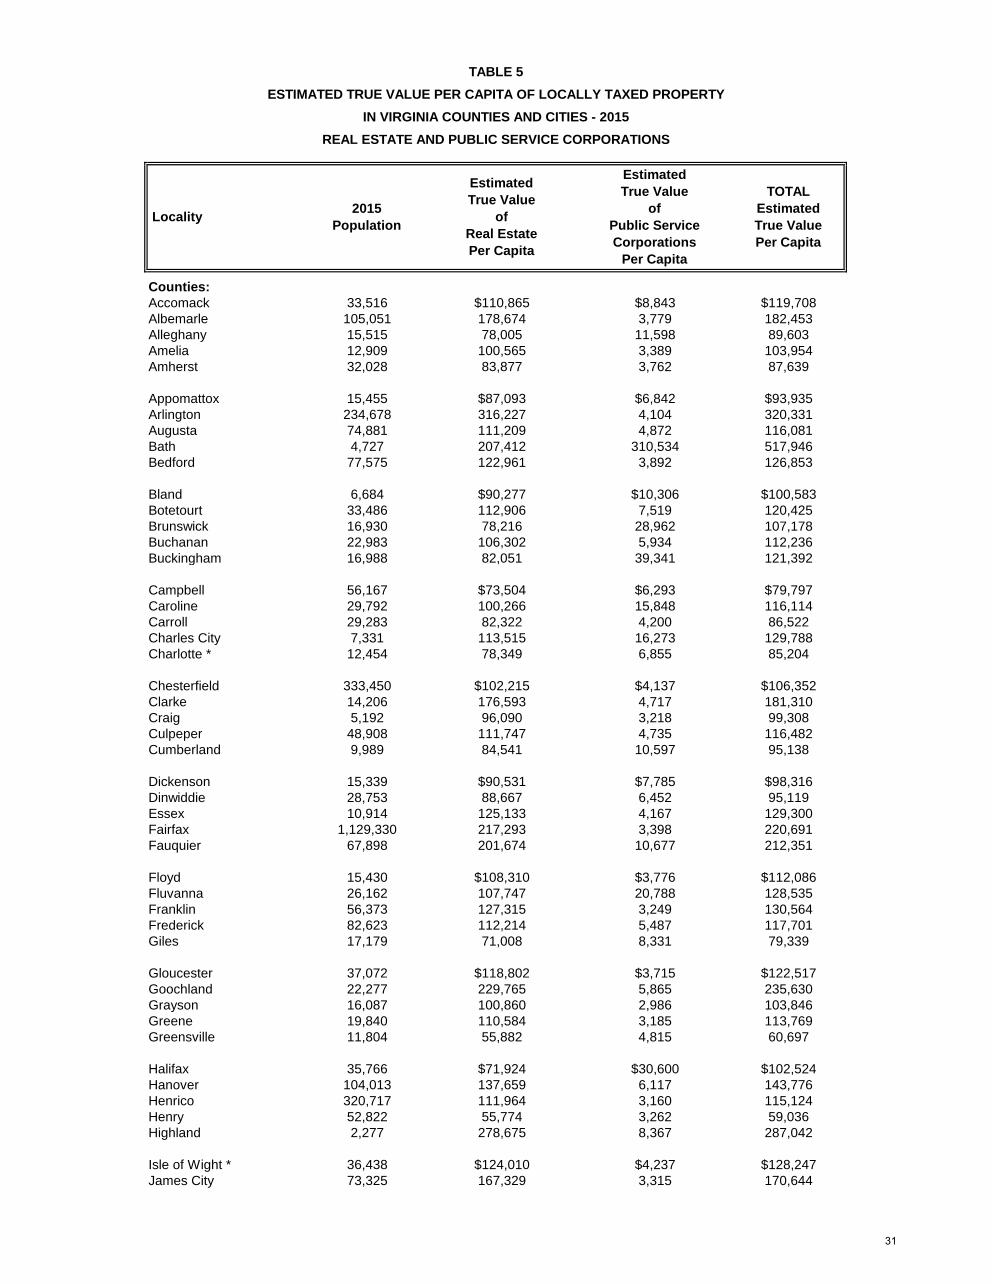
Table 5 provides the per capita estimated true full value of locally taxed property for real estate and public service corporations. Across the Commonwealth, total estimated true value averaged about $139,600 per capita. While estimated population in the State increased by about 0.7% from 2014 to 2015, the estimated true value per capita increased about 0.9%.
4

Counties:Accomack 2014 470 98.15% 24.92% $3,647,020,000Albemarle Annual 1,556 94.60% 11.15% $17,756,289,400Alleghany 2013 173 91.00% 22.94% $1,101,321,500Amelia 2012 159 87.26% 22.10% $1,132,799,500Amherst 2014 365 97.18% 19.87% $2,610,655,400
Appomattox 2014 198 98.62% 16.85% $1,327,451,619Arlington Annual 2,770 93.34% 6.97% $69,269,138,400Augusta 2014 827 96.67% 13.95% $8,050,121,200Bath 2011 46 99.82% 27.99% $978,673,900Bedford 2015 1,421 98.81% 14.53% $9,425,208,802
Bland 2014 50 97.76% 30.79% $589,892,500Botetourt 2010 419 96.75% 13.63% $3,657,885,035Brunswick 2012 149 97.76% 23.65% $1,294,538,346Buchanan 2015 97 102.42% 26.07% $2,502,263,538Buckingham 2014 105 101.22% 23.04% $1,410,886,300
Campbell 2015 505 96.59% 11.32% $3,987,697,268Caroline 2011 308 91.75% 17.76% $2,740,686,523Carroll 2013 405 98.00% 23.10% $2,362,415,580Charles City 2014 52 97.33% 20.76% $809,956,982Charlotte * 2014 114 93.74% 25.97% $914,675,911
Chesterfield Annual 3,171 94.57% 5.98% $32,232,731,100Clarke 2010 194 104.00% 14.63% $2,609,034,400Craig 2012 83 98.20% 24.24% $489,919,100Culpeper 2015 601 91.95% 12.56% $5,025,380,109Cumberland 2014 117 99.30% 24.82% $838,569,387
Dickenson 2012 49 100.13% 27.57% $1,390,457,400Dinwiddie 2013 201 98.11% 13.33% $2,501,271,468Essex 2013 126 102.28% 23.56% $1,396,844,854Fairfax Annual 13,519 92.41% 5.28% $226,770,213,865Fauquier 2014 795 85.89% 11.48% $11,761,138,100
Floyd 2015 207 103.87% 21.99% $1,735,904,000Fluvanna 2015 455 95.20% 18.79% $2,683,562,300Franklin 2012 726 98.14% 14.73% $7,043,660,700Frederick 2015 1,146 95.19% 9.58% $8,825,484,557Giles 2015 215 97.13% 23.10% $1,184,838,600
Gloucester 2015 495 97.51% 15.03% $4,294,577,074Goochland Annual 261 95.79% 9.98% $4,902,983,710Grayson 2010 245 103.44% 26.10% $1,678,342,500Greene 2015 303 95.22% 15.39% $2,089,107,465Greensville 2014 53 95.25% 24.29% $628,294,432
Halifax 2014 318 101.95% 22.04% $2,622,579,263Hanover Annual 1,209 90.66% 6.99% $12,980,971,400Henrico Annual 3,734 92.72% 8.10% $33,294,659,600Henry 2013 282 99.26% 15.86% $2,924,300,500Highland 2012 38 108.01% 23.79% $685,370,160
TotalFair Market Value
of Real Estate
TABLE 1LATEST EFFECTIVE REASSESSMENT, NUMBER OF SALES,
MEDIAN ASSESSMENT/SALES RATIO, COEFFICIENT OF DISPERSION,& TOTAL FAIR MARKET VALUE FOR VIRGINIA LOCALITIES - 2015
LocalityLatest
Reassessment(Tax Year)
Numberof Sales
MedianRatio
Coefficientof Dispersion
5

TotalFair Market Value
of Real Estate
TABLE 1LATEST EFFECTIVE REASSESSMENT, NUMBER OF SALES,
MEDIAN ASSESSMENT/SALES RATIO, COEFFICIENT OF DISPERSION,& TOTAL FAIR MARKET VALUE FOR VIRGINIA LOCALITIES - 2015
LocalityLatest
Reassessment(Tax Year)
Numberof Sales
MedianRatio
Coefficientof Dispersion
Isle of Wight * 2013 465 100.54% 15.12% $4,543,060,050James City 2014 918 93.68% 8.09% $11,494,002,400King & Queen 2012 67 93.12% 24.14% $850,092,800King George 2014 265 92.84% 15.32% $2,712,592,314King William 2015 271 89.92% 20.53% $1,640,296,131
Lancaster 2013 202 98.97% 22.31% $2,542,513,400Lee 2010 198 83.70% 29.74% $893,532,182Loudoun Annual 5,495 94.79% 5.62% $68,297,942,814Louisa Annual 500 97.14% 20.05% $4,836,890,900Lunenburg 2012 113 93.06% 31.41% $857,417,400
Madison 2013 178 106.16% 28.85% $2,267,604,200Mathews 2011 132 110.79% 22.21% $1,684,896,860Mecklenburg * 2015 288 104.01% 19.02% $3,774,016,700Middlesex 2012 232 100.57% 20.29% $2,226,089,400Montgomery 2015 1,040 95.35% 10.73% $7,541,384,700
Nelson 2014 262 107.18% 21.08% $3,003,342,100New Kent 2014 324 94.79% 13.82% $2,487,247,144Northampton 2013 190 111.32% 20.89% $2,280,796,758Northumberland 2014 269 102.55% 19.71% $2,992,473,100Nottoway 2012 138 92.38% 31.85% $913,469,910
Orange 2012 357 92.87% 13.78% $4,100,373,700Page 2011 287 109.60% 21.31% $2,429,052,700Patrick 2015 231 99.34% 29.69% $1,558,304,900Pittsylvania 2014 612 100.64% 23.08% $4,466,264,995Powhatan 2014 487 89.05% 13.65% $3,358,068,300
Prince Edward 2015 215 94.02% 22.55% $1,490,890,176Prince George Annual 209 96.91% 10.24% $2,757,065,800Prince William Annual 6,025 91.96% 6.64% $52,411,671,500Pulaski 2015 428 94.82% 17.69% $2,667,240,300Rappahannock 2010 96 111.18% 19.47% $2,152,476,600
Richmond 2015 61 100.50% 23.38% $862,466,913Roanoke Annual 1,029 92.75% 7.21% $8,135,595,300Rockbridge 2011 265 102.06% 22.81% $2,812,285,106Rockingham 2014 929 90.17% 13.88% $8,404,982,400Russell 2013 176 91.70% 23.27% $1,588,877,814
Scott 2010 227 93.54% 34.47% $1,192,991,800Shenandoah 2010 686 100.56% 18.09% $5,150,437,400Smyth 2014 262 89.10% 23.99% $1,566,806,700Southampton 2012 170 99.56% 23.98% $1,721,793,200Spotsylvania 2014 1,593 83.28% 10.93% $13,095,404,100
Stafford 2014 1,650 85.90% 9.58% $15,042,358,750Surry 2010 72 101.55% 23.54% $890,958,700Sussex 2012 74 98.02% 38.40% $852,804,175Tazewell 2012 342 102.82% 21.50% $2,784,815,400Warren 2015 525 95.16% 12.42% $4,363,458,300
6

TotalFair Market Value
of Real Estate
TABLE 1LATEST EFFECTIVE REASSESSMENT, NUMBER OF SALES,
MEDIAN ASSESSMENT/SALES RATIO, COEFFICIENT OF DISPERSION,& TOTAL FAIR MARKET VALUE FOR VIRGINIA LOCALITIES - 2015
LocalityLatest
Reassessment(Tax Year)
Numberof Sales
MedianRatio
Coefficientof Dispersion
Washington 2013 653 91.66% 22.20% $4,593,936,899Westmoreland 2010 307 102.34% 21.86% $2,683,206,100Wise 2014 83 93.14% 11.06% $1,855,681,401Wythe 2012 325 98.00% 23.57% $2,513,073,000York 2014 767 98.28% 8.46% $8,845,002,519
Cities:Alexandria Annual 2,320 96.47% 6.87% $36,481,525,456Bristol 2013 249 91.54% 23.42% $1,060,336,824Buena Vista * 2013 41 114.48% 14.15% $370,437,000Charlottesville Annual 506 94.63% 14.35% $5,953,910,000Chesapeake Annual 3,294 92.47% 5.92% $23,507,035,803
Colonial Heights 2014 164 97.06% 9.41% $1,610,852,800Covington * 2012 56 99.88% 20.37% $274,374,300Danville * 2015 213 98.27% 12.13% $2,235,865,000Emporia 2014 26 110.17% 22.08% $360,735,400Fairfax Annual 377 95.38% 6.35% $5,701,761,700
Falls Church Annual 153 96.71% 6.75% $3,868,019,700Franklin * 2015 52 103.32% 17.40% $557,261,200Fredericksburg * 2013 433 87.21% 12.84% $3,626,209,900Galax 2012 62 104.59% 24.74% $458,384,400Hampton Annual 1,079 98.64% 13.40% $10,418,531,600
Harrisonburg Annual 417 98.57% 10.08% $3,985,386,820Hopewell 2015 149 107.21% 16.42% $1,327,751,600Lexington * 2015 56 96.24% 15.84% $520,077,100Lynchburg * 2014 702 96.51% 8.17% $5,040,043,300Manassas Annual 508 96.57% 3.00% $4,716,414,000
Manassas Park * Annual 215 89.23% 8.03% $1,332,161,000Martinsville 2015 85 97.03% 13.85% $637,317,000Newport News * Annual 910 97.43% 7.24% $14,033,493,132Norfolk * Annual 1,732 98.05% 7.43% $17,806,235,050Norton 2012 23 92.36% 15.09% $218,309,472
Petersburg * Annual 103 104.13% 15.14% $1,876,468,096Poquoson * 2014 155 99.51% 10.61% $1,500,055,080Portsmouth * Annual 529 98.57% 8.04% $7,034,502,097Radford 2012 123 93.88% 12.84% $795,759,300Richmond Annual 2,317 91.41% 13.38% $20,031,295,000
Roanoke Annual 664 94.98% 7.78% $6,892,110,000Salem Annual 295 91.05% 11.16% $2,009,908,000Staunton 2015 342 98.31% 11.85% $1,813,658,931Suffolk Annual 653 96.78% 10.55% $9,423,596,600Virginia Beach * Annual 5,172 89.78% 8.82% $50,831,511,700
Waynesboro 2015 279 93.13% 12.81% $1,723,076,200Williamsburg * Annual 135 96.93% 10.66% $1,736,611,700Winchester 2015 368 95.01% 16.83% $2,923,648,800
* Indicates localities with fiscal reassessment cycles.
7

Class 1: Single Family Residential UrbanCounties:Accomack 114 96.72% 22.50% 1.08
Albemarle 998 94.05% 8.58% 1.01
Alleghany 38 101.04% 24.46% 1.13
Amelia 6 78.91% 10.09% 0.99
Amherst 33 102.63% 16.08% 1.05
Appomattox 17 106.00% 17.26% 1.02
Arlington 2,742 93.38% 6.84% 1.01
Augusta 336 95.57% 11.12% 1.01
Bedford 86 98.02% 14.09% 1.04
Botetourt 125 98.66% 10.73% 1.00
Brunswick 12 106.38% 12.40% 1.01
Campbell 215 97.42% 8.19% 1.01
Caroline 16 106.74% 14.24% 0.97
Carroll 24 104.57% 17.73% 1.04
Charlotte 21 99.33% 27.56% 1.19
Chesterfield 2,469 94.41% 5.59% 1.00
Clarke 67 99.59% 12.32% 1.06
Craig 11 119.87% 21.14% 1.04
Culpeper 204 91.80% 9.25% 1.00
Cumberland 4 139.62% 13.21% 1.04
Dickenson 8 98.56% 14.46% 1.01
Essex 21 108.16% 16.91% 1.00
Fairfax 9,936 92.12% 5.33% 1.01
Fauquier 230 84.51% 10.24% 1.00
Fluvanna 231 95.62% 15.49% 1.03
Franklin 95 98.82% 9.41% 1.01
Frederick 32 93.79% 5.97% 1.00
Giles 83 98.56% 21.80% 1.09
Goochland 26 91.06% 6.52% 0.99
Greene 9 95.79% 6.29% 1.01
Greensville 6 124.98% 12.45% 1.05
Halifax 73 101.38% 17.86% 1.05
Hanover 773 90.79% 5.74% 1.00
Henrico 3,487 92.71% 7.54% 1.00
Henry 7 94.83% 7.16% 0.99
Highland 4 106.39% 3.85% 1.01
TABLE 2
RATIO OF 2015 ASSESSED VALUATIONS
TO 2015 SELLING PRICES OF REAL ESTATE
FOR SELECTED CLASSIFICATIONS OF PROPERTY
Locality Numberof Sales
RegressionIndex
MedianRatio (%)
Coefficient of Dispersion (%)
8

TABLE 2
RATIO OF 2015 ASSESSED VALUATIONS
TO 2015 SELLING PRICES OF REAL ESTATE
FOR SELECTED CLASSIFICATIONS OF PROPERTY
Locality Numberof Sales
RegressionIndex
MedianRatio (%)
Coefficient of Dispersion (%)
Isle of Wight 48 106.98% 12.89% 1.07
James City 804 93.59% 7.82% 0.99
King George 218 92.88% 13.04% 1.01
King William 49 93.78% 18.32% 1.07
Lancaster 34 102.64% 23.08% 1.02
Lee 15 85.71% 19.65% 1.02
Loudoun 4,862 94.95% 5.07% 1.00
Louisa 18 97.05% 22.05% 1.04
Lunenburg 20 84.54% 20.35% 1.04
Madison 2 0.00% 0.00% 0.99
Mathews 5 90.75% 5.48% 0.99
Mecklenburg 72 105.24% 19.55% 1.05
Middlesex 17 100.92% 22.26% 1.06
Montgomery 713 95.43% 9.44% 1.02
Nelson 42 112.11% 19.78% 1.05
Northampton 75 102.15% 21.44% 1.08
Nottoway 40 94.54% 22.51% 1.07
Orange 39 93.71% 9.34% 0.99
Page 98 110.96% 17.29% 1.03
Patrick 4 131.35% 13.66% 1.16
Pittsylvania 50 97.59% 22.25% 1.07
Prince Edward 47 96.00% 19.98% 1.02
Prince George 88 96.13% 9.84% 1.00
Prince William 5,209 92.28% 6.07% 1.00
Pulaski 108 93.36% 20.57% 1.02
Rappahannock 11 103.60% 13.31% 0.97
Richmond 5 99.19% 11.70% 1.01
Roanoke 631 92.72% 6.89% 1.01
Rockbridge 16 108.33% 23.24% 0.88
Rockingham 223 89.32% 12.70% 1.01
Russell 22 83.77% 18.75% 1.01
Scott 38 101.21% 26.59% 1.04
Shenandoah 270 100.35% 15.07% 1.03
Smyth 85 89.77% 21.76% 1.03
Southampton 23 108.13% 19.33% 1.04
Spotsylvania 996 83.34% 8.98% 0.99
Stafford 1,221 86.11% 8.07% 1.00
Sussex 20 102.13% 30.35% 1.19
9

TABLE 2
RATIO OF 2015 ASSESSED VALUATIONS
TO 2015 SELLING PRICES OF REAL ESTATE
FOR SELECTED CLASSIFICATIONS OF PROPERTY
Locality Numberof Sales
RegressionIndex
MedianRatio (%)
Coefficient of Dispersion (%)
Tazewell 149 102.88% 22.44% 1.05
Warren 136 90.78% 10.38% 1.00
Washington 92 91.64% 21.93% 1.01
Westmoreland 98 93.90% 21.67% 1.04
Wise 37 95.24% 10.72% 1.03
Wythe 109 97.47% 18.31% 1.02
York 715 98.32% 7.87% 1.01
Class 1: Single Family Residential UrbanCities:Alexandria 2,260 96.47% 6.65% 1.02
Bristol 230 91.64% 21.76% 1.05
Buena Vista 38 114.88% 13.79% 1.01
Charlottesville 435 94.03% 13.50% 1.04
Chesapeake 2,923 92.68% 5.56% 1.00
Colonial Heights 154 97.33% 8.22% 1.01
Covington 54 100.32% 20.61% 1.08
Danville 191 98.75% 11.05% 1.01
Emporia 19 110.00% 18.21% 1.04
Fairfax 352 95.43% 6.11% 1.00
Falls Church 151 96.71% 6.69% 1.00
Franklin 47 98.96% 17.71% 1.05
Fredericksburg 400 86.98% 11.83% 1.01
Galax 48 104.13% 23.53% 1.11
Hampton 1,039 98.70% 13.07% 1.03
Harrisonburg 367 98.66% 9.60% 1.02
Hopewell 133 106.17% 15.17% 1.05
Lexington 54 97.15% 15.30% 1.03
Lynchburg 649 96.46% 7.85% 1.01
Manassas 501 96.57% 2.83% 1.00
Manassas Park 126 89.36% 8.78% 0.99
Martinsville 77 97.18% 13.14% 1.03
Newport News 870 97.57% 6.86% 1.01
Norfolk 1,665 98.08% 7.12% 1.01
Norton 18 90.26% 11.27% 1.01
Petersburg 59 107.08% 13.28% 1.03
Poquoson 151 99.51% 10.23% 1.01
Portsmouth 494 98.93% 6.72% 1.01
10

TABLE 2
RATIO OF 2015 ASSESSED VALUATIONS
TO 2015 SELLING PRICES OF REAL ESTATE
FOR SELECTED CLASSIFICATIONS OF PROPERTY
Locality Numberof Sales
RegressionIndex
MedianRatio (%)
Coefficient of Dispersion (%)
Radford 114 93.88% 12.45% 1.02
Richmond 2,075 91.30% 12.58% 1.03
Roanoke 11 86.90% 20.22% 0.97
Salem 276 91.57% 10.08% 1.01
Staunton 311 98.50% 10.91% 1.02
Suffolk 38 99.62% 11.74% 1.00
Virginia Beach 4,988 89.81% 8.51% 1.01
Waynesboro 266 93.05% 12.58% 1.03
Williamsburg 130 96.59% 10.52% 1.03
Winchester 316 94.64% 14.93% 1.04
Class 2: Single Family Residential SuburbanCounties:Accomack 280 100.99% 24.24% 1.11
Albemarle 441 94.98% 14.52% 1.04
Alleghany 111 89.22% 20.94% 1.05
Amelia 123 86.35% 20.52% 1.05
Amherst 286 96.11% 19.26% 1.06
Appomattox 148 96.91% 15.29% 1.05
Augusta 424 97.95% 14.42% 1.03
Bath 36 101.02% 28.30% 1.12
Bedford 1,250 98.48% 14.14% 1.04
Bland 43 98.67% 29.62% 1.23
Botetourt 260 95.71% 13.37% 1.02
Brunswick 100 97.69% 24.22% 1.06
Buchanan 75 102.08% 25.35% 1.07
Buckingham 79 101.22% 20.59% 1.08
Campbell 249 95.63% 12.81% 1.01
Caroline 256 91.90% 16.32% 1.05
Carroll 341 98.28% 23.45% 1.08
Charles City 41 96.80% 19.83% 1.08
Charlotte 56 94.91% 25.79% 1.04
Chesterfield 613 95.43% 6.15% 1.00
Clarke 104 105.99% 13.20% 1.03
Craig 49 99.05% 24.04% 1.03
Culpeper 348 92.02% 13.53% 1.03
Cumberland 85 98.68% 25.86% 1.09
Dickenson 28 107.24% 30.10% 1.10
11

TABLE 2
RATIO OF 2015 ASSESSED VALUATIONS
TO 2015 SELLING PRICES OF REAL ESTATE
FOR SELECTED CLASSIFICATIONS OF PROPERTY
Locality Numberof Sales
RegressionIndex
MedianRatio (%)
Coefficient of Dispersion (%)
Dinwiddie 182 97.74% 12.49% 1.03
Essex 92 98.48% 24.94% 1.15
Fairfax 3,462 93.19% 4.90% 1.00
Fauquier 519 87.54% 11.33% 1.00
Floyd 157 101.95% 21.38% 1.06
Fluvanna 208 94.33% 21.89% 1.05
Franklin 590 98.13% 15.20% 1.04
Frederick 1,080 95.22% 9.54% 1.01
Giles 105 95.00% 25.09% 1.09
Gloucester 465 97.42% 14.20% 1.03
Goochland 213 96.11% 9.58% 1.00
Grayson 213 102.27% 26.85% 1.09
Greene 286 94.79% 15.69% 1.03
Greensville 34 96.83% 23.62% 1.02
Halifax 163 102.90% 24.10% 1.07
Hanover 389 90.00% 8.56% 1.00
Henrico 145 92.75% 12.71% 1.01
Henry 248 99.67% 14.71% 1.02
Highland 18 101.11% 21.61% 1.09
Isle of Wight 389 99.06% 14.76% 1.02
James City 96 94.53% 9.28% 1.01
King & Queen 53 92.93% 26.79% 1.04
King George 43 99.25% 25.28% 1.10
King William 194 89.11% 18.05% 1.06
Lancaster 161 98.66% 22.40% 1.09
Lee 132 84.45% 29.94% 1.04
Loudoun 491 92.45% 8.97% 1.01
Louisa 432 96.86% 18.56% 1.07
Lunenburg 58 111.20% 28.46% 1.15
Madison 151 106.00% 27.72% 1.17
Mathews 118 112.35% 22.52% 1.10
Mecklenburg 177 103.84% 18.09% 1.03
Middlesex 190 100.09% 19.48% 1.06
Montgomery 271 94.03% 12.52% 1.02
Nelson 174 105.27% 20.47% 1.05
New Kent 306 94.73% 13.45% 1.02
Northampton 96 118.61% 18.29% 1.03
Northumberland 261 102.55% 19.33% 1.06
12

TABLE 2
RATIO OF 2015 ASSESSED VALUATIONS
TO 2015 SELLING PRICES OF REAL ESTATE
FOR SELECTED CLASSIFICATIONS OF PROPERTY
Locality Numberof Sales
RegressionIndex
MedianRatio (%)
Coefficient of Dispersion (%)
Nottoway 63 97.50% 36.63% 1.13
Orange 291 92.35% 13.77% 1.05
Page 178 109.18% 22.61% 1.05
Patrick 174 99.43% 30.21% 1.08
Pittsylvania 478 100.06% 22.24% 1.07
Powhatan 457 88.85% 13.27% 1.04
Prince Edward 131 94.14% 21.74% 1.07
Prince George 113 97.21% 10.71% 1.02
Prince William 748 89.43% 9.51% 1.00
Pulaski 288 94.29% 16.59% 1.01
Rappahannock 54 115.88% 18.91% 1.05
Richmond 43 106.11% 19.73% 1.09
Roanoke 347 92.57% 6.92% 1.00
Rockbridge 214 100.26% 22.05% 1.06
Rockingham 597 90.33% 13.52% 1.01
Russell 120 94.62% 22.51% 1.11
Scott 129 93.33% 32.71% 1.05
Shenandoah 360 100.22% 18.69% 1.06
Smyth 147 87.71% 23.81% 1.04
Southampton 119 100.01% 24.16% 1.09
Spotsylvania 532 82.77% 12.75% 0.99
Stafford 388 85.39% 12.98% 1.02
Surry 53 109.70% 22.27% 0.97
Sussex 31 117.20% 39.14% 1.19
Tazewell 156 105.11% 20.31% 1.06
Warren 372 96.03% 12.32% 1.01
Washington 483 91.02% 20.60% 1.03
Westmoreland 192 104.17% 20.83% 1.05
Wise 44 89.51% 10.73% 1.03
Wythe 165 98.30% 25.50% 1.06
York 23 93.14% 12.59% 0.97
Class 2: Single Family Residential SuburbanCities:Chesapeake 287 89.25% 7.39% 1.00
Manassas Park 56 89.14% 5.21% 1.00
Petersburg 17 104.84% 11.26% 1.01
Roanoke 577 94.90% 7.21% 1.01
13

TABLE 2
RATIO OF 2015 ASSESSED VALUATIONS
TO 2015 SELLING PRICES OF REAL ESTATE
FOR SELECTED CLASSIFICATIONS OF PROPERTY
Locality Numberof Sales
RegressionIndex
MedianRatio (%)
Coefficient of Dispersion (%)
Staunton 1 0.00% 0.00% 1.00
Suffolk 561 96.74% 8.00% 1.01
Virginia Beach 75 89.47% 12.82% 1.01
Class 3: Multi-Family ResidentialCounties:Accomack 7 101.85% 15.40% 1.05
Albemarle 6 95.86% 5.55% 0.95
Alleghany 1 0.00% 0.00% 1.00
Amherst 7 109.73% 11.65% 0.97
Arlington 17 81.45% 19.56% 0.85
Augusta 2 0.00% 0.00% 1.17
Bedford 1 0.00% 0.00% 1.00
Botetourt 4 82.81% 27.82% 1.15
Campbell 5 108.71% 19.55% 0.96
Caroline 1 0.00% 0.00% 1.00
Carroll 2 0.00% 0.00% 1.02
Chesterfield 2 0.00% 0.00% 0.99
Craig 1 0.00% 0.00% 1.00
Culpeper 3 88.04% 7.46% 1.12
Cumberland 2 0.00% 0.00% 1.01
Fairfax 4 85.70% 8.53% 1.01
Floyd 1 0.00% 0.00% 1.00
Fluvanna 1 0.00% 0.00% 1.00
Franklin 2 0.00% 0.00% 1.09
Giles 1 0.00% 0.00% 1.00
Gloucester 4 108.88% 8.93% 1.00
Greene 1 0.00% 0.00% 1.00
Halifax 2 0.00% 0.00% 1.17
Hanover 3 96.78% 2.14% 0.97
Henrico 1 0.00% 0.00% 1.00
Henry 3 97.41% 25.44% 1.12
Isle of Wight 1 0.00% 0.00% 1.00
James City 1 0.00% 0.00% 1.00
King George 1 0.00% 0.00% 1.00
Lee 1 0.00% 0.00% 1.00
Loudoun 1 0.00% 0.00% 1.00
Middlesex 4 135.00% 19.75% 1.06
14

TABLE 2
RATIO OF 2015 ASSESSED VALUATIONS
TO 2015 SELLING PRICES OF REAL ESTATE
FOR SELECTED CLASSIFICATIONS OF PROPERTY
Locality Numberof Sales
RegressionIndex
MedianRatio (%)
Coefficient of Dispersion (%)
Montgomery 6 92.93% 14.57% 1.06
Nelson 1 0.00% 0.00% 1.00
Northampton 1 0.00% 0.00% 1.00
Nottoway 1 0.00% 0.00% 1.00
Orange 5 96.52% 3.43% 1.00
Pittsylvania 1 0.00% 0.00% 1.00
Prince Edward 1 0.00% 0.00% 1.00
Prince William 6 77.52% 10.81% 1.06
Pulaski 3 133.00% 10.94% 1.17
Roanoke 25 93.86% 9.11% 1.13
Rockbridge 1 0.00% 0.00% 1.00
Rockingham 27 92.96% 8.17% 1.03
Scott 1 0.00% 0.00% 1.00
Shenandoah 2 0.00% 0.00% 1.31
Smyth 2 0.00% 0.00% 1.00
Spotsylvania 1 0.00% 0.00% 1.00
Stafford 2 0.00% 0.00% 1.19
Warren 4 121.06% 13.13% 0.98
Washington 5 135.38% 16.94% 0.98
Wythe 3 115.06% 21.26% 1.18
York 1 0.00% 0.00% 1.00
Class 3: Multi-Family ResidentialCities:Alexandria 6 95.71% 12.65% 1.01
Bristol 3 102.20% 42.11% 1.50
Charlottesville 51 94.88% 19.26% 1.03
Chesapeake 9 92.44% 6.93% 0.97
Colonial Heights 1 0.00% 0.00% 1.00
Emporia 1 0.00% 0.00% 1.00
Franklin 2 0.00% 0.00% 1.05
Fredericksburg 10 94.01% 23.41% 0.81
Hampton 7 90.39% 25.52% 1.18
Harrisonburg 26 100.19% 6.81% 1.31
Hopewell 6 124.64% 19.20% 0.84
Lynchburg 25 96.67% 8.30% 1.01
Manassas 1 0.00% 0.00% 1.00
Manassas Park 31 87.76% 9.53% 0.99
15

TABLE 2
RATIO OF 2015 ASSESSED VALUATIONS
TO 2015 SELLING PRICES OF REAL ESTATE
FOR SELECTED CLASSIFICATIONS OF PROPERTY
Locality Numberof Sales
RegressionIndex
MedianRatio (%)
Coefficient of Dispersion (%)
Martinsville 3 123.76% 11.17% 1.13
Newport News 9 85.19% 9.07% 1.02
Norfolk 9 101.88% 15.99% 1.07
Norton 1 0.00% 0.00% 1.00
Petersburg 5 96.38% 14.68% 1.11
Portsmouth 11 91.93% 23.60% 1.18
Radford 4 95.84% 10.32% 1.08
Richmond 147 94.85% 18.29% 1.06
Roanoke 41 97.67% 9.17% 1.04
Salem 5 101.68% 13.19% 1.09
Staunton 10 119.64% 13.04% 1.01
Suffolk 2 0.00% 0.00% 3.34
Virginia Beach 5 78.60% 8.81% 0.89
Wayesboro 7 101.83% 12.85% 1.01
Winchester 12 92.40% 34.55% 0.98
Class 4: Commercial/IndustrialCounties:Accomack 24 94.15% 38.48% 1.22
Albemarle 21 101.49% 21.49% 1.03
Alleghany 10 89.10% 37.83% 1.33
Amelia 4 69.69% 61.61% 2.43
Amherst 16 100.75% 25.98% 1.23
Appomattox 4 95.29% 16.09% 1.14
Arlington 11 82.21% 16.99% 0.91
Augusta 18 80.63% 28.62% 1.17
Bath 1 0.00% 0.00% 1.00
Bedford 15 102.79% 16.69% 1.00
Botetourt 9 95.47% 9.57% 0.91
Brunswick 3 76.52% 36.10% 0.90
Buchanan 13 102.18% 27.59% 1.05
Buckingham 4 95.13% 50.97% 1.05
Campbell 16 101.26% 16.96% 1.14
Caroline 12 102.72% 33.03% 1.13
Carroll 8 84.79% 23.65% 1.08
Charles City 1 0.00% 0.00% 1.00
Charlotte 6 92.10% 31.29% 1.34
Chesterfield 66 93.69% 17.64% 1.09
16

TABLE 2
RATIO OF 2015 ASSESSED VALUATIONS
TO 2015 SELLING PRICES OF REAL ESTATE
FOR SELECTED CLASSIFICATIONS OF PROPERTY
Locality Numberof Sales
RegressionIndex
MedianRatio (%)
Coefficient of Dispersion (%)
Clarke 6 130.97% 14.24% 1.07
Craig 4 106.38% 20.39% 0.89
Culpeper 9 84.95% 22.33% 1.19
Cumberland 1 0.00% 0.00% 1.00
Dickenson 4 54.13% 34.21% 0.97
Dinwiddie 2 0.00% 0.00% 0.99
Essex 3 138.26% 22.13% 1.24
Fairfax 117 91.27% 10.33% 1.06
Fauquier 17 78.91% 19.08% 1.01
Fluvanna 2 0.00% 0.00% 1.01
Franklin 4 99.88% 12.90% 1.02
Frederick 17 96.46% 7.59% 1.00
Giles 4 109.55% 17.19% 0.99
Gloucester 15 102.71% 28.84% 1.14
Goochland 3 94.78% 5.79% 1.05
Greene 1 0.00% 0.00% 1.00
Greensville 3 92.70% 9.82% 1.10
Halifax 13 100.70% 20.97% 1.08
Hanover 27 89.28% 15.39% 1.10
Henrico 96 93.22% 21.41% 1.13
Henry 13 102.65% 26.24% 1.46
Highland 1 0.00% 0.00% 1.00
Isle of Wight 12 97.26% 26.43% 1.06
James City 14 94.93% 14.01% 0.98
King George 3 74.27% 10.39% 1.00
King William 9 99.06% 38.79% 1.70
Lancaster 3 86.72% 11.08% 1.07
Lee 2 0.00% 0.00% 0.84
Loudoun 95 94.24% 12.22% 1.00
Louisa 6 80.83% 30.68% 1.53
Lunenburg 5 88.48% 45.98% 1.26
Mathews 5 87.95% 12.74% 1.02
Mecklenburg 13 103.17% 15.34% 1.05
Middlesex 14 105.51% 22.71% 1.16
Montgomery 35 97.85% 16.41% 1.06
Nelson 7 115.56% 34.56% 1.36
New Kent 4 78.51% 27.43% 1.08
Northampton 11 90.95% 39.89% 0.89
17

TABLE 2
RATIO OF 2015 ASSESSED VALUATIONS
TO 2015 SELLING PRICES OF REAL ESTATE
FOR SELECTED CLASSIFICATIONS OF PROPERTY
Locality Numberof Sales
RegressionIndex
MedianRatio (%)
Coefficient of Dispersion (%)
Northumberland 1 0.00% 0.00% 1.00
Nottoway 7 71.16% 43.36% 0.89
Orange 10 102.47% 24.34% 1.16
Page 6 94.30% 50.45% 1.28
Patrick 6 111.29% 19.22% 1.08
Pittsylvania 14 146.13% 28.44% 0.95
Powhatan 12 94.39% 11.30% 1.06
Prince Edward 6 89.89% 26.94% 0.84
Prince George 2 0.00% 0.00% 1.00
Prince William 57 85.17% 17.71% 1.25
Pulaski 9 96.79% 22.59% 0.97
Rappahannock 4 79.61% 7.50% 0.98
Richmond 5 89.01% 35.49% 1.05
Roanoke 20 91.07% 19.54% 0.96
Rockbridge 5 109.17% 30.44% 0.96
Rockingham 22 81.41% 23.72% 1.14
Russell 9 87.85% 18.42% 1.12
Scott 2 0.00% 0.00% 1.07
Shenandoah 14 101.71% 35.27% 1.10
Smyth 11 101.67% 34.29% 0.94
Southampton 4 127.64% 17.05% 1.13
Spotsylvania 53 92.41% 24.24% 1.12
Stafford 32 83.73% 22.47% 1.15
Sussex 4 99.47% 48.82% 1.27
Tazewell 16 91.41% 26.10% 1.08
Warren 8 100.81% 15.16% 1.12
Washington 24 86.78% 32.37% 1.43
Westmoreland 5 45.27% 64.04% 1.56
Wise 2 0.00% 0.00% 1.04
Wythe 19 107.85% 27.88% 1.04
York 28 95.77% 20.32% 1.09
Class 4: Commercial/IndustrialCities:Alexandria 54 96.06% 15.53% 1.10
Bristol 16 79.38% 46.77% 1.43
Buena Vista 3 94.30% 14.78% 1.00
Charlottesville 20 104.99% 16.67% 1.02
18

TABLE 2
RATIO OF 2015 ASSESSED VALUATIONS
TO 2015 SELLING PRICES OF REAL ESTATE
FOR SELECTED CLASSIFICATIONS OF PROPERTY
Locality Numberof Sales
RegressionIndex
MedianRatio (%)
Coefficient of Dispersion (%)
Chesapeake 40 90.92% 15.36% 1.22
Colonial Heights 9 71.24% 28.29% 1.06
Covington 2 0.00% 0.00% 1.06
Danville 22 89.27% 22.17% 1.05
Emporia 6 99.39% 34.15% 0.87
Fairfax 25 95.33% 9.73% 1.07
Falls Church 2 0.00% 0.00% 1.01
Franklin 3 108.29% 19.18% 0.84
Fredericksburg 23 90.88% 23.83% 1.16
Galax 14 112.35% 27.20% 1.15
Hampton 33 91.92% 21.99% 1.50
Harrisonburg 24 88.64% 19.74% 1.11
Hopewell 10 127.42% 21.52% 1.22
Lexington 2 0.00% 0.00% 0.97
Lynchburg 28 96.84% 15.68% 1.06
Manassas 6 109.31% 14.86% 1.09
Manassas Park 1 0.00% 0.00% 1.00
Martinsville 5 77.16% 12.93% 1.06
Newport News 31 89.54% 16.26% 1.02
Norfolk 58 97.13% 14.86% 1.08
Norton 4 106.18% 17.83% 1.20
Petersburg 22 97.46% 23.23% 1.16
Poquoson 4 86.97% 28.41% 1.05
Portsmouth 24 89.69% 28.41% 1.20
Radford 4 107.10% 10.81% 1.02
Richmond 95 91.54% 22.15% 1.02
Roanoke 35 94.56% 11.17% 0.99
Salem 14 65.97% 22.70% 1.07
Staunton 20 80.80% 18.79% 0.97
Suffolk 40 95.81% 34.45% 1.29
Virginia Beach 94 82.78% 21.41% 1.08
Waynesboro 6 84.88% 17.33% 1.15
Williamsburg 5 101.36% 13.76% 0.98
Winchester 40 98.98% 25.89% 1.06
Class 5: Agricultural Undeveloped 20-100 acresCounties:Accomack 36 87.94% 27.16% 1.19
19

TABLE 2
RATIO OF 2015 ASSESSED VALUATIONS
TO 2015 SELLING PRICES OF REAL ESTATE
FOR SELECTED CLASSIFICATIONS OF PROPERTY
Locality Numberof Sales
RegressionIndex
MedianRatio (%)
Coefficient of Dispersion (%)
Albemarle 80 104.71% 17.57% 1.04
Alleghany 11 87.96% 8.58% 1.02
Amelia 21 97.90% 22.62% 1.02
Amherst 17 94.09% 26.89% 1.15
Appomattox 26 105.12% 19.16% 1.04
Augusta 39 104.13% 20.98% 1.05
Bath 6 80.59% 12.86% 1.00
Bedford 61 105.83% 18.61% 1.00
Bland 5 84.13% 13.81% 1.07
Botetourt 18 110.02% 26.00% 1.11
Brunswick 26 100.57% 23.02% 1.04
Buchanan 8 130.88% 15.75% 1.06
Buckingham 12 100.97% 24.52% 0.98
Campbell 14 87.01% 20.34% 0.99
Caroline 17 88.59% 25.14% 1.12
Carroll 25 88.86% 24.71% 1.13
Charles City 9 106.12% 22.02% 1.13
Charlotte 26 82.19% 24.86% 1.05
Chesterfield 20 93.64% 6.92% 1.01
Clarke 11 118.81% 24.17% 1.53
Craig 14 90.98% 22.67% 1.08
Culpeper 32 94.63% 19.92% 1.06
Cumberland 21 106.07% 19.81% 1.12
Dickenson 8 94.53% 22.14% 1.16
Dinwiddie 14 115.48% 15.60% 1.14
Essex 6 88.49% 28.47% 1.10
Fauquier 27 86.97% 15.15% 1.03
Floyd 45 107.63% 23.28% 1.03
Fluvanna 10 101.54% 23.85% 1.12
Franklin 31 98.59% 19.25% 1.06
Frederick 15 100.84% 17.69% 1.07
Giles 21 99.36% 17.30% 1.07
Gloucester 8 82.12% 36.38% 0.93
Goochland 17 100.36% 15.37% 1.02
Grayson 30 110.94% 18.30% 1.06
Greene 5 101.90% 15.25% 0.93
Greensville 6 82.35% 26.90% 1.23
Halifax 47 101.74% 21.71% 1.07
20

TABLE 2
RATIO OF 2015 ASSESSED VALUATIONS
TO 2015 SELLING PRICES OF REAL ESTATE
FOR SELECTED CLASSIFICATIONS OF PROPERTY
Locality Numberof Sales
RegressionIndex
MedianRatio (%)
Coefficient of Dispersion (%)
Hanover 15 95.82% 12.68% 1.26
Henrico 4 103.38% 3.98% 0.98
Henry 10 86.98% 20.52% 1.04
Highland 11 120.69% 22.94% 0.88
Isle of Wight 10 97.74% 16.25% 0.99
James City 3 93.84% 11.71% 1.02
King & Queen 12 94.88% 16.24% 1.05
King William 16 99.78% 36.06% 1.15
Lancaster 4 88.49% 7.94% 1.03
Lee 42 83.29% 31.45% 1.11
Loudoun 41 95.40% 12.17% 1.07
Louisa 40 105.18% 31.80% 1.18
Lunenburg 26 83.22% 26.59% 1.01
Madison 22 112.06% 35.09% 1.18
Mathews 3 112.89% 5.39% 0.97
Mecklenburg 17 105.90% 25.20% 1.10
Middlesex 4 92.25% 13.41% 1.01
Montgomery 15 93.83% 25.73% 0.97
Nelson 30 112.33% 20.17% 1.03
New Kent 13 96.80% 18.19% 1.07
Northampton 7 107.91% 12.53% 1.01
Northumberland 6 86.97% 34.59% 1.14
Nottoway 19 78.21% 27.76% 0.99
Orange 11 84.73% 22.79% 1.01
Page 5 118.36% 19.06% 1.10
Patrick 41 98.76% 28.03% 1.05
Pittsylvania 58 111.21% 19.30% 1.05
Powhatan 12 87.17% 27.50% 0.93
Prince Edward 22 96.65% 24.86% 1.00
Prince George 6 99.15% 7.59% 0.99
Prince William 5 89.11% 10.31% 1.05
Pulaski 17 96.53% 17.11% 1.04
Rappahannock 26 115.32% 17.79% 1.00
Richmond 8 69.63% 24.42% 1.06
Roanoke 6 101.76% 4.97% 0.98
Rockbridge 25 96.29% 26.70% 1.02
Rockingham 53 88.19% 21.59% 1.05
Russell 20 91.15% 28.84% 1.08
21

TABLE 2
RATIO OF 2015 ASSESSED VALUATIONS
TO 2015 SELLING PRICES OF REAL ESTATE
FOR SELECTED CLASSIFICATIONS OF PROPERTY
Locality Numberof Sales
RegressionIndex
MedianRatio (%)
Coefficient of Dispersion (%)
Scott 50 89.37% 44.59% 1.27
Shenandoah 34 123.54% 17.58% 1.06
Smyth 13 100.63% 20.83% 1.04
Southampton 19 92.32% 21.47% 0.99
Spotsylvania 11 74.08% 16.23% 1.03
Stafford 7 101.82% 16.77% 1.07
Surry 19 96.41% 20.81% 1.13
Sussex 15 93.25% 29.84% 1.36
Tazewell 13 96.73% 20.79% 1.04
Warren 3 119.58% 21.10% 1.00
Washington 43 96.33% 29.51% 1.26
Westmoreland 10 92.78% 34.90% 0.93
Wythe 22 86.43% 24.98% 1.08
Class 5: Agricultural Undeveloped 20-100 acresCities:Chesapeake 7 92.32% 17.05% 1.00
Manassas Park 1 0.00% 0.00% 1.00
Radford 1 0.00% 0.00% 1.00
Suffolk 11 98.28% 29.07% 1.07
Virginia Beach 9 102.20% 16.66% 1.00
Class 6: Agricultural Undeveloped over 100 acresCounties:Accomack 9 112.07% 20.00% 1.12
Albemarle 10 96.15% 7.96% 1.00
Alleghany 2 0.00% 0.00% 1.00
Amelia 5 95.13% 25.66% 1.07
Amherst 6 86.38% 30.55% 1.28
Appomattox 3 123.02% 20.69% 1.05
Augusta 8 98.10% 10.13% 1.01
Bath 3 107.29% 24.09% 1.01
Bedford 8 117.88% 20.04% 0.92
Bland 2 0.00% 0.00% 1.63
Botetourt 3 125.26% 19.39% 1.01
Brunswick 8 75.41% 14.28% 1.05
Buchanan 1 0.00% 0.00% 1.00
Buckingham 10 99.11% 31.41% 1.15
22

TABLE 2
RATIO OF 2015 ASSESSED VALUATIONS
TO 2015 SELLING PRICES OF REAL ESTATE
FOR SELECTED CLASSIFICATIONS OF PROPERTY
Locality Numberof Sales
RegressionIndex
MedianRatio (%)
Coefficient of Dispersion (%)
Campbell 6 88.52% 13.15% 1.03
Caroline 6 79.57% 10.02% 1.00
Carroll 5 87.93% 16.29% 0.97
Charles City 1 0.00% 0.00% 1.00
Charlotte 5 84.51% 13.13% 1.04
Chesterfield 1 0.00% 0.00% 1.00
Clarke 6 94.10% 5.58% 0.99
Craig 4 93.42% 15.08% 1.10
Culpeper 5 88.77% 13.53% 1.09
Cumberland 4 91.49% 18.27% 1.06
Dickenson 1 0.00% 0.00% 1.00
Dinwiddie 3 102.55% 11.57% 1.04
Essex 4 96.22% 15.34% 1.11
Fauquier 2 0.00% 0.00% 1.07
Floyd 4 103.38% 25.64% 1.07
Fluvanna 3 122.72% 12.97% 1.05
Franklin 4 74.01% 29.42% 1.35
Frederick 2 0.00% 0.00% 0.99
Giles 1 0.00% 0.00% 1.00
Gloucester 3 117.65% 10.08% 1.03
Goochland 2 0.00% 0.00% 0.94
Grayson 2 0.00% 0.00% 0.99
Greene 1 0.00% 0.00% 1.00
Greensville 4 91.26% 21.81% 1.10
Halifax 20 105.37% 19.75% 1.11
Hanover 2 0.00% 0.00% 1.00
Henrico 1 0.00% 0.00% 1.00
Henry 1 0.00% 0.00% 1.00
Highland 4 125.56% 20.46% 1.06
Isle of Wight 5 106.52% 19.36% 1.20
King & Queen 2 0.00% 0.00% 1.00
King William 3 70.99% 18.97% 1.11
Lee 6 75.70% 26.25% 1.24
Loudoun 5 95.81% 13.40% 0.97
Louisa 4 87.36% 9.40% 0.96
Lunenburg 4 89.51% 34.68% 1.28
Madison 3 84.46% 35.09% 1.16
Mathews 1 0.00% 0.00% 1.00
23

TABLE 2
RATIO OF 2015 ASSESSED VALUATIONS
TO 2015 SELLING PRICES OF REAL ESTATE
FOR SELECTED CLASSIFICATIONS OF PROPERTY
Locality Numberof Sales
RegressionIndex
MedianRatio (%)
Coefficient of Dispersion (%)
Mecklenburg 9 99.35% 24.98% 1.09
Middlesex 3 93.33% 19.98% 0.99
Nelson 8 102.65% 22.42% 1.12
New Kent 1 0.00% 0.00% 1.00
Northumberland 1 0.00% 0.00% 1.00
Nottoway 8 80.59% 26.00% 1.30
Orange 1 0.00% 0.00% 1.00
Patrick 6 82.73% 32.25% 1.07
Pittsylvania 11 118.20% 23.40% 1.10
Powhatan 6 98.07% 13.57% 1.03
Prince Edward 8 68.36% 33.25% 1.14
Pulaski 3 96.55% 2.93% 1.00
Rappahannock 1 0.00% 0.00% 1.00
Rockbridge 4 138.45% 23.81% 1.09
Rockingham 7 89.33% 15.61% 1.00
Russell 5 93.94% 23.06% 1.19
Scott 7 75.29% 40.70% 1.16
Shenandoah 6 96.74% 11.16% 1.03
Smyth 4 81.42% 21.20% 1.06
Southampton 5 84.67% 23.81% 1.11
Sussex 4 72.63% 16.23% 1.19
Tazewell 8 89.70% 7.80% 1.00
Warren 2 0.00% 0.00% 1.03
Washington 6 122.06% 22.53% 1.24
Westmoreland 2 0.00% 0.00% 0.92
Wythe 7 108.25% 27.81% 1.08
Class 6: Agricultural Undeveloped over 100 acresCities:Chesapeake 28 94.83% 7.76% 1.00
Suffolk 1 0.00% 0.00% 1.00
Virginia Beach 1 0.00% 0.00% 1.00
24

2014 2015 2014 2015 2014 2015
Counties:Accomack 97.68% 98.15% $0.58 $0.56 $0.57 $0.55Albemarle 94.30% 94.60% $0.80 $0.82 $0.75 $0.77Alleghany 92.55% 91.00% $0.69 $0.69 $0.64 $0.63Amelia 88.00% 87.26% $0.49 $0.51 $0.43 $0.45Amherst 101.60% 97.18% $0.56 $0.56 $0.57 $0.54
Appomattox 101.66% 98.62% $0.60 $0.65 $0.61 $0.64Arlington 90.17% 93.34% $0.98 $1.04 $0.89 $0.97Augusta 98.07% 96.67% $0.56 $0.58 $0.55 $0.56Bath 104.98% 99.82% $0.48 $0.48 $0.50 $0.48Bedford 99.46% 98.81% $0.52 $0.52 $0.52 $0.51
Bland 102.06% 97.76% $0.60 $0.60 $0.61 $0.59Botetourt 99.12% 96.75% $0.72 $0.72 $0.71 $0.70Brunswick 98.47% 97.76% $0.47 $0.47 $0.46 $0.46Buchanan 75.38% 102.42% $0.43 $0.39 $0.32 $0.40Buckingham 97.74% 101.22% $0.50 $0.50 $0.49 $0.51
Campbell 96.43% 96.59% $0.52 $0.52 $0.50 $0.50Caroline 96.50% 91.75% $0.83 $0.83 $0.80 $0.76Carroll 99.60% 98.00% $0.68 $0.66 $0.68 $0.65Charles City 88.32% 97.33% $0.72 $0.72 $0.64 $0.70Charlotte * 95.23% 93.74% $0.48 $0.48 $0.46 $0.45
Chesterfield 94.35% 94.57% $0.96 $0.96 $0.91 $0.91Clarke 105.33% 104.00% $0.66 $0.66 $0.69 $0.68Craig 98.56% 98.20% $0.56 $0.56 $0.55 $0.55Culpeper 80.31% 91.95% $0.83 $0.73 $0.67 $0.67Cumberland 101.47% 99.30% $0.74 $0.74 $0.75 $0.73
Dickenson 107.65% 100.13% $0.56 $0.56 $0.60 $0.56Dinwiddie 97.59% 98.11% $0.79 $0.79 $0.77 $0.78Essex 95.76% 102.28% $0.86 $0.88 $0.82 $0.90Fairfax 89.54% 92.41% $1.09 $1.09 $0.98 $1.01Fauquier 88.47% 85.89% $0.99 $1.00 $0.88 $0.86
Floyd 96.72% 103.87% $0.50 $0.55 $0.48 $0.57Fluvanna 96.33% 95.20% $0.88 $0.90 $0.85 $0.86Franklin 98.72% 98.14% $0.55 $0.55 $0.54 $0.54Frederick 84.69% 95.19% $0.59 $0.56 $0.50 $0.53Giles 105.02% 97.13% $0.56 $0.61 $0.59 $0.59
Gloucester 103.92% 97.51% $0.65 $0.68 $0.68 $0.67Goochland 95.63% 95.79% $0.53 $0.53 $0.51 $0.51Grayson 101.33% 103.44% $0.49 $0.49 $0.50 $0.51Greene 96.27% 95.22% $0.72 $0.75 $0.69 $0.71Greensville 91.52% 95.25% $0.67 $0.67 $0.61 $0.64
Halifax 102.41% 101.95% $0.48 $0.48 $0.49 $0.49Hanover 91.98% 90.66% $0.81 $0.81 $0.75 $0.73Henrico 92.32% 92.72% $0.87 $0.87 $0.80 $0.81Henry 100.67% 99.26% $0.49 $0.49 $0.49 $0.48Highland 106.30% 108.01% $0.40 $0.40 $0.43 $0.43
TABLE 3NOMINAL AND EFFECTIVE TRUE REAL PROPERTY TAX RATES
IN VIRGINIA COUNTIES AND CITIES - 2014 & 2015( Exclusive of Town Taxes Imposed by Incorporated Towns for Town Purposes )
Locality Median Ratio Nominal Tax Rate Effective Tax Rate
25
2014 2015 2014 2015 2014 2015
TABLE 3NOMINAL AND EFFECTIVE TRUE REAL PROPERTY TAX RATES
IN VIRGINIA COUNTIES AND CITIES - 2014 & 2015( Exclusive of Town Taxes Imposed by Incorporated Towns for Town Purposes )
Locality Median Ratio Nominal Tax Rate Effective Tax Rate
Isle of Wight * 99.17% 100.54% $0.73 $0.85 $0.72 $0.85James City 95.57% 93.68% $0.77 $0.84 $0.74 $0.79King & Queen 93.63% 93.12% $0.54 $0.54 $0.51 $0.50King George 92.84% 92.84% $0.59 $0.61 $0.55 $0.57King William 112.67% 89.92% $0.73 $0.83 $0.82 $0.75
Lancaster 103.29% 98.97% $0.54 $0.54 $0.56 $0.53Lee 83.44% 83.70% $0.65 $0.65 $0.54 $0.54Loudoun 91.62% 94.79% $1.16 $1.14 $1.06 $1.08Louisa 100.24% 97.14% $0.68 $0.72 $0.68 $0.70Lunenburg 98.21% 93.06% $0.38 $0.38 $0.37 $0.35
Madison 109.38% 106.16% $0.68 $0.68 $0.74 $0.72Mathews 98.06% 110.79% $0.54 $0.54 $0.53 $0.60Mecklenburg * 107.88% 104.01% $0.38 $0.40 $0.41 $0.42Middlesex 98.26% 100.57% $0.53 $0.53 $0.52 $0.53Montgomery 96.49% 95.35% $0.89 $0.89 $0.86 $0.85
Nelson 104.46% 107.18% $0.72 $0.72 $0.75 $0.77New Kent 95.39% 94.79% $0.84 $0.84 $0.80 $0.80Northampton 106.36% 111.32% $0.67 $0.68 $0.72 $0.76Northumberland 101.33% 102.55% $0.49 $0.49 $0.50 $0.50Nottoway 99.77% 92.38% $0.47 $0.47 $0.47 $0.43
Orange 95.54% 92.87% $0.80 $0.80 $0.77 $0.75Page 109.71% 109.60% $0.64 $0.64 $0.70 $0.70Patrick 109.94% 99.34% $0.48 $0.55 $0.53 $0.54Pittsylvania 102.40% 100.64% $0.59 $0.59 $0.60 $0.59Powhatan 95.11% 89.05% $0.90 $0.90 $0.86 $0.80
Prince Edward 109.18% 94.02% $0.47 $0.49 $0.51 $0.46Prince George 100.26% 96.91% $0.82 $0.82 $0.82 $0.79Prince William 87.54% 91.96% $1.15 $1.12 $1.00 $1.03Pulaski 107.80% 94.82% $0.59 $0.64 $0.64 $0.61Rappahannock 109.66% 111.18% $0.69 $0.65 $0.76 $0.72
Richmond 98.85% 100.50% $0.67 $0.67 $0.66 $0.67Roanoke 92.91% 92.75% $1.09 $1.09 $1.01 $1.01Rockbridge 97.25% 102.06% $0.72 $0.72 $0.70 $0.73Rockingham 91.62% 90.17% $0.67 $0.70 $0.61 $0.63Russell 91.63% 91.70% $0.63 $0.63 $0.58 $0.58
Scott 94.69% 93.54% $0.69 $0.69 $0.65 $0.65Shenandoah 103.16% 100.56% $0.57 $0.57 $0.59 $0.57Smyth 95.02% 89.10% $0.74 $0.74 $0.70 $0.66Southampton 100.85% 99.56% $0.77 $0.77 $0.78 $0.77Spotsylvania 84.71% 83.28% $0.86 $0.86 $0.73 $0.72
Stafford 87.17% 85.90% $1.02 $1.02 $0.89 $0.88Surry 114.76% 101.55% $0.73 $0.73 $0.84 $0.74Sussex 94.50% 98.02% $0.54 $0.54 $0.51 $0.53Tazewell 99.28% 102.82% $0.55 $0.55 $0.55 $0.57Warren 93.96% 95.16% $0.61 $0.60 $0.57 $0.57
26
2014 2015 2014 2015 2014 2015
TABLE 3NOMINAL AND EFFECTIVE TRUE REAL PROPERTY TAX RATES
IN VIRGINIA COUNTIES AND CITIES - 2014 & 2015( Exclusive of Town Taxes Imposed by Incorporated Towns for Town Purposes )
Locality Median Ratio Nominal Tax Rate Effective Tax Rate
Washington 93.01% 91.66% $0.63 $0.63 $0.59 $0.58Westmoreland 108.16% 102.34% $0.49 $0.49 $0.53 $0.50Wise 94.42% 93.14% $0.60 $0.60 $0.57 $0.56Wythe 98.32% 98.00% $0.44 $0.49 $0.43 $0.48York 98.98% 98.28% $0.75 $0.75 $0.74 $0.74
Cities:Alexandria 94.76% 96.47% $1.04 $1.04 $0.99 $1.01Bristol 91.14% 91.54% $1.07 $1.12 $0.98 $1.03Buena Vista * 115.02% 114.48% $1.07 $1.10 $1.23 $1.26Charlottesville 95.32% 94.63% $0.95 $0.95 $0.91 $0.90Chesapeake 95.62% 92.47% $1.05 $1.05 $1.00 $0.97
Colonial Heights 98.69% 97.06% $1.14 $1.14 $1.13 $1.11Covington * 95.74% 99.88% $0.69 $0.71 $0.66 $0.71Danville * 97.22% 98.27% $0.73 $0.73 $0.71 $0.72Emporia 100.24% 110.17% $0.87 $0.90 $0.87 $0.99Fairfax 93.30% 95.38% $1.04 $1.05 $0.97 $1.00
Falls Church 94.98% 96.71% $1.31 $1.32 $1.24 $1.27Franklin * 104.21% 103.32% $0.91 $0.97 $0.94 $1.00Fredericksburg * 91.10% 87.21% $0.74 $0.79 $0.67 $0.69Galax 109.71% 104.59% $0.69 $0.73 $0.76 $0.76Hampton 98.50% 98.64% $1.24 $1.24 $1.22 $1.22
Harrisonburg 99.49% 98.57% $0.69 $0.72 $0.69 $0.71Hopewell 108.37% 107.21% $1.11 $1.13 $1.20 $1.21Lexington * 107.89% 96.24% $0.83 $1.03 $0.90 $0.99Lynchburg * 97.66% 96.51% $1.11 $1.11 $1.08 $1.07Manassas 88.75% 96.57% $1.37 $1.39 $1.21 $1.34
Manassas Park * 82.72% 89.23% $1.65 $1.55 $1.36 $1.38Martinsville 105.48% 97.03% $1.06 $1.06 $1.12 $1.03Newport News * 98.29% 97.43% $1.22 $1.22 $1.20 $1.19Norfolk * 96.51% 98.05% $1.15 $1.15 $1.11 $1.13Norton 98.93% 92.36% $0.80 $0.80 $0.79 $0.74
Petersburg * 103.55% 104.13% $1.35 $1.35 $1.40 $1.41Poquoson * 99.96% 99.51% $0.97 $1.07 $0.97 $1.06Portsmouth * 100.86% 98.57% $1.27 $1.27 $1.28 $1.25Radford 95.78% 93.88% $0.76 $0.76 $0.73 $0.71Richmond 89.76% 91.41% $1.20 $1.20 $1.08 $1.10
Roanoke 95.90% 94.98% $1.19 $1.22 $1.14 $1.16Salem 91.49% 91.05% $1.18 $1.18 $1.08 $1.07Staunton 97.98% 98.31% $0.95 $0.95 $0.93 $0.93Suffolk 98.09% 96.78% $1.03 $1.07 $1.01 $1.04Virginia Beach * 88.91% 89.78% $0.93 $0.93 $0.83 $0.83
Waynesboro 92.10% 93.13% $0.80 $0.80 $0.74 $0.75Williamsburg * 96.75% 96.93% $0.57 $0.57 $0.55 $0.55Winchester 90.62% 95.01% $0.95 $0.91 $0.86 $0.86
* Indicates localities with fiscal reassessment cycles.
27

Counties:Accomack $3,715,761,589 $296,382,078 $4,012,143,667 7.39%Albemarle 18,769,861,945 397,019,129 19,166,881,074 2.07%Alleghany 1,210,243,407 179,949,792 1,390,193,199 12.94%Amelia 1,298,188,746 43,751,300 1,341,940,046 3.26%Amherst 2,686,412,225 120,501,670 2,806,913,895 4.29%
Appomattox $1,346,026,789 $105,742,879 $1,451,769,667 7.28%Arlington 74,211,633,169 963,208,348 75,174,841,517 1.28%Augusta 8,327,424,434 364,850,607 8,692,275,041 4.20%Bath 980,438,690 1,467,894,498 2,448,333,188 59.95%Bedford 9,538,719,565 301,935,770 9,840,655,334 3.07%
Bland $603,408,858 $68,887,711 $672,296,569 10.25%Botetourt 3,780,759,726 251,768,668 4,032,528,394 6.24%Brunswick 1,324,200,436 490,330,633 1,814,531,069 27.02%Buchanan 2,443,139,561 136,374,197 2,579,513,758 5.29%Buckingham 1,393,880,952 668,328,266 2,062,209,219 32.41%
Campbell $4,128,478,381 $353,486,811 $4,481,965,192 7.89%Caroline 2,987,124,276 472,136,496 3,459,260,771 13.65%Carroll 2,410,628,143 122,974,498 2,533,602,641 4.85%Charles City 832,176,083 119,295,587 951,471,670 12.54%Charlotte * 975,758,386 85,368,626 1,061,127,012 8.05%
Chesterfield $34,083,463,149 $1,379,415,030 $35,462,878,179 3.89%Clarke 2,508,686,923 67,010,672 2,575,697,595 2.60%Craig 498,899,287 16,710,003 515,609,290 3.24%Culpeper 5,465,339,977 231,580,927 5,696,920,904 4.07%Cumberland 844,480,752 105,855,033 950,335,785 11.14%
Dickenson $1,388,652,152 $119,417,474 $1,508,069,626 7.92%Dinwiddie 2,549,456,190 185,510,368 2,734,966,558 6.78%Essex 1,365,706,740 45,476,749 1,411,183,489 3.22%Fairfax 245,395,751,396 3,837,823,127 249,233,574,523 1.54%Fauquier 13,693,256,607 724,945,448 14,418,202,056 5.03%
Floyd $1,671,227,496 $58,265,316 $1,729,492,812 3.37%Fluvanna 2,818,867,962 543,848,458 3,362,716,420 16.17%Franklin 7,177,155,798 183,174,526 7,360,330,323 2.49%Frederick 9,271,440,862 453,391,395 9,724,832,258 4.66%Giles 1,219,848,245 143,119,040 1,362,967,284 10.50%
Gloucester $4,404,242,718 $137,719,792 $4,541,962,510 3.03%Goochland 5,118,471,354 130,651,669 5,249,123,023 2.49%Grayson 1,622,527,552 48,030,452 1,670,558,004 2.88%Greene 2,193,979,694 63,190,820 2,257,170,514 2.80%Greensville 659,626,700 56,834,434 716,461,134 7.93%
Halifax $2,572,417,129 $1,094,440,422 $3,666,857,551 29.85%Hanover 14,318,300,684 636,289,686 14,954,590,370 4.25%Henrico 35,908,821,829 1,013,371,348 36,922,193,177 2.74%Henry 2,946,101,652 172,288,598 3,118,390,250 5.52%Highland 634,543,246 19,051,444 653,594,690 2.91%
TABLE 4ESTIMATED TRUE FULL VALUE OF LOCALLY TAXED PROPERTY
IN VIRGINIA COUNTIES AND CITIES - 2015REAL ESTATE AND PUBLIC SERVICE CORPORATIONS
Locality True Valueof Real Estate
True Value ofPublic ServiceCorporations
Total EstimatedTrue Value
Public Service Corps.% of Total
Estimated True Value
28

TABLE 4ESTIMATED TRUE FULL VALUE OF LOCALLY TAXED PROPERTY
IN VIRGINIA COUNTIES AND CITIES - 2015REAL ESTATE AND PUBLIC SERVICE CORPORATIONS
Locality True Valueof Real Estate
True Value ofPublic ServiceCorporations
Total EstimatedTrue Value
Public Service Corps.% of Total
Estimated True Value
Isle of Wight * $4,518,659,290 $154,386,791 $4,673,046,081 3.30%James City 12,269,430,401 243,038,449 12,512,468,851 1.94%King & Queen 912,900,344 29,298,310 942,198,654 3.11%King George 2,921,792,669 275,560,624 3,197,353,293 8.62%King William 1,824,172,744 54,136,191 1,878,308,935 2.88%
Lancaster $2,568,973,830 $57,667,242 $2,626,641,072 2.20%Lee 1,067,541,436 87,038,457 1,154,579,893 7.54%Loudoun 72,051,843,880 2,005,995,212 74,057,839,092 2.71%Louisa 4,979,298,847 2,511,655,808 7,490,954,655 33.53%Lunenburg 921,359,768 51,789,436 973,149,204 5.32%
Madison $2,136,025,057 $47,741,304 $2,183,766,361 2.19%Mathews 1,520,802,293 24,092,363 1,544,894,656 1.56%Mecklenburg * 3,628,513,316 303,330,602 3,931,843,918 7.71%Middlesex 2,213,472,606 45,486,553 2,258,959,159 2.01%Montgomery 7,909,160,671 235,075,587 8,144,236,258 2.89%
Nelson $2,802,147,882 $106,426,253 $2,908,574,135 3.66%New Kent 2,623,955,210 131,385,262 2,755,340,472 4.77%Northampton 2,048,865,216 52,297,204 2,101,162,420 2.49%Northumberland 2,918,062,506 49,183,234 2,967,245,740 1.66%Nottoway 988,817,829 93,587,265 1,082,405,094 8.65%
Orange $4,415,175,730 $164,181,206 $4,579,356,935 3.59%Page 2,216,288,960 91,048,833 2,307,337,793 3.95%Patrick 1,568,658,043 81,109,560 1,649,767,603 4.92%Pittsylvania 4,437,862,674 408,785,922 4,846,648,595 8.43%Powhatan 3,770,991,915 98,110,157 3,869,102,072 2.54%
Prince Edward $1,585,715,992 $97,381,608 $1,683,097,601 5.79%Prince George 2,844,975,544 169,873,939 3,014,849,483 5.63%Prince William 56,993,988,147 1,790,920,965 58,784,909,112 3.05%Pulaski 2,812,951,171 142,372,983 2,955,324,154 4.82%Rappahannock 1,936,028,602 54,113,898 1,990,142,500 2.72%
Richmond $858,176,033 $62,483,996 $920,660,029 6.79%Roanoke 8,771,531,321 289,390,678 9,060,921,999 3.19%Rockbridge 2,755,521,366 174,408,125 2,929,929,491 5.95%Rockingham 9,321,262,504 335,917,935 9,657,180,439 3.48%Russell 1,732,691,182 270,521,038 2,003,212,220 13.50%
Scott $1,275,381,441 $136,312,002 $1,411,693,443 9.66%Shenandoah 5,121,755,569 241,442,396 5,363,197,965 4.50%Smyth 1,758,481,145 153,284,439 1,911,765,584 8.02%Southampton 1,729,402,571 187,490,879 1,916,893,450 9.78%Spotsylvania 15,724,548,631 414,220,726 16,138,769,358 2.57%
Stafford $17,511,477,008 $453,942,460 $17,965,419,468 2.53%Surry 877,359,626 1,785,663,243 2,663,022,869 67.05%Sussex 870,030,785 115,344,345 985,375,130 11.71%Tazewell 2,708,437,464 182,456,119 2,890,893,583 6.31%Warren 4,585,391,236 1,098,659,346 5,684,050,582 19.33%
29

TABLE 4ESTIMATED TRUE FULL VALUE OF LOCALLY TAXED PROPERTY
IN VIRGINIA COUNTIES AND CITIES - 2015REAL ESTATE AND PUBLIC SERVICE CORPORATIONS
Locality True Valueof Real Estate
True Value ofPublic ServiceCorporations
Total EstimatedTrue Value
Public Service Corps.% of Total
Estimated True Value
Washington $5,011,932,030 $220,411,979 $5,232,344,009 4.21%Westmoreland 2,621,854,700 59,991,286 2,681,845,986 2.24%Wise 1,992,357,098 1,522,404,254 3,514,761,351 43.31%Wythe 2,564,360,204 230,245,840 2,794,606,044 8.24%York 8,999,799,063 444,697,966 9,444,497,029 4.71%Counties Total $855,495,715,004 $36,513,960,059 $892,009,675,063
Cities:Alexandria $37,816,446,000 $606,844,440 $38,423,290,440 1.58%Bristol 1,158,331,685 21,039,961 1,179,371,646 1.78%Buena Vista * 323,582,285 21,978,142 345,560,427 6.36%Charlottesville 6,291,778,506 142,951,957 6,434,730,463 2.22%Chesapeake 25,421,256,411 888,633,479 26,309,889,890 3.38%
Colonial Heights $1,659,646,404 $36,887,889 $1,696,534,293 2.17%Covington * 274,703,945 282,808,705 557,512,650 50.73%Danville * 2,275,226,417 53,089,726 2,328,316,143 2.28%Emporia 327,435,236 21,701,058 349,136,294 6.22%Fairfax 5,977,942,650 115,804,843 6,093,747,493 1.90%
Falls Church $3,999,606,762 $24,771,397 $4,024,378,159 0.62%Franklin * 539,354,626 6,725,634 546,080,260 1.23%Fredericksburg * 4,158,020,755 113,965,640 4,271,986,394 2.67%Galax 438,267,903 15,068,259 453,336,162 3.32%Hampton 10,562,177,210 324,975,246 10,887,152,456 2.98%
Harrisonburg $4,043,204,646 $54,421,734 $4,097,626,380 1.33%Hopewell 1,238,458,726 368,611,413 1,607,070,139 22.94%Lexington * 540,395,989 18,838,896 559,234,885 3.37%Lynchburg * 5,222,301,627 217,013,670 5,439,315,297 3.99%Manassas 4,883,932,898 109,746,626 4,993,679,525 2.20%
Manassas Park * $1,492,951,922 $27,696,098 $1,520,648,020 1.82%Martinsville 656,824,693 25,947,370 682,772,063 3.80%Newport News * 14,403,667,384 514,794,391 14,918,461,775 3.45%Norfolk * 18,160,362,111 827,736,214 18,988,098,325 4.36%Norton 236,367,986 25,599,557 261,967,543 9.77%
Petersburg * $1,802,043,692 $146,594,843 $1,948,638,535 7.52%Poquoson * 1,507,441,544 19,667,864 1,527,109,408 1.29%Portsmouth * 7,136,554,831 381,167,684 7,517,722,515 5.07%Radford 847,634,533 24,240,425 871,874,959 2.78%Richmond 21,913,680,123 1,039,850,661 22,953,530,784 4.53%
Roanoke $7,256,380,291 $451,702,048 $7,708,082,338 5.86%Salem 2,207,477,210 45,365,660 2,252,842,870 2.01%Staunton 1,844,836,671 76,440,878 1,921,277,549 3.98%Suffolk 9,737,132,259 361,661,547 10,098,793,806 3.58%Virginia Beach * 56,617,856,650 999,653,626 57,617,510,276 1.73%
Waynesboro $1,850,183,829 $110,813,927 $1,960,997,756 5.65%Williamsburg * 1,791,614,258 56,378,498 1,847,992,756 3.05%Winchester 3,077,201,137 69,581,550 3,146,782,687 2.21%Cities Total $269,692,281,804 $8,650,771,558 $278,343,053,362
Virginia $1,125,187,996,808 $45,164,731,617 $1,170,352,728,425
30
Counties:Accomack 33,516 $110,865 $8,843 $119,708Albemarle 105,051 178,674 3,779 182,453Alleghany 15,515 78,005 11,598 89,603Amelia 12,909 100,565 3,389 103,954Amherst 32,028 83,877 3,762 87,639
Appomattox 15,455 $87,093 $6,842 $93,935Arlington 234,678 316,227 4,104 320,331Augusta 74,881 111,209 4,872 116,081Bath 4,727 207,412 310,534 517,946Bedford 77,575 122,961 3,892 126,853
Bland 6,684 $90,277 $10,306 $100,583Botetourt 33,486 112,906 7,519 120,425Brunswick 16,930 78,216 28,962 107,178Buchanan 22,983 106,302 5,934 112,236Buckingham 16,988 82,051 39,341 121,392
Campbell 56,167 $73,504 $6,293 $79,797Caroline 29,792 100,266 15,848 116,114Carroll 29,283 82,322 4,200 86,522Charles City 7,331 113,515 16,273 129,788Charlotte * 12,454 78,349 6,855 85,204
Chesterfield 333,450 $102,215 $4,137 $106,352Clarke 14,206 176,593 4,717 181,310Craig 5,192 96,090 3,218 99,308Culpeper 48,908 111,747 4,735 116,482Cumberland 9,989 84,541 10,597 95,138
Dickenson 15,339 $90,531 $7,785 $98,316Dinwiddie 28,753 88,667 6,452 95,119Essex 10,914 125,133 4,167 129,300Fairfax 1,129,330 217,293 3,398 220,691Fauquier 67,898 201,674 10,677 212,351
Floyd 15,430 $108,310 $3,776 $112,086Fluvanna 26,162 107,747 20,788 128,535Franklin 56,373 127,315 3,249 130,564Frederick 82,623 112,214 5,487 117,701Giles 17,179 71,008 8,331 79,339
Gloucester 37,072 $118,802 $3,715 $122,517Goochland 22,277 229,765 5,865 235,630Grayson 16,087 100,860 2,986 103,846Greene 19,840 110,584 3,185 113,769Greensville 11,804 55,882 4,815 60,697
Halifax 35,766 $71,924 $30,600 $102,524Hanover 104,013 137,659 6,117 143,776Henrico 320,717 111,964 3,160 115,124Henry 52,822 55,774 3,262 59,036Highland 2,277 278,675 8,367 287,042
Isle of Wight * 36,438 $124,010 $4,237 $128,247James City 73,325 167,329 3,315 170,644
TABLE 5ESTIMATED TRUE VALUE PER CAPITA OF LOCALLY TAXED PROPERTY
IN VIRGINIA COUNTIES AND CITIES - 2015REAL ESTATE AND PUBLIC SERVICE CORPORATIONS
Locality 2015Population
EstimatedTrue Value
ofReal EstatePer Capita
EstimatedTrue Value
ofPublic ServiceCorporations
Per Capita
TOTALEstimatedTrue ValuePer Capita
31

TABLE 5ESTIMATED TRUE VALUE PER CAPITA OF LOCALLY TAXED PROPERTY
IN VIRGINIA COUNTIES AND CITIES - 2015REAL ESTATE AND PUBLIC SERVICE CORPORATIONS
Locality 2015Population
EstimatedTrue Value
ofReal EstatePer Capita
EstimatedTrue Value
ofPublic ServiceCorporations
Per Capita
TOTALEstimatedTrue ValuePer Capita
King and Queen 7,190 126,968 4,075 131,043King George 24,600 118,772 11,202 129,974King William 16,253 112,236 3,331 115,567
Lancaster 11,297 $227,403 $5,105 $232,508Lee 25,182 42,393 3,456 45,849Loudoun 374,451 192,420 5,357 197,777Louisa 34,244 145,406 73,346 218,752Lunenburg 12,435 74,094 4,165 78,259
Madison 13,099 $163,068 $3,645 $166,713Mathews 8,737 174,065 2,758 176,823Mecklenburg * 31,608 114,797 9,597 124,394Middlesex 11,082 199,736 4,105 203,841Montgomery 98,121 80,606 2,396 83,002
Nelson 14,993 $186,897 $7,098 $193,995New Kent 20,468 128,198 6,419 134,617Northampton 12,176 168,271 4,295 172,566Northumberland 12,220 238,794 4,025 242,819Nottoway 16,261 60,809 5,755 66,564
Orange 34,015 $129,801 $4,827 $134,628Page 23,719 93,439 3,839 97,278Patrick 18,450 85,022 4,396 89,418Pittsylvania 63,255 70,158 6,463 76,621Powhatan 28,442 132,585 3,449 136,034
Prince Edward 23,631 $67,103 $4,121 $71,224Prince George 37,131 76,620 4,575 81,195Prince William 443,463 128,520 4,038 132,558Pulaski 34,841 80,737 4,086 84,823Rappahannock 7,308 264,919 7,405 272,324
Richmond 9,119 $94,109 $6,852 $100,961Roanoke 93,775 93,538 3,086 96,624Rockbridge 22,163 124,330 7,869 132,199Rockingham 79,134 117,791 4,245 122,036Russell 28,008 61,864 9,659 71,523
Scott 22,759 $56,039 $5,989 $62,028Shenandoah 42,228 121,288 5,718 127,006Smyth 31,417 55,972 4,879 60,851Southampton 18,551 93,224 10,107 103,331Spotsylvania 128,998 121,898 3,211 125,109
Stafford 140,176 $124,925 $3,238 $128,163Surry 6,819 128,664 261,866 390,530Sussex 11,887 73,192 9,703 82,895Tazewell 44,051 61,484 4,142 65,626Warren 38,829 118,092 28,295 146,387
Washington 54,130 $92,591 $4,072 $96,663Westmoreland 17,725 147,918 3,385 151,303Wise 39,943 49,880 38,114 87,994Wythe 28,743 89,217 8,011 97,228York 69,466 129,557 6,402 135,959Counties (as a whole) 5,819,210 $147,012 $6,275 $153,287
32
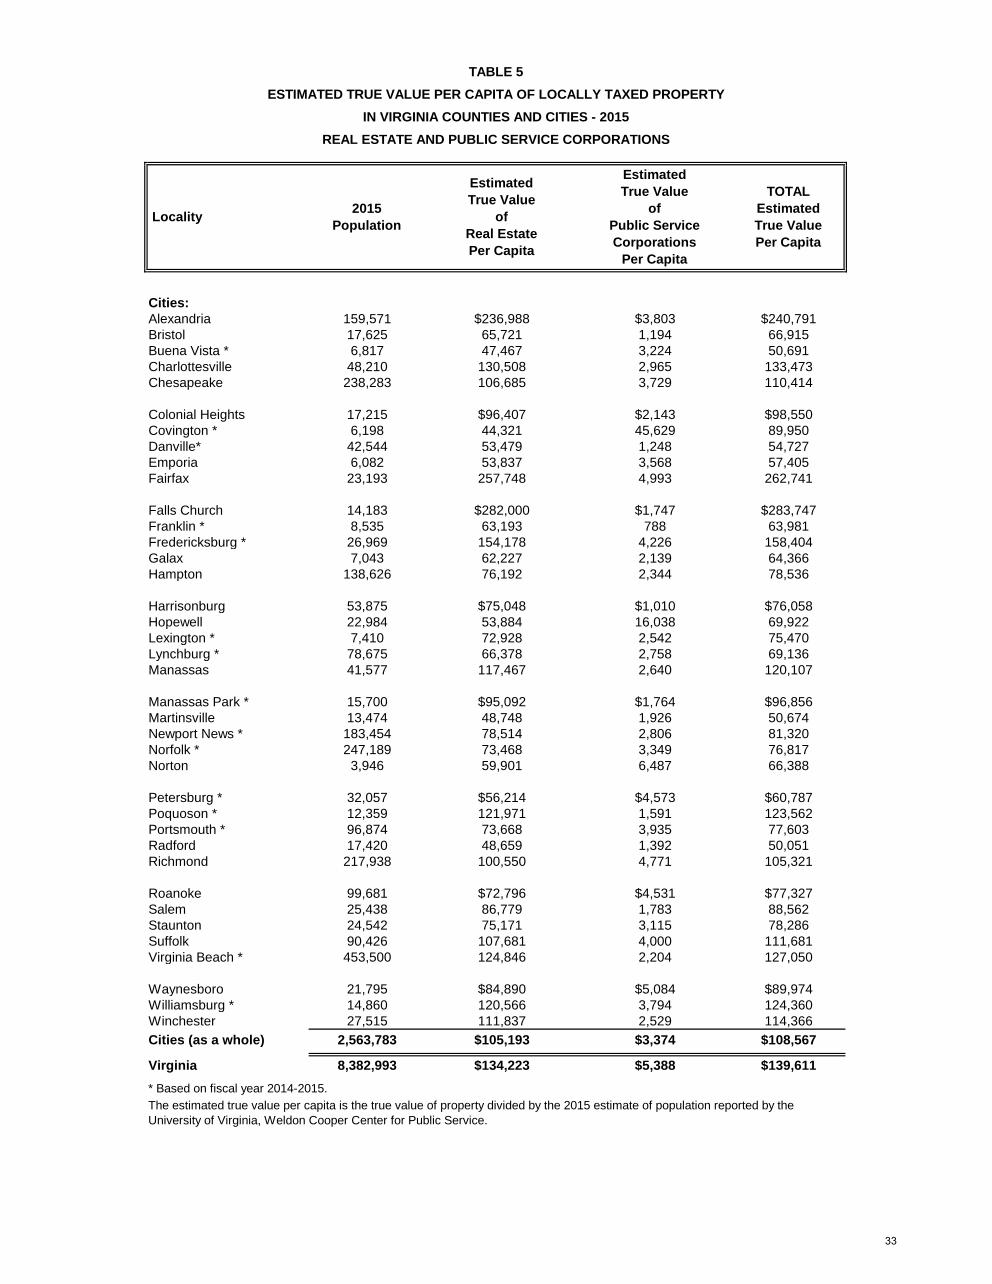
TABLE 5ESTIMATED TRUE VALUE PER CAPITA OF LOCALLY TAXED PROPERTY
IN VIRGINIA COUNTIES AND CITIES - 2015REAL ESTATE AND PUBLIC SERVICE CORPORATIONS
Locality 2015Population
EstimatedTrue Value
ofReal EstatePer Capita
EstimatedTrue Value
ofPublic ServiceCorporations
Per Capita
TOTALEstimatedTrue ValuePer Capita
Cities:Alexandria 159,571 $236,988 $3,803 $240,791Bristol 17,625 65,721 1,194 66,915Buena Vista * 6,817 47,467 3,224 50,691Charlottesville 48,210 130,508 2,965 133,473Chesapeake 238,283 106,685 3,729 110,414
Colonial Heights 17,215 $96,407 $2,143 $98,550Covington * 6,198 44,321 45,629 89,950Danville* 42,544 53,479 1,248 54,727Emporia 6,082 53,837 3,568 57,405Fairfax 23,193 257,748 4,993 262,741
Falls Church 14,183 $282,000 $1,747 $283,747Franklin * 8,535 63,193 788 63,981Fredericksburg * 26,969 154,178 4,226 158,404Galax 7,043 62,227 2,139 64,366Hampton 138,626 76,192 2,344 78,536
Harrisonburg 53,875 $75,048 $1,010 $76,058Hopewell 22,984 53,884 16,038 69,922Lexington * 7,410 72,928 2,542 75,470Lynchburg * 78,675 66,378 2,758 69,136Manassas 41,577 117,467 2,640 120,107
Manassas Park * 15,700 $95,092 $1,764 $96,856Martinsville 13,474 48,748 1,926 50,674Newport News * 183,454 78,514 2,806 81,320Norfolk * 247,189 73,468 3,349 76,817Norton 3,946 59,901 6,487 66,388
Petersburg * 32,057 $56,214 $4,573 $60,787Poquoson * 12,359 121,971 1,591 123,562Portsmouth * 96,874 73,668 3,935 77,603Radford 17,420 48,659 1,392 50,051Richmond 217,938 100,550 4,771 105,321
Roanoke 99,681 $72,796 $4,531 $77,327Salem 25,438 86,779 1,783 88,562Staunton 24,542 75,171 3,115 78,286Suffolk 90,426 107,681 4,000 111,681Virginia Beach * 453,500 124,846 2,204 127,050
Waynesboro 21,795 $84,890 $5,084 $89,974Williamsburg * 14,860 120,566 3,794 124,360Winchester 27,515 111,837 2,529 114,366Cities (as a whole) 2,563,783 $105,193 $3,374 $108,567
Virginia 8,382,993 $134,223 $5,388 $139,611* Based on fiscal year 2014-2015.The estimated true value per capita is the true value of property divided by the 2015 estimate of population reported by theUniversity of Virginia, Weldon Cooper Center for Public Service.
33

APPENDIX 1
Methodology and Terms
The Department of Taxation adopted a method of collecting data from the localities in a prescribed format. Localities may include their entire qualifying ("arm's length") population in the Study with minimal cost of data collection to the Department.
The data are derived from the recordation tax receipts that the law requires the Clerk of the Court in each locality to file with the Virginia Department of Taxation. The Department obtains the data on sales prices from the computerized listing of the Supreme Court of Virginia. The listing indicates each transfer, the date of the deed, the name of the grantor and the grantee, the address of the grantee, the quantity of land conveyed, the specified sales price, and a description of the parcel. The Department of Taxation collects information from the field on the assessed values of the property for a sampling of the transactions.
The number of sales selected in the study is determined by the personnel of the Property Tax Unit in consultation with the localities. Only arms length sales are selected from the total number of transfers reported in the land records of a locality.
Fair market sales are defined as "arm's length" transactions where there is a willing buyer and a willing seller, neither of which is under pressure to buy or sell. This excludes transfers such as sales within a family, foreclosures, or sales to a government unit.
The assessed value for each sale is divided by its selling price to produce an assessment/sales ratio. The ratios for each locality are arrayed by numerical value, and the median ratio is selected as the best indicator of that locality's existing assessment/sales ratio. The median ratio is defined as the ratio value where half the ratio values are higher and half the ratio values are lower. The median ratio is unaffected by distortions caused by large sales or "extreme" ratios at either end of the spectrum, particularly those at the higher end. The National Association of Tax Administrators, the U.S. Department of Commerce, and a special committee of the International Association of Assessing Officers (IAAO) recognize the accuracy of the median ratio. The median ratio for the state is calculated by dividing the state effective tax rate by the nominal tax rate for the state.
The coefficient of dispersion in this report is based on the measure recommended by the IAAO. It is calculated by:
(1) Subtracting the median ratio from each ratio in the sample, (2) Taking the absolute value of the calculated differences, (3) Summing the absolute differences, (4) Dividing by the number of ratios to obtain the "average absolute deviation," (5) Dividing by the median ratio, and (6) Multiplying by 100.
This measure represents the mean percentage deviation from the median ratio. Mathematically, if Xi represents the assessment/sales ratio for the ith sale in a sample of size n, and Xm represents the median ratio of the sample,
34

Coefficient of Dispersion = [({Sum[Abs(Xi-Xm)]}/n)/Xm]*100
The coefficient of dispersion calculated by this method is affected by the size of the sample (n), that is, the number of sales of property used in the study for a locality. Comparing two localities with the same median ratio and similar spread, the coefficient of one may be larger if it has a smaller sample size. This average absolute deviation method based on all sample data has been used beginning with the 1993 study.
A small coefficient of dispersion indicates that the ratios are grouped relatively close to the median and that assessment of property is more equitable. A large coefficient indicates that there is a wide spread in the ratios around the median, reflecting a less uniform assessment of property. The acceptable level for the coefficient of dispersion depends on the type of property considered and the size of the sample. The IAAO notes that a low coefficient (15 percent or less) tends to be associated with good appraisal uniformity. A coefficient of 15 percent indicates a good distribution of assessments for single-family residential properties. Similarly, a coefficient of 20 percent or less indicates a good distribution for more diverse classes of property. A less uniform assessment translates into inequality in actual tax burdens. As market activity decreases or the complexity of properties increases, the coefficient of dispersion often rises, even though appraisal procedures may be valid. Variation in assessments may be a result, among other factors, of the length of period between reassessments, difficulty of obtaining fair market value for different types of parcels, and the unique characteristics of different properties.
Total fair market value includes the value of land, buildings, and improvements, and minerals under the surface, as well as standing timber (trees) not owned by the owners of the land/lot. This information is based on land book records and reported every year to the Department of Taxation by the local Commissioners of the Revenue and assessors. The fair market value for localities refers to 2015, except for counties and cities that conduct fiscal year reassessments, where the 2014-2015 values are reported.
The regression index is defined as the mean ratio divided by the sales-weighted ratio. The sales-weighted ratio is the total of the assessed values divided by the total of the selling prices of all sales in the classification. It allows transfers with a larger selling price to have a greater impact on the ratio than those with smaller selling prices. A value of 1.00 indicates a uniform relationship between assessed values and selling prices of properties with different prices. An index above 1.00 indicates that less expensive property has a higher assessment/sales ratio than more expensive property. A reasonable index may be in the range of 0.95 to 1.05 percent, but tax experts have not reached a consensus in regards to this level.
The nominal tax rate for a locality is the rate of tax per $100 of assessed value that is levied for county/city and district purposes. The tax rate is calculated by dividing the real estate levies by the local real estate taxable value, as reported from the local land books by the local Commissioners of the Revenue. Some localities impose additional district levies, so that the rate is higher than the county levy reported in the Virginia Local Tax Rates Bulletin. The nominal tax rate for the state is obtained by dividing the total local real estate levies by the total taxable real estate value of all counties and cities.
35

The effective tax rate for a locality is calculated by multiplying the nominal tax rate by the median assessment/sales ratio. The effective tax rate for the state is computed by multiplying the total fair market value for all counties and cities by the state nominal tax rate and then dividing by the total true value of real estate for the state.
The total estimated true value of locally taxed property is composed of two components: real estate and public service corporation property. The estimated true value of real estate is computed as the total fair market value reported in the local land book, divided by the median assessment/sales ratio for the locality. The public service corporation component includes the value reported for each locality annually by the State Corporation Commission plus the estimated true value of railroad and pipelines for each locality as reported by the Railroad and Pipeline Appraisal section of the Property Tax Unit of the Department of Taxation.
The estimated true value per capita of locally taxed property is defined as the true value of property divided by the 2015 estimates for population as reported to the Department of Taxation by the University of Virginia, Weldon Cooper Center for Public Service.
36

Locality Total
Class 1SingleFamily
ResidentialUrban
Class 2SingleFamily
ResidentialSuburban
Class 3
Multi-Family
Residential
Class 4
Commercialand
Industrial
Class 5Agricultural
withLess Than100 Acres
Class 6Agricultural
withMore Than100 Acres
Counties:Accomack 470 114 280 7 24 36 9Albemarle 1,556 998 441 6 21 80 10Alleghany 173 38 111 1 10 11 2Amelia 159 6 123 0 4 21 5Amherst 365 33 286 7 16 17 6
Appomattox 198 17 148 0 4 26 3Arlington 2,770 2,742 0 17 11 0 0Augusta 827 336 424 2 18 39 8Bath 46 0 36 0 1 6 3Bedford 1,421 86 1,250 1 15 61 8
Bland 50 0 43 0 0 5 2Botetourt 419 125 260 4 9 18 3Brunswick 149 12 100 0 3 26 8Buchanan 97 0 75 0 13 8 1Buckingham 105 0 79 0 4 12 10
Campbell 505 215 249 5 16 14 6Caroline 308 16 256 1 12 17 6Carroll 405 24 341 2 8 25 5Charles City 52 0 41 0 1 9 1Charlotte 114 21 56 0 6 26 5
Chesterfield 3,171 2,469 613 2 66 20 1Clarke 194 67 104 0 6 11 6Craig 83 11 49 1 4 14 4Culpeper 601 204 348 3 9 32 5Cumberland 117 4 85 2 1 21 4
Dickenson 49 8 28 0 4 8 1Dinwiddie 201 0 182 0 2 14 3Essex 126 21 92 0 3 6 4Fairfax 13,519 9,936 3,462 4 117 0 0Fauquier 795 230 519 0 17 27 2
Floyd 207 0 157 1 0 45 4Fluvanna 455 231 208 1 2 10 3Franklin 726 95 590 2 4 31 4Frederick 1,146 32 1,080 0 17 15 2Giles 215 83 105 1 4 21 1
Gloucester 495 0 465 4 15 8 3Goochland 261 26 213 0 3 17 2Grayson 245 0 213 0 0 30 2Greene 303 9 286 1 1 5 1Greensville 53 6 34 0 3 6 4
Halifax 318 73 163 2 13 47 20Hanover 1,209 773 389 3 27 15 2Henrico 3,734 3,487 145 1 96 4 1Henry 282 7 248 3 13 10 1Highland 38 4 18 0 1 11 4
APPENDIX 2NUMBER OF SALES INCLUDED IN THE 2015 ASSESSMENT/SALES RATIO STUDY
37

Locality Total
Class 1SingleFamily
ResidentialUrban
Class 2SingleFamily
ResidentialSuburban
Class 3
Multi-Family
Residential
Class 4
Commercialand
Industrial
Class 5Agricultural
withLess Than100 Acres
Class 6Agricultural
withMore Than100 Acres
APPENDIX 2NUMBER OF SALES INCLUDED IN THE 2015 ASSESSMENT/SALES RATIO STUDY
Isle of Wight 465 48 389 1 12 10 5James City 918 804 96 1 14 3 0King and Queen 67 0 53 0 0 12 2King George 265 218 43 1 3 0 0King William 271 49 194 0 9 16 3
Lancaster 202 34 161 0 3 4 0Lee 198 15 132 1 2 42 6Loudoun 5,495 4,862 491 1 95 41 5Louisa 500 18 432 0 6 40 4Lunenburg 113 20 58 0 5 26 4
Madison 178 2 151 0 0 22 3Mathews 132 5 118 0 5 3 1Mecklenburg 288 72 177 0 13 17 9Middlesex 232 17 190 4 14 4 3Montgomery 1,040 713 271 6 35 15 0
Nelson 262 42 174 1 7 30 8New Kent 324 0 306 0 4 13 1Northampton 190 75 96 1 11 7 0Northumberland 269 0 261 0 1 6 1Nottoway 138 40 63 1 7 19 8
Orange 357 39 291 5 10 11 1Page 287 98 178 0 6 5 0Patrick 231 4 174 0 6 41 6Pittsylvania 612 50 478 1 14 58 11Powhatan 487 0 457 0 12 12 6
Prince Edward 215 47 131 1 6 22 8Prince George 209 88 113 0 2 6 0Prince William 6,025 5,209 748 6 57 5 0Pulaski 428 108 288 3 9 17 3Rappahannock 96 11 54 0 4 26 1
Richmond 61 5 43 0 5 8 0Roanoke 1,029 631 347 25 20 6 0Rockbridge 265 16 214 1 5 25 4Rockingham 929 223 597 27 22 53 7Russell 176 22 120 0 9 20 5
Scott 227 38 129 1 2 50 7Shenandoah 686 270 360 2 14 34 6Smyth 262 85 147 2 11 13 4Southampton 170 23 119 0 4 19 5Spotsylvania 1,593 996 532 1 53 11 0
Stafford 1,650 1,221 388 2 32 7 0Surry 72 0 53 0 0 19 0Sussex 74 20 31 0 4 15 4Tazewell 342 149 156 0 16 13 8Warren 525 136 372 4 8 3 2
38

Locality Total
Class 1SingleFamily
ResidentialUrban
Class 2SingleFamily
ResidentialSuburban
Class 3
Multi-Family
Residential
Class 4
Commercialand
Industrial
Class 5Agricultural
withLess Than100 Acres
Class 6Agricultural
withMore Than100 Acres
APPENDIX 2NUMBER OF SALES INCLUDED IN THE 2015 ASSESSMENT/SALES RATIO STUDY
Washington 653 92 483 5 24 43 6Westmoreland 307 98 192 0 5 10 2Wise 83 37 44 0 2 0 0Wythe 325 109 165 3 19 22 7York 767 715 23 1 28 0 0
Cities:Alexandria 2,320 2,260 0 6 54 0 0Bristol 249 230 0 3 16 0 0Buena Vista 41 38 0 0 3 0 0Charlottesville 506 435 0 51 20 0 0Chesapeake 3,294 2,923 287 9 40 7 28
Colonial Heights 164 154 0 1 9 0 0Covington 56 54 0 0 2 0 0Danville 213 191 0 0 22 0 0Emporia 26 19 0 1 6 0 0Fairfax 377 352 0 0 25 0 0
Falls Church 153 151 0 0 2 0 0Franklin 52 47 0 2 3 0 0Fredericksburg 433 400 0 10 23 0 0Galax 62 48 0 0 14 0 0Hampton 1,079 1,039 0 7 33 0 0
Harrisonburg 417 367 0 26 24 0 0Hopewell 149 133 0 6 10 0 0Lexington 56 54 0 0 2 0 0Lynchburg 702 649 0 25 28 0 0Manassas 508 501 0 1 6 0 0
Manassas Park 215 126 56 31 1 1 0Martinsville 85 77 0 3 5 0 0Newport News 910 870 0 9 31 0 0Norfolk 1,732 1,665 0 9 58 0 0Norton 23 18 0 1 4 0 0
Petersburg 103 59 17 5 22 0 0Poquoson 155 151 0 0 4 0 0Portsmouth 529 494 0 11 24 0 0Radford 123 114 0 4 4 1 0Richmond 2,317 2,075 0 147 95 0 0
Roanoke 664 11 577 41 35 0 0Salem 295 276 0 5 14 0 0Staunton 342 311 1 10 20 0 0Suffolk 653 38 561 2 40 11 1Virginia Beach 5,172 4,988 75 5 94 9 1
Waynesboro 279 266 0 7 6 0 0Williamsburg 135 130 0 0 5 0 0Winchester 368 316 0 12 40 0 0
Totals 94,379 62,163 27,252 642 2,123 1,818 381
39

APPENDIX 3
Computations for State Median Ratio
1. The Nominal Tax Rate for Virginia is obtained by dividing the total of the local real estatelevies by the total taxable fair market real estate values of all counties and cities.
The local levy and taxable value refer to fiscal year 2014-2015 for the following localities which conducted fiscal year reassessments:
Counties: Charlotte Cities: Buena Vista Newport News Isle of Wight Covington Norfolk Mecklenburg Danville Petersburg
Franklin City Poquoson Fredericksburg Portsmouth Lexington Virginia Beach Lynchburg Williamsburg Manassas Park
Data on taxable value and levies for the above localities for Fiscal Year 2014-2015 are from the Virginia Department of Taxation's Annual Report, Fiscal Year 2015. All other localities conducted calendar year reassessments and the data for those localities is taken from the Virginia Department of Taxation's Annual Report, Fiscal Year 2016.
State Nominal Tax Rate = Total Local Levy / Total FMV Taxable * 100
= $9,948,058,109 / $1,029,262,363,420 * 100
= $0.9665 per $100 of Assessed Value
2. The Effective Tax Rate for Virginia is computed by multiplying the total taxable fair market realestate values for all counties and cities by the State nominal tax rate and then dividing by the totalestimated true value of real estate for the State.
State Effective Tax Rate = Total FMV Taxable * Nominal Tax Rate / Total True Value of Real Estate
= $1,029,262,363,420 * 0.9665 / $1,125,187,996,808
= $0.8841 per $100 of True Value
3. The Median Ratio for Virginia is calculated by dividing the State effective tax rate by the Statenominal tax rate.
State Median Ratio = State Effective Tax Rate / State Nominal Tax Rate
= $0.8841 / $0.9665
= 91.47%
40