2015 Nonprofit Compensation & Benefits Report Overview
28
2015 Central Florida Nonprofit Compensation & B enefits Survey Sponsored by
-
Upload
edyth-bush-institute -
Category
Business
-
view
2.047 -
download
0
Transcript of 2015 Nonprofit Compensation & Benefits Report Overview
2015 Central Florida Nonprofit Compensation & Benefits
Survey
Sponsored by

“A good leader inspires people to have confidence in the leader; a great leader inspires people to have confidence in themselves.”
- Eleanor Roosevelt

THANK YOUto all of the participating nonprofit organizations!!
The survey was commissioned by the Edyth Bush Institute for Philanthropy & Nonprofit Leadership at Rollins College, but was conducted by Nonprofit Compensation Associates, based in California.
A pdf version of this PowerPoint presentation will be available at www.rollins.edu/ebi.
2015 Central Florida Nonprofit Compensation & Benefits Survey

Participants
Nonprofit organizations with at least one paid employee in 7 Central Florida counties:
•Brevard•Lake•Orange•Osceola•Polk•Seminole•Volusia
*The study excluded: churches,
schools, colleges, universities,
hospitals, and foundations
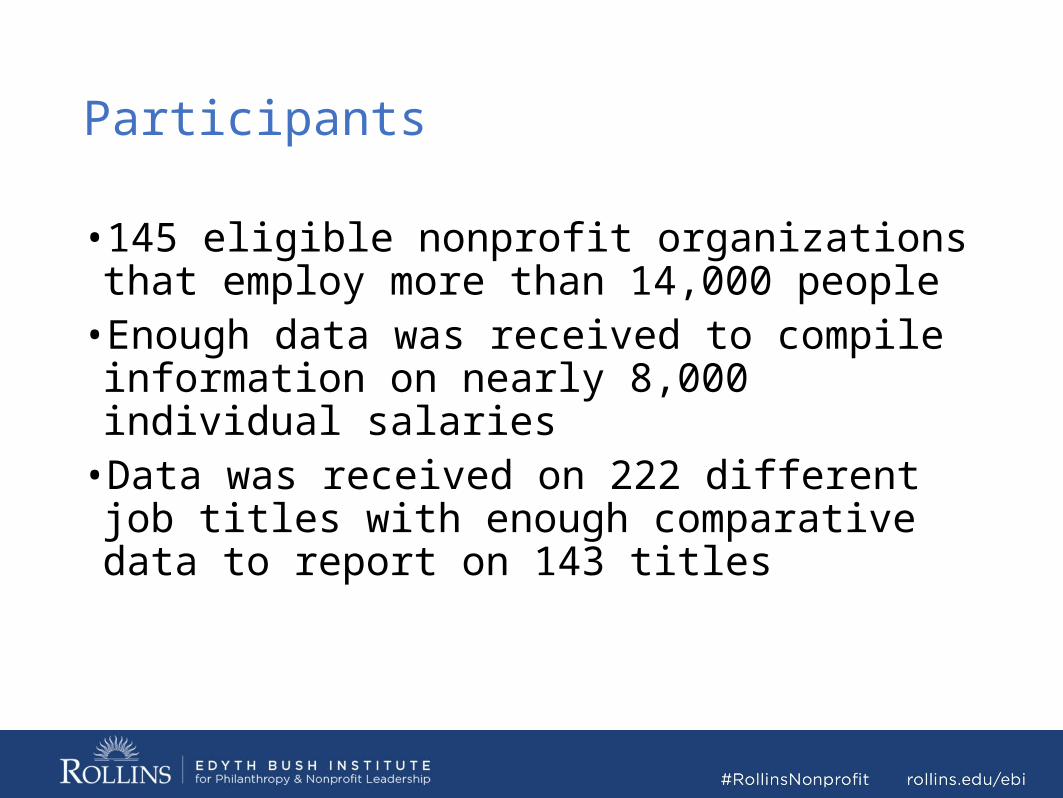
Participants
•145 eligible nonprofit organizations that employ more than 14,000 people•Enough data was received to compile information on nearly 8,000 individual salaries•Data was received on 222 different job titles with
enough comparative data to report on 143 titles

Budgets
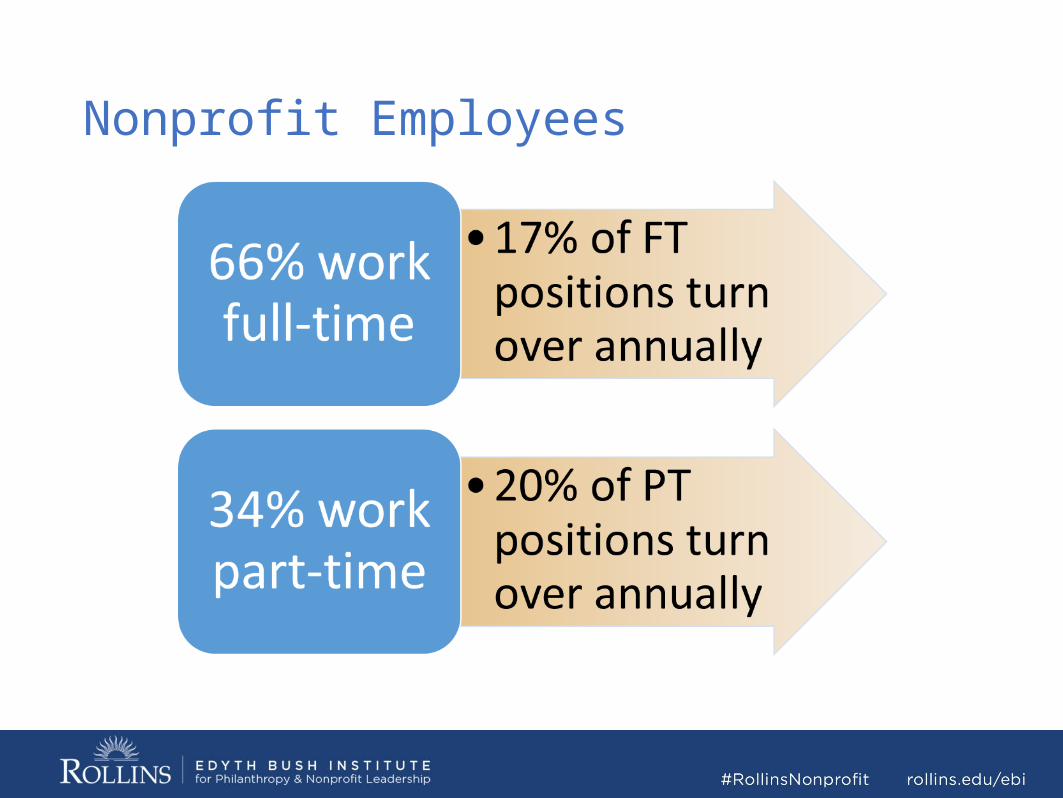
Nonprofit Employees

BenefitsPaid Time Off
•51% provide full-time employees with specific, separate numbers of paid days off for vacation, holiday and sick leave•45% have a PTO program – a set number of days off
to be taken for any purpose•52% offer paid time off for part-timers•Of those, >50% require an average minimum work
schedule of 25 hours

Benefits Health Insurance
•86% offer some type of health insurance to full-time employees•14% offer no health benefits•42% of those that have part-time employees offer
them health insurance - an average of 28 hours/week are required to qualify

BenefitsRetirement
•62% provide retirement benefits for full-time employees•Most offer a 401(k) or 403(b) plan•79% offer a plan with both employer and employee
contribution•16% offer a plan with no employer contribution•89% offer some percentage of each employee’s
annual salary Range: 2-20%; Average: 5.23%
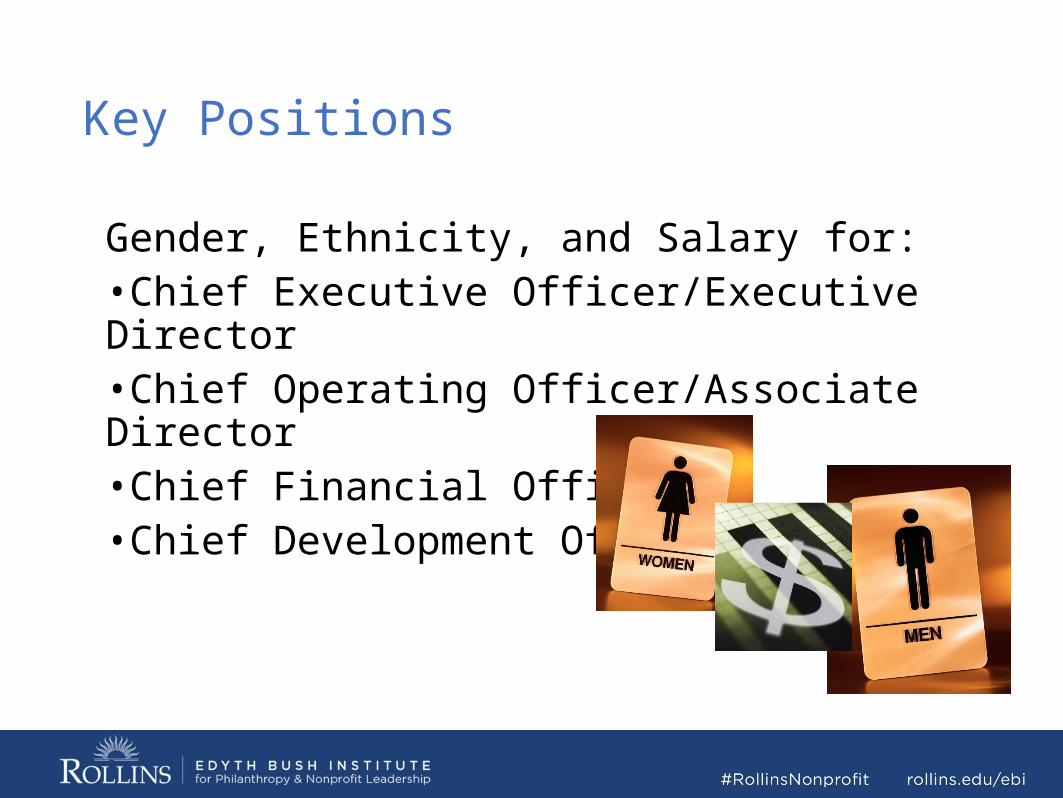
Key Positions
Gender, Ethnicity, and Salary for:•Chief Executive Officer/Executive Director•Chief Operating Officer/Associate Director•Chief Financial Officer•Chief Development Officer

CEO/ED

CEO/ED Compensation

COO/Associate Director

COO/Associate Director Compensation

CFO

CFO Compensation
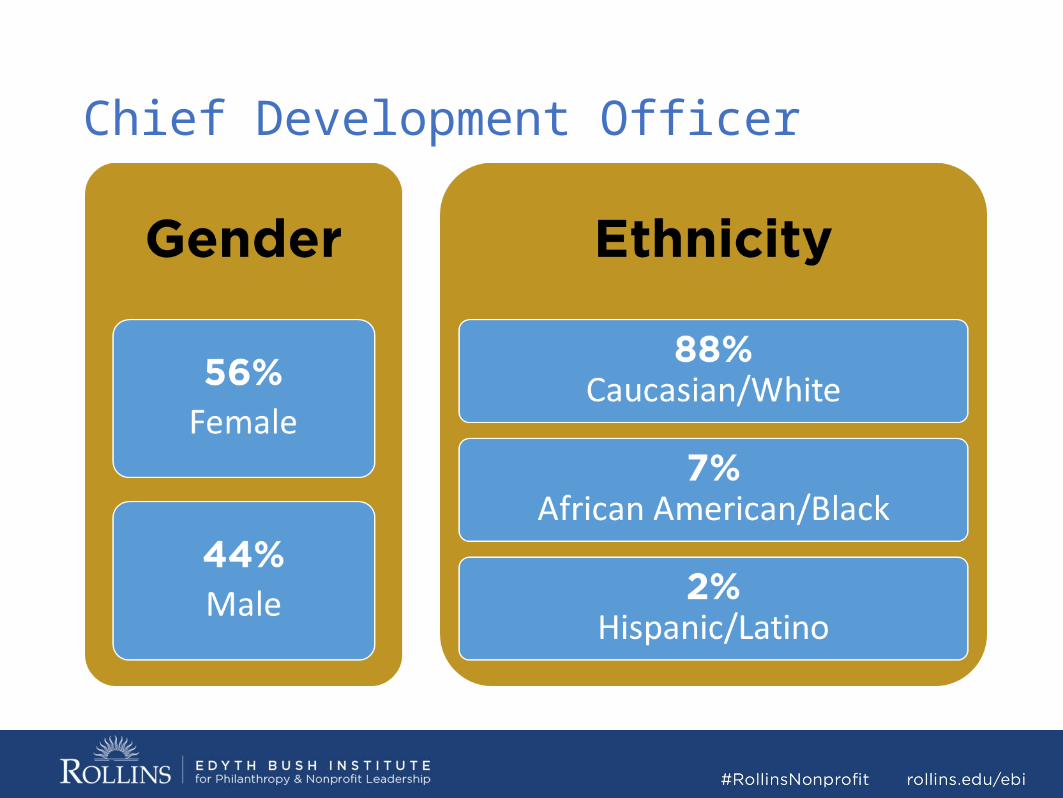
Chief Development Officer
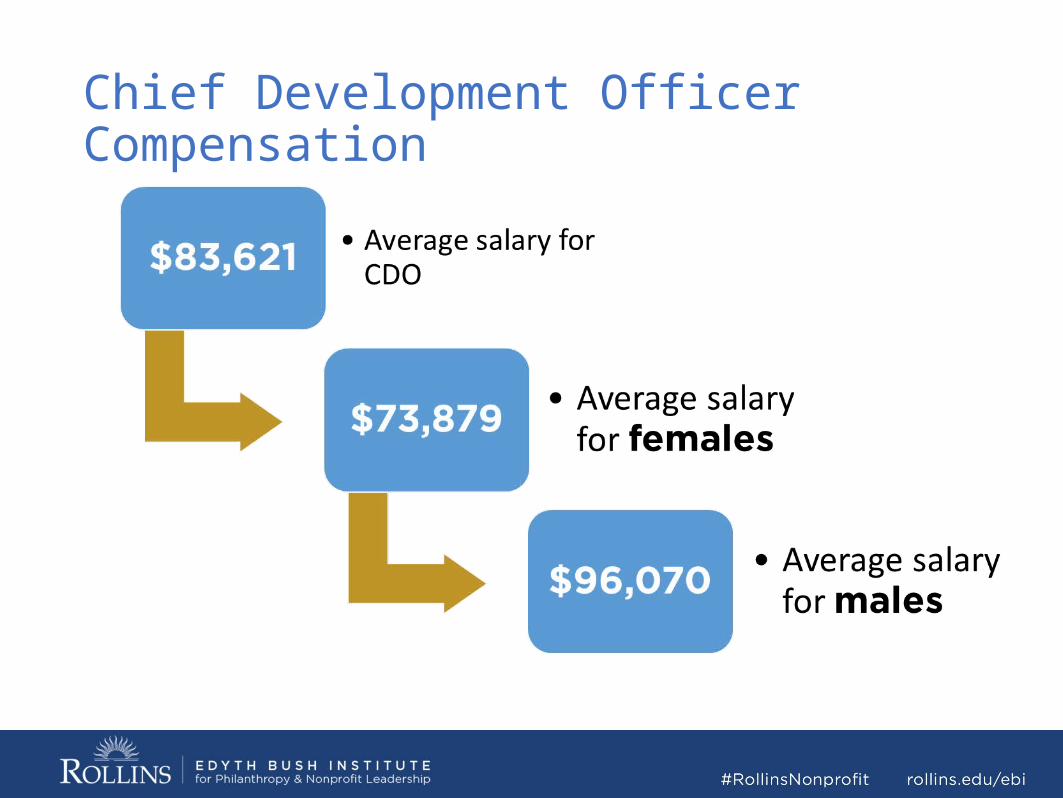
Chief Development OfficerCompensation

Survey Comparison 2015 to 2013
2015 2013
# of participants: 145 161
# of positions included: 143 137
# of job titles: 8,000 <10,000
Median budget: $1,297,925 $1,480,400
104 organizations (72%) participated in both studies
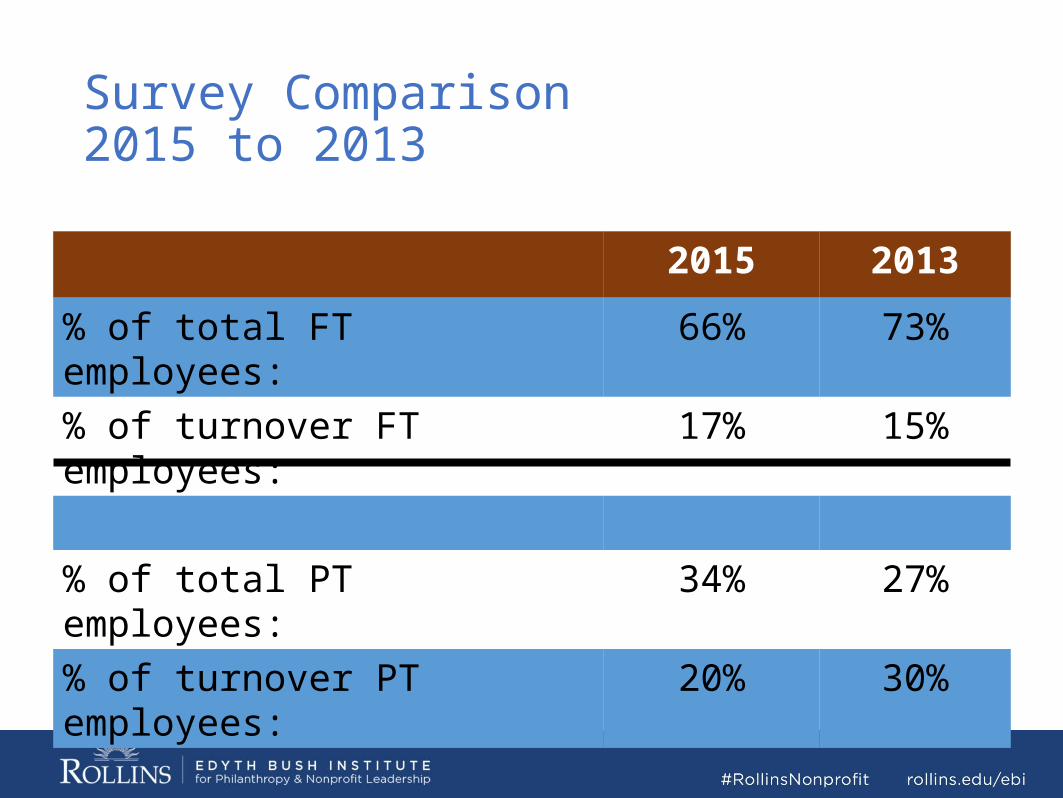
Survey Comparison 2015 to 2013
2015 2013
% of total FT employees: 66% 73%
% of turnover FT employees: 17% 15%
% of total PT employees: 34% 27%
% of turnover PT employees: 20% 30%

Survey Comparison 2015 to 2013
Benefits 2015 2013
NPO’s providing health insurance for employees
86% 88%
Average cost per employee per month:
$540 $495
NPO’s offering dental insurance NPO’s offering vision insurance
69%62%
71%59%
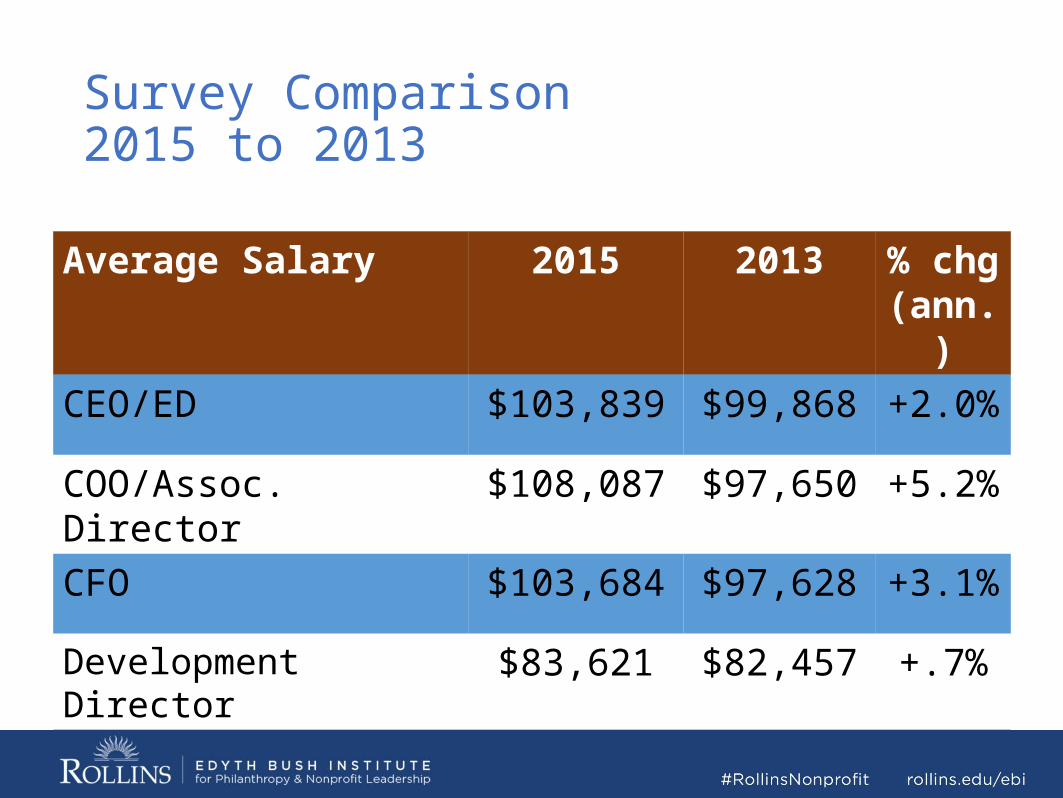
Survey Comparison 2015 to 2013
Average Salary 2015 2013 % chg (ann.)
CEO/ED $103,839 $99,868 +2.0%
COO/Assoc. Director $108,087 $97,650 +5.2%
CFO $103,684 $97,628 +3.1%
Development Director $83,621 $82,457 +.7%

Improvements Needed in our Local Sector
•Male/Female salary parity•Racial/Ethnic diversity in leadership• Strategies to stabilize the turnover of employees•NPO’s need to offer retirement benefits for
employees•NPO’s need to pay a living wage to all employees
Please honor the Edyth Bush Institute copyright on this report.
We appreciate acknowledgement of the Edyth Bush Institute
for Philanthropy & Nonprofit Leadershipas you use and share this report.

THANK YOU for your participation …we’ll be counting on you again in 2017!
Special thanks to:

2015 Central Florida Nonprofit Compensation & Benefits Survey
Sponsored by
Download the report for free at http://bit.ly/1dlVbLM.


![Compensation & Benefits[1]](https://static.fdocuments.in/doc/165x107/577d369f1a28ab3a6b938bc4/compensation-benefits1.jpg)