2014 full year results - Rio Tinto Tinto full year presentation... · 2014 full year results...
44
2014 full year results Delivering sustainable shareholder returns 12 February 2015 Highlights Financial performance 2015 objectives Appendix
Transcript of 2014 full year results - Rio Tinto Tinto full year presentation... · 2014 full year results...

2014 full year results Delivering sustainable shareholder returns
12 February 2015 Highlights Financial performance 2015 objectives Appendix

©2015, Rio Tinto, All Rights Reserved
Cautionary statement
This presentation has been prepared by Rio Tinto plc and Rio Tinto Limited (“Rio Tinto”). By accessing/attending this presentation you
acknowledge that you have read and understood the following statement.
Forward-looking statements
This document contains certain forward-looking statements with respect to the financial condition, results of operations and business of the Rio
Tinto Group. These statements are forward-looking statements within the meaning of Section 27A of the US Securities Act of 1933, and Section
21E of the US Securities Exchange Act of 1934. The words “intend”, “aim”, “project”, “anticipate”, “estimate”, “plan”, “believes”, “expects”, “may”,
“should”, “will”, “target”, “set to” or similar expressions, commonly identify such forward-looking statements.
Examples of forward-looking statements include those regarding estimated ore reserves, anticipated production or construction dates, costs,
outputs and productive lives of assets or similar factors. Forward-looking statements involve known and unknown risks, uncertainties,
assumptions and other factors set forth in this presentation.
For example, future ore reserves will be based in part on market prices that may vary significantly from current levels. These may materially affect
the timing and feasibility of particular developments. Other factors include the ability to produce and transport products profitably, demand for our
products, changes to the assumptions regarding the recoverable value of our tangible and intangible assets, the effect of foreign currency
exchange rates on market prices and operating costs, and activities by governmental authorities, such as changes in taxation or regulation, and
political uncertainty.
In light of these risks, uncertainties and assumptions, actual results could be materially different from projected future results expressed or implied
by these forward-looking statements which speak only as to the date of this presentation. Except as required by applicable regulations or by law,
the Rio Tinto Group does not undertake any obligation to publicly update or revise any forward-looking statements, whether as a result of new
information or future events. The Group cannot guarantee that its forward-looking statements will not differ materially from actual results. In this
presentation all figures are US dollars unless stated otherwise.
Disclaimer
Neither this presentation, nor the question and answer session, nor any part thereof, may be recorded, transcribed, distributed, published or
reproduced in any form, except as permitted by Rio Tinto. By accessing/ attending this presentation, you agree with the foregoing and, upon
request, you will promptly return any records or transcripts at the presentation without retaining any copies.
This presentation contains a number of non-IFRS financial measures. Rio Tinto management considers these to be key financial performance
indicators of the business and they are defined and/or reconciled in Rio Tinto’s annual results press release and/or Annual report.
2

Sam Walsh Chief executive
12 February 2015 Highlights Financial performance 2015 objectives Appendix

©2015, Rio Tinto, All Rights Reserved
Improve Strengthen Deliver
Reduced costs
Decreased capex Reduced net debt
Operating, exploration and evaluation cost reductions achieved by 31 December 2014 vs 2012 Full year 2014 spend vs 2012
Since net debt peaked
at 30 June 2013
Recycling capital
via divestments
Released working
capital
Materially increased
cash returns
Divestments completed
since January 2013
Working capital cash release 31
December 2014 vs 2012
2014 total dividend growth and capital
return compared to 2013
4
Delivering our transformation programme
$4.8bn by
$9.4bn
+64% $3.9bn
by
$9.6bn
$2.1bn

©2015, Rio Tinto, All Rights Reserved
5
2014 highlights
Underlying earnings of $9.3 billion
Net earnings of $6.5 billion
Net cash from operating activities of $14.3 billion
Net debt reduced by $5.6 billion to $12.5 billion
©2015, Rio Tinto, All Rights Reserved
6
Material increase in cash returns to shareholders
3.6
5.9
2013 2014
Dividends Share buy-back
Total cash returns to shareholders
US$ billion
1 Dividend numbers are based on total dividends declared for each financial year. 2014 numbers are based on the interim dividend paid in September 2014 and the 2014 final
dividend, payable in April 2015 (calculated based on the number of shares outstanding at 31 December 2014).
145
167
192
215
2011 2012 2013 2014
+15%
+15%
Dividends declared US cents per share
+12%
+64%
1

Chris Lynch Chief financial officer
12 February 2015 Highlights Financial performance 2015 objectives Appendix

©2015, Rio Tinto, All Rights Reserved
Delivering on our promises in 2014 8
Reduced costs
Decreased capital expenditure
Incremental operating, exploration & evaluation cost reductions achieved by 31 December 2014 vs 2013 31 December 2014 vs 2013
Released working capital
Strengthened balance sheet
Working capital cash release 31 December 2014 vs 2013 31 December 2014 vs 2013
by
$4.8bn $1.5bn
$5.6bn net debt reduction
$1.5bn

©2015, Rio Tinto, All Rights Reserved
10,217
6,511
9,305
691
1,431
958 217 188
(4,146)
(251)
0
2,000
4,000
6,000
8,000
10,000
12,000
2013underlyingearnings
Price Exchangerates
Energy &inflation
Flexed 2013 earnings
Volumes Cash costreductions
Exploration& evaluation(excludingdisposals &writedowns)
Tax and other 2014underlyingearnings
9
Management actions significantly offset price impact
Underlying earnings 2013 vs 2014 US$ million (post tax)
Total cost reductions
of $1,175m post-tax

©2015, Rio Tinto, All Rights Reserved
10
Net earnings
US$m
2014 underlying earnings 9,305
Impairments (1,187)
Impairment reversals 1,049
Losses on disposals (349)
MRRT repeal (362)
Exchange losses on
debt and derivatives (1,850)
Other (79)
Net earnings 6,527

©2015, Rio Tinto, All Rights Reserved
Underlying earnings ($bn) Net cash generated from operating activities ($bn)
2013 2014 2013 2014
Iron Ore 9.85 8.11 14.01 10.27
Aluminium 0.55 1.25 1.70 2.55
Copper 0.82 0.91 0.38 1.70
Diamonds & Minerals 0.35 0.40 0.84 1.20
Energy 0.03 (0.21)1 0.92 0.36
Product group total 11.62 10.46 17.85 16.08
Other ops./ other items/
exploration/ interest (1.40) (1.15) (2.80) (1.79)
Total 10.22 9.31 15.05 14.29
1 The completion of the sale of Rio Tinto Coal Mozambique (RTCM) was announced on 8 October 2014. Losses at RTCM of $93 million up to that date are included in the Energy underlying earnings. Underlying earnings were also negatively impacted by the $119 million loss at Energy Resources Australia.
11
Robust product group earnings and cash flows

©2015, Rio Tinto, All Rights Reserved
12
Continual cost improvement
Pre-tax operating cash cost improvements Reduction vs. 2012 (US$ billion)
0.98
1.30
0.93
0.40
0.75
5.58
3.30
1.53
3.61
4.83
H1 2013 H2 2013 2013 total(operatingand E&E)
H1 2014 H2 2014 2014 total(operatingand E&E)
Two-year total(operatingand E&E)
2015 target Combined totaltarget
(operatingand E&E)
Exploration & evaluation savings Operating cost reductions
Iron ore 0.71
Aluminium 0.81
Copper 0.92
D&M and other 0.37
Energy 0.80
TOTAL 3.61

©2015, Rio Tinto, All Rights Reserved
13
Pilbara – continual cost improvement
• Our low-cost advantage has been
sustained over many years:
− 2014 cash unit cost of $19.5/t
− H2 2014 cash unit cost of $18.7/t
(8% lower than $20.4/t in H1 2014 )
− Maintain consistently attractive
EBITDA margins (64% in 2014)
• Average realised FOB price of $84.3
per wet metric tonne ($91.6/dmt)
• 360 infrastructure project on track for
completion in H1 2015
• Expect production of 330Mt/a in 2015
Pilbara cash unit cost / EBITDA margin US$ per tonne Percentage
21.8
23.9
20.2 19.5
17.0
0%
10%
20%
30%
40%
50%
60%
70%
80%
0
5
10
15
20
25
30
FY 2011 FY 2012 FY 2013 FY 2014 Spot
Cash cost per tonne (US$/t) EBITDA Margin %
1
Source: Rio Tinto financial statements, Rio Tinto analysis. 1 Estimated cash unit costs for Q4 2014 on spot AUD:USD exchange rate of 78 Australian cents and a fuel price of A$0.67 per litre post fuel tax credits (2014 average: A$0.92/l).
©2015, Rio Tinto, All Rights Reserved
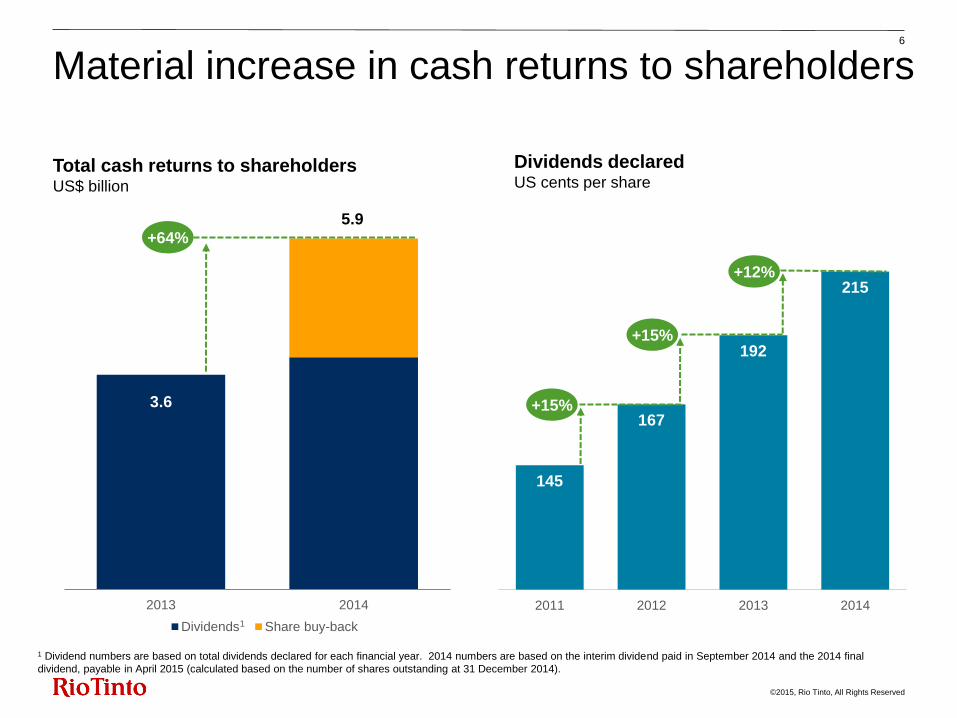
0%
25%
50%
75%
100%
2013 2014
EBITDA margin >60% EBITDA margin 45-60%
EBITDA margin 30-45% EBITDA margin 15-30%
EBITDA margin <15%
• High quality, low cost assets reduce
volatility of earnings and cash flow
• In 2014, the percentage of revenues
generating at least 30% EBITDA
margins increased to 80% through:
− Reducing costs
− Productivity improvements
− Divesting underperforming
businesses
Portfolio split by asset quality Percentage of revenue (2013 vs 2014)
14
Maintained Group EBITDA margin of 39%
EBITDA margins >60%
EBITDA margins 45-60%
EBITDA margins 30-45%
EBITDA margins 15-30%
EBITDA margins <15%

©2015, Rio Tinto, All Rights Reserved
9.4
15.1
14.3
2012 2013 2014
• $0.8 billion reduction in cash flows,
as $4 billion price impact largely
offset by:
− operating cash cost reductions
− exploration and evaluation savings
− 6% volume growth1
− $1.5 billion of working capital cash
release
Net cash generated from operating activities US$ billion
15
Strong operating cash flows
1 Copper equivalent growth calculated at 2013 constant prices and based on Rio
Tinto's reported production numbers released in 2014.

©2015, Rio Tinto, All Rights Reserved
• $1.5 billion cash unlocked now
available for more productive uses
• Significant release of working capital
achieved through:
− Optimising inventory levels
− Tighter management of receivables
• Continued focus on working capital
levels in 2015
0.4
1.1 1.5
Prices Inventory &receivables release
Total working capitalcash release
Working capital cash release US$ billion
16
$1.5 billion of cash released from working capital

©2015, Rio Tinto, All Rights Reserved
17.6
13.0
8.2
2012A 2013A 2014A 2015F 2016F 2017F
Sustaining Approved Yet to approve
~7 ~7 <7
• Capital allocation discipline requires
project IRR >15%
• All projects ranked against each
other and buy-backs
• Two major projects expected to
complete in first half of 2015:
− Kitimat modernisation
($1 billion remaining)
− Pilbara 290/360 infrastructure
($1.5 billion remaining)
• Silvergrass decision not required in
2015
Capital discipline… Capital expenditure profile (US$ billion)1
1 Forecast capex is subject to variation in future exchange rates. Capex numbers are gross and, in a change to previous reporting, are no longer net of disposals.
17
Focus on capital efficiency

©2015, Rio Tinto, All Rights Reserved
22.1
18.1
12.5
14.5
Share buy-back
28%
25%
19%
21%
Jun-13 Dec-13 Dec-14 Pro formaDec-14*
• Maintain strong balance sheet amid
challenging market
• Targeting 20-30% gearing ratio
through the cycle
• Ratio expected to remain at lower
end of the range in near term
• $12.4 billion of cash on hand as at
31 Dec. 2014
− $1.75 billion of bonds maturing in
2015
− $2 billion share buy-back
• Balance sheet headroom a key
competitive advantage
Net debt and gearing ratio1
US$ billion
1 Gearing ratio = net debt/ (net debt + book equity). * Post $2 billion share buy-back.
18
Balance sheet strength and flexibility
Gearing ratio Net debt
©2015, Rio Tinto, All Rights Reserved
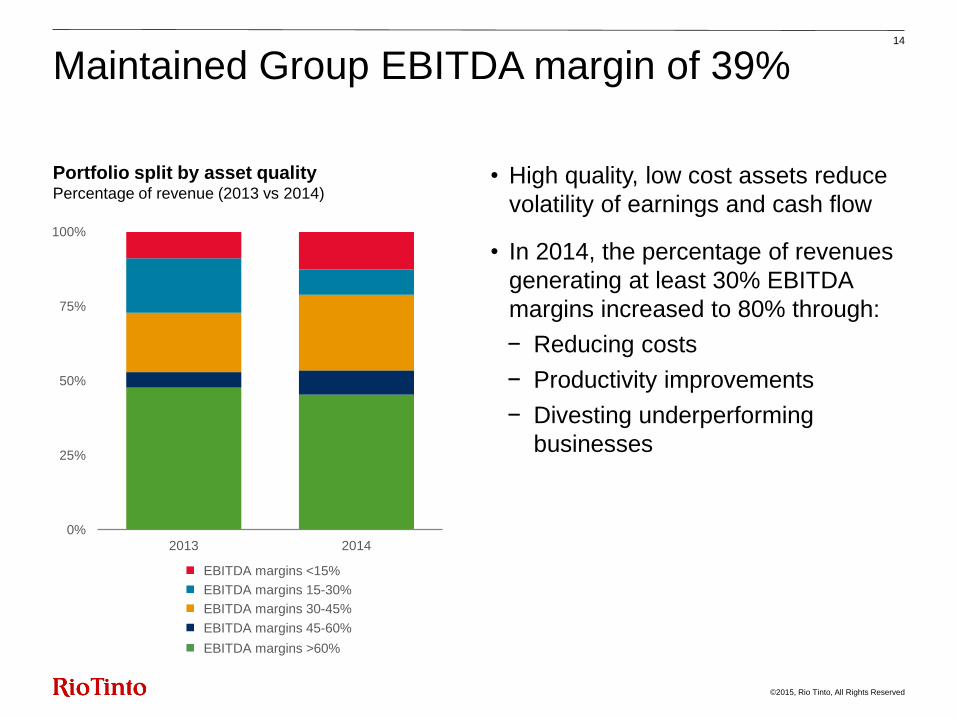
3. Iterative cycle of
2. Progressive
dividends
19
Our capital allocation framework maximises shareholder value
Compelling growth
Further cash
returns to shareholders
Debt management
1. Essential
sustaining capex

Sam Walsh Chief executive
12 February 2015 Highlights Financial performance 2015 objectives Appendix

©2015, Rio Tinto, All Rights Reserved
21
Our commitment to shareholders
To deliver industry-leading, sustainable shareholder
returns through the cycle from our:
Tier 1 assets
Disciplined allocation of capital
Operating and commercial excellence
Culture of safety and integrity
©2015, Rio Tinto, All Rights Reserved
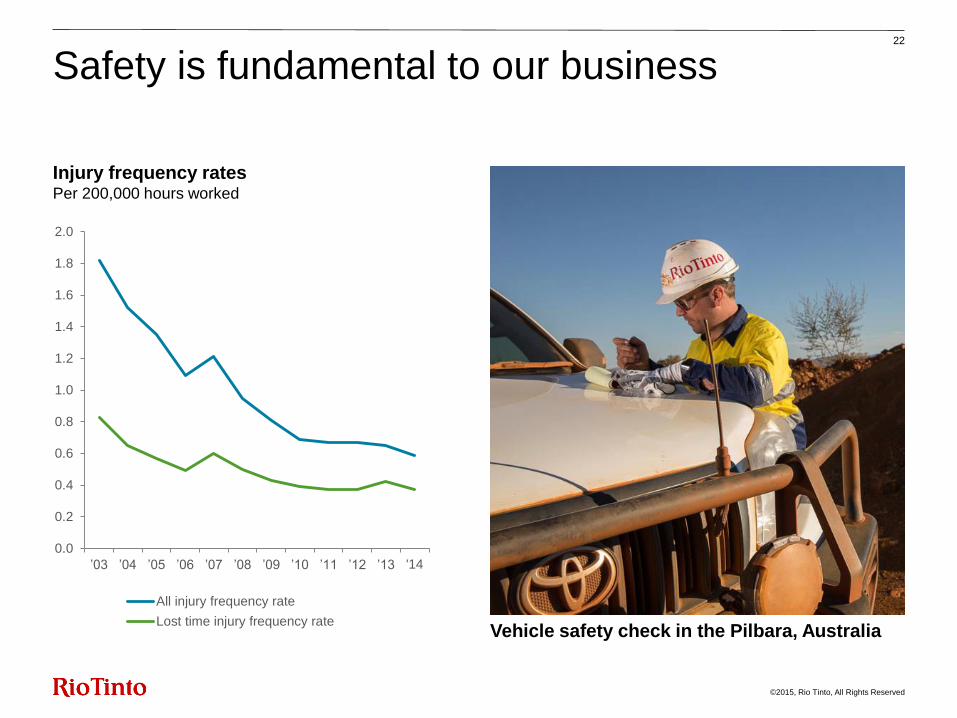
0.0
0.2
0.4
0.6
0.8
1.0
1.2
1.4
1.6
1.8
2.0
’03 ’04 ’05 ’06 ’07 ’08 ’09 ’10 ’11 ’12 ’13 '14
All injury frequency rate
Lost time injury frequency rate
Injury frequency rates Per 200,000 hours worked
Vehicle safety check in the Pilbara, Australia
22
Safety is fundamental to our business

©2015, Rio Tinto, All Rights Reserved
Succeeding in a challenging market 23
Long-life, low-cost
and expandable assets
Strong cash flow generation
throughout the cycle from our
key commodities
Commercial excellence
Strong customer relationships,
high quality benchmark products,
technical marketing and
value-in-use pricing
Operating excellence
Leadership in technology
and productivity drives a
sustainable and competitive
cost position
Strong and efficient
balance sheet
Sustainable shareholder
returns and
value-adding growth

©2015, Rio Tinto, All Rights Reserved
Maintain industry-leading
cost position
Completing 360
infrastructure in H1
40 Mt/a of brownfield
expansions
Build on sector-leading
EBITDA margin position
Deliver Kitimat
modernisation in H1, further
consolidating smelter cost
curve position
Bauxite expansion projects
• South of Embley
• Gove to 8Mt/a
24
Managing a world-class portfolio…
2015 guidance
Copper Aluminium Iron Ore
Global shipments
approaching 350 Mt
2015 objectives
2014 achievements
Strong focus on cash and
preservation of margins
Drive operational excellence
across the group
Progress growth options
• Oyu Tolgoi U/G
• Resolution & La Granja
Bauxite: 43 Mt
Alumina: 8.0 Mt
Aluminium: 3.3 Mt
Mined copper: 500-535kt
Refined copper: 190-220kt
Cash generated:
$10.3 billion
Completed 290Mt/a
ramp-up
Cash generated:
$2.6 billion
Sector-leading primary
metal 2014 EBITDA
margin of 25%
Cash generated:
$1.7 billion
Maintained EBITDA
margins at 42%
©2015, Rio Tinto, All Rights Reserved
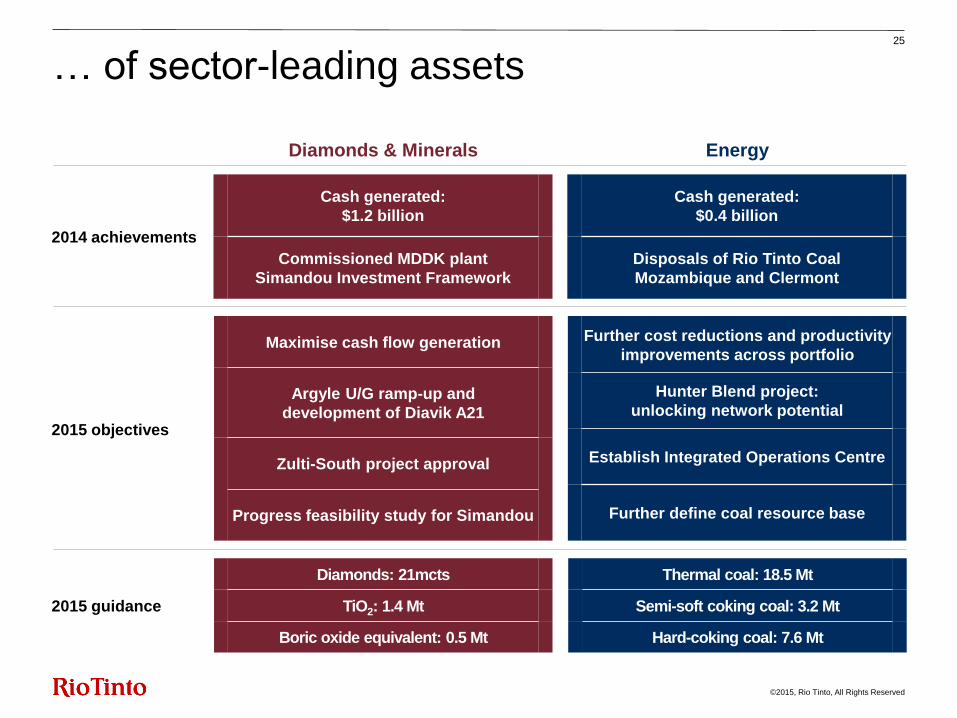
Cash generated:
$1.2 billion
Commissioned MDDK plant
Simandou Investment Framework
25
… of sector-leading assets
2015 guidance
2015 objectives
Maximise cash flow generation
Argyle U/G ramp-up and
development of Diavik A21
Zulti-South project approval
Progress feasibility study for Simandou
Energy Diamonds & Minerals
2014 achievements
Diamonds: 21mcts
TiO2: 1.4 Mt
Boric oxide equivalent: 0.5 Mt
Thermal coal: 18.5 Mt
Semi-soft coking coal: 3.2 Mt
Hard-coking coal: 7.6 Mt
Hunter Blend project:
unlocking network potential
Establish Integrated Operations Centre
Further define coal resource base
Further cost reductions and productivity
improvements across portfolio
Cash generated:
$0.4 billion
Disposals of Rio Tinto Coal
Mozambique and Clermont
©2015, Rio Tinto, All Rights Reserved
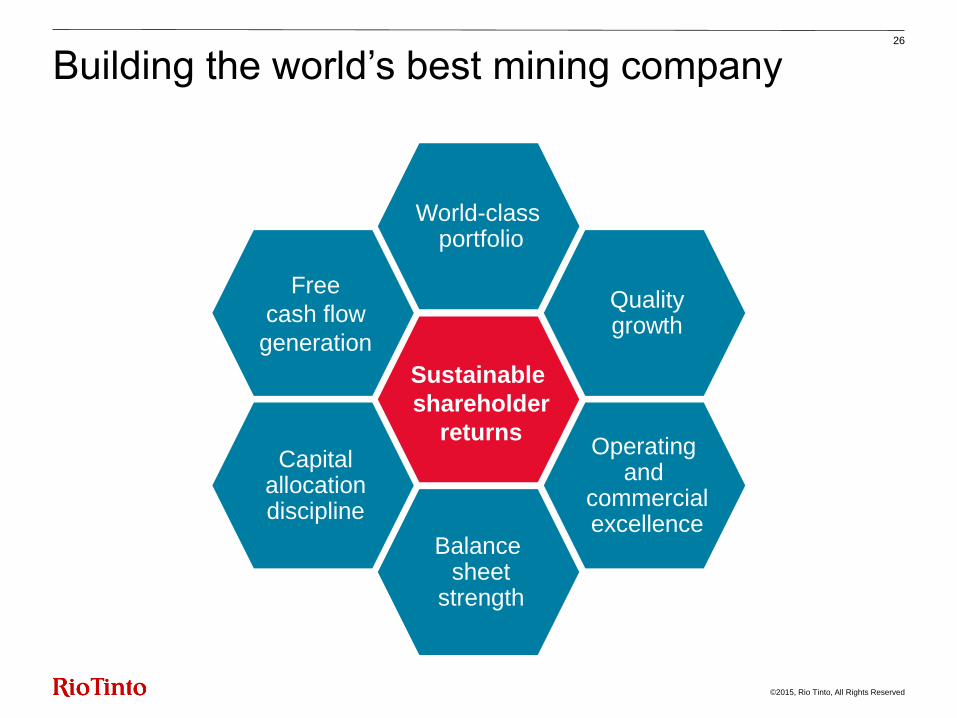
26
Building the world’s best mining company
World-class portfolio
Sustainable
shareholder
returns Capital
allocation discipline
Balance sheet
strength
Quality growth
Free
cash flow
generation
Operating and
commercial excellence

2014 full year results Delivering sustainable shareholder returns
12 February 2015 Highlights Financial performance 2015 objectives Appendix
©2015, Rio Tinto, All Rights Reserved
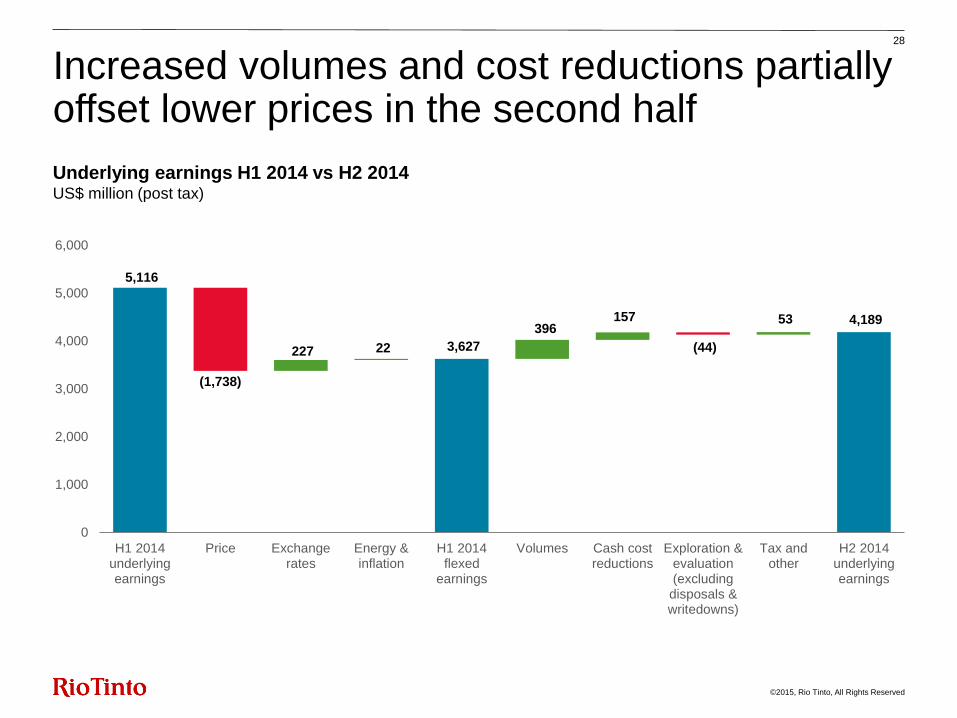
5,116
3,627
4,189
227 22
396 157 53
(1,738)
(44)
0
1,000
2,000
3,000
4,000
5,000
6,000
H1 2014underlyingearnings
Price Exchangerates
Energy &inflation
H1 2014flexed
earnings
Volumes Cash costreductions
Exploration &evaluation(excludingdisposals &writedowns)
Tax andother
H2 2014underlyingearnings
28
Increased volumes and cost reductions partially offset lower prices in the second half
Underlying earnings H1 2014 vs H2 2014 US$ million (post tax)
©2015, Rio Tinto, All Rights Reserved
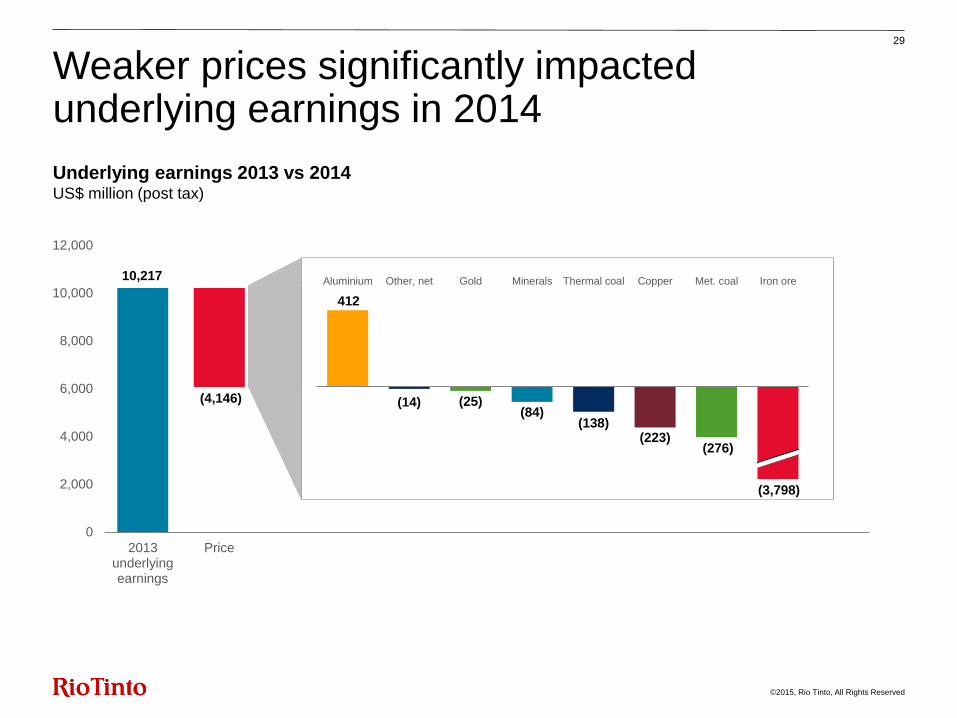
29
Weaker prices significantly impacted underlying earnings in 2014
Underlying earnings 2013 vs 2014 US$ million (post tax)
0
2,000
4,000
6,000
8,000
10,000
12,000
2013underlyingearnings
Price
(4,146)
10,217
412
(14) (25) (84)
(138) (223)
(276)
Aluminium Other, net Gold Minerals Thermal coal Copper Met. coal Iron ore
(3,798)

©2015, Rio Tinto, All Rights Reserved
10,217
6,511 691
1,431
(4,146) (251)
0
2,000
4,000
6,000
8,000
10,000
12,000
2013underlyingearnings
Price Exchangerates
Energy &inflation
Flexed2013
underlyingearnings
Volumes
85 69
37 17 11 8
(11)
(71)
1,286
30
… partly offset by favourable exchange rates and higher volumes
Underlying earnings 2013 vs 2014 US$ million (post tax)

©2015, Rio Tinto, All Rights Reserved
411
1,108
Price Inventory &receivables
release
4,079
1,366 668
(1,501)
(1,880)
1,519
1,194
2013workingcapital
Inventories Receivables Payables 2014workingcapital
Othernon-cash
Total workingcapital cash
release
Working capital movements US$ million
31
$1.5 billion of cash released from working capital
$2.7bn

©2015, Rio Tinto, All Rights Reserved
32
Iron Ore: increased volumes and cost reductions partially offset lower prices
Underlying earnings 2013 vs 2014 US$ million (post tax)
9,858
6,197
8,107
186
1,286 259 9 356
(3,798) (49)
4,000
6,000
8,000
10,000
2013underlyingearnings
Price Exchangerates
Energy &inflation
Flexed 2013 earnings
Volumes Cash costreductions
Exploration &evaluation
Tax & other 2014underlyingearnings
• Production of 295 million tonnes was 11% higher than in 2013 as the 290 Mt/a Pilbara expansion reached nameplate capacity in May 2014, two months ahead of schedule.
• Almost 90% of the additional 30 million tonnes produced in 2014 has gone directly into the premium Pilbara Blend, the industry reference for the 62% Fe market.
• Pilbara EBITDA margins of 64% achieved in 2014 (70% in 2013) despite a 30% decline in average 62% Fe index prices compared to 2013.
• Total cost reductions delivered in 2014 of $259 million post tax, through productivity improvements and lower contractor costs. Total pre-tax Iron Ore cost savings delivered since 2012 are now $710 million.
• Tax and other driven by lower MRRT expense following repeal in Q3 2014 and the one-off royalty settlement in 2013.
• Pilbara iron ore revenues includes $1,312 million of freight in 2014 ($927 million in 2013).

©2015, Rio Tinto, All Rights Reserved
The world’s best aluminium business
Clear focused strategy: Bauxite and first quartile smelters are key pillars
33
1 Post completion of the Kitimat modernisation project, with first production expected towards the end of the first half of 2015.
Alumina Aluminium Bauxite
Industry-leading bauxite
position
Third party sales of 23 million
tonnes in 2014
Achieved FOB EBITDA margins
of 44% in 2014
Market-paced growth options
at Cape York, starting with
South of Embley
Provides competitive security
of supply for our smelters
Improve financial
performance in 2015
Focused on ramping up
Yarwun, reducing costs and
improving productivity
Sector-leading primary metal
2014 EBITDA margin of 25%
2014 underlying earnings
increased by 182% vs 2013
80% of smelters in first cost
quartile1; ~80% of power from
low carbon sources
Focused on cash generation

©2015, Rio Tinto, All Rights Reserved
• While the LME price increased 1% compared to 2013, the significant uplift in physical delivery market premiums and the impact
of weaker Canadian and Australian dollars significantly increased flexed underlying earnings.
• Total cost savings delivered in 2014 of $168 million post tax, through productivity improvements and cost reductions. Total pre-
tax Aluminium cost savings delivered since 2012 are now $806 million.
• EBITDA margins improved to 29% in 2014, compared to 19% in 2013. Improved EBITDA and reduced working capital have
delivered strong operating cash flows of $2.6 billion and over $500 million of free cash flow.
• Third party bauxite sales increased 4% during 2014 to 23.3 million tonnes (2013: 22.4 million tonnes).
• The Kitimat modernisation is on track, with first production expected by the end of the first half of 2015.
• The South of Embley project, a 22.8 Mt/a, tier one investment opportunity, received funding approval to continue feasibility study.
• In 2014, the Aluminium group sold its joint venture interests in the SØRAL smelter in Norway in October and the Alucam smelter
in Cameroon in December.
• Bauxite revenues includes $256 million of freight in 2014 ($261 million in 2013).
(1) Excludes the Gove alumina refinery, which continues to be reported in Other operations.
34
Aluminium:(1) exchange rates, strong price premiums and cost improvements more than doubled earnings
Underlying earnings 2013 vs 2014 US$ million (post tax)
557
1,103 1,248
377
247 17 168 3
(78) (43)
-
500
1,000
1,500
2013underlyingearnings
Price Exchangerates
Energy &inflation
Flexed 2013 earnings
Volumes Cash costreductions
Exploration &evaluation
Tax & other 2014underlyingearnings

©2015, Rio Tinto, All Rights Reserved
35
Copper: a clear strategy to create long-term value
$923 million of cash cost
improvements since 2012
42% EBITDA margin preserved in 2014
despite 7% lower average LME price
Significant progress in simplifying
the portfolio since 2012
Clear strategy to deliver
sustainable value:
• Maximise value from
existing operations
• Deliver brownfield growth projects
to leverage next copper cycle
• Progress future world-class
greenfield growth options
Four key operating assets
Two greenfield options
Oyu Tolgoi Kennecott
Escondida Grasberg
La Granja Resolution

©2015, Rio Tinto, All Rights Reserved
36
Copper: cost savings and improved volumes more than offset lower prices
Underlying earnings 2013 vs 2014 US$ million (post tax)
• Cost reductions and volume improvements delivered a significant uplift in underlying earnings year on year, more than
offsetting lower prices. Total pre-tax cost savings delivered by Copper since 2012 are now $923 million.
• Achieved $1.7bn gross revenue at Oyu Tolgoi, where shipments exceeded production in 2014 and inventories returned
to normal levels at the year end.
• Kennecott completed a 65-day smelter maintenance shutdown during the fourth quarter and began de-weighting and
de-watering the east wall to manage a geologic structure, which will temporarily lower mined copper in 2015.
• Resolution Copper achieved a number of significant milestones during the year with completion of the first shaft and
approval of the land exchange under the Southeast Arizona Land Exchange and Conservation Act.
• At 31 December 2014, the Group had an estimated 331 million pounds of copper sales (2013: 254 million) that were
provisionally priced at 288 cents per pound (2013: 333 cents). The final price of these sales will be determined during
the first half of 2015.
821
572
912 120
30 149
294 121
(131) (244) (24)
(224)
0
200
400
600
800
1,000
1,200
2013 DivestedOperations in
2013
Absence ofexplorationwrite down
Price Exchangerates
Energy &inflation
Flexed 2013underlyingearnings
Volumes Cash costreductions
Exploration &evaluation
Tax & other 2014

©2015, Rio Tinto, All Rights Reserved
Improve Strengthen Deliver
Reduced costs
Reducing capex Increasing free
cash flow
Operating cost reductions achieved by 31 December 2014 vs 20121
Cumulative year on year capex
reductions since 20123
Reducing working
capital
Progressing high
value projects
Trade working capital
31 December 2014 vs 20122
Cumulative increases to free cash flow
since 20124
$648million
$677million
$1,325million
37
Diamonds & Minerals: delivering free cash flow
$40 million
$470 million
$674 million
A21
Argyle U/G
MDDK
Zulti South FS Simandou
FS
2013
vs
2012
2014
vs
2013
Cumulative
1 The impact of cost savings achieved are largely offset by the effect of higher fixed costs per tonne due to lower production in response to market conditions. 2 Excludes
Simandou and the impact of reporting Richards Bay Minerals inventory at fair value in December 2012. 3 FY 2014 vs FY 2012 reductions in capital expenditure. Excludes
Simandou, includes EAU capex. 4 FY 2013 vs FY 2012 and FY 2014 vs FY 2013 increases in free cash flow. Excludes Simandou.

©2015, Rio Tinto, All Rights Reserved
38
Diamonds & Minerals: 15% higher underlying earnings from cost reductions and increased volumes
Underlying earnings 2013 vs 2014 US$ million (post tax)
350 327
401 91 37
36 21
(61) (53)
(20)
0
100
200
300
400
500
2013underlyingearnings
Price Exchangerates
Energy &inflation
Flexed 2013earnings
Volumes Cash costreductions
Exploration &evaluation
Tax & other 2014underlyingearnings
• Excluding Simandou project costs, underlying earnings were 16% higher than 2013, reflecting cash cost reductions,
higher sales volumes and lower exploration and evaluation spend during 2014.
• The second crusher at Argyle was commissioned during the year and the ramp-up of the Argyle underground mine to
full operation is on schedule to be completed in 2015.
• In November 2014, the $350 million development of the A21 kimberlite pipe at Diavik was approved (Rio Tinto share
$210 million), which will provide an important source of incremental supply to maintain existing production levels.
• The feasibility studies for the Simandou mine and infrastructure – a project which has the potential to be a truly world
class operation – have continued to the extent possible during the year, despite the outbreak of Ebola, and will
continue in 2015.

©2015, Rio Tinto, All Rights Reserved
• Significant progress in reshaping the
portfolio in 2014
− Sale of Clermont for US$1 billion
− Sale of Rio Tinto Coal Mozambique
• Rio Tinto Coal Australia generating
positive earnings and cash flows
• $795 million in cost savings since 2012
• Marketing expertise delivered price
premium to spot benchmarks:1
− 35% over index on uranium
− 10% over index on thermal coal
− 8% over index on coking coal
• Hunter Blend project is focus for 2015:
− Unlocking network potential of Hunter
Valley
− Integrated Operations Centre
39
Energy: large, high-quality Hunter Valley resource
RTCA has a large footprint
…with shallow, stable geology
Favourable
geology
Mt Pleasant project
Bengalla
Hunter Valley
Operations (HVO)
Auckland (HVO) project
Mount Thorley Warkworth
20km
Jerry’s Plains Subgroup Foybrook Formation Open Cut Pit
RTCA
Auckland
500m
5000m
Glencore
Bulga
RTCA
HVO, MTW
1Three year average.

©2015, Rio Tinto, All Rights Reserved
40
Energy: cash cost reductions and lower E&E spend offset by weaker prices
Underlying earnings 2013 vs 2014 US$ million (post tax)
33
(334)
(210) 114 107
62 33
(434)
(47)
(78) (500)
(400)
(300)
(200)
(100)
-
100
2013underlyingearnings
Price Exchangerates
Energy &inflation
Flexed 2013earnings
Volumes Cash costreductions
Exploration &evaluation
Tax & other 2014underlyingearnings
• Significant productivity gains across the Australian coal business delivered annual site production records at Hail
Creek, Hunter Valley Operations and Bengalla.
• Total pre-tax Energy cost savings delivered since 2012 are $795 million.
• A weaker Australian dollar, cash cost reductions and lower exploration & evaluation spend were more than offset by
lower prices.
• Rio Tinto Coal Australia finished the year with $21 million in underlying earnings in a difficult price environment but this
was overshadowed by $93 million of losses incurred at Rio Tinto Coal Mozambique before it was divested in October
2014, and the $119 million loss at Energy Resources Australia.
• Rio Tinto completed the sale of its 50.1% interest in the Clermont Joint Venture for $1.015 billion during 2014.

©2015, Rio Tinto, All Rights Reserved
• Other operations includes the Gove alumina refinery and RT Marine. The reduction in net loss reflects cash cost
savings, exchange rate benefits and increased volumes.
• Exploration costs were largely in line after accounting for the lower divestment income during the year.
• Other includes savings across central functions.
Other movements in underlying earnings 41
Underlying earnings impact
Energy & Inflation Volumes
Cash Costs
Epl'n eval'n
Epl'n eval'n 2014 disp
Non Cash
Interest, tax & other 2014 US$ million 2013
FX/ price
Intersegment (4) - - - 4 - - - - -
Other operations (281) 17 - 20 36 - - (12) (23) (243)
Central Exploration (net) (145) 7 - - - 1 (19) - - (156)
Interest (242) - - - - - - - 81 (161)
Other (730) 13 - - 54 - - (27) 97 (593)
Total (1,402) 37 - 20 94 1 (19) (39) 155 (1,153)

©2015, Rio Tinto, All Rights Reserved
42
Earnings reconciliations
2014
Energy Resources of Australia US$m
Earnings per ERA press release (A$188m) (170)
Increased depreciation of closure asset (3)
Tax and unwinding of discount 1
Less: Minority interests (31.6%) 58
Other (5)
Underlying earnings as reported by Rio Tinto (119)

©2015, Rio Tinto, All Rights Reserved
43
Modelling earnings
Note: The sensitivities give the estimated effect on underlying earnings assuming that each individual price or exchange rate moved in isolation. The relationship between currencies and commodity prices is a complex one and movements in exchange rates can affect movements in commodity prices and vice versa. The exchange rate sensitivities include the effect on operating costs but exclude the effect of revaluation of foreign currency working capital.
Earnings sensitivity
2014 average price/
rate
($m) impact on 2014 underlying earnings of 10%
price/rate change
Copper 310c/lb 340
Aluminium $1,867/t 462
Gold $1,266/oz 46
Iron ore (62% Fe FOB) $88/t 1,303
Coking coal (benchmark) $126/t 110
Thermal coal (average spot) $74/t 117
A$ 90USc 753
C$ 91USc 251
Oil $101/bbl 100
©2015, Rio Tinto, All Rights Reserved
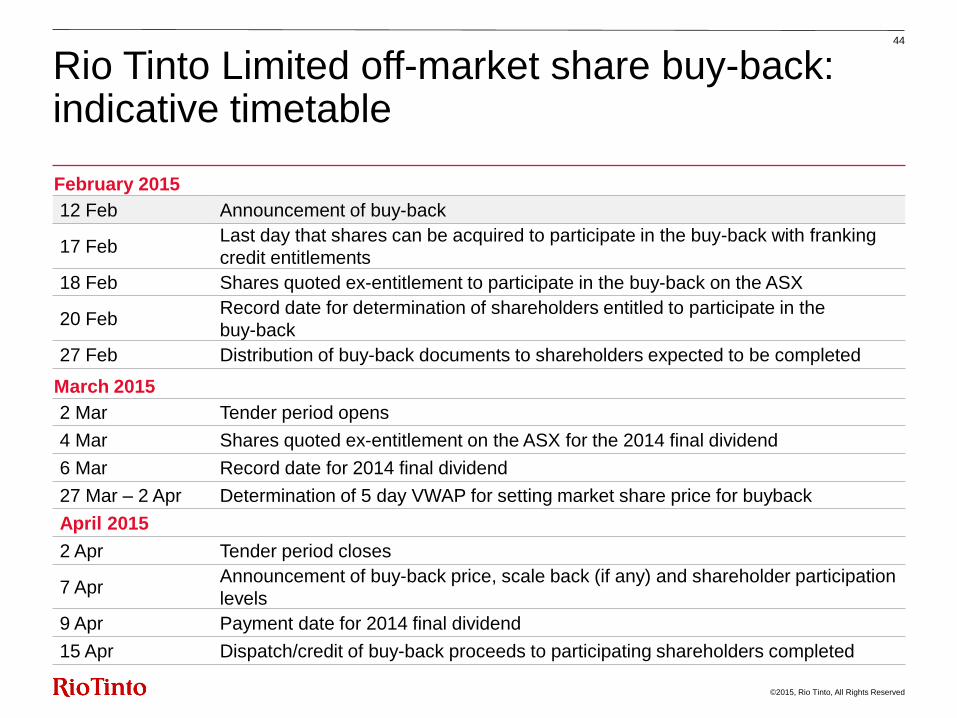
44
Rio Tinto Limited off-market share buy-back: indicative timetable
February 2015
12 Feb Announcement of buy-back
17 Feb Last day that shares can be acquired to participate in the buy-back with franking
credit entitlements
18 Feb Shares quoted ex-entitlement to participate in the buy-back on the ASX
20 Feb Record date for determination of shareholders entitled to participate in the
buy-back
27 Feb Distribution of buy-back documents to shareholders expected to be completed
March 2015
2 Mar Tender period opens
4 Mar Shares quoted ex-entitlement on the ASX for the 2014 final dividend
6 Mar Record date for 2014 final dividend
27 Mar – 2 Apr Determination of 5 day VWAP for setting market share price for buyback
April 2015
2 Apr Tender period closes
7 Apr Announcement of buy-back price, scale back (if any) and shareholder participation
levels
9 Apr Payment date for 2014 final dividend
15 Apr Dispatch/credit of buy-back proceeds to participating shareholders completed