Educational Visioning: Defining Next Educational Practices + Facilities Support
Upload
samson-hopkinsCategory
view
222download
0description

2014/15 Educational and General Budget
Board of GovernorsFinance, Administration, and Facilities Committee
October 16, 2013
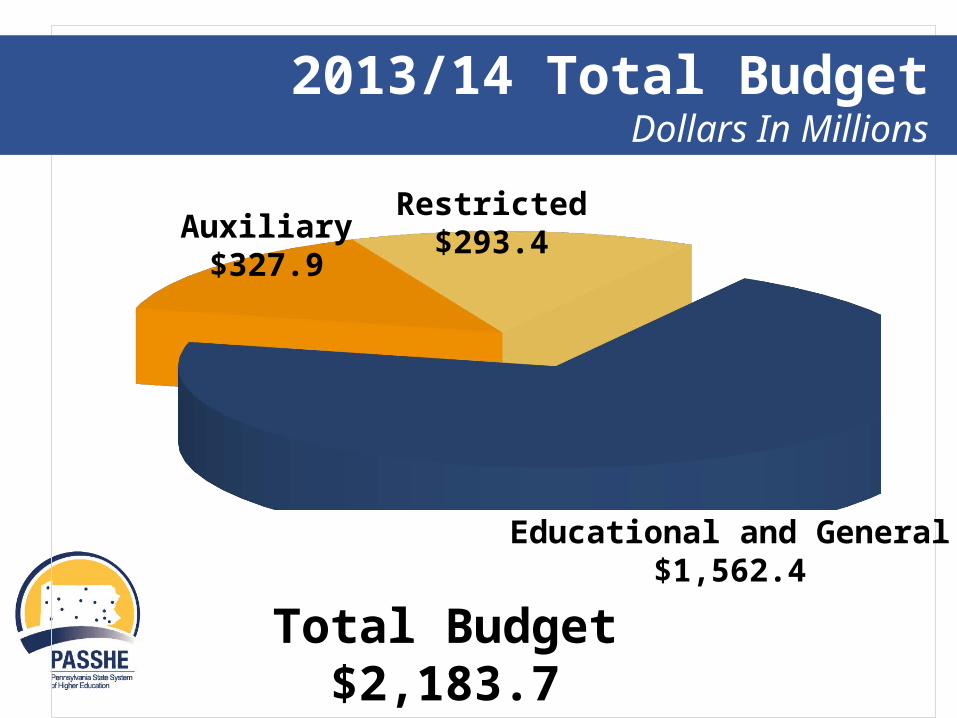
Total Budget$2,183.7
Educational and General$1,562.4
Auxiliary$327.9
Restricted$293.4
2013/14 Total BudgetDollars In Millions

Appropriation$412.8
26%
Tuition and Fees$1,019.7
65%All Other
$129.98%
2013/14 E&G Revenue and SourcesDollars In Millions
E&G Budget$1,562.4

Capital/Transfers$1067%
Salaries & Wages$79651%
Benefits$35322%
All Other “Operating”
$30720%
2013/14 E&G Expenditures and UsesDollars In Millions
E&G Expenditures: $1,562
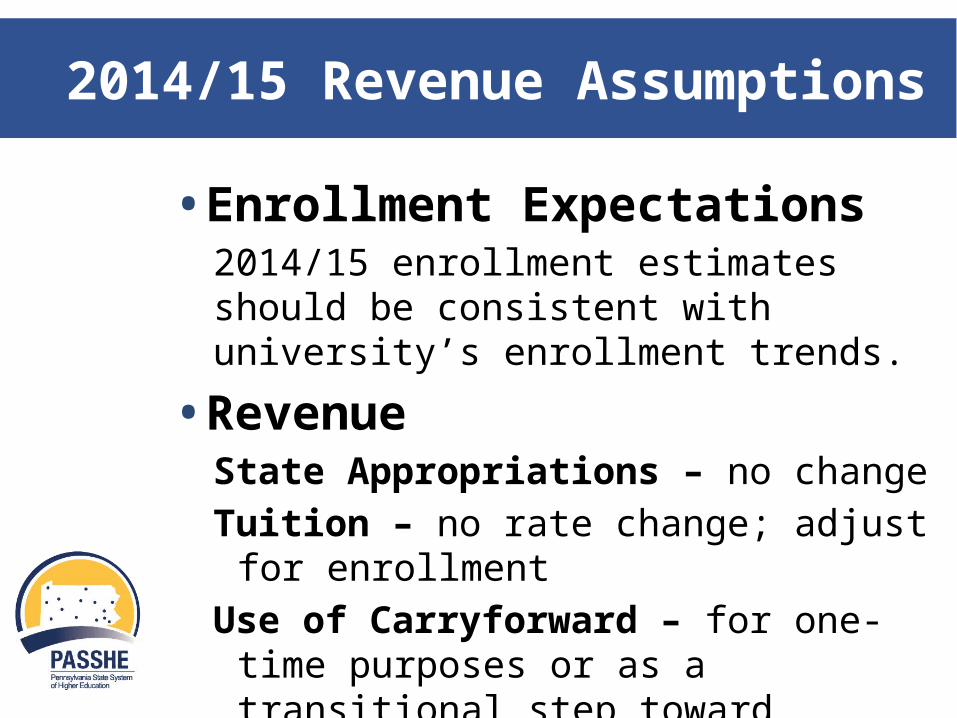
2014/15 Revenue Assumptions
•Enrollment Expectations2014/15 enrollment estimates should be consistent with university’s enrollment trends.
•RevenueState Appropriations – no changeTuition – no rate change; adjust for enrollmentUse of Carryforward – for one-time purposes
or as a transitional step toward structural changes.

AgendaEnrollment ProjectionsAnnualized Full-time Equivalent
5,801 or
5.2% less than
10/11
2007/08 2008/09 2009/10 2010/11 2011/12 2012/13 2013/14 2014/1580,000
85,000
90,000
95,000
100,000
105,000
110,000
115,000
120,000
103,359105,566
109,637112,030
109,741106,975
104,587 103,814
PASSHE Full-time Equivalent Enrollment
7.3% less than10/11

AgendaPercent Change in High School Graduates 2008/09 and 2019/20
5,801 or
5.2% less than
10/11
<-15 -5 0 +5 >+15 Source: WICHE, Knocking at the College Door

2014/15 Cost Drivers
Expenditure CategoriesPercent Increase
$ in Millions
Salary Adjustments* 3.1% $23.9Employee and Annuitant Health Care* 7.0%** 12.6Retirement* 21.4% 18.2 PSERS and SERS Rate Changes Only* 29.5% 13.2Consumer Price Index 3.0%
*Estimated cost of required adjustments based on a static complement. **Varies by health care program.

Projected Retirement Costs20
02/0
320
03/0
420
04/0
520
05/0
620
06/0
720
07/0
820
08/0
920
09/1
020
10/1
120
11/1
220
12/1
320
13/1
420
14/1
520
15/1
620
16/1
720
17/1
820
18/1
920
19/2
020
20/2
120
21/2
2
$0
$20,000,000
$40,000,000
$60,000,000
$80,000,000
$100,000,000
$120,000,000
$140,000,000
$160,000,000
ARP SERS PSERS
32%
27% SERS Rates as % of Salary
2013/14 15.1%2014/15 20.0%2017/18 31.6%

Personnel Complement
• 135 faculty and coaches participated in the Voluntary Retirement Incentive Program
• Some universities are in the process of developing workforce reduction plans that are not reflected above
• PASSHE has 544 fewer permanent employees today than in Fall 2008 192 fewer permanent faculty 352 fewer permanent nonfaculty
E&G FTE Employees 2012/13 2013/14 Change % 2014/15 Change %Faculty 5,362 5,301 (61) -1.1% 5,286 (15) -0.3%Nonfaculty 5,753 5,751 (2) -0.2% 5,754 5 0.1%Total 11,115 11,052 (63) -0.6% 11,040 (10) -0.1%

Expenditure estimates also include the net effect of realignment efforts, which include the following two components: • Reducing/eliminating under-utilized
programs and services• Expanding and/or creating relevant,
high-need programs Includes up-front, transitional,
nonrecurring costs
Restructuring and Realignment

2014/15 E&G BudgetRevenue/Sources FY 2013/14 % Change FY 2014/15 $ Change % ChangeTuition $839.1 0.6% $835.2 ($3.9) -0.5%Fees 180.7 0.6% 180.1 (0.6) -0.3%State Appropriation 412.8 0.0% 412.8 0.0 0.0%All Other Revenue 70.8 -4.2% 69.7 (1.1) -1.6%Use of Carryforward 59.1 557.7% 47.5 (11.6) -19.7%Total Revenue/Sources $1,562.4 3.5% $1,545.2 ($17.2) -1.1%
Expenditures and TransfersCompensation Summary:
Salaries & Wages $795.6 2.3% $822.7 $27.1 3.4%Benefits 353.2 11.6% 384.4 31.2 8.8%
Subtotal, Compensation $1,148.8 5.0% $1,207.1 $58.3 5.1%Noncompensation Summary:Utilities 34.1 3.5% 34.5 0.4 1.3%Services & Supplies 273.2 4.7% 278.4 5.2 1.9%Capital Expenditures & Transfers 106.4 -14.3% 93.8 (12.6) -11.8%
Subtotal, Noncompensation $413.6 -1.0% $406.7 ($6.9) -1.7%Total Expenditures and Transfers $1,562.4 3.3% $1,613.9 $51.5 3.3%
Revenue/Sources less Expenditures/Transfers $0.0 ($68.7)
Excluding One-Time Sources* ($56.0)

Tuition, Fees$1,015.2
Funding Requirement$68.7
*Includes other miscellaneous revenue, and use of carryforward.Note: Numbers may not add due to rounding.
$ in Millions
Appropriation$412.8
2014/15 E&G Budget $ in Millions
E&G Budget: $1,613.9
Other$117.2

Line Item History
Year Line Items Amount2011/12 All line items eliminated2010/11
and2009/10
Programs InitiativesDiversity and Equal OpportunityMcKeever Environment Learning CenterPA Ctr. For Environment Education
Total Line Items
$18.51.60.2
0.4$20.7
Note: Line Items were funded at similar levels in fiscal years 2000/01 – 2008/09.

Possible Line Item Proposal
Align academic program offerings to current and emerging high priority occupations across the Commonwealth that will provide employment opportunities for graduates to remain in Pennsylvania and contribute to the economic, social and cultural vitality of their region.

Possible Line Item ProposalBenefit
• Provide seed money for the expansion and development of programs that are critical to the economic vitality of the Commonwealth.
• Support flexible curriculum design utilizing various delivery methods to attract, retain and graduate traditional and nontraditional students in these key programs.
• Increase the availability of an educated work force that aligns with Commonwealth’s critical-need jobs.
• One-time funding commitment.

Board Action Items
Approval of University E&G Budgets• Page 19 of meeting materials
Approval of Appropriation Request• Page 43 of meeting materials

Need Request$0
$10
$20
$30
$40
$50
$60
$70
Expenditure Increase
$51.54% E&G
Appropriation$16.5
Assume Tuition Increase
Similar to CPI$27.3
Line Item*$18.0
One-Time Sources $12.7
Enrollment $4.5Nonrecurring
Recurring
*Line Item request to provide seed money for aligning academic program offerings with high priority occupations across the Commonwealth.
2014/15 Budget Request Strategy($ in Millions)

2014/15 Appropriation Request Proposal
Appropriation AmountE&G Appropriation $429.3
Increase of $16.5 million or 4.0%Line Item $18.0
High Priority Occupations
To submit a balanced budget, assume a tuition increase similar to the projected CPI.