


2014 Walk/Ride Day Challenge Sample Impact Report
22
Sample Workplace Logo 2014 Walk/Ride Day Corporate Challenge Impact Report Prepared For: Sample Workplace
-
Upload
tilly-pick -
Category
Government & Nonprofit
-
view
154 -
download
2
Transcript of 2014 Walk/Ride Day Challenge Sample Impact Report
Sample Workplace Logo
2014 Walk/Ride Day Corporate Challenge Impact Report Prepared For: Sample Workplace

Sample Workplace Logo 2
Thank you for participating in the 2014 Walk/Ride Day Corporate Challenge!
Every time one of your employees reconsiders their commuting option, it’s a win for your workplace, their health, the environment, and our greater community!

Sample Workplace Logo 3
Overview
2014 Walk/Ride Day
• Green Commuting
• Incremental Green & Health Impact
• Total Participation
Sample Workplace Corporate Challenge
• Participation
• Outcomes
• Comparisons
2015 Walk/Ride Day Planning Research
• Participants Survey
• Coordinator Survey
Appendix: Assumptions

Sample Workplace Logo 4
Why we are all in this.
“Walk/Ride Day promotes a new social norm”
“A neat way to promote alternative modes of travel”
“Show my children that there are other ways to get around”
“To represent that more people are doing things more sustainably”
“Create stats, which will lead to improved infrastructure”
“To be a part of the healthy transportation solution”
“To feel proud of myself for biking”
*Source: 2014 WRD Participant Survey, Q4/5 (reasons for checking in) and Q14 (making WRD more personally relevant)
Sample Workplace Logo 5
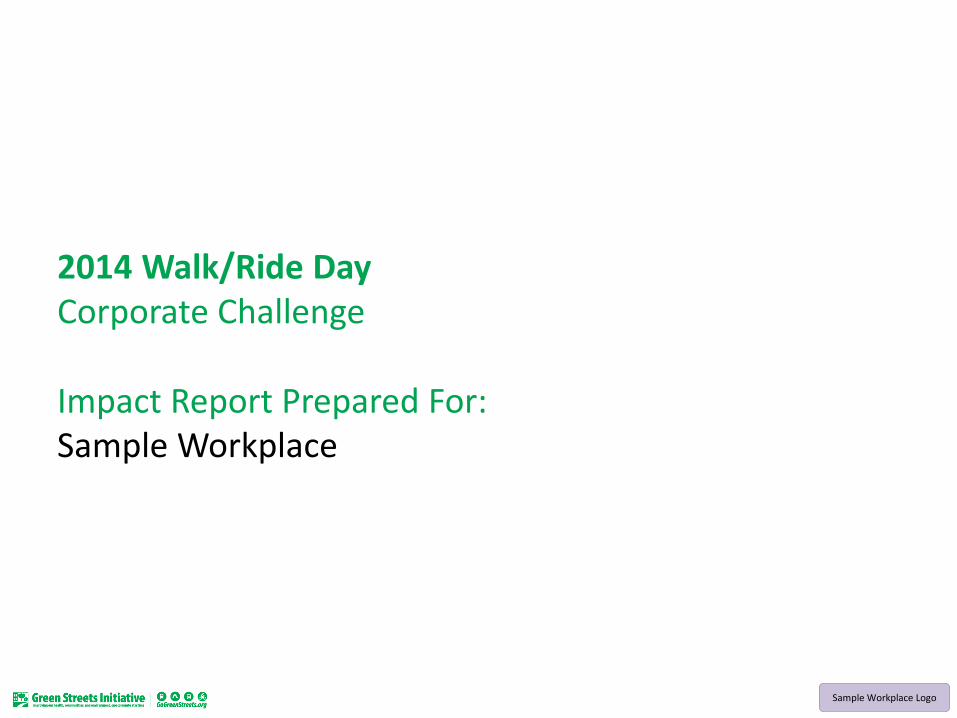
We are Walk/Ride Day participants across the region.
5
*Source: batchgeo.com
Sample Workplace Logo 6
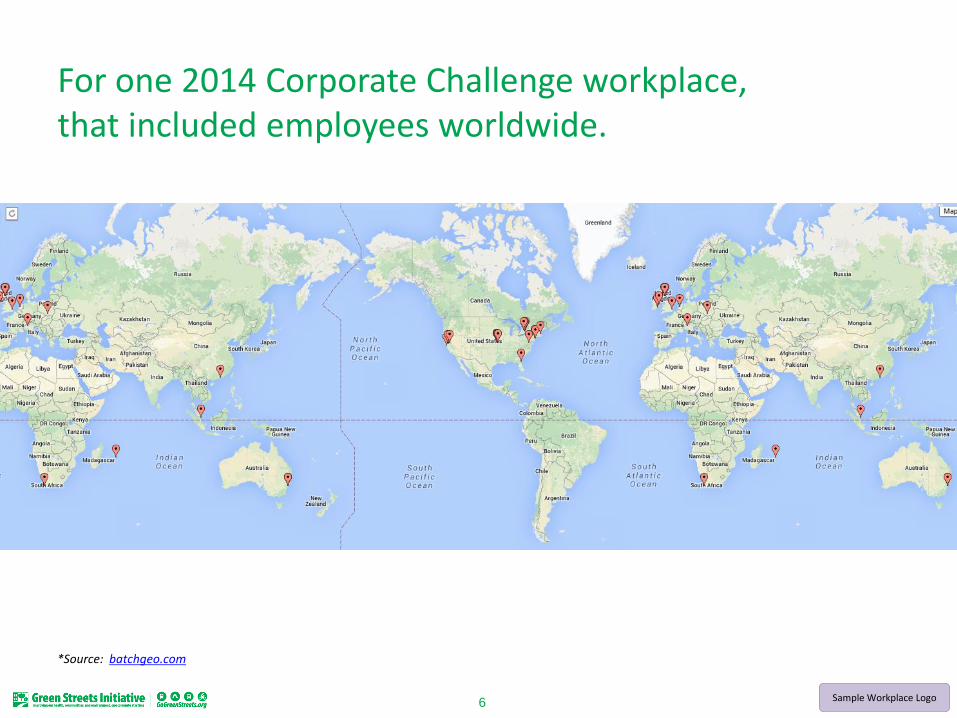
For one 2014 Corporate Challenge workplace, that included employees worldwide.
*Source: batchgeo.com

Sample Workplace Logo 7
Many “everyday” green commuters played a big part and helped raise awareness on Walk/Ride Days.
2014 Walk/Ride Day: Green Commuting
• Of 6,185 Walk/Ride Day participants in 2014, roughly 89% are regular green commuters (Yeah!)
• 280,535 kgs of CO2 were saved from our atmosphere on Walk/Ride Day by what most of you do on a regular basis
− Equivalent to: taking almost 60 cars off the road for one year
*See appendix for assumptions. Green commuters = check-ins using alternate vehicles, carpool, transit, telecommute, bike, walk, run, or other modes of transportation on normal days. CO2 equivalent via www.epa.gov/cleanenergy/energy-resources/calculator.html

Sample Workplace Logo 8
Walk/Ride Days are delivering incremental impact!
2014 Walk/Ride Day: Incremental Green & Health Impact
• 17,091 kgs CO2 reduction from changes on just 12 Walk/Ride Days
− Equivalent to: 3.6 cars off the road for a year
• 223,586 extra calories burned
− Equivalent to: 822 hours in the gym!
• Driven by behavior change*
− 2,143 Positive shifts
− 1,801 Greener shifts
− 1,250 Healthier shifts
*See appendix for analysis assumptions. Shifts are check-ins, not unique users. CO2 equivalents from http://www.epa.gov/cleanenergy/energy-resources/calculator.html#results; calorie equivalents: 272 calories / hour of gym from http://www.livestrong.com/article/548348-how-many-calories-are-burned-in-one-hour-of-mixed-exercise/
http://www.livestrong.com/article/548348-how-many-calories-are-burned-in-one-hour-of-mixed-exercise/
http://www.livestrong.com/article/548348-how-many-calories-are-burned-in-one-hour-of-mixed-exercise/
http://www.livestrong.com/article/548348-how-many-calories-are-burned-in-one-hour-of-mixed-exercise/
http://www.livestrong.com/article/548348-how-many-calories-are-burned-in-one-hour-of-mixed-exercise/
http://www.livestrong.com/article/548348-how-many-calories-are-burned-in-one-hour-of-mixed-exercise/
http://www.livestrong.com/article/548348-how-many-calories-are-burned-in-one-hour-of-mixed-exercise/
http://www.livestrong.com/article/548348-how-many-calories-are-burned-in-one-hour-of-mixed-exercise/
http://www.livestrong.com/article/548348-how-many-calories-are-burned-in-one-hour-of-mixed-exercise/
http://www.livestrong.com/article/548348-how-many-calories-are-burned-in-one-hour-of-mixed-exercise/
http://www.livestrong.com/article/548348-how-many-calories-are-burned-in-one-hour-of-mixed-exercise/
http://www.livestrong.com/article/548348-how-many-calories-are-burned-in-one-hour-of-mixed-exercise/
http://www.livestrong.com/article/548348-how-many-calories-are-burned-in-one-hour-of-mixed-exercise/
http://www.livestrong.com/article/548348-how-many-calories-are-burned-in-one-hour-of-mixed-exercise/
http://www.livestrong.com/article/548348-how-many-calories-are-burned-in-one-hour-of-mixed-exercise/
http://www.livestrong.com/article/548348-how-many-calories-are-burned-in-one-hour-of-mixed-exercise/
http://www.livestrong.com/article/548348-how-many-calories-are-burned-in-one-hour-of-mixed-exercise/
http://www.livestrong.com/article/548348-how-many-calories-are-burned-in-one-hour-of-mixed-exercise/
http://www.livestrong.com/article/548348-how-many-calories-are-burned-in-one-hour-of-mixed-exercise/
http://www.livestrong.com/article/548348-how-many-calories-are-burned-in-one-hour-of-mixed-exercise/
http://www.livestrong.com/article/548348-how-many-calories-are-burned-in-one-hour-of-mixed-exercise/
http://www.livestrong.com/article/548348-how-many-calories-are-burned-in-one-hour-of-mixed-exercise/
http://www.livestrong.com/article/548348-how-many-calories-are-burned-in-one-hour-of-mixed-exercise/

Sample Workplace Logo 9
You helped nearly double participation!
2014 Walk/Ride Day: Total Participation
• 12-month program
• 6,185 unique users (+178% versus 2013)
• 15,397 total check-ins (+190% versus 2013)
• Corporate Challenge – April to October
− 7 days, last Friday of every month
− 40 workplaces
− Accounts for 95% of all Walk/Ride Day check-ins
− Corporate Challenge participants checked-in to report their commutes 36% of the time
*Reported via online check-ins at www.gogreenstreets.org. Includes all WRD check-ins.

Sample Workplace Logo
2014 Walk/Ride Day Corporate Challenge Details Sample Workplace

Sample Workplace Logo 11
Thank you for being so dedicated to our cause!
Sample Workplace 2014 Walk/Ride Day: Participation
• X place by number of check-ins, among legal, financial, science, and energy companies
• Roughly 79% of participants are regular green commuters
• 4% employee participation in Walk/Ride Day
− Participants checked-in to report their commutes 29% of the times
• 550 participants
• 1,119 check-ins
*See appendix for assumptions. Reported via online check-ins at www.gogreenstreets.org.
Sample Workplace Logo 12
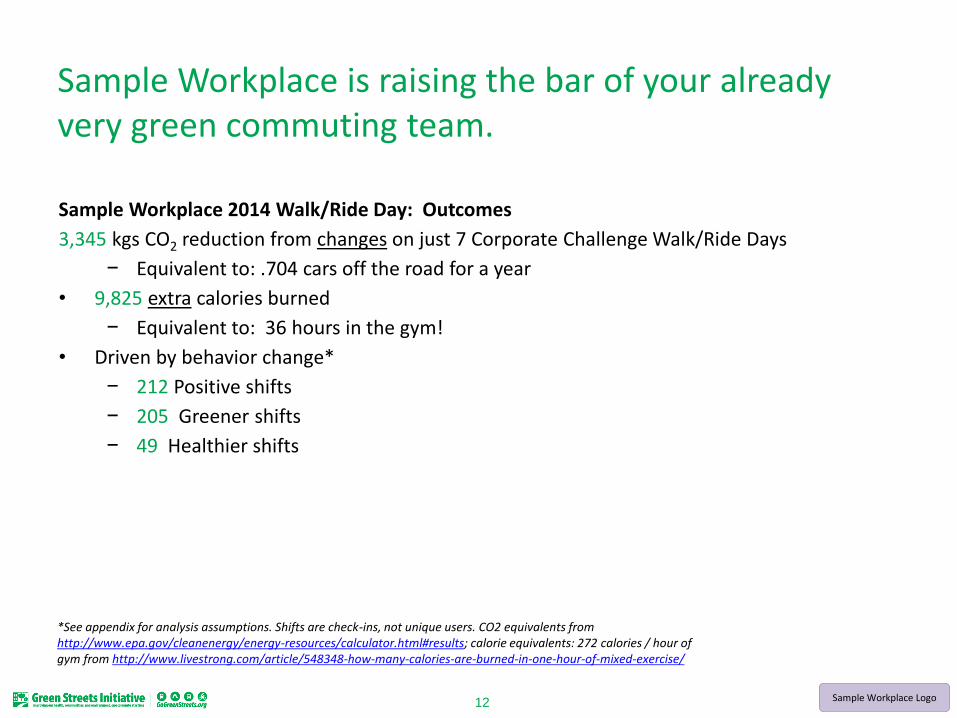
Sample Workplace is raising the bar of your already very green commuting team.
Sample Workplace 2014 Walk/Ride Day: Outcomes
3,345 kgs CO2 reduction from changes on just 7 Corporate Challenge Walk/Ride Days
− Equivalent to: .704 cars off the road for a year
• 9,825 extra calories burned
− Equivalent to: 36 hours in the gym!
• Driven by behavior change*
− 212 Positive shifts
− 205 Greener shifts
− 49 Healthier shifts
*See appendix for analysis assumptions. Shifts are check-ins, not unique users. CO2 equivalents from http://www.epa.gov/cleanenergy/energy-resources/calculator.html#results; calorie equivalents: 272 calories / hour of gym from http://www.livestrong.com/article/548348-how-many-calories-are-burned-in-one-hour-of-mixed-exercise/
http://www.livestrong.com/article/548348-how-many-calories-are-burned-in-one-hour-of-mixed-exercise/
http://www.livestrong.com/article/548348-how-many-calories-are-burned-in-one-hour-of-mixed-exercise/
http://www.livestrong.com/article/548348-how-many-calories-are-burned-in-one-hour-of-mixed-exercise/
http://www.livestrong.com/article/548348-how-many-calories-are-burned-in-one-hour-of-mixed-exercise/
http://www.livestrong.com/article/548348-how-many-calories-are-burned-in-one-hour-of-mixed-exercise/
http://www.livestrong.com/article/548348-how-many-calories-are-burned-in-one-hour-of-mixed-exercise/
http://www.livestrong.com/article/548348-how-many-calories-are-burned-in-one-hour-of-mixed-exercise/
http://www.livestrong.com/article/548348-how-many-calories-are-burned-in-one-hour-of-mixed-exercise/
http://www.livestrong.com/article/548348-how-many-calories-are-burned-in-one-hour-of-mixed-exercise/
http://www.livestrong.com/article/548348-how-many-calories-are-burned-in-one-hour-of-mixed-exercise/
http://www.livestrong.com/article/548348-how-many-calories-are-burned-in-one-hour-of-mixed-exercise/
http://www.livestrong.com/article/548348-how-many-calories-are-burned-in-one-hour-of-mixed-exercise/
http://www.livestrong.com/article/548348-how-many-calories-are-burned-in-one-hour-of-mixed-exercise/
http://www.livestrong.com/article/548348-how-many-calories-are-burned-in-one-hour-of-mixed-exercise/
http://www.livestrong.com/article/548348-how-many-calories-are-burned-in-one-hour-of-mixed-exercise/
http://www.livestrong.com/article/548348-how-many-calories-are-burned-in-one-hour-of-mixed-exercise/
http://www.livestrong.com/article/548348-how-many-calories-are-burned-in-one-hour-of-mixed-exercise/
http://www.livestrong.com/article/548348-how-many-calories-are-burned-in-one-hour-of-mixed-exercise/
http://www.livestrong.com/article/548348-how-many-calories-are-burned-in-one-hour-of-mixed-exercise/
http://www.livestrong.com/article/548348-how-many-calories-are-burned-in-one-hour-of-mixed-exercise/
http://www.livestrong.com/article/548348-how-many-calories-are-burned-in-one-hour-of-mixed-exercise/
http://www.livestrong.com/article/548348-how-many-calories-are-burned-in-one-hour-of-mixed-exercise/

Sample Workplace Logo 13
Here is how Sample Workplace compared to other Corporate Challenge participants.
Sample Workplace 2014 Walk/Ride Day: Comparisons (301+ Staff Size)
Sample Workplace
WRDCC Total
Sample Competitor 1
Sample Competitor 2
Sample Competitor 3
CO2 (kgs) saved by not driving to work on WRD
18,017 281,000 20,743 31,027 14,247
CO2 (kgs) reduction from changes on WRD
3,345 17,093 1,514 900 2,561
Improved health (cal) 9,825 242,071 7,148 24,483 18,563
Positive WRD shift 19% 14% 14% 13% 22%
Greener WRD shift 18% 12% 12% 11% 21%
Healthier WRD shift 4% 8% 5% 10% 9%
% of time participants checked-in their commute
29% 35% 38% 35% 36%
*See appendix for analysis assumptions.
Sample Workplace Logo 15
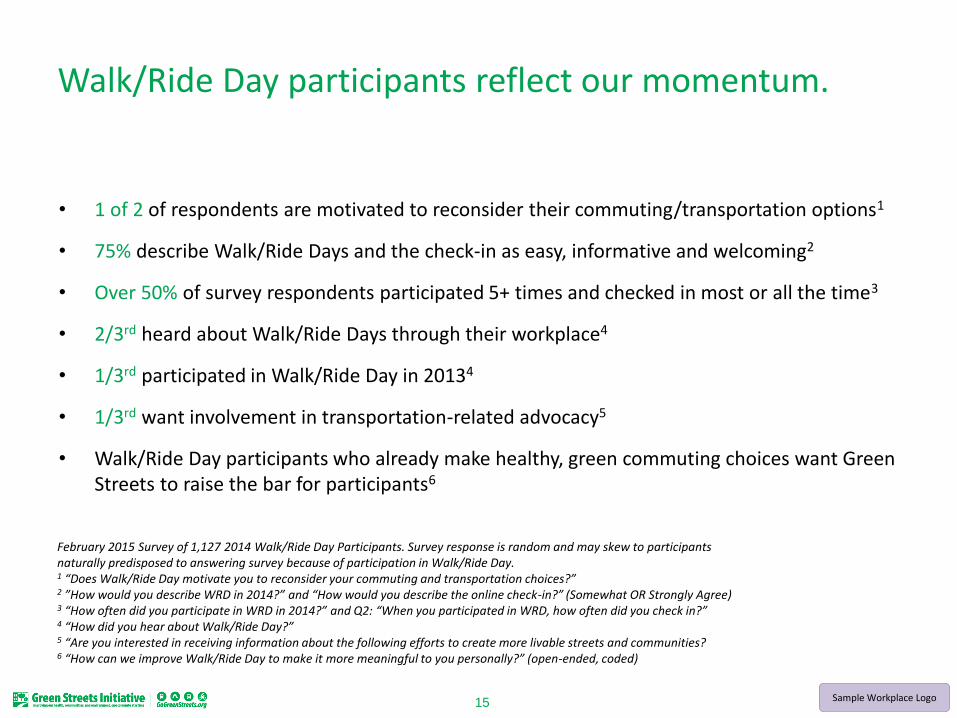
Walk/Ride Day participants reflect our momentum.
• 1 of 2 of respondents are motivated to reconsider their commuting/transportation options1
• 75% describe Walk/Ride Days and the check-in as easy, informative and welcoming2
• Over 50% of survey respondents participated 5+ times and checked in most or all the time3
• 2/3rd heard about Walk/Ride Days through their workplace4
• 1/3rd participated in Walk/Ride Day in 20134
• 1/3rd want involvement in transportation-related advocacy5
• Walk/Ride Day participants who already make healthy, green commuting choices want Green Streets to raise the bar for participants6
February 2015 Survey of 1,127 2014 Walk/Ride Day Participants. Survey response is random and may skew to participants naturally predisposed to answering survey because of participation in Walk/Ride Day. 1 “Does Walk/Ride Day motivate you to reconsider your commuting and transportation choices?” 2 ”How would you describe WRD in 2014?” and “How would you describe the online check-in?” (Somewhat OR Strongly Agree) 3 “How often did you participate in WRD in 2014?” and Q2: “When you participated in WRD, how often did you check in?” 4 “How did you hear about Walk/Ride Day?” 5 “Are you interested in receiving information about the following efforts to create more livable streets and communities? 6 “How can we improve Walk/Ride Day to make it more meaningful to you personally?” (open-ended, coded)

Sample Workplace Logo 16
Fall 2014 Survey of 32 Walk/Ride Day Corporate Challenge Coordinators 1 “Overall, how important are the following outcomes for your organization?” 2 “Why did your organization participate in the 2014 Walk/Ride Day Corporate Challenge?” 3 “How would you describe the role of competition in the 2014 Walk/Ride Day Corporate Challenge?” 4 “How would you describe the 2014 Walk/Ride Day check-in experience on our website?
Corp Challenge coordinator input is fortifying our work.
• For 56% of coordinators, “bringing attention to green, healthy commuting choices” is an important outcome for their organization. 22% are “Very Satisfied” and 53% “Somewhat Satisfied” that Walk/Ride Days helped achieve that outcome.1
• 47% are participating to “engage employees in sustainability activities”2
• PR and visibility is not an objective for most coordinators2
• For the majority of coordinators, the competition seems less important than Walk/Ride Day environmental and health outcomes3
• While the check-in experience is perceived as solid, feedback from coordinators suggests it could be more engaging and rewarding4
Sample Workplace Logo 17
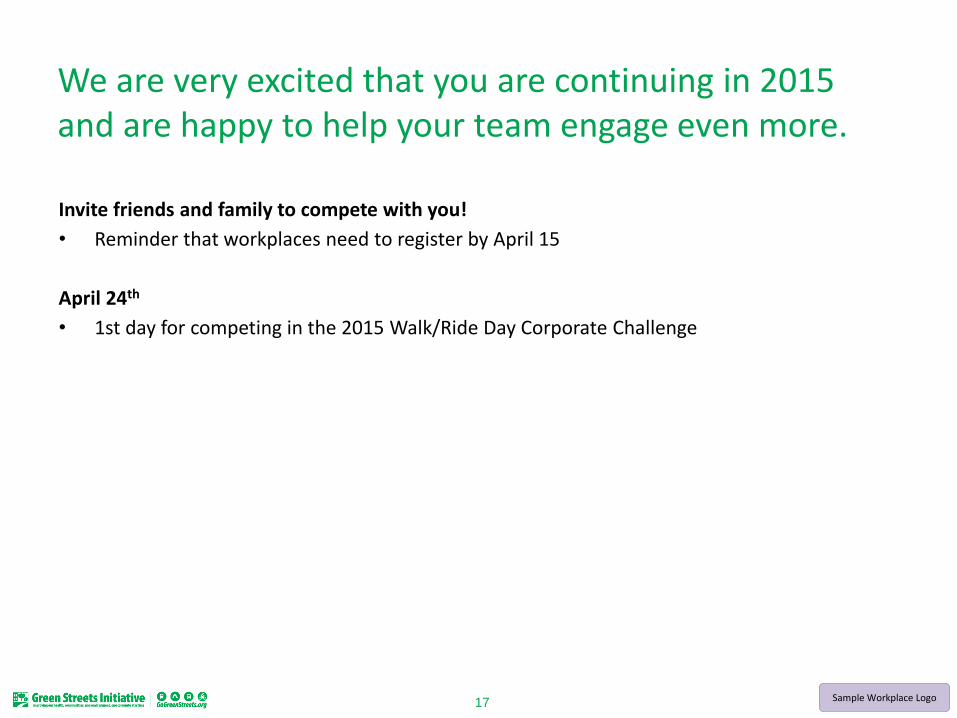
We are very excited that you are continuing in 2015 and are happy to help your team engage even more.
Invite friends and family to compete with you!
• Reminder that workplaces need to register by April 15
April 24th
• 1st day for competing in the 2015 Walk/Ride Day Corporate Challenge
Sample Workplace Logo 20
Assumptions: General
Reporting 2014 Walk/Ride Day outcomes as well as establishing analysis rules and processes for 2015 Walk/Ride Day, primarily in support of the Corporate Challenge, represent an upgrade in Green Streets’ methodology to document progress towards its mission.
More specifically, Green Streets is leveraging improved check-in functionality introduced in 2014 to accommodate varied commuting experiences/modes to support Walk/Ride Day growth plans and to make results data more actionable for Corporate Challenge coordinators.
*Analysis as of March 6, 2015, subject to potential updates from further data-mining by Green Streets’ team and/or per input from WRDCC participants

Sample Workplace Logo 21
Assumptions: Data Inputs
Mode: Mission Metric Definition Sources
Driving: Lower CO2 and Healthier
14.3 kg CO2 per gallon www.carbonindependence.org (all-in...includes CO2 footprint from manufacturing, roads, repairs)
0.53 average vehicle speed in miles per minute www.ridetowork.org
27.3 average vehicle fuel economy mpg national highway traffic safety administration
50.0 average alternative vehicle fuel economy highway fuel economy of a prius
0.15 kg CO2 per transit passenger mile average calculated from commuter rail, subway trains and bus travel via http://www.carbonfund.org/how-we-calculate sourced from EPA
Transit: Lower CO2 and Healthier
0.36 average transit miles per minute average of Commuter Rail, Heavy Rail (Subway / "T") and Bus average miles-per-hour, from 2013 Public Transportation Factbook http://www.apta.com/resources/statistics/Documents/FactBook/2013-APTA-Fact-Book.pdf
0.054 kg of CO2 per minute since, on average, transit releases .15kgs of CO2 per passenger mile, and transit travels at .36 miles per minute, transit releases .15kgs x .36 = .054 kg of CO2 per minute. See above sources.
Bike/Walk/Run: Celebrate Existing Behavior
2.8 calories burned in one minute of walking www.everydayhealth.com
4.5 calories burned in one minute of biking www.everydayhealth.com (mid-point of published ranges)
9.2 calories burned in one minute of running www.everydayhealth.com
0.05 average walking speed in miles per minute 3.1 mph per wikipedia.org and its sources http://en.wikipedia.org/wiki/Preferred_walking_speed
0.16 average bicycling speed in miles per minute 9.6 mph in Copenhagen and 11-12mph via livestrong.com http://en.wikipedia.org/wiki/Bicycle_performance) and http://www.livestrong.com/article/413599-the-average-bike-riding-speed/
*Analysis as of March 6, 2015, subject to potential updates from further data-mining by Green Streets’ team and/or per input from WRDCC participants

Sample Workplace Logo 22
Assumptions: Green/Healthy/Positive Shift Calculation
Greener Shift = Any checked-in commute, with any number of legs and variety of modes of transportation that, in total, produces less CO2 on Walk/Ride Day vs. Normal Day
Healthy Shift = Any checked-in commute, with any number of legs and variety of modes of transportation that, in total, produces more calories burned on Walk/Ride Day vs. Normal Day
Positive Shift = Any checked-in commute for which any or both of the above are true
*Analysis as of March 6, 2015, subject to potential updates from further data-mining by Green Streets’ team and/or per input from WRDCC participants