
2014 Software Global Client Conference -...
53
2014 Software Global Client Conference
Transcript of 2014 Software Global Client Conference -...

2014 Software Global Client Conference

Energy Performance
Solutions for Plants.
Solutions for each step in
your journey.
WW INFO-03
Michael Munro
Strategic Marketing - Power Software
and Systems
Christian-Marc Pouyez
Product Manager – Intelligence & CEM

2014 Software Global Client Conference
The Schneider Electric approach to Energy Management
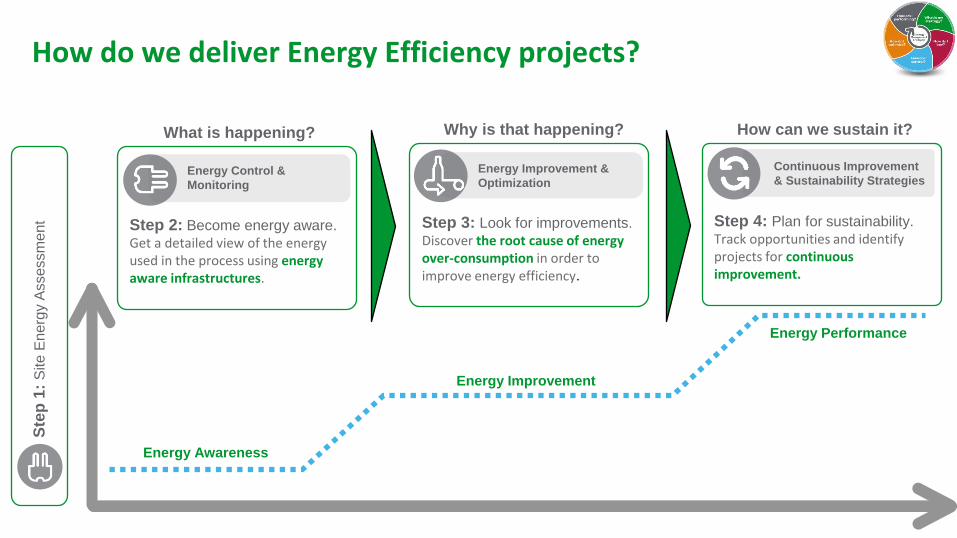
How do we deliver Energy Efficiency projects?
Step 3: Look for improvements.
Discover the root cause of energy over-consumption in order to improve energy efficiency.
Energy Improvement &
Optimization
Step 4: Plan for sustainability.
Track opportunities and identify projects for continuous improvement.
Ste
p 1
: S
ite E
nerg
y A
ssessm
ent
Continuous Improvement
& Sustainability Strategies
Energy Awareness
Energy Improvement
Energy Performance
Step 2: Become energy aware.
Get a detailed view of the energy used in the process using energy aware infrastructures.
Energy Control &
Monitoring
What is happening? Why is that happening? How can we sustain it?
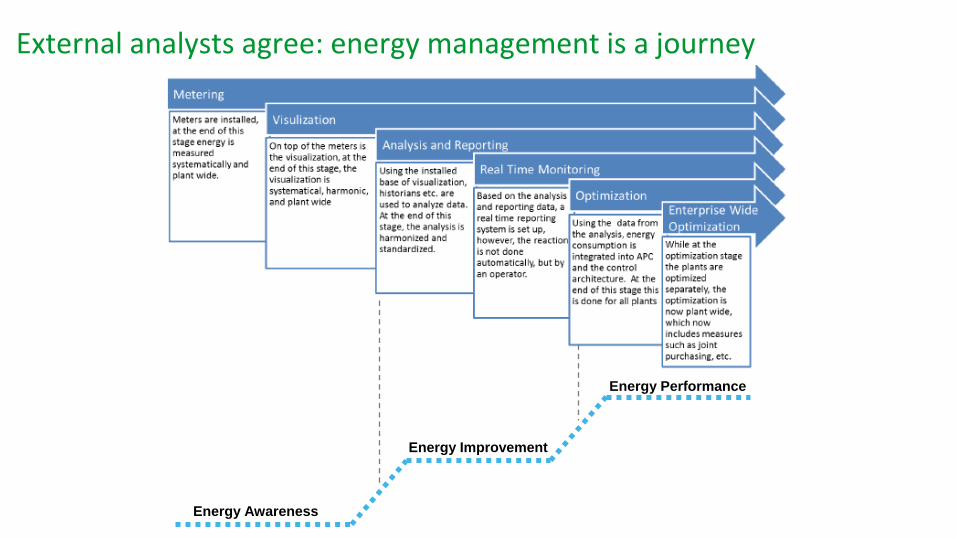
External analysts agree: energy management is a journey
Energy Awareness
Energy Improvement
Energy Performance

2014 Software Global Client Conference
Scenario 1: Energy Awareness
2014 Software Global Client Conference
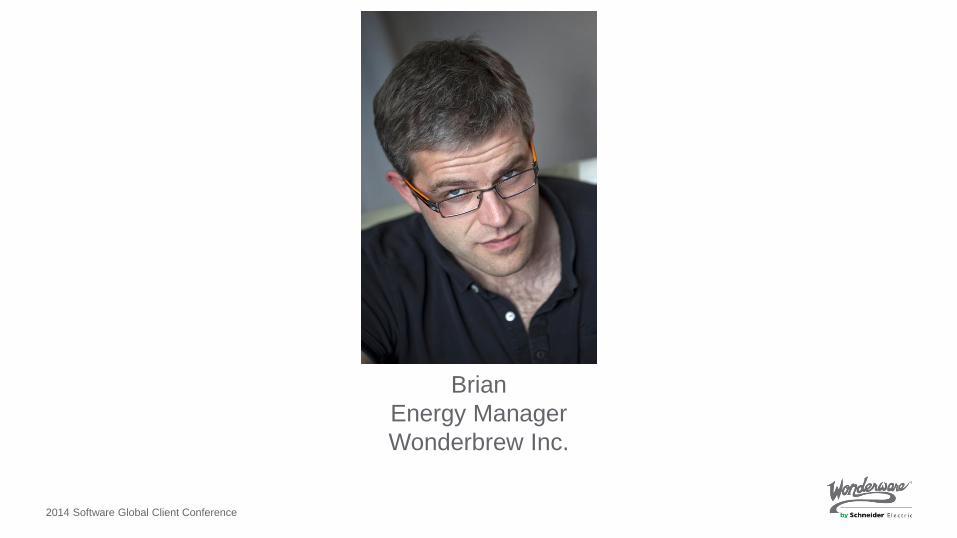
Brian
Energy Manager
Wonderbrew Inc.

2014 Software Global Client Conference
Current Situation:
• Already completed some
efficiency projects – where next?
• Energy data scattered, multiple
tools, incomplete picture
• Manual reporting – time
consuming
Objectives:
• Better visibility with standardized
tools across all utilities
• Save time reporting to corporate
• Baseline current energy usage
• Satisfy a limited audience:
engineering & management
Corporate Goal
Reduce energy consumption by 10% in a year
2014 Software Global Client Conference 9
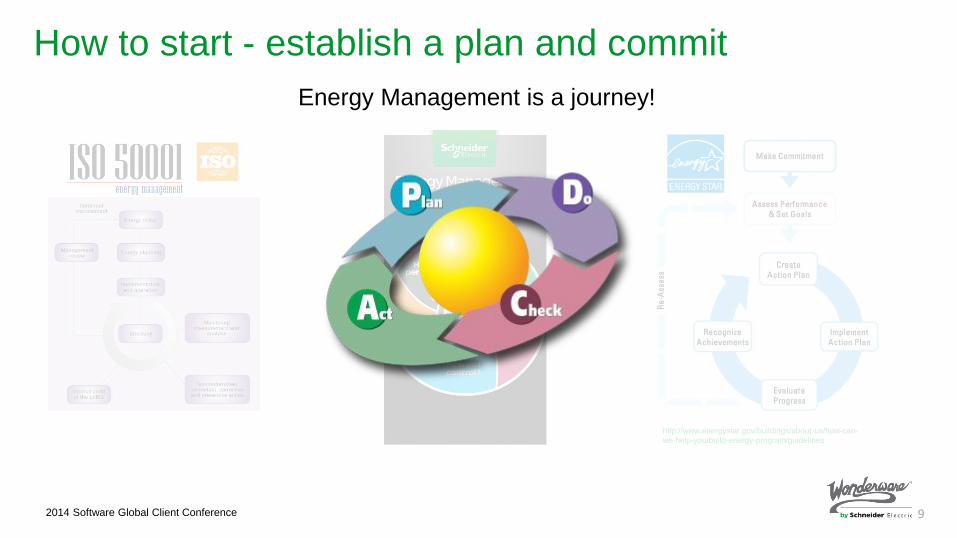
How to start - establish a plan and commit
http://www.energystar.gov/buildings/about-us/how-can-
we-help-you/build-energy-program/guidelines
Energy Management is a journey!

2014 Software Global Client Conference
Site Energy Assessment
●Baseline energy use and cost history from utility
bills
● Identify and prioritize the energy types
(WAGES)
● Identify key areas of high energy consumption
● Understand your energy flows in relation to
industrial processes
● Survey existing metering available and identify
requirements for additional metering
● Identify key stakeholders
2014 Software Global Client Conference
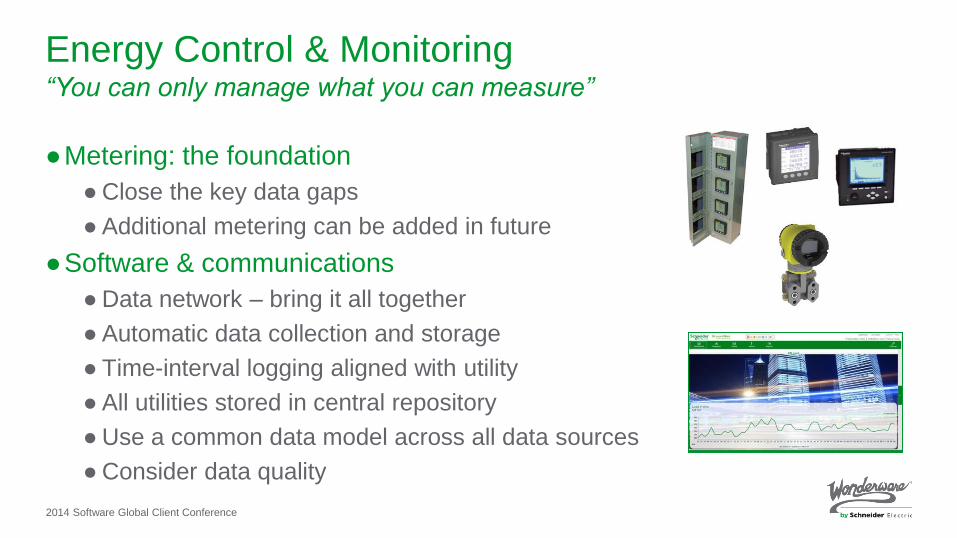
●Metering: the foundation
● Close the key data gaps
● Additional metering can be added in future
●Software & communications
● Data network – bring it all together
● Automatic data collection and storage
● Time-interval logging aligned with utility
● All utilities stored in central repository
● Use a common data model across all data sources
● Consider data quality
Energy Control & Monitoring “You can only manage what you can measure”

2014 Software Global Client Conference
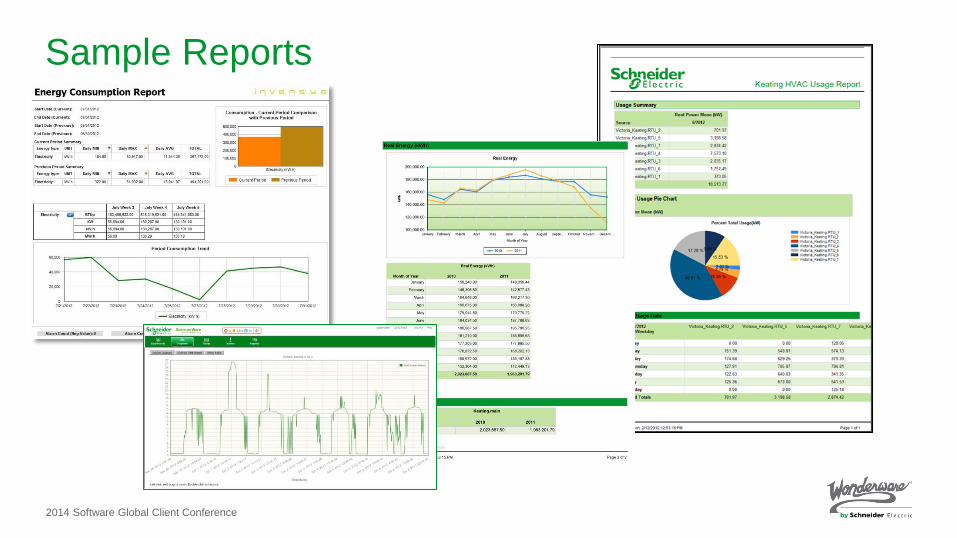
●Use, understand, and share the data
● Begin to see patterns and trends
● Sometimes unexpected…energy use is often hidden
●Basic reporting:
● Energy consumption trends – when am I using energy?
● Energy consumption by hierarchy – where am I using energy?
● Energy comparisons – by process, equipment, time
● Custom reports
Energy Control & Monitoring Reporting and visualization

2014 Software Global Client Conference
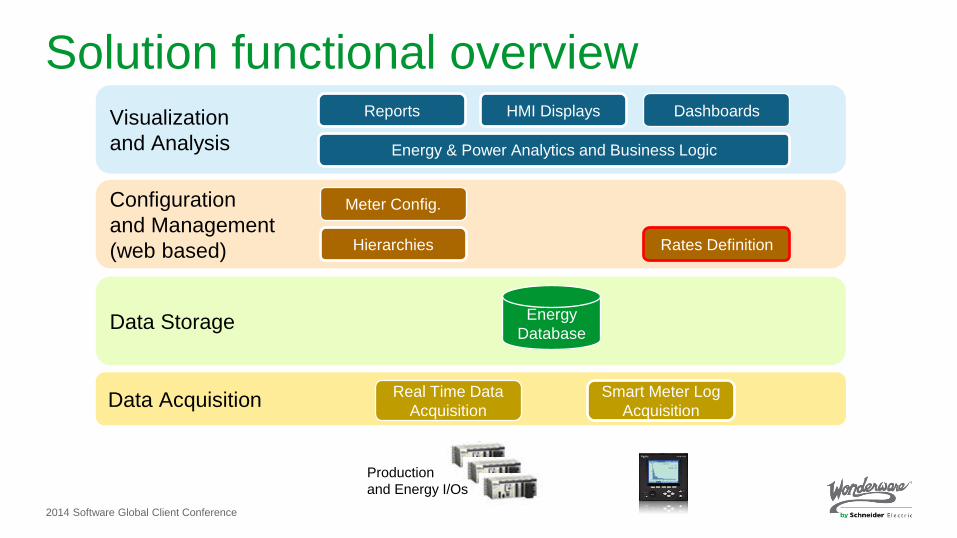
Solution functional overview
Production
and Energy I/Os
Visualization
and Analysis
Reports
Configuration
and Management
Meter Config.
Hierarchies
Data Storage
Data Acquisition
Energy
Database
Direct Meter
Acquisition
Real Time Data
Acquisition
2014 Software Global Client Conference
Sample Reports

2014 Software Global Client Conference
Benefits:
Key areas of the plant are measured
for energy consumption
Easy access to data with automated
reporting from a central location
Ability to justify and prioritize specific
energy conservation measures
Objectives:
Better visibility with standardized tools
across utilities
Limited audience: engineering &
management
Provide reports to corporate
Baseline current energy usage
Solution benefits

2014 Software Global Client Conference
Case Study
European consumer goods
manufacturing plant
Situation:
• Corporate mandate to reduce energy use in
the plant
• Multiple systems
• Many existing meters not being read
Solution:
• 81 Schneider Electric power meters
• Schneider Electric PLCs to record energy
pulses from water, gas, electrical meters
• Power Monitoring Expert software to collect
and visualize data
Results:
• Centralized tool to collect and manage all energy data
• Ability to support and justify energy efficiency projects
• Ability to allocate the energy costs to production

2014 Software Global Client Conference
Scenario 2: Energy Intensity
2014 Software Global Client Conference
Brian
Energy Manager
Wonderbrew Inc.

2014 Software Global Client Conference
Current Situation:
• Metering and reporting are active
• Single Tool
• Lots of data, spending lots of time to
understand data
• Good days, bad days, not able to
explain why
Objectives:
• Understand what is driving the
energy consumption
• Identify opportunities for systematic
improvements
• Define realistic targets per process
area
• Raising awareness in the facility:
broader audience
Corporate Goal
Reduce energy intensity by 10% in a year
2014 Software Global Client Conference
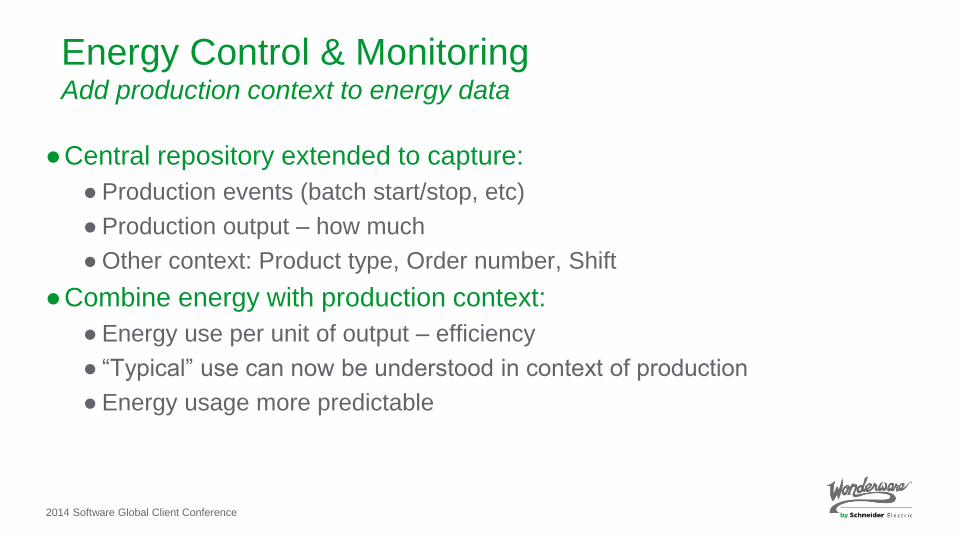
●Central repository extended to capture:
● Production events (batch start/stop, etc)
● Production output – how much
● Other context: Product type, Order number, Shift
●Combine energy with production context:
● Energy use per unit of output – efficiency
● “Typical” use can now be understood in context of production
● Energy usage more predictable
Energy Control & Monitoring Add production context to energy data

2014 Software Global Client Conference
● Identify the main drivers for energy consumption
● Production volume, production type, weather influences, etc
●Using historical data, define targets for key areas
● Targets can be at process level or down to specific metering points
●Provide visibility of actuals and targets to the right people (actionable)
● Real-time dashboards
● Daily reports
Energy Control & Monitoring Set baselines and targets

2014 Software Global Client Conference
Solution functional overview
Production
and Energy I/Os
Visualization
and Analysis
Reports HMI Displays Dashboards
Configuration
and Management
(web based)
Meter Config.
Hierarchies
Targets Definition
Data Storage
Data Acquisition
Energy
Database
Direct Meter
Acquisition
Real Time Data
Acquisition
2014 Software Global Client Conference
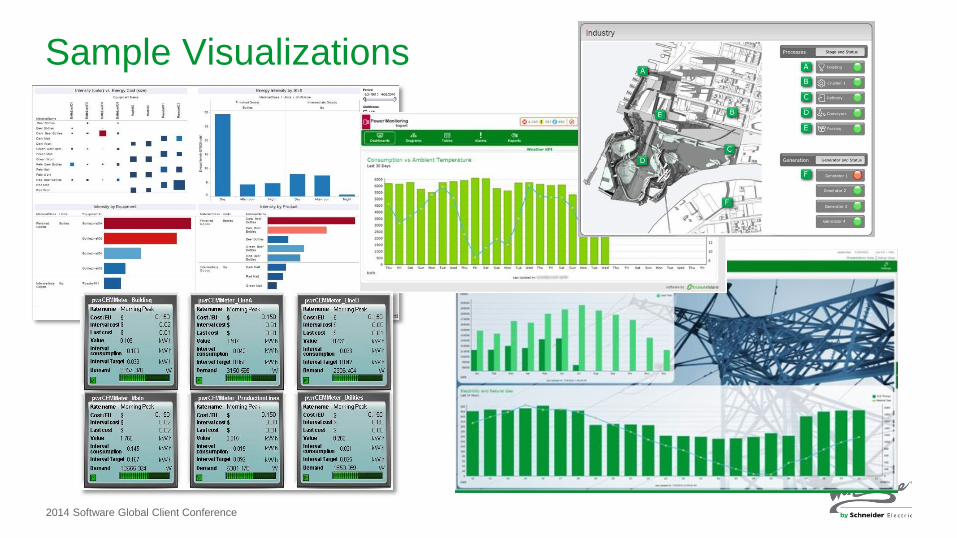
Sample Visualizations
2014 Software Global Client Conference
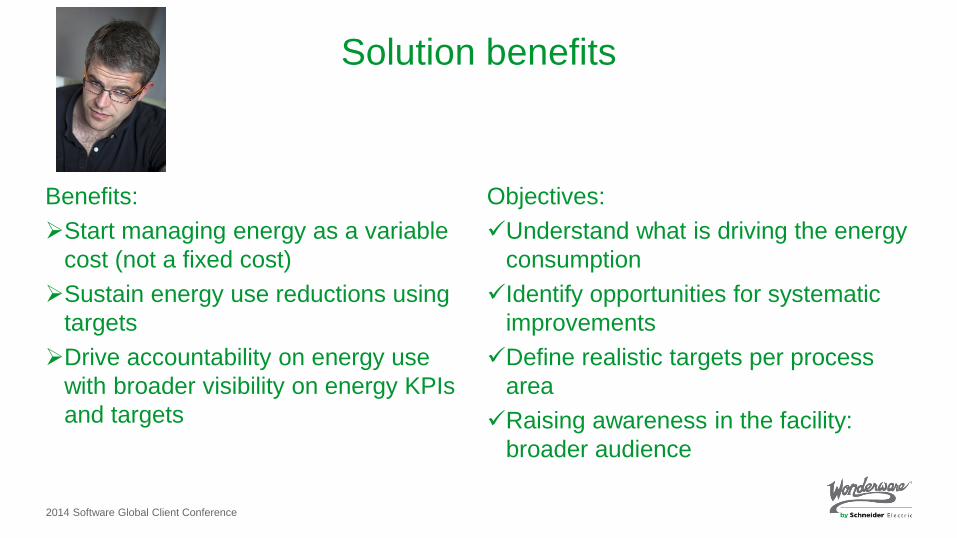
Benefits:
Start managing energy as a variable
cost (not a fixed cost)
Sustain energy use reductions using
targets
Drive accountability on energy use
with broader visibility on energy KPIs
and targets
Solution benefits
Objectives:
Understand what is driving the energy
consumption
Identify opportunities for systematic
improvements
Define realistic targets per process
area
Raising awareness in the facility:
broader audience

2014 Software Global Client Conference
Case Study Coca-Cola
Swaziland
Conco Ltd
Situation:
• Goal to reduce energy consumption by 20%
in one year
• Emphasis on reducing consumption
holistically (no accountability)
• Energy users not empowered enough to take
control of situations
Solution:
• Wonderware System Platform with CEM and
SmartGlance
• Monitoring of Water, Air, Electricity and
Steam.
• Implementation of smarter energy usage/cost
control protocols
Results:
• Improved visibility into energy usage and cost by area of the plant,
• Ability to control high-energy operations to take place during low-cost periods
• Personnel awareness of their immediate impact on energy cost
Above all resulted in reduction of energy consumption

2014 Software Global Client Conference
Scenario 3: Power Quality

2014 Software Global Client Conference
Cathy
Facility Maintenance Engineer
Wonderbrew Inc.
2014 Software Global Client Conference
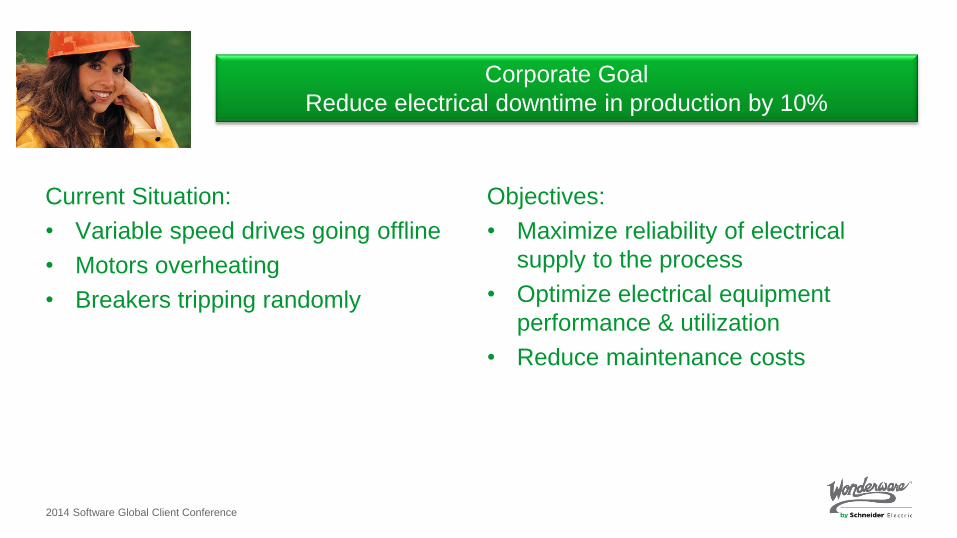
Current Situation:
• Variable speed drives going offline
• Motors overheating
• Breakers tripping randomly
Objectives:
• Maximize reliability of electrical
supply to the process
• Optimize electrical equipment
performance & utilization
• Reduce maintenance costs
Corporate Goal
Reduce electrical downtime in production by 10%

2014 Software Global Client Conference
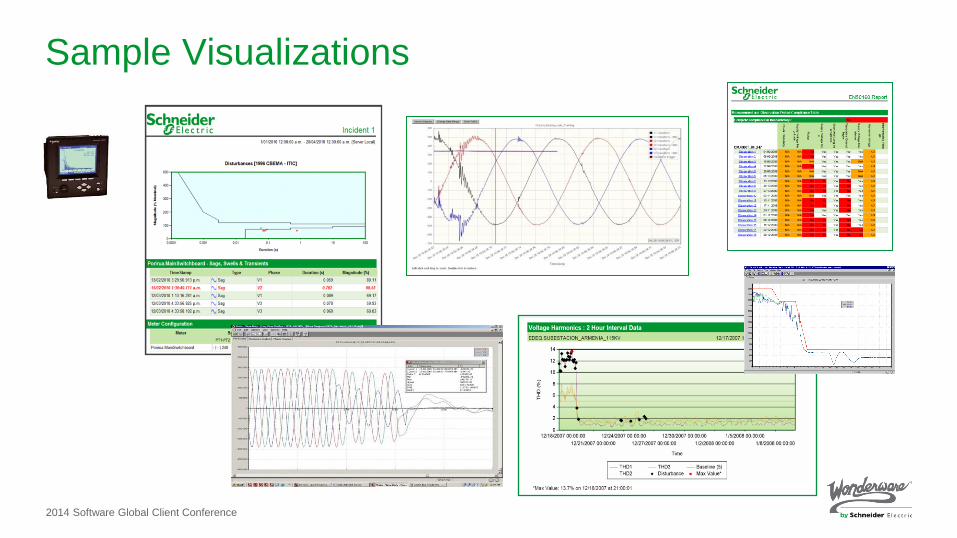
● Install power quality metering at main and critical loads
● Advanced meters capture harmonics, voltage dips, surges
● Blink of an eye: tenths of a second
● Magnitude, duration, signature are all important
●Analyze root cause
● Harmonic loads, internal vs external
● Implement mitigation solutions
● Power conditioning equipment, utility remedies
● Continuous monitoring to track over time
Energy Improvement & Optimization Improve Power Quality

2014 Software Global Client Conference
Solution functional overview Visualization
and Analysis
Reports Dashboards
Energy & Power Analytics and Business Logic
Configuration
and Management
(web based)
Meter Config.
Hierarchies
Data Storage
Data Acquisition
Energy
Database
Smart Meter Log
Acquisition
2014 Software Global Client Conference
Sample Visualizations
2014 Software Global Client Conference
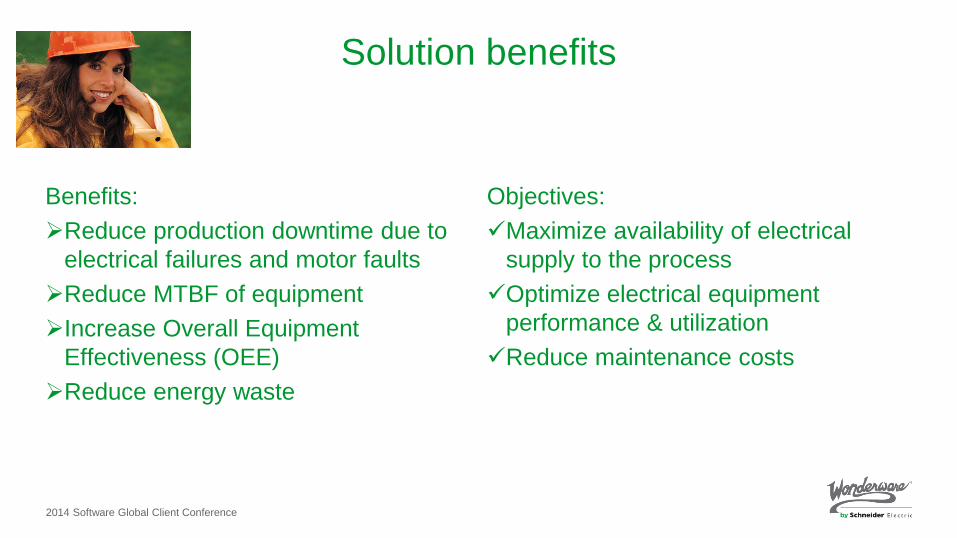
Benefits:
Reduce production downtime due to
electrical failures and motor faults
Reduce MTBF of equipment
Increase Overall Equipment
Effectiveness (OEE)
Reduce energy waste
Solution benefits
Objectives:
Maximize availability of electrical
supply to the process
Optimize electrical equipment
performance & utilization
Reduce maintenance costs
2014 Software Global Client Conference
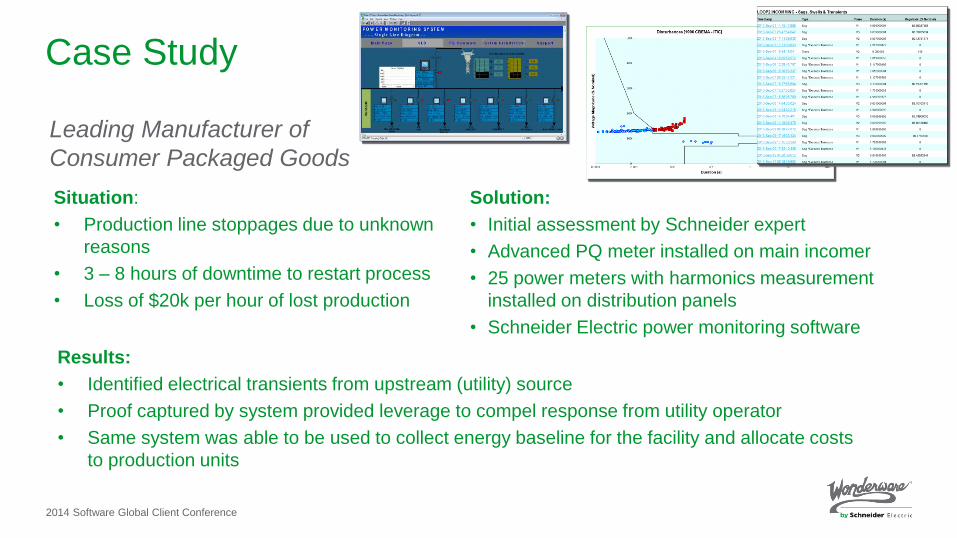
Case Study
Leading Manufacturer of
Consumer Packaged Goods
Situation:
• Production line stoppages due to unknown
reasons
• 3 – 8 hours of downtime to restart process
• Loss of $20k per hour of lost production
Solution:
• Initial assessment by Schneider expert
• Advanced PQ meter installed on main incomer
• 25 power meters with harmonics measurement
installed on distribution panels
• Schneider Electric power monitoring software
Results:
• Identified electrical transients from upstream (utility) source
• Proof captured by system provided leverage to compel response from utility operator
• Same system was able to be used to collect energy baseline for the facility and allocate costs
to production units

2014 Software Global Client Conference
Scenario 4: Energy Cost

2014 Software Global Client Conference
Robert
Facility Manager
Wonderbrew Inc.

2014 Software Global Client Conference
Current Situation:
• Monthly utility bill, paid by
accounting, fixed cost
• Not full understanding of what is
driving utility cost beyond
consumption
Objectives:
• Better understanding of utility bill
(electricity)
• Reduce penalties
• Allocate costs to departments to
drive accountability
Corporate Goal
Reduce plant electrical bill by 10% this year
2014 Software Global Client Conference
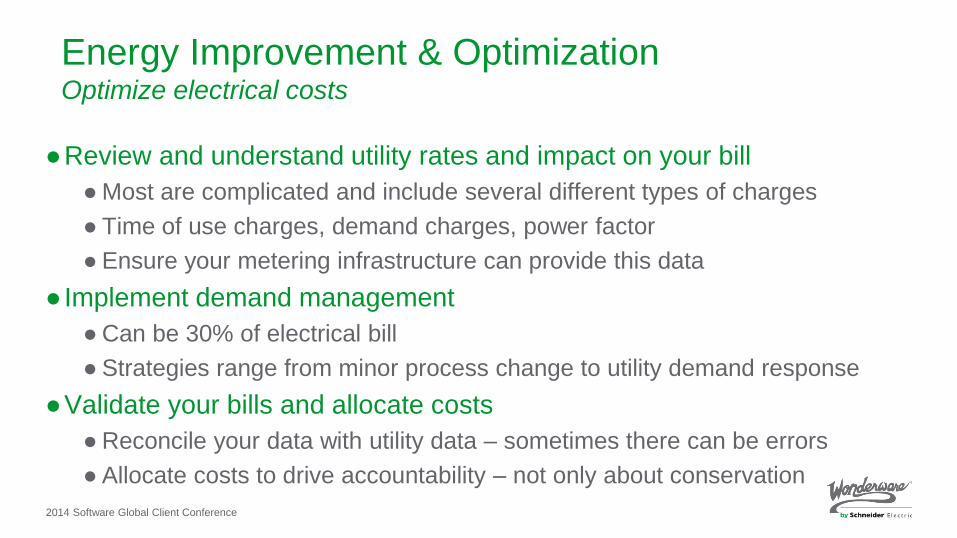
●Review and understand utility rates and impact on your bill
● Most are complicated and include several different types of charges
● Time of use charges, demand charges, power factor
● Ensure your metering infrastructure can provide this data
● Implement demand management
● Can be 30% of electrical bill
● Strategies range from minor process change to utility demand response
●Validate your bills and allocate costs
● Reconcile your data with utility data – sometimes there can be errors
● Allocate costs to drive accountability – not only about conservation
Energy Improvement & Optimization Optimize electrical costs
2014 Software Global Client Conference
Solution functional overview
Production
and Energy I/Os
Visualization
and Analysis
Reports HMI Displays Dashboards
Configuration
and Management
(web based)
Meter Config.
Hierarchies Rates Definition
Data Storage
Data Acquisition
Energy
Database
Smart Meter Log
Acquisition
Real Time Data
Acquisition
Energy & Power Analytics and Business Logic

2014 Software Global Client Conference
Sample Visualizations
2014 Software Global Client Conference
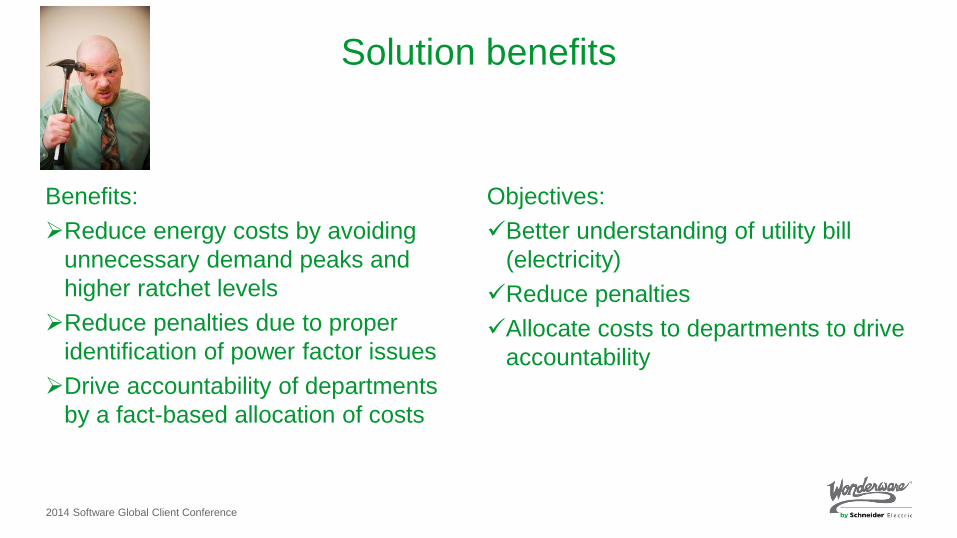
Benefits:
Reduce energy costs by avoiding
unnecessary demand peaks and
higher ratchet levels
Reduce penalties due to proper
identification of power factor issues
Drive accountability of departments
by a fact-based allocation of costs
Solution benefits
Objectives:
Better understanding of utility bill
(electricity)
Reduce penalties
Allocate costs to departments to drive
accountability
2014 Software Global Client Conference
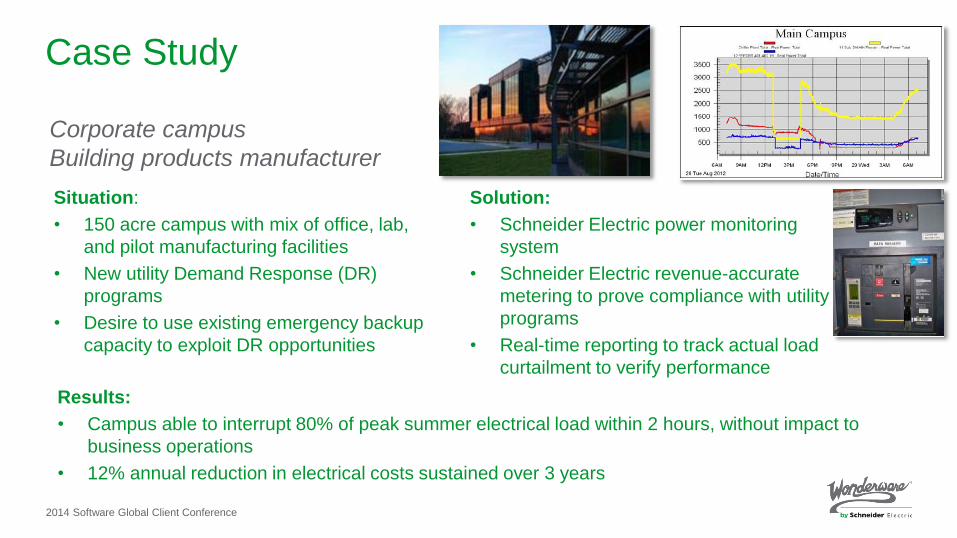
Case Study
Corporate campus
Building products manufacturer
Situation:
• 150 acre campus with mix of office, lab,
and pilot manufacturing facilities
• New utility Demand Response (DR)
programs
• Desire to use existing emergency backup
capacity to exploit DR opportunities
Solution:
• Schneider Electric power monitoring
system
• Schneider Electric revenue-accurate
metering to prove compliance with utility
programs
• Real-time reporting to track actual load
curtailment to verify performance
Results:
• Campus able to interrupt 80% of peak summer electrical load within 2 hours, without impact to
business operations
• 12% annual reduction in electrical costs sustained over 3 years

2014 Software Global Client Conference
Energy Performance is a journey!

Corporate
Meet standards, goals, compliance
Regional Management
Integration of energy and sustainability information for decision making
Individual Plants Monitor KPIs, Optimize Energy Usage
Enterprises need to consider top to bottom….
Plant-level
Energy Efficiency
Enterprise Level
Digital Energy Services Platform

Corporate
Meet standards, goals, compliance
Regional Management
Integration of energy and sustainability information for decision making
Individual Plants Monitor KPIs, Optimize Energy Usage
Plants need an individual journey with a standardized
approach
Plant-level
Energy Efficiency
2014 Software Global Client Conference
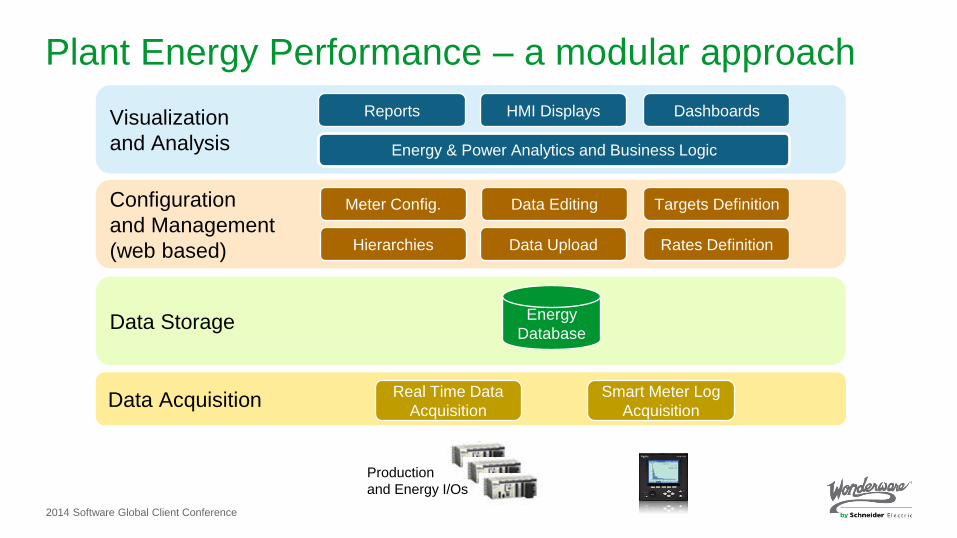
Plant Energy Performance – a modular approach
Production
and Energy I/Os
Visualization
and Analysis
Reports HMI Displays Dashboards
Configuration
and Management
(web based)
Meter Config.
Hierarchies Rates Definition
Targets Definition Data Editing
Data Upload
Data Storage
Data Acquisition
Energy
Database
Smart Meter Log
Acquisition
Real Time Data
Acquisition
Energy & Power Analytics and Business Logic

Goals: • Optimize
Consumption
• Maximize availability
& utilization of energy.
Collaborative architecture bridging silos to yield
optimized plants & processes.
Goals: • Optimize Production
• Maximize availability
& utilization of assets.
We are building on our shared experiences in energy
management
Devices & I/Os
Energy Monitoring
Process Control
Energy Control
Process SCADA
Energy SCADA
Process MES
Energy Analytics
Plant Energy Performance: Reduced energy consumption per unit of production and improved plant efficiency
Broad portfolio of energy management products and solutions, with deep energy
management expertise
Energy Control & Monitoring
Process Control & Automation

2014 Software Global Client Conference
Next Steps for Plant Energy Performance
●Research phase – customer value and technical feasibility
●Voice of Customer – your chance to influence the product roadmap
●Validation – beta customers to pilot the solution – could it be you??

2014 Software Global Client Conference
An update on Wonderware CEM

2014 Software Global Client Conference
CEM 2014 R2 To be released in Fall 2014
• Full support of Application Server Redundancy
• New Demand Attribute in Meter object
• Easier installation and configuration
• Documentation improvements and addition of offline documentation
• The most robust version ever!
• Technology Update:
•System Platform 2014 and possibly 2014 R2
•Windows and SQL Server support, in line with System Platform 2014 R2

2014 Software Global Client Conference
To learn more…

Corporate
Meet standards, goals, compliance
Regional Management
Integration of energy and sustainability information for decision making
Individual Plants Monitor KPIs, Optimize Energy Usage
Enterprises need to consider top to bottom….
Plant-level
Energy Efficiency
Enterprise Level
Digital Energy Services Platform For more information…
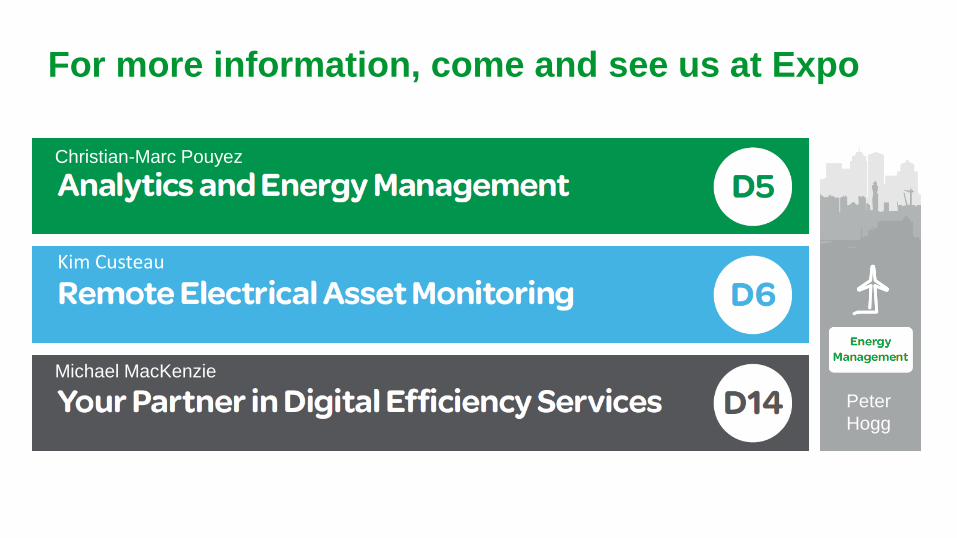
For more information, come and see us at Expo
Christian-Marc Pouyez
Michael MacKenzie
Peter
Hogg
Kim Custeau

©2014 Schneider Electric. All Rights Reserved.
All trademarks are owned by Schneider Electric Industries SAS or its affiliated companies or their respective owners.