Consumer attitudes and intentions toward personalization of fair trade apparel
1
©2014 Blue Research® all rights reserved.Confidential to Janrain
Value of Social LoginUS Consumer Perceptions
Prepared for
by Maggie Foree and Paul Abel, PhD.
for questions, contact [email protected]
www.blue-research.com
1 29 14
2
©2014 Blue Research® all rights reserved.Confidential to Janrain
Mistargeting Is Common
and Drives Disengagement

3
©2014 Blue Research® all rights reserved.Confidential to Janrain
Relying on Online Registration
Data Can Lead to Mistargeting
Q4. If creating a new account at a website becomes tedious then people tend to not enter all of the information requested (leave some information blank) or
intentionally enter incorrect information (sometimes to avoid being targeted for marketing programs). n=594
Of consumers admit to
intentionally providing
misinformation when creating
a new account or registering
for the first time.
75%
4
©2014 Blue Research® all rights reserved.Confidential to Janrain
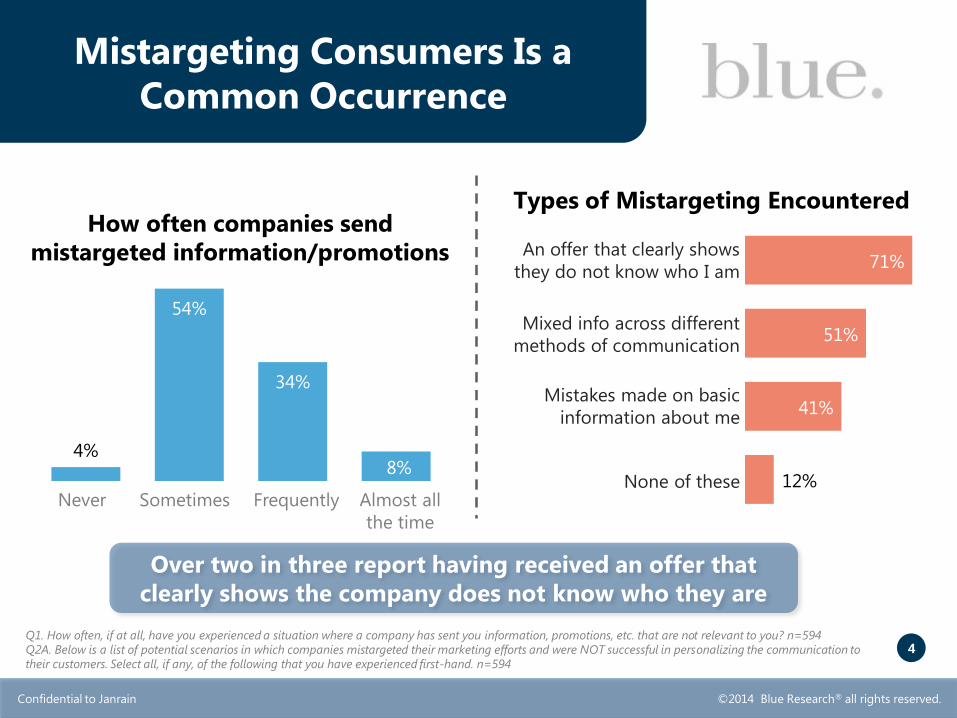
Mistargeting Consumers Is a
Common Occurrence
Q1. How often, if at all, have you experienced a situation where a company has sent you information, promotions, etc. that are not relevant to you? n=594
Q2A. Below is a list of potential scenarios in which companies mistargeted their marketing efforts and were NOT successful in personalizing the communication to
their customers. Select all, if any, of the following that you have experienced first-hand. n=594
Never Sometimes Frequently Almost all
the time
12%
41%
51%
71%
None of these
Mistakes made on basic
information about me
Mixed info across different
methods of communication
An offer that clearly shows
they do not know who I am
Over two in three report having received an offer that
clearly shows the company does not know who they are
Types of Mistargeting Encountered
4%
54%
34%
8%
How often companies send
mistargeted information/promotions

5
©2014 Blue Research® all rights reserved.Confidential to Janrain
94% of Consumers Admit
Mistargeting Leads Them to
Disengage from a Company
Q2B. When a company mistargets their marketing efforts there are a variety of actions you might take. Please select from the following list all of the actions you
have taken, if any, for companies that consistently mistarget you in their marketing efforts. Please select ALL that apply. n=522
Actions Taken After Being Mistargeted
None of these
Automatically delete emails
Unsubscribe from emails
Categorize emails as ‘junk’/ ‘spam’
Be less likely to buy products
Visit website less frequently
Never visit website again
68%
54%
45%
29%
13%
10%
6%
94% admit to taking one
or more of these actions
to avoid further
engaging with companies
that mistarget them

6
©2014 Blue Research® all rights reserved.Confidential to Janrain
Many Consumers Say It Only
Takes a Few Mistargeted Emails
for Them to Disengage
Q2D. In general, how many mistargeted emails does it take before you start to
delete a company’s emails without looking at them or perhaps categorize the
emails as ‘junk’? n=408
Q2C. In general, how many of those mistargeted emails does it take
in order for you to unsubscribe from the distribution list? n=277
13%
25%
24%
6% 1
7%
15%
1 2 3 4 5 More
than 5
Number of Mistargeted Emails
After 2 Mistargets Many
Unsubscribe from Emails38%
24%
24%
21%
5% 14%
12%
1 2 3 4 5 More
than 5
After 2 Mistargets Nearly Half
Automatically Delete or
Categorize Emails as ‘Junk’
Number of Mistargeted Emails
48%

7
©2014 Blue Research® all rights reserved.Confidential to Janrain
Social Login Capabilities Are
Considered Attractive and Many Admit
It Will Influence Their Behavior

8
©2014 Blue Research® all rights reserved.Confidential to Janrain
Consumers See Value in the
Capabilities Social Login Enables
44%
45%
49%
60%Suggest products/ promotions
based on profile info
Capabilities of Social Login Considered Useful
Q8. For each, please rate how useful you believe these capabilities are. (showing respondents who rated 5-10 on a 1-10 scale) n=594
Allow mobile phone apps to
offer special ‘in-store’ offers
Ability to comment/ share opinions
about a company
Offers suggestion based on profile
info

9
©2014 Blue Research® all rights reserved.Confidential to Janrain
Consumers See Value in the
Capabilities Social Login Enables
Q11. Below is a list of opinions. For each, please rate the degree to which you agree or disagree with the statement: 3) I expect that by using ‘social login’ it
will improve my experience at a website (showing respondents who rated 5-10 on a 1-10 scale) n=594
Expect using Social Login
will improve their
experience with a website.
44%

10
©2014 Blue Research® all rights reserved.Confidential to Janrain
Social Login Is Expected to
Influence Consumer Behavior
Q11. Below is a list of opinions. For each, please rate the degree to which you agree or disagree with the statement: 2) I am more likely to return to a website if
it automatically recognizes me (without needing to remember a username or password every time) by using social login. (showing respondents who rated 5-10
on a 1-10 scale) n=594
are more likely to
return to a website that
remembers them without a
username or password
64%

11
©2014 Blue Research® all rights reserved.Confidential to Janrain
Companies Offering Social Login
Are Considered More Up-to-Date
and Innovative
Q11. Below is a list of opinions. For each, please rate the degree to which you agree or disagree with the statement: Companies that offer ‘social login’ are more
up-to-date, innovative and leave a positive impression compared to those which do not offer this capability (showing respondents who rated 5-10 on a 1-10
scale) n=594
believe companies that
offer Social Login are more
up to date and innovative,
and leave a positive
impression
56%

12
©2014 Blue Research® all rights reserved.Confidential to Janrain
Social Login Is Expected to
Influence Consumer Behavior on
Mobile Devices
Q16. Rate each of the statements below based on your level of agreement. A “1” means you completely disagree with that statement and a “10” means you
completely agree with that statement. If social login made it easier for me to login to sites using my mobile phone, iPad and/or tablet computer, I would……read
more online articles using one of these mobile devices. (showing respondents who rated 5-10 on a 1-10 scale) n=594
would read more articles
using their mobile phone
or tablet if Social Login
made it easier for them to
login
49%

13
©2014 Blue Research® all rights reserved.Confidential to Janrain
Q16. Rate each of the statements below based on your level of agreement. A “1” means you completely disagree with that statement and a “10” means you
completely agree with that statement. If social login made it easier for me to login to sites using my mobile phone, iPad and/or tablet computer, I
would……make more purchases online using one of these mobile devices. (showing respondents who rated 5-10 on a 1-10 scale) n=594
would make more
purchases online using
their mobile phone or
tablet if Social Login made
it easier for them to login
42%
Social Login Is Expected to
Influence Consumer Behavior on
Mobile Devices

14
©2014 Blue Research® all rights reserved.Confidential to Janrain
Social Login Is Frequently
Encountered; More Than Half Use
and Few Are Unsatisfied

15
©2014 Blue Research® all rights reserved.Confidential to Janrain
Nearly 9 in 10 Have Encountered
Websites Offering Social Login
Q7B. In the past month, how often, if at all, have you come across a website that offered the ability to ‘log-in’ using one of your social network, email or online
service accounts? n=594
81% report encountering social login at least once in the last month
Social Login is Commonly Encountered
have come across a site
offering social login
capability
88%

16
©2014 Blue Research® all rights reserved.Confidential to Janrain
Once Encountered, Just Over Half
Use Social Login Capability
Nearly Every Time: 5% Sometimes: 46%
use social login
when it is an option
Q7C. When you are at a website that requires you to either create an account or gives you the option to log in using one of your social network, email or online
accounts, how often do you use the social login option? n=560
How often do you use the social login option?
51% 49% never use
social login

17
©2014 Blue Research® all rights reserved.Confidential to Janrain
Majority Use Social Login Because
It Is Faster Than Registering
Q7E. Which of the following are the reason(s) why you use social login? n=286
5%
12%
50%
65%
Why do you use social login?
Faster than registering
at a site
Means one less password
to remember
Ensures websites are
more personalized
Some other
reason

18
©2014 Blue Research® all rights reserved.Confidential to Janrain
2%
7%
31
%
44
%
16
%
1-2 3-4 5-6 7-8 9-10
Wide Majority of Users Are Very
Satisfied With Social Login
Q7F. Overall, how satisfied are you with the experiences you have had using social login? n=286
Not Satisfied Very Satisfied
Satisfaction with Social Login Experiences

19
©2014 Blue Research® all rights reserved.Confidential to Janrain
Communicating How Personal
Information Is Used Could Increase
Usage of Social Login

20
©2014 Blue Research® all rights reserved.Confidential to Janrain
Not Everyone Who Encounters
Social Login Uses the Capability
88%have come across a
site offering social
login capability
Q7B. In the past month, how often, if at all, have you come across a website that offered the ability to ‘log-in’ using one of your social network, email or online
service accounts? n=594

21
©2014 Blue Research® all rights reserved.Confidential to Janrain
Not Everyone Who Encounters
Social Login Uses the Capability
Q7C. When you are at a website that requires you to either create an account or gives you the option to log in using one of your social network, email or online
accounts, how often do you use the social login option? n=560
49%say they never use
social login
22
©2014 Blue Research® all rights reserved.Confidential to Janrain
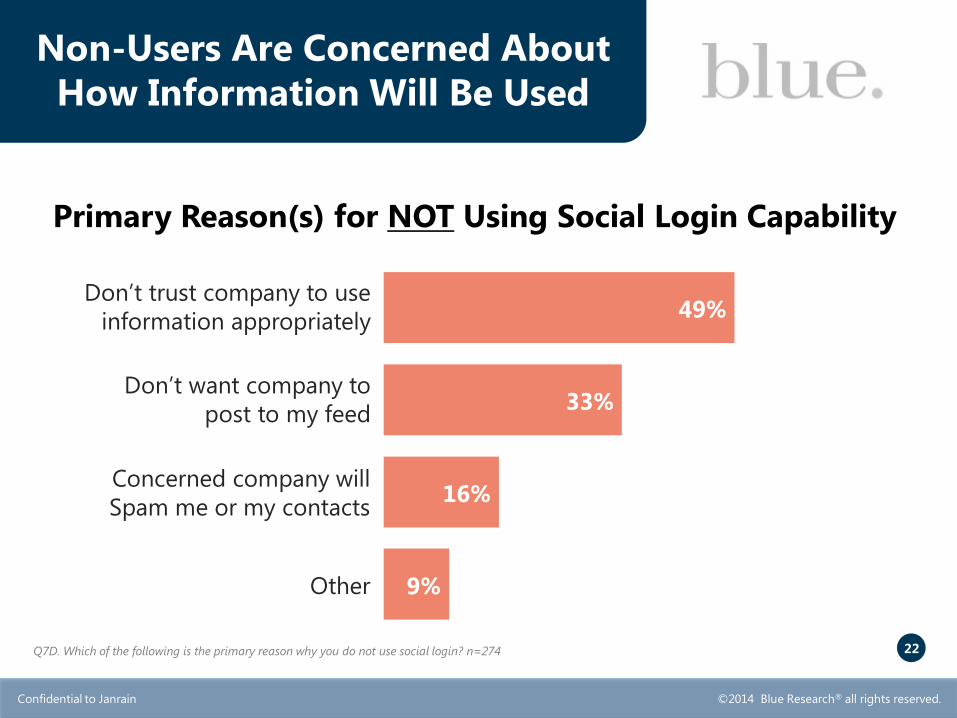
Non-Users Are Concerned About
How Information Will Be Used
Q7D. Which of the following is the primary reason why you do not use social login? n=274
Primary Reason(s) for NOT Using Social Login Capability
Don’t trust company to use
information appropriately
9%
16%
33%
49%
Don’t want company to
post to my feed
Concerned company will
Spam me or my contacts
Other

23
©2014 Blue Research® all rights reserved.Confidential to Janrain
Nearly Half of Non-Users Admit
They Could Be Enticed to Share
Social Media Profile Information
Q7H. Which of the following is most likely to encourage you to share your social media profile (e.g., gender, age, interests) with a website that you trust?
Non-users n=257
Actions to Encourage Non-Users to Share Profile Information
13%
14%
17%
31%
Company provides a
promotion
Company sends a free trial
or gift card
Information is ONLY used to
personalize experience
Company will not contact
others in social network

24
©2014 Blue Research® all rights reserved.Confidential to Janrain
Social Login Users May Represent a
Very Attractive Target Market

25
©2014 Blue Research® all rights reserved.Confidential to Janrain
Over Half Are SLI Users; a Little
Less Than Half Are Non-Users
Q7C. When you are at a website that requires you to either create an account or gives you the option to log in using one of your social network, email or online
accounts, how often do you use the social login option? n=560
How often do you use the social login option?
Nearly Every Time: 5%
Sometimes: 46%
51% Users

26
©2014 Blue Research® all rights reserved.Confidential to Janrain
Over Half Are SLI Users; a Little
Less Than Half Are Non-Users
Q7C. When you are at a website that requires you to either create an account or gives you the option to log in using one of your social network, email or online
accounts, how often do you use the social login option? n=560
How often do you use the social login option?
49% Non-Users

27
©2014 Blue Research® all rights reserved.Confidential to Janrain
Personalization Drives More
Social Login Users to Be Engaged
18%
28%
30%
Q9. If a company personalizes your experience and the information on their website by catering to your specific interests/preferences (e.g. recommending articles to
read, videos to watch, products/services to consider based on your profile, interests and/or purchases or perhaps those of your friends), how much more or less likely, if
at all, are you to do the following? (excludes percent selecting ‘no impact’ or ‘less likely’) SLI Users n=320; SLI Non-users n=274
Percent More Likely to… if a Site is Personalized
Social Login Non-Users
32%
46%
48%Read articles or watch
videos on the website
Spend more time on
the website
Download a mobile app from
that company
Social Login Users

28
©2014 Blue Research® all rights reserved.Confidential to Janrain
Q9. If a company personalizes your experience and the information on their website by catering to your specific interests/preferences (e.g. recommending articles to
read, videos to watch, products/services to consider based on your profile, interests and/or purchases or perhaps those of your friends), how much more or less
likely, if at all, are you to buy products/services on the website? (only showing those who select options 1-2) SLI Users n=320; SLI Non-users n=274
Personalization Drives More
Social Login Users to Purchase
Products or Services Online
of Social Login Users are
more likely to buy products
or services on a website if
the company personalizes
the experience
45%

29
©2014 Blue Research® all rights reserved.Confidential to Janrain
Q9. If a company personalizes your experience and the information on their website by catering to your specific interests/preferences (e.g. recommending articles to
read, videos to watch, products/services to consider based on your profile, interests and/or purchases or perhaps those of your friends), how much more or less
likely, if at all, are you to buy products/services on the website? (only showing those who select options 1-2) SLI Users n=320; SLI Non-users n=274
Personalization Drives More
Social Login Users to Purchase
Products or Services Online
of Social Login Non-Users
are more likely to buy
products or services on a
website if the company
personalizes the experience
29%

30
©2014 Blue Research® all rights reserved.Confidential to Janrain
Social Login Users Are More
Likely Than Non-Users to
Influence and Be Influenced
Q12. How often do you do the following? (excludes percent selecting “never”) SLI Users n=320; SLI Non-users n=274
Q9. If a company personalizes your experience and the information on their website by catering to your specific interests/preferences (e.g. recommending articles to
read, videos to watch, products/services to consider based on your profile, interests and/or purchases or perhaps those of your friends), how much more or less
likely, if at all, are you to do the following? (excludes percent selecting ‘no impact’ or ‘less likely’) SLI Users n=320; SLI Non-users n=274
Percent That Use Their Social Network to...
Social Login Non-Users
22%
32%
61%
56%
68%
40%
54%
74%
79%
84%Share a positive comment about
a product, service or company
Share a negative comment
Recommend a company’s
website to others
Social Login Users
Ask for feedback/ suggestions
before making a purchase
Seek out/ avoid a company
based on reviews
31
©2014 Blue Research® all rights reserved.Confidential to Janrain
Key Takeaways

32
©2014 Blue Research® all rights reserved.Confidential to Janrain
Online research completed by nationally representative sample of 594
social media active consumers to assess behaviors, interests and
perceptions.
Results demonstrate:
Key Takeaways

33
©2014 Blue Research® all rights reserved.Confidential to Janrain
Key Takeaways
Mistargeting is Common;
Consumers are DisengagingOver 9 in 10 report being
mistargeted and a similar percent
report taking steps to is
disengage from interacting with
these organizations.
Social Login is AttractiveMany report the experience it
enables could impact their
behavior in ways organizations
will find beneficial.
Social Login
is Widely EncounteredNearly 9 in 10 have been
exposed to social login

34
©2014 Blue Research® all rights reserved.Confidential to Janrain
Key Takeaways
Trust will Increase UseAssuring consumers that
personal information will be
used appropriately is
important in order for a
broader range of consumers
to elect to use social login.
Social Login Users are AttractiveConsumers who choose to use social
login appear to be more likely to
influence others, be influenced by others
and make purchases online, relative to
non-users of social login.
Social Login is Often UsedA little over half choose to use
it and over nine in ten social
login users report being
satisfied with their experiences
35
©2014 Blue Research® all rights reserved.Confidential to Janrain
These findings suggest social login may help companies
engage with an attractive segment of the consumer
population in a way consumers consider beneficial.
Key Takeaways

888 780 BLUE • [email protected] • blue-research.com
NW Office:
1400 NW Irving St.
Suite 408
Portland, OR 97209
CA Office:
1625 Scott Pl.
Suite 201
Encinitas, CA 92024

37
©2014 Blue Research® all rights reserved.Confidential to Janrain
Additional Data

38
©2014 Blue Research® all rights reserved.Confidential to Janrain
Demographics
Most are 35-64 Years
26% 18-34
55% 35-64
19% 65+
Age
Most are female
Gender
54%
Female
Most are White Caucasian
Ethnicity
2% African American
3% Hispanic
9% Asian
83% White Caucasian
2% Other
2% Prefer not to say
46%
Male
Most are College Grads
Education
0% Less than HS
8% HS Grad
4% Tech School
22% Some College
38% College Grad
28% Advanced Degree
Household IncomeMost earn less than $100k per year
28%
43%
26%
2%
Less
than
$50K
$50K
thru
$100K
$100K
thru
$250K
More
than
$250K

39
©2014 Blue Research® all rights reserved.Confidential to Janrain
Method
Custom designed online survey with the logic and skip patterns required to
deliver reliable insights completed by 602 respondents:
– Potential respondents recruited via email, given a one-time password
protected access to the survey.
– Respondents screened to ensure each is social media active and has:
• Purchased a product or service online in the past 30 days and/or
• Read articles or watched videos online from major media outlets in the past 30 days.
– Questionnaire composed primarily of close-ended questions; median time to
complete the survey is ~11 minutes.
– Quality controls in place to remove ‘speedsters’ and ‘flat-liners’ from data
analysis; 8 were removed for a final sample size of 594.
Design, programming, data collection, analysis and report by Blue Research.

888 780 BLUE • [email protected] • blue-research.com
NW Office:
1400 NW Irving St.
Suite 408
Portland, OR 97209
CA Office:
1625 Scott Pl.
Suite 201
Encinitas, CA 92024