
2014 ANNUAL REPORT - University of Michigan · PDF file2014 ANNUAL REPORT Letter from the ......
47
2014 ANNUAL REPORT
Transcript of 2014 ANNUAL REPORT - University of Michigan · PDF file2014 ANNUAL REPORT Letter from the ......

2 0 1 4 A N N U A L R E P O R T

LETTER FROM THE PRESIDENT 2
REPORT FROM THE INTERIM CHIEF FINANCIAL OFFICER 6
REPORT FROM THE VICE PRESIDENT FOR DEVELOPMENT 1 4
ACADEMICS 1 8
STUDENT PROFILE 2 0
GLOBAL 2 2
HEALTH SYSTEM 2 4
RESEARCH 2 6
PLANET BLUE 2 8
COMMUNITY 3 0
ATHLETICS 3 2
DEARBORN 3 4
FLINT 3 5
NEWSMAKERS 3 6
MAJOR PROJECTS 3 8
MANAGEMENT RESPONSIBILITY FOR FINANCIAL STATEMENTS 4 2
INDEPENDENT AUDITOR’S REPORT 4 3
MANAGEMENT’S DISCUSSION AND ANALYSIS 4 5
FINANCIAL STATEMENTS 6 2
OFFICERS AND STAFF 8 8
t a b l e o fC o n t e n t s

20
14 A
NN
UA
L R
EP
OR
T L
etter from
the P
residen
t
2
l e t t e R f R o m t h e P R E S I D E N T
M A R k S . S c h L I S S E L
3
20
14 A
NN
UA
L R
EP
OR
T L
etter from
the P
residen
t
As I join the University of Michigan as its 14th president, I am impressed
with this institution’s vast strengths: across academic disciplines, and
in its schools and colleges, robust health system and hospitals, athletic
enterprise, and two regional campuses in Dearborn and Flint.
From its earliest days, the University of Michigan has existed to better
society and to improve the world through research and education. The
university’s first president, Henry Tappan, shaped the modern American
research university. Nearly 200 years later, the University of Michigan is a
model of academic excellence across the nation and around the world.
Excellence remains the foundation of our work.
As I became engaged in the presidential search process, I learned that the
university has 100 graduate programs ranked in the top 10 nationally; in
fact, only Harvard, Stanford, and the University of California at Berkeley
have a greater number. This puts Michigan in a special place within the
landscape of national higher education. Of course, it also brings a deep
responsibility to focus these tremendous intellectual assets on the most
pressing challenges of our time.
O U R h I g h E S T P R I O R I T y
I S S T U D E N T f I N A N c I A L
S U P P O R T, T O g U A R A N T E E
T h AT A D I v E R S E g R O U P O f
T h E w O R L D ’ S b R I g h T E S T
U N D E R g R A D U AT E A N D
g R A D U AT E S T U D E N T S w I L L
b E A b L E T O S T U D y
AT M I c h I g A N .

20
14 A
NN
UA
L R
EP
OR
T L
etter from
the P
residen
t
5
20
14 A
NN
UA
L R
EP
OR
T L
etter from
the P
residen
t
4
As I said in my inaugural address, we live in a remarkable but
imperfect world. We face great societal threats that demand the
academy’s attention, and our responses must include endeavors in
science, technology, professional training, the liberal arts, cultural
understanding, civic engagement, and artistic expression.
I believe there has never been a more important time for Michigan’s
contributions to, and leadership in, public higher education.
The university is in a strong position to move into its third century
with positive momentum. Michigan’s Ann Arbor campus received
a record 46,813 applications for fall 2013, and the incoming class
has the highest level of academic achievement in the history of the
university. At the same time, our campuses in Flint and Dearborn
have experienced growth in their total student enrollment and are
building outstanding new programs with an eye toward the regional
economy. The incoming class will have tremendous opportunities for
experiential learning, entrepreneurship, arts exploration, and global
engagement. One of our most important goals will be to keep a
Michigan education affordable and build the financial resources that
will enable us to do that.
Research is closely coupled with education at the University of
Michigan, both at the graduate and undergraduate levels. Despite an
increasingly competitive environment for external research funding,
U-M spent $1.3 billion on research last year—one of the highest
amounts of any university. This is an excellent foundation not only
for generating important new knowledge, but also for providing
students with opportunities to develop the research skills and insights
they need to become innovators in their chosen careers.
The commitment to philanthropy of Michigan’s alumni and friends is
among the university’s most valued assets. The Victors for Michigan
campaign has kicked off and is already well on its way to achieving its
ambitious goals. Donors demonstrated their commitment by stepping
up to give $2.3 billion to date, 57 percent of the campaign’s $4 billion
goal. I appreciate that there is much left to accomplish, and I am
eager to be part of this exciting campaign.
Our goals for the campaign underscore U-M’s key priorities in the
years ahead:
0Our highest priority is student financial support, to guarantee
that a diverse group of the world’s brightest undergraduate and
graduate students will be able to study at Michigan.
0Next, we want to enhance the value of a Michigan education by
extending academic excellence from the classroom into real-world
experiences that develop students’ global perspectives and creative,
entrepreneurial mindset. We are hard at work on this already.
0And finally, we want to continue to serve the public good by
collaborating on the development of bold new ideas to help solve
the world’s most challenging problems. Donor support can help us
as we bring together the brightest and most collaborative minds here
at Michigan.
The University of Michigan will celebrate its 200th anniversary in
2017. As we build toward that momentous occasion, we are proud
of the university’s grand history, its contemporary strengths, and its
future promise. Our mission is to employ the power of ideas and
our collective diversity of experience to solve important problems
and strengthen communities. Our mission, too, is to extend the
university’s great impact into its third century: to be an exceptional
global university where learning transforms lives and promotes
economic progress.
I am proud and honored to be a member of this special academic
community.
Sincerely,
Mark Schlissel
President

20
14 A
NN
UA
L R
EP
OR
T R
epo
rt from
the In
terim C
FO
6
D O U g L A S L . S T R O N g
20
14 A
NN
UA
L R
EP
OR
T R
epo
rt from
the In
terim C
FO
7
I am pleased to report that the University of Michigan continues
to be financially healthy, thanks in large part to our 44,000
faculty and staff who are keenly focused on advancing the
institution’s core mission, while also maximizing our resources
and increasing our efficiencies.
In FY 2014, the university’s total net position increased by
$1.6 billion to $13.1 billion. This increase is primarily the result
of strong investment returns, which added $974 million to the
endowment net of distributions for operations, and a strong start
to the public phase of the Victors for Michigan Campaign which,
amongst the generous donations, included $298 million in gift
revenues specifically for capital and endowment purposes.
We continue to use a disciplined budget approach that carefully
balances the university’s requirement to be competitive against
the challenging economic environment that we’ve faced for several
years. The university’s long-term strategy is designed to ensure
that tuition increases are moderate and that our ongoing efforts to
develop and implement innovative cost containment strategies and
successful fundraising programs continue. Beyond that, our faculty
and staff remain focused on protecting and enhancing the world-class
quality of the university’s research, teaching, and clinical care. When
combined with our long-term investment strategy, these factors
ensure a strong future for the university, with the resources to make
strategic investments in the people, programs, and facilities that
result in U-M being one of the best public universities in the world.
R e p o R t f R o m t h e I N T E R I M c h I E f
f I N A N c I A L O f f I c E R
I N f y 2 0 1 5 , f O R T h E
S I x T h y E A R I N A R O w,
T h E R E w I L L b E N O
I N c R E A S E I N T h E c O S T
T O AT T E N D U-M f O R T h E
T y P I c A L A N N A R b O R
c A M P U S U N D E R g R A D U AT E
R E S I D E N T S T U D E N T w h O
h A S f I N A N c I A L N E E D .
20
14 A
NN
UA
L R
EP
OR
T R
epo
rt from
the In
terim C
FO
9
20
14 A
NN
UA
L R
EP
OR
T R
epo
rt from
the In
terim C
FO
8
In the following sections, I will discuss these contributors as well as
provide updates on several key initiatives that are positively impacting
the university’s overall financial health to provide context for the
accompanying financial statements.
T h E E N D O w M E N T The university’s long-term diversified investment strategy is designed
to maximize total return, while our distribution rule policy is designed
to protect the endowment corpus in real terms and provide dependable
support for operations. The Long Term Portfolio’s 18.8 percent return
in FY 2014 follows a 10.8 percent return in FY 2013 and a -0.5 percent
return in FY 2012. The Long Term Portfolio’s annualized 10-year return
of 10.0 percent was 1.4 percentage points above the custom benchmark
designed to capture the university’s long-term diversified investment
strategy and 4.0 percentage points over the university’s blended passive
index, which captures the performance of passive, investable asset class
benchmarks representative of a large institutional investment pool.
The return of the S&P 500 stock index was 7.8 percent over the same
10-year period.
The table below shows the Long Term Portfolio’s favorable 10-year
investment performance relative to its benchmarks. Utilizing a
diversified investment strategy has limited the loss of capital in the
more challenging years.
The university’s endowment distribution rule smooths the impact of
volatile capital markets by providing for annual distributions based on
a percent of the moving average fair value of endowment shares.
This rule, along with the growth of the endowment, allowed for
funding the construction and furnishing of a new
state-of-the-art residence designed to foster
a community where graduate students from
multiple disciplines can live and exchange ideas
in a unique high-density residential-academic
arrangement.
A summary of major capital projects in planning,
in progress, and completed during FY 2014
appears on pages 38–41.
R E v E N U E
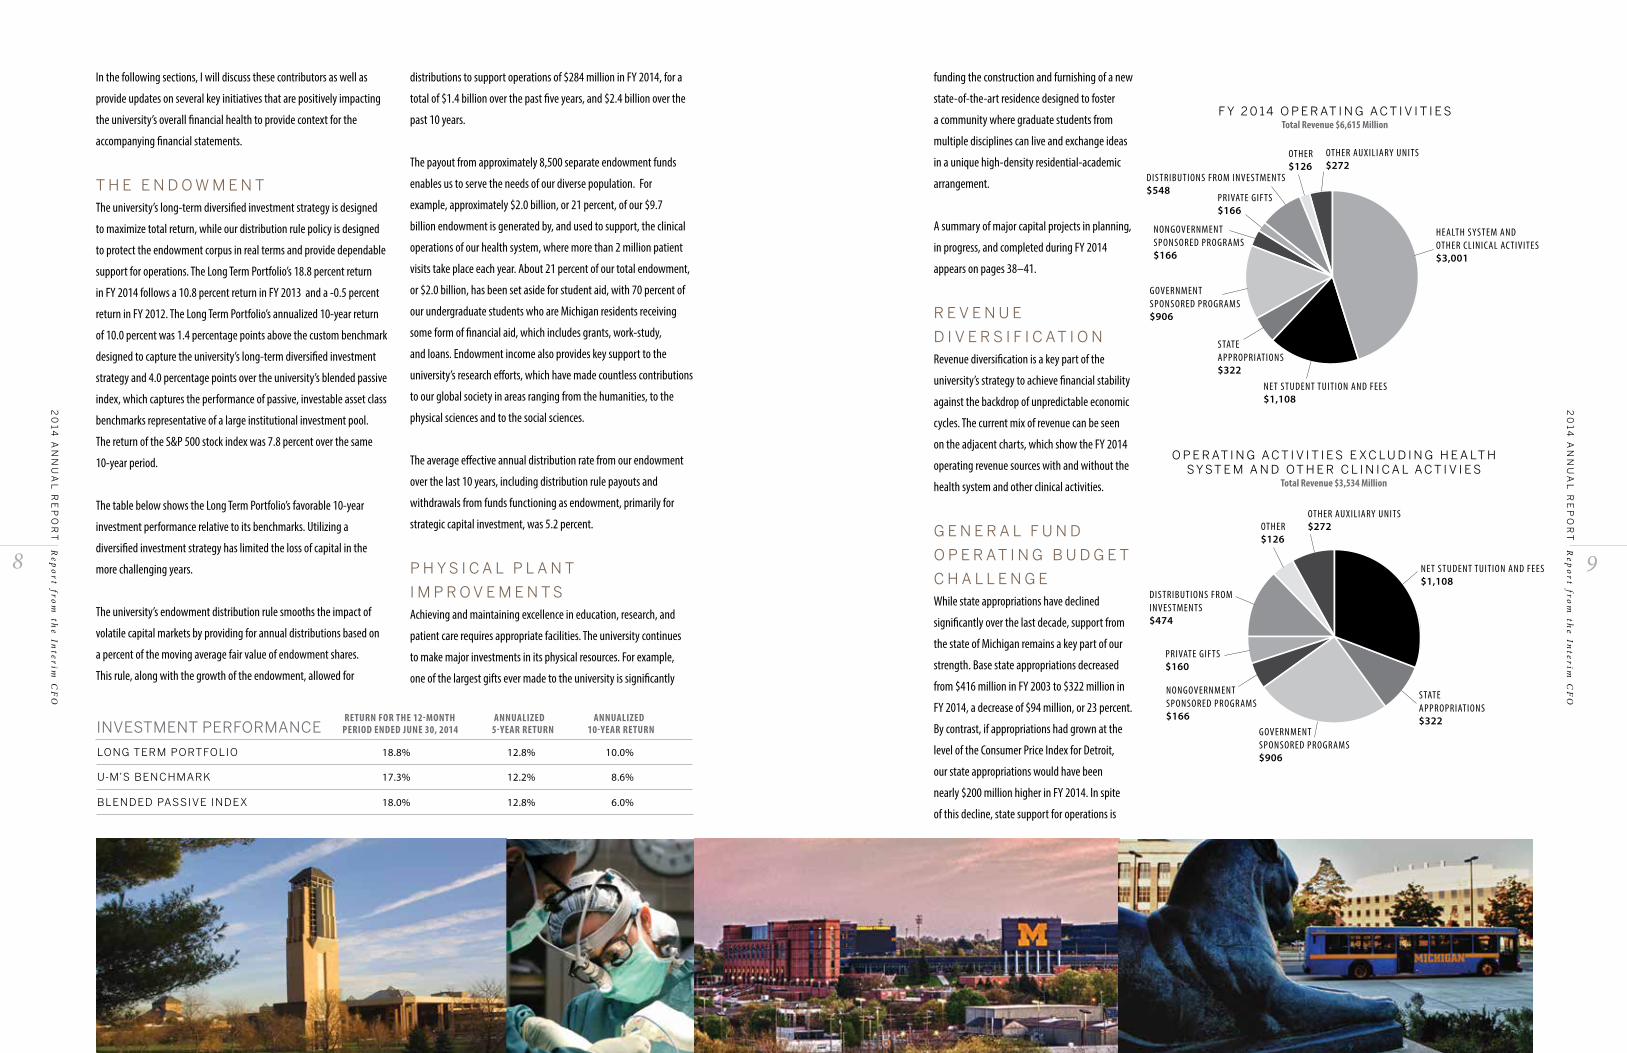
D I v E R S I f I c AT I O N Revenue diversification is a key part of the
university’s strategy to achieve financial stability
against the backdrop of unpredictable economic
cycles. The current mix of revenue can be seen
on the adjacent charts, which show the FY 2014
operating revenue sources with and without the
health system and other clinical activities.
g E N E R A L f U N D
O P E R AT I N g b U D g E T
c h A L L E N g E While state appropriations have declined
significantly over the last decade, support from
the state of Michigan remains a key part of our
strength. Base state appropriations decreased
from $416 million in FY 2003 to $322 million in
FY 2014, a decrease of $94 million, or 23 percent.
By contrast, if appropriations had grown at the
level of the Consumer Price Index for Detroit,
our state appropriations would have been
nearly $200 million higher in FY 2014. In spite
of this decline, state support for operations is
LONg TERM PORTfOLIO 18.8% 12.8% 10.0% U-M’S bENchMARk 17.3% 12.2% 8.6% bLENDED PASSIvE INDEx 18.0% 12.8% 6.0%
return for the 12-month AnnuAlized AnnuAlized period ended june 30, 2014 5-YeAr return 10-YeAr return
distributions to support operations of $284 million in FY 2014, for a
total of $1.4 billion over the past five years, and $2.4 billion over the
past 10 years.
The payout from approximately 8,500 separate endowment funds
enables us to serve the needs of our diverse population. For
example, approximately $2.0 billion, or 21 percent, of our $9.7
billion endowment is generated by, and used to support, the clinical
operations of our health system, where more than 2 million patient
visits take place each year. About 21 percent of our total endowment,
or $2.0 billion, has been set aside for student aid, with 70 percent of
our undergraduate students who are Michigan residents receiving
some form of financial aid, which includes grants, work-study,
and loans. Endowment income also provides key support to the
university’s research efforts, which have made countless contributions
to our global society in areas ranging from the humanities, to the
physical sciences and to the social sciences.
The average effective annual distribution rate from our endowment
over the last 10 years, including distribution rule payouts and
withdrawals from funds functioning as endowment, primarily for
strategic capital investment, was 5.2 percent.
P h y S I c A L P L A N T
I M P R O v E M E N T SAchieving and maintaining excellence in education, research, and
patient care requires appropriate facilities. The university continues
to make major investments in its physical resources. For example,
one of the largest gifts ever made to the university is significantly
NONGOVERNMENT SPONSORED PROGRAMS$166
HEALTH SYSTEM AND OTHER CLINICAL AC TIVITES$3,001
PRIVATE GIFTS$166
STATE APPROPRIATIONS$322
NET STUDENT TUITION AND FEES$1,108
GOVERNMENT SPONSORED PROGRAMS$906
OTHER AUxILIARY UNITS$272
DISTRIBUTIONS FROM INVESTMENTS$548
f y 2 0 1 4 O P E R AT I N g A c T I v I T I E S total revenue $6,615 million
OTHER$126
NONGOVERNMENT SPONSORED PROGRAMS$166
STATE APPROPRIATIONS$322
NET STUDENT TUITION AND FEES$1,108
GOVERNMENT SPONSORED PROGRAMS$906
OTHER AUxILIARY UNITS$272
DISTRIBUTIONS FROM INVESTMENTS$474
OTHER$126
PRIVATE GIFTS$160
O P E R AT I N g A c T I v I T I E S E x c L U D I N g h E A LT h S y S T E M A N D O T h E R c L I N I c A L A c T I v I E S
total revenue $3,534 million
INvESTMENT PERfORMANcE

20
14 A
NN
UA
L R
EP
OR
T R
epo
rt from
the In
terim C
FO
1 1
20
14 A
NN
UA
L R
EP
OR
T R
epo
rt from
the In
terim C
FO
1 0
crucially important to us as it would take an additional endowment of
approximately $7 billion in unrestricted funds to generate an equivalent
revenue stream.
In FY 2015, the university will receive an increase of 5.8 percent to
our appropriation from the state of Michigan. We are grateful for
this increase and the adopted budget remains focused on limiting
the financial burden for students while maintaining an unwavering
commitment to the quality of the university, both inside and outside
the classroom.
Multi-year budget planning, prudent management of resources, and our
willingness to make difficult decisions regarding priorities have allowed
us to prepare for—and smooth out—the impact of the tumultuous
financial situation that has faced both the state and nation in recent
years. This long-term plan and focus has enabled us to avoid the severe
program cuts and double-digit tuition increases other universities
around the country have experienced.
The general fund operating budget continues to balance academic
excellence and access with long-term cost containment efforts and
the need to invest in the future. A disciplined approach to finding
efficiencies in what we do is a driving force behind our ability to limit
tuition increases, provide more financial aid, and continue to invest in
teaching and research. Since FY 2004, the university’s deans, directors,
faculty, and staff reduced and reallocated $289 million in recurring
general fund expenditures from the Ann Arbor campus budget. Looking
ahead, our plans call for reducing or reallocating more than $65 million
in recurring costs by 2017, including $24 million in the FY 2015 budget.
We will continue to make every effort to protect the excellence of the
educational experience as we make these changes.
The approved Ann Arbor campus budget for FY 2015 includes tuition
rate increases of only 1.6 percent for resident undergraduates. The
budget for the Ann Arbor campus also includes tuition rate increases of
3.4 percent for nonresident undergraduate students, and 2.4 percent
for most graduate programs. It also includes more than $180 million in
centrally awarded financial aid, which constitutes the largest investment
in financial aid in the university’s history. Within that, centrally awarded
financial aid for undergraduates is increasing by 17.2 percent, which will
help in our ongoing efforts to preserve access for our most financially
vulnerable undergraduate students. This marks the ninth time in the
past 10 years that financial aid has increased by at least 10 percent.
For the sixth year in a row, there will be no increase in the cost to
attend U-M for the typical Ann Arbor campus undergraduate resident
student who has financial need. The FY 2015 financial aid investment
is sufficient to cover the full increase in the cost of attendance (tuition
and fees, housing, textbooks, and incidentals) with grant aid for
these students, resulting in no increase in packaged loan burden. In
addition, the loan burden in the 2015 financial aid package for these
students is less than in 2009.
The UM-Dearborn FY 2015 budget includes a 3.2 percent increase
in resident undergraduate and graduate rates. The increase is the
lowest since the 2004–05 school year and constitutes a three-year
downward trend in tuition increases. UM-Dearborn also increased
institutional financial aid by 21 percent. UM-Flint’s budget includes a
3 percent increase in undergraduate and graduate tuition rates as well
as a 5 percent increase in institutional financial aid.
T h E h E A LT h S y S T E M The U-M Health System (UMHS)—which integrates the Hospitals and
Health Centers, Medical School, Michigan Health Corporation, and
shared administrative services under the direction of the university’s
executive vice president for medical affairs—is a national leader in
advanced patient care, innovative research to improve human health,
and comprehensive education of physicians and medical scientists.
It continues to receive recognition for excellence in patient care,
including national rankings in many specialty areas by U.S. News &
World Report. The magazine also ranked the Medical School among
the very best, and residency directors surveyed for the ranking gave
our medical graduates among the highest ratings in the nation.
In FY 2014, the U-M Hospitals and Health Centers (UMHHC) achieved
an operating margin of 1.0 percent on operating revenues of
$2.5 billion. At the same time, UMHHC experienced a 5.7 percent
increase in patient care activity, record-high patient satisfaction, and
a 7.9 percent rise in revenues. All are notable achievements given the
challenging healthcare climate, and run counter to trends observed at
other major health systems in the state.
UMHHC’s operating performance this past year included the expected
short-term impacts of strategic investments that will provide
long-term benefit. Most notable this year were the activation of
the comprehensive MiChart electronic health information system in
U-M’s hospitals and other patient care areas, and the planning and
preparation for the opening of the 100,000-square-foot Northville
Health Center. A variety of other recent investments in patient care
capacity and efforts to control expenses also contributed to these
results.
This year, the first patients covered by individual private insurance
plans purchased under the Patient Protection and Affordable Care
Act were seen at UMHHC, as were patients covered by the Healthy
Michigan expanded Medicaid program enacted by the state
government. The full impact of these newly insured patients on
UMHHC financial results remains to be seen, but uncompensated care
for the uninsured and underinsured, currently at $153 million in FY
2014, should decline.
In the coming fiscal year, UMHHC will aim to achieve a positive
operating margin of 3.0 percent. Its plans call for serving 4 percent
more patients and growing revenues to $2.7 billion. Additional
efforts to increase clinical capacity are in planning stages. Recent and
proposed affiliations will also enable UMHS to bolster its capacity as
well as its statewide and nationwide reach.
D I v E R S I f y I N g R E S E A R c h
S U P P O R T The university is committed to maintaining the strength of its
research enterprise, which is central to its ability to attract top faculty
and students as well as its effectiveness in preparing students for the
challenges they will face in a wide range of careers.
Research spending in FY 2014 exceeded the billion-dollar mark for
the sixth straight year, totaling $1.3 billion. Although total research
expenditures at U-M dipped from the previous year, they have risen
dramatically over the last decade even as the total federal investment
in university research has eased off, showing the strength of U-M’s
competitive standing among its peer research universities and the
diversity of research funding from both federal and non-federal
sources. Thus, U-M is well positioned moving forward, when it is likely
that federal support for research will grow more slowly than it has in
the past, and competition for available funds will intensify.
In addition to maintaining our competitiveness for research contracts
from the full range of federal agencies, a key focus has been to submit
proposals for large projects that build on innovative partnerships
and the university’s inherent interdisciplinary strengths. This year, for
example, U-M joined with the manufacturing technology nonprofit
EWI and The Ohio State University to win the leadership of the
American Lightweight Materials Manufacturing Innovation Institute
(ALMMII), part of a White House initiative to help U.S. manufacturers
become more competitive. ALMMII will receive $70 million in federal
funding over five years, matched by more than $78 million from
consortium partners, to sponsor research and development projects
as well as education and training programs.
Strengthening ties to industry has also been a priority. During
FY 2014, with funding from Ford Motor Company and the Michigan
Economic Development Corporation, the U-M Energy Institute
launched an $8 million battery lab that will enable industry and
university researchers to collaborate on developing cheaper and
longer lasting energy storage devices in the heart of the U.S. auto
industry. Efforts are also under way to expand the Medical School’s
work in clinical trials, a promising and important area of growth.
U-M’s research generates a wealth of ideas that have potential to
benefit society. The Office of Technology Transfer reported a record
439 invention disclosures in FY 2014. In addition, it launched 14 new
companies based on technology developed at U-M, a new record.

20
14 A
NN
UA
L R
EP
OR
T R
epo
rt from
the In
terim C
FO
1 3
20
14 A
NN
UA
L R
EP
OR
T R
epo
rt from
the In
terim C
FO
1 2
c O N T R O L L I N g b E N E f I T c O S T S A N D I M P R O v I N g h E A LT h The university continues monitoring and evaluating the cost of employee and retiree health benefits. This is an ever-present
challenge for organizations across the country. Drawing on the combined expertise of top clinical and health policy faculty and
financial experts, the university has made adjustments to its health benefits premium structure and eligibility requirements
according to a multi-year plan. In doing so, the university closely monitors key benchmarks to ensure that it remains competitive
with local and national labor markets. As key facets of national healthcare reform continue to be implemented, the university is
also closely tracking cost and coverage implications.
For the university, total healthcare spending for nearly 100,000 employees, retirees, and dependents was approximately $363
million in FY 2014. Changes to the healthcare premium structure that began in FY 2004 are now generating cash savings of more
than $69 million annually. Changes to retirement eligibility rules and the amounts of university contributions toward healthcare
for future retirees took effect on January 1, 2013. These changes are projected to yield recurring annual cash outlay savings of more
than $9 million by the year 2020 and $165 million by 2040, helping to preserve vital funding for the university’s core mission and
creating greater opportunity to control the rate of future tuition increases.
MHealthy, the university’s health and well-being program, works in conjunction with benefit programs and initiatives to curb the
rate of increase in healthcare costs through prevention, early intervention, and health improvement. In FY 2014, nearly 20,000
benefits-eligible employees completed a health questionnaire, which enabled them to learn more about their health risks and
to take action to improve their health through follow-up programs and services. During that same period, approximately 18,000
employees participated in health screenings to have their cholesterol, blood pressure, and glucose checked and also spoke with a
health professional about their health goals.
MHealthy also has begun to provide specialized health improvement programs among job families that tend to have higher health
risks. And our efforts to help our employees get, and stay, healthy are not going unnoticed. The university was recently named as
one of the state of Michigan’s healthiest employers in a statewide analysis of employers whose policies and practices promote a
healthy workforce.
c O M P R E h E N S I v E c O S T c O N TA I N M E N T E f f O R T SThe university has long pursued a wide range of strategies to achieve cost reductions and long-term efficiencies in its operational
areas. We have, for example, opted to self-insure in select areas such as health benefits and risk management, which allows us to
achieve the full financial benefit of risk-reduction programs and investment opportunities with insurance reserves.
We’ve also aligned our health benefit offerings with the market and worked to ensure appropriate levels of cost sharing with
our employees. Beyond that, we’re continuing our efforts to aggressively control energy consumption by installing new systems,
retrofitting existing facilities, advancing energy purchases, and creating educational programs aimed at helping our employees
understand the financial and environmental importance of energy conservation.
Our ongoing strategic sourcing program, which consolidates the university’s spend with high-quality vendors to maximize
pricing discounts, enabled the institution to save more than $20 million in FY 2014 in a number of commodities, including office
supplies, computers, and temporary administrative staffing services. Contracts were also signed in FY 2014 for nearly 20 additional
categories, including transportation services, promotional items, and research materials such as antibodies and lab equipment.
These contracts are expected to save the university nearly $5 million annually, beginning in FY 2015.
The university’s information technology rationalization projects provide a shared technology infrastructure, improve service,
and reduce costs. The first phase is underway, with a focus on improving shared foundational services including email,
storage, security, server virtualization, and desktop support. During 2014, we implemented services to consolidate and
enhance desktop support, campus networking, and cloud computing capabilities across all central administrative units and
will continue those efforts in a pilot set of academic units.
In FY 2015, the university’s Shared Services Center will become operational and handle specific financial and human
resources transactions for a variety of units across the university. The first phase of work to be performed by the new
center will include accounts payable, accounts receivable, human resources appointment, and benefits transactions. Our
shared service model serves to optimize scale economies and provide cost-effective, flexible, and reliable services through
managerial span of control adjustment, process standardization, and elimination of non-value-added work.
I N T E R N A L c O N T R O L S FY 2014 was the tenth consecutive year that each unit on campus was required to complete an annual internal control
review and certification of internal controls and financial information. More than 40 deans and other top administrators
from both academic and administrative units completed this process, which leverages best practices from the Sarbanes-
Oxley Act and focuses on areas such as financial stewardship, information technology security, conflict of interest, and
identity theft prevention.
A variety of tools and guidance are provided to units on key risk areas such as employment, purchasing cards, cash handling,
journal entries, stewardship of gifts, financial aid administration, and employee travel and expense.
c O N c L U S I O N In FY 2014, the University of Michigan again received the highest credit ratings from Standard & Poor’s (AAA) and Moody’s
Investor Services (Aaa). We are one of only four public universities in the country to maintain both of these ratings, which
are the highest possible and a clear indication of the institution’s strong financial health and outlook.
Against the backdrop of the institution’s ongoing financial strength, it is, as in prior years, satisfying to receive an unqualified
opinion from the university’s independent financial auditors. This opinion, which appears on pages 43–44, signifies that the
financial statements present fairly the financial position of the university. My certification of management’s responsibility
for the preparation, integrity, and fair presentation of the university’s financial statements appears on page 42.
I encourage you to review Management’s Discussion and Analysis, which begins on page 45. This informative section details
how U-M’s financial strength, prudent financial policies, and commitment to maintaining the highest level of excellence
help ensure that the university’s mission will continue to be fulfilled in the decades ahead.
Douglas Strong
Interim Executive Vice President and Chief Financial Officer

20
14 A
NN
UA
L R
EP
OR
T R
epo
rt from
the V
P fo
r Dev
elop
men
t
1 4
J E R R y A . M A y
R e p o R t f R o m t h e v I c E P R E S I D E N T f O R D E v E L O P M E N T
20
14 A
NN
UA
L R
EP
OR
T R
epo
rt from
the V
P fo
r Dev
elop
men
t
1 5
On November 8th, donors and friends of the U-M came out in record
numbers to kick off the largest fundraising effort in our history, the
Victors for Michigan campaign. Thousands of people joined together
for an outdoor community celebration on Ingalls Mall and then moved
into Hill Auditorium, along with more than 500 U-M students. We
announced a commitment to raise $4 billion to support three campaign
priorities, a truly audacious goal, including a goal of raising
$1 billion for our top priority—student support.
Financial support for students will allow the U-M to continue recruiting
a diverse group of the world’s best students to Michigan, and ensures
that they can afford to enroll regardless of their financial circumstances.
w E A N N O U N c E D A c O M M I T M E N T
T O R A I S E $ 4 b I L L I O N T O S U P P O R T
T h R E E c A M P A I g N P R I O R I T I E S ,
A T R U Ly A U D A c I O U S g O A L ,
I N c L U D I N g A g O A L O f R A I S I N g
$ 1 b I L L I O N f O R O U R T O P
P R I O R I T y — S T U D E N T S U P P O R T.
the second priority is for engaged learning, giving students
hands-on educational experiences both inside and far beyond the
classroom. Through global experiences, internships, and immersive
learning that tests textbook lessons in the real world, engaged
learning prepares students to lead in the dynamic, multicultural,
entrepreneurial century we live in.
the third priority is to support bold ideas for the public good,
bringing the exceptional academic resources of the university—
including 100 graduate programs ranked in the top 10 nationally—
to bear on significant topics like K-12 education, sustainability, and
health challenges around the world and in our backyards.
c A M PA I g N L A U N c h c ATA P U LT S U-M T O R E c O R D-SE T T I N g y E A R
MUch wORk yET TO bE DONE IN vIcTORS fOR MIchIgAN cAMPAIgN

20
14 A
NN
UA
L R
EP
OR
T R
epo
rt from
the V
P fo
r Dev
elop
men
t
1 7
20
14 A
NN
UA
L R
EP
OR
T R
epo
rt from
the V
P fo
r Dev
elop
men
t
1 6
William Clay ford, Sr. (’44), of Detroit, was a student at Michigan
whose support has resulted in his name on the varsity tennis center.
Barbara erb (’44), of Detroit, with her late husband, fred (BBA ’47),
created the Frederick A. and Barbara M. Erb Institute for Global
Sustainable Enterprise. They met at the university in the 1940s when
they were students. Fred had passed away in January 2013, and
Barbara passed away in November.
peter Wege (hlld ’07), of East Grand Rapids, passed away, leaving
a legacy of environmental activism. At the University of Michigan,
he was a great benefactor and inspirational friend of the School of
Natural Resources & Environment.
We will miss these close friends. We remain truly awed by their
generosity, and by that of our more than 100,000 donors who
stepped forward this year to demonstrate their belief in the
University of Michigan. We are grateful for their commitment to
keeping the U-M one of the finest research universities in the world.
As we enter the next year of the Victors for Michigan campaign, we
thank all our donors.
We are humbled by your generosity.
Jerry A. May
Vice President for Development
The campaign is off and running in what can only be described as a
marathon. During our first year after kickoff, we set a remarkable pace.
We are extremely grateful for such a resounding response from donors.
Buoyed by the enthusiasm of the campaign, donors set records in
FY 2014 on so many fronts:
0127,516 donors made gifts and pledges, and bequest intentions,
totaling almost $950 million, an increase of 54 percent over last year.
0Outright gifts and pledge payments totaled $436 million, an
increase of 22 percent over last year.
– Donors made gifts totaling $88.9 million for student support,
$65.5 million of which was for the endowment; these
endowed funds will benefit students far into the future.
– Corporate giving was up 27 percent to $21.6 million, including
$6 million for student support.
– Foundation giving was up 32 percent to $60.5 million.
– Giving from associations was up 79 percent to $23.4 million.
A number of donors this year made extremely generous gifts as
they stepped up to take on leadership roles in the campaign. Their
generosity helped us reach these record-breaking totals. These donors
wanted to convey their belief in the campaign’s priorities, and they
wanted the campaign to get off to a great start.
Stephen m. ross (BBA ’62, hlld ’11) accepted the role of campaign
chair and made a gift of $200 million: $100 million for facilities for the
Stephen M. Ross School of Business and $100 million for athletic
facilities for a broad range of sports. In recognition, U-M’s South Campus
was named the Stephen M. Ross Athletic Campus.
A. Alfred taubman (taubman College ’48, hlld ’91), vice chair
for Victors for Michigan, and co-chair for the Health System campaign,
made a gift of $12.5 million to support the renovation and expansion of
the Taubman College of Architecture + Urban Planning. In recognition,
the new wing will be named the A. Alfred Taubman Wing.
rich rogel (BBA ’70, hlld ’09) has accepted the roles of vice chair
for Victors for Michigan, chair of the campaign for student support,
and chair of the Health System campaign. He and his wife, Susan, have
made a gift of $50 million: $30 million for scholarships in the Medical
School; $10 million to support faculty, students, and programs in the
Kenneth G. Lieberthal and Richard H. Rogel Center for Chinese Studies
in the College of Literature, Science, and the Arts; and $10 million for
future university initiatives.
Of the 127,516 donors this fiscal year, 119,168 made gifts under
$25,000. These gifts have a great impact in the schools and units
for which they are designated.
In the College of Literature, Science, and the Arts, for example, annual
fund gifts were used to provide funds for students who had taken
unpaid internships. As a result, $276,000 was awarded to students
in stipends ranging from $3,500–$5,000, allowing them to take
internships which gave them the valuable hands-on experiences we
call engaged learning. Internships in the U.S. ranged from working as
an intern for the Traverse City Film Festival, to working as an intern at
NASA. International internships allowed 42 students to work in business
development in Jordan, marketing in the Royal African Society in
London, and teaching in Turkey.
In the Penny W. Stamps School of Art & Design, the annual fund
supports scholarships, seed funding for new programs, and guest
lecturers, among other pressing needs. paul hoogesteger, a 1951
graduate, has given $100 to this Opportunity Fund each year for
the past 64 years. His gifts, along with those from the other tens of
thousands of donors who make annual gifts, have a powerful impact
on our students’ experiences at Michigan.
These gifts, and the many others made before the campaign was
publicly launched on November 8th, catapulted the Victors for Michigan
campaign toward its $4 billion goal. Since we began counting toward
the campaign in 2011, donors have made gifts totaling $2.3 billion,
57 percent of the goal. During that time, donors have given $394
million toward the $1 billion goal for student support.
Even as we celebrate this astounding success our donors have made
possible, we acknowledge that we have much more to accomplish. As
with any marathon, the second half is the hardest. We will be focused
on raising the $1.7 billion needed to reach our $4 billion goal, and in
particular we will be seeking funding for the $606 million remaining
to meet the $1 billion goal to support our students.
This year we lost several great friends of the University of Michigan.
margaret Ann (ranny) riecker (hlld ’05) of Midland, Michigan
passed away. Ranny was a devoted volunteer and, with her late husband
john (AB ’52, jd ’54), supported many parts of the university including
the Center for the Education of Women, the Ford School of Public Policy,
Athletics, the Law School, and LSA, among others.
.

20
14 A
NN
UA
L R
EP
OR
T A
cad
emics
1 8
a C a d e m i C s
N E w P R O g R A M S , M A J O R S ,
A N D I N I T I AT I v E S 0U-M students can now choose a minor in Digital Studies, offered
by the College of Literature, Science, and the Arts (LSA), which is
leading the interdisciplinary effort.
0The School of Information announced the $2 million Initiative for
Information Impact, which aims to engage students in the broader
U-M community in projects that benefit communities here at home
and overseas.
0LSA and the International Institute have formally approved the
establishment of the Copernicus Program in Polish Studies, funded
partially by the Copernicus Endowment.
0LSA’s Department of Sociology is offering a new minor in law,
justice, and social change, for students who have an interest in law
and society and those who are looking at careers in law, policy, and
criminal justice.
0The School of Kinesiology is now offering a new health and
fitness major, a research-based curriculum for students interested in
careers promoting individual and community health.
U R O P c E L E b R AT E S
2 5 y E A R S The Undergraduate Research Opportunity Program
(UROP) celebrated its 25th year with a symposium in
March 2014 at Palmer Commons. The award-winning
program creates research partnerships between
underclassmen and U-M faculty and researchers,
enabling students to gain skills and experience in
a wide variety of disciplines. Since the program’s
inception in 1988, more than 15,000 students have
participated.
A M O N g T O P S c h O O L S
f O R f U L b R I g h T
g R A N T SThe University of Michigan had the second-highest
number of student recipients of Fulbright grants
this year, with 32; only Harvard, with 39, had more.
Seven U-M faculty members also received the State
Department-sponsored awards, which seek to
increase mutual understanding between the U.S.
and other countries.
R A N k I N g S0U-M #12 on list of best colleges for undergraduate
teaching in U.S. News rankings
0U-M #5 on “smartest students” list
(Business Insider)
0Times Higher Education ranks U- M 15th in
world universities
S T U D E N T15:1t o f a c u lt y r at i o
D E g R E E263P R O g R A M S
L A N g U A g E S60+TA U g h T
S c h O O L S19A N D c O L L E g E S
g E N I U S g R A N T1
5,996I N T E R N AT I O N A L S T U D E N T S
b y T h E N U M b E R S
20
14 A
NN
UA
L R
EP
OR
T A
cad
emics
1 9

20
14 A
NN
UA
L R
EP
OR
T S
tud
ent P
rofile
2 1
R E c O R D E N R O L L M E N T f O R
f R E S h M A N A P P L I c AT I O N S The U-M’s Ann Arbor campus set an all-time enrollment record for the
fifth consecutive year, with 43,710 students in fall 2013. Applications
also set an all-time record—the seventh straight year—at 46,813,
10 percent more than the previous year. U-M has a 97 percent
freshman retention rate, and a 91 percent six-year graduation rate,
33 percentage points higher than the national average.
U-M M A I N TA I N S c O M M I T M E N T
T O c O L L E g E A f f O R D A b I L I T yIn FY 2014, there was no increase in the net cost of attendance for
most U-M students with financial need. The university continued
to cover 100 percent of in-state students’ demonstrated financial
need—the only public university in the state to do so. For a resident
student with a household income of $60,000–80,000, the typical
grant award was $13,430.
undergraduate Graduate/professional total
A N N A R b O R 28,283 15,427 43,710
D E A R b O R N 7,334 1 ,669 9,003
f L I N T 7,143 1 ,412 8,555
A L L c A M P U S E S 42,760 18,508 61,268
2 0 1 3 f A L L T E R M E N R O L L M E N T
undergraduate Graduate/professional total
ANN ARbOR 7,044 6,507 13,551
DEARbORN 1,297 487 1 ,784
fLINT 1,216 471 1 ,687
ALL cAMPUSES 9,557 7,465 17,022
2 0 1 3–14 D E g R E E S g R A N T E D
s t u d e n tp R o f i l e
60%O f U N D E R g R A D S A R E
f R O M M I c h I g A N
$26,240y E A R Ly f R E S h M A N c O S T S ,
I N c L U D E S T U I T I O N , f E E S ,
R O O M A N D b O A R D , b O O k S ,
A N D P E R S O N A L S P E N D I N g
20
14 A
NN
UA
L R
EP
OR
T S
tud
ent P
rofile
2 0
D I D y O U k N O w ? 0There are more than 1,400 U-M student groups.
01,300 U-M students have taken part in the Undergraduate
Research Opportunity Program.
0More than 73 percent of U-M students graduate within
four years.
0U-M alumni include three Supreme Court justices, 200
Olympic medalists, eight Nobel Laureates, and one U.S. president.
0U-M is ranked 6th in the nation by recruiters for hires.
0U-M students can choose from 100 study-abroad programs
on six continents.

2 2
b AT T L I N g b R A I N D R A I N :
D O c T O R S I N E T h I O P I AU-M has learned from its work in African nations that the
best way to retain medical talent is to offer doctors training
and other opportunities to advance their careers in their own
countries. And Senait Fisseha, a U-M associate professor of
obstetrics and gynecology, is playing a key role in helping
Ethiopia reverse the “brain drain” that has resulted in there
being more Ethiopian doctors in Chicago than in Addis Ababa.
Fisseha is leading a U-M effort to develop a postgraduate
training program for OB/GYN physicians that is becoming
a national model for Ethiopia. Her work is funded by an
anonymous $1.6 million grant; additional funding is being
provided by the Centers for Disease Control and Prevention
and the American International Health Alliance.
L E A R N I N g A N D T E A c h I N g
I N I N D I AIn 2013, Mary Sue Coleman became the first University
of Michigan president to visit India, on a trip focused on
expanding student exchanges and exploring new research
collaborations. “I’m proud that we have deepened our work
in five countries in three continents,” she said, “because it
means deeper experiences for students and faculty.” The
trip followed Coleman’s signing a new agreement with Delhi
University that provides opportunities for collaborative research
and will also allow U-M students to participate in a unique
program involving long train trips across India. “A university
exists to promote a limitless marketplace of ideas—a
marketplace in which ideas are tested, refined, and sharpened
by competition,” said Coleman. “That is why we matter.”
G l o b a l U-M P A R T N E R S h I P I N
c h I N A w I N S A w A R D f O R
E x c E L L E N c E , I N N O v AT I O NThe University of Michigan-Shanghai Jiao Tong University Joint
Institute (SJTU-JI) has received an IIE Andrew Heiskell Award—one of
the highest honors in international higher education. SJTU-JI won the
award for best practices in international partnerships. The award was
given by the Institute of International Education; it’s the first time a
U.S.-China collaboration has won in the partnership category. Founded
in 2006, Joint Institute classes are taught in English by more than
20 full-time faculty. More than 30 U-M faculty have engaged with JI
through teaching, course design, or joint research projects.
f I R S T w A L L E N b E R g f E L L O w
S T U D I E S c O N S E R v AT I O N
I N k E N y A
The first-ever University of Michigan Wallenberg Fellowship was
awarded to Zach Petroni, a graduating senior at the Ford School of
Public Policy, who used the $25,000 award to study conservation
governance in Kenya. Petroni first became interested in conservation
efforts when he went to Kenya during a junior-year course with the
Graham Sustainability Institute, and he credits that experience as
being “really formative in my thinking.” The $25,000 award, among
the largest for a graduating senior, was named in honor of U-M
alumnus Raoul Wallenberg, who is credited with saving the lives of
100,000 Hungarian Jews during the Holocaust. “The greatest lesson I’ve
learned from Wallenberg,” Petroni said, “is that one person can change
the world for the better...if only they are willing to put others first.”
I N N U M b E R O f #8I N T E R N AT I O N A L S T U D E N T S (OPEN DOORS)
2 3
20
14 A
NN
UA
L R
EP
OR
T G
lob
al
S T U D y I N g A b R O A D (OPEN DOORS)
#10 I N S T U D E N T S
20
14 A
NN
UA
L R
EP
OR
T G
lob
al

20
14 A
NN
UA
L R
EP
OR
T H
ealth
Sy
stem
2 5
T R A N S P L A N T c E N T E R
c E L E b R AT E S 5 0 y E A R SMore than 10,026 organ transplants have been done at U-M hospitals
since 1964, including 1,065 in children. In June 2014, the Transplant
Center celebrated 50 years of saving lives, and the first patients were
at the party: a pair of identical twin sisters who were the first donor
and recipient of a transplanted kidney at U-M. Only about a dozen
centers nationwide have done as many procedures. Teams transplant
hearts, lungs, pancreases, livers, kidneys, and corneas in about 400 to
450 procedures a year.
h O S P I TA L N E T w O R k T O
R E v O L U T I O N I z E S T R O k E
R E S E A R c h Nine Michigan hospitals have come together to form one of 25
regional networks around the nation that will enhance knowledge
of the three “prongs” of stroke research: prevention, treatment, and
recovery. Michigan StrokeNet, funded by the National Institutes of
Health, will be coordinated by the UMHS Stroke Program, and will
involve hospitals from Trinity Health system, UMHS, and Detroit
Medical Center.
U-M R E c E I v E S $ 1 . 1 M
f R O M A M A T O f U N D N E w
c U R R I c U L U M D E v E L O P M E N TThe U-M Medical School (UMMS) was recently awarded a $1.1 million
grant from the American Medical Association (AMA), part of the AMA’s
$11 million “Accelerating Change in Medical Education” initiative. More
than 80 percent of the nation’s medical schools submitted proposals
for revisions to the nation’s medical education curriculum; U-M and
10 other universities were selected to receive the grants. UMMS’
proposal focuses on teaching medical students the skills needed
to assume leadership roles in health systems. “We need to bring
medical education into the 21st century,” said Rajesh Mangrulkar,
UMMS associate dean for medical student education. “Our new
curriculum will ensure we produce doctors who will be ready to lead
changes. . .that will have an impact on patients and their communities.”
L I q U I D b I O P S y I M P R O v E S
c A N c E R D I A g N O S I SA microfluidic chip developed at U-M can capture elusive circulating
tumor cells from blood and support the cells’ growth for further
analysis. The device could one day help doctors diagnose cancers
and test treatment options without having to subject patients to
traditional biopsies, revolutionizing the treatment of cancer patients.
Max Wicha, director of the U-M Comprehensive Cancer Center, and
Diane Simeone, director of the Translational Oncology Program,
are co-authors of the paper on the device, published in Nature
Nanotechnology.
M A g A z I N E h O N O R S
c R E AT O R S O f 3 D S P L I N T
A surgeon and an engineer who saved a baby’s life with a 3D-printed
airway splint have won a Breakthrough Innovator Award from Popular
Mechanics magazine. Glenn Green, associate professor of pediatric
otolaryngology, and Scott Hollister, professor of biomedical
engineering and mechanical engineering and associate professor
of surgery, received the award at a ceremony in New York City in
October. “I believe 3D-printed medical devices will change the face of
medicine,” Hollister said.
h e a l t h s Y s t e m O U T P AT I E N T c L I N I c v I S I T S
2.1M I L L I O N
g R O w T h I N P AT I E N T
A c T I v I T y
5.7%
20
14 A
NN
UA
L R
EP
OR
T H
ealth
Sy
stem
2 4

20
14 A
NN
UA
L R
EP
OR
T R
esearch
2 6
R e s e a R C h
E P I L E P S y I N A D I S h : S T E M
c E L L R E S E A R c h R E v E A L S
c L U E S T O D I S E A S E ’ S
O R I g I N SIn a study funded by the National Institutes of Health, the American
Epilepsy Society, the Epilepsy Foundation, and U-M, a team of
scientists from the University of Michigan Medical School and
colleagues are taking a new stem cell-based approach to studying
epilepsy. The new technique, which could be called “epilepsy in a dish,”
has yielded a surprising discovery about what causes one form of the
disease, and may help in the search for better medicines to treat all
kinds of seizure disorders. The team reported their results online in
the Annals of Neurology, and have further work in progress to create
induced pluripotent stem cell lines from the cells of patients with
other genetic forms of epilepsy.
$ 7. 7 M g I f T f U N D S T h E N E w
w E I N b E R g I N S T I T U T E f O R
c O g N I T I v E S c I E N c EA $7.7 million gift from U-M alumnus Marshall Weinberg will fund
the new Weinberg Institute for Cognitive Science in the College of
Literature, Science, and the Arts. The interdisciplinary institute is
a cooperative effort between the departments of linguistics,
philosophy, and psychology; courses are also offered through other
LSA departments. The Institute is an outgrowth of the Weinberg
Cognitive Science Symposium, which explored a variety of cognitive
issues. “Interdisciplinary learning has the most meaningful impact,”
Weinberg says. “It is my hope that Michigan students will continue to
unlock secrets of the brain.”
20
14 A
NN
UA
L R
EP
OR
T R
esearch
2 7
U-M T O L E A D $ 2 5 M P R O J E c T
T O c U R b T h E S P R E A D O f
N U c L E A R w E A P O N SA U-M College of Engineering faculty member will lead a new $25 million
project to help nations with nuclear power safeguard their materials and
help improve monitoring of nations that don’t observe the international
nuclear nonproliferation treaty. Funded by the National Nuclear Security
Administration, the project establishes the Center for Verification Technology.
Teams from 13 universities will work with eight national labs to analyze
nuclear nonproliferation efforts, improve technologies for monitoring
weapons-grade materials and detecting secret weapon tests, and train the
next generation of nonproliferation experts. Partners include North Carolina
State University, Yale, Penn State University, Duke University, and the
Los Alamos and Lawrence Livermore labs.
TA U b M A N c O L L E g E R E c E I v E S
$ 1 . 3 M M E L L O N g R A N TThe Taubman College of Architecture + Urban Planning and LSA have been
awarded $1.3 million from the Andrew W. Mellon Foundation to support
a major initiative on the synergies between humanities research and the
design of cities. The program, “Egalitarianism and the Contemporary
Metropolis,” will include symposia, new lecture and seminar courses, post-
graduate research fellowships, and public exhibitions. The interdisciplinary
program will engage scholars and designers from architecture and urban
design, philosophy, art history, Latin American and American studies,
Afroamerican and African studies, history, and urban planning.
f A S T E R I M A g E P R O c E S S I N g I S
g O A L O f N E w $ 5 M c O N T R A c T
A U-M researcher is heading a project that will attempt to build alternative
computer hardware that could process images and video 1,000 times
faster with 10,000 times less power than today’s systems—all without
sacrificing accuracy. Wei Lu, U-M associate professor of electrical engineering
and computer science, explains that “with the proliferation of sensors, videos,
and images in today’s world, we increasingly run into the problem of having
much more data than we can process in a timely fashion. Our approach aims
to change that. ” Lu was awarded an up-to-$5.7 million contract from DARPA
to design and fabricate a computer chip based on self-organizing, adaptive
neural networks.
$1.3I N R E S E A R c h E x P E N D I T U R E S
b I L L I O N

20
14 A
NN
UA
L R
EP
OR
T P
lan
et Blu
e
2 8
g R A D S T U D E N T S w I N D O w
A w A R D S T O P U R S U E R E S E A R c h
I N M I c h I g A N A N D I N D I AFour teams of U-M grad students were recently selected to receive Dow
Distinguished Awards for Sustainability totaling more than $135,000.
A dozen teams entered the competition, and winners were selected by
a diverse group of sustainability experts including U-M faculty and external
practitioners from business, government, and the community. “The
Distinguished Awards are intended to spur multidisciplinary collaborations
that seek to develop sustainability solutions on local to global scales,”
said Don Scavia, director of the Graham Sustainability Institute, which
administers the program on behalf of the university. “We are excited to see
what this year’s inaugural winners can accomplish through their projects. ”
Three of the winning teams are pursuing projects focused on built
environment matters in Southeast Michigan. The fourth, called BLUELab
India, was awarded $5,000 in seed funding to examine water access and
contamination issues in the Gujarat province of India, with the goal of
helping to assure that every household in the area has access to clean water.
A U T O M AT E D v E h I c L E T E S T
f A c I L I T y T O O P E N f A L L 2 0 1 4A unique environment for testing connected and automated vehicles is
being constructed on 30 acres at the North Campus Research Complex.
The facility, which will simulate a dynamic urban environment, is a critical
element of a joint project with industry and government to develop and
implement an entire system of connected and automated vehicles on
the streets of Southeastern Michigan by 2021. “There have been a host of
innovations in this arena in recent years, but one of the major challenges
ahead is ensuring that these vehicles can perform safely and reliably in a
complex urban setting,” said Peter Sweatman, director of the U-M Mobility
Transformation Center, which is leading the initiative. “Testing a workable
system of such technologies in a realistic off-road environment is an essen-
tial step before a significant number of vehicles can be safely implemented
on actual roadways.” The novel test environment, funded in part by a grant
from the state of Michigan Department of Transportation, will include roads
with intersections, traffic signs and signals, sidewalks, benches, simulated
buildings, street lights, and obstacles such as construction barriers.
p l a n e t b l u e O P E N I N N O v AT I O N b AT T E R y L A b
E S TA b L I S h E D w I T h f O R D A N D M E D cThe university secured approximately $8 million to establish a battery lab which will enable
industry and university researchers to collaborate on developing cheaper and longer-lasting
energy storage devices. Initial support for the lab includes $5 million from the Michigan Economic
Development Corporation (MEDC), $2.1 million from Ford Motor Company, and $750,000 from
the College of Engineering. The lab will be housed at the U-M Energy Institute within the newly
renovated Michigan Memorial Phoenix Project Laboratory. “Michigan is the home and leader of
the global automotive industry including the development of advanced powertrain technologies.
The battery prototyping facility at the U-M Energy Institute will be a valuable resource for our
automotive industry going forward” said Nigel Francis MEDC senior vice president for automotive,
and senior automotive advisor to Governor Rick Snyder.
L A N D M A R k E f f O R T M E A S U R E S
c A M P U S S U S TA I N A b I L I T y c U LT U R EA new U-M survey found that there is room for improvement among faculty, staff, and students
when it comes to sustainability behaviors, awareness, engagement, and accountability. The
findings are part of the Sustainability Cultural Indicators Program, known as SCIP, a first-of-
its-kind study by the Graham Sustainability Institute and the Institute for Social Research. The
program is tracking the sustainability “culture” on campus over a six-year period, with particular
focus on four areas: climate action, waste prevention, healthy environments, and community
awareness. About 6,600 students, faculty, and staff were interviewed; the first-year report,
“Monitoring the Culture of Sustainability at the University of Michigan: Fall 2012,” represents
the tabulated results of that survey. Using annual SCIP data as a gauge, the university hopes to
see U-M’s sustainability culture improve each year as community members become increasingly
aware of, and engaged in, campus sustainability initiatives, such as the Planet Blue Ambassador
program and the annual Earthfest event.
U-M E N E R g y c O N S U M P T I O N c O N T I N U E S
T O D E c R E A S EThe U-M has avoided millions in energy costs for the sixth consecutive year as the result of
ongoing efforts by the Planet Blue Operations Team (PBOT). Energy conservation measures
resulted in an 8 percent reduction in energy use and an avoidance of $3.6 million in utility
costs for FY 2014. The energy saved is equivalent to the amount needed to power, heat, and cool
more than 2,585 average U.S. homes. “Each year we continue to identify energy improvements
in our buildings that result in significant savings for the university and help us to reach our larger
campus goals,” said Kevin Morgan, one of four regional energy managers for PBOT. “Sustainable
operations is part of the culture of how we do business on campus, and it’s our job to explore
opportunities to continue to operate in the most efficient manner possible.”
20
14 A
NN
UA
L R
EP
OR
T P
lan
et Blu
e
2 9
8,000R E U S A b L E w AT E R b O T T L E S
D I S T R I b U T E D O N c A M P U S
M I L L I O N$3.8I N R E S E A R c h f U N D I N g A w A R D E D
b y T h E U-M w AT E R c E N T E R

20
14 A
NN
UA
L R
EP
OR
T C
om
mu
nity
3 0
U-M A M O N g b E S T c O L L E g E S
f O R v E T E R A N SThe Military Times named the U-M among the 120 “Best for Vets Colleges” in
2014. The distinction recognizes and rewards U-M’s commitment to providing
opportunities to America’s veterans. “The University of Michigan is proud to
receive this high-level recognition from Military Times,” said Lester Monts, U-M
senior vice provost for academic affairs. “With our new policies governing in-state
tuition rates, along with a welcoming campus environment, I look forward to
an even larger number of veterans enrolling at the University of Michigan.” The
Best for Vets Colleges ranking provides significant information to help service
members choose their college or university, and is based on assessments of
student success and academic quality, retention and graduation rates, student
loan track records, and student-faculty ratio.
I N N O v AT I v E A L g A E R E S E A R c h
k E E P S S T U D E N T S I N S TAT EA partnership between U-M and a local company is serving as a model for how
university-to-business ties can produce significant mutual benefits. The
collaboration between Valicor Inc., of Dexter, and the College of Engineering
also illustrates how innovative programs can keep recent graduates working in
Michigan on world-class technologies. At the heart of the sharing agreement
are important new advances in what could be called the “greenest” of the
green energy movement: algae research. The partnership is exploring new,
more efficient ways to extract oil and other elements from microalgae for use
in biofuels, pharmaceuticals, nutritional supplements, animal feed, and other
products. Valicor has developed patent-pending methods that may solve the
current inefficient algal oil extraction that limits large-scale production and,
thus, economic viability.
C o m m u n i t Y
20
14 A
NN
UA
L R
EP
OR
T C
om
mu
nity
3 1
120b E S T f O R v E T S c O L L E g E S
A M O N g T h E
100,000S T E M E D U c AT O R S b y 2 0 2 1
U-M h O N O R E D b y A P L U f O R
c O M M I T M E N T T O E c O N O M I c
D E v E L O P M E N T I N S TAT EThe University of Michigan was one of four public universities honored by the
Association of Public and Land-grant Universities (APLU) for its exemplary work
statewide in entrepreneurship, technology transfer, and business development.
U-M was recognized for the work of its Institute for Research on Labor, Employment,
and the Economy; Business Engagement Center; and Michigan Venture Center. U-M,
along with Northern Illinois University, the State University of New York, and the
University of Cincinnati, has won APLU’s inaugural Economic Prosperity Award for its
efforts in working with public- and private-sector partners in Michigan to support
economic development. “These four institutions demonstrate the critical role that
public universities play in taking cutting-edge research and translating it into new
opportunities for economic growth with businesses in their state,” said APLU
President Peter McPherson. “All of these schools illustrate a core responsibility
of public universities—giving back to their communities and state in ways that
strengthen the economy and improve the quality of life for residents of that state.”
U-M T O h E L P T R A I N 1 0 0 k S T E M
T E A c h E R SThe School of Education’s LessonSketch online platform and TeachingWorks
organization have been invited to join 100Kin10, a multisector network responding
to the national imperative to train 100,000 science, technology, engineering, and
math teachers by 2021. “We are honored to be invited to partner with 100Kin10 and
work with them to bring excellence into STEM learning environments,” said Deborah
Loewenberg Ball, dean of the School of Education and director of TeachingWorks.
“It’s going to take innovation, creativity, and hard work to respond to this national
challenge. Together, LessonSketch and TeachingWorks bring a lot to the table as we
continue to make a difference in training excellent teachers.” The New York Times
editorial board called 100Kin10 “the most important effort” in STEM teacher
preparation. “Combining the resources offered by 100Kin10 with LessonSketch and
TeachingWorks’ commitment to supporting responsible teaching practice will go
a long way toward meeting the imperative of training 100,000 excellent STEM
educators by 2021,” Ball said. “We are honored to be joining such an elite group
of organizations who, like us, have all made bold and strong commitments to
improving STEM teaching and learning for our nation’s schools.”

20
14 A
NN
UA
L R
EP
OR
T A
thletics
3 2
a t h l e t i C s
R E c O R D-S E T T I N g A c A D E M I c y E A RMichigan student-athletes had one of the highest academic performances in the history
of the department. A record-tying six students earned Academic All-America honors
and 447 achieved a 3.0 cumulative grade point average for two consecutive terms. The
athletic department also held its first-ever graduation ceremony for student-athletes,
their families, and friends on the eve of the university’s graduation ceremony.
c O N f E R E N c E N E w SAt the Big Ten level, Michigan claimed the conference crown in six sports—men’s
basketball, men’s gymnastics, women’s gymnastics, softball, men’s swimming and
diving, and women’s tennis—and were the runners-up in five other sports—men’s
cross country, women’s cross country, women’s rowing, women’s soccer, and women’s
indoor track and field. Michigan had 45 student-athletes earn All-Big Ten first team
honors, with 23 student-athletes winning individual conference titles.
I N T h E c O M M U N I T yU-M student-athletes continued to give of their time, commitment, and passion, and
create mutually beneficial partnerships with local nonprofits, including weekly visits
from student-athletes with patients at C.S. Mott Children’s Hospital. Michigan Athletics
also had a chance to “go green” by hosting the first-ever “zero waste” men’s gymnastics
national championship at Crisler Center. Volunteers from the School of Natural Resources
& Environment, as well as the Michigan Student-Athletes for Sustainability and Student
Sustainability Initiative, helped fans sort compostable and non-compostable materials.
20
14 A
NN
UA
L R
EP
OR
T A
thletics
3 3
S T U D E N T- AT h L E T E S235 N A M E D T O A c A D E M I c A L L- b I g T E N c O N f E R E N c E
M E N ’ S g y M N A S T I c S
R E P E AT A S c h A M P I O N SThe men’s gymnastics squad became the first Michigan
team in 44 years to win back-to-back national titles.
Senior Sam Mikulak won the all-around national
crown for the third time in four years as well, and the
Nissen-Emery Award for National Athlete of the Year.
The Wolverines also repeated as national champions
in cheerleading, placed fourth at the NCAAs in men’s
swimming and diving and women’s cross country,
and had 18 varsity teams in total competing in the
post-season, with eight of those squads finishing in
the top 10 at the national level.
N AT I O N A L2c h A M P I O N T E A M S
A L L-A M E R I c A N S55 N c A A4
I N D I v I D U A L T I T L E S
A c A D E M I c
4c h A M P I O N T E A M S
6A L L - A M E R I c A N S
R E g I O N A L
56
c O N f E R E N c E6c h A M P I O N T E A M S
D I S T I N g U I S h E D S c h O L A R S
b I g T E N

E N R O L L M E N T T O P S 9 , 0 0 0 f O R S E c O N D
c O N S E c U T I v E y E A RUM-Dearborn enrollment topped 9,000 for the second consecutive year and the third time in the
university’s history for fall 2013. Student housing at The Union at Dearborn helped drive growth in the
freshman class, which increased by 9 percent over last year. Academic achievement among the incoming
class also increased, with an average high school GPA of 3.61 and ACT score of 24.51. The diversity of the
freshman class also grew, with a 57 percent increase in Hispanic students and a 55 percent increase in
African American students. “Having a diverse student body that reflects Southeast Michigan is crucial to
the education our students receive,” said Stanley Henderson, vice chancellor for enrollment management
and student life.
S T U D E N T S M O v E I N T O T h E U N I O N A new era in student life began in September 2013, when more than 400 students from across
Michigan and 11 other states moved into The Union at Dearborn. The privately owned complex is the
first housing option in more than 25 years specifically designed for UM-Dearborn students. Construction
of the complex was completed in just under a year; a ribbon-cutting ceremony took place on August 21.
“This project,” said UM-Dearborn chancellor Daniel Little, “will be transformative to the future of campus
and to the nature of student life on campus,” saying that The Union will lay the foundation for future
student enrollment growth.
J A N O S k y T O L E A D c O L L E g E O f E D U c AT I O N ,
h E A LT h , A N D h U M A N S E R v I c E SJanine Janosky has been named dean of the newly created College of Education, Health, and Human
Services (CEHHS). Before joining UM-Dearborn, Janosky served as vice president and senior fellow for
the Center for Community Health Improvement at Austen BioInnovation Institute in Akron, Ohio, where
she implemented the Accountable Care Community, a 70-organization initiative that promotes health
and education throughout the greater Akron area. The initiative now serves as a national model for
community health, and earned Janosky the “Champion of Change” honor from the White House.
Janosky, who has served as an FDA advisory committee member and consultant since 1995, was also
recently appointed to the five-member FDA Medical Device Resolution Panel.
N E w c E h h S D E g R E E P R O g R A M S A D D
T O h E A LT h c A R E O f f E R I N g SThe College of Education, Health, and Human Services has added three new degrees: a Master of Science
in Health Information Technology, a Bachelor of Arts in community health education, and a Bachelor of
Science in public health. All three programs begin enrolling students this fall, with the first class expected
to graduate in 2016. “These programs are truly interdisciplinary, and will help our graduates confront
healthcare issues we face in metro Detroit and across the country,” said Julie Roddy, chair of the College
of Education, Health, and Human Services’ Department of Health and Human Services.
d e a R b o R n 2
014
AN
NU
AL
RE
PO
RT
Flin
t 3 5
$22R E N O v AT I O N O f w I L L I A M
R . M U R c h I E S c I E N c E
b U I L D I N g
U M-f L I N T I S M I c h I g A N ’ S
f A S T E S T-g R O w I N g U N I v E R S I T y For the fifth time, UM-Flint has been named the fastest growing
university in the state. UM-Flint had the highest percentage increase
in fall 2013, with an enrollment jump of 3 percent. In the past decade,
UM-Flint has claimed the “fastest-growing” title five times. The
university’s strategic plans to increase enrollment over that same
period of time have had dramatic results: from 2004 to 2013, total
enrollment has soared over 38 percent, the largest percentage gain
among Michigan’s 15 public universities.
S TAT E ’ S f I R S T P h . D. P R O g R A M
I N P h y S I c A L T h E R A P y
E S TA b L I S h E DContinuing the tradition of leadership in physical therapist education,
UM-Flint’s Physical Therapy department is establishing the state’s first
Ph.D. in Physical Therapy—the first Ph.D. program on the UM-Flint
campus. The dual DPT/Ph.D. is designed for individuals interested in
teaching, research, and advanced clinical practice in physical therapy.
“The Physical Therapy department designed the Ph.D. program to
address the significant faculty shortage in the field nationwide,”
said Donna Fry, professor and interim director of UM-Flint’s physical
therapy programs.
R E Ac h I N g O U T TO “ c O M M U N I T y
c h A M P I O N S ” T O h E L P M E E T
N E E D S O f f O S T E R y O U T hA March 2014 meeting of community leaders and legislators focused
on foster care support in the state, identifying UM-Flint’s Mpowering
My Success program as a model to emulate. Mpowering is a state-
funded initiative designed to help foster youth make a successful
transition to college. “The Mpowering My Success program can have a
significant impact on a student’s success as they embark upon higher
education,” says Lori Vedder, director of financial aid. “UM-Flint is
seeking the input and advice of those who can help make an even
greater difference.”
M I L L I O N55%f I R S T g E N E R AT I O N
c O L L E g E S T U D E N T S
20
14 A
NN
UA
L R
EP
OR
T D
earb
orn
3 4
79%f L I N T A L U M N I
L I v I N g I N
M I c h I g A N
f l i n t

20
14 A
NN
UA
L R
EP
OR
T N
ewsm
ak
ers
3 73 6
20
14 A
NN
UA
L R
EP
OR
T N
ewsm
ak
ers
f A c E b O O k U S E P R E D I c T S
D E c L I N E I N h A P P I N E S SFacebook may help connect people, but it also can make them sad,
according to a new study. U-M social psychologist and Institute for
Social Research (ISR) researcher Ethan Kross was the lead author of the
article on the research, which found that the more people used
Facebook, the worse they subsequently felt. “On the surface,” Kross
said, “Facebook provides an invaluable resource for fulfilling the
basic human need for social connection. But rather than enhance
well-being, we found that Facebook use predicts the opposite
result—it undermines it.”
f A c U LT y N E w S 0Former SPH dean Noreen Clark passed away on November 23
in New York City after a brief illness. Clark, the Myron E. Wegman
Distinguished University Professor of Public Health, was one of the
world’s leading experts in the management of chronic disease and
worked with the UN and other international organizations.
0LSA associate professor Joseph Gone was awarded a fellowship by
the John Simon Guggenheim Memorial Foundation. Gone, an
associate professor of psychology and American Culture, focuses his
work on integrating indigenous healing practices into clinical mental
health settings that serve Native Americans.
0Sharon Glotzer, the Stuart W. Churchill Professor of Chemical
Engineering, was elected to the National Academy of Sciences.
Glotzer is recognized for her groundbreaking simulations of the
self-assembly of nanoparticles into complex structures.
TA L k I N g c R A v I N g S w I T h
T h E D A L A I L A M AU-M professor Kent Berridge was one of a dozen neuroscientists,
mental health professionals, and addiction clinicians invited to
meet with the Dalai Lama for a weeklong dialogue about craving,
desire, and addiction. The Dalai Lama is “interested in cravings and
in helping people become freer from them,” says Berridge. “He might
shed a different kind of light on the nature of craving that could be
interesting and useful to Western science.”
N E w f O U N D R U I N S c h A L L E N g E
v I E w O f E A R Ly R O M A N SArchaeologists have found a massive monument that shows that
Romans had grand architectural ambitions much earlier than
previously thought. Gabii, just east of Rome, was built 300 years
before the Colosseum and 100 years before the invention of mortar,
and may be the earliest public building ever discovered. The $2 million
dig is sponsored by the U-M Kelsey Museum of Archaeology.
S P h , D E T R O I T P A R T N E R T O
I M P R O v E A I R q U A L I T yA $2.8 million grant from the National Institute of Environmental
Health Services is helping fund an effort to combat air pollution in the
city of Detroit. The five-year grant builds on research by the School of
Public Health and local community groups, and will explore ways that
air pollution can be ameliorated, creating a model for change that can
be applied in similar communities throughout the country.
DENTAL SchOOL gETS $2M gRANTThanks to a $2 million gift from the Delta Dental Foundation, the School
of Dentistry will create a clinic where practitioners from multiple
disciplines (including dental students, faculty, and other U-M colleagues)
can provide dental and healthcare services in the same facility. The
gift funds the Delta Dental of Michigan Integrated Special Care Clinic,
which will improve healthcare access and convenience for patients with
developmental disabilities, cognitive impairments, complex medical
problems, veterans with PTSD, and the vulnerable elderly. Last year,
more than 130,000 patients visited the school’s 14 clinics, including
about 12,000 new patients seeking comprehensive dental care.
U-M Ac q U I R E S S Ay L E S A R c h I v EThanks to a grant from the U-M Library, many of the documents and
props from iconic filmmaker John Sayles’ movies will be available to
researchers in the John Sayles Archive at the Special Collections Library.
The Sayles collection joins those of Orson Welles and Robert Altman,
making U-M a major destination for research on American filmmakers.
U-M R E A c h E S M I L E S T O N E U-M completed the transfer of nearly half its collections of Native
American human remains and funerary objects from burial sites in
Michigan to the tribes that lived in the areas where they were found, in
compliance with the Native American Graves Protection and Repatriation
Act (NAGPRA). “By respecting the cultural perspectives of the tribes [we]
are confident that this will lead to entirely new research collaborations...
that will advance our knowledge of Native American cultures for the
benefit of all,” said Toni Antonucci, associate vice president for research,
who oversees the repatriation process for U-M.
n e w s m a k e R s
0Three U-M faculty—Eric R. Fearon, Arline T. Geronimus, and
James O. Woolliscroft—were named to the Institute of Medicine of
the National Academies. Fearon is a nationally recognized investigator
in the field of cancer genetics. Geronimus is a professor at the School
of Public Health and an international leader in the development of
biopsychosocial models of population health. Woolliscroft, dean of
the U-M Medical School, is an internationally recognized leader in
medical education.
0Two U-M professors, Daniel Atkins, the W.K. Kellogg Professor in
Community Information, and Wallace Hopp, the Herrick Professor of
Business, have been elected to the National Academy of Engineering,
the most prestigious engineering organization in the country.
0SPH dean Martin Philbert was named a fellow of the Royal
Society of Chemistry, the largest organization in Europe for the
advancement of chemical sciences.
0U-M professor Susan Murphy was one of 24 “exceptionally
creative individuals” to win a fellowship from the John D. and
Catherine T. MacArthur Foundation this year. The $625,000 stipend will
enable Murphy, the H. E. Robbins Professor of Statistics, to continue
her research on algorithms for smartphone-based interventions.
0The American Academy of Arts and Sciences has elected five
U-M faculty as 2014 Fellows: Deborah Loewenberg Ball, dean of the
School of Education; Arul Chinnaiyan, director of the Michigan Center
for Translational Pathology; Linda Gregerson, the Caroline Walker
Bynum Distinguished University Professor of English; Mary Kelley, the
Ruth Bordin Collegiate Professor of History; and James Morrow, A.F.K.
Organski Collegiate Professor of World Politics and research professor
at ISR.

20
14 A
NN
UA
L R
EP
OR
T M
ajo
r Pro
jects
P R O J E c T S I N P L A N N I N gArt and Architecture Building Renovation and A. Alfred Taubman Wing
Biological Science Building
George Granger Brown Memorial Laboratories Renovation
Dental Building to Palmer Commons Chilled Water Interconnection
Department of Intercollegiate Athletics Operations Center
East Hall Masonry Cornice and Window Soffit Repairs
Glen Avenue Parking Structure Elevator Replacement and Improvements
Mobility Transformation Facility
North Campus Research Complex Buildings 10 and 14 Renovations for the
Institute for Healthcare Policy and Innovation
North Campus Grove
Nuclear Engineering Laboratory Renovation
Transportation Operations and Maintenance Facility
University of Michigan Hospitals and Health Center Projects
• C.S. Mott Children’s and Von Voigtlander Women’s Hospitals Renovations
for Child and Adolescent Psychiatric Hospital Relocation
• University Hospital Adult Emergency Department Critical Care Unit
3 9
20
14 A
NN
UA
L R
EP
OR
T M
ajo
r Pro
jects
3 8
P R O J E c T S I N P R O g R E S SGeorge Granger Brown memorial laboratories mechanical engineering
Addition | Work started April 2012 with an estimated completion date of
September 2014. Financing is from the College of Engineering, gifts, investment
proceeds, and a construction grant from the National Institute of Standards and
Technology.
Central Campus Area utility tunnel reinforcement | Work started April
2014 with an estimated completion date of December 2014. Financing is from
utilities reserves.
Central power plant feed Water System deaerator upgrade | Work started
April 2013 with an estimated completion date of December 2014. Financing is
from utilities reserves.
William l. Clements library infrastructure improvements and
Addition | Work started February 2014 with an estimated completion date of
December 2015. Financing is from gifts and investment proceeds.
William W. Cook legal research library Attic insulation and ninth floor
roofing replacement | Work started March 2014 with an estimated
completion date of December 2014. Financing is from the general fund.
dearborn Academic Support Center renovations | Work started January
2014 with an estimated completion date of March 2015. Financing is from
UM-Dearborn.
dearborn engineering laboratory Building expansion for Bioengineering |
Work started April 2014 with an estimated completion date of September 2014.
Financing is from UM-Dearborn.
dearborn Science Building Computing Wing renovations | Work started
January 2014 with an estimated completion date of June 2015. Financing is from
UM-Dearborn.
dearborn Science Building and Computer information Science Building
renovation | Work started February 2014 with an estimated completion date of
September 2016. Financing is from a FY11 capital outlay request to the State
of Michigan and UM-Dearborn.
flint William r. murchie Science Building renovation | Work started
January 2014 with an estimated completion date of December 2015. Financing
is from a FY11 capital outlay request to the State of Michigan and UM-Flint.
harlan hatcher Graduate library life Safety upgrades | Work started
February 2014 with an estimated completion date of December 2014. Financing
is from investment proceeds.
elmer d. mitchell field improvements | Work started April 2014 with an
estimated completion date of December 2014. Financing is from investment
proceeds.
m a J o R p R o J e C t s O v E R v I E w O f
P R O J E c T S I N
P L A N N I N g , I N
P R O g R E S S , A N D
c O M P L E T E D

20
14 A
NN
UA
L R
EP
OR
T M
ajo
r Pro
jects
4 1
20
14 A
NN
UA
L R
EP
OR
T M
ajo
r Pro
jects
4 0
earl V. moore Building renovation and Brehm pavilion | Work started
April 2014 with an estimated completion date of December 2015. Financing is
from investment proceeds and gifts.
munger Graduate residences | Work started October 2013 with an
estimated completion date of September 2015. Financing is from gifts and
University Housing.
new field hockey team Center, new field hockey Stadium, and
ocker field improvements | Work started November 2013 with an
estimated completion date of September 2014. Financing is from the Athletic
Department and gifts.
north Campus research Complex Building 10 Air handling unit
replacement | Work started July 2013 with an estimated completion date of
July 2014. Financing is from the Medical School.
north Campus research Complex Building 28 renovations for the
College of engineering | Work started May 2014 with an estimated
completion date of December 2014. Financing is from the College of
Engineering and the Medical School.
north Campus research Complex Building 80 Switchgear
replacement | Work started September 2013 with an estimated completion
date of September 2014. Financing is from the Medical School.
pierpont Commons Café renovation | Work started April 2014 with an
estimated completion date of December 2014. Financing is from investment
proceeds and Student Life.
power Center for the performing Arts improvements | Work started
April 2014 with an estimated completion date of June 2015. Financing is from
investment proceeds.
president’s residence infrastructure renovation | Work started March
2014 with an estimated completion date of September 2014. Financing is from
investment proceeds.
horace h. rackham School of Graduate Studies infrastructure
improvements | Work started May 2014 with an estimated completion date
of December 2015. Financing is from investment proceeds.
harrison m. randall laboratory Air handling upgrades | Work started
May 2014 with an estimated completion date of December 2014. Financing is
from the College of LSA and the general fund.
regional Chiller plant for South and West Quadrangles and the
michigan union | Work started May 2013 with an estimated completion date
of September 2014. Financing is from University Housing.
mason hall Angell hall Courtyard Computing Site and Classroom
renovation | Completed August 2013. Financed by investment proceeds and
the Office of the Provost.
michigan Stadium Bowl painting | Completed August 2013. Financed by
the Athletic Department.
michigan Stadium marquee | Completed August 2013. Financed by the
Athletic Department.
modern languages Building elevator replacement | Completed June
2014. Financed by the general fund.
earl V. moore Building roof replacement | Completed August 2013.
Financed by investment proceeds.
north Campus research Complex Building 22 electron microbeam
Analysis laboratory renovation | Completed January 2014. Financed by
the College of Engineering and the Medical School.
power Center for the performing Arts electrical System
improvements | Completed October 2013. Financed by the general fund.
Glenn e. Schembechler hall entrance and museum renovation |
Completed March 2014. Financed by the Athletic Department and gifts.
Softball Center new facility | Completed February 2014. Financed by the
Athletic Department and gifts.
university of michigan hospitals and health Centers projects |
Financed by the U-M Hospitals and Health Centers.
• 2205 Commonwealth Boulevard, Ann Arbor, michigan
leasehold improvements for pediatric Speech language
pathology, physical therapy, and occupational therapy |
Completed March 2014.
• A. Alfred taubman health Care Center Backfill renovations
(levels 1 and 2) | Completed August 2013.
• A. Alfred taubman health Care Center internal medicine
renovation | Completed November 2013.
• Cancer Center Backfill renovation | Completed December 2013.
• i-275 Corridor Clinic expansion leasehold improvements |
Completed April 2014.
• livingston County Survival flight hangar leasehold
improvements | Completed December 2013.
• university hospital Communication Closet upgrades |
Completed November 2013.
• university hospital Critical power distribution
improvements | Completed May 2014.
• university hospital ethylene oxide Sterilizers replacement |
Completed December 2013.
Wall Street east parking Structure | Completed June 2014. Financed
by U-M Parking & Transportation Services.
Wilpon Baseball and Softball Complex Site improvements |
Completed December 2013. Financed by gifts and the Athletic Department.
Stephen m. ross School of Business Kresge Business Administration
library renovation, Computer and executive education Building
demolition, new Academic Building, and exterior Cladding project |
Work started April 2014 with an estimated completion date of December 2016.
Financing is from gifts and investment proceeds.
School of education renovation | Work started December 2013 with an
estimated completion date of December 2015. Financing is from investment
proceeds.
School of nursing new Building | Work started September 2013 with an
estimated completion date of December 2015. Financing is from investment proceeds.
South Quadrangle renovation | Work started May 2013 with an estimated
completion date of September 2014. Financing is from University Housing.
A. Alfred taubman health Sciences library renovation | Work started
December 2013 with an estimated completion date of December 2015.
Financing is from the Medical School.
university of michigan hospitals and health Centers projects |
Financing is from the U-M Hospitals and Health Centers.
• domino’s farms leasehold improvements for Wound Care
program expansion | Work started October 2013 with an estimated
completion date of September 2014.
• C.S. mott Children’s and Von Voigtlander Women’s hospital Shell
Space utilization for new operating room | Work started June
2014 with an estimated completion date of March 2015.
• neuroscience hospital renovation for electroencephalography
and electromyography Clinics relocation | Work started April
2014 with an estimated completion date of December 2014.
• A. Alfred taubman health Care Center department of emergency
medicine renovation | Work started May 2014 with an estimated
completion date of June 2015.
• university hospital and A. Alfred taubman health Care Center
fire Alarm upgrades | Work started October 2012 with an estimated
completion date of September 2014.
Varsity drive Building dry Collections relocation renovations | Work
started May 2014 with an estimated completion date of March 2015. Financing
is from the College of LSA.
West hall renovation for the College of literature, Science, and the
Arts | Work started October 2013 with an estimated completion date of
September 2014. Financing is from the College of LSA.
West Quadrangle and michigan union-Cambridge house renovation |
Work started May 2014 with an estimated completion date of September 2016.
Financing is from University Housing.
P R O J E c T S c O M P L E T E DVera B. Baits houses ii renewal | Completed August 2013. Financed by
University Housing.
George Granger Brown memorial laboratories room 2514 renovation |
Completed January 2014. Financed by the College of Engineering.
Central Campus Area utility tunnel replacement | Completed
September 2013. Financed by utilities reserves.
Central power plant distributed Control System upgrades | Completed
July 2013. Financed by utilities reserves.
Chemistry Building, Willard henry dow laboratory, and Alexander G.
ruthven museums Building renovation for Army, navy, and Air force
officer education programs relocation | Completed May 2014. Financed
by investment proceeds.
College of pharmacy Building Basement and first floor renovations |
Completed September 2013. Financed by the College of Pharmacy.
dearborn fairlane Center renovations | Completed December 2013.
Financed by UM-Dearborn.
east hall renovation for department of psychology | Completed March
2014. Financed by the College of LSA.
east Quadrangle renovation | Completed July 2013. Financed by
University Housing, the College of LSA and investment proceeds.
flint Central energy plant Boiler replacement | Completed December
2013. Financed by UM-Flint.
flint northbank Center elevator replacement | Completed August 2013.
Financed by UM-Flint.
hutchins hall and William W. Cook legal research library law School
renovation phase ii | Completed July 2013. Financed by the Office of the
Provost and the Law School.
institute for Social research Addition | Completed March 2014. Financed by
an American Recovery and Reinvestment Act of 2009 grant from the National
Institutes of Health, the Office of the Provost, and the Institute for Social
Research.
the lawyers’ Club Building and john p. Cook Building renovation |
Completed July 2013. Financed by a gift, investment proceeds, and the
Lawyers Club.
lorch hall roof replacement | Completed October 2013. Financed by the
general fund.
martha Cook Building fire Suppression System installation |
Completed August 2013. Financed by University Housing.

20
14 A
NN
UA
L R
EP
OR
T In
dep
end
ent A
ud
itor’s R
epo
rt
4 3
The Regents of the University of Michigan
We have audited the accompanying financial statements of the University of Michigan (the “University”), as of and for the years ended June 30, 2014 and 2013 and the related notes to the financial statements which collectively comprise the statements of net position and the related statements of revenues, expenses and changes in net position and cash flows.
Management’s Responsibility for the Financial StatementsManagement is responsible for the preparation and fair presentation of these financial statements in accordance with accounting principles generally accepted in the United States of America; this includes the design, implementation, and maintenance of internal control relevant to the preparation and fair presentation of financial statements that are free from material misstatement, whether due to fraud or error.
Auditor’s ResponsibilityOur responsibility is to express an opinion on these financial statements based on our audits. We conducted our audits in accordance with auditing standards generally accepted in the United States of America. Those standards require that we plan and perform the audit to obtain reasonable assurance about whether the financial statements are free from material misstatement.
An audit involves performing procedures to obtain audit evidence about the amounts and disclosures in the financial statements. The procedures selected depend on our judgment, including the assessment of the risks of material misstatement of the financial statements, whether due to fraud or error. In making those risk assessments, we consider internal control relevant to the University’s preparation and fair presentation of the financial statements in order to design audit procedures that are appropriate in the circumstances, but not for the purpose of expressing an opinion on the effectiveness of the University’s internal control. Accordingly, we express no such opinion. An audit also includes evaluating the appropriateness of accounting policies used and the reasonableness of significant accounting estimates made by management, as well as evaluating the overall presentation of the financial statements. We believe that the audit evidence we have obtained is sufficient and appropriate to provide a basis for our audit opinion.
PricewaterhouseCoopers LLP, One Detroit Center, 500 Woodward Avenue, Detroit, MI 48226T: (313) 394 6000, F: (313) 394 6555 www.pwc.com/us
I n d e p e n d e n t A u d I t o r ’ s r e p o r t
The management of the University of Michigan (the “University”) is responsible for the preparation, integrity, and fair presentation of the consolidated financial statements. The financial statements, presented on pages 62 to 87, have been prepared in conformity with accounting principles generally accepted in the United States of America and, as such, include amounts based on judgments and estimates by management.
The consolidated financial statements have been audited by the independent accounting firm PricewaterhouseCoopers LLP, which was given unrestricted access to all financial records and related data, including minutes of all meetings of the Board of Regents. The University believes that all representations made to the independent auditors during their audit were valid and appropriate. PricewaterhouseCoopers’ audit opinion is presented on pages 43–44.
The University maintains a system of internal controls over financial reporting, which is designed to provide reasonable assurance to the University’s management and Board of Regents regarding the preparation of reliable published financial statements. Such controls are maintained by the establishment and communication of accounting and financial policies and procedures, by the selection and training of qualified personnel, and by an internal audit program designed to identify internal control weakness in order to permit management to take appropriate corrective action on a timely basis. There are, however, inherent limitations in the effectiveness of any system of internal control, including the possibility of human error and the circumvention of controls.
The Board of Regents, through its Finance, Audit and Investment Committee, is responsible for engaging the independent auditors and meeting regularly with management, internal auditors, and the independent auditors to ensure that each is carrying out their responsibilities and to discuss auditing, internal control, and financial reporting matters. Both internal auditors and the independent auditors have full and free access to the Finance, Audit and Investment Committee.
Based on the above, I certify that the information contained in the accompanying financial statements fairly presents, in all material respects, the financial condition, changes in net position and cash flows of the University.
Douglas Strong Interim Executive Vice President and Chief Financial Officer
September 18, 2014
m A n A g e m e n t r e s p o n s I b I l I t y f o r f I n A n c I A l s t A t e m e n t s
20
14 A
NN
UA
L R
EP
OR
T M
an
agem
ent R
espo
nsib
ility
4 2

20
14 A
NN
UA
L R
EP
OR
T M
an
agem
ent’s D
iscussio
n a
nd
An
aly
sis
4 5
20
14 A
NN
UA
L R
EP
OR
T In
dep
end
ent A
ud
itor’s R
epo
rt
4 4
OpinionIn our opinion, the financial statements referred to above present fairly, in all material respects, the financial position of the University at June 30, 2014 and 2013, and the changes in financial position and cash flows thereof for the years then ended in accordance with accounting principles generally accepted in the United States of America.
Other MattersThe accompanying management’s discussion and analysis on pages 45 through 61 is required by accounting principles generally accepted in the United States of America to supplement the basic financial statements. Such information, although not a part of the basic financial statements, is required by the Governmental Accounting Standards Board who considers it to be an essential part of financial reporting for placing the basic financial statements in an appropriate operational, economic, or historical context. We have applied certain limited procedures to the required supplementary information in accordance with auditing standards generally accepted in the United States of America, which consisted of inquiries of management about the methods of preparing the information and comparing the information for consistency with management’s responses to our inquiries, the basic financial statements, and other knowledge we obtained during our audits of the basic financial statements. We do not express an opinion or provide any assurance on the information because the limited procedures do not provide us with sufficient evidence to express an opinion or provide any assurance.
September 18, 2014
M A n A g e M e n t ’ s d I s c u s s I o n A n d A n A l y s I s ( U N A U d i T E d )
i N T R O d U c T i O N
The following discussion and analysis provides an overview of the financial position of the University of Michigan (the “University”) at June 30, 2014 and 2013 and its activities for the three fiscal years ended June 30, 2014. This discussion has been prepared by management and should be read in conjunction with the financial statements and the notes thereto, which follow this section.
The University is a comprehensive public institution of higher learning with over 61,000 students and approximately 7,600 faculty members on three campuses in southeast Michigan. The University offers a diverse range of degree programs from baccalaureate to post-doctoral levels through 19 schools and colleges, and contributes to the state and nation through related research and public service programs. The University also has a nationally renowned health system which includes three hospitals, 40 health centers, more than 120 outpatient clinics, the University’s Medical School and Michigan Health Corporation, a wholly-owned corporation created to pursue joint venture and managed care initiatives. The University, in total, employs over 44,000 permanent employees and approximately 14,000 temporary staff.
The University consistently ranks among the nation’s top universities by various measures of quality, both in general academic terms, and in terms of strength of offerings in specific academic disciplines and professional subjects. Research is central to the University’s mission and a key aspect of its strong reputation among educational institutions. The University is widely recognized for the breadth and excellence of its research enterprise as well as for the exceptional level of cooperation across disciplines, which allows faculty and students to address the full complexity of real-world challenges. The University’s Health System also has a tradition of excellence in teaching, advancement of medical science and patient care, consistently ranking among the best health care systems in the nation.
F i N A N c i A L H i g H L i g H T s
The University’s financial position remains strong, with assets of $18.2 billion and liabilities of $5.1 billion at June 30, 2014, compared to assets of $16.4 billion and liabilities of $4.9 billion at June 30, 2013. Net position, which represents the residual interest in the University’s assets after liabilities are deducted, totaled $13.1 billion at June 30, 2014 as compared to $11.5 billion at June 30, 2013. Changes in net position represent the University’s results of operations and are summarized for the years ended June 30, 2014 and 2013 as follows:
(in millions) 2014 2013Operating revenues and educational appropriations $ 5,900.6 $ 5,676.4Private gifts for operating activities 166.4 168.6Operating and net interest expenses (6,428.0) (6,162.1) (361.0) (317.1)Net investment income 1,653.8 847.3Endowment and capital gifts/grants and other 282.2 199.7Increase in net position $ 1,575.0 $ 729.9
Net position increased $1.6 billion in fiscal 2014 after an increase of $730 million in fiscal 2013 primarily due to increases in net investment income which totaled $1.7 billion and $847 million in 2014 and 2013, respectively.

20
14 A
NN
UA
L R
EP
OR
T M
an
agem
ent’s D
iscussio
n a
nd
An
aly
sis
4 7
20
14 A
NN
UA
L R
EP
OR
T M
an
agem
ent’s D
iscussio
n a
nd
An
aly
sis
4 6
M A n A g e M e n t ’ s d I s c u s s I o n A n d A n A l y s I s ( U N A U d i T E d )
In 2014, operating revenues and educational appropriations increased 3.9 percent, or $224 million, while total operating and net interest expenses increased 4.3 percent, or $266 million. As a result of the Victors for Michigan campaign which was launched in November 2013, endowment and capital gifts increased significantly in 2014.
The results of operations reflect the University’s focus on maintaining its national standards academically, in research and in health care within a competitive recruitment environment for faculty and health care professionals and a period of reduced federal funding for research. At the same time, the University is addressing constrained state appropriations and rising health care, regulatory and facility costs with aggressive cost cutting and productivity gains to help preserve access to affordable higher education for Michigan families. To achieve aggressive and sustainable long-term goals for cost cutting and productivity gains, the University is also strategically utilizing resources to bridge cuts and support enterprise-wide information technology projects and other initiatives.
The University’s long-term investment strategy combined with its endowment spending policy serves to insulate operations from expected volatility in the capital markets and provide for a stable and predictable level of spending distributions from the endowment. Endowment spending rate distributions to University units totaled $277 million and $270 million in 2014 and 2013, respectively. The success of the University’s long-term investment strategy is evidenced by strong returns over sustained periods of time and the ability to limit losses in the face of challenging markets.
The University invests its financial assets in pools with distinct risk and liquidity characteristics based on its needs, with most of its financial assets invested in two such pools. The University’s working capital is primarily invested in relatively short duration, liquid assets, through its Daily and Monthly Portfolios, while the endowment is invested, along with the noncurrent portion of the insurance and benefit reserves, in an equity oriented long-term strategy, through its Long Term Portfolio.
U s i N g T H E F i N A N c i A L s TAT E m E N T s
The University’s financial report includes three financial statements: the Statement of Net Position; the Statement of Revenues, Expenses and Changes in Net Position; and the Statement of Cash Flows. These financial statements are prepared in accordance with Governmental Accounting Standards Board (“GASB”) principles, which establish standards for external financial reporting for public colleges and universities.
s TAT E m E N T O F N E T P O s i T i O N
The statement of net position presents the financial position of the University at the end of the fiscal year and includes all assets and liabilities of the University. The difference between total assets and total liabilities — net position — is one indicator of the current financial condition of the University, while the change in net position is an indication of whether the overall financial condition has improved or worsened during the year. A comparison of the University’s assets, liabilities and net position at June 30, 2014 and 2013 is summarized as follows:
(in millions) 2014 2013Current assets $ 2,317 $ 2,153Noncurrent assets: Endowment, life income and other investments 10,053 8,674 Capital assets, net 5,467 5,369 Other 358 237 Total assets 18,195 16,433 Current liabilities 1,530 1,397Noncurrent liabilities 3,607 3,553 Total liabilities 5,137 4,950 Net position $ 13,058 $ 11,483
The University continues to maintain and protect its strong financial foundation. This financial health, as reflected in the statement of net position at June 30, 2014 and 2013, results from the prudent utilization of financial resources including careful cost controls, preservation of endowment funds, conservative utilization of debt and adherence to a long-range capital plan for the maintenance and replacement of the physical plant.
Current assets consist primarily of cash and cash equivalents, operating and capital investments and accounts receivable and totaled $2.3 billion and $2.2 billion at June 30, 2014 and 2013, respectively. Cash, cash equivalents and investments for operating activities totaled $1.0 billion at June 30, 2014, which represents approximately two months of total expenses excluding depreciation.
Current liabilities consist primarily of accounts payable, accrued compensation, unearned revenue, commercial paper, the current portion of bonds payable and net long-term bonds payable subject to remarketing. Current liabilities totaled $1.5 billion and $1.4 billion at June 30, 2014 and 2013, respectively.

20
14 A
NN
UA
L R
EP
OR
T M
an
agem
ent’s D
iscussio
n a
nd
An
aly
sis
4 9
20
14 A
NN
UA
L R
EP
OR
T M
an
agem
ent’s D
iscussio
n a
nd
An
aly
sis
4 8
M A n A g e M e n t ’ s d I s c u s s I o n A n d A n A l y s I s ( U N A U d i T E d )
E N d O w m E N T, L i F E i N c O m E A N d O T H E R i N v E s T m E N T s
The composition of the University’s endowment, life income and other investments at June 30, 2014 and 2013 is summarized as follows:
(in millions) 2014 2013Endowment investments $ 9,731 $ 8,382Life income investments 119 111Noncurrent portion of insurance and benefits obligations investments 203 181 $ 10,053 $ 8,674
The University’s endowment funds consist of both permanent endowments and funds functioning as endowment. Permanent endowments are those funds received from donors with the stipulation that the principal remain inviolate and be invested in perpetuity to produce income that is to be expended for the purposes specified by the donors. Funds functioning as endowment consist of amounts (restricted gifts or unrestricted funds) that have been allocated by the University for long-term investment purposes, but are not limited by donor stipulations requiring the University to preserve principal in perpetuity. Programs supported by endowment funds include scholarships, fellowships, professorships, research efforts and other important programs and activities.
The University uses its endowment funds to support operations in a way that strikes a balance between generating a predictable stream of annual support for current needs and preserving the purchasing power of the endowment funds for future periods. The major portion of the endowment is maintained in the University Endowment Fund, a unitized pool which represents a collection of approximately 8,500 separate (individual) funds, the majority of which are restricted for specific purposes. The University Endowment Fund is invested in the University’s Long Term Portfolio, a single diversified investment pool.
The endowment spending rule provides for distributions from the University Endowment Fund to the units that benefit from the endowment fund. Commencing with the quarter ending September 30, 2010, the annual distribution rate began to be reduced from 5 percent of the one-quarter lagged seven year moving average fair value of University Endowment Fund shares to 4.5 percent. To avoid negative impacts of this change on near-term budgets, endowment distributions were managed toward the new rate by keeping quarter to quarter distributions per share unchanged and gradually moving toward the 4.5 percent rate when increases in share value would otherwise result in higher per share distributions. The University reached the 4.5 percent target rate as of December 31, 2013. This change is one element of an ongoing financial management strategy that has allowed the University to effectively weather the challenging economic environment while avoiding measures taken by many of our peer institutions, such as faculty hiring freezes, furloughs, program cuts or halting construction.
To protect endowment principal in the event of a prolonged market downturn, distributions are limited to 5.3 percent of the current fair value of fund shares. Any capital gains or income generated above the endowment spending rate are reinvested so that in lean times funds will be available for distribution. In addition, departments may also use withdrawals from funds functioning as endowment to support capital expenditures and operations.
Endowment spending rate distributions totaled $283 million, $276 million and $270 million and withdrawals from funds functioning as endowment totaled $137 million, $24 million and $39 million in 2014, 2013 and 2012, respectively. Total spending rate distributions combined with withdrawals from funds functioning as endowment averaged 6.0 percent, 4.8 percent and 5.2 percent of the current year average fair value of the University Endowment Fund for 2014, 2013 and 2012, respectively. Over the past ten years, total spending rate distributions combined with withdrawals from funds functioning as endowment averaged 5.2 percent.
c A P i TA L A N d d E b T A c T i v i T i E s
One of the critical factors in continuing the quality of the University’s academic, research and clinical programs is the development and renewal of capital assets. The University continues to implement its long-range plan to modernize its complement of older facilities, along with balanced investment in new construction.
Capital asset additions totaled $590 million in 2014, as compared to $519 million in 2013. Capital asset additions primarily represent renovation and new construction of student residence, academic, research, clinical and athletic facilities, as well as significant investments in equipment, including information technology. Current year capital asset additions were primarily funded with net position and gifts designated for capital purposes of $504 million, as well as debt proceeds of $86 million. Construction in progress, which totaled $271 million at June 30, 2014 and $328 million at June 30, 2013, includes important projects for student residential life, research, instruction, patient care and athletics.
Projects completed in 2014 include renovation and expansion of the George Granger Brown Memorial Laboratories and Institute for Social Research (ISR) buildings, construction of the Northville Health Center facility, and renovation of graduate and undergraduate student residences.
Originally constructed in 1958, the George Granger Brown Memorial Laboratories building, which houses the Department of Mechanical Engineering, was expanded by 62,500 gross square feet to add research laboratories and offices for faculty and graduate students to support emerging research endeavors. Designed to support interdisciplinary collaboration within the University and with other academic institutions and industry, the expansion also provides spaces to enhance the ability to realize ultra-high-resolution measurements at molecular and atomic scales to enable researchers to study the forces at work at the smallest scales and advance nanotechnologies in energy, manufacturing, healthcare and biotechnology.
The ISR building, which was originally constructed in 1965, was expanded by 56,700 gross square feet with a five-level addition and renovation of 12,800 square feet of the existing building. The additional space was needed to address ISR’s continued growth in programs and projects and enhance existing space configurations and technological infrastructure to promote collaborations for increasingly interdisciplinary social science research. As ISR’s traditional social science research portfolio has expanded to include the collection and analysis of environmental factors and biometric and biological data, the new addition includes basement-level secure storage facilities for biospecimens and secure data enclaves. This expansion was funded in part by a grant from the National Institutes of Health, awarded as part of the American Recovery and Reinvestment Act.
The Northville Health Center facility was constructed pursuant to the terms of a 25-year capital lease in western Wayne County as part of the Health System’s strategic plan to attract patients from outside its local market area of Washtenaw and Livingston counties. The expanded clinical programs made possible by this new 100,000 square foot facility, which offers primary and specialty care, will support the Health System’s near-by Livonia Center for Specialty Care and improve overall market share. The site will also accommodate future expansion. Renovation of student residences in East Quadrangle, the Lawyers Club building and the John P. Cook building was also completed in 2014. The infrastructure of these student residences was thoroughly upgraded, including wireless high-speed network access, accessibility improvements, renovated bath facilities and new plumbing, heating, cooling, ventilation, fire detection and suppression systems. In addition, energy conservation measures were implemented to improve the energy performance of the overall buildings.
The renovation of East Quadrangle, which was originally constructed in 1940, is part of the University’s residential life initiatives and follows extensive renovations to Alice Lloyd, Mosher Jordan, Stockwell and Couzens residence halls in previous years. This project also improved dining and Residential College facilities as well as added new spaces for living-learning initiatives, student interaction and community. The Lawyers Club and John P. Cook buildings comprise the student-housing portion of the Law Quadrangle and were opened in 1924 and 1931, respectively. One of the largest gifts ever made to the Law School helped to revitalize these student living spaces and create a sense of community, while preserving the historic collegiate gothic exteriors. In honor of the gift, the north wing of the Lawyers Club is now called the Charles T. Munger Residences.

20
14 A
NN
UA
L R
EP
OR
T M
an
agem
ent’s D
iscussio
n a
nd
An
aly
sis
5 1
20
14 A
NN
UA
L R
EP
OR
T M
an
agem
ent’s D
iscussio
n a
nd
An
aly
sis
5 0
M A n A g e M e n t ’ s d I s c u s s I o n A n d A n A l y s I s ( U N A U d i T E d )
Construction in progress at June 30, 2014 includes the next phase of residential life initiatives and construction of a new residential facility for graduate students. Renovation of South Quadrangle, which was originally constructed in 1951, is expected to be completed in August 2014 and continues the work of the University’s planned capital program to improve university housing and dining facilities and strengthen the connection between living and learning on campus. One of the largest gifts ever made to the University is funding the construction and furnishing of a new state-of-the-art residence designed to foster a community where graduate students from multiple disciplines can live and exchange ideas in a unique high-density residential-academic arrangement. The eight-story Munger Graduate Residence will include approximately 380,000 gross square feet and accommodate approximately 630 students in an apartment- style layout. Construction is scheduled to be completed in summer 2015.
The University takes its financial stewardship responsibility seriously and works diligently to manage its financial resources effectively, including the prudent use of debt to finance capital projects. A strong debt rating is an important indicator of the University’s success in this area. In February 2014, Moody’s Investors Service, Inc. (“Moody’s”) affirmed its highest credit rating (Aaa) for bonds backed by a broad revenue pledge based on extremely strong credit fundamentals, including significant financial resources, strong market position and consistent operating performance derived from a well diversified revenue base. Standard & Poor’s Ratings Services (“Standard & Poor’s”) also affirmed its highest credit rating (AAA) based on the University’s national reputation for academic and research excellence, strong financial resources, positive financial performance, exceptional record of fundraising and manageable debt burden and capital plan. Only three other public universities have received the highest credit ratings from both Moody’s and Standard & Poor’s.
Long-term debt activity for the year ended June 30, 2014 is summarized as follows:
Beginning Ending(in millions) Balance Additions Reductions BalanceCommercial paper $ 55 $ 2 $ 16 $ 41Bonds 1,752 101 59 1,794 $ 1,807 $ 103 $ 75 $ 1,835
The University utilizes commercial paper, backed by a general revenue pledge, to provide interim financing for its capital improvement program. Outstanding commercial paper is converted to long-term debt financing as appropriate, within the normal course of business. Outstanding bonds are supported by the university’s general revenues.
During 2014, consistent with capital and debt financing plans, the University issued $92 million of fixed rate, tax-exempt, general revenue bonds, with a net original issue premium of $9 million. Total bond proceeds of $101 million were utilized for capital projects and debt issuance costs.
The University maintains a combination of fixed and variable rate debt, which totaled $1.8 billion at June 30, 2014 and 2013. The composition of the University’s debt at June 30, 2014 and 2013 is summarized as follows:
(in millions) 2014 2013Variable rate: Commercial paper $ 41 $ 55 Bonds 850 864Fixed rate bonds 944 888 $ 1,835 $ 1,807
A significant portion of the University’s variable rate bonds are subject to remarketing and, in accordance with GASB Interpretation No. 1, such debt is classified as current unless supported by long-term liquidity arrangements, such as lines of credit or standby bond purchase agreements, which could refinance the debt on a long-term basis. In the event that variable rate bonds are put back to the University by the debt holder, management believes that the bonds will be remarketed within a reasonable amount of time. The University’s strong credit rating facilitates the remarketing of its debt. In addition, the University maintains four remarketing agents to achieve a wide distribution of its variable rate debt.
While fixed rate bonds typically have a higher effective rate of interest as compared to variable rate bonds, they reduce the volatility of required debt service payments and do not require liquidity support, such as letters of credit or guarantees.
Effective interest rates averaged 2.1 percent in 2014 and 2.2 percent in 2013, including the federal subsidies for interest on taxable Build America Bonds. In 2014, interest expense includes the write-off of unamortized bond issuance costs of $8 million as required by the adoption of GASB Statement No. 65, Items Previously Reported as Assets and Liabilities (“GASB 65”). Interest expense net of federal subsidies received for interest on taxable Build America Bonds and interest capitalized during construction totaled $47 million in 2014 and $41 million in 2013, while capitalized interest on debt financed construction in progress totaled $2 million in 2013. There was no interest capitalized in 2014.
O b L i g AT i O N s F O R P O s T E m P L O y m E N T b E N E F i T s
In accordance with GASB Statement No. 45, Accounting and Financial Reporting by Employers for Postemployment Benefits Other than Pensions, the University recognizes the cost of postemployment benefits during the periods when employees render their services. Using current actuarial assumptions, and presuming a continuation of the current level of benefits, the University’s obligations for postemployment benefits totaled $1.73 billion and $1.70 billion at June 30, 2014 and 2013, respectively. Since a portion of retiree medical services will be provided by the University’s Health System, this liability is net of the related margin and fixed costs of providing those services which totaled $303 million and $290 million at June 30, 2014 and 2013, respectively.
By implementing a series of health benefit initiatives over the past nine years, the University has favorably impacted its actuarial accrued liability for postemployment benefits by approximately $586 million as of June 30, 2014. These initiatives have included cost sharing changes, elimination of Medicare Part B reimbursements for certain retirees and adjustment of retirement eligibility criteria. The University amortizes changes in actuarial assumptions, plan design and experience gains and losses over a ten year closed period. Accordingly, the liability for net postemployment benefits obligations recorded in the statement of net position differs from the actuarial accrued liability by the unamortized portion of these changes. At June 30, 2014, the recorded liability for net postemployment benefits obligations totaled $1.73 billion and the actuarial accrued liability totaled $1.46 billion.

20
14 A
NN
UA
L R
EP
OR
T M
an
agem
ent’s D
iscussio
n a
nd
An
aly
sis
5 3
20
14 A
NN
UA
L R
EP
OR
T M
an
agem
ent’s D
iscussio
n a
nd
An
aly
sis
5 2
M A n A g e M e n t ’ s d I s c u s s I o n A n d A n A l y s I s ( U N A U d i T E d )
N E T P O s i T i O N
Net position represents the residual interest in the University’s assets after liabilities are deducted. The composition of the University’s net position at June 30, 2014 and 2013 is summarized as follows:
(in millions) 2014 2013Net investment in capital assets $ 3,698 $ 3,637Restricted: Nonexpendable: Permanent endowment corpus 1,535 1,432 Expendable: Net appreciation of permanent endowments 1,725 1,339 Funds functioning as endowment 2,008 1,748 Restricted for operations and other 739 602Unrestricted 3,353 2,725 $ 13,058 $ 11,483
Net investment in capital assets represents the University’s capital assets net of accumulated depreciation and outstanding principal balances of debt related to the acquisition, construction or improvement of those assets. The $61 million increase reflects the University’s continued development and renewal of its capital assets in accordance with its long-range capital plan.
Restricted nonexpendable net position represents the historical value (corpus) of gifts to the University’s permanent endowment funds. The $103 million increase primarily represents new gifts. Restricted expendable net position is subject to externally imposed stipulations governing their use. This category of net position includes net appreciation of permanent endowments, funds functioning as endowment and net position restricted for operations, facilities and student loan programs. Restricted expendable net position totaled $4.5 billion at June 30, 2014, as compared to $3.7 billion at June 30, 2013. The increase of approximately $800 million is primarily driven by new gifts and strong investment returns.
Although unrestricted net position is not subject to externally imposed stipulations, all of the University’s unrestricted net position has been designated for various academic and research programs and initiatives, as well as capital projects. Unrestricted net position at June 30, 2014 and 2013 totaled $3.4 billion and $2.7 billion, respectively. At June 30, 2014, unrestricted net position included funds functioning as endowment of $4.3 billion offset by unfunded obligations for postemployment benefits of $1.7 billion. At June 30, 2013, unrestricted net position included funds functioning as endowment of $3.7 billion offset by unfunded obligations for postemployment benefits of $1.7 billion. Unrestricted net position also includes other net resources which totaled approximately $800 million and $700 million at June 30, 2014 and 2013, respectively.
s TAT E m E N T O F R E v E N U E s , E x P E N s E s A N d c H A N g E s i N N E T P O s i T i O N
The statement of revenues, expenses and changes in net position presents the University’s results of operations. In accordance with GASB reporting principles, revenues and expenses are classified as either operating or nonoperating. A comparison of the University’s revenues, expenses and changes in net position for the three years ended June 30, 2014 is summarized as follows:
One of the University’s greatest strengths is the diverse streams of revenue that supplement its student tuition and fees, including private support from individuals, foundations and corporations, along with government and other sponsored programs, state appropriations and investment income. The University continues to aggressively seek funding from all possible sources consistent with its mission in order to supplement student tuition and prudently manage the financial resources realized from these efforts to fund its operating activities, which include instruction, patient care and research.
The following is a graphic illustration of revenues by source, both operating and nonoperating, which are used to fund the University’s operating activities for the year ended June 30, 2014 (amounts are presented in thousands of dollars). Certain recurring sources of the University’s revenues are considered nonoperating, as defined by GASB, such as state appropriations, distributions from investments, private gifts and federal Pell grants.
(in millions) 2014 2013 2012Operating revenues: Student tuition and fees, net of scholarship allowances $ 1,107.6 $ 1,064.7 $ 998.4 Sponsored programs 1,027.6 1,076.0 1,045.8 Patient care revenues, net 3,001.3 2,786.1 2,601.8 Other 398.4 390.5 392.6 5,534.9 5,317.3 5,038.6Operating expenses 6,381.3 6,121.0 5,842.1 Operating loss (846.4) (803.7) (803.5) Nonoperating and other revenues (expenses): State educational appropriations 321.7 315.9 307.6 Federal Pell grants 44.0 43.2 45.3 Private gifts for operating activities 166.4 168.6 131.6 Net investment income 1,653.8 847.3 68.7 Interest expense, net (54.2) (49.3) (45.1) Federal subsidies for interest on Build America Bonds 7.5 8.2 8.3 Endowment and capital gifts and grants 297.7 212.1 107.6 Other (15.5) (12.4) 8.4 Nonoperating and other revenues, net 2,421.4 1,533.6 632.4 Increase (decrease) in net position 1,575.0 729.9 (171.1) Net position, beginning of year 11,483.1 10,753.2 10,924.3Net position, end of year $ 13,058.1 $ 11,483.1 $ 10,753.2

20
14 A
NN
UA
L R
EP
OR
T M
an
agem
ent’s D
iscussio
n a
nd
An
aly
sis
5 5
20
14 A
NN
UA
L R
EP
OR
T M
an
agem
ent’s D
iscussio
n a
nd
An
aly
sis
5 4
Tuition and state appropriations are the primary sources of funding for the University’s academic programs. There is a relationship between the growth or reduction in state support and the University’s ability to restrain tuition fee increases. Together, net student tuition and fees and state appropriations increased 4 percent, or $49 million, to $1.43 billion in 2014, as compared to 6 percent, or $75 million, to $1.38 billion in 2013.
The University has been able to avoid the severe cuts and double digit tuition increases experienced elsewhere in the country because of a prudent long-term plan which anticipated the realities of the state’s challenging economy. The University’s plan includes an ongoing commitment to cost containment and reallocating resources to the highest priorities to provide support for innovative new academic initiatives to maintain academic excellence and help students keep pace with the evolving needs of society.
In 2014, the University’s state educational appropriations increased by 2 percent, or $6 million, to $322 million. In 2013, the University’s state educational appropriations increased by 3 percent, or $8 million, to $316 million. This followed a year when the University received the largest cut in state appropriations in its history, a 15 percent, or $54 million reduction in 2012.
For the three years ended June 30, 2014, net student tuition and fees revenue consisted of the following components:
(in millions) 2014 2013 2012Student tuition and fees $ 1,405.3 $ 1,349.1 $ 1,269.7Scholarship allowances (297.7) (284.4) (271.3) $ 1,107.6 $ 1,064.7 $ 998.4
In 2014, net student tuition and fees revenue increased 4 percent, or $43 million, to $1.11 billion, which reflects a 4 percent, or $56 million, increase in gross tuition and fee revenues offset by a 5 percent, or $13 million increase in scholarship allowances. Tuition rate increases in 2014 were 1.1 percent for resident undergraduate students, 3.2 percent for nonresident undergraduate students and 1.8 percent for most graduate students on the Ann Arbor campus, with a 3.5 percent tuition rate increase for most undergraduate and graduate students on the Dearborn campus and 3.5 percent and 3.0 percent tuition rate increases for undergraduate and graduate students on the Flint campus, respectively. The University also experienced moderate growth in the number of students, particularly nonresident students.
In 2013, net student tuition and fees revenue increased 7 percent, or $66 million, to $1.06 billion, which reflects a 6 percent, or $79 million, increase in gross tuition and fee revenues offset by a 5 percent, or $13 million increase in scholarship allowances. Tuition rate increases in 2013 were 2.8 percent for resident undergraduate students, 3.5 percent for nonresident undergraduate students and 3.0 percent for most graduate students on the Ann Arbor campus, with a 3.7 percent tuition rate increase for most undergraduate and graduate students on the Dearborn campus and 3.6 percent and 2.8 percent tuition rate increases for undergraduate and graduate students on the Flint campus, respectively. The University also experienced moderate growth in the number of students, particularly nonresident students.
The University’s tuition increases have consistently been among the lowest in the state, even in years of significant reductions in state appropriations, which reflects a commitment to affordable higher education for Michigan families. At the same time, the University has also increased scholarship and fellowship expenses and related allowances to benefit students in financial need.
While tuition and state appropriations fund a large percentage of University costs, private support is becoming increasingly essential to the University’s academic distinction. Private gifts for other than capital and permanent endowment purposes totaled $166 million in 2014, as compared to $169 million in 2013 and $132 million in 2012.
M A n A g e M e n t ’ s d I s c u s s I o n A n d A n A l y s I s ( U N A U d i T E d )
OPERATING RE VENUES$5,534,882 84%
F i s c A L y E A R 2 0 1 4 Revenues for Operating Activities
F i s c A L y E A R 2 0 1 4 Revenues for Operating Activities
Excluding Revenues from the University’s Health Systemand Other Clinical Activities
STUDENT RESIDENCES AND OTHER AUXILIARY ENTERPRISES$271,823 4%
NONOPERATING RE VENUES$1,079,914 16%
PATIENT CARE RE VENUES$3,001,292 45%
SALES AND SERVICES OF EDUCATIONAL DEPARTMENTS AND OTHER INCOME$126,594 2%
NET STUDENT TUITION AND FEES$1,107,557 17%
NONGOVERNMENTAL SPONSORED PROGRAMS$165,711 3%
FEDERAL, STATE AND LOCAL GRANTS AND CONTRAC TS$861,905 13%
NONOPERATING RE VENUES$999,540 28%
OPERATING RE VENUES$2,533,590 72%
FEDERAL, STATE AND LOCAL GRANTS AND CONTRAC TS$861,905 24%
NET STUDENT TUITION AND FEES$1,107,557 31%
STUDENT RESIDENCES AND OTHER AUXILIARY ENTERPRISES$271,823 8%
SALES AND SERVICES OF EDUCATIONAL DEPARTMENTS AND OTHER INCOME$126,594 4%
NONGOVERNMENTAL SPONSORED PROGRAMS$165,711 5%
STATE APPROPRIATIONS$321,681 9%
DISTRIBUTIONS FROM INVESTMENTS$474,344 13%
PRIVATE GIFTS$159,5285%
FEDERAL PELL GRANTS$43,987 1%
STATE APPROPRIATIONS$321,681 5%
DISTRIBUTIONS FROM INVESTMENTS$547,851 8%
PRIVATE GIFTS$166,395 2%
FEDERAL PELL GRANTS$43,987 1%
The University measures its performance both for the University as a whole and for the University without its Health System and other clinical activities. The exclusion of these activities allows a clearer view of the operations of the schools and colleges, as well as central administration. The following is a graphic illustration of University revenues by source, both operating and nonoperating, which are used to fund operating activities other than the Health System and other clinical activities, for the year ended June 30, 2014 (amounts are presented in thousands of dollars).
20
14 A
NN
UA
L R
EP
OR
T M
an
agem
ent’s D
iscussio
n a
nd
An
aly
sis
5 7
20
14 A
NN
UA
L R
EP
OR
T M
an
agem
ent’s D
iscussio
n a
nd
An
aly
sis
5 6
M A n A g e M e n t ’ s d I s c u s s I o n A n d A n A l y s I s ( U N A U d i T E d )
The University receives revenues for sponsored programs from various government agencies and private sources, which normally provide for both direct and indirect costs to perform these sponsored activities, with a significant portion related to federal research. Revenues for sponsored programs decreased 4 percent, or $48 million, to $1.0 billion in 2014, which reflects the ongoing impact of sequestration and continued competitive pressure associated with obtaining federally sponsored funds, offset somewhat by increased revenue from industry sponsored activities. Revenues for sponsored programs increased 3 percent, or $30 million, to $1.1 billion in 2013, consistent with the national trend of stabilized federal research funding, supplemented by increased revenue from industry sponsored activities.
Patient care revenues are principally generated within the University’s hospitals and ambulatory care facilities under contractual arrangements with governmental payers and private insurers. Patient care revenues increased 8 percent, or $215 million, to $3.0 billion in 2014, as compared to an increase of 7 percent, or $184 million, to $2.8 billion in 2013. The increased revenues for both years primarily resulted from growth in outpatient and inpatient volume, as well as an increase in revenue per patient case resulting from a combination of favorable changes in payment rates, case mix improvements and payer mix changes.
Net investment income totaled $1.7 billion in 2014, compared to $847 million in 2013 and $69 million in 2012. Consistent with recent trends, the returns in 2014 remained strong in developed market equities, absolute return strategies and all alternative asset classes. In addition, the fixed income asset class which experienced small losses in 2013 achieved double digit returns in the current year. In 2012, fixed income had strong returns which more than offset losses in the University’s equity oriented investments.
Endowment and capital gifts and grants totaled $298 million in 2014 as compared to $212 million and $108 million in 2013 and 2012, respectively, with the significant increase in 2014 and 2013 due primarily to capital gifts. Private gifts for permanent endowment purposes totaled $89 million in 2014, as compared to $78 million in 2013 and $56 million in 2012. Capital gifts and grants totaled $209 million in 2014, as compared to $134 million in 2013 and $52 million in 2012. Over the past three years, major capital gifts have been received in support of the University’s wide-ranging building initiatives which include graduate student housing, the Health System, Law School, Stephen M. Ross School of Business, College of Engineering and Intercollegiate Athletics current and planned capital projects.
In addition to revenue diversification, the University continues to make cost containment an ongoing priority. This is necessary as the University continues to face significant financial pressures, particularly in the areas of compensation and benefits, which represent 64 percent of total expenses, as well as in the areas of energy, technology and ongoing maintenance of facilities and infrastructure.
A comparative summary of the University’s expenses for the three years ended June 30, 2014 is as follows:
The University is committed to recruiting and retaining outstanding faculty and staff and the compensation package is one way to successfully compete with peer institutions and nonacademic employers. The resources expended for compensation and benefits increased 5 percent, or $186 million, to $4.2 billion in 2014, as compared to 4 percent, or $161 million, to $4.0 billion in 2013. Of the 2014 increase, compensation increased 5 percent, to $3.2 billion, and employee benefits increased 5 percent, to $947 million. For 2013, compensation increased 4 percent, to $3.1 billion, and employee benefits increased 4 percent, to $901 million. During 2014 and 2013, nursing and other health professionals were added to support higher patient volume levels associated with new activations including the Northville Health Center facility, which opened in 2014, and the C.S. Mott Children’s Hospital and Von Voigtlander Women’s Hospital, which opened in 2012.
Health care benefits are one of the most significant employee benefits. Over the past several years, the University has implemented initiatives to better control its rate of increase, encourage employees to choose the lowest cost health care plan that meets their needs and share a larger portion of health care cost increases with employees.
Compared to most employers, the University is in a unique position to utilize internal experts to advise and guide its health care and drug plans. For example, the Pharmacy Benefits Advisory Committee, which consists of internal experts including Health System physicians, School of Pharmacy faculty and an on-staff pharmacist, monitors the safety and effectiveness of covered medications as well as optimizes appropriate prescribing, dispensing and cost effective use of prescription drugs. The University also actively promotes and manages generic drug utilization and has achieved an 85 percent generic dispensing rate in 2014, as compared to 84 percent in 2013 and 82 percent in 2012.
In addition, the University utilizes its nationally recognized health policy experts to guide future health plan strategies. After careful review, a series of changes are being implemented to help the University maintain competitive active and retiree benefits while helping control the growth in costs.
During 2013, the University began to implement changes to eligibility requirements for retiree health benefits and the related amount of the University’s contributions. These changes are based on the work of a committee on retiree health benefits that was formed to propose a means to maintain competitive retiree health benefits while helping address the acceleration of health benefits costs for current and future retirees and their dependents. To assist current employees with the transition, these changes, which were originally announced in 2011, are being phased in gradually over the eight-year period January 1, 2013 through January 1, 2021.
Commencing January 1, 2013, the University utilizes a point system to determine retirement eligibility, where points represent the combination of age and years of service for full-time employees. The points needed for retirement total 76 in 2013 and will gradually be increased to 80 by 2021. During this time period, the University’s contributions towards health care benefits for employees who retire in each of these years will gradually be reduced. Employees who retire after December 31, 2020 will need a minimum of twenty years of service to receive the maximum retiree health benefit contribution. Specifically, the University’s contributions towards health care benefits will decrease from 87.5 percent for the retiree and 65 percent for any dependents for those employees who retire in 2013 to a maximum of 80 percent for the retiree and 50 percent for any dependents for those employees who retire in 2021. For new hires, the maximum University contribution upon retirement with twenty or more years of service will be 68 percent for the retiree and 26 percent for any dependents. These adjustments will keep the University’s retiree benefits competitive with peer institutions while producing an estimated $9 million reduction in annual cash outlay by 2020 and an estimated $165 million reduction in annual cash outlay by 2040.
During 2012, the University substantially completed a multi-year phase in of a new health benefits cost sharing program. When fully implemented in July 2014, the University’s overall contribution toward the health care of employees, retirees and dependents is expected to be close to 70 percent of the total cost of premiums, co-pays and deductibles. Down from an 80 percent overall contribution in 2009, the new target is more in line with average contributions of peer universities and health systems. In addition, the University’s health premium contribution for part-time employees working between 20 and 29 hours per week was reduced from 100 percent to 80 percent of the contribution made for full-time staff in the lowest salary band. Once fully implemented, these changes are expected to reduce the University’s annual cash outlay for health care expenses by approximately $31 million.
(in millions) 2014 2013 2012Operating: Compensation and benefits $ 4,150.8 64% $ 3,965.0 64% $ 3,804.3 65% Supplies and services 1,618.5 25 1,555.8 25 1,473.7 25 Depreciation 487.5 8 476.9 8 443.1 7 Scholarships and fellowships 124.5 2 123.3 2 121.0 2 6,381.3 99 6,121.0 99 5,842.1 99Nonoperating: Interest, net 46.7 1 41.1 1 36.8 1 $ 6,428.0 100% $ 6,162.1 100% $ 5,878.9 100%

20
14 A
NN
UA
L R
EP
OR
T M
an
agem
ent’s D
iscussio
n a
nd
An
aly
sis
5 9
20
14 A
NN
UA
L R
EP
OR
T M
an
agem
ent’s D
iscussio
n a
nd
An
aly
sis
5 8
M A n A g e M e n t ’ s d I s c u s s I o n A n d A n A l y s I s ( U N A U d i T E d )
The MHealthy initiative is a university-wide effort to improve the health and well-being of faculty, staff and their dependents by creating a culture of health, reducing health risks in our population and containing health related costs through prevention and early intervention. Over the past five years, more than 33,000 of the University’s employees participated in a health risk assessment, allowing them to learn more about their health risks and take action to improve them through follow-up programs and services. In 2014, biometric wellness screenings were offered on all campuses in addition to the annual health risk assessment and 18,000 employees completed a screening. MHealthy has also begun to provide special targeted health improvement programs to high-risk job families, including service maintenance and nursing. A three-year evaluation of the program’s impact was completed in 2012 by faculty researchers from the Michigan Institute for Clinical and Health Research and the University’s Health Management Research Center. Faculty and staff who participated all three years showed statistically significant improvement in their risk levels, with the number of high risk individuals decreasing and the number of low risk individuals increasing.
These initiatives and programs reflect the reality of the national landscape, while remaining true to the commitment we make to our employees for a robust benefits package.
Supplies and services expenses increased 4 percent, or $63 million, to $1.62 billion in 2014, as compared to an increase of 6 percent, or $82 million, to $1.56 billion in 2013. These increases were primarily due to growth in patient care related expenses as well as activation costs associated with significant capital projects. During 2014, the new Northville Health Center facility was placed in service and the University implemented several significant information technology systems, including the third phase of an electronic medical record and patient billing system.
Depreciation expense increased 2 percent, or $11 million, to $488 million in 2014, as compared to an increase of 8 percent, or $34 million, to $477 million in 2013. The increased depreciation expense is primarily related to the completion of current year capital projects, as well as the impact of a full year of depreciation for the capital projects completed during the prior year. Capital assets placed in service during 2014 include the renovations of East Quad and the Lawyers Club, the expansion of the ISR building and the Northville Health Center facility. Capital assets completed in 2013 include the renovation and expansion of Crisler Arena and the Michigan Memorial Phoenix Laboratory and in 2012 include a new facility for the C.S. Mott Children’s and Von Voigtlander Women’s Hospitals, renovation to Alice Lloyd Hall and the new William Davidson Player Development Center.
Net interest expense increased $6 million in 2014 to $47 million, from $41 million in 2013 and $37 million in 2012. The increase in 2014 primarily resulted from the write-off of unamortized bond issuance costs in connection with the adoption of GASB 65 offset by favorable changes in the underlying effective interest rates, while the increase in 2013 primarily resulted from a decrease in the amount of capitalized interest on debt financed construction due to decreased construction in process.
In addition to their natural (object) classification, it is also informative to review operating expenses by function. A comparative summary of the University’s expenses by functional classification for the three years ended June 30, 2014 is as follows:
Instruction expenses increased 3 percent, or $29 million in 2014, and 4 percent, or $32 million in 2013. This increase is consistent with the modest level of growth in the related revenue sources offset by cost containment efforts.
Research expenses decreased 6 percent or $41 million in 2014 and increased 4 percent, or $31 million in 2013, which reflects volatility from sequestration and intense competition for research dollars. To measure its total volume of research expenditures, the University considers research expenses, included in the above table, as well as research related facilities and administrative expenses, research initiative and start-up expenses and research equipment purchases. These amounts aggregated $1 billion in 2014 and 2013.
Patient care expenses increased 6 percent, or $173 million, in 2014 and 9 percent, or $221 million, in 2013. These increases are the result of additional expenses associated with the opening of the new health center facility in 2014 and children and women’s hospital facility in 2012, including costs of staffing, medical supplies and pharmaceuticals.
Total scholarships and fellowships provided to students aggregated $441 million in 2014, as compared to $426 million in 2013 and $411 million in 2012, an increase of 7 percent over the past two years. Tuition, housing and fees revenues are reported net of aid applied to students’ accounts, while amounts paid directly to students are reported as scholarship and fellowship expenses. Scholarships and fellowships for the three years ended June 30, 2014 are summarized as follows:
(in millions) 2014 2013 2012Operating: Instruction $ 953.9 15% $ 924.5 15% $ 892.5 15% Research 708.8 11 750.2 12 718.8 12 Public service 152.8 2 148.9 2 129.6 2 Institutional and academic support 542.9 8 530.8 9 504.5 9 Auxiliary enterprises: Patient care 2,925.0 46 2,752.5 44 2,532.4 43 Other 208.5 3 157.6 3 215.6 4 Operations and maintenance of plant 277.4 4 256.3 4 284.6 5 Depreciation 487.5 8 476.9 8 443.1 7 Scholarships and fellowships 124.5 2 123.3 2 121.0 2 6,381.3 99 6,121.0 99 5,842.1 99Nonoperating: Interest, net 46.7 1 41.1 1 36.8 1 $ 6,428.0 100% $ 6,162.1 100% $ 5,878.9 100%
(in millions) 2014 2013 2012Paid directly to students $ 124.5 $ 123.3 $ 121.0Applied to tuition and fees 297.7 284.4 271.3Applied to University Housing 18.6 18.0 19.0 $ 440.8 $ 425.7 $ 411.3

20
14 A
NN
UA
L R
EP
OR
T M
an
agem
ent’s D
iscussio
n a
nd
An
aly
sis
6 1
20
14 A
NN
UA
L R
EP
OR
T M
an
agem
ent’s D
iscussio
n a
nd
An
aly
sis
6 0
The following graphic illustrations present total expenses by function, with and without the University’s Health System and other patient care activities:
s TAT E m E N T O F c A s H F L O w s
The statement of cash flows provides additional information about the University’s financial results by reporting the major sources and uses of cash. A comparative summary of the statement of cash flows for the years ended June 30, 2014 and 2013 is as follows:
(in millions) 2014 2013Cash received from operations $ 5,562.4 $ 5,270.9Cash expended for operations (5,880.0) (5,575.2)Net cash used in operating activities (317.6) (304.3)Net cash provided by investing activities 102.8 64.0Net cash used in capital and related financing activities (434.9) (463.3)Net cash provided by noncapital financing activities 614.2 566.2 Net decrease in cash and cash equivalents (35.5) (137.4)Cash and cash equivalents, beginning of year 101.3 238.7Cash and cash equivalents, end of year $ 65.8 $ 101.3
Cash received from operations primarily consists of student tuition, sponsored program grants and contracts and patient care revenues. Significant sources of cash provided by noncapital financing activities, as defined by GASB, include state appropriations, federal Pell grants and private gifts used to fund operating activities.
E c O N O m i c F A c T O R s T H AT w i L L A F F E c T T H E F U T U R E
The University continues to face significant financial challenges to its academic programs, stemming from the State’s uncertain financial circumstances. Given the continuation of this difficult economic environment, it is noteworthy that the University maintains the highest credit ratings of Moody’s (Aaa) and Standard & Poor’s (AAA). Achieving and maintaining the highest credit ratings provides the University a high degree of flexibility in securing capital funds on the most competitive terms. This flexibility, along with ongoing efforts toward revenue diversification and cost containment, will enable the University to provide the necessary resources to support a consistent level of excellence in service to students, patients, the research community, the state and the nation.
A crucial element to the University’s future continues to be a strong relationship with the state of Michigan. Historically, there has been a connection between the growth, or reduction, of state support and the University’s ability to control tuition increases. Over the past several years, the University has successfully addressed the realities of the state’s difficult economy and, pursuant to a long-range plan, continues to work relentlessly to cut and mitigate operational costs in order to remain affordable and preserve access, while protecting the academic enterprise.
The University’s budget for 2015 anticipates a 5.8 percent increase in state educational appropriations, a 1.6 percent tuition rate increase for Ann Arbor campus resident undergraduates and a 17.0 percent increase in centrally awarded financial aid. Nonresident undergraduate tuition rates will increase 3.4 percent, while most graduate and professional rates will increase 2.4 percent. Resident undergraduate tuition rates on the Dearborn and Flint campuses will increase 3.2 and 3.0 percent, respectively.
While tuition and state appropriations fund a large percentage of academic costs, private support is becoming increasingly essential to the University’s academic distinction. In November 2013, the University launched the public phase of a major fundraising campaign with the announcement of an ambitious goal of $4 billion. The campaign, titled “Victors for Michigan”, is focused on raising funds for three priority areas of student support, engaged learning and bold ideas, in order to better prepare tomorrow’s leaders and address the complex problems facing the world. Since commencing the quiet phase of the campaign in 2011, the University has raised 57 percent of the goal, in cash, pledges and bequests. The campaign will continue through 2018.
The University continues to execute its long-range plan to modernize and expand its complement of older facilities while adding key new facilities for instruction, research, patient care and residential life. This strategy addresses the University’s growth and the continuing effects of technology on teaching, clinical and research activities. Authorized costs to complete construction and other projects totaled $1.24 billion at June 30, 2014. Funding for these projects is anticipated to include $1.12 billion from gifts, grants and net position designated for capital purposes as well as future borrowings, $77 million from the State Building Authority and $52 million from the utilization of unexpended debt proceeds.
In addition to strategic capital and technological investments, the University’s Health System is also focusing on clinical affiliation arrangements to enhance patient care, clinical research, physician recruitment and support services. During 2014, the Health System signed a letter of intent to affiliate with Allegiance Health Services, a community hospital and health care provider in Jackson County, and continued to strengthen relationships with current affiliated partners.
While the University’s Hospitals and Health Centers are well positioned to maintain a strong financial position in the near term, ongoing constraints on revenue are expected due to fiscal pressures from employers and federal and state governments. Management believes that much of the payment pressure can be offset by growth in patient volume and continued efforts to contain certain costs.
The University will continue to employ its long-term investment strategy to maximize total returns, at an appropriate level of risk, while utilizing a spending rate policy to preserve endowment capital and insulate the University’s operations from temporary market volatility.
As a labor-intensive organization, the University faces competitive pressures related to attracting and retaining faculty and staff. Moreover, consistent with the national landscape, the University also faces rising costs of health benefits for its employees and retirees. The University has successfully taken and will continue to take proactive steps to respond to these challenges while protecting the quality of the overall benefits package.
U.S. health care reform will also influence benefits planning. Since the Affordable Care Act was signed into law in March 2010, and affirmed by the Supreme Court, new regulatory requirements will affect health plans, providers and employers alike. The implementation of the changes has begun and will span several years into the future, with most changes taking place by 2015. University experts are diligently reviewing and assessing the short and long-term impacts on our health plans and our health system to develop clear strategies and options for the future that will ensure compliance over the coming years of regulatory change.
While it is not possible to predict the ultimate results, management believes that the University’s financial position will remain strong.
M A n A g e M e n t ’ s d I s c u s s I o n A n d A n A l y s I s ( U N A U d i T E d )
INTEREST1%
RESEARCH11%
SCHOLARSHIPS AND FELLOWSHIPS2%
AUXILIARY ENTERPRISES49% OPERATIONS AND
MAINTENANCE OF PLANT4%
INSTITUTIONAL AND ACADEMIC SUPPORT8%
DEPRECIATION8% INSTRUC TION
15%
PUBLIC SERVICE2%
INTEREST1%
RESEARCH20%
SCHOLARSHIPS AND FELLOWSHIPS4%
AUXILIARY ENTERPRISES6%
OPERATIONS AND MAINTENANCE OF PLANT8%
INSTITUTIONAL AND ACADEMIC SUPPORT16%
DEPRECIATION14%
INSTRUC TION27%
PUBLIC SERVICE4%
F i s c A L y E A R 2 0 1 4 Expenses by Function
F i s c A L y E A R 2 0 1 4 Expenses by Function
Excluding Expenses from the University’s Health System and Other Patient Care Activities

20
14 A
NN
UA
L R
EP
OR
T F
ina
ncia
l Sta
temen
ts
6 3
20
14 A
NN
UA
L R
EP
OR
T F
ina
ncia
l Sta
temen
ts
6 2
f I n A n c I A l s t A t e M e n t s c O N s O L i d AT E d s TAT E m E N T O F N E T P O s i T i O N
June 30,(in thousands) 2014 2013AssetsCurrent Assets: Cash and cash equivalents $ 65,762 $ 101,327 Investments for operating activities 943,663 832,280 Investments for capital activities 440,831 357,495 Investments for student loan activities 57,311 60,732 Accounts receivable, net 565,621 574,810 Current portion of notes and pledges receivable, net 74,120 118,648 Current portion of prepaid expenses and other assets 83,985 66,907 Cash collateral held by agent 85,657 40,957 Total Current Assets 2,316,950 2,153,156Noncurrent Assets: Endowment, life income and other investments 10,053,139 8,674,180 Notes and pledges receivable, net 334,551 206,982 Prepaid expenses and other assets 23,934 29,455 Capital assets, net 5,466,671 5,369,400 Total Noncurrent Assets 15,878,295 14,280,017 Total Assets $ 18,195,245 $ 16,433,173
Liabilities and Net Position Current Liabilities: Accounts payable $ 238,669 $ 219,581 Accrued compensation and other 363,790 354,745 Unearned revenue 217,012 214,381 Current portion of insurance and benefits reserves 86,014 86,173 Current portion of obligations for postemployment benefits 66,262 61,258 Commercial paper and current portion of bonds payable 107,860 117,907 Long-term bonds payable subject to remarketing, net 319,479 267,060 Collateral held for securities lending 85,657 40,957 Deposits of affiliates and others 45,602 35,283 Total Current Liabilities 1,530,345 1,397,345Noncurrent Liabilities: Accrued compensation 61,110 64,944 Insurance and benefits reserves 108,650 109,415 Obligations for postemployment benefits 1,665,192 1,636,833 Obligations under life income agreements 48,590 46,849 Government loan advances 87,343 91,418 Bonds payable 1,407,320 1,421,935 Deposits of affiliates and other 228,621 181,305 Total Noncurrent Liabilities 3,606,826 3,552,699 Total Liabilities 5,137,171 4,950,044
Net Position: Net investment in capital assets 3,697,894 3,637,027 Restricted: Nonexpendable 1,535,326 1,432,191 Expendable 4,471,681 3,689,208 Unrestricted 3,353,173 2,724,703 Total Net Position 13,058,074 11,483,129 Total Liabilities and Net Position $ 18,195,245 $ 16,433,173
c O N s O L i d AT E d s TAT E m E N T O F R E v E N U E s , E x P E N s E s A N d c H A N g E s i N N E T P O s i T i O N
The accompanying notes are an integral part of the consolidated financial statements.
Year Ended June 30,(in thousands) 2014 2013Operating Revenues Student tuition and fees $ 1,405,309 $ 1,349,057Less scholarship allowances 297,752 284,386 Net student tuition and fees 1,107,557 1,064,671Federal grants and contracts 852,798 914,012State and local grants and contracts 9,107 8,514Nongovernmental sponsored programs 165,711 153,440Sales and services of educational departments 123,918 124,533Auxiliary enterprises: Patient care revenues (net of provision for bad debts of $128,758 in 2014 and $114,025 in 2013) 3,001,292 2,786,063 Student residence fees (net of scholarship allowances of $18,599 in 2014 and $18,008 in 2013) 92,247 89,035 Other revenues 179,576 174,206Student loan interest income and fees 2,676 2,808 Total Operating Revenues 5,534,882 5,317,282 Operating Expenses Compensation and benefits 4,150,848 3,965,030Supplies and services 1,618,549 1,555,800Depreciation 487,458 476,898Scholarships and fellowships 124,465 123,287 Total Operating Expenses 6,381,320 6,121,015
Operating loss (846,438) (803,733) Nonoperating Revenues (Expenses) State educational appropriations 321,681 315,921Federal Pell grants 43,987 43,247Private gifts for other than capital and endowment purposes 166,395 168,634Net investment income 1,653,792 847,273Interest expense, net (54,235) (49,342)Federal subsidies for interest on Build America Bonds 7,566 8,251 Total Nonoperating Revenues, Net 2,139,186 1,333,984
Income before other revenues (expenses) 1,292,748 530,251 Other Revenues (Expenses) Capital gifts and grants 208,706 134,498Private gifts for permanent endowment purposes 89,023 77,567Other (15,532) (12,384) Total Other Revenues, Net 282,197 199,681
Increase in net position 1,574,945 729,932
Net Position, Beginning of Year 11,483,129 10,753,197 Net Position, End of Year $ 13,058,074 $ 11,483,129
The accompanying notes are an integral part of the consolidated financial statements.

20
14 A
NN
UA
L R
EP
OR
T F
ina
ncia
l Sta
temen
ts
6 5
20
14 A
NN
UA
L R
EP
OR
T F
ina
ncia
l Sta
temen
ts
6 4
Year Ended June 30,(in thousands) 2014 2013Cash Flows From Operating Activities Student tuition and fees $ 1,106,911 $ 1,065,578Federal, state and local grants and contracts 852,552 914,079Nongovernmental sponsored programs 174,346 158,017Sales and services of educational departments and other 315,541 298,140Patient care revenues 3,002,184 2,726,203Student residence fees 90,998 88,801Payments to employees (3,196,506) (3,063,397)Payments for benefits (913,930) (872,199)Payments to suppliers (1,628,379) (1,501,979)Payments for scholarships and fellowships (124,465) (123,287)Student loans issued (16,762) (14,377)Student loans collected 17,212 17,339Student loan interest and fees collected 2,676 2,808 Net Cash Used in Operating Activities (317,622) (304,274) Cash Flows From Investing Activities Interest and dividends on investments, net 39,838 55,231Proceeds from sales and maturities of investments 6,692,327 3,849,010Purchases of investments (6,670,154) (3,804,124)Net decrease (increase) in cash equivalents from noncurrent investments 30,479 (50,795)Net increase in deposits of affiliates and others 10,319 14,678 Net Cash Provided by Investing Activities 102,809 64,000 Cash Flows From Capital and Related Financing Activities Private gifts and other receipts 121,913 93,820Proceeds from issuance of capital debt 102,907 500,053Principal payments on capital debt (72,759) (489,259)Interest payments on capital debt, net of capitalized interest (52,512) (54,792)Federal subsidies for Build America Bonds interest 7,575 8,258Payments for bond refunding and related costs (422) (1,500)Purchases of capital assets, including capitalized interest (543,761) (520,926)Proceeds from sales of capital assets 2,119 1,055 Net Cash Used in Capital and Related Financing Activities (434,940) (463,291) Cash Flows From Noncapital Financing Activities State educational appropriations 320,634 314,405Federal Pell grants 43,987 43,247Private gifts and other receipts 249,162 207,982Student direct lending receipts 331,503 345,412Student direct lending disbursements (327,598) (346,634)Amounts received for annuity and life income funds 4,225 8,828Amounts paid to annuitants and life beneficiaries and related expenses (7,725) (7,038) Net Cash Provided by Noncapital Financing Activities 614,188 566,202 Net decrease in cash and cash equivalents (35,565) (137,363)Cash and Cash Equivalents, Beginning of Year 101,327 238,690 Cash and Cash Equivalents, End of Year $ 65,762 $ 101,327
f I n A n c I A l s t A t e M e n t s c O N s O L i d AT E d s TAT E m E N T O F c A s H F L O w s
Year Ended June 30,(in thousands) 2014 2013Reconciliation of operating loss to net cash used in operating activities: Operating loss $ (846,438) $ (803,733) Adjustments to reconcile operating loss to net cash used in operating activities: Depreciation expense 487,458 476,898 Changes in assets and liabilities: Accounts receivable, net 8,145 (74,109) Prepaid expenses and other assets (5,621) 9,919 Accounts payable 2,428 32,969 Accrued compensation and other 1,336 5,228 Unearned revenue 2,631 13,415 Insurance and benefits reserves (924) 8,612 Obligations for postemployment benefits 33,363 26,527 Net cash used in operating activities $ (317,622) $ (304,274)
c O N s O L i d AT E d s TAT E m E N T O F c A s H F L O w s , c O N T i N U E d
The accompanying notes are an integral part of the consolidated financial statements. The accompanying notes are an integral part of the consolidated financial statements.

20
14 A
NN
UA
L R
EP
OR
T F
ina
ncia
l Sta
temen
ts
6 7
20
14 A
NN
UA
L R
EP
OR
T F
ina
ncia
l Sta
temen
ts
6 6
n o t e s t o c o n s o l I d A t e d f I n A n c I A l s t A t e M e n t s J U N E 3 0 , 2 0 1 4 A N d 2 0 1 3
N O T E 1 – O R g A N i z AT i O N A N d s U m m A R y O F s i g N i F i c A N T A c c O U N T i N g P O L i c i E s
Organization and Basis of Presentation: The University of Michigan (the “University”) is a state-supported institution with an enrollment of over 61,000 students on its three campuses. The financial statements include the individual schools, colleges and departments, the University of Michigan Hospitals and Health Centers, Michigan Health Corporation (a wholly-owned corporation created to pursue joint venture and managed care initiatives) and Veritas Insurance Corporation (a wholly-owned captive insurance company). While the University is a political subdivision of the state of Michigan, it is not a component unit of the State in accordance with Governmental Accounting Standards Board (“GASB”) Statement No. 14, The Financial Reporting Entity. The University is classified as a state instrumentality under Internal Revenue Code Section 115, and is also classified as a charitable organization under Internal Revenue Code Section 501(c)(3), and is therefore exempt from federal income taxes. Certain activities of the University may be subject to taxation as unrelated business income under Internal Revenue Code Sections 511 to 514.
The University reports as a special purpose government entity engaged primarily in business type activities, as defined by GASB, on the accrual basis. Business type activities are those that are financed in whole or in part by fees charged to external parties for goods or services.
The financial statements of all controlled organizations are included in the University’s financial statements; affiliated organizations that are not controlled by, and not dependent on the University, such as booster and alumni organizations, are not included.
Net position is categorized as:Net investment in capital assets: Capital assets, net of accumulated depreciation and outstanding principal balances of debt related to the acquisition, construction or improvement of those assets.
Restricted:Nonexpendable – Net position subject to externally imposed stipulations that it be maintained permanently. Such net position includes the corpus portion (historical value) of gifts to the University’s permanent endowment funds and certain investment earnings stipulated by the donor to be reinvested permanently.
Expendable – Net position whose use by the University is subject to externally imposed stipulations that can be fulfilled by actions of the University pursuant to those stipulations or that expire by the passage of time. Such net position includes net appreciation of the University’s permanent endowment funds that have not been stipulated by the donor to be reinvested permanently.
Unrestricted: Net position that is not subject to externally imposed stipulations. Unrestricted net position may be designated for specific purposes by action of management or the Board of Regents. Substantially all unrestricted net position is designated for various academic and research programs and initiatives, as well as capital projects.
Adoption of New Accounting Standards: During 2014, the University adopted GASB Statement No. 65, Items Previously Reported as Assets and Liabilities. The adoption of this statement did not have a material impact on the University’s financial statements.
Summary of Significant Accounting Policies: For purposes of the statement of cash flows, the University considers all highly liquid investments purchased with a maturity of three months or less, to be cash equivalents. Cash equivalents representing assets of the University’s endowment, life income and other investments are included in noncurrent investments as these funds are not used for operating purposes.
Investments are reported in four categories in the statement of net position. Investments reported as endowment, life income and other investments are those funds invested in portfolios that are considered by management to be of a long duration. Investments for student loan and capital activities are those funds that are intended to be used for these specific activities. All other investments are reported as investments for operating activities.
Investments in marketable securities are carried at fair value, as established by the major securities markets. Purchases and sales of investments are accounted for on the trade date basis. Investment income is recorded on the accrual basis. Realized and unrealized gains and losses are reported in investment income.
Investments in nonmarketable limited partnerships are carried at fair value, which is generally provided by the management of the investment partnerships as of June 30, 2014 and 2013. The University may also adjust the fair value of these investments based on market conditions, specific redemption terms and restrictions, risk considerations and other factors. As these investments are not readily marketable, the estimated value is subject to uncertainty and, therefore, may differ from the value that would have been used had a ready market for the investments existed.
Derivative instruments, such as financial futures, forward foreign exchange contracts and interest rate swaps held in investment portfolios, are recorded on the contract date and are carried at fair value using listed price quotations or amounts that approximate fair value. To facilitate trading in financial futures, the University is required to post cash or securities to satisfy margin requirements of the exchange where such futures contracts are listed. The University monitors the required amount of cash and securities on deposit for financial futures transactions and withdraws or deposits cash or securities as necessary.
Investments denominated in foreign currencies are translated into U.S. dollar equivalents using year-end spot foreign currency exchange rates. Purchases and sales of investments denominated in foreign currencies and related income are translated at spot exchange rates on the transaction dates.
Accounts receivable are recorded net of a provision for uncollectible accounts receivable. The provision is based on management’s judgment of potential uncollectible amounts, which includes such factors as historical experience and type of receivable. The University receives pledges and bequests of financial support from corporations, foundations and individuals. Revenue is recognized when a pledge representing an unconditional promise to pay is received and all eligibility requirements, including time requirements, have been met. In the absence of such a promise, revenue is recognized when the gift is received. Permanent endowment pledges do not meet eligibility requirements, as defined by GASB, and are not recorded as assets until the related gift is received.
Unconditional promises to give that are expected to be collected in future years are recorded at the present value of the estimated future cash flows. The discounts on these amounts are computed using risk-free interest rates applicable to the years in which the promises are made, commensurate with expected future payments. An allowance for uncollectible pledges receivable is provided based on management’s judgment of potential uncollectible amounts and includes such factors as prior collection history, type of gift and nature of fundraising.
Capital assets are recorded at cost or, if donated, at appraised value at the date of donation. Depreciation of capital assets is provided on a straight-line basis over the estimated useful lives of the respective assets, which generally range from four to forty years. The University does not capitalize works of art or historical treasures that are held for exhibition, education, research or public service. These collections are neither disposed of for financial gain nor encumbered in any way. Accordingly, such collections are not recognized or capitalized for financial statement purposes.
Unearned revenue consists primarily of cash received from grant and contract sponsors which has not yet been earned under the terms of the agreement. Unearned revenue also includes amounts received in advance of an event, such as student tuition and advance ticket sales related to future fiscal years.
Deposits of affiliates and others represent cash and invested funds held by the University as a result of agency relationships with various groups. Noncurrent deposits of affiliates represent the portion of endowment and similar funds held by the University on behalf of others.
The University holds life income funds for beneficiaries of the pooled income fund, charitable remainder trusts and the gift annuity program. These funds generally pay lifetime income to beneficiaries, after which the principal is made available to the University in accordance with donor intentions. All life income fund assets, including those held in trust, are recorded at fair value. The present value of estimated future payments due to life income beneficiaries is recorded as a liability.
For donor restricted endowments, the Uniform Prudent Management of Institutional Funds Act, as adopted in Michigan, permits the Board of Regents to appropriate amounts for endowment spending rule distributions as is considered prudent. The University’s policy is to retain net realized and unrealized appreciation with the endowment after spending rule distributions. Net appreciation of permanent endowment funds, which totaled $1,725,281,000 and $1,338,629,000 at June 30, 2014 and 2013, respectively, is recorded in restricted expendable net position. The University’s endowment spending rule is further discussed in Note 2.

20
14 A
NN
UA
L R
EP
OR
T F
ina
ncia
l Sta
temen
ts
6 9
20
14 A
NN
UA
L R
EP
OR
T F
ina
ncia
l Sta
temen
ts
6 8
N O T E 1 – O R g A N i z AT i O N A N d s U m m A R y O F s i g N i F i c A N T A c c O U N T i N g P O L i c i E s , c O N T i N U E d
Student tuition and residence fees are presented net of scholarships and fellowships applied to student accounts, while stipends and other payments made directly to students are presented as scholarship and fellowship expenses.
Patient care revenues are reported net of contractual allowances and bad debt expenses. Contractual allowances are established based on agreements with third-party payers that provide payments for patient care services at amounts different from established rates. Patient care services are primarily provided through the University of Michigan Health System, which includes the Hospitals and Health Centers, the Faculty Group Practice of the University of Michigan Medical School and the Michigan Health Corporation. Patient care services are also provided through University Health Services, which provides health care services to students, faculty and staff and Dental Faculty Associates, which provides dental care services performed by faculty dentists.
Patient care services are provided to patients who meet certain criteria under the Hospitals and Health Centers’ charity care policy without charge or at amounts less than its established rates. Accordingly, charity care is not reported as revenue in the accompanying statement of revenues, expenses and changes in net position. Charges forgone for charity care services totaled $55,038,000 and $54,803,000 in 2014 and 2013, respectively.
Other auxiliary enterprise revenues primarily represent revenues generated by intercollegiate athletics, parking, student unions, university press and student publications.
The University’s policy for defining operating activities as reported on the statement of revenues, expenses and changes in net position are those that generally result from exchange transactions such as payments received for providing services and payments made for services or goods received. Nearly all of the Univer-sity’s expenses are from exchange transactions. Certain significant revenue streams relied upon for operations result from nonexchange transactions, and are recorded as nonoperating revenues including state appropriations, federal Pell grants, gifts and investment income.
The preparation of financial statements in conformity with accounting principles generally accepted in the United States of America requires management to make estimates and assumptions that affect amounts reported in the financial statements and accompanying notes. Actual results could differ from those estimates. The most significant areas that require management estimates relate to self-insurance and benefits obligations.
Reclassifications: Certain prior year amounts have been reclassified to conform with current year presentations.
N O T E 2 – c A s H A N d i N v E s T m E N T s
Summary: The University maintains centralized management for substantially all of its cash and investments.
Working capital of individual university units is invested in the University Investment Pool (“UIP”). Together with the University’s short-term insurance and other benefits reserves, the UIP is invested in the Daily and Monthly Portfolios, which are principally invested in investment-grade money market securities, U.S. government and other fixed income securities and absolute return strategies.
The University collectively invests substantially all of the assets of its endowment funds along with a portion of its insurance and benefits reserves, charitable remainder trusts and gift annuity program in the Long Term Portfolio. The longer investment horizon of the Long Term Portfolio allows for an equity-oriented strategy to achieve higher expected returns over time, and permits the use of less liquid alternative investments, providing for equity diversification beyond the stock markets. The Long Term Portfolio includes investments in domestic and non-U.S. stocks and bonds, commingled funds and limited partnerships consisting of venture capital, private equity, real estate, natural resources and absolute return strategies.
The University also separately invests certain insurance reserves, endowments and charitable remainder trusts, unexpended bond proceeds and other funds with investment restrictions outside of the Daily, Monthly and Long Term Portfolios.
Authorizations: The University’s investment policies are governed and authorized by University Bylaws and the Board of Regents. The approved asset allocation policy for the Long Term Portfolio sets a general target of 80 percent equities and 20 percent fixed income securities, within a permitted range of 65 to 90 percent for equities and 10 to 35 percent for fixed income securities. Since diversification is a fundamental risk management strategy, the Long Term Portfolio is broadly diversified within these general categories.
The endowment spending rule provides for distributions from the University Endowment Fund to the University entities that benefit from the endowment fund. Commencing with the quarter ending September 30, 2010, the annual distribution rate began to be reduced from 5 percent of the one-quarter lagged seven year moving average fair value of fund shares to 4.5 percent. Distributions were managed toward the new rate by keeping quarter to quarter distributions per share unchanged and moving toward the 4.5 percent rate when increases in the value of fund shares would otherwise result in higher per share distributions. The University reached the 4.5 percent target distribution rate as of December 31, 2013. To protect endowment principal in the event of a prolonged market downturn, distributions are limited to 5.3 percent of the current fair value of fund shares. Distributions are also made from the UIP to University entities based on the 90-day U.S. Treasury Bill rate. The University’s costs to administer and grow the University Endowment Fund and UIP are funded by investment returns.
Cash and Cash Equivalents: Cash and cash equivalents, which totaled $65,762,000 and $101,327,000 at June 30, 2014 and 2013, respectively, represent short-term money market investments in mutual funds, overnight collective funds managed by the University’s custodian or short-term highly liquid investments registered as securities and held by the University or its agents in the University’s name. Of its cash and cash equivalents, the University had actual cash balances in its bank accounts in excess of Federal Deposit Insurance Corporation (“FDIC”) limits in the amount of $8,070,000 and $13,026,000 at June 30, 2014 and 2013, respectively. The University does not require its deposits to be collateralized or insured.
n o t e s t o c o n s o l I d A t e d f I n A n c I A l s t A t e M e n t s

20
14 A
NN
UA
L R
EP
OR
T F
ina
ncia
l Sta
temen
ts
7 1
20
14 A
NN
UA
L R
EP
OR
T F
ina
ncia
l Sta
temen
ts
7 0
N O T E 2 – c A s H A N d i N v E s T m E N T s , c O N T i N U E d
Investments: At June 30, 2014 and 2013, the University’s investments, which are held by the University or its agents in the University’s name, are summarized as follows:
(in thousands) 2014 2013Cash equivalents, noncurrent $ 58,162 $ 88,641Fixed income securities 2,257,691 2,034,823Commingled funds 2,121,542 1,864,955Equity securities 1,460,819 910,308Nonmarketable alternative investments 5,588,516 5,019,809Other investments 8,214 6,151 $ 11,494,944 $ 9,924,687
The University’s investment strategy, like that of most other institutions, incorporates certain financial instruments that involve, to varying degrees, elements of market risk and credit risk in excess of amounts recorded in the financial statements. Market risk is the potential for changes in the value of financial instruments due to market changes, including interest and foreign exchange rate movements and fluctuations embodied in forwards, futures and commodity or security prices. Market risk is directly impacted by the volatility and liquidity of the markets in which the underlying assets are traded. Credit risk is the possibility that a loss may occur due to the failure of a counterparty to perform according to the terms of the contract. The University’s risk of loss in the event of a counterparty default is typically limited to the amounts recognized in the statement of net position and is not represented by the contract or notional amounts of the instruments.
Fixed income securities have inherent financial risks, including credit risk and interest rate risk. Credit risk for fixed income securities is the risk that the issuer will not fulfill its obligations. Nationally recognized statistical rating organizations (“NSROs”), such as Moody’s and Standard & Poor’s, assign credit ratings to security issues and issuers that indicate a measure of potential credit risk to investors. Fixed income securities considered investment grade are those rated at least Baa by Moody’s and BBB by Standard & Poor’s. To manage credit risk, the University specifies minimum average and minimum absolute quality NSRO ratings for securities held pursuant to its management agreements.
The University minimizes concentration of credit risk, the risk of a large loss attributed to the magnitude of the investment in a single issuer of fixed income securities, by diversifying its fixed income issues and issuers and holding U.S. Treasury securities which are considered to have minimal credit risk. The University also manages this risk at the account level by limiting each fixed income manager’s holding of any non-U.S. government issuer to 5 percent of the value of the investment account.
Interest rate risk is the risk that changes in interest rates will adversely affect the fair value of fixed income securities. Effective duration, a commonly used measure of interest rate risk, incorporates a security’s yield, coupon, final maturity, call features and other imbedded options into one number expressed in years that indicates how price-sensitive a security or portfolio of securities is to changes in interest rates. The effective duration of a security or portfolio indicates the approximate percentage change in fair value expected for a one percent change in interest rates. The longer the duration, the more sensitive the security or portfolio is to changes in interest rates. The weighted average effective duration of the University’s fixed income securities was 5.0 years at June 30, 2014, compared to 4.5 years at June 30, 2013. The University manages the effective duration of its fixed income securities at the account level, where fixed income managers generally may not deviate from the duration of their respective benchmarks by more than 25 percent. The Monthly Portfolio held positions in bond futures at June 30, 2013, which are used to adjust the duration of cash equivalents and the fixed income portion of the portfolios.
n o t e s t o c o n s o l I d A t e d f I n A n c I A l s t A t e M e n t s
The composition of fixed income securities at June 30, 2014 and 2013, along with credit quality and effective duration measures, is summarized as follows:
Of the University’s fixed income securities, 97 percent and 95 percent were rated investment grade or better at June 30, 2014 and 2013, and 63 percent and 64 percent of these securities consisted of either U.S. treasury and government agencies or non-U.S. government securities rated AAA/Aaa at June 30, 2014 and 2013, respectively.
Commingled (pooled) funds include Securities and Exchange Commission regulated mutual funds and externally managed funds, limited partnerships and corporate structures which are generally unrated and unregulated. Certain commingled funds may use derivatives, short positions and leverage as part of their investment strategy. These investments are structured to limit the University’s risk exposure to the amount of invested capital. The composition of commingled funds at June 30, 2014 and 2013 is summarized as follows:
(in thousands) 2014 2013Absolute return $ 880,514 $ 795,019 U.S. equities 387,828 265,073Non-U.S./global equities 795,161 746,108U.S. fixed income 51,293 51,007Other 6,746 7,748 $ 2,121,542 $ 1,864,955
2014 U.S. Investment Non-Investment Not Duration (in thousands) Government Grade Grade Rated Total (in years) U.S. Treasury $ 529,837 $ 529,837 4.0U.S. Treasury inflation protected 299,533 299,533 3.2U.S. government agency 439,648 439,648 0.2Mortgage backed $ 34,179 $ 13,831 $ 5,356 53,366 1.9Asset backed 59,847 1,689 61,536 2.1Corporate and other 824,069 44,417 5,285 873,771 9.0 $ 1,269,018 $ 918,095 $ 59,937 $ 10,641 $ 2,257,691 5.0
2013 U.S. Investment Non-Investment Not Duration (in thousands) Government Grade Grade Rated Total (in years) U.S. Treasury $ 532,978 $ 532,978 2.7U.S. Treasury inflation protected 319,351 319,351 2.9U.S. government agency 378,079 $ 2,884 380,963 0.5Mortgage backed 33,459 $ 20,331 $ 1,365 55,155 1.7Asset backed 21,354 2,184 23,538 4.9Corporate and other 653,778 58,152 10,908 722,838 8.8 $ 1,230,408 $ 711,475 $ 80,667 $ 12,273 $ 2,034,823 4.5

20
14 A
NN
UA
L R
EP
OR
T F
ina
ncia
l Sta
temen
ts
7 3
20
14 A
NN
UA
L R
EP
OR
T F
ina
ncia
l Sta
temen
ts
7 2
N O T E 2 – c A s H A N d i N v E s T m E N T s , c O N T i N U E d
Commingled funds have liquidity (redemption) provisions, which enable the University to make full or partial withdrawals with notice, subject to restrictions on the timing and amount. Of the University’s commingled funds at June 30, 2014 and 2013, approximately 74 percent and 72 percent are redeemable within one year, with 51 and 50 percent redeemable within 90 days under normal market conditions. The remaining amounts are redeemable beyond one year, with redemption of certain funds dependent on disposition of the underlying assets.
Nonmarketable alternative investments consist of limited partnerships and similar vehicles involving an advance commitment of capital called by the general partner as needed and distributions of capital and return on invested capital as underlying strategies are concluded during the life of the partnership. There is no active secondary market for these alternative investments, which are generally unrated and unregulated, and the liquidity of these investments is dependent on actions taken by the general partner. The composition of these partnerships at June 30, 2014 and 2013 is summarized as follows:
(in thousands) 2014 2013Private equity $ 1,313,188 $ 1,293,353 Real estate 1,254,747 1,281,143Venture capital 1,206,028 948,372Absolute return 969,165 766,836Natural resources 845,388 730,105 $ 5,588,516 $ 5,019,809
The University’s limited partnership investments are diversified in terms of manager selection and industry and geographic focus. At June 30, 2014 and 2013, no individual partnership investment represented 5 percent or more of total investments. The University’s committed but unpaid obligation to these limited partnerships is further discussed in Note 13.
Absolute return strategies in the commingled funds and nonmarketable alternative investments classifications include long/short stock programs, merger arbitrage, intra-capital structure arbitrage and distressed debt investments. The goal of absolute return strategies is to provide, in aggregate, a return that is consistently positive and uncorrelated with the overall market.
The University participates in non-U.S. developed and emerging markets through commingled funds invested in non-U.S./global equities and absolute return strategies. Although substantially all of these funds are reported in U.S. dollars, price changes of the underlying securities in local markets as well as changes to the value of local currencies relative to the U.S. dollar are embedded in investment returns. In addition, a portion of the University’s equity securities and nonmarketable alternative investments are denominated in foreign currencies, which must be settled in local (non-U.S.) currencies. Forward foreign currency contracts are typically used to manage the risks related to fluctuations in currency exchange rates between the time of purchase or sale and the actual settlement of foreign securities. Various investment managers acting for the University also use forward foreign exchange contracts in risk-based transactions to carry out their portfolio strategies, which may result in short exposure to certain foreign currencies.
n o t e s t o c o n s o l I d A t e d f I n A n c I A l s t A t e M e n t s
Foreign exchange risk is the risk that investments denominated in foreign currencies may lose value due to adverse fluctuations in the value of the U.S. dollar relative to foreign currencies. The value of the University’s non-U.S. dollar holdings net of outstanding forward foreign exchange contracts totaled $1,213,415,000 or 11 percent of total investments at June 30, 2014, and $959,154,000 or 10 percent of total investments at June 30, 2013. Non-U.S. dollar exposures are summarized as follows:
(in thousands) 2014 2013Euros $ 558,970 $ 745,144 British pounds sterling 292,679 195,440Canadian dollar 173,037 45,391Japanese yen 212,743 60,882Other (24,014) (87,703) $ 1,213,415 $ 959,154
The University manages foreign exchange risk through the use of forward foreign currency contracts and manager agreements that provide minimum diversification and maximum exposure limits by country and currency.
The Long Term Portfolio and the Monthly Portfolio participate in a short-term, fully collateralized, securities lending program administered by the University’s master custodian. Together, the Portfolios had $91,859,000 and $41,443,000 in securities loans outstanding at June 30, 2014 and 2013, respectively. At loan inception, an approved borrower must deliver collateral of cash, securities or letters of credit to the University’s lending agent equal to 102 percent of fair value for domestic securities and 105 percent for foreign securities. Collateral positions are monitored daily to insure that borrowed securities are never less than 100 percent collateralized. At June 30, 2014, collateral of $97,688,000 (106 percent of securities on loan) includes invested cash of $85,657,000 and U.S. government securities of $12,031,000, while at June 30, 2013, collateral of $42,982,000 (104 percent of securities on loan) includes invested cash of $40,957,000 and U.S. government securities of $2,025,000.
Cash collateral held by the University’s lending agent, along with the offsetting liability to return the collateral at loan termination, are recorded in the statement of net position. Neither the University nor its securities lending agent has the ability to pledge or sell securities received as collateral unless a borrower defaults. Securities loans may be terminated upon notice by either the University or the borrower.
N O T E 3 – A c c O U N T s R E c E i v A b L E
The composition of accounts receivable at June 30, 2014 and 2013 is summarized as follows:
(in thousands) 2014 2013Patient care $ 559,775 $ 608,538Sponsored programs 98,849 96,099State educational appropriations 58,487 57,440Student accounts 25,713 24,145Other 36,888 43,083 779,712 829,305Less provision for uncollectible accounts receivable 214,091 254,495 $ 565,621 $ 574,810

20
14 A
NN
UA
L R
EP
OR
T F
ina
ncia
l Sta
temen
ts
7 5
20
14 A
NN
UA
L R
EP
OR
T F
ina
ncia
l Sta
temen
ts
7 4
N O T E 4 – N O T E s A N d P L E d g E s R E c E i v A b L E
The composition of notes and pledges receivable at June 30, 2014 and 2013 is summarized as follows:
(in thousands) 2014 2013Notes: Federal student loan programs $ 85,478 $ 85,793 University student loan funds 18,316 18,829 Other 477 488 104,271 105,110 Less allowance for uncollectible notes 3,100 3,100 Total notes receivable, net 101,171 102,010 Gift pledges: Capital 209,419 124,088 Operations 112,474 108,257 321,893 232,345 Less: Allowance for uncollectible pledges 9,498 6,455 Unamortized discount to present value 4,895 2,270 Total pledges receivable, net 307,500 223,620 Total notes and pledges receivable, net 408,671 325,630Less current portion 74,120 118,648 $ 334,551 $ 206,982
The principal repayment and interest rate terms of federal and university loans vary considerably. The allowance for uncollectible notes only applies to University funded notes and the University portion of federal student loans, as the University is not obligated to fund the federal portion of uncollected student loans. Federal loan programs are funded principally with federal advances to the University under the Perkins and various health professions loan programs.
Payments on pledges receivable at June 30, 2014 are expected to be received in the following years ended June 30 (in thousands):
2015 $ 59,6482016 46,5792017 35,4832018 35,2212019 23,0512020 and after 121,911 $ 321,893
As discussed in Note 1, permanent endowment pledges do not meet eligibility requirements, as defined by GASB, until the related gift is received. Accordingly, permanent endowment pledges totaling approximately $124,427,000 and $48,080,000 at June 30, 2014 and 2013, respectively, are not recognized as assets in the accompanying financial statements. In addition, bequest intentions and other conditional promises are not recognized as assets until the specified conditions are met because of uncertainties with regard to their realizability and valuation.
n o t e s t o c o n s o l I d A t e d f I n A n c I A l s t A t e M e n t s
N O T E 5 – c A P i TA L A s s E T s
Capital assets activity for the years ended June 30, 2014 and 2013 is summarized as follows:
2014 Beginning Ending(in thousands) Balance Additions Retirements Balance Land $ 100,914 $ 11,097 $ 112,011Land improvements 112,301 4,377 $ 1 116,677Infrastructure 231,858 9,670 241,528Buildings 6,898,895 397,770 13,428 7,283,237Construction in progress 328,418 (57,455) 270,963Property held for future use 30,779 30,779Equipment 1,739,835 200,832 61,430 1,879,237Library materials 518,722 23,950 542,672 9,961,722 590,241 74,859 10,477,104Less accumulated depreciation 4,592,322 487,458 69,347 5,010,433 $ 5,369,400 $ 102,783 $ 5,512 $ 5,466,671 2013 Beginning Ending(in thousands) Balance Additions Retirements Balance Land $ 94,743 $ 6,171 $ 100,914Land improvements 111,806 5,238 $ 4,743 112,301Infrastructure 223,292 8,566 231,858Buildings 6,775,245 245,338 121,688 6,898,895Construction in progress 226,816 101,602 328,418Property held for future use 47,073 (16,294) 30,779Equipment 1,692,537 145,460 98,162 1,739,835Library materials 495,702 23,020 518,722 9,667,214 519,101 224,593 9,961,722Less accumulated depreciation 4,329,550 476,898 214,126 4,592,322 $ 5,337,664 $ 42,203 $ 10,467 $ 5,369,400
The decrease in construction in progress of $57,455,000 in 2014 represents the amount of capital expenditures for new projects of $524,767,000 net of assets placed in service of $582,222,000. The increase in construction in progress of $101,602,000 in 2013 represents the amount of capital expenditures for new projects of $441,873,000 net of assets placed in service of $340,271,000. Interest of $1,504,000 was capitalized in 2013. There was no interest capitalized in 2014.

20
14 A
NN
UA
L R
EP
OR
T F
ina
ncia
l Sta
temen
ts
7 7
20
14 A
NN
UA
L R
EP
OR
T F
ina
ncia
l Sta
temen
ts
7 6
N O T E 6 – L O N g -T E R m d E b T
Long-term debt at June 30, 2014 and 2013 is summarized as follows:
n o t e s t o c o n s o l I d A t e d f I n A n c I A l s t A t e M e n t s
Certain variable rate bonds have remarketing features which allow bondholders to put debt back to the University. Accordingly, variable rate bonds payable are classified as current unless supported by long-term liquidity agreements, such as lines of credit or standby bond purchase agreements, which can refinance the debt on a long-term basis. The classification of the University’s variable rate bonds payable at June 30, 2014 and 2013 is summarized as follows:
(in thousands) 2014 2013Variable rate bonds payable subject to remarketing $ 669,825 $ 688,230Less: Current principal maturities 19,230 18,405 Long-term liquidity agreements: Unsecured line of credit 150,000 150,000 Standby bond purchase agreements 181,116 252,765Long-term bonds payable subject to remarketing, net $ 319,479 $ 267,060
The University’s available line of credit and standby bond purchase agreements were entirely unused at June 30, 2014.
In connection with certain issues of variable rate debt, the University has entered into various floating-to-fixed interest rate swaps to convert all or a portion of the associated variable rate debt to synthetic fixed rates to protect against the potential of rising interest rates. The fair value, significant terms and other information about the University’s interest rate swaps is discussed in Note 7.
Long-term debt activity for the year ended June 30, 2014 is summarized as follows:
The University maintains a combination of variable and fixed rate debt supported by general revenues, with effective interest rates that averaged approximately 2.1 percent and 2.2 percent in 2014 and 2013, respectively, including federal subsidies for interest on taxable Build America Bonds. The University utilizes commercial paper to provide interim financing for its capital improvement program. The Board of Regents has authorized the issuance of up to $150,000,000 in commercial paper backed by a general revenue pledge. Outstanding commercial paper debt is converted to long-term debt financing, as appropriate, within the normal course of business.
During 2014, the University issued $92,285,000 of fixed rate General Revenue Bonds (Series 2014A and Series 2014B) with a net original issue premium of $8,447,000. Total bond proceeds of $100,732,000 were utilized to provide $100,310,000 for capital projects and $422,000 for debt issuance costs.
During 2013, the University issued $408,840,000 of General Revenue Bonds with a net original issue premium of $2,956,000. Total bond proceeds of $411,796,000 were utilized to convert $22,865,000 of commercial paper to long-term debt, refund $266,275,000 of Hospital Revenue Bonds and $57,125,000 of Medical Service Plan Revenue Bonds and provide $64,031,000 for capital projects and $1,500,000 for debt issuance costs. General Revenue Bonds issued in 2013 include $355,330,000 of variable rate bonds (Series 2012D-1, 2012D-2, 2012E and 2012F) and $53,510,000 of fixed rate bonds (Series 2013A).
(in thousands) 2014 2013Commercial Paper: Tax-exempt, variable rate (.07%)* $ 34,800 $ 44,395 Taxable, variable rate (.12%)* 6,290 10,945General Revenue Bonds: Series 2014A, 3.00% to 5.00% through 2044 83,065 Series 2014B, 0.265% to 3.516% through 2024 9,220 unamortized premium 8,283 Series 2013A, 2.00% to 5.00% through 2029 51,695 53,510 unamortized premium 2,669 2,861 Series 2012A, variable rate (.05%)* through 2036 50,000 50,000 Series 2012B, variable rate (.01%)* through 2042 65,000 65,000 Series 2012C, 2.00% to 5.00% through 2017 78,490 83,920 unamortized premium 8,316 11,426 Series 2012D-1, variable rate (.01%)* to fixed via swap through 2025 72,930 75,745 deferred amount on refunding (16,563) (18,796) Series 2012D-2, variable rate (.04%)* to fixed via swap through 2026 and variable rate 2027 through 2030 78,930 82,645 deferred amount on refunding (6,503) (7,539) Series 2012E**, variable rate (.26%)* through 2033 95,970 95,029 Series 2012F**, variable rate (.46%)* through 2043 100,970 100,970 Series 2010A, taxable-Build America Bonds, 4.926% to 5.593% through 2040 163,110 163,110 Series 2010C, 2.00% to 5.00% through 2027 160,695 171,440 unamortized premium 11,165 12,748 Series 2010D, taxable-Build America Bonds, 1.051% to 5.333% through 2041 196,910 204,655 Series 2009A, 2.50% to 5.00% through 2029 71,800 79,305 Series 2009B, variable rate (.07%)* through 2039 118,710 118,710 unamortized premium 5,842 6,273 Series 2009D, taxable-Build America Bonds, 5.155% to 6.172% through 2030 89,815 89,815 Series 2008A, variable rate (.01%)* through 2038 105,810 105,810 Series 2008B, variable rate (.06%)* to fixed via swap through 2026 and variable rate 2027 through 2028 95,605 101,240 Series 2005A, 5.00% through 2018 7,870 12,830 unamortized premium 223 426 unamortized loss on extinguishment (37) Series 2002, variable rate (.06%)* to fixed via swap through 2018 and variable rate 2019 through 2032 82,840 89,080General Revenue Refunding Bonds: Series 2003, 3.50% to 5.00% through 2015 695 1,365 unamortized premium 7 23 unamortized loss on extinguishment (2) 1,834,659 1,806,902Less: Commercial paper and current portion of bonds payable 107,860 117,907 Long-term bonds payable subject to remarketing, net 319,479 267,060 $ 1,407,320 $ 1,421,935* Denotes variable rate at June 30, 2014 ** Denotes variable rate bonds not subject to remarketing
Beginning Ending(in thousands) Balance Additions Retirements Balance Commercial paper $ 55,340 $ 2,175 $ 16,425 $ 41,090Bonds 1,751,562 100,732 58,725 1,793,569 $ 1,806,902 $ 102,907 $ 75,150 $ 1,834,659

20
14 A
NN
UA
L R
EP
OR
T F
ina
ncia
l Sta
temen
ts
7 9
20
14 A
NN
UA
L R
EP
OR
T F
ina
ncia
l Sta
temen
ts
7 8
N O T E 6 – L O N g -T E R m d E b T, c O N T i N U E d
During 2014, unamortized bond issuance costs totaling $7,559,000 were written off to interest expense in connection with the adoption of GASB Statement No. 65, Items Previously Reported as Assets and Liabilities.
Debt obligations are generally callable by the University and mature at various dates through fiscal 2044. Principal maturities, including amortization of deferred amounts on refunding, and interest on debt obligations, based on scheduled bond maturities, for the next five years and in subsequent five-year periods are as follows:
If all variable rate bonds were put back to the University and existing unsecured lines of credit and standby bond purchase agreements were not extended upon their current expiration dates, the total principal payments due in 2015 would increase to $421,694,000, total principal payments due in 2016 would increase to $369,936,000, total principal payments due in 2017 would increase to $264,250,000 and total principal payments due in 2018 would increase to $63,855,000. Accordingly, principal payments due in subsequent years would be reduced to $34,200,000 in 2019; $163,530,000 in 2020 through 2024; $233,695,000 in 2025 through 2029; $106,935,000 in 2030 through 2034; $110,780,000 in 2035 through 2039; and $52,345,000 in 2040 through 2044. There would not be a material impact on annual interest payments due to the low variable rate of interest on these bonds.
N O T E 7 – d E R i v AT i v E i N s T R U m E N T s
Derivatives held by the University are recorded at fair value in the statement of net position in accordance with GASB Statement No. 53, Accounting and Financial Reporting for Derivative Instruments (“GASB 53”). For hedging derivative instruments that are effective in significantly reducing an identified financial risk, as defined by the Statement, the corresponding change in fair value is deferred and included in the statement of net position. For all other derivative instruments, changes in fair value are reported as net investment income (loss).
n o t e s t o c o n s o l I d A t e d f I n A n c I A l s t A t e M e n t s
Derivative instruments held by the University at June 30, 2014 and 2013 are summarized as follows:
The University utilizes bond futures in its investment portfolios to adjust the duration of cash equivalents and fixed income securities, while foreign currency forward contracts are utilized to settle securities and transactions denominated in foreign currencies and manage foreign exchange risk. Other derivative instruments in the University’s investment portfolios consist primarily of interest rate swaps, credit default swaps, and total return swaps used to carry out investment and portfolio strategies.
In connection with certain issues of variable rate debt, the University has entered into various floating-to-fixed interest rate swaps to convert all or a portion of the associated variable rate debt to synthetic fixed rates to protect against the potential of rising interest rates. The fair value generally represents the estimated amount that the University would pay to terminate the swap agreements at the statement of net position date, taking into account current interest rates and creditworthiness of the underlying counterparty. The notional amount represents the underlying reference of the instrument and does not represent the amount of the University’s settlement obligations.
In accordance with GASB 53, an interest rate swap is considered an effective cash flow hedge if the swap payments received substantially offset the payments made on the associated debt. An interest rate swap that is not considered an effective cash flow hedge is deemed to be an investment derivative instrument and changes in fair value are recorded as net investment income (loss).
At June 30, 2014 and 2013, the fair value of floating-to-fixed interest rate swaps associated with the University’s variable rate debt is a liability of $30,692,000 and $34,135,000, respectively, and is included in the statement of net position as part of noncurrent other liabilities. The deferred outflow of resources for the fair value of swaps deemed effective cash flow hedges totaled $6,146,000 and $5,731,000, at June 30, 2014 and 2013, respectively, and is included in the statement of net position as part of noncurrent other assets. Three bond issues were refunded in 2013 and the deferred outflow of resources related to the effective cash flow hedges associated with these bonds was reclassified to deferred amount on refunding and net against bonds payable. The deferred amount on refunding is being amortized into interest expense over the remaining term of the refunding bonds and totaled $23,066,000 and $26,335,000 at June 30, 2014 and 2013, respectively.
(in thousands) Principal Interest * Total 2015 $ 102,215 $ 45,547 $ 147,7622016 57,270 43,714 100,9842017 121,845 42,197 164,0422018 54,475 37,515 91,9902019 55,335 36,011 91,3462020-2024 308,745 157,710 466,4552025-2029 342,360 111,642 454,0022030-2034 343,625 63,906 407,5312035-2039 335,260 33,514 368,7742040-2044 100,090 5,625 105,715 1,821,220 $ 577,381 $ 2,398,601 Plus unamortized premiums 36,505 Less deferred amount on refunding 23,066 $ 1,834,659 * Interest on variable rate debt is estimated based on rates in effect at June 30, 2014; amounts do not reflect federal subsidies to be received for Build America Bonds interest
2014 2013 Notional Notional (in thousands) Amount Fair Value Amount Fair Value Investment Derivative Instruments: Investment portfolios: Futures $ (88,380) $ (563) $ 11,176 $ (224) Foreign currency forwards 1,973,999 7,875 862,093 (5,411) Other 11,215 (27) 79,430 (2,537) $ 1,896,834 $ 7,285 $ 952,699 $ (8,172) Floating-to-fixed interest rate swap on debt $ 28,210 $ (1,480) $ 34,450 $ (2,069) Effective Cash Flow Hedges: Floating-to-fixed interest rate swaps on debt $ 206,280 $ (29,212) $ 218,435 $ (32,066)

20
14 A
NN
UA
L R
EP
OR
T F
ina
ncia
l Sta
temen
ts
8 1
20
14 A
NN
UA
L R
EP
OR
T F
ina
ncia
l Sta
temen
ts
8 0
N O T E 7 – d E R i v AT i v E i N s T R U m E N T s , c O N T i N U E d
The change in fair value of derivative instruments, which includes realized gains and losses on positions closed, for the years ended June 30, 2014 and 2013 is summarized as follows:
(in thousands) 2014 2013Investment Derivative Instruments: Investment portfolios: Futures $ (4,223) $ 947 Foreign currency forwards 334 21,305 Other 3,338 (5,133) $ (551) $ 17,119 Floating-to-fixed interest rate swap on debt $ 589 $ 1,531 Effective Cash Flow Hedges: Floating-to-fixed interest rate swaps on debt $ 2,854 $ 12,803
The University’s interest rate swaps, along with their associated variable rate debt and significant terms, are summarized below.
The floating-to-fixed interest rate swap associated with the Series 2008B General Revenue Bonds has a notional amount of $78,890,000 and $84,525,000 at June 30, 2014 and 2013, respectively, covering a portion of the principal outstanding and the notional amount decreases as principal on the underlying bonds is repaid. Effective from April 1, 2008, the University makes payments based on a fixed rate of 3.105 percent and receives variable rate payments from the swap counterparty based on 68 percent of One-Month USD LIBOR, until the swap terminates in April 2026. The University has the option to terminate the swap upon five business day written notice and payment of the fair market compensation for the value of the swap. This swap is considered an effective hedge at June 30, 2014 and 2013 and has a fair value of ($8,339,000) and ($9,075,000), respectively.
The floating-to-fixed interest rate swap associated with the Series 2005B Hospital Revenue Bonds has a notional amount of $54,605,000 and $58,315,000 at June 30, 2014 and 2013, respectively. The Series 2005B Hospital Revenue Bonds were refunded on February 1, 2013, and the swap is now associated with the Series 2012D-2 General Revenue Bonds. Effective from December 1, 2005, the University makes payments based on a fixed rate of 3.229 percent and receives variable rate payments from the swap counterparty based on 68 percent of the One-Month USD LIBOR, until the bonds mature in December 2025. The University has the option to terminate the swap upon five business day written notice and payment of the fair market compensation for the value of the swap. This swap is considered an effective hedge at June 30, 2014 and 2013 and has a fair value of ($5,759,000) and ($6,414,000), respectively.
The floating-to-fixed interest rate swap associated with the Series 2002 General Revenue Bonds has a notional amount of $28,210,000 and $34,450,000 at June 30, 2014 and 2013, respectively, covering a portion of the principal outstanding and the notional amount decreases as principal on the underlying bonds is repaid. Effective from June 1, 2007, the University makes payments based on a fixed rate of 3.5375 percent and receives variable rate payments from the swap counterparty based on 68 percent of One-Month USD LIBOR, through April 1, 2009, and 63 percent of the Five-Year USD LIBOR Swap Rate for the balance of the term, through April 2018. The University has the option to terminate the swap upon five business day written notice and payment of the fair market compensation for the value of the swap. This swap is not considered an effective hedge at June 30, 2014 and 2013 and has a fair value of ($1,480,000) and ($2,069,000), respectively.
The floating-to-fixed interest rate swap associated with the Series 1998A-2 Hospital Revenue Refunding Bonds has a notional amount of $44,670,000 at June 30, 2014 and 2013 tied to the outstanding balance of the bonds. The Series 1998A-2 Hospital Revenue Refunding Bonds were refunded on January 4, 2013, and the swap is now associated with the Series 2012D-1 General Revenue Bonds. Effective from May 14, 1998, the University makes payments based on a fixed rate of 4.705 percent and receives variable rate payments from the swap counterparty based on the floating Securities Industry and Financial Markets Association (SIFMA) Municipal Index through the final maturity dates of the underlying bonds in December 2024. The counterparty has the option of terminating the swaps if for any 180-day period the average variable rate is more than 7.0 percent. This swap is considered an effective hedge at June 30, 2014 and 2013 and has a fair value of ($11,076,000) and ($11,596,000), respectively.
n o t e s t o c o n s o l I d A t e d f I n A n c I A l s t A t e M e n t s
The floating-to-fixed interest rate swap associated with the Series 1998A-1 Medical Service Plan Revenue Refunding Bonds has a notional amount of $28,115,000 and $30,925,000 at June 30, 2014 and 2013, respectively, tied to the outstanding balance of the bonds. The Series 1998A-1 Medical Service Plan Revenue Refunding Bonds were refunded on January 4, 2013, and the swap is now associated with the Series 2012D-1 General Revenue Bonds. Effective from May 14, 1998, the University makes payments based on a fixed rate of 4.685 percent and receives variable rate payments based on the floating SIFMA Municipal Index through the final maturity dates of the underlying bonds in December 2024. The counterparty has the option of terminating the swaps if for any 180-day period the average variable rate is more than 7.0 percent. This swap is considered an effective hedge at June 30, 2014 and 2013 and has a fair value of ($4,038,000) and ($4,981,000), respectively.
Using rates in effect at June 30, 2014, the projected cash flows for the floating-to-fixed interest rate swaps deemed effective cash flow hedges, along with the debt service requirements of the associated variable rate debt, are summarized as follows:
Variable Rate Bonds Swap Total (in thousands) Principal Interest Payments, Net Payments 2015 $ 12,675 $ 94 $ 7,281 $ 20,0502016 13,205 89 6,848 20,1422017 13,775 83 6,368 20,2262018 14,020 77 5,898 19,9952019 13,770 72 5,412 19,2542020-2024 98,480 266 18,079 116,8252025-2029 79,405 84 834 80,3232030 2,135 2,135 $ 247,465 $ 765 $ 50,720 $ 298,950
By using derivative financial instruments to hedge exposures to changes in interest rates, the University is exposed to termination risk and basis risk. There is termination risk with floating-to-fixed interest rate swaps because the University or swap counterparty may terminate a swap if the other party fails to perform under the terms of the contract or its credit rating falls below investment grade. Termination risk is the risk that the associated variable rate debt no longer carries a synthetic fixed rate and if at the time of termination a swap has a negative fair value, the University is liable to the counterparty for payment equal to the swap’s fair value. The University is also exposed to basis risk because some of the variable payments paid to the University by the counterparties are based on a percentage of LIBOR. Basis risk is the risk that changes in the relationship between SIFMA and LIBOR may impact the synthetic fixed rate of the variable rate debt. The University is not exposed to credit risk because the swaps have negative fair values. The University is subject to collateral requirements with its counterparties on certain derivative instrument positions. To meet trading margin requirements for bond futures, the University had cash and U.S. government securities with a fair value of $1,443,000 and $611,000 at June 30, 2014 and 2013, respectively, on deposit with the its futures broker as collateral. To meet collateral requirements for a total return swap with a notional amount of $56,695,000 at June 30, 2013, the University posted cash collateral of $3,760,000 in May 2013, which was still outstanding at June 30, 2013. The cash collateral was returned upon expiration of the total return swap in August 2013 and no additional cash collateral was posted in 2014. For certain floating-to-fixed interest rate swaps, the University was required to post collateral if the fair value of the liability of the swap reaches a minimum threshold. For the swap that was formerly associated with the Series 1998A-1 Medical Service Plan Revenue Refunding Bonds, and now associated with the Series 2012D-1 General Revenue Bonds the University posted collateral of $1,200,000 during the first half of fiscal 2013, which was returned in January 2013. At June 30, 2014, there are no collateral requirements for interest rate swaps associated with the University’s debt.

20
14 A
NN
UA
L R
EP
OR
T F
ina
ncia
l Sta
temen
ts
8 3
20
14 A
NN
UA
L R
EP
OR
T F
ina
ncia
l Sta
temen
ts
8 2
N O T E 8 – s E L F - i N s U R A N c E
The University is self-insured for medical malpractice, workers’ compensation, directors and officers’ liability, property damage, auto liability and general liability through Veritas Insurance Corporation, a wholly-owned captive insurance company. The University is also self-insured for various employee benefits through internally maintained funds.
Claims and expenses are reported when it is probable that a loss has occurred and the amount of the loss can be reasonably estimated. Those losses include an estimate of claims that have been incurred but not reported and the future costs of handling claims. These liabilities are generally based on actuarial valuations and are reported at present value, discounted at a rate of 6 percent.
Changes in the total reported liability for insurance and benefits obligations for the years ended June 30, 2014 and 2013 are summarized as follows:
(in thousands) 2014 2013Balance, beginning of year $ 195,588 $ 186,976 Claims incurred and changes in estimates 515,134 474,310 Claim payments (516,058) (465,698)Balance, end of year 194,664 195,588Less current portion 86,014 86,173 $ 108,650 $ 109,415
N O T E 9 – P O s T E m P L O y m E N T b E N E F i T s
The University provides retiree health and welfare benefits, primarily medical, prescription drug, dental and life insurance coverage, to eligible retirees and their eligible dependents. Substantially all of the approximately 38,000 full-time permanent University employees may become eligible for these benefits if they reach retirement age while working for the University. For employees retiring on or after January 1, 1987, contributions toward health and welfare benefits are shared between the University and the retiree and can vary based on date of hire, date of retirement, age and coverage elections.
The University also provides income replacement benefits, retirement savings contributions and health and life insurance benefits to substantially all permanent University employees that are enrolled in a University sponsored long-term disability plan and qualify, based on disability status while working for the University, to receive basic or expanded long-term disability benefits. Contributions toward the expanded long-term disability plan are shared between the University and employees and vary based on years of service, annual base salary and coverage elections. Contributions toward the basic long-term disability plan are paid entirely by the University.
These postemployment benefits are provided through single-employer plans administered by the University. The Executive Vice Presidents of the University have the authority to establish and amend benefit provisions of the plans.
The University’s annual postemployment benefits expense is actuarially determined in accordance with GASB Statement No. 45, Accounting and Financial Reporting by Employers for Postemployment Benefits Other Than Pensions (“GASB 45”). Projections of benefits are based on the substantive plan (the plan as understood by the employer and the plan members) and include the types of benefits provided and announced future changes at the time of each valuation and the historical pattern of sharing of benefit costs between the employer and plan members to that point.
The University implemented GASB 45 in 2008 and elected to amortize its initial unfunded actuarial accrued liability over one year, the minimum period allowed by the Statement. The University also elected to amortize subsequent changes in actuarial assumptions, plan design and experience gains and losses over a ten year closed period. Therefore, the liability for net postemployment benefits obligations recorded in the statement of net position will differ from the actuarial accrued liability by the unamortized portion of these changes. At June 30, 2014, the recorded liability for net postemployment benefits obligations and the actuarial accrued liability totaled $1,731,454,000 and $1,458,283,000, respectively.
n o t e s t o c o n s o l I d A t e d f I n A n c I A l s t A t e M e n t s
Changes in the total reported liability for postemployment benefits obligations for the years ended June 30, 2014 and 2013 are summarized as follows:
Since a portion of retiree medical services will be provided by the University’s Health System, the liability for postemployment benefits obligations is net of the related margin and fixed costs of providing those services which totaled $303,492,000 of actuarial accrued liability at June 30, 2014 and $290,402,000 at June 30, 2013. In accordance with GASB 45, the University’s liability for postemployment benefits obligations at June 30, 2014 is not reduced by the anticipated Medicare Retiree Drug Subsidy for future periods of approximately $200,000,000 on an actuarial accrued liability basis.
The annual required contribution represents a level of funding that an employer is projected to need in order to prefund its obligations for postemployment benefits over its employees’ years of service and totals $121,796,000 and $105,503,000 at June 30, 2014 and 2013, respectively. The University has no obligation to make contributions in advance of when insurance premiums or claims are due for payment and currently pays for postemployment benefits on a pay-as-you-go basis. The University’s obligations for postemployment benefits at June 30, 2014, 2013 and 2012 as a percentage of covered payroll of $3,083,357,000, $2,979,189,000 and $2,826,760,000, was 56, 57 and 59 percent, respectively.
2014 (in thousands) Retiree Health and Welfare Long-term Disability TotalBalance, beginning of year $ 1,556,284 $ 141,807 $ 1,698,091 Service cost 44,762 7,721 52,483 Amortization of assumption changes, plan changes and net actuarial (gains) losses (71,427) 6,923 (64,504) Interest cost 94,622 11,174 105,796 Payments of current premiums and claims (43,343) (17,069) (60,412)Balance, end of year 1,580,898 150,556 1,731,454Less current portion 47,826 18,436 66,262 $ 1,533,072 $ 132,120 $ 1,665,192
2013 (in thousands) Retiree Health and Welfare Long-term Disability TotalBalance, beginning of year $ 1,531,220 $ 140,344 $ 1,671,564 Service cost 43,330 2,656 45,986 Amortization of assumption changes, plan changes and actuarial (gains) losses (71,676) 1,126 (70,550) Interest cost 93,098 11,059 104,157 Payments of current premiums and claims (39,688) (13,378) (53,066)Balance, end of year 1,556,284 141,807 1,698,091Less current portion 44,189 17,069 61,258 $ 1,512,095 $ 124,738 $ 1,636,833

20
14 A
NN
UA
L R
EP
OR
T F
ina
ncia
l Sta
temen
ts
8 5
20
14 A
NN
UA
L R
EP
OR
T F
ina
ncia
l Sta
temen
ts
8 4
N O T E 9 – P O s T E m P L O y m E N T b E N E F i T s , c O N T i N U E d
The University’s liability for postemployment benefits obligations was calculated using the projected unit credit method. Significant actuarial methods and assumptions used in the valuation for the years ended June 30, 2014 and 2013 are as follows:
N O T E 1 0 – R E T i R E m E N T P L A N
The University has a defined contribution retirement plan for all qualified employees through the Teachers Insurance and Annuity Association-College Retirement Equities Fund (“TIAA-CREF”) and Fidelity Management Trust Company (“FMTC”) mutual funds. All regular and supplemental instructional and primary staff are eligible to participate in the plan based upon age and service requirements. Participants maintain individual contracts with TIAA-CREF, or accounts with FMTC, and are fully vested.
Eligible employees generally contribute 5 percent of their pay and the University generally contributes an amount equal to 10 percent of employees’ pay to the plan. The University contribution commences after an employee has completed one year of employment. Participants may elect to contribute additional amounts to the plans within specified limits that are not matched by University contributions. Contributions and covered payroll under the plan (excluding participants’ additional contributions) for the three years ended June 30, 2014 are summarized as follows:
n o t e s t o c o n s o l I d A t e d f I n A n c I A l s t A t e M e n t s
N O T E 1 1 – N E T P O s i T i O N
The composition of net position at June 30, 2014 and 2013 is summarized as follows:
(in thousands) 2014 2013Net investment in capital assets $ 3,697,894 $ 3,637,027 Restricted: Nonexpendable: Permanent endowment corpus 1,535,326 1,432,191 Expendable: Net appreciation of permanent endowments 1,725,281 1,338,629 Funds functioning as endowment 2,007,676 1,748,356 Restricted for operations and other 738,724 602,223Unrestricted 3,353,173 2,724,703 $ 13,058,074 $ 11,483,129
Unrestricted net position, as defined by GASB, is not subject to externally imposed stipulations; however, they are subject to internal restrictions. For example, unrestricted net position may be designated for specific purposes by action of management or the Board of Regents. At June 30, 2014 and 2013, all of the unrestricted net position has been designated for various academic and research programs and initiatives, and capital projects.
N O T E 1 2 – F E d E R A L d i R E c T L E N d i N g P R O g R A m
The University distributed $327,598,000 and $346,634,000 for the years ended June 30, 2014 and 2013, respectively, for student loans through the U.S. Department of Education (“DoED”) federal direct lending program. These distributions and related funding sources are not included as expenses and revenues in the accompanying financial statements. The statement of net position includes a payable of $1,319,000 and a receivable of $2,586,000 at June 30, 2014 and 2013, respectively, for DoED funding received prior or subsequent to distribution.
N O T E 1 3 – c O m m i T m E N T s A N d c O N T i N g E N c i E s
Authorized expenditures for construction and other projects unexpended as of June 30, 2014 were $1,244,559,000. Of these expenditures, approximately $1,115,488,000 will be funded by internal sources, gifts, grants and future borrowings, $76,628,000 by the State Building Authority and the remaining $52,443,000 will be funded using unexpended debt proceeds.
Under the terms of various limited partnership agreements approved by the Board of Regents or by University officers, the University is obligated to make periodic payments for advance commitments to venture capital, private equity, real estate, natural resources and absolute return strategies. As of June 30, 2014, the University had committed, but not paid, a total of $2,290,059,000 in funding for these alternative investments. Based on historical capital calls and discussions with those managing the limited partnerships, outstanding commitments for such investments are anticipated to be paid in the following years ended June 30 (in thousands):
2015 $ 835,3802016 567,3212017 376,9302018 194,0222019 119,8402020 and beyond 196,566 $ 2,290,059
2014 Retiree Health and Welfare Long-term DisabilityDiscount Rate 6.08% 7.88%Immediate/Ultimate Administrative Trend Rate 0.0%/3.0% 0.0%/3.0%Immediate/Ultimate Medical Trend Rate 6.0%-8.0%/5.0% 6.0%-8.0%/5.0%Immediate/Ultimate Rx Trend Rate 7.0%/5.0% 7.0%/5.0%Expected Retirement Age (Faculty/Staff/Union) 66/62/61 Not ApplicableMortality/Termination Table RP-2000 Generational 2005 SOA Life Waiver (Modified) 2013 Retiree Health and Welfare Long-term DisabilityDiscount Rate 6.08% 7.88%Immediate/Ultimate Administrative Trend Rate 0.0%/3.0% 0.0%/3.0%Immediate/Ultimate Medical Trend Rate 6.0%-8.0%/5.0% 6.0%-8.0%/5.0%Immediate/Ultimate Rx Trend Rate 7.0%/5.0% 7.0%/5.0%Expected Retirement Age (Faculty/Staff/Union) 66/62/61 Not ApplicableMortality/Termination Table RP-2000 Generational 2005 SOA Life Waiver (Modified)
(in thousands) 2014 2013 2012University contributions $ 245,973 $ 234,036 $ 226,517Employee contributions $ 127,815 $ 122,094 $ 117,127Payroll covered under plan $ 3,083,357 $ 2,979,189 $ 2,826,760Total payroll $ 3,230,004 $ 3,092,257 $ 2,963,848

20
14 A
NN
UA
L R
EP
OR
T F
ina
ncia
l Sta
temen
ts
8 7
20
14 A
NN
UA
L R
EP
OR
T F
ina
ncia
l Sta
temen
ts
8 6
N O T E 1 3 – c O m m i T m E N T s A N d c O N T i N g E N c i E s , c O N T i N U E d
These commitments are generally able to be called prior to an agreed commitment expiration date and therefore may occur earlier or later than estimated.
The University has entered into capital and operating leases for certain space and equipment, which expire at various dates through 2039. Outstanding commitments for these leases are expected to be paid in the following years ended June 30:
Operating lease expenses totaled $35,921,000 and $34,252,000 in 2014 and 2013, respectively.
Substantial amounts are received and expended by the University under federal and state programs and are subject to audit by cognizant governmental agencies. This funding relates to research, student aid, patient care and other programs. The University believes that any liabilities arising from such audits will not have a material effect on its financial position.
The University is a party to various pending legal actions and other claims in the normal course of business, and is of the opinion that the outcome of these procedings will not have a material adverse effect on its financial position.
N O T E 1 4 – O P E R AT i N g E x P E N s E s b y F U N c T i O N
Operating expenses by functional classification for the years ended June 30, 2014 and 2013 are summarized as follows:
(in thousands) Capital Operating2015 $ 5,489 $ 33,1652016 2,725 25,6552017 2,725 21,2102018 2,725 13,7062019 2,725 10,1302020-2024 14,305 26,9402025-2029 15,020 4,0682030-2034 15,775 8472035-2039 16,560 78,049 $ 135,721Less amount representing interest 42,263 Present value of net minimum capital lease payments $ 35,786
2014 Compensation Supplies Scholarships and and and (in thousands) Benefits Services Depreciation Fellowships Total
Instruction $ 823,611 $ 130,339 $ 953,950Research 472,939 235,828 708,767Public service 101,342 51,426 152,768Academic support 201,436 45,162 246,598Student services 74,893 21,541 96,434Institutional support 143,768 56,136 199,904Operations and maintenance of plant 42,915 234,466 277,381Auxiliary enterprises 2,289,944 843,651 3,133,595Depreciation $ 487,458 487,458Scholarships and fellowships $ 124,465 124,465 $ 4,150,848 $ 1,618,549 $ 487,458 $ 124,465 $ 6,381,320
2013 Compensation Supplies Scholarships and and and (in thousands) Benefits Services Depreciation Fellowships Total
Instruction $ 797,370 $ 127,157 $ 924,527Research 489,283 260,901 750,184Public service 96,487 52,386 148,873Academic support 194,688 47,467 242,155Student services 70,961 21,364 92,325Institutional support 145,676 50,668 196,344Operations and maintenance of plant 41,371 214,907 256,278Auxiliary enterprises 2,129,194 780,950 2,910,144Depreciation $ 476,898 476,898Scholarships and fellowships $ 123,287 123,287 $ 3,965,030 $ 1,555,800 $ 476,898 $ 123,287 $ 6,121,015
n o t e s t o c o n s o l I d A t e d f I n A n c I A l s t A t e M e n t s

This report, as well as reports from previous years, may be viewed
online at: finops.umich.edu/reporting/annualreports.
Nondiscrimination Policy
The University of Michigan, as an equal opportunity/affirmative
action employer, complies with all applicable federal and state laws
regarding nondiscrimination and affirmative action. The University of
Michigan is committed to a policy of equal opportunity for all persons
and does not discriminate on the basis of race, color, national origin,
age, marital status, sex, sexual orientation, gender identity, gender
expression, disability, religion, height, weight, or veteran status in
employment, educational programs and activities, and admissions.
Inquiries or complaints may be addressed to the Senior Director for
Institutional Equity, and Title IX/Section 504/ADA Coordinator, Office of
Institutional Equity, 2072 Administrative Services Building, Ann Arbor,
Michigan 48109-1432, 734-763-0235, TTY 734-647-1388. For other
University of Michigan information call 734-764-1817.
Photos by: Michigan Photography, Joseph Xu, Zoha Momin
Design and Production by: Michigan Creative
MC130483
©2014 Regents of the University of Michigan
Office of the Executive Vice President
and Chief Financial Officer
3014 Fleming Administration Building
503 Thompson Street
Ann Arbor, MI 48109-8730
umich.edu
This report was printed with vegetable-
based inks on recycled paper stock with
30 percent post-consumer fiber, and is
certified to Forest Stewardship Council
(FSC) standards.
20
14 A
NN
UA
L R
EP
OR
T O
fficers an
d S
taff
8 8
R E g E N T s O f T h E U N i v E R s i T y O f M i c h i g A N Mark J. Bernstein, Ann ArborJulia Donovan Darlow, Ann ArborLaurence B. Deitch, Bloomfield HillsShauna Ryder Diggs, Grosse PointeDenise Ilitch, Bingham FarmsAndrea Fischer Newman, Ann Arbor Andrew C. Richner, Grosse Pointe Park Katherine E. White, Ann Arbor Mary Sue Coleman, ex officioMark S. Schlissel, ex officio [7/14/14]
E x E c U T i v E O f f i c E R s Mary Sue Coleman, PresidentMark S. Schlissel, President [7/14/14] Sally J. Churchill, Vice President and Secretary of the UniversityS. Jack Hu, Interim Vice President for ResearchMartha E. Pollack, Provost and Executive Vice President for Academic AffairsE. Royster Harper, Vice President for Student AffairsDaniel Little, Chancellor, University of Michigan-DearbornTimothy Lynch, Vice President and General CounselJerry A. May, Vice President for DevelopmentRuth Person, Chancellor, University of Michigan-Flint Michael M. E. Johns, Interim Executive Vice President for Medical Affairs Lisa Rudgers, Vice President for Global Communications and Strategic InitiativesDouglas L. Strong, Interim Executive Vice President and Chief Financial Officer Cynthia H. Wilbanks, Vice President for Government Relations
D E A N s Ann ArborArchitecture + Urban PlanningMonica Ponce de Leon Art & DesignGunalan Nadarajan BusinessAlison Davis-Blake DentistryPeter Polverini EducationDeborah Loewenberg Ball EngineeringDavid C. Munson, Jr. Graduate StudiesJanet A. Weiss InformationJeffrey MacKie-Mason KinesiologyRonald Zernicke Law SchoolMark D. West Literature, Science, and the ArtsSusan A. Gelman, interim Medical SchoolJames O. Woolliscroft Music, Theatre & DanceChristopher Kendall Natural Resources & EnvironmentMarie Lynn Miranda
NursingKathleen Potempa PharmacyFrank J. Ascione Public HealthMartin Philbert Public PolicySusan M. Collins Social WorkLaura Lein University LibrariesPaul N. Courant
DeArbornArts, Sciences, and LettersMartin J. Hershock Engineering and Computer Science Tony W. England BusinessRaju Balakrishnan Education, Health, and Human ServicesJanine Janosky
FlintArts and SciencesAlbert C. Price, interim Education and Human ServicesBob Barnett Health Professions and StudiesDavid Gordon, MD ManagementScott Johnson
B U s i N E s s A N D f i N A N c i A L s TA f f Henry D. BaierAssociate Vice President for Facilities and Operations L. Erik Lundberg, CFAChief Investment Officer Nancy HobbsInterim Associate Vice President for Finance Jeffrey M. MoelichExecutive Director of University Audits Laura M. PattersonAssociate Vice President and Chief Information Officer Cheryl L. Soper, CPAController and Director of Financial Operations John S. Sullivan, CFA Treasurer Laurita E. ThomasAssociate Vice President and Chief Human Resource Officer
f i N A N c i A L s TA f fColin T. AndersonInterim Director of Procurement Services Antony E. BurgerDirector of Financial Analysis Michele J. Everard, CFADirector of University Investments Chad D. Greenwell, CPADivision Controller for Financial Reporting Brent C. HaaseInternal Controls Compliance Manager Michael J. HagueDivision Controller for Student Business Services Edward J. Jennings, CPATax Director Jim P. MettlachPayroll Director Holly D. NielsenExecutive Director of Application and Information Services Jonathan J. SchroederDivision Controller for Investment Accounting Debora L. TalleyInterim Director of Sponsored Programs Joan ThowsenDirector of University Investments Jarrod W. Van KirkDivision Controller for Accounting Services
o f f i c e r s a n d s t a f f A s O f j U N E 3 0 , 2 0 1 4