2014 Annual Presentation - quest.gr · Uni Systems Financial Services ... 12,828 9,513 12,143...
36
2014 Annual Presentation
Transcript of 2014 Annual Presentation - quest.gr · Uni Systems Financial Services ... 12,828 9,513 12,143...

2014 Annual Presentation

Table of Contents Part 2 AREAS of ACTIVITY
ICT Sector □ Info Quest Technologies □ Quest on Line - You.gr □ iSquare □ iStorm □ Uni Systems
Financial Services □ Cardlink
Courier & Post Services □ ACS
Renewable Energy □ Quest Energy
LOOKING AHEAD
Part 1 QUEST GROUP OVERVIEW
The Group at a glance
Milestones
Group Structure
Minority Interests (Participations)
Strategy building blocks
Competitive advantages
Shareholders
Revenue Split
Financial Performance
Impairments
Balance Sheet Items
Recent Significant Events

QUEST GROUP OVERVIEW PART 1

Quest Holdings is one of the largest holding companies in Greece
listed in the ATHEX, leading player in the ICT, Financial and Courier services sectors.
Quest Group at a glance
Active in ICT, Renewable Energy, Courier/Post and Financial Services
Diversified group with a portfolio of leading companies
Established in 1981 Listed in ATHEX since 1998
Group workforce, more than 1,200 professionals
International presence in Europe, SEE, Turkey
Significant portfolio of Real Estate Assets

Milestones
o 1996
Acquisition of
Hellas on Line, a
leading Greek
ISP. Sold to EFG-
Eurobank in
2002
o 1993
Establishment of Q-
Phone. Merged with
Palmaphone to create
Unifon, the largest
Telecom Service Provider
in Greece. Sold to
Vodafon–Panafone
in 2001
o 1991
Quest PC launched & assembled in Greece
o 1999
Acquisition
of ACS, the Courier
Services
market leader
o 2002
Establishment
of Q Telecom, as the 4th mobile telecom operator. Sold to TPG & APAX in 2005, (owner of TIM Hellas, currently WIND Hellas).
o 1998
Listing in ATHEX
o 2007
Acquisition of
Uni Systems. Merged with the Solutions Division of Info-Quest to create the leading IT integrator in Greece
o 2006
Establishment
of Quest Energy, a Renewable Energy Producer
o 2010
Establishment
of iStorm. An “Apple Premium Reseller” retail outlets
o 2012
Re-launch of e-commerce activity for technology and FMCG products
o 2015
Acquisition
οf Cardlink, Leader in POS Terminal Deployment
o 2013
Establishment of IQbility, an initiative to support startups
o 2009
Establishment of
iSquare. Merged with Rainbow, the Apple Authorized Distributor for Greece and Cyprus
o 2011
Spin-off of the commercial activity “Info-Quest Technologies”. The remaining
entity is Quest Holdings
o 1981
Info-Quest SA Establishment

Group Structure
Courier & Post
Services
Renewable
Energy
Financial
Services
Information Technology
IT Products &
Services Distribution
Integrated
Solutions
Retail

Minority Interests (Participations in IT Companies)
21,5%
33,5%
16,88%
35,48%
25%
33%

Strategy Building Blocks
Customer Driven
Diversification
International Expansion
Innovation
Operational Excellence
Human Capital & Values

Competitive Advantages
Established brand names
Flexibility, consistent expansion pattern and optimum
utilization of human resources
Skilled management team
Time-tested partnerships and strong customer base
Track record in creating value for the shareholders,
employees and customers
International Presence in Europe, SEE, Turkey
Financially Sound

Shareholders
Capital return to the Shareholders
□ 2013: Capital Return to the shareholders amounting € 13.159k (€ 1,10 per share)
□ 2012: Capital Return to the shareholders amounting € 9.614k (€ 0,20 per share)
Total Capital Return 2012-2013: € 22.773k
Total # of shares: 11.962.443
Theodoros Fessas 51.07%
Efi Koutsoureli
25.15%
Free Float 23.78%
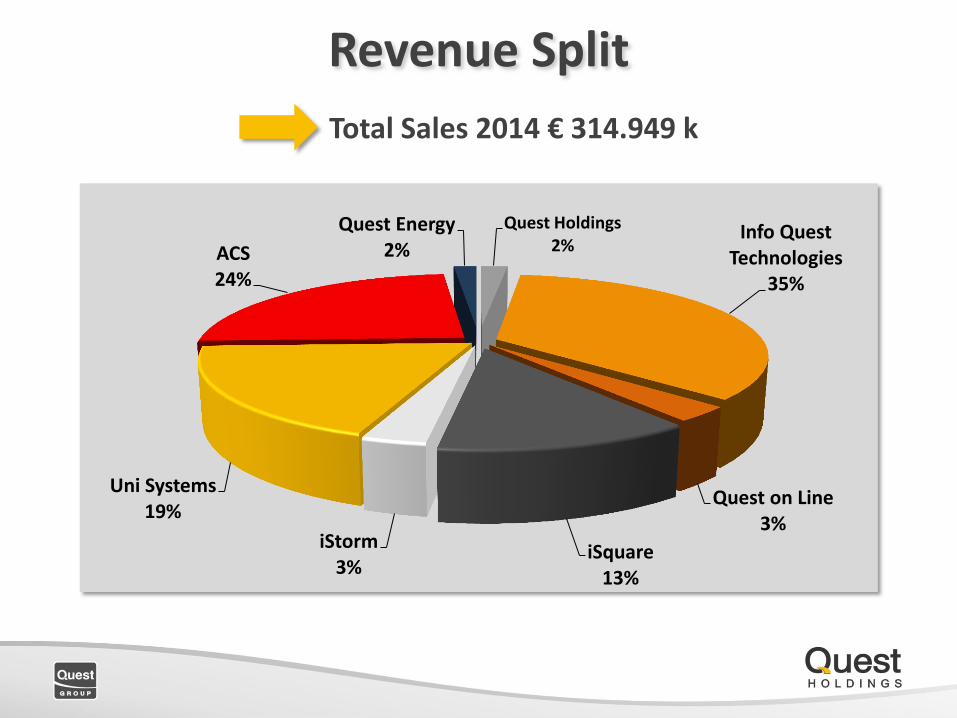
Revenue Split
Total Sales 2014 € 314.949 k
Quest Holdings 2%
Info Quest Technologies
35%
Quest on Line 3%
iSquare 13%
iStorm 3%
Uni Systems 19%
ACS 24%
Quest Energy 2%

Financial Performance
240,000
260,000
280,000
300,000
320,000
340,000
2010 2011 2012 2013 2014
331,463
307,333
282,918
294,652
314,949
SALES
0
5,000
10,000
15,000
20,000
2010 2011 2012 2013 2014
9,276
12,828
9,513
12,143
19,861 EBITDA
0
2,000
4,000
6,000
2010 2011 2012 2013 2014
4,519
5,825
1,322 1,602
3,588
EBT
Amounts in ,000 €
Amounts in ,000 €
Amounts in ,000 €
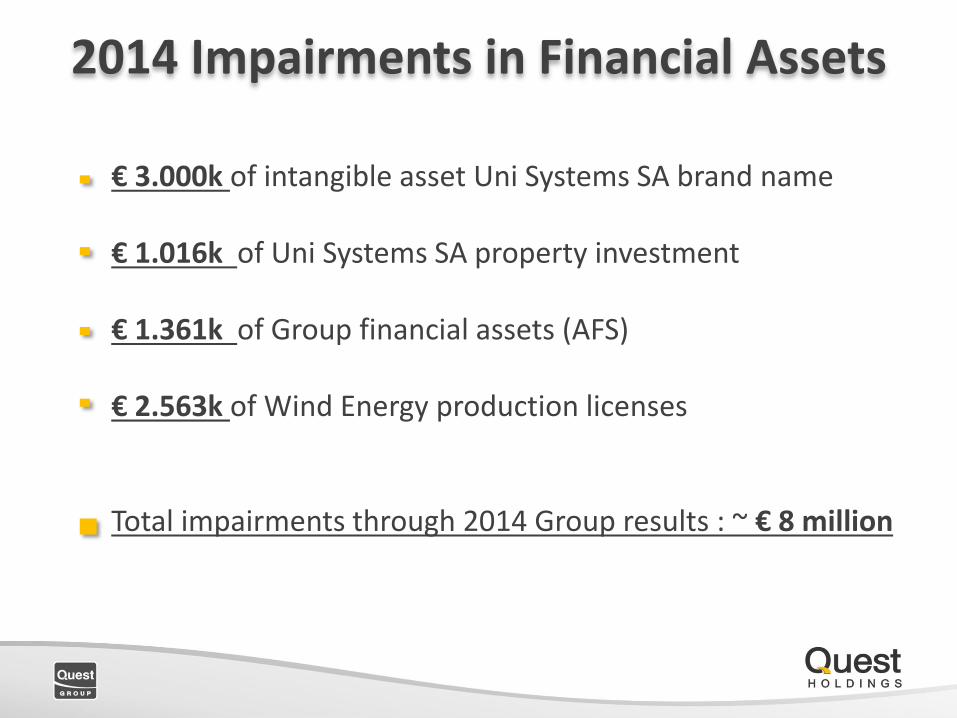
2014 Impairments in Financial Assets
€ 3.000k of intangible asset Uni Systems SA brand name € 1.016k of Uni Systems SA property investment € 1.361k of Group financial assets (AFS) € 2.563k of Wind Energy production licenses Total impairments through 2014 Group results : ~ € 8 million
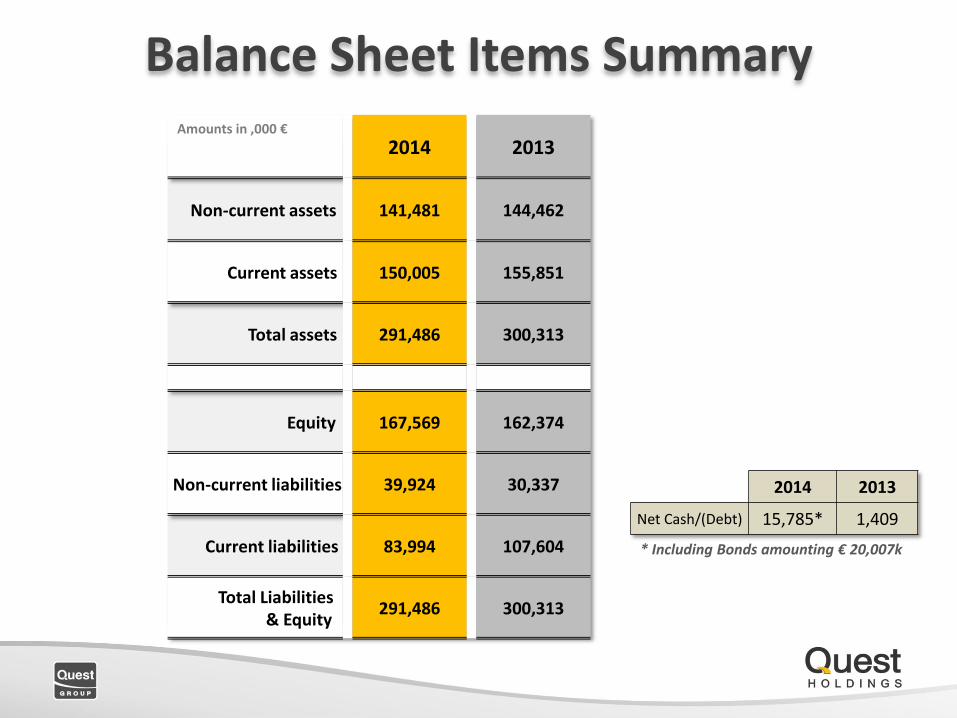
2014 2013
Net Cash/(Debt) 15,785* 1,409
* Including Bonds amounting € 20,007k
Balance Sheet Items Summary
2014 2013
Non-current assets 141,481 144,462
Current assets 150,005 155,851
Total assets 291,486 300,313
Equity 167,569 162,374
Non-current liabilities 39,924 30,337
Current liabilities 83,994 107,604
Total Liabilities & Equity
291,486 300,313
Amounts in ,000 €

Q1 ‘15 Major Events
Acquisition of “Cardlink” for a total consideration of €15.000k
Cardlink operates as POS terminal network, for electronic transactions with credit & debit cards. Property acquisition (26,500 m2) from “ACS” for a total consideration amounting to € 7.250k Acquisition of 21,5% of “Impact” for a total amount € 700k iSquare becomes the “Open” distributor of i-phone in Greece and Cyprus

QUEST GROUP AREAS OF ACTIVITY PART 2

Addressable Market Segments

ICT Sector
Quest Group, operates in the ICT sector for 35 years through some of the leading companies in the industry.

The major ICT Products & Services Distributor
Company Snapshot Main areas of activity
Value Added Distribution
Cloud Services
e-Commerce
Largest distributor (by sales) of H/W and S/W products in Greece
Authorized partner of the major global vendors (HP, IBM, Dell, Lenovo, Microsoft, Softlayer, Intel, Cisco, EMC, Autodesk etc.)
Provider of full lifecycle (presales, sales, training, support) value-added IT solutions, through an extensive network of resellers and System Integrators throughout Greece
Enabler of streamlined transition from CAPEX to OPEX, via platforms and partnerships
Own Brand assembler and distributor (Quest PCs and Bitmore products)
Authorized Service provider for major IT vendors (Apple, HP, Lenovo)

-3,000
-2,000
-1,000
0
1,000
2,000
3,000
2010 2011 2012 2013 2014
-2,100
197
-1,028
1,817 2,275
EBITDA
0
20,000
40,000
60,000
80,000
100,000
120,000
140,000
160,000
2010 2011 2012 2013 2014
141,182
116,748
99,623 104,680
119,898
SALES
-5,000
-4,000
-3,000
-2,000
-1,000
0
1,000
2,000
2010 2011 2012 2013 2014
-4,485
-662 -1,906
901 1,051
EBT
Financial Results 2010 - 2014
Amounts in .000 €
Amounts in .000 €
Amounts in .000 €

The Quest Group Web Shop
Company Snapshot 2014 figures
Unique User Experience
Wide range of technology and FMCG products
Advanced e-commerce platform
Easy Navigation & Search
300 pick up points all over Greece for free delivery (ACS points & U shops)
Call Center for orders & customer support
Availability
Multiple options of payment
Competitive prices
4.250.000 Visits
65.500 Facebook fans
>100.000 Orders
> 80% 5* Reviews

0
2,000
4,000
6,000
8,000
10,000
12,000
2010 2011 2012 2013 2014
0 0
3,583
6,257
10,213
SALES
-1,000
-800
-600
-400
-200
0
2010 2011 2012 2013 2014
0 -21
-684
-854 -787
EBITDA
-1,000
-800
-600
-400
-200
0
2010 2011 2012 2013 2014
0 -21
-714
-929 -933
EBT
Financial Results 2010 - 2014
Amounts in .000 €
Amounts in .000 €
Amounts in .000 €

Unique User Experience
Apple’s Value Added Distributor for
Greece & Cyprus
Offers added value by creating Apps
and S/W for the Greek Apple
ecosystem
Company Snapshot
5 Apple Premium Reseller Stores
Athens (3)
Thessaloniki (2)
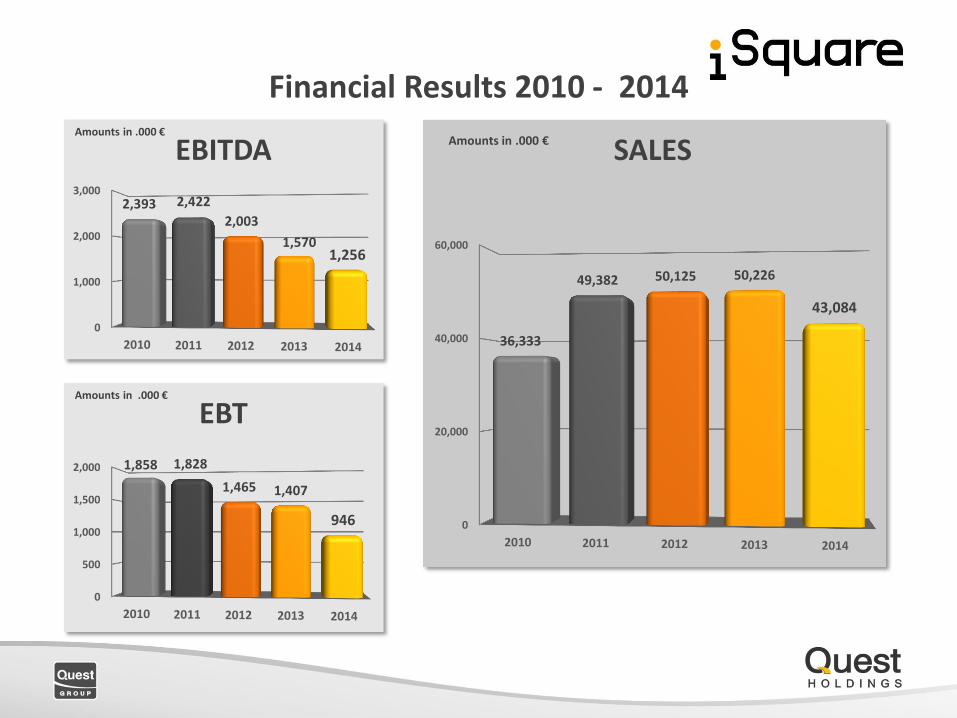
0
20,000
40,000
60,000
2010 2011 2012 2013 2014
36,333
49,382 50,125 50,226
43,084
SALES
0
1,000
2,000
3,000
2010 2011 2012 2013 2014
2,393 2,422
2,003
1,570 1,256
EBITDA
0
500
1,000
1,500
2,000
2010 2011 2012 2013 2014
1,858 1,828
1,465 1,407
946
EBT
Financial Results 2010 - 2014
Amounts in .000 €
Amounts in .000 €
Amounts in .000 €

0
2,000
4,000
6,000
8,000
10,000
12,000
2010 2011 2012 2013 2014
1,909
5,479 5,961 5,951
11,026
SALES
-500
-400
-300
-200
-100
0
100
200
2010 2011 2012 2013 2014
-472
0
-117
17
152
EBITDA
-600
-500
-400
-300
-200
-100
02010 2011 2012 2013 2014
-501
-108
-295 -275 -247
EBT
Financial Results 2010 - 2014
Amounts in .000 €
Amounts in .000 €
Amounts in .000 €

One of the leading IT companies in Greece
Company Snapshot Among the top 5 IT companies in the SEE
Strong industry vertical expertise supported by horizontal solutions
80% of revenue based on services
Wide Customer Basis, offering solutions to financial, banking, telecom, public sector and EU Institutions
Uni Systems’ Data Center supports a full portfolio of services (SaaS, PaaS, IaaS), and guarantees 99.99% availability.
Expanding in Central Europe, Turkey, and SEE
Activities in more than 30 countries
Main areas of activity
Government & Local
Authorities
Banking & Finance
Telecom Operators
Enterprises & Utilities
Systems Integration Solutions & Services for Large Enterprises

0
20,000
40,000
60,000
80,000
2010 2011 2012 2013 2014
75,383
63,858 61,576
64,582 64,908
SALES
0
1,000
2,000
3,000
4,000
5,000
6,000
2010 2011 2012 2013 2014
5,566
3,671 3,521 3,485
4,784
EBITDA
0
1,000
2,000
3,000
4,000
5,000
6,000
2010 2011 2012 2013 2014
5,274
2,043
1,019
2,084 2,188
EBT
Financial Results 2010 - 2014
Amounts in .000 €
Amounts in .000 €
Amounts in .000 €

Financial Services
Courier & Postal Services
Renewable Energy

Company Snapshot Main areas of activity
Operates the largest network of POS terminals for electronic payment transactions in Greece
In 2014, installed base of 80,000 terminals processed in excess of 55M transactions corresponding to more that €5.5B of retail activity
Company was acquired by Quest Group in January 2015
Standalone POS terminals for banks and merchants
Payment gateway for electronic commerce transactions
Financial Services

Financial Results 2013 - 2014
8,000
8,500
9,000
9,500
10,000
2013 2014
8,791
9,662
SALES
0
500
1,000
1,500
2013 2014
334
1,271
EBITDA
-2,000
-1,500
-1,000
-500
0
2013 2014
-1,571
-988
EBT
Amounts in .000 € Amounts in .000 €
Amounts in .000 €

Leader in the Greek Courier market
Company Snapshot The largest private Greek courier company
with the widest PoP network throughout Greece
3,000 specialized personnel & associate workers
More than 30,000 m2 warehouse space & 350 shops in Greece, Albania and Bulgaria.
Handling over 16,5M Courier and 22M Post shipments per year
More than 70 daily combined transportation routes/ exclusive cargo flights
Special Express Transportation (Radio-Pharmaceuticals/ Special Security Projects)
Cooperates with international courier companies (TNT, DHL, GLS) for shipments in 200 countries around the world
Main areas of activity
Courier Services Express Next Day Domestic (B2X & C2X) COD Service (B2X) Express Same Day (B2X & C2X) Value Added Services (B2X & C2X) Parcel (B2B) Freight (B2B) Special Domestic Projects (B2X) International Services (B2X & C2X) Other Retail Services
• Money Transfer • Bill receipts • Telecom Card Services • Kiosk Xpress
Post Services Advanced Mass Post (B2X) Advanced Business Post (B2X)

Financial Results 2010 - 2014
0
20,000
40,000
60,000
80,000
100,000
2010 2011 2012 2013 2014
85,365 78,320
70,975 73,076
82,304
SALES
0
2,000
4,000
6,000
8,000
2010 2011 2012 2013 2014
4,994 4,626
3,061 3,454
7,244
EBITDA
0
2,000
4,000
6,000
8,000
2010 2011 2012 2013 2014
4,650 4,208
2,949 3,054
6,707
EBT
Amounts in .000 €
Amounts in .000 €
Amounts in .000 €

Renewable Energy
Company Snapshot
Owns and operates 5 photovoltaic parks of 18,2 MW power

Financial Results 2010 - 2014
0
2,000
4,000
6,000
8,000
2010 2011 2012 2013 2014
167
4,238
5,113
6,102 5,734
SALES
-1,000
0
1,000
2,000
3,000
4,000
2010 2011 2012 2013 2014
-992
1,168
2,293 2,055
3,834
EBITDA
-2,000
-1,500
-1,000
-500
02010 2011 2012 2013 2014
-1,549
-818
-168
-1,198
-1,964
EBT*
Amounts in .000 €
Amounts in .000 €
Amounts in .000 €
• Partial impairment of energy production licenses amounting 870k for 2013, and 2,563k for 2014

Looking Ahead
Continuous development of existing activities and consolidation of our competitive positioning (e-commerce, cloud services, postal services, e-transactions etc.)
Emphasis on international expansion Systematic quest for new business opportunities Build a modern, competitive and sustainable corporation Maintain healthy Balance Sheet

THANK YOU !