KCB GROUP PLC INVESTOR PRESENTATION. · Beauty and Personal Care –945 Building and Construction...
30
KCB GROUP PLC INVESTOR PRESENTATION. FY17 FINANCIAL RESULTS JOSHUA OIGARA GROUP CEO & MD LAWRENCE KIMATHI GROUP CFO
Transcript of KCB GROUP PLC INVESTOR PRESENTATION. · Beauty and Personal Care –945 Building and Construction...

KCB GROUP PLC INVESTOR
PRESENTATION.
FY17 FINANCIAL RESULTS
JOSHUA OIGARA GROUP CEO & MD
LAWRENCE KIMATHI GROUP CFO

KCB Group at a glance
2
6,483 staff
15.7M Customers
153,431 shareholders
Market Capitalization $1.5B

Our Purpose, Values and Strategic Objectives
3
Excellence in Customer experience:
NPS target of 60%
Digital financial services / AI:
NFI contribution 40%
Excellent operations performance:
CIR 45%
Outstanding employee engagement:
85% satisfaction levelStrong shareholder value:
ROE >21%,
Growth in Youth and Women enterprises
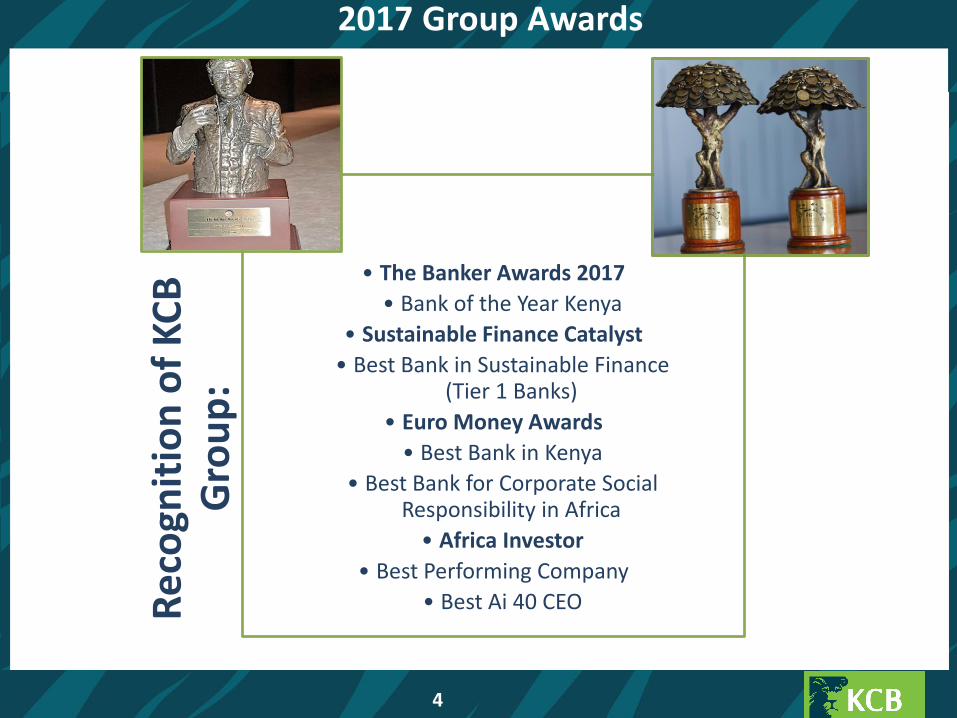
2017 Group Awards
Re
cogn
itio
n o
f K
CB
G
rou
p:
• The Banker Awards 2017
• Bank of the Year Kenya
• Sustainable Finance Catalyst
• Best Bank in Sustainable Finance (Tier 1 Banks)
• Euro Money Awards
• Best Bank in Kenya
• Best Bank for Corporate Social Responsibility in Africa
• Africa Investor
• Best Performing Company
• Best Ai 40 CEO
4
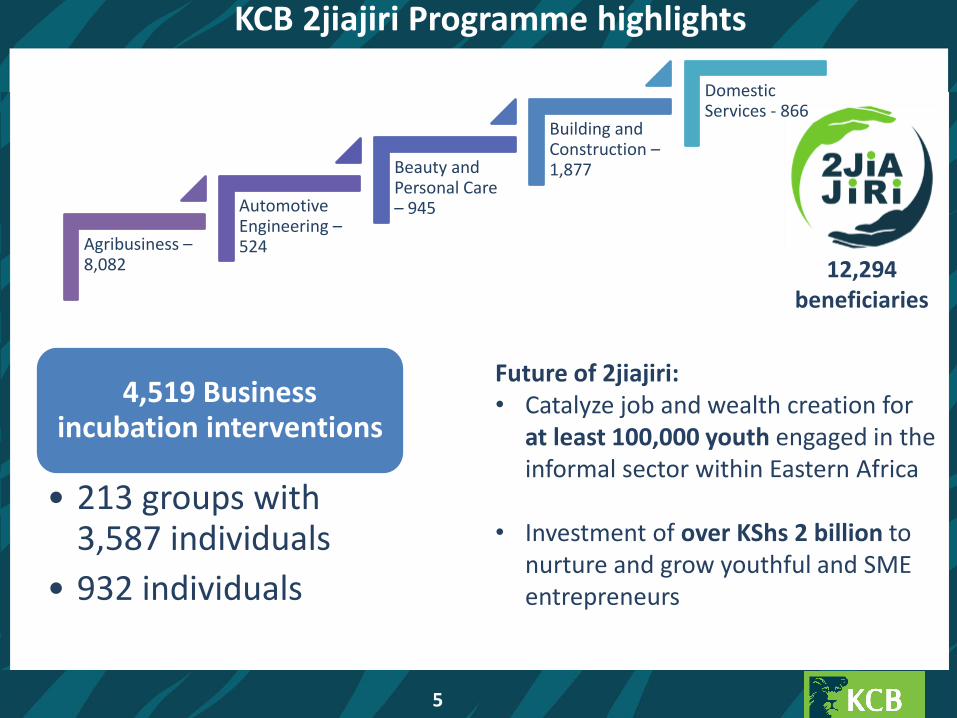
KCB 2jiajiri Programme highlights
5
12,294 beneficiaries
Agribusiness –8,082
Automotive Engineering –524
Beauty and Personal Care – 945
Building and Construction –1,877
Domestic Services - 866
4,519 Business incubation interventions
• 213 groups with 3,587 individuals
• 932 individuals
Future of 2jiajiri:• Catalyze job and wealth creation for
at least 100,000 youth engaged in the informal sector within Eastern Africa
• Investment of over KShs 2 billion to nurture and grow youthful and SMEentrepreneurs
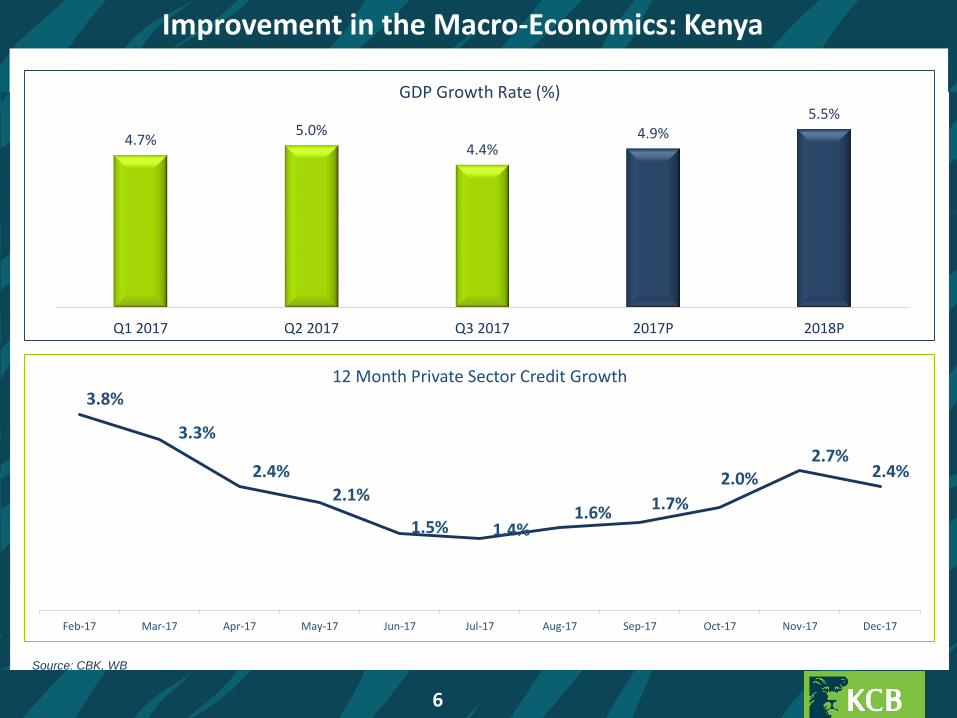
Improvement in the Macro-Economics: Kenya
6
Source: CBK, WB
4.7%5.0%
4.4%4.9%
5.5%
Q1 2017 Q2 2017 Q3 2017 2017P 2018P
GDP Growth Rate (%)
3.8%
3.3%
2.4%
2.1%
1.5% 1.4%1.6% 1.7%
2.0%2.7%
2.4%
Feb-17 Mar-17 Apr-17 May-17 Jun-17 Jul-17 Aug-17 Sep-17 Oct-17 Nov-17 Dec-17
12 Month Private Sector Credit Growth
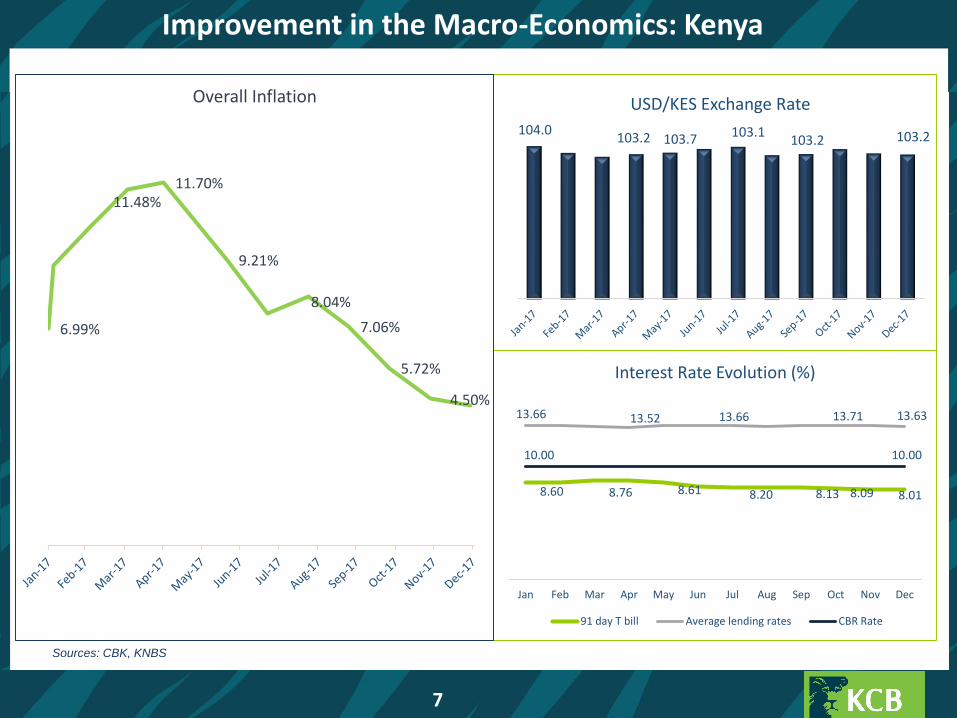
Sources: CBK, KNBS
104.0 103.2 103.7 103.1
103.2 103.2
USD/KES Exchange Rate
8.60 8.76 8.61 8.20 8.13 8.09 8.01
13.66 13.52 13.66 13.71 13.63
10.00 10.00
Jan Feb Mar Apr May Jun Jul Aug Sep Oct Nov Dec
Interest Rate Evolution (%)
91 day T bill Average lending rates CBR Rate
7
6.99%
11.48%11.70%
9.21%
8.04%
7.06%
5.72%
4.50%
Overall Inflation
Improvement in the Macro-Economics: Kenya

Sources: IMF, Bloomberg
Macro-Economic Highlights: Regional
4.9
7.07.0
(3.7)
10.3
5.4
7.0 6.9
(7.1)
9.6
4.4
6.86.0
0.5
5.44.4
6.5 6.2
0.1
8.5
Uganda Tanzania Rwanda Burundi Ethiopia
GDP (%)
2014 2015 2016 2017
13.6%11.8%
4.4%
9.8%
3.0%
9.2%
20.0%
6.0%
8.8%7.0%7.1%
14.0%
9.0%
15.0%
3.8%
8.6%6.4%
4.0%
15.0%
Tanzania Uganda Rwanda Burundi South Sudan
91 Day T-Bills
2014 2015 2016 2017
6.1%
3.1%
1.8%
7.9% 8.1%
5.4% 5.8%
7.1%
18.0%
8.1%
Tanzania Uganda Rwanda Burundi Ethiopia
Inflation
2014 2015 2016 2017
1.7%
52.8%
480.0%
182.2%
South Sudan
8
2,186
3,484
785.6
1,629
22.40 44.3
2,207
3,491
827.9
1,643
27.58 111.4
Tanzania Uganda Rwanda Burundi Ethiopia South Sudan
Exchange rates to USD
2016 2017

9
87% of Transactions outside the Branch
Source: KCB data
Mobile, 53%Branch Teller, 23%
ATMs, 13%
Agency & POS, 11%
2016
Mobile57%Branch
Teller13%
ATMs10%
Agency & POS20%
2017
10
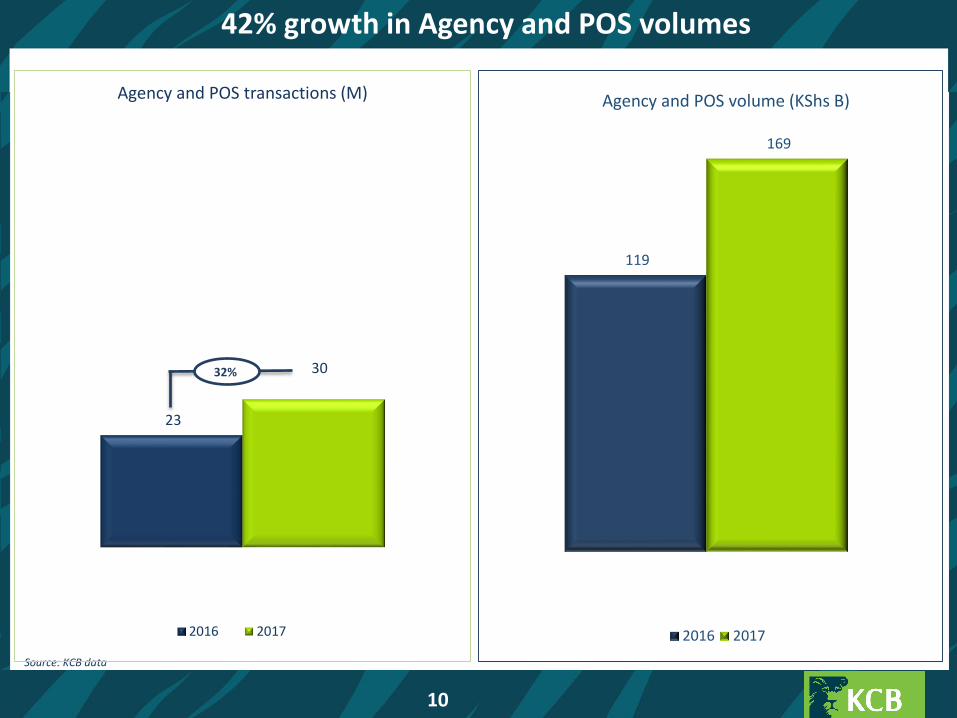
42% growth in Agency and POS volumes
Source: KCB data
23
30
Agency and POS transactions (M)
2016 2017
119
169
Agency and POS volume (KShs B)
2016 2017
32%

11
Marginal change in ATM volumes
Source: KCB data
14 15
ATMs
ATM transactions (M)
2016 2017
153 152
ATMs
ATM volume (KShs B)
2016 2017

Source: KCB data
Sustained Growth on Mobile
14.1
29.6
2016 2017
Mobile Loan Disbursement (KShs B)
12
6.5
17
53.1
88.8
2016 2017
Mobile transactions (M)
KCB App Total transactions
67%

Source: KCB data
Over 500% growth on the KCB App
13
1.43
8.72
0.81
3.34
-
0.50
1.00
1.50
2.00
2.50
3.00
3.50
4.00
-
1.00
2.00
3.00
4.00
5.00
6.00
7.00
8.00
9.00
10.00
2016 2017
KCB Mobile App Volumes
Value Transacted (B) Transaction No. (M)
35
1,2
59
76
3,0
84
11,289.96
25,243.46
-
5,000.00
10,000.00
15,000.00
20,000.00
25,000.00
30,000.00
-
100,000
200,000
300,000
400,000
500,000
600,000
700,000
800,000
900,000
2016 2017
Customer Utilization
Total Downloads Av value per customer
117%
124%
% ∆
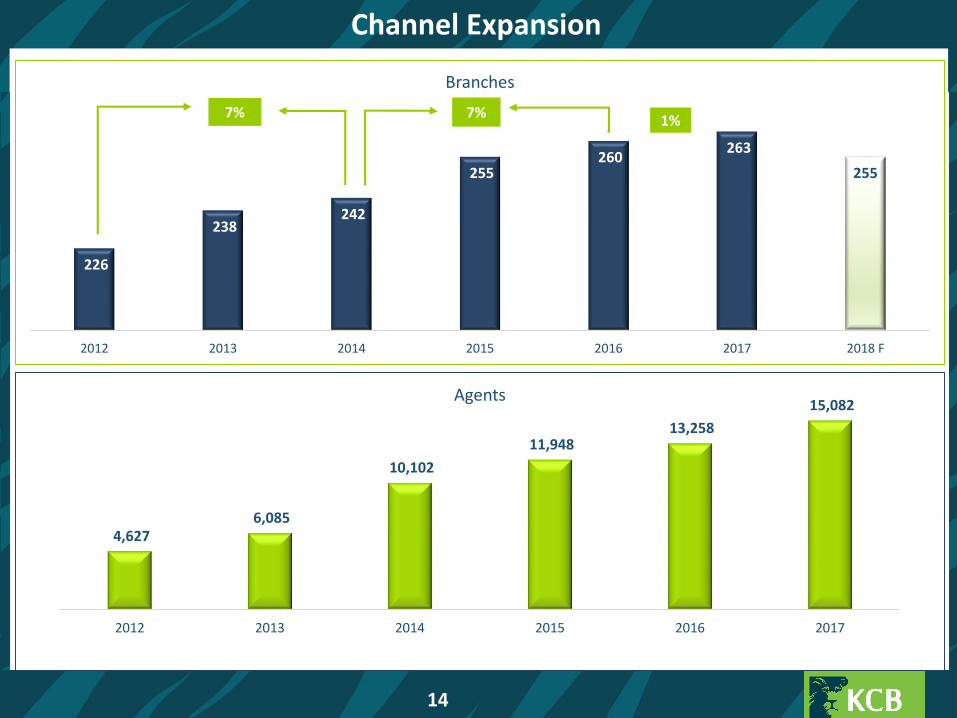
Channel Expansion
14
226
238 242
255 260
263
255
2012 2013 2014 2015 2016 2017 2018 F
Branches
7%1%
7%
4,627 6,085
10,102
11,948 13,258
15,082
2012 2013 2014 2015 2016 2017
Agents

2017 Staff Rationalization programme
15
Average age: 45 years
Staff Released: 316
35% 65%
249
67
KCB Bank Kenya KCB Subsidiaries
Distribution
0.186
2.016
2016 2017
Total Spend (Kshs B)
The key drivers of the programme
• Right sizing of the company’s resource requirements
• Alignment to advancements and changes of technology and todays’ business operating models
OUR PERFORMANCE TO DATE

Group Asset Portfolio up
9%
KShs: 647B
Net Loans and advances
up 10%
KShs: 423B Investment in Govt.
Securities up 7%
KShs: 110B
Cash and Balances with Central Bank
and other Financial
Institutions
0%
KShs:73BFixed and
other Assets up 21%
KShs: 41B
KCB Bank Kenya Asset Portfolio up
10%
KShs: 556B
Net Loans and advances
up 10%
KShs: 388B Investment in Govt.
Securities up 4%
KShs: 95B
Cash and Balances with Central Bank
and other Financial
Institutions up 21%
KShs:39BFixed and
other Assets up 23%
KShs: 34B
9% Total Assets growth driven by Net Loans & Advances
17
KCB Group KCB Bank Kenya
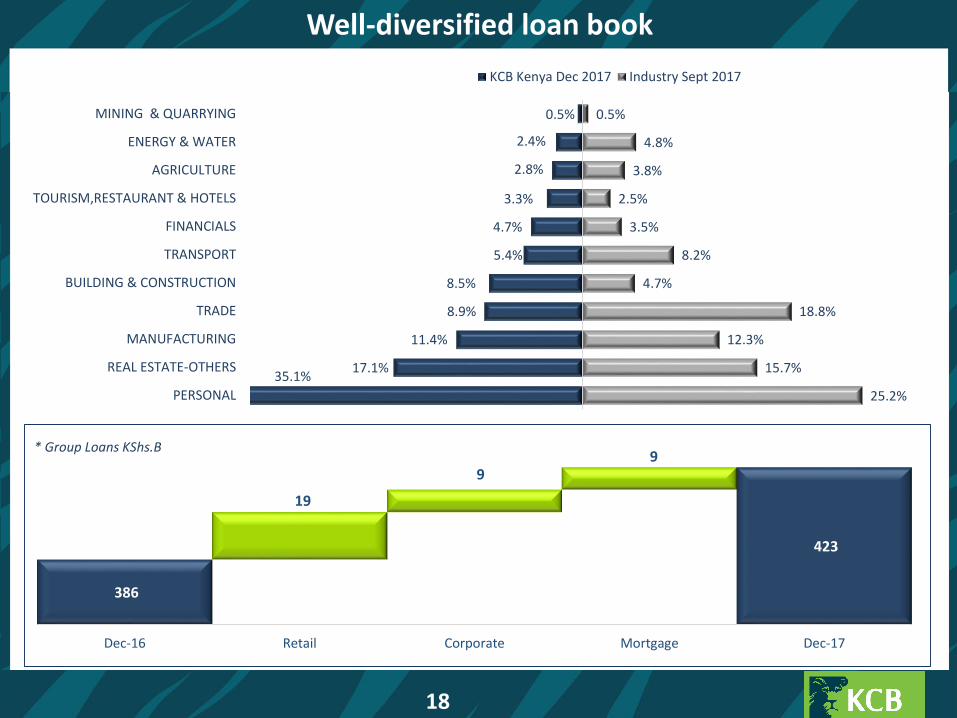
Well-diversified loan book
18
386
423
19
9 9
Dec-16 Retail Corporate Mortgage Dec-17
* Group Loans KShs.B
35.1%17.1%
11.4%
8.9%
8.5%
5.4%
4.7%
3.3%
2.8%
2.4%
0.5%
25.2%
15.7%
12.3%
18.8%
4.7%
8.2%
3.5%
2.5%
3.8%
4.8%
0.5%
PERSONAL
REAL ESTATE-OTHERS
MANUFACTURING
TRADE
BUILDING & CONSTRUCTION
TRANSPORT
FINANCIALS
TOURISM,RESTAURANT & HOTELS
AGRICULTURE
ENERGY & WATER
MINING & QUARRYING
KCB Kenya Dec 2017 Industry Sept 2017

2017 NPL Movement
19
1.0% 1.0% 1.0%1.5%
7.9% 7.9% 8.0%8.5%
Q1 2017 Q2 2017 Q3 2017 2017
CoR NPL Group
3.7%
6.2%
10.4%
13.1%
3.6%
6.5%
10.4%
12.3%
3.2%
7.3%
10.4%
15.5%
3.3%
7.8%
11.0%
16.4%
CHECK OFF MORTGAGE CORPORATE SME & MICRO
Q1 2017 Q2 2017 Q3 2017 Q4 2017

Steady Coverage Position
20
43.6%
48.7%
69.5%
74.4%
2016 2017
IFRS CBK
2017 industry position as at September
37.70%
34.5%
2016 2017
INDUSTRY
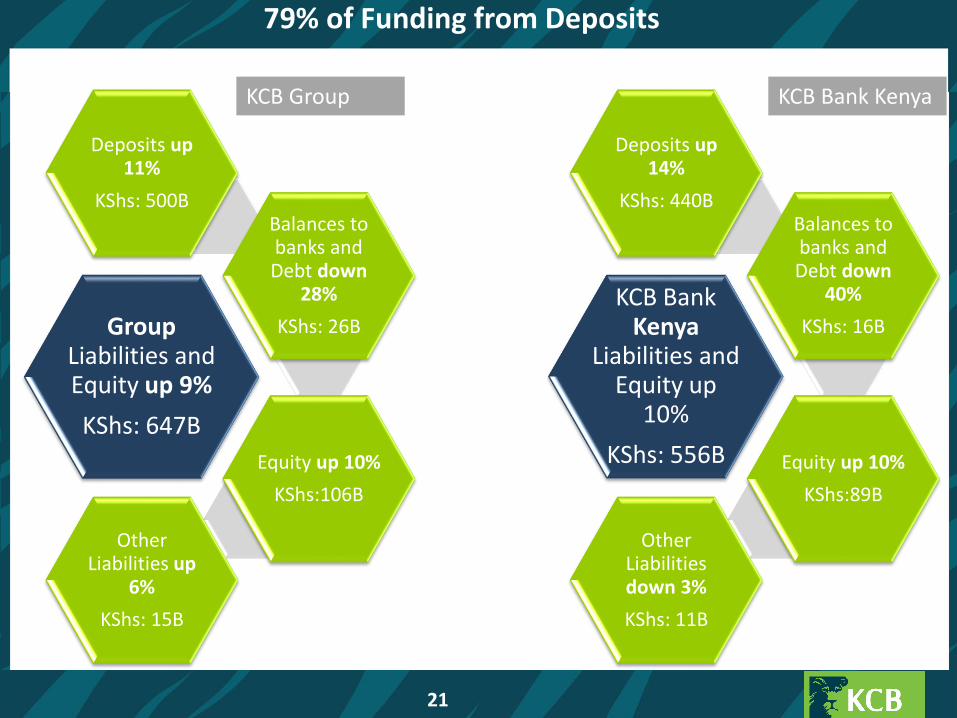
GroupLiabilities and Equity up 9%
KShs: 647B
Deposits up 11%
KShs: 500BBalances to banks and Debt down
28%
KShs: 26B
Equity up 10%
KShs:106B
Other Liabilities up
6%
KShs: 15B
KCB Bank Kenya
Liabilities and Equity up
10%
KShs: 556B
Deposits up 14%
KShs: 440BBalances to banks and Debt down
40%
KShs: 16B
Equity up 10%
KShs:89B
Other Liabilities down 3%
KShs: 11B
79% of Funding from Deposits
21
KCB Group KCB Bank Kenya

Well-funded and Diverse Portfolio
Deposits by Type FY 16
65%5%
24%
6%
Demand Savings Term Call
65%4%
26%
5%
Deposits by Type FY 17
42% 50% 51%
55% 47% 46%
2% 3% 3%
2015 2016 2017
Corporate Retail Other
22
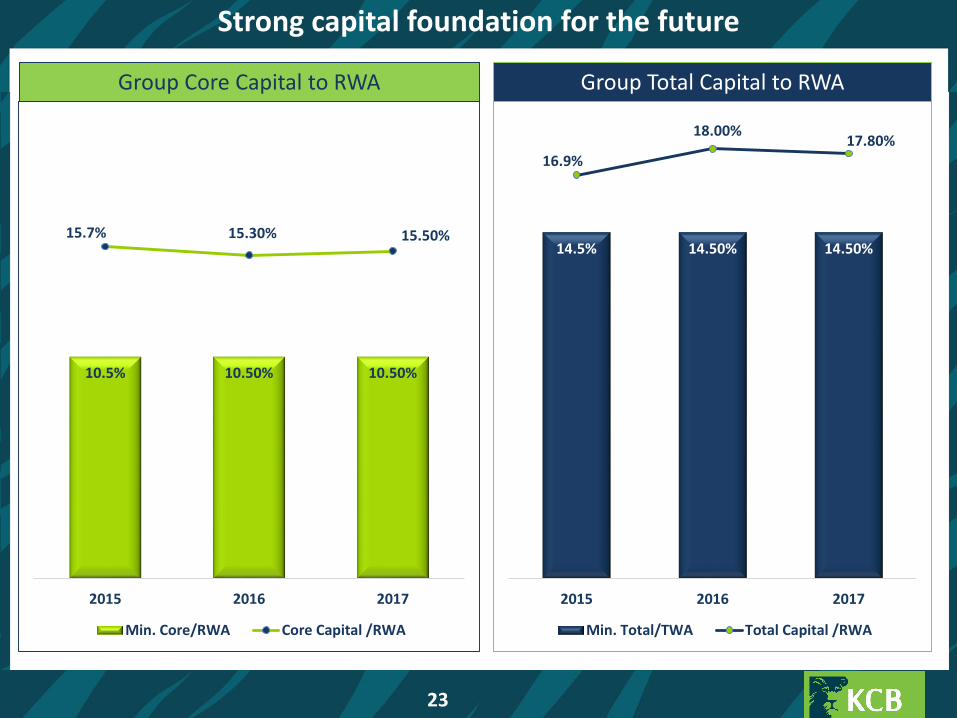
Strong capital foundation for the future
Group Core Capital to RWA Group Total Capital to RWA
10.5% 10.50% 10.50%
15.7% 15.30% 15.50%
2015 2016 2017
Min. Core/RWA Core Capital /RWA
14.5% 14.50% 14.50%
16.9%
18.00%17.80%
2015 2016 2017
Min. Total/TWA Total Capital /RWA
23

Resolute strategy delivers 9% balance sheet growth
KShs Billions
KCB Group KCB Bank Kenya
Actual 2016
Actual2017
Y-O-Y Change
Actual 2016
Actual2017
Y-O-Y Change
Cash and balances with central bank 29.4 29.1 (1%) 26.1 26.0 (1%)
Balances with other institutions 43.7 43.9 0% 6.1 13.1 115%
Investments in Government & Other securities
102.5 110.0 7% 91.0 94.6 4%
Net loans and advances 385.7 422.7 10% 353.9 387.9 10%
Fixed assets 12.7 14.0 10% 9.2 9.5 3%
Other assets 21.2 27.1 28% 18.4 24.5 33%
Total Assets 595.2 646.7 9% 504.8 555.6 10%
Customer Deposits 448.2 499.5 11% 386.6 440.2 14%
Balances due to other banks 13.1 11.0 (16%) 5.6 5.2 (7%)
Other liabilities 14.4 15.2 6% 11.0 10.7 (3%)
Long-term debt 23.0 14.9 (35%) 20.6 10.6 (49%)
Total Liabilities 498.7 540.7 8% 423.8 466.6 10%
Shareholders’ Equity 96.6 106.0 10% 81.0 89.0 10%
Total Liabilities and Equity 595.2 646.7 9% 504.8 555.6 10%
24

Stable profitability despite interest rate pressure
KShs Billions
KCB Group KCB Bank Kenya
Actual 2016
Actual2017
Y-O-Y Change
Actual 2016
Actual2017
Y-O-Y Change
Interest Income 62.8 63.7 1% 56.2 56.9 1%
Interest Expense (15.8) (15.3) (3%) (13.3) (12.8) (3%)
Net interest income 47.0 48.4 3% 42.9 44.1 3%
Foreign exchange income 5.5 4.7 (15%) 2.2 2.9 33%
Net fees and commissions 12.6 14.7 16% 9.1 10.7 18%
Other income 4.3 3.6 (16%) 4.0 3.3 (18%)
Total other operating income 22.5 23.0 2% 15.3 16.9 11%
Total other operating expenses (32.9) (34.9) (6%) (25.9) (28.6) (9%)
Net provisions for bad debts (3.8) (5.9) 55% (3.8) (5.0) 32%
Profit Before Loss on Monetary Position
32.7 30.5 (7%) 28.5 27.5 (4%)
Loss on Monetary Position (3.6) (1.4) (61%) 0.0 0.0 -
Profit before tax 29.1 29.1 0% 28.5 27.5 (4%)
Tax (9.4) (9.4) 0% (8.7) (8.2) (5%)
Profit after tax 19.7 19.7 0% 19.8 19.2 (3%)
25

Income Distribution
83%82% 80%
16%
17% 19%1%
1% 1%
2015 2016 2017
Interest Income & Growth
Loans and advances Govt. Securities Placements & Money Markets
% ∆
26
47%42%
46%
13%
14%
18%
17%24%
20%
22%19%
16%
2015 2016 2017
NFI Mix & Growth
Fees and Commission Lending Fees Fx Income Other Income
14%
-
(18%)
(15%)
29%
13%
% ∆
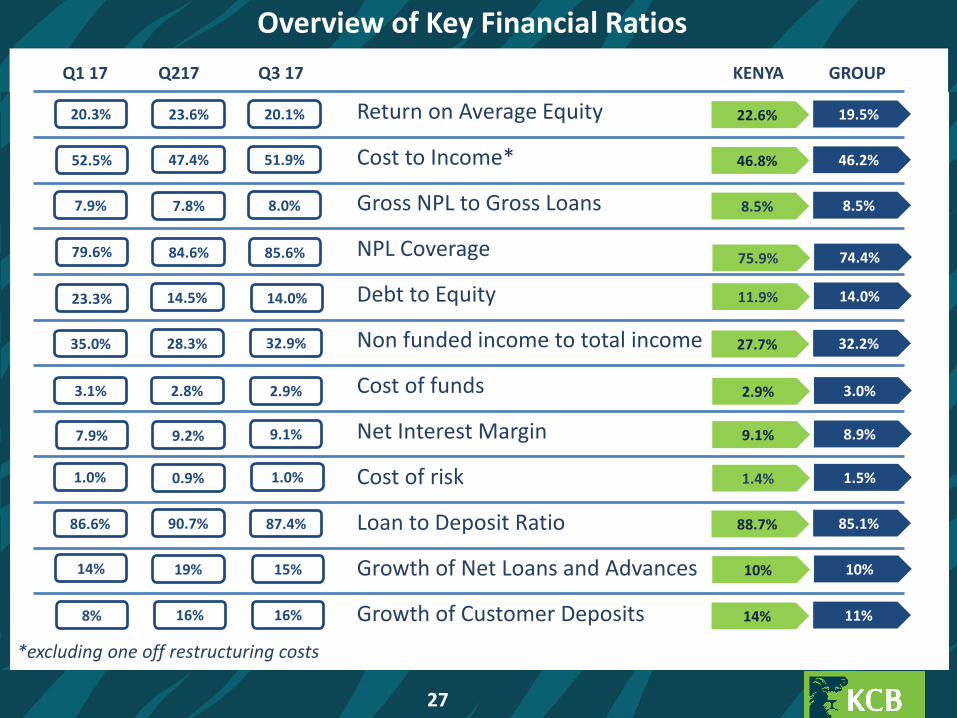
Overview of Key Financial Ratios
Return on Average Equity
Cost to Income*
Gross NPL to Gross Loans
NPL Coverage
Debt to Equity
Non funded income to total income
Cost of funds
Net Interest Margin
Cost of risk
Loan to Deposit Ratio
Growth of Net Loans and Advances
Growth of Customer Deposits
23.6% 20.1%
47.4% 51.9%
7.8% 8.0%
84.6% 85.6%
14.5% 14.0%
28.3% 32.9%
2.8% 2.9%
9.2% 9.1%
0.9% 1.0%
90.7% 87.4%
19% 15%
16% 16%
19.5%
46.2%
8.5%
74.4%
14.0%
32.2%
3.0%
8.9%
1.5%
85.1%
10%
11%
Q1 17 Q217 Q3 17 KENYA GROUP
20.3%
52.5%
7.9%
79.6%
23.3%
35.0%
3.1%
7.9%
1.0%
86.6%
14%
8%
22.6%
46.8%
8.5%
75.9%
11.9%
27.7%
2.9%
9.1%
1.4%
88.7%
10%
14%
27
*excluding one off restructuring costs
2017 Dividend
28
KCB Group paid an interim dividend in October 2017 of KShs. 1.00 per share.
At the AGM to be held on 27 April 2018, at SafaricomKasarani Indoor Stadium, we shall propose a final dividend of KShs. 2.00 per share.
Based on the 2017 performance of the Group, the proposed dividend is maintained at the same payout level as 2016.
Taking into consideration business performance during the current year, the Group anticipates it shall be able to pay an interim dividend to shareholders.

Outlook 2018
Return on Average Equity
Cost to Income Ratio*
Gross NPL to Gross Loans
Non funded income ratio
Cost of Funds
Net Interest Margin
Cost of Risk
Cost of Funds
Customer Deposit Growth
2018
21.1%
46.0%
3.3%
8.7%
3.3%
7.0%
30.9%
1.3%
11%
29
Strategic Initiatives:
• Excellence in Customer experience: NPS 60%
• Digital financial services / AI: NFI 40%
• Strong shareholder value: ROE >21%
• Growth in Youth and Women enterprises
• Excellent operations performance: CIR 45%
• Outstanding employee engagement: 85% satisfaction level
Net Loans Growth 8%
Targets:
• Continue to improve efficiency
• Increase shareholder value
• Manage asset quality
• Full digital transformation
• Relentless drive for excellence in customer experience
*excluding one off restructuring costs