2013 SMALL BIVALVE FISHERY ASSESSMENT Venerupis ...
12
Small Bivalve Fishery Assessment 2013 2013 SMALL BIVALVE FISHERY ASSESSMENT Venerupis largillierti - Southern Zone, Georges Bay Ostrea angasi - Georges Bay David Tarbath and Caleb Gardner May 2013
Transcript of 2013 SMALL BIVALVE FISHERY ASSESSMENT Venerupis ...
Small Bivalve Fishery Assessment 2013
2013 SMALL BIVALVE FISHERY ASSESSMENT
Venerupis largillierti - Southern Zone, Georges Bay
Ostrea angasi - Georges Bay
David Tarbath and Caleb Gardner
May 2013

Institute for Marine and Antarctic Studies, University of Tasmania, PO Box 49, Hobart TAS 7001
Enquires should be directed to:
David Tarbath
Fisheries, Aquaculture & Coasts Centre
Institute for Marine and Antarctic Studies
University of Tasmania
Private Bag 49, Hobart, Tasmania 7001, Australia
Ph. (03) 6227 7277, Fax (03) 6227 8035
Citation: 2013 Small Bivalve Fishery Assessment (2013). Tarbath, D. and Gardner, C.
Institute for Marine and Antarctic Studies Report. 9pp.
The authors do not warrant that the information in this document is free from errors or
omissions. The authors do not accept any form of liability, be it contractual, tortious, or
otherwise, for the contents of this document or for any consequences arising from its use or
any reliance placed upon it. The information, opinions and advice contained in this document
may not relate, or be relevant, to a reader’s particular circumstance. Opinions expressed by
the authors are the individual opinions expressed by those persons and are not necessarily
those of the Institute for Marine and Antarctic Studies (IMAS) or the University of Tasmania
(UTAS).
© Institute for Marine and Antarctic Studies, University of Tasmania 2013
Copyright protects this publication. Except for purposes permitted by the Copyright Act,
reproduction by whatever means is prohibited without prior written permission of the Institute for
Marine and Antarctic Studies.
Small Bivalve Fishery Assessment 2013
Page 1
2013 SMALL BIVALVE FISHERY ASSESSMENT
Venerupis largillierti - Southern Zone, Georges Bay
Ostrea angasi - Georges Bay
David Tarbath and Caleb Gardner
Institute for Marine and Antarctic Studies, University of Tasmania, PO Box 49, Hobart TAS 7001

Small Bivalve Fishery Assessment 2013
Page 2
Venerupis Clam Survey, Georges Bay South Zone, April 2013
Summary
A survey of the Georges Bay southern zone found no Venerupis clam stocks at harvestable
size. The clam population in this part of the bay was reported to be destroyed in 2011
following low salinity levels after prolonged rainfall in the bay’s catchment. Large numbers
of juvenile clams were found, indicating that the population is rebuilding. It is anticipated that
it may take two or more years before stocks are rebuilt sufficiently to support fishing.
Introduction
A small fishery for the venerid clam Venerupis (=Ruditapes) largillierti takes place in
Georges Bay, north-east Tasmania. This species is considered accidentally introduced from
New Zealand in the late 1920’s (Maguire, 2005; NIMPIS, 2013). It is found sub-tidally in
shallow estuarine waters on sandy or muddy substrates exposed to water currents (Cook,
2010). Its distribution in Australia is limited to the east and south-east of Tasmania (Grove,
2011). Previous assessments showed that it forms large populations with densities reaching
approximately 40 t/ha in parts of Georges Bay, and that this density has increased in recent
years. Much higher densities may be attainable - a related species (V. philippinarum) was
reported producing annual harvests in excess of 60 t/ha/yr (Becker et al., 2008).
The most recent survey of the Georges Bay southern zone occurred in April 2013. Five areas
in wading depth totalling approximately 5.5 ha were surveyed in which quadrats of size 23
cm x 30 cm were dug out and the Venerupis present were counted and measured for length.
Four areas in deeper water (2-3 m) totalling approximately 1.1 ha were similarly surveyed by
divers, using quarter square metre quadrats.
948 Venerupis of size range 4-53 mm were collected (Fig. 1). The modal length was 15 mm.
Only 8 clams of legal size (≥ 40 mm) were found. On this basis there is no fishable stock in
the southern zone with no prospects of a fishery for the remainder of 2013 and probably
2014.
Discussion
The previous (2010) survey estimated a biomass of 117 t, with a stock (i.e. clams ≥ 40 mm)
of 75 t covering an area of approximately 5.5 ha. Most of this biomass was reported to be
destroyed in 2011 due to prolonged low salinity levels following an extended period of high
rainfall in the region (A. Flintoff, fisher, pers. comm.).
Compared with the remainder of the bay, the Venerupis beds in the southern zone are shallow
and exposed to low salinity water following high rainfall. The northern zone beds are deeper
(5-7m) and unaffected by changes in salinity.
Extensive settlement of Venerupis juveniles throughout Georges Bay was reported in 2012
(D. Ridgers, fisher, pers. comm.). It is likely that most of the juveniles collected in the recent
survey originated from this settlement, and that the source of recruitment is the population in
the deeper northern zone. Growth rates of Venerupis reported from Georges Bay and New
Zealand varied between 1.2-2.0 mm/month (Gribben et al., 2002; Kent et al., 1999). Given
linear growth rates, stock rebuilding should start to occur when parts of this cohort reach
legal size in 2014. Rates of natural mortality for this species in the southern zone are

Small Bivalve Fishery Assessment 2013
Page 3
unknown and projections of yield from juvenile density could be inaccurate and thus
misleading.
Figure 1. Length frequency of Venerupis largillierti from samples collected in April 2013, Georges Bay
southern zone. The vertical black line shows the position of the 40-mm minimum legal size relative to the
measured clams.
0
50
100
150
200
250
300
350
400
0-4
5-9
10
-14
15
-19
20
-24
25
-29
30
-34
35
-39
40
-44
45
-49
50
-54
Co
un
t
Shell length (mm)

Small Bivalve Fishery Assessment 2013
Page 4
Native Oyster Survey, Georges Bay, April 2013
Summary
A survey was conducted in the Georges Bay in April 2013 and from data collected it was
estimated that the biomass of native oysters was 618.4 tonnes, with 95% confidence limits at
504.3 t and 732.5 t. The fishery is managed under a TAC that specifies the number of oysters
available to fishers in dozens. Based on 10% of the exploitable stock, the TAC is 39,796
dozen. Based on 10% of total biomass, the TAC becomes 55,573 dozen. The former approach
is recommended, because almost 30% of the biomass was below marketable size.
Introduction
The native oyster Ostrea angasi (also known as mud oyster) is widespread and common
throughout Tasmania, and also across much of southern Australia (Grove, 2011). It lives
inter-tidally on sand or muddy bottom, in some places with large numbers forming dense
beds. In Georges Bay, north-east Tasmania, a small fishery has operated for many years,
possibly since 1985. More recently market demand has been weak, and consequently harvest
levels have been negligible: between 1,000 and 3,000 dozen, or less than 1% of the estimated
biomass. Oysters are deemed marketable at 70 mm shell length. The fishery occupies a
defined area in the bay with a number of separate beds being available for harvesting, the
total area of which is 75,618 m2 (Figure1).
Four assessments of oyster abundance in Georges Bay have been made since 2003. The
boundaries of the oyster beds were defined after the 2003 assessment with the use of a GPS
receiver and the areas of the beds were subsequently estimated (Figure 1). Since 2008,
assessments have used a stratified (by bed) random design, with samples collected from the
beds using a quarter square-metre quadrat. Assuming that the quadrats provide a
representative sample, the average density per 0.25 m2 is calculated, and then extrapolated to
the total bed area.
2013 assessment.
The summed area of surveyed oyster beds surveyed was 52,104 m2 comprising the beds 7, 4
and 1, the assumed equivalent areas of beds 6, 5 and the small patch between beds 4, 5 and 8
(approximately 5,000 m2, see Discussion).
2,387 oysters were collected and measured (shell length, mm). A length-weight relationship
developed from previous survey data was used to estimate weights (w = a.lb, where a =
2.49E-04, b = 2.87543). Numbers of oysters and biomass were calculated for each bed and
then totalled to provide estimates for the fishery.
Mean weight per m2 of oysters was 11.9 kg/m
2, giving a fishery biomass of 618.4 t ± 114.1 t.
The mean density across all six surveyed beds was 128.0 oysters per m2, for a total of
666,871 oysters, of which approximately two thirds were of marketable size (≥70 mm). At
10% of available biomass, the TAC equates to 55,573 dozen. The number of marketable
sized oysters i.e. the stock, was 4,775,515. At 10 % of available stock, the fishery TAC
equates to 477,552 or 39,796 dozen oysters.
Many small oysters were encountered, and it appears that recruitment is ongoing (Figure 2).
The modal size at all beds was larger than the legal minimum size. Bed 5 had quantities of

Small Bivalve Fishery Assessment 2013
Page 5
particularly small oysters (<30 mm). The proportion of oysters >100 mm was low
considering that their maximum reported length is 170-180 mm (Edgar, 1997; Grove, 2011).
Figure 1. Habitat map of part of Georges Bay with eight separate native oyster beds delineated.
Discussion
The 2003 assessment recognised only three beds: the main bed (20,160 m2), the eastern bed
(8,976 m2) and the Akaroa bed (13,000 m
2), with a total area of 42,000 m
2. Later surveys
included more beds and greater areas.
During the 2010 and 2013 surveys, the sampling locations were logged using GPS, accurate
to within approximately 10 m. Figure 3 shows the position of the GPS tracks relative to the
identified beds. It shows that in both years less than 50% of the samples were collected inside
the defined beds. This has implications for the accuracy of the assessments.
In 2010, it was assumed that samples collected near beds 4, 5 and 6 could be attributed to
those beds and that the area sampled was approximately equal to the area of those beds. This
assumption was repeated in 2013, although the area covered by oysters was substantially
greater than the defined areas of those beds. No sampling was done in bed 6 (all sampling
was done immediately south of the bed) and bed 5 samples were mostly collected outside
their boundaries. It appeared that the floor of the bay from south of bed 6 to the east of bed 4
forms a continuous bed i.e. the areas attributed to beds 4, 5 and 6 under-represent the area
covered by oysters.
Native oyster (Ostrea angasi) beds in Georges Bay
0 0.09 0.18 0.27 0.360.045
Miles
:
Bed: 8
Area: 14858.94
Bed: 7
Area: 11514.49
Bed: 6
Area: 4307.08
Bed: 5
Area: 7835.06
Bed: 4
Area: 12883.08
Bed: 3
Area: 5724.6
Bed: 2
Area: 7932.26
Bed: 1
Area: 10565.87
Legend
High profile reef
Medium profile reef
Low profile reef
Patchy reef
Seagrass
Patchy seagrass
Sparse seagrass
Caulerpa
Hard sand
Sand
Silty sand
Silt
0 220 440 660 880110Meters

Small Bivalve Fishery Assessment 2013
Page 6
The eastern side of the channel (beds 1, 2, 3 and 8) appeared less productive. In 2008, beds 3
and 8 were not sampled. In 2010, bed 3 was not sampled and only part of bed 8 was sampled
because oyster abundance was low and patchy. Bed 2 had low abundance. In 2013, the only
recognised bed sampled was bed 1 i.e. beds 2, 3 and 8 were omitted because the fishers
considered that abundance was too low for fishing.
In both 2010 and 2013, a small patch between beds 8, 4 and 5 was sampled. The boundary of
this patch was undefined, but for the purposes of this 2013 assessment it was estimated at
5,000 m2. Bed 7 has been sampled consistently in all years and has the highest densities.
Oyster biomass has increased since 2010, but not to 2008 levels (Table 1). Given that the
annual catch has been < 1% of the TAC for many years, differences in biomass are probably
attributable more to sampling error rather than actual variation in abundance. This sampling
error can in turn be attributed to between-survey spatial variation in the sampling and the
patchy distribution of oysters in the bay. Due to the low level of effort, the fishers who
conducted the sampling were less familiar with the spatial distribution of oysters in the bay
than they might have been if the stock had been fully fished. This degrades the ability to
detect changes in abundance and needs to be addressed.
Table 1. Comparison between weights and numbers from 2008 and 2010 surveys:
2008 2010 2013
mean density (kg/quadrat) 3.046 2.037 2.763
area of fishery (m2) 55,036 69,895 52,104
mean density (kg/m2) 12.185 8.148 11.051
total biomass (t) 670.6 569.5 618.4
density (count legal/m2) 90 67 92
TAC (10% of count, in dozens) 41,369 39,025 39,796
average weight (g/oyster) 132 121 129
A possible solution is that fishers be required to use GPS and depth/time loggers, so that the
position of the productive beds that comprise the fishery becomes known and the bed areas
more accurately estimated. However, if the fishery continues to receive minimal effort, GPS
loggers will provide no benefit. The alternative is to conduct a dedicated survey of beds using
both IMAS and industry divers, although this would be costly in terms of the returns from the
fishery.
Table 1 compares results from previous surveys with the current survey. Density was least,
with smaller (lighter) oysters in 2010, but the surveyed area was greater. It shows that
sampling large areas with low or patchy abundance does not necessarily increase biomass,
and reflects the need for consistent sampling across the most productive parts of the fishery.
The 70-mm minimum length needs consideration. The size was chosen to suit marketing
needs and is not legislated. No study has been done on minimum size with respect to ensuring
sufficient egg production and recruitment for sustainable fishing. This is no problem while
the stock remains unfished, but the size limit is low relative to the modal size of oysters in all
beds (Figure 2), and ideally the minimum size would be larger than the mode if was intended
to promote sustainable fishing.
Small Bivalve Fishery Assessment 2013
Page 7
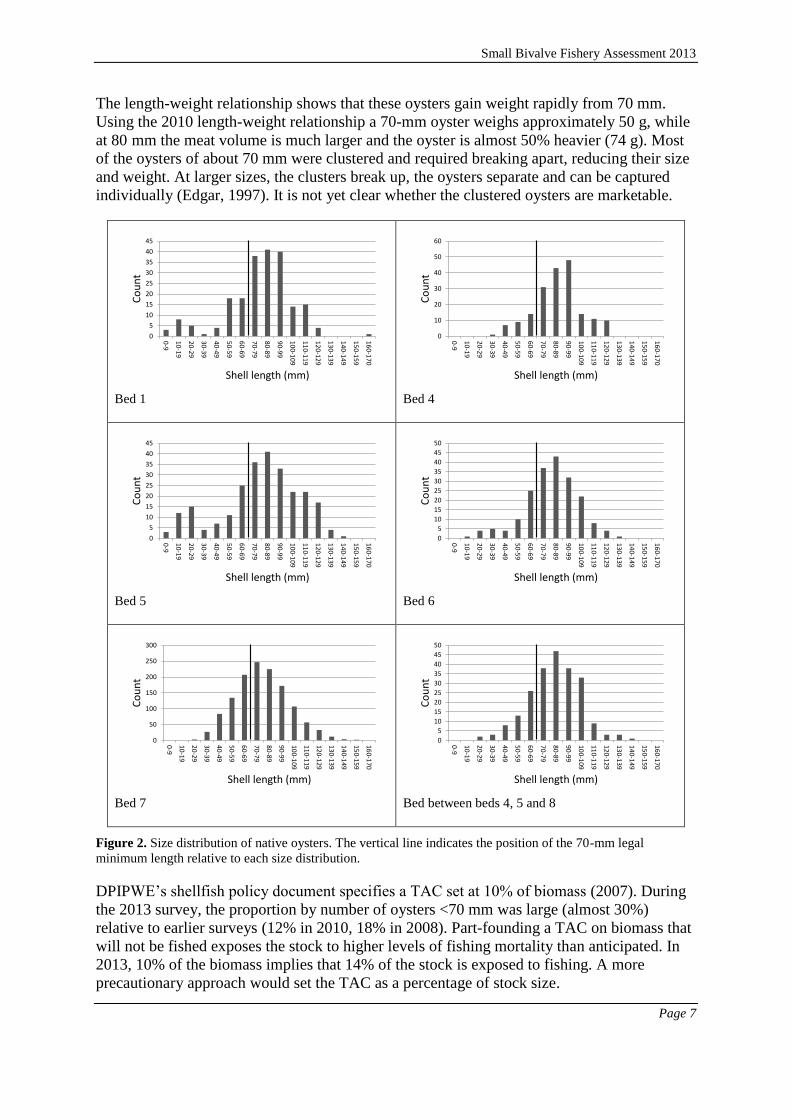
The length-weight relationship shows that these oysters gain weight rapidly from 70 mm.
Using the 2010 length-weight relationship a 70-mm oyster weighs approximately 50 g, while
at 80 mm the meat volume is much larger and the oyster is almost 50% heavier (74 g). Most
of the oysters of about 70 mm were clustered and required breaking apart, reducing their size
and weight. At larger sizes, the clusters break up, the oysters separate and can be captured
individually (Edgar, 1997). It is not yet clear whether the clustered oysters are marketable.
Bed 1
Bed 4
Bed 5
Bed 6
Bed 7
Bed between beds 4, 5 and 8
Figure 2. Size distribution of native oysters. The vertical line indicates the position of the 70-mm legal
minimum length relative to each size distribution.
DPIPWE’s shellfish policy document specifies a TAC set at 10% of biomass (2007). During
the 2013 survey, the proportion by number of oysters <70 mm was large (almost 30%)
relative to earlier surveys (12% in 2010, 18% in 2008). Part-founding a TAC on biomass that
will not be fished exposes the stock to higher levels of fishing mortality than anticipated. In
2013, 10% of the biomass implies that 14% of the stock is exposed to fishing. A more
precautionary approach would set the TAC as a percentage of stock size.
0
5
10
15
20
25
30
35
40
45
0-9
10
-19
20
-29
30
-39
40
-49
50
-59
60
-69
70
-79
80
-89
90
-99
10
0-1
09
11
0-1
19
12
0-1
29
13
0-1
39
14
0-1
49
15
0-1
59
16
0-1
70
Co
un
t
Shell length (mm)
0
10
20
30
40
50
60
0-9
10
-19
20
-29
30
-39
40
-49
50
-59
60
-69
70
-79
80
-89
90
-99
10
0-1
09
11
0-1
19
12
0-1
29
13
0-1
39
14
0-1
49
15
0-1
59
16
0-1
70
Co
un
t
Shell length (mm)
0
5
10
15
20
25
30
35
40
45
0-9
10
-19
20
-29
30
-39
40
-49
50
-59
60
-69
70
-79
80
-89
90
-99
10
0-1
09
11
0-1
19
12
0-1
29
13
0-1
39
14
0-1
49
15
0-1
59
16
0-1
70
Co
un
t
Shell length (mm)
0
5
10
15
20
25
30
35
40
45
50
0-9
10
-19
20
-29
30
-39
40
-49
50
-59
60
-69
70
-79
80
-89
90
-99
10
0-1
09
11
0-1
19
12
0-1
29
13
0-1
39
14
0-1
49
15
0-1
59
16
0-1
70
Co
un
t
Shell length (mm)
0
50
100
150
200
250
300
0-9
10
-19
20
-29
30
-39
40
-49
50
-59
60
-69
70
-79
80
-89
90
-99
10
0-1
09
11
0-1
19
12
0-1
29
13
0-1
39
14
0-1
49
15
0-1
59
16
0-1
70
Co
un
t
Shell length (mm)
0
5
10
15
20
25
30
35
40
45
50
0-9
10
-19
20
-29
30
-39
40
-49
50
-59
60
-69
70
-79
80
-89
90
-99
10
0-1
09
11
0-1
19
12
0-1
29
13
0-1
39
14
0-1
49
15
0-1
59
16
0-1
70
Co
un
t
Shell length (mm)

Figure 3. Native oyster surveys in Georges Bay, showing GPS tracks from the 2010 (yellow marker) and 2013 (green marker) surveys, the position of mapped oyster beds and the undefined
bed between beds 4, 5 and 8.

Small Bivalve Assessment 2013
Page 9
References:
Becker, P., Barringer, C. and Marelli, D. C. (2008). Thirty years of sea ranching
Manila clams (Venerupis philippinarum): successful techniques and lessons learned.
Reviews in Fisheries Science 16, 44-50.
Cook, S. (2010). New Zealand Coastal Marine Invertebrates. Christchurch: Canterbury
University Press.
DPIPWE. (2007). Shellfish fishery policy document. Tasmanian Department of
Primary Industries, Parks, Water and Environment, Hobart.
Edgar, G. J. (1997). Australian marine life. Melbourne: Reed Books.
Gribben, P. E., Creese, R. G. and Hooker, S. H. (2002). Growth rates of the venus
clam Ruditapes largillierti grown under experimental culture conditions in New
Zealand. Aquaculture 213, 187-197.
Grove, S. G. (2011). The seashells of Tasmania: a comprehensive guide. Hobart:
Taroona Publications.
Kent, G. N., Maguire, G. B., Duthie, I. and Pugh, R. (1999). Spawning, settlement,
and growth of the New Zealand venerid Ruditapes largillierti (Philippi 1849) in culture.
New Zealand Journal of Marine and Freshwater Research 33, 55-62.
Maguire, G. B. (2005). Enhancing Tasmanian clam resources, (ed. FRDC), pp. 286.
Hobart.
NIMPIS. (2013). Ruditapes largillierti general information, National Introduced
Marine Pest Information System, viewed 7 May 2013
<http://www.marinepests.gov.au/nimpis>.

The Institute for Marine and Antarctic Studies (IMAS), established in 2010,
comprises the University of Tasmania's internationally recognised expertise
across the full spectrum of temperate marine, Southern Ocean, and Antarctic
research and education.
The Institute for Marine and Antarctic Studies (IMAS), established in 2010,
comprises the University of Tasmania's internationally recognised expertise
across the full spectrum of temperate marine, Southern Ocean, and Antarctic
research and education.
CONTACT US:
IMAS is currently located at two main campuses:
Sandy Bay:
Physical Address
IMAS-Sandy Bay
Building 49 (between the Law Building and the University Gym)
Cnr Alexander St/Grosvenor St
Sandy Bay TAS 7005
Australia
Postal Address:
IMAS-Sandy Bay
Private Bag 129, Hobart TAS 7001
Telephone: (03) 6226 2937
Taroona:
Physical Address
IMAS-Taroona
Nubeena Crescent, Taroona TAS 7053
Australia
Postal Address
IMAS-Taroona
Private Bag 49, Hobart TAS 7053
Telephone: +61 3 6227 7277