2013 QUALITY REPORT - AHCA/NCAL the 2013 Quality Report captures a snapshot of the skilled nursing...
48
2013 QUALITY REPORT
Transcript of 2013 QUALITY REPORT - AHCA/NCAL the 2013 Quality Report captures a snapshot of the skilled nursing...

2013 QUALITY REPORT

QUALITY
COMMITMENT
INNOVATION

34 REFERENCES
36 DATA SOURCE DESCRIPTIONS
37 APPENDIX
TABLE OF CONTENTS
3 LETTER FROM THE PRESIDENT AND CEO
4 EXECUTIVE SUMMARY
6 THE LONG TERM AND POST-ACUTE CARE COMMUNITY
8 Individuals We Serve11 Workforce12 Skilled Nursing Care Center Staffing12 Staff Turnover and Retention
14 AMERICAN HEALTH CARE ASSOCIATION MEMBERS
15 AHCA Quality Initiative and Activities19 AHCA Programs That Advance Performance19 LTC Trend Tracker19 AHCA/NCAL National Quality Award Program20 Advancing Excellence in America’s Nursing Homes Campaign
22 TRENDS IN QUALITY
22 Skilled Nursing Care Center Quality Measures22 Regulatory Compliance Measures23 Five-Star Rating 23 Customer Satisfaction
28 TRENDS IN PAYMENT FOR QUALITY
28 State Value-Based Purchasing Programs28 Value-Based Purchasing Measurement30 Tying Measurement to Incentive Payments30 Managed Care31 Long-Stay Payment in Medicaid Managed Care31 Medicare Advantage Plans 31 Affordable Care Act31 Delivery System and Payment Reform Models32 Bundled Payments and the BPCI Demonstration32 Accountable Care Organizations32 Medicare-Medicaid Integration33 Outlook
The dependence level of individuals cared for in skilled nursing care centers is increasing.
The proportion of facilities receiving an overall rating of four or five stars has steadily increased to 46.9 percent.
The trend in payment is shifting from a volume-based approach to one based on quality outcomes.
AHCA members have made measurable progress in reaching goals outlined in the AHCA Quality Initiative.
FFS VBP

Improving Lives by Delivering Solutions for Quality Care

3
AHCA Quality Report
When considered in the perspective of time, one year is just a snapshot. It’s easy to watch the time pass, and before you know it, we’re rolling out another annual review of our quality efforts. But when you read through this report, it becomes clear how much difference one year can make. In one year, the American Health Care Association’s skilled nursing care center members have made significant progress toward reaching our quality goals. In one year, our members have decreased rehospitaliza-tion rates and the off-label use of antipsychotic medications. In one year, they have provided long term and post-acute services to 3.7 million individuals in need of care.
Last year, the AHCA launched our Quality Initiative. The adoption of this program in our member centers started a new chapter of quality care. We declared to the public, to our key stakeholders and to ourselves that we value quality care so much that we were willing to put ourselves up to the test of meeting goals and measuring results. This report touches on some of the progress that we have documented in our member centers this year. It showcases the momentum of many centers, and it also demon-strates that while we have more work to do to reach our goals, we are on the right path to get there.
Although data alone can never fully capture all of the critically important work that goes on in our member centers every day, it does provide vital information about the individuals we serve, their care needs and the functions of our centers. The data in this year’s report show that when it comes to person-centered care, nursing staff time spent with residents per day is on the rise. In
terms of overall quality, 46.9 percent of centers nationwide have received a rating of four or five stars in the CMS Five-Star Quality Rating System.
While the 2013 Quality Report captures a snapshot of the skilled nursing care profession, it remains increasingly important to see not just where we are today but the direction that long term and post-acute care is heading. We are living and working in a health care environment that is hotly contested and on the cusp of major change. We are moving from a system that is centered on volume of work to one that emphasizes and focuses on quality of care. Our work has been the center of debate on Capitol Hill, in political offices across the country and in communities that rely greatly on our services.
We may not have a clear view of the path before us, but one thing is certain: we are, and will continue to be, a vital element in the continuum of health care services. Regardless of legislation and policies in the coming years, millions of Americans will continue to rely on our centers and our staffs to provide high-quality, person-centered care. We are growing our capacity to serve each and every individual who requires care, and I look forward to the journey ahead.
Mark Parkinson President & CEO, American Health Care Association
WELCOME TO THE 2013 AHCA QUALITY REPORT
AHCA Quality Report
4
EXECUTIVE SUMMARY
The American Health Care Association (AHCA) is the nation’s premier association of long term and post-acute care providers. AHCA represents more than 8,600 non-profit, proprietary and government skilled nursing care centers. This report focuses on all skilled nursing centers nationally, including both our members as well as non-members. By delivering solutions for quality care, AHCA aims to improve the lives of the millions of frail, elderly and individuals with disabilities who receive long term or post-acute care in our member centers each day.
The annual AHCA Quality Report uses government data and AHCA research to provide an overview of the latest trends in the skilled nursing care sector, updated information on how skilled nursing care centers are performing on national quality measures, and important information on payment models and structures. The Quality Report also highlights AHCA member centers’ efforts to improve quality care through specific programs and initiatives.
The 2013 Quality Report presents a wide array of useful data and information. Three notable trends in this report are:
• A shift from long-stay to short-stay services in skilled nursing care centers
• Measurable improvements in objective measures of quality
• A national movement toward value-based payment structures
THE CHANGING LONG TERM CARE POPULATIONSkilled nursing care centers serve individuals who have increas-ingly complex medical conditions and extensive needs for care and support, as demonstrated by measures of both physical and cognitive function. In an analysis concentrating on five activities of daily living (bathing, bed mobility, transfer, toilet use and eating), nearly all (95.2 percent) of those individuals who enter a center for a Medicare-covered, post-acute stay require assistance with four or five of these activities. Among long-stay residents at centers for at least one year, 85.6 percent need that same level of assistance. In addition, almost two-thirds (61.1 percent) of long-stay residents have dementia, while only 37.7 percent of Medicare admissions have dementia.
In response to the increasing level of dependence of individuals entering skilled nursing care centers, the profession has increased the hours provided for direct nursing care. From 2008 through 2013, direct care nursing hours per resident day have steadily increased at
all levels of nursing staff. Additionally, the percent of skilled nursing care centers receiving the top ratings of four or five stars in the staffing component of the Centers for Medicare and Medicaid Services (CMS) Five-Star Quality Rating System has steadily increased since 2009. In that year, 38.3 percent of centers received four or five stars, compared to 51.3 percent of centers that received those ratings in 2013.
OBJECTIVE MEASURES OF QUALITY CAREIn early 2012, AHCA launched the Quality Initiative, a member-wide challenge to meet specific, measurable targets in four distinct areas: hospital readmissions, staff stability, customer satisfaction and the off-label use of antipsychotic medications. Since the launch of the initiative, AHCA members have demonstrated not only a commit-ment to but also discernible improvements in quality care.
AHCA members have reduced hospital readmissions from 18.2 percent to 17.9 percent from the fourth quarter of 2011 to the fourth quarter of 2012. In that same time, participating centers reduced the off-label use of antipsychotic medications from 23.8 percent to 22.1 percent. For more information on the four Quality Initiative goals and our member centers’ progress in achieving these goals, please turn to page 15 of this report or visit qualityinitiative.ahcancal.org.
While the AHCA Quality Initiative measures four distinct areas of quality care, the AHCA/NCAL National Quality Award program seeks to recognize those facilities that are embracing a broad and systematic approach to improving the overall quality of their organizations. By enhancing business practices and implementing strategic approaches to quality care, member centers commit to long term change in their facilities. Centers that have earned awards at the Silver and/or Gold level consistently outperform other centers in objective quality metrics.
On a national level, we also see quality improving steadily. The proportion of care centers receiving five stars on the CMS Five-Star rating scale has increased from 11.8 percent in 2009 to 19.6 percent in 2013. From the fourth quarter of 2011 to the same quarter of 2012, there have been across-the-board improvements in almost all the quality measures generally used in this field.

AHCA Quality ReportExecutive Summary
5
A PROFESSION CENTERED ON QUALITY OUTCOMESHistorically, government payers based payment to health care providers for care given within centers on the volume of services provided. The traditional fee-for-service approach to payment rewards providers with higher costs and volumes of service without much attention to quality, resulting in steadily rising costs of care. However, policymakers are now focused on redesigning payment systems across the health care spectrum, including long term and post-acute care, to move away from this volume-based approach to one that ties financial incentives to outcomes or quality. These types of models are often referred to as pay-for-performance or value-based purchasing arrangements.
In an effort to support this systematic shift to improving quality care, many states have implemented Medicaid managed care programs. By 2014, AHCA estimates that approximately 27 states
will have some form of such programs, up from only eight in 2012. The Patient Protection and Affordable Care Act (ACA) established three national efforts with implications for quality incentive programs: Accountable Care Organizations, bundled payments and Medicare-Medicaid integration efforts. These programs are still developing and many details remain to be determined.
To support integration efforts, the ACA also established the Medicare-Medicaid Coordination Office (MMCO) and the Center for Medicare and Medicaid Innovation. Currently, 20 states are working with MMCO on various integration initiatives. The vast majority (14) are pursing capitated, risk-based approaches that will use health plans to integrate Medicare and Medicaid benefits and financing.
While the future of these efforts remains uncertain, there is clearly a new paradigm emerging of payment structures driven by performance measures.

The number of elderly individuals, age 65 and over, continues to grow. The U.S. Bureau of Census estimates that in 2012, 13.7 percent of the U.S. population was over the age of 65, which was equivalent to 40.8 million individuals (U.S. Bureau of Census, 2013). Despite this increase in the elderly population, trends in skilled nursing care center growth have remained constant. The overall number of skilled nursing care centers has remained relatively steady over the last six years (a decline of 185 or, on average, 31 per year), as has the average number of beds per center, at 108. However, there has been a small shift in ownership of centers from not-for-profit (decreased by 10.3 percent, or 452 centers) to for-profit (increased by 3.0 percent, or 318 centers). The overall occupancy rate continues to follow a declining trend from a high of 89.0 percent in 2007 to 86.0 percent in 2013 (Table 1.1). The stable number of centers and beds and declining occupancy, despite a growing elderly population, suggest a decrease in long term stay use that is likely a result of the
expansion of home/community-based services and assisted living centers.
In 2012, the average private payment rate in a skilled nursing care center for a private room was $248 daily ($90,520 annually) and $222 daily ($81,030 annually) for a semi-private room (MetLife Market Institute, 2012). However, most persons cared for in skilled nursing care centers have their stay and care covered by either Medicare or Medicaid. Medicaid provides coverage to individuals with disabilities younger than 65 years of age who need long term care and to those over age 65 who are considered low income. At any point in time, Medicaid is the payer for services for the majority of persons being served in nursing centers, covering an average of 63.5 percent of individuals residing in a nursing center on a given day. In 2012, Medicaid payment rates on average nationally were approximately $22.34 per resident per day less than the centers’ costs for providing services. This amounted to an estimated national Medicaid shortfall across all nursing centers of approximately $7 billion
(Eljay, LCC, 2012) (Table 1.2). As a result, the Medicare Payment Advisory Commission (MedPAC) estimates the non-Medicare mar-gins for centers to be negative, ranging from -1 percent to -3 percent in 2011.
There are significant differences in the payer mix among for-profit, not-for-profit and government-owned centers. Govern-ment centers have the highest number of individuals whose care is being paid for by Medicaid on a given day, at 67 per-cent, followed by for-profit centers, at 66 percent. Not-for-profit centers have the smallest share of individuals being paid for by Medicaid, at 55 percent (Figure 1.1).
THE LONG TERM AND POST-ACUTE CARE COMMUNITY
AHCA Quality Report
TABLE 1.1
Long Term Care Community—National Overview
2007 2008 2009 2010 2011 2012 2013
Number of Skilled Nursing Care Centers 15,866 15,772 15,718 15,694 15,693 15,690 15,681 For-Profit 10,521 10,581 10,607 10,641 10,758 10,832 10,839Not-for-Profit 4,382 4,244 4,199 4,145 4,030 3,968 3,930Government 963 947 912 908 905 890 912
Total Beds 1,718,000 1,713,000 1,709,000 1,708,000 1,706,000 1,705,000 1,703,000
Average Number of Beds per Center 108.3 108.6 108.8 108.9 108.7 108.7 108.6
Occupancy Rate 89.0% 88.6% 88.0% 87.5% 87.0% 86.6% 86.0%
Number of Persons Served at Any Given Time 1,431,134 1,420,735 1,411,054 1,400,484 1,395,832 1,387,727 1,382,193
Data Source: CMS CASPER data, March of each year
TABLE 1.2
Payer of Services for Individuals on Any Given Day
Medicare Medicaid Other Payer
14.2% 63.5% 22.3%
Data Source: CMS CASPER Data, March 2013
6

Caring for Two Distinct PopulationsConsider a 100-bed center that mirrors national averages. At a single point in time, this center is likely to be serving:
14 individuals receiving short-stay, post-acute care services following a hospital stay, whose care is being paid for under the Medicare program
86 individuals residing in the facility for long term care, whose care is being paid for either with their private funds or insurance or by the Medicaid program
Given this much shorter length of stay, over the course of one year, a typical 100-bed center will actually serve more total individuals coming from the hospital for short-stay, post-acute care than for long term care.
14 SHORT-STAY INDIVIDUALS
189 SHORT-STAY INDIVIDUALS
86LONG TERM CARE INDIVIDUALS
The average length of stay for short-stay care in a skilled nursing center is approximately 27 days…
while the average long term care stay is greater than 365 days.
27 >365SHORT-STAY CARE LONG TERM CARE
Jones et al., 2009MedPAC, 2013
86LONG TERM CARE INDIVIDUALS

Medicare is the primary payer of services for an average of 14 percent of individuals on a given day in a nursing care center. Medicare provides coverage only following an acute care hospital stay for short term, post-acute care in skilled nursing centers. The primary purpose of post-acute services is to improve the individual’s function and enable them to return home or to a more independent living situation. This is achieved principally by providing:
• physical, occupational and/or speech therapy services to assist the person in regaining functional skills;
• completing an individual’s course of treatment as directed by the hospital (e.g., antibiotics);
• helping to manage an individual’s medical issues (e.g., pain, wound care, etc.); and
• teaching the individual to care for him or herself by self-administering medications and/or using new medical equipment.
The ultimate goal of these services is to return the individual to his or her optimum health and prevent any further decline, particularly a decline requiring rehospitalization.
To qualify for Medicare coverage for a skilled nursing center stay, a beneficiary must first have a qualifying hospital stay. This is defined by the Centers for Medicare and Medicaid Services (CMS) as three inpatient hospital days. Currently, days spent in observation status while in the hospital do not count toward meeting this requirement. Legislation has been intro-duced to alter this requirement to include time spent in observation status in the three-day minimum for Medicare eligibility.
After the inpatient hospitalization require-ment is satisfied, an individual is eligible for up to 100 days of Medicare coverage for skilled nursing care. For individuals meeting medical eligibility requirements, which are based on the need for daily skilled nursing
care and/or rehabilitation therapy, Medicare pays for 100 percent of the services during the first 20 days in a skilled nursing care center. The beneficiary is responsible for a copayment of $148 per day starting on the 21st day. If continued care is required after 100 days of care under this benefit, the beneficiary must pay most costs that are not covered by either Medicare Part B or D or any long term care insurance plan they may have (Medicare costs, CMS, 2013). For-profit centers have a slightly larger proportion of individuals receiving services covered by Medicare on any given day than not-for-profit centers. Fifteen percent of people receiving services in for-profit centers on a given day are being paid for by Medicare, whereas only 14 percent of those in not-for-profit centers are being paid for by Medicare. At 8 percent, government centers have the smallest proportion of individuals being paid for by Medicare (Figure 1.1).
In Figure 1.1, “Other” refers to payments made out of pocket, through private insurance or Medicare Advantage plans. For-profit centers have the smallest share of individuals with these payment sources, and not-for-profit centers have the highest on any given day. Thirty-one percent of individuals on a given day are being covered by these other payment sources in not-for-profit centers, compared to 19 percent in for-profit centers. A quar-ter of individuals in government centers pay with one of the other methods.
The point-in-time payer mix described above, however, does not fully capture the mix or magnitude of individuals served by a given center over a period of time. To illustrate more fully the impact of a typical mix of services and individual persons cared for by a typical skilled nursing care center, consider a 100-bed center with a payer mix that mirrors the national averages. This means that at a single point in time, on average, a center is likely to be serving:
• 14 individuals receiving short term, post-acute services following a hospital stay, whose care is being paid by the Medicare program;
• 64 individuals for long term care, whose care is being paid by the Medicaid program; and
• 22 individuals paying for their care out of pocket or who are covered by private insurance. While some of these individuals may be Medicare managed care plan enrollees receiving short term, post-acute care (who are not captured in the above Medicare percentage), for purposes of this illustration we will assume they are residing in the center for long term care.
The average length of stay for short term care in a skilled nursing center is approx-imately 27 days (MedPAC, 2013); while the average long term care stay is greater than 365 days (Jones et al., 2009). Given this much shorter length of stay, over the course of one year, a typical 100-bed cen-ter will actually serve more total individuals coming from the hospital for short-stay, post-acute care than for long term care.
INDIVIDUALS WE SERVE Currently, skilled nursing care centers take care of two distinct groups of individuals: those who need rehabilitation after an acute illness and those who need long term care because they are unable to independently live at home or in an assisted living center.
In Table 1.3, Medicare admissions include individuals admitted from an acute care hospital. These admissions make up the largest type of admission to a skilled nurs-ing care center. Non-Medicare admissions are individuals coming to a center either from a non-qualifying Medicare acute hos-pital stay or from the community. Long-stay residents include those individuals who have been at a nursing care center for more than 12 months. Data reported for each
AHCA Quality ReportThe Long Term and Post-Acute Care Community
8

AHCA Quality ReportThe Long Term and Post-Acute Care Community
of these groups of individuals are drawn from the standard assessment instrument used for all persons in skilled nursing care centers, known as the Minimum Data Set (MDS). For Medicare and non-Medicare admissions, the assessments used in com-piling these statistics are those that were completed within 5–14 days of admission to a center. For long-stay residents, the data are drawn from annual assessments completed after residents have resided in a center for at least 12 months.
On average, the oldest individuals are long-stay residents. Those who come in as Medi-care admissions are older than non-Medicare admissions. Individuals under the age of 65 tend to come in as non-Medicare admissions. More than 50 percent of Medicare admis-sions are for individuals who are between the ages of 65 and 84. Of these three groups, long-stay residents have the largest propor-tion who are 85 and older, at 45.9 percent. Individuals in all three categories are more likely to be females than males (Table 1.3).
The MDS also captures information about cognitive impairments, such as dementia. Almost two-thirds (61.1 percent) of long-stay residents have dementia, compared to 37.7 percent of Medicare admissions and 40.2 percent of non-Medicare admissions (Table 1.3).
Activities of daily living (ADLs) are a series of activities necessary for an individual to perform on a daily basis. Time trends show increasing levels of dependency in ADLs among individuals served in skilled nursing
Principal Point-in-Time Payer of ServicesFIGURE 1.1
For-Profit Centers Not-for-Profit Centers Government Centers
55%
67%66%
19%31%
25%
15%14% 8%
Data Source: CMS CASPER data, March 2013
TABLE 1.3
Characteristics of Individuals Receiving Services in Skilled Nursing Care Centers
Medicare Admissions
Non-Medicare Admissions
Long-Stay Residents (>12 Months)
Number of Stays 2,452,848 798,513 850,906 Average Age 78.8 74.4 79.8
Age CategoryUnder 65 10.6% 26.3% 15.0%Age 65–84 53.7% 43.1% 39.1%85 and Older 35.8% 30.6% 45.9%
GenderMale 37.7% 39.6% 30.6%Female 62.3% 60.4% 69.4%
Cognitive Function Dementia* 37.7% 40.2% 61.1%
Data Source: CMS MDS 3.0, 2012 data reported*This measure is calculated using the BIMS score from MDS 3.0 and only includes those who are coded as severely (coded total of 0–7) or moderately (coded total 8–12) impaired.
MEDICAID MEDICAID MEDICAID
OTHER OTHER OTHER
MEDICARE MEDICAREMEDICARE
9

AHCA Quality ReportThe Long Term and Post-Acute Care Community
Trends in Resident ADL Dependence
Aver
age
ADL
Depe
nden
ce
Data Source: CMS CASPER data, March of each year
Graph shows the average dependence out of five ADLs (bed mobility, transfer, eating, toilet use and bathing) at a level of dependence ranging from supervision to total dependence.
2009 2010 2011 2012 2013
5.00
1.00
2.00
3.00
4.00
TABLE 1.4
ADL Dependence
Medicare Admissions
Non-Medicare Admissions
Long-Stay Residents (>12 Months)
Bed Mobility Independent 4.8% 9.8% 17.1%Supervision/Limited Assistance 22.3% 23.8% 18.9%Extensive Assistance/Total Dependence 72.7% 66.4% 64%
TransferIndependent 2.5% 6.7% 14.2%Supervision/Limited Assistance 23.5% 25.1% 20.4%Extensive Assistance/Total Dependence 73.9% 68.1% 65.4%
EatingIndependent 34.2% 34.9% 30.6%Supervision/Limited Assistance 47.7% 47.2% 42.6%Extensive Assistance/Total Dependence 18% 17.9% 26.7%
Toilet Use Independent 2.5% 5.9% 11.1%Supervision/Limited Assistance 20.9% 21.7% 16.8%Extensive Assistance/Total Dependence 76.5% 72.3% 72%
BathingIndependent 1.3% 2.1% 2.1%Supervision/Limited Assistance 9.6% 10.9% 9.2%Extensive Assistance/Total Dependence 88.8% 86.7% 88.6%
Data Source: CMS MDS 3.0, 2012 data reported
FIGURE 1.2
10
4.02 4.06 4.08 4.10 4.14
2009 2010 2011 2012 2013
4.50
3.50
4.004.02
4.06 4.08 4.104.14
centers (Figure 1.2). In an analysis concen-
trating on five ADLs— bed mobility, transfer,
eating, toilet use and bathing—95.2 percent
of those who come in as Medicare admissions
need some degree of assistance, ranging
from needing supervision to being totally
dependent, on four or five ADLs. Among those living in the center for more than 12 months, 85.6 percent of residents need some degree of assistance with four or five ADLs.
A larger percentage of Medicare admissions, 72.7 percent, require extensive assistance or
are totally dependent on assistance with bed
mobility as compared to non-Medicare and
long-stay residents. This pattern also holds
true for transfer, toilet use and bathing. A
significant percentage of residents who are
in a nursing center for more than 12 months,

26.7 percent, require extensive assistance or are totally dependent on assistance with eating (Table 1.4).
The Case Mix Index (CMI) is an indicator of the clinical complexity and resource needs of individuals who are cared for in skilled nursing care centers. For Medicare beneficiaries receiving services in skilled nursing care cen-ters, individuals are assigned into Resource Utilization Groups (RUGs) based on numerous factors, including clinical conditions, comor-bidities and support needs. Each RUG has an associated CMI value based on historical
studies of the amount of nursing time needed to care for persons in each RUG. The CMI increases in value with the resource needs of the individual. As shown in Figure 1.3, the average case mix for persons receiving ser-vices in skilled nursing care centers steadily increased over the period from 2006 through 2010. Notwithstanding the change in the RUG system in 2011 and the case-mix weights in FY 2011, the case mix appears to have continued to increase each year.
The large majority of individuals in nursing care centers receive some sort of therapy
during their stay (i.e., physical, occupational or speech). Almost all Medicare admissions (94 percent) receive at least one type of therapy during their stay. Approximately 88.2 percent receive at least 45 minutes of therapy and fall into one of the rehabilitation RUGs. These individuals also commonly need therapy from a combination of different types of therapists. This is expected, as Medicare admissions to skilled nursing care centers occur after an acute inpatient hos-pital stay. As such, many individuals arrive with higher dependency in their ADLs due to recent acute illness or injury and with the goal of rehabilitation to return them to their homes in the community. Similarly, a large proportion of non-Medicare admissions also receive therapy. In contrast, only 11.7 percent of individuals who reside in a center long term (e.g., greater than 12 months) received therapy in the seven days preceding their annual assessment (Table 1.5). For long-stay residents, therapy services are frequently covered by Medicare Part B.
WORKFORCEThe skilled nursing care center workforce consists of individuals from many professions, including certified nursing assistants (CNAs),
AHCA Quality ReportThe Long Term and Post-Acute Care Community
National Case Mix Index
2006 2007 2008 2009 2010 2011
1.40
1.25
1.30
1.35
CMI
Data Source: CMS Skilled Nursing Facility Prospective Payment System 100% claims data
Actual RUG weights for each year as cited in Federal Register. Period 2006–2010 uses 2006 RUG weights, 2011 uses 2012 RUG weights due to a correction to the RUG weights.
1.27
1.291.30
1.31 1.31
1.35
FIGURE 1.3
TABLE 1.5
Therapy
Medicare
New AdmissionsNon-Medicare
New Admissions Individuals in Centers
(>12 Months)Therapies Administered at Time of Assessment Speech Therapy 31.3% 21.3% 2.7%Occupational Therapy 89.8% 66.6% 5.5%Physical Therapy 91.6% 69.3% 6.8%
At Least Two Therapies Administered at Time of AssessmentSpeech and Occupational Therapy 29.9% 19.7% 0.7%Speech and Physical Therapy 29.9% 20.0% 0.7%Occupational and Physical Therapy 88.1% 64.8% 2.4%
All Three Therapies Administered during Assessment PeriodSpeech, Occupational and Physical Therapy 29.9% 19.7% 0.7%
Any One of the Three Types of Therapy Administered during Assessment PeriodAny Therapy (Speech, Occupational, Physical) 94.0% 72.0% 11.7%
Data Source: MDS 3.0 data, 2012 data reported
11

licensed practical nurses (LPNs), registered nurses (RNs), nurses with administrative duties (ARNs), nurse practitioners, therapists, dietary staff, social workers, housekeeping personnel, social services staff, activity professionals and administrative workers. In 2012, skilled nursing care centers employed a total of 1,662,910 individuals (United States Department of Labor, Bureau of Labor Statistics, 2012).
Skilled Nursing Care Center Staffing
During the period from 2008 through 2013, the direct care nursing hours per resident day have steadily increased at all levels of
nursing staff (Figure 1.4). This is a positive trend, as research has demonstrated that staffing is associated with the quality of care in skilled nursing care centers. For instance, a 2011 study shows that every additional hour of CNA staffing per resident day is associated with a 10 percent decrease in the total deficiency score of a center. A six-min-ute increase is associated with a 3 percent decrease in the quality of care deficiency score. Conversely, a one-hour decrease in CNA staffing per resident day is associated with a 33 percent increase in quality of care deficiencies (Hyer et al., 2011).
The CMS Five-Star System is a quality rating method that was created to help consumers select and compare skilled nursing centers.
The system provides a rating from one star (quality much below average) through five stars (quality much above average) for each of the following areas: health inspections, staffing and quality measures, as well as an overall aggregate rating combining all three areas. The staffing component of the system is based on the number of RN hours per resi-dent day and the number of total nursing hours per resident day (including RNs, LPNs and CNAs). The measure is adjusted to account for variations in the acuity of residents in different nursing care centers (Abt Associates, 2013). As shown in Figure 1.5, the percent of nursing care centers receiving the top ratings of four or five stars in the staffing component has steadily increased since 2009. In 2009, 38.3 percent of centers received four or five stars, compared to 51.3 percent that received those ratings in 2013. The converse trend of decreases in one and two stars also holds true. In 2009, 41.8 percent of centers had one or two stars, compared to only 28.4 percent in 2013.
Staff Turnover and Retention
The largest national source of nursing care center turnover and retention data is an annual Nursing Facility Staffing Survey con-ducted by AHCA. The survey is distributed to all nursing care centers in the United States, regardless of AHCA membership. In 2011, the most recent year for which data analyses are complete, more than 4,000 skilled nursing care centers participated in the survey. This survey measures turnover by dividing the number of staff who left (voluntarily or otherwise) in a given year by the total number of current employees at the end of the calendar year. Retention is measured by dividing the number of employees who have worked in the center for at least 12 months by the total number of employees at the end of the calendar year (AHCA, 2013).1
In 2011, nursing staff turnover was high at all levels. It was the highest for RNs, at 63 percent, and the lowest for Directors
AHCA Quality ReportThe Long Term and Post-Acute Care Community
20092008 2010 2011 2012 2013
4.0
3.0
0.0
2.0
1.0
0.32
0.32 0.36 0.39 0.42 0.44
0.79
0.81 0.83
0.82 0.83
0.82
2.33
2.35 2.40
2.24 2.
42
2.42
3.44 3.48 3.
59
3.45 3.
67
3.68
Direct Care Nursing Hours per Resident DayFIGURE 1.4
Data Source: CMS CASPER data, March of each year ■ RN ■ LPN ■ CNAs ■ Total
March 2010March 2009 March 2011 March 2012 March 2013
Trends in Five-Star Staffing RatingsFIGURE 1.5
■ 1 Star ■ 2 Star ■ 3 Star ■ 4 Star ■ 5 StarData Source: CMS Nursing Home Compare, Five-Star data
7.3%
31.0%
19.8%
19.1%
22.7%
34.6%
20.8%
18.9%
18.0%
7.7%
37.9%
21.0%
17.7%
14.9%
8.5%
39.7%
21.0%
16.8%
13.1%
9.3%
41.2%
20.3%
15.7%
12.7%
10.1%
1 2012 results from the AHCA Nursing Facility Staffing Survey were not available before publication of this report.
12
Hour
s pe
r Res
iden
t Day

ARNDON RN LPN CNA
31.7
%29
.4%
22.3
%
24.4
%
22.4
%23
.9%
33.7
%
49.6
% 55.5
%47
.8%
62.8
%
44.6
%43
.1%36
.9% 43
.1%
59.7
%50
.3%
46.9
%55
.3%
of Nursing (DONs), at 24 percent (Figure 1.6). Turnover in non-nursing job catego-ries was also high in 2011. In these other categories, housekeeping and maintenance had the highest turnover, at 44 percent, and therapy staff had the lowest, at 25 percent (Figure 1.6). The national economic situation plays a role in the increase and decrease of turnover in all workforce sectors, including health care. Tradition-ally, turnover in all sectors (including both health care and non-health care businesses)
is low when the economy is poor and increases when the economy improves. This is further evidenced by the inverse relationship between unemployment rates and turnover, where low unemployment levels typically correspond to high turnover. The trend observed here in 2011 may be related to improvements in the economy, compared to the national economic down-turn that occurred during the earlier period of 2008–2010 when we saw decreases in turnover (AHCA, 2013).
In 2011, retention decreased slightly for all employees; however, it remained relatively stable for all nursing staff at 70 percent. Retention of RNs was 66 percent and was the lowest among nursing staff. Retention of DONs was the highest among nursing staff, at 85 percent (Figure 1.7). Retention of administrative staff was the highest among non-nursing staff, at 83 percent, and reten-tion of food service staff, at 74 percent, was the lowest (Figure 1.7).
AHCA Quality ReportThe Long Term and Post-Acute Care Community
70%
60%
30%
20%
10%
0%
50%
40%
Trends in Staff Turnover
Nursing Staff Categories
Nursing Staff Categories
All Staffing Categories
All Staffing Categories
Trends in Staff Retention
FIGURE 1.6
FIGURE 1.7
■ 2008 ■ 2009 ■ 2010 ■ 2011
■ 2008 ■ 2009 ■ 2010 ■ 2011
Data Source: AHCA Nursing Facility Staffing Survey, 2008–2011
Data Source: AHCA Nursing Facility Staffing Survey, 2008–2011
Perc
ent T
urno
ver
13
25.8
%
Total of All Staffing Categories
45.1
%42
.0%
37.0
% 45.0
%
Administrative Staff
Therapy Staff
Food Service Staff
Housekeeping & Maintenance
Activities Staff
21.8
%21
.1%17
.7%
26.7
%
17.1%
48.6
%39
.3%
34.2
%43
.9%
30.0
%29
.4%
26.0
%44
.3%
23.8
%25
.3%
23.3
% 28.0
%
26.1%
17.6
% 24.7
%
Total of All Staffing Categories
69.0
%72
.9%
72.6
%72
.1%
90%
60%
70%
80%
30%
20%
10%
0%
50%
40%
Perc
ent R
eten
tion
ARNDON RN LPN CNA
80.5
%82
.1% 85.2
%84
.8%
76.7
%75
.3%
77.2
%77
.5%
67.1%
67.8
%68
.5%
65.7
%
69.5
%73
.5%
74.6
%73
.8%
64.6
%68
.4%
68.5
%68
.6%
Administrative Staff
Therapy Staff
Food Service Staff
Housekeeping & Maintenance
Activities Staff
82.0
%85
.5%
84.8
%83
.4%
74.7
%
69.8
%74
.8%
74.7
%73
.7%
76.6
%80
.5%
81.1%
80.7
%
77.4
% 82.5
%82
.0%
80.0
%
78.8
%80
.8%
78.3
%
50.7
%46
.9%
41.6
%50
.0%
All Nursing Staff
All Nursing Staff
66.9
%70
.4%
70.3
%69
.9%

AHCA Quality Report
AMERICAN HEALTH CARE ASSOCIATION MEMBERS
14
Ownership Type of AHCA CentersFIGURE 2.1
Data Source: AHCA Membership Database, as of March 2013
The American Health Care Association (AHCA) represents a diverse group of more than 8,600 long term and post-acute care providers across the United States. This report focuses on the skilled nursing care sector and is primarily based on national data sets, which include data only for those skilled nursing care centers that participate in the Medicare and Medicaid programs. There are a small number of providers that do not accept payment through these programs and are, thus, not represented in the national data sets. AHCA membership data reported in this section has, thus, been limited to those approximately 8,600 members that provide skilled nursing care services and are federally certified. Informa-tion about AHCA members is from both the national data sets and the AHCA member-ship database.
As of March 2013, AHCA membership includes 55.0 percent of the 15,681 skilled nursing care centers across the nation. Our 8,631 member centers are a com-bination of for-profit, not-for-profit and government centers. AHCA’s membership includes 63.6 percent of all the nation’s for-profit centers, 35.4 percent of the not-for-profit centers and 37.7 percent of the government-owned centers.
Member centers include those owned by multi-facility corporations, which consist of a wide range of sizes, as well as those that operate as stand-alone entities. CMS does not capture national data that would allow for a fine-grain analysis of the ownership type and size of parent organizations at a nationwide level. The CMS definition of a multi-facility entity is any group of two or more facilities under common ownership,
regardless of size. AHCA membership data categorize members in three distinct groups:
• independently owned: fewer than 1,200 total beds across all centers;
• regional multi-facility organizations: more than 1,200 beds but fewer than 4,000 beds across all centers; and
• multi-facility organizations: 4,000 or more beds across all centers.
See Figure 2.1 for a breakdown of the AHCA membership across these three categories. The largest proportion of AHCA member centers are those that are part of regional multi-facility organizations, followed by independently owned centers and large nationwide corporations, which comprise less than one-fourth of AHCA members.
Nationally, 69.4 percent of all skilled nursing care centers are located in urban settings.
Independently Owned Centers
Centers Owned by Regional Multi-Facility Organizations
Centers Owned by Multi- Facility Organizations

Similarly, 67.5 percent of AHCA members are located in urban settings. AHCA members tend to have a slightly lower average number of beds per center, at 107.1, than non-member centers, which have an average of 110.4 beds per center. However, AHCA members have slightly higher aver-age occupancy than non-members, at 87.1 percent, compared to 84.3 percent.
As mentioned earlier, nursing care centers are paid primarily by Medicare and Medicaid. In order to receive payment from these sources, nursing care centers are required to get beds certified by demonstrating that they meet state licensure rules and federal regulations. Among certified beds, a majority (89.3 percent) in the nation are certified for both Medicare and Medicaid. However, AHCA members are more likely than non-members to certify the majority of
their beds for both Medicare and Medicaid, at 94.0 percent of all certified beds for AHCA members, versus 83.7 percent for non-members. In the aggregate, the AHCA membership includes 57.8 percent of the nation’s dually certified beds, 30.4 percent of Medicare-only certified beds and 33.1 percent of Medicaid-only certified beds. AHCA members provide care for 55.6 percent of all individuals admitted to skilled nursing care centers for Medicare Part A-covered post-acute care (Table 2.1).
AHCA QUALITY INITIATIVE AND ACTIVITIES AHCA is committed to quality improvement and encourages its members to participate in quality improvement efforts, including the AHCA Quality Initiative, LTC Trend Trackersm, the AHCA/NCAL (National Center for
Assisted Living) National Quality Award Program and the Advancing Excellence in America’s Nursing Homes Campaign.
AHCA Quality Initiative
AHCA announced its Quality Initiative in February 2012 and set four specific measurable goals with a target date to accomplish them. They include:
Safely Reduce Hospital Readmissions: By March 2015, safely reduce the number of hospital readmissions within 30 days during a skilled nursing care center stay by 15 percent.
TABLE 2.1
Number of Centers and Ownership Type
Member Non-Member TotalTotal Number of Centers 8,631 7,050 15,681 Number of For-Profit Centers 6,894 3,945 10,839Number of Not-for-Profit Centers 1,393 2,537 3,930Number of Government Centers 344 568 912
Facility Type Number of Centers Owned by Multi-Facility Organizations 5,381 3,211 8,592 Number of Independently-Owned Centers 3,250 3,839 7,089
Geographic MixNumber of Urban Centers 5,828 5,054 10,882 Number of Rural Centers 2,803 1,996 4,799
Size and OccupancyAverage Occupancy 87.1% 84.3% 86.0%Average Number of Beds per Center 107.1 110.4 108.6
Bed CertificationNumber of Medicare-Only Certified Beds 27,788 68,082 97,870Number of Medicaid-Only Certified Beds 26,954 54,493 81,447Number of Medicare/Medicaid Certified Beds 860,372 628,716 1,489,088
Medicare Part A VolumeSkilled Nursing Care Center Medicare Part A Admissions* 1,342,211 1,072,538 2,414,749
Data Source: CASPER Data, March 2013, for total number of centers, facility type, geographic mix, size and occupancy, and bed certification. MDS 3.0 2012 data for Medicare Part A volume.* Number of skilled nursing facility Part A status admissions was calculated based on the completion of a five-day MDS assessment, which is only required for Part A stays.
15
AHCA Quality ReportAmerican Health Care Association Members

Increase Staff Stability: By March 2015, reduce turnover among nursing staff (RN, LPN/LVN, CNA) by 15 percent.
Increase Customer Satisfaction: By March 2015, increase the percentage of customers who would recommend the facility to others up to 90 percent.
Safely Reduce the Off-label Use of Antipsychotics: By December 2013, safely reduce the off-label use of antipsychotics by 15 percent.2
These goals build on long-standing quality improvement work in long term and post-acute care. The Quality Initiative embraces and supports the triple aim of improving the patient experience of care,
improving the health of populations and reducing the per-capita cost of health care.
GOAL 1: Safely Reduce Hospital Readmissions
Hospital readmissions from skilled nursing care centers have potentially negative impacts on the physical, mental and emotional well-being of individuals. The high number of readmis-sions has been identified by policymakers as a key opportunity to reduce health care costs and improve quality of care. Currently, as a result of the Patient Protection and Affordable Care Act (ACA), hospitals with a higher- than-statistically expected rate of 30-day readmissions based on the population served are subject to reductions in Medicare payment
rates for all Medicare inpatient admissions. In the first year of the Hospital Readmission Reduction Program, more than 2,200 hospitals received penalties that amounted to a total of $280 million (Laderman et al., 2013).
A number of other programs and entities are also focusing on this important issue. For example, the Better Care for Nursing Facility Residents through Enhanced Coordination Efforts initiative by CMS also focuses on re-ducing readmissions, as does the Partnership for Patients, which has a goal of reducing 30-day hospital readmissions by 20 percent in three years. CMS has also included the review of readmissions into the Quality Indicator Survey process for skilled nurs-ing care centers. In addition, MedPAC has
AHCA Quality ReportAmerican Health Care Association Members
Safely Reduce Hospital Readmissions
Safely reduce the number of hospital readmissions within
30 days during a skilled nursing care center stay by 15 percent
BY MARCH 2015
Increase Staff Stability
Reduce turnover among nursing staff (RN, LPN/LVN, CNA)
by 15 percent
BY MARCH 2015
Increase Customer Satisfaction
Increase the percentage of customers who would recommend the facility to others up to 90 percent
BY MARCH 2015
Safely Reduce the Off-label Use of Antipsychotics
Safely reduce the off-label use of antipsychotics
by 15 percent
BY DECEMBER 2013
16
Trends in the Skilled Nursing Care Center Rehospitalization Rate for AHCA Members
FIGURE 2.2
Data Source: OnPoint-30 Rehospitalization Measure
Aver
age
Adju
sted
Reh
ospi
taliz
atio
n Ra
te
2011 Q4 Baseline 2012 Q1 2012 Q2 2012 Q3 2012 Q4
20%
15%
16%
17%
18%
19%18.2% 18.1% 18.0% 17.9% 17.9%
2011 Q4 Baseline 2012 Q1 2012 Q2 2012 Q3 2012 Q4
19%
17%
18%
2 Updated as of 2013 from the 2012 goal.
18.218.1
18.017.9 17.9

AHCA Quality ReportAmerican Health Care Association Members
1717
AHCA Quality ReportAmerican Health Care Association Members
*Membership numbers vary because change can only be calculated for centers with complete data in both time periods. Source for readmissions: OnPoint-30 Rehospitalization MeasureSource for antipsychotics: CMS Nursing Home Compare Quality Measures
Readmissions
Antipsychotics
Among AHCA members nationwide, the reduction in 30-day hospital readmission rates in the first year of the Quality Initiative equates to 17,178 individuals who were not rehospitalized. Many of AHCA’s members made significant progress in 2012 toward meeting the three-year goal of a 15% reduction.
Among AHCA members nationwide, the reduction in off-label use of antipsychotics in the first year of the Quality Initiative equates to 11,350 fewer individuals who are on these medications. Many of AHCA’s members have met the 15% reduction goal, while others are making significant progress.
6,406* Member Centers
7,605* Member Centers
29.2%
38.3%
24.9%
19.8%
45.9%
41.9%
■ Improved 15% or More ■ Improved Less than 15%
■ Did Not Improve
■ Improved 15% or More ■ Improved Less than 15%
■ Did Not Improve
AHCA Member Improvement in Off- Label Use of Antipsychotics
2011–2012
AHCA Member Improvement in Readmission 2011–2012
Hospital
Skilled Nursing Care Center

recommended a program to reduce rehospi-talizations from skilled nursing centers.
AHCA is measuring progress of this goal using PointRight’s OnPoint-30™ Rehospitalization metric. This is an all-cause measure of 30-day readmissions from the skilled nursing care center setting that is risk-adjusted using 33 demographic and clinical factors to achieve comparability across facilities. It is calculated using MDS 3.0 data for a 12-month period. Data from either the five-day Skilled Nursing Facility Prospective Payment System assess-ment or the 14-day admission assessment are used to calculate the denominator (i.e., all persons admitted from a hospital) and all of the clinical factors used in risk adjustment. The numerator of the measure is based on the number of individuals sent back to any hospital (excluding emergency room only visits) from a nursing center within 30 days of admission as indicated on the MDS discharge assess-ment. The denominator includes all residents admitted from an acute hospital to a nursing care center who have had an MDS admission assessment during the prior 12 months. Thus, this includes persons whose stays are covered by Medicare Part A (fee for service), Medicare managed care, Medicaid, commercial insur-ance and other forms of payment.
From the baseline period of the fourth quarter of 2011 through the fourth quarter of 2012, AHCA member centers have made progress toward reducing the number of hospital readmissions. AHCA members started at a readmissions rate of 18.2 percent and decreased to 17.9 percent, a 1.6 percent decrease in one year (Figure 2.2). In this period, more than a quarter (29 percent) of AHCA member centers have already achieved the three-year goal of a 15 percent reduction. As a result, AHCA members have successfully avoided a total of 17,178 hospital readmissions in the first year of this initiative.
GOAL 2: Increase Staff Stability
Studies have found that higher levels of turnover in skilled nursing care centers are associated with lower quality of care (Castle & Anderson, 2011). The baseline period for measuring progress on the staff stability goal is 2011 (Figure 2.3). As described in the Workforce section of this report, turnover is measured annually after the end of the calendar year through a mailed survey to all nursing centers. AHCA currently is analyzing turnover data for 2012 in order to track first-year progress on this goal.
GOAL 3: Increase Customer Satisfaction
Measuring customer satisfaction enables skilled nursing care centers to gain essential insight into their performance in offering quality of care and quality of life from the perspective of the individuals they serve and their families. There is no single customer satisfaction survey that is consistently used in the long term and post-acute care field. The Nursing Home Consumer Assessment of Health Providers and Systems (NH CAHPS), developed by the Agency for Healthcare Research and Quality and endorsed by the National Quality Forum (NQF), is the only non-proprietary survey currently available; all others are proprietary. Use of the NH CAHPS to date is limited as it requires face-to-face interviews, making it cost prohibitive to implement on a national scale. AHCA’s review of the predominant customer satisfaction surveys used in the field reveals that they all contain two similarly worded questions, which are examined in more detail in the Customer Satisfaction section of this report:
1. How satisfied were you overall with your experience at [insert facility]?
2. Would you recommend this facility to (a friend or someone else)?
As there is no one commonly used survey, AHCA lacks the data to allow measure-ment of progress on this goal across all members. To address this, AHCA’s Cus-tomer Experience Committee is working on developing a core set of customer sat-isfaction questions that are being tested by Dr. Nicholas Castle at the University of Pittsburgh. After they have been validated, AHCA will submit these questions to the NQF for endorsement and will work with the various vendors to incorporate them into their instruments.
GOAL 4: Safely Reduce the Off-Label Use of Antipsychotics
The reduction of off-label use of antipsy-chotic drugs in skilled nursing care centers is a national priority. Several studies have
AHCA Quality ReportAmerican Health Care Association Members
18
2011 Direct Care Nursing Staff Turnover for AHCA Members*
FIGURE 2.3
CNARN All Direct Care Nursing Staff Combined (RN, LPN, CNA)LPN
Perc
ent T
urno
ver
Data Source: AHCA Nursing Facility Staffing Survey, 2008–2011* This measure and these data exclude the nursing staff categories of Directors of Nursing and nurses with administrative duties in order to
best capture nursing staff providing direct care services.
70%
60%
30%
20%
10%
0%
50%
40%
66.4%
44.4%
56.1% 54.0%

demonstrated that these medications provide only a small benefit for a limited set of individuals with dementia, but pose a large risk of adverse events (Ballard, Waite, & Birks, 2006; Maher et al., 2011). In 2012, CMS launched the Partnership to Improve Dementia Care in Nursing Homes, which sets a matching goal to reduce the use of antipsychotic medications in nursing centers.
The baseline period for this goal is the fourth quarter of 2011, and progress on the goal is measured using the CMS quality measure on the prevalence of off-label use of antipsy-chotic medications in skilled nursing care centers. AHCA member centers have seen a 6.7 percent decrease in the use of antipsy-chotic medications from the fourth quarter of 2011 to the fourth quarter of 2012 (Figure 2.4). In this period, 58.1 percent of AHCA members improved their rates on this measure, with 38.3 percent achieving a reduction of 15 percent or more in their rates.
AHCA PROGRAMS THAT ADVANCE PERFORMANCE AHCA encourages its members to further their quality journey by participating in a
number of programs. Three of these are further explored below.
LTC Trend Tracker
AHCA’s LTC Trend Trackersm (LTCTT), a web-based tool, is a free member service that provides centers the ability to set benchmarks and compare their operations to others. LTCTT offers AHCA members numerous downloadable quality, clinical and financial reports. LTCTT is used by AHCA members to support their quality improve-ment efforts and offers providers a singular tool that can assist with quality assurance/performance improvement goal setting, basic analytics and marketing.
LTCTT provides registered users unique data unavailable elsewhere, such as Risk-Adjusted Rehospitalization reports; a modeling tool that allows centers to predict their Five-Star ratings based on potential changes in staffing or quality measure results; and staffing, turnover and RUG utilization reports. The information found in LTCTT comes from various publicly reported resources and data submitted by members, which is organized by each center’s Medicare provider number.
In 2013, LTCTT, in collaboration with PointRight, announced the Risk-Adjusted
Rehospitalization report, using PointRight’s OnPoint-30 measure described earlier. This information is valuable to centers in assessing and benchmarking their own performance, as well as demonstrating their performance as compared to peers to com-munity partners, payers, referral sources and others.
The Five-Star Staffing and Quality Measure reports also contain a tool that allows users to predict how their organization’s Five-Star rat-ing may change based on a change in staffing levels, staffing mix or their quality measure results. This tool ranks quality measures so users can focus on those measures that need the most improvement to potentially increase their Five-Star rating. In addition, users have the ability to enter data for goal setting and see how improving certain quality measure scores can affect their rating. Similarly, the Five-Star staffing tool allows users to see how they need to alter staffing patterns to improve their staffing rating.
AHCA/NCAL National Quality Award Program
The AHCA/NCAL National Quality Award Program is a progressive, three-step pro-gram based on the nationally recognized
AHCA Quality ReportAmerican Health Care Association Members
19
Trends in Skilled Nursing Care Center Off-Label Use of Antipsychotics for AHCA Members
FIGURE 2.4
Data Source: CMS Nursing Home Compare Quality Measures, 2011–2012
Aver
age
Antip
sych
otic
Use
Rat
e
2011 Q4 Baseline 2012 Q1 2012 Q2 2012 Q3 2012 Q4
29%
15%
17%
19%
21%
23%
25%
27%
2011 Q4 Baseline 2012 Q1 2012 Q2 2012 Q3 2012 Q4
23.8% 23.9%
23.4%
22.9%
22.1%
25%
20%
24%
22%
21%
23%22.1%22.9%23.4%
23.9%23.8%

AHCA Quality ReportAmerican Health Care Association Members
Nursing Care Centers with No Health CitationsFIGURE 2.6
2009 2010 2011 2012 2013
20%
5%
15%
10%
Data Source: CMS CASPER data, Standard and Complaint Health Surveys, March of each year
● Silver/Gold Recipients (2010–2012) ■ All Others
10.0%
8.0%
10.0%
8.0%
14.0%
9.0%
17.0%
9.0%
14.0%
Nursing Care Centers with a High (4 or 5) Five-Star Overall RatingFIGURE 2.5
2009 2010 2011 2012 2013
80%
30%
60%
50%
40%
70%
Data Source: CMS Five-Star Nursing Home Compare data, March of each year
● Silver/Gold Recipients (2010–2012) ■ All Others
10.0%
20
46.8%
35.4%
50.8%
39.0%
68.3%
42.6%
72.2%
43.1%
74.6%
46.7%
Baldrige Performance Excellence criteria. AHCA/NCAL members can apply for recog-nition at the Bronze, Silver and Gold levels. As an organization progresses through the levels, applicants must showcase a more detailed and comprehensive demonstration of systematic quality performance and organizational effectiveness.
As of the 2012 award cycle, 2,856 AHCA/NCAL members have received a Quality Award at one or more levels. These mem-bers are well suited to meet the forth-coming regulatory requirements of Quality Assurance and Performance Improvement (QAPI), mandated for implementation in skilled nursing care centers by the ACA, due to the parallels that exist between the criteria of the Quality Award program and the five elements of QAPI. Both QAPI and the Quality Award program utilize a systematic approach to organizational performance and focus on leadership, responding to staff and customers, and demonstrating results (Kaldy, 2013).
Since its start in 1996 through 2012, the Quality Award program has received more than 8,000 applications and has issued more than 3,000 awards, including 13 Gold, 256 Silver and 2,856 Bronze. The AHCA/
NCAL National Quality Award Program is a member of the Alliance for Performance Excellence, an association of the 39 recognized Baldrige-based award pro-grams in the nation. The AHCA/NCAL program is the largest of these programs, with a volume of applications that exceeds the combined total of all the other 38 programs and the National Baldrige program. From 2010–2012, these programs received a total of 403 applications; whereas, in the same timeframe, the AHCA/NCAL National Quality Award program received 3,025 applications.
AHCA analysis shows that those nursing care centers receiving the Silver and Gold awards (based on data analysis for 125 total Silver recipients and four Gold recipients from 2010, 2011 and 2012) have better per-formance than other centers nationwide on their overall, staffing and quality measure Five-Star ratings (Figure 2.5) and other qual-ity measures. They are also more likely than others to be deficiency free. Among regu-latory surveys conducted in 2008 (reported as of March 2009), 10 percent of Silver and Gold recipients had no health citations. This increased to 14 percent by the March 2013 reporting period (for surveys conducted in 2012); whereas, for the same time periods,
8 percent of all other facilities nationally had no health citations in 2008 and 10 percent had no health citations in 2012 (Figure 2.6).
Silver and Gold award recipients in the last three years also have better performance than other AHCA members on the Quality Initiative goals. For instance, they have had a 3.4 percent reduction from the fourth quarter of 2011 to the fourth quarter of 2012 in the prevalence of off-label use of antipsychot-ics, while other members reduced use by 1.6 percent (Figure 2.7). The risk-adjusted rehospitalization rate for the one-year period ending the fourth quarter of 2012 for centers that received the Gold or Silver award in the last three years was 17.4 percent, compared to 17.9 percent for other AHCA members (Figure 2.8).
Advancing Excellence in America’s Nursing Homes Campaign
The Advancing Excellence in America’s Nursing Homes Campaign (AE), established in 2006, is focused on supporting skilled nursing care centers to improve perfor-mance. AHCA was one of the 13 founding members of AE and has been an active member on the AE board and numerous committees since its inception. Nursing
Perc
ent o
f Nur
sing
Car
e Ce
nter
s w
ith a
4 o
r 5 F
ive-
Star
O
vera
ll Ra
ting
Perc
ent o
f Nur
sing
Cen
ters
with
No
Heal
th C
itatio
ns

care centers that voluntarily enroll in AE are required to select goals and set targets for improvement. AE has periodically revised its goals and processes and is now in its third phase, which is focused on nine goals:
1. Improving Staff Stability
2. Increasing Use of Consistent Assignment
3. Increasing Person-Centered Care Planning and Decision Making
4. Safely Reducing Hospitalizations
5. Using Medications Appropriately
6. Increasing Resident Mobility
7. Reducing Pressure Ulcers
8. Decreasing Symptoms of Pain
9. Preventing/Managing Infections Safely
These goals align with many national priorities, including the CMS Partnership to Improve Dementia Care, the National Nursing Home Quality of Care Collaborative led by Quality Improvement Organizations across
the country, the Partnership for Patients and the AHCA/NCAL Quality Initiative.
Skilled nursing care centers voluntarily enroll in the campaign and work on achieving mea-surable improvements in the goal areas using the free resources that are provided by AE. A nursing care center is considered enrolled in AE if it has registered to participate and selected goals. Currently, the campaign has more than 9,000 centers enrolled, of which 60 percent are AHCA members (Figure 2.9).3
Key components of AE are the Local Area Networks of Excellence (LANEs). They consist of a wide range of stakeholders at the state level that have organized to support participating nursing homes within each state in achieving the AE goals. AHCA state affiliates participate in 46 LANEs and act as a convener or co-convener of 16 LANEs4 (Advancing Excellence in America’s Nursing Homes Campaign, 2013).
AHCA Quality ReportAmerican Health Care Association Members
3 Based on 3/12/13 AE enrollment numbers and AHCA membership as of March 2013. 4 Based on 3/12/13 information received from AE.
21
Nursing Care Centers Enrolled in Advancing Excellence
FIGURE 2.9
■ AHCA Members
■ Non-AHCA Members
60%40%
Comparison of Off-Label Antipsychotic Use Comparison of Rehospitalization Rates FIGURE 2.7 FIGURE 2.8
2011 Q4 Baseline
2011 Q4 Baseline2012 Q1 2012 Q12012 Q2 2012 Q22012 Q3 2012 Q32012 Q4 2012 Q4
25% 19%
15% 17%
20% 18%
Prev
alen
ce o
f Off
-Lab
el A
ntip
sych
otic
Use
Aver
age
Adju
sted
Reh
ospi
taliz
atio
n Ra
te
Data Source: CMS Nursing Home Compare Quality Measures, 2011–2012 * Other AHCA Members excludes Silver/Gold Recipients (2010–2012)
Data Source: OnPoint-30 Rehospitalization Measure* Other AHCA Members excludes Silver/Gold Recipients (2010–2012)
● Silver/Gold Recipients (2010–2012) ■ Other AHCA Members* ● Silver/Gold Recipients (2010–2012) ■ Other AHCA Members*
18.3%18.2%
18.0%
22.2%
22.3% 22.2%21.6%
20.3%
18.9%
23.8% 24.0%23.4%
23.0%
17.6% 17.6%17.5%
17.6%
17.4%
Data Source; Advancing Excellence in America’s Nursing Homes Campaign, March 2013
17.9% 17.9%

AHCA Quality Report
TRENDS IN QUALITY
22
SKILLED NURSING CARE CENTER QUALITY MEASURES Skilled nursing care center quality measures are calculated by CMS based on information collected using the MDS assessment tool. Due to the transition from MDS version 2.0 to version 3.0 and accompanying revisions to the quality measures at the end of 2010, there was a period during which measures were not calculated or reported. The current quality measures are only available starting from the fourth quarter of 2011. There are five short-stay quality measures and 13 long-stay quality measures. Almost all the quality measures are showing improving trends from the fourth quarter of 2011 to the fourth quarter of 2012 (Table 3.1).
REGULATORY COMPLIANCE MEASURES Federal law requires that nursing care centers that are Medicare and/or Medicaid certified comply with the requirements that are present in 42 CFR Part 483, Sub-part B. To assess this compliance, skilled nursing care centers are inspected by state surveyors who are contracted by CMS. These inspections are conducted annually and are referred to as “standard surveys.” Each Medicare- and/or Medicaid-certified center is required to have a standard survey conducted at least once every 12 to 15 months. If a complaint is lodged against the nursing center, a focused survey, referred to as a “complaint survey,” may also be conducted at a separate time from
the standard survey. A citation is given to the center during a survey if it fails to comply with any of the 174 “F-tags,” representing the regulatory requirements. Each citation is rated based on its scope, or how prevalent the deficiency is, and its severity, or how much potential or actual harm occurred. Certain citations are classi-fied as Substandard Quality of Care (SQC). These citations are for deficiencies in the regulatory categories of resident behavior and facility practices, quality of life or quality of care that are rated as immedi-ate jeopardy; or a pattern of widespread actual harm; or a widespread potential for more than minimal harm.
Table 3.2 reports on trends in citations of three safety-related deficiencies. In the
TABLE 3.1
Quality Measure Rates
2011 Q4 2012 Q4Percent of Long-Stay Residents Who:Receive an Antipsychotic Medication for Off-Label Indication 23.9% 22.9%Have a Pressure Ulcer (High Risk) 7.0% 6.4%Are Physically Restrained 2.4% 1.9%Have Increasing Symptoms of Depression or Anxiety 7.2% 6.9%Experience One or More Falls with Major Injury 3.4% 3.3%Have Moderate to Severe Pain 12.4% 10.1%Have Weight Loss 7.2% 7.3%Experience Increased Dependency in ADLs 16.8% 15.8%Have an Indwelling Urinary Catheter 4.3% 3.8%Are Incontinent of Bowel or Bladder (Low Risk) 41.6% 43.1%Have a Urinary Tract Infection 7.8% 7.2%Are Assessed and Appropriately Given the Seasonal Influenza Vaccine 91.0% 92.1%Are Assessed and Appropriately Given the Pneumococcal Vaccine 94.0% 94.3%
Percent of Short-Stay Residents Who:Are Started on an Antipsychotic Medication for Off-Label Indication 3.0% 2.8%Have Moderate to Severe Pain 23.1% 21.1%Have One or More Pressure Ulcer(s) That Are New or Worsening 2.1% 1.5%Are Assessed and Appropriately Given the Seasonal Influenza Vaccine 80.6% 82.5%Are Assessed and Appropriately Given the Pneumococcal Vaccine 80.6% 81.8%
Data Source: CMS Nursing Home Compare quality measure data (MDS 3.0), three-quarter average data as of Q4 2011 and Q4 2012

six-year time period reported, the frequency of medication error citations has decreased (i.e., improved) from 11.8 percent to 8.2 percent. However, nursing centers receiving infection control citations have increased from 20 percent to 40 percent.
Figure 3.1 shows that from 2008 to 2012 the average total number of survey citations in skilled nursing care centers was steadily decreasing. In 2013, the average number of citations increased by 0.3 percent relative
to 2012. It is too early to determine whether this small increase signals a change in the trend. Over the entire reporting period, however, the average number of citations remains lower than in 2008.
The percent of skilled nursing care centers with citations at scope and severity level G or above, with SQC citations or with cita-tions classified as posing immediate jeop-ardy (IJ) to residents has fluctuated over the period from 2008 to 2013. However,
the overall frequency of citations at each of these levels has declined at the national level over this time period (Table 3.3). Furthermore, the percent of skilled nursing care centers that have citation-free stan-dard and complaint surveys has increased from 2008 to 2013, going from 6.4 percent to 7.9 percent (Figure 3.2).
FIVE-STAR RATING The Five-Star Rating System was incorpo-rated into CMS’ Nursing Home Compare web-based consumer information system in 2008. From 2009 to 2013, the proportion of skilled nursing care centers receiving five stars has increased from 11.8 percent to 19.6 percent. At the same time, the propor-tion of skilled nursing care centers receiving one star has decreased from 22.5 percent to 13.5 percent (Figure 3.3).
CUSTOMER SATISFACTIONIn every business, including long term care, the customer is the most important stakeholder. As such, satisfaction is an
TABLE 3.2
Trends in Skilled Nursing Care Center Safety Measures
2008 2009 2010 2011 2012 2013Percent with Medication Error Citation—Tag F332 11.8% 11.1% 10.9% 9.7% 8.5% 8.2%Percent with Unnecessary Drugs Citation—Tag F339 19.4% 20.1% 20.5% 20.1% 20.1% 20.6%Percent with Infection Control Citation—Tag F441 20.0% 20.7% 25.1% 37.2% 39.6% 40.3%
Data Source: CMS CASPER, March of each year
TABLE 3.3
Trends in Skilled Nursing Care Center Citations
2008 2009 2010 2011 2012 2013Percent Cited at Scope and Severity Level G or Above 26.0% 25.2% 22.7% 21.7% 17.5% 17.6%Percent with Standard Health/Complaint SQC Citations 6.7% 7.1% 6.4% 6.1% 5.0% 5.1%Percent with Standard Health/Complaint IJ Citations 5.6% 6.1% 5.3% 5.5% 4.2% 4.4%
Data Source: CMS CASPER, March of each year
Average Number of Standard (Health and Complaint) Survey Citations in Skilled Nursing Care Centers
FIGURE 3.1
2008 2009 2010 2011 2012 2013
10
0
1
2
6
7
8
9
3
4
5
Data Source: CMS CASPER, March of each year
7.8
7.0
8.8 8.88.3
7.3
AHCA Quality ReportTrends in Quality
23

Overall Improvement in Quality
* Changes in Quality Measures reflect only the period 2011 to 2012 because of changes to MDS 3.0 and measure definitions in 2010.
From 2009 to 2013, the proportion of skilled nursing care centers receiving five stars has increased from 11.8 percent to 19.6 percent.
2013
11.8%
19.6%
2009
FROM 2009 TO 2013
IMPR
OVE
MEN
TS IN
QU
ALI
TY
NURSING STAFF• Nursing care hours per
resident day increased by 10%
• Centers receiving a 4 or 5 star rating in the staffing domain increased by 34%
QUALITY MEASURES• Centers show improvement on
16 of 18 quality measures*SURVEY COMPLIANCE• Average number of deficiency
citations per center went down
• Percent of deficiency-free surveys went up

important outcome measure to assess quality in health care. Skilled nursing care centers may use either internal or vendor-created and administered question-naires to assess customer satisfaction. Though the questionnaires differ in their survey methodology, they all generally contain two similarly worded questions: one related to the customer’s willingness to recommend the nursing care center as a
good place to receive care, and another about the customer’s overall satisfaction. Though the wording of these questions is similar in each survey, variation in rating scales (i.e., four-point, five-point, 10-point, etc.) makes comparing data difficult across different surveys.
The following two pages of this report show the results of these two questions reported
separately from three distinct long term care customer satisfaction survey vendors, who agreed to share their data with AHCA for publication in this report: My InnerView (myinnerview.com), Pinnacle Quality Insight (pinnacleqi.com) and abaqis® (providigm.com/solutions/abaqis/). Results are also included from one long term care customer expecta-tion survey by ServiceTrac LIVE (servicetrac.com). For detailed information on the survey methodology utilized by the vendors, please visit their websites.
Overall trends from the four vendors show:
• Overall satisfaction and willingness to recommend the center to a friend are reported as high by all vendors, though rates differ slightly among vendors due to differences in survey methodology.
• Long-stay residents and their families seem to have higher rates of satisfaction and willingness to recommend the center to a friend than those discharged following a short stay.
• For two of the satisfaction vendors with historical data, satisfaction and willing-ness to recommend the center are improving each year, more so for short-stay discharged individuals than current residents, but there does not appear to be any change in rates of family member satisfaction.
• One vendor shows a slight decrease in willingness to recommend to a friend.
Reasons for the slight variations observed among vendors are unknown, but may be related to a combination of factors, such as the survey methodology or the type and number of centers included in the survey. This underscores the need for a standard questionnaire to measure overall satisfac-tion and willingness to recommend a center to a friend.
AHCA Quality ReportTrends in Quality
25
Standard Health/Complaint Survey Citation-Free Skilled Nursing Care Centers
FIGURE 3.2
2008 2009 2010 2011 2012 2013
10%
0%
1%
2%
3%
7%
8%
9%
4%
5%
6%
Data Source: CMS CASPER, March of each year
March 2010March 2009 March 2011 March 2012 March 2013
Trends in Five-Star Overall RatingsFIGURE 3.3
■ 1 Star ■ 2 Star ■ 3 Star ■ 4 Star ■ 5 StarData Source: CMS Nursing Home Compare, Five-Star data
11.8%
23.8%
21.3%
20.6%
22.5%
25.6%
21.4%
20.4%
19.1%
13.5%
27.1%
20.9%
20.3%
16.0%
15.7%
27.2%
21.1%
20.3%
15.3%
16.1%
27.3%
19.9%
19.7%
13.5%
19.6%
6.4 6.26.5
7.1
8.2 7.9
Perc
ent o
f Ski
lled
Nur
sing
Car
e Ce
nter
s w
ith C
itatio
n-Fr
ee
Stan
dard
Hea
lth/C
ompl
aint
Sur
veys
AHCA Quality ReportTrends in Quality
26
My InnerView
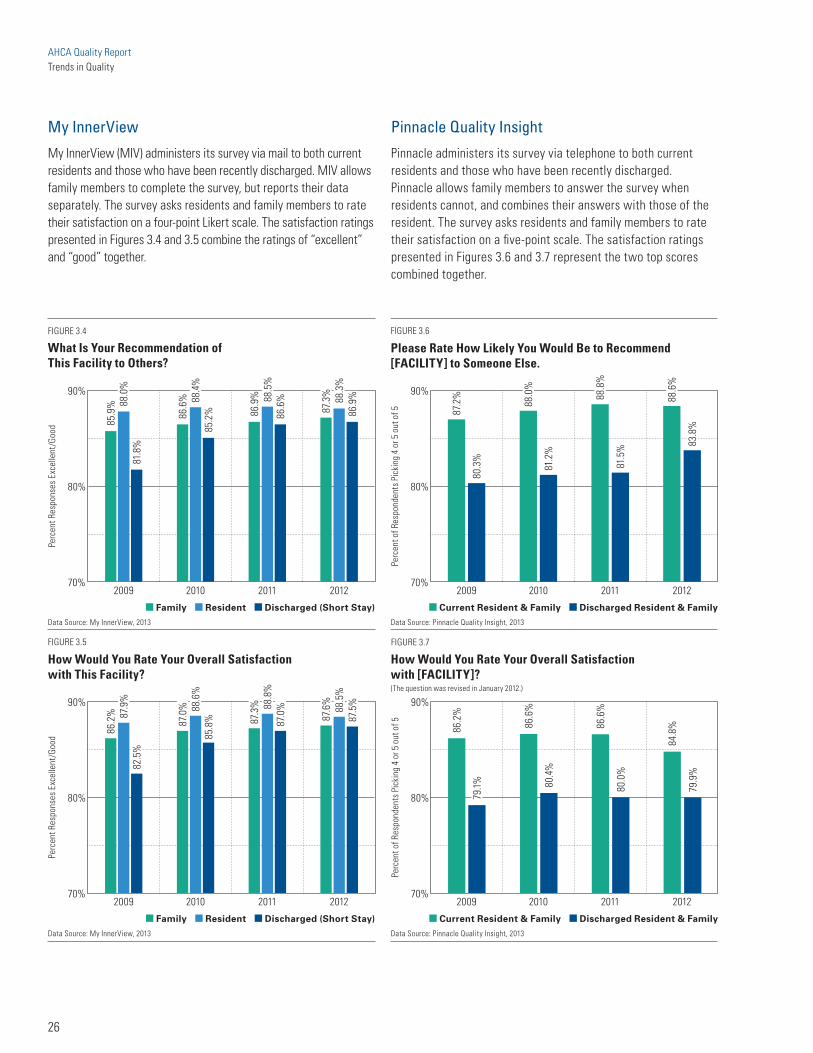
My InnerView (MIV) administers its survey via mail to both current residents and those who have been recently discharged. MIV allows family members to complete the survey, but reports their data separately. The survey asks residents and family members to rate their satisfaction on a four-point Likert scale. The satisfaction ratings presented in Figures 3.4 and 3.5 combine the ratings of “excellent” and “good” together.
Pinnacle Quality Insight
Pinnacle administers its survey via telephone to both current residents and those who have been recently discharged. Pinnacle allows family members to answer the survey when residents cannot, and combines their answers with those of the resident. The survey asks residents and family members to rate their satisfaction on a five-point scale. The satisfaction ratings presented in Figures 3.6 and 3.7 represent the two top scores combined together.
What Is Your Recommendation of This Facility to Others?
Please Rate How Likely You Would Be to Recommend [FACILITY] to Someone Else.
How Would You Rate Your Overall Satisfaction with This Facility?
How Would You Rate Your Overall Satisfaction with [FACILITY]?(The question was revised in January 2012.)
FIGURE 3.4 FIGURE 3.6
FIGURE 3.5 FIGURE 3.7
2009 2009
2009 2009
2010 2010
2010 2010
2011 2011
2011 2011
2012 2012
2012 2012
70% 70%
70% 70%
80% 80%
80% 80%
90% 90%
90% 90%
Perc
ent R
espo
nses
Exc
elle
nt/G
ood
Perc
ent o
f Res
pond
ents
Pic
king
4 o
r 5 o
ut o
f 5
Perc
ent R
espo
nses
Exc
elle
nt/G
ood
Perc
ent o
f Res
pond
ents
Pic
king
4 o
r 5 o
ut o
f 5
Data Source: My InnerView, 2013 Data Source: Pinnacle Quality Insight, 2013
Data Source: My InnerView, 2013 Data Source: Pinnacle Quality Insight, 2013
■ Family ■ Resident ■ Discharged (Short Stay) ■ Current Resident & Family ■ Discharged Resident & Family
■ Family ■ Resident ■ Discharged (Short Stay) ■ Current Resident & Family ■ Discharged Resident & Family
86.2
%87
.2%
80.3
%79
.1%
86.6
%88
.0%
81.2
%80
.4%
80.0
%
79.9
%83
.8%
88.6
%84
.8%
81.5
%
88.8
%86
.6%
85.9
% 88.0
%81
.8%
86.2
% 87.9
%82
.5%
86.6
% 88.4
%85
.2%
87.0
% 88.6
%85
.8%
86.9
% 88.5
%86
.6%
87.3
% 88.8
%87
.0%
88.3
%86
.9%
87.3
%88
.5%
87.5
%
87.6
%

AHCA Quality ReportTrends in Quality
27
ServiceTrac LIVE
ServiceTrac LIVE’s data is published separately in light of its unique approach in measuring the customer experience rather than satis-faction. Using a five-point Likert scale, ServiceTrac measures how well providers are meeting residents’ expectations based on service delivery. ServiceTrac administers the survey via the phone, paper, iPad and email to both current residents and those who have been recently discharged. ServiceTrac allows family members to complete the survey on behalf of residents (Figures 3.10 and 3.11).
abaqis®
abaqis users conduct resident and family interviews and report the responses separately. Center staff show residents a 10-point Likert visual analog scale, with descriptors corresponding to the num-bers, and ask residents to rate their satisfaction and likelihood to recommend the facility. Families use the same ratings, but without the visual scale to allow for interviews over the phone. The rates reported in Figures 3.8 and 3.9 correspond to “very” or “extremely” likely to recommend and “very” or “extremely” satisfied. Results for this survey are available in real time starting in 2012.
Likelihood to Recommend Likelihood to Recommend
Overall Satisfaction Overall Satisfaction
FIGURE 3.8 FIGURE 3.10
FIGURE 3.9 FIGURE 3.11
Long Stay (101+ Days) 2010
Long Stay (101+ Days) 2010
Short Stay (Up to 100 Days) 2011
Short Stay (Up to 100 Days) 2011
2012
2012
70% 70%
70% 20%
80%
80%
80% 40%
30%
90% 95%
90%
85%
75%
90% 60%
50%
Perc
ent V
ery
and
Extr
emel
y
Perc
ent P
roba
bly,
Will
ing
and
Very
Will
ing
Perc
ent V
ery
and
Extr
emel
y
Perc
ent F
ar E
xcee
d/Ex
ceed
/Met
Data Source: abaqis, 2013 Data Source: ServiceTrac LIVE, 2013. Discharge data not available before 2012.
Data Source: abaqis, 2013 Data Source: ServiceTrac LIVE, 2013. Discharge data not available before 2012.
■ Resident Interviews ■ Family Interviews ■ Long-Stay Respondents ■ Discharged Respondents
■ Resident Interviews ■ Family Interviews ■ Long-Stay Respondents ■ Discharged Respondents
46.7% 47.1%
84.2%85.8%
79.5%
92.1%
32.6%
55.1%
77.6%
86.2%
79.6%
86.0%
75.6%
86.9%
77.5%
85.6%

Historically, public and private payers have paid skilled nursing care centers for short- and long-stay residents using fee-for-service (FFS) payment structures based on some measure of the cost of providing those services. This method rewards providers with higher costs and higher volume of ser-vices regardless of the quality of outcomes. Highlighting rising costs of care, health care purchasers have begun to pursue avenues to inculcate more accountability for the processes used to deliver care and, in some instances, the outcomes of that care.
Many researchers and analysts point to financial incentives as the most viable leverage for modifying health care provider behavior. Payment methods intended to foster specific provider behaviors and better outcomes are often referred to as pay-for-performance (P4P) or value-based purchasing (VBP) arrangements.5
Some factors making VBP more viable to implement than in the past are the availability of reliable measures of quality and patient outcomes, an expanded array of evidence- based practices that can be used by providers and offer consistent measurement, and advances in information technology for data collection and subsequent analysis.
Thus, the trend in payment is shifting from a volume-based payment system (e.g., FFS) to one based on outcomes or quality (e.g., VBP). The following section provides an overview of these trends to pay skilled nursing care centers related to state Medicaid VBP arrangements in FFS payment structures, Medicaid and Medicare man-aged care arrangements, and an overview of still nascent ACA-related models, which also include VBP.
STATE VALUE-BASED PURCHASING PROGRAMSIn fiscal year 2011, Medicaid expenditures on nursing care center services were approx-imately $51.8 billion. Medicaid programs cover nearly two-thirds of all long term residents, principally via FFS arrangements. Although Medicaid covers a large propor-tion of days of care for long-stay residents, Medicaid payment levels are typically below Medicare and private payment rates (Med-Pac, 2012). The disparity between Medicaid and other payers varies considerably by state (Eljay, LLC, 2011). In an effort to provide additional resources to skilled nursing care centers and further emphasize quality care for Medicaid-eligible people, several states have explored VBP arrangements.
Currently, little to no federal CMS guid-ance exists on Medicaid VBP. Thus, states have considerable discretion in developing Medicaid payment methods. Over the years, states have experimented with a variety of approaches. Typically, VBP incentive payments are amounts that are added to a center’s base payment rate for achieving certain bench-marks. These approaches have produced highly mixed results. Furthermore, a number of them have been discontinued due to unclear outcomes or state budgetary challenges often related to the national economic downturn.
In recent years, a number of states have developed programs that would pay pro-viders for meeting certain quality bench-marks. However, in some states these programs were either never implemented or implementation was delayed due to budget problems at the state level, or because VBP elements proved difficult to
track, or because the state and nursing care centers believed the measurement elements were not meaningful relative to measuring performance.
Based on a recent survey of AHCA state affiliates, while most states do not appear to collect quality measures, among those that do these measures are tied to payment and tend to focus on structural or process quality measures, such as staffing, survey outcomes and clinical processes, rather than outcome measures. This is consistent with findings from previous surveys AHCA has conduct-ed. In addition, with an increasing number of states looking to expand to Medicaid managed long term services and supports (LTSS), managed care plans will also become an increasingly important player in quality measurement. At this point, quality perfor-mance will likely be an important factor that plans will consider in developing provider networks and will ultimately play an import-ant role in determining which providers they contract with. An additional consideration on the issue of the increasing use of managed care in LTSS is that with multiple plans in the market, a lack of coordination in quality mea-surement and related data collection across plans will make it difficult for Medicaid, as a payer, to assess service outcomes and will increase administrative costs.
Value-Based Purchasing Measurement
Financial incentives in VBP programs are typically based on a variety of measures, including staffing, survey outcomes, resident satisfaction and clinical quality outcomes. Early in VBP program develop-ment, clinical quality measures were less
AHCA Quality ReportTrends in Payment for Quality
TRENDS IN PAYMENT FOR QUALITY
28
5 State-based efforts are typically referred to as P4P programs, while Medicare and health plan efforts are generally called VBP strategies. For purposes of this document, we use VBP only.

Linking Provider Payments to Quality Outcomes
The trend in payment is shifting from a volume-based payment system to one based on outcomes or quality.
QUALITY METRICS

common. However, as measurements and data collection methods have evolved, use of clinical quality measures has become more common. Less common metrics include occupancy, efficiency, Medicaid utilization and implementation of “culture change.”6 Within these domains, how-ever, specific metrics vary. For example, Vermont’s staffing measure is based on retention, while some other states focus on staffing ratios.
Tying Measurement to Incentive Payments
Most states use a VBP approach in which points are scored for meeting established benchmarks. Approaches to this include scoring each skilled nursing care center either based on its ranking compared to other nursing centers in the state or based on whether it has achieved center-specific target levels for performance. Points across the measures are then summed and trans-lated into a per diem add-on for Medicaid resident days. Add-on calculations vary from a fixed dollar amount to a percentage
of a center’s specific rate. For example, Indiana recently updated the way it pays for quality through the implementation of a VBP on July 1, 2013.7 Under this program, the state will pay nursing care centers an add-on rate based on a report card score using survey finding measures (75 percent) and staffing measures (25 percent), includ-ing nursing hours per resident day and staff retention and turnover.
More recent approaches to Medicaid VBP focus on embedding the incentive payment in the per diem rate, rather than structur-ing it as an add-on to the per diem. For example, Ohio has increased the proportion of facility payments that are tied to quality measures, which impacts the potentially achievable per diem. Skilled nursing care centers that meet targets on at least five of 20 measures are “rewarded” by not having their Medicaid per diem rate reduced. Nearly 10 percent of the rate is dependent on performance on the quality measures.
Research has raised some concerns about current VBP arrangements (Briesacher et
al., 2009). Specifically, researchers question whether the size of incentive payments is sufficient to stimulate change by provid-ers. Additionally, VBP arrangements that compare a center to its peers by definition limit the potential for centers to receive incentive payments to a certain proportion of the market. This creates unattainable targets for low-ranking centers, even if they have made measurable improvements in quality or achieved accepted targets. There-fore, lower-performing centers have less of an opportunity to receive a quality-related payment and, thus, have little incentive to invest resources in improving. This defeats the purpose of using financial incentives to improve quality, when centers that need to improve the most do not benefit from the VBP program. Other critics question whether the metrics used in VBP programs capture what matters most to consumers and/or key factors that drive costs.
MANAGED CARE Both Medicare and Medicaid managed care are rapidly replacing traditional FFS arrangements as the dominant payment and service delivery systems. Until recently, however, nursing care center services were typically excluded from Medicaid managed care arrangements, such as in New York state’s pilot program. In other states, such as Minnesota and Texas, pro-grams were structured such that nursing care center services were only included for what roughly equated to a post-acute care stay. However, in recent years, a handful of states have significantly expanded Med-icaid managed care, including managed care for non-traditional populations (e.g., older adults and persons with disabilities) and non-traditional managed care services, specifically long term care. The states of Hawaii, New Mexico and Tennessee include the full array of long term care in their Medicaid managed care arrange-ments, including long-stay center services.
AHCA Quality ReportTrends in Payment for Quality
Medicaid Managed Long Term Care Expansion
■ Existing in 2012
■ Projected by 2014
■ Existing & Projected Expansion
Data Source: Saucier, P., et al. The Growth of Managed Long-Term Services and Supports (MLTSS) Programs: A 2012 Update (July 2012). Additions based on AHCA research.
FIGURE 4.1
30
6 In broad terms, the “culture change” movement focuses on making a variety of physical and operational changes in centers with the desired outcome of providing person-centered care and creating a more home-like environment.7 The state plan amendment for this new methodology is currently under review with CMS, but is expected to be approved and applied retroactively to July 1, 2013.

AHCA Quality ReportTrends in Payment for Quality
31
Arizona has the most experience to date with Medicaid managed care, as well as the inclusion of long-stay center services in managed long term care.
However, many states with existing pro-grams are aggressively pursuing managed long term care expansions, while other states are developing new managed long term care programs. In 2011, 11 states were operating some form of Medicaid managed long term care either statewide or region-ally. By 2014, approximately 27 states will have some form of Medicaid managed long term care. See Figure 4.1 for an overview.
The degree to which skilled nursing care centers are included in state Medicaid managed care programs is likely to continue to vary. However, the majority of states are now interested in including long-stay nursing center care in their managed care programs.
As mentioned above, in states with man-aged long term care, quality is likely to be a determining factor for plans in consider-ing which providers to include in their net-works. While this is a common approach for physician groups and other providers, this will be difficult for Medicaid managed long term care since nearly two-thirds of all residents in nursing care centers are covered by Medicaid. There are not enough facilities or beds to absorb all Medicaid beneficiaries needing long term care if all centers are not enrolled in managed care networks. In addition, Medicaid currently pays nursing care centers in many states at rates that are less than the actual costs of providing care. Thus, limiting networks will have the effect of increasing Medicaid census in network facilities. Research has shown high Medicaid census to be associated with poorer quality and facility closures (Grabowski et al., 2004; Mor et al., 2011; Castle et al., 2009). What also remains unclear is precisely how plans will choose to measure quality, and whether there will be consistency in quality mea-surement across plans.
Long-Stay Payment in Medicaid Managed Care
States typically use one of two methods of payment in managed care. First, states may require plans to use FFS state-set provider rates for some or all providers who choose to contract with a plan and participate in its provider network. Second, states may allow plans to negotiate FFS rates for some or all provider types.
In the first arrangement, states may build quality incentive payments into state-set rates, following federal guidelines for incorporating such payments into capitation rates. In states that allow negotiated rates, plans may develop their own provider incen-tive payment arrangements as long as such requirements align with state plan perfor-mance standards and provider payment rate requirements. In one example of the second approach, states can establish plan perfor-mance requirements that make it necessary for plans to develop performance incentive arrangements for contracted providers. Plan-determined measures roughly mirror state VBP arrangements but typically are more focused on clinical measures than FFS programs. States vary in how they require the incorporation of VBP for centers by managed care plans and leave the decision up to the managed care companies. Little research has been conducted to date on Medicaid managed long term care VBP arrangements. Other payment incentive ar-rangements include shared risk and shared savings agreements.8
Medicare Advantage Plans
The Medicare Modernization Act of 2003 established the Medicare Advantage (MA) program, as it is known today. With MA, beneficiaries have the option to receive their Medicare benefits through private insurance plans. Enrollment in these plans is voluntary. While MA plans are required to offer coverage that meets or exceeds the standards set by the original Medicare
program, they do not have to cover every benefit in the same way. For example, if a plan chooses to pay less than Medicare for some benefits, such as care at a skilled nursing care center, the savings may be passed along to consumers by offering lower copayments for doctor visits.
In terms of hospital readmissions, MA plans have strong incentives to enroll hospital providers with low readmission rates. Additionally, plans develop clinical guide-lines and prior authorizations processes intended to guide enrollees to the most appropriate setting. In turn, MA plans may offer incentive payments to providers. Specifically, MA typically offers VBP arrangements that reward certain clinical outcomes, reduced lengths of stay and reduced hospitalizations.
AFFORDABLE CARE ACTThe ACA established three national efforts with implications for quality incentive payments. These are accountable care organizations (ACOs), bundled payments and Medicare-Medicaid integration efforts. All three of these initiatives are still unfolding, with many details on how or whether quality incentives for centers may be included still to be determined.
Delivery System and Payment Reform Models
As noted previously, the traditional FFS system is slowly being replaced by systems that seek to reward better outcomes and value rather than merely reward the volume of services provided. While such strate-gies have been underway for many years in traditional managed care, the ACA has expanded these models more widely within the Medicare program. Two popular models being tested and implemented across the health care system are bundled payments and ACOs. CMS is testing various bundled payment models in both acute and post-
8 Plans are paid a capped amount per beneficiary and typically are expected to manage on average the costs of all enrollee needs to the capitation amount. Depending upon the state program, plans may be at varying degrees of risk for going over the capitation amounts (e.g., they must make up the difference) or they may accrue profits by keeping spending below the total capitation amount. In turn, plans may develop similar risk and shared savings arrangements with the providers.

acute care settings through its Bundled Payments for Care Improvement (BPCI) demonstration, and in 2011, CMS published the Medicare Shared Savings Program (MSSP) final rule outlining how a Medicare ACO will function. Both programs seek to facilitate and encourage coordinated and integrated care and to reward providers that simultaneously improve quality and lower costs.
Bundled Payments and the BPCI Demonstration
Bundled payments seek to incentivize improved patient care by fostering coordi-nation among providers during a defined episode of patient care. To test the efficacy of bundled payments, CMS launched its BPCI demonstration project, which will test four distinct models of bundled payments. More than 450 health care organizations have applied to participate in the demonstration, including many post-acute care providers.
Within each of the four models, providers were able to choose from a list of 48 defined episodes that they want to test.
Applicants have some flexibility in refining service delivery models to treat patients within those episodes. The test models that are most applicable to post-acute care providers are Model 2 (acute plus post-acute services) and Model 3 (post-acute services only).9
Participants in the BPCI demonstration must include in their applications a descrip-tion of how they will address quality and efficiency. Incentive payments may be paid to participants based on achieving savings and quality targets. To date, all applicant organizations are still in phase one of the BPCI demonstration (planning phase), and no contracts have been signed yet between provider organizations and CMS.
Accountable Care Organizations
ACOs are groups of providers that come together to coordinate and manage the care of a defined patient population. Medicare ACOs manage a population of Medicare patients within a given health care market. They are governed by the MSSP rule and must follow specific guidelines and
regulations in order to participate. Participa-tion in an ACO is voluntary.
The MSSP allows providers who voluntarily agree to coordinate care and who meet cer-tain quality standards to share in any sav-ings they achieve for the Medicare program. ACOs that elect to also share the risk for potential losses to the Medicare program have the opportunity share in a greater proportion of potential savings. In terms of measurement, ACOs will coordinate and integrate Medicare services across roughly 30 quality measures organized in four domains. These domains include patient experience, care coordination, patient safety, and preventive health and services tailored to at-risk populations.
The MSSP ACOs are still young and are adapting to a new model for delivering care. As a result, many have not yet fully integrated their post-acute care provider partners into their ACO model. Instead, ACOs are typically now evaluating and identifying their post-acute care networks. While no national set of quality outcome measures for post-acute providers has been established for ACOs, they are primarily looking at indicators such as hospital readmission rates and average lengths of stay as network inclusion criteria. The five Massachusetts Pioneer ACOs have collaborated to develop a set of quality measures for skilled nursing care centers, but have not yet indicated if these measures will be used to determine network inclusion.
Within Medicaid and the state Children’s Health Insurance Program, an increas-ing number of states are moving toward accountable care (Figure 4.2). While in some states these initiatives do not currently include LTSS, other states either currently do or are planning to expand to include these services in the future. For an example of one state’s approach in development, see Box 4.1.
Medicare-Medicaid Integration
The ACA also established two new entities within CMS: the Medicare-Medicaid
AHCA Quality ReportTrends in Payment for Quality
32
State Accountable Care Activity
■ ACO Activity
■ No ACO Activity
Data Source: http://www.nashp.org/state-accountable-care-activity-map, accessed on June 25, 2013.
FIGURE 4.2
9 More information can be found at http://innovation.cms.gov/initiatives/Bundled-Payments/.

Coordination Office (MMCO) and the Center for Medicare and Medicaid Innovation (CMMI). In terms of functionality, MMCO is charged with fostering the development of financial and organizational efforts to integrate Medicare and Medicaid services for people who are eligible for both pro-grams. CMMI has broad authority for testing an array of payment and service delivery models that may improve quality of care and produce efficiency. Specifically, CMMI has broad new waiver authority for Medicare and Medicaid as well as a substantial appropria-tion to test innovative concepts.
Currently, 20 states are working with MMCO on various types of Medicare-Medicaid integration initiatives. The vast majority (14) of those states engaged are pursuing capitated, risk-based approaches that will use health plans to integrate Medicare and Medicaid benefits and financing. The plans will receive varying degrees of Medicare and Medicaid integrated capitation payments and will then be responsible for making all provider pay-ments for services delivered to people dually eligible for Medicare and Medicaid.
Details on how CMS and the states will structure blended payments to the plans are still being determined. It appears likely that plans will use existing quality incentive payment models currently in use in Medicaid and Medicare managed care.
Regarding quality measurement, plans will have to submit data to both states and CMS on various core quality measures, including some that are specific to nursing center care. These core measures may include pressure ulcer prevalence, people with mobility impairment, transitioning from a facility back into the community and having a patient-centered medical home.
OUTLOOKMedicare and Medicaid budgetary pres-sure will continue to drive policymakers and skilled nursing care professionals to explore payment methodologies that offer the promise of greater accountability and transparency. In addition to budget pressure, three additional factors will foster
continued interest in linking payments with quality performance and outcomes.
First, the profession and many federal and state officials increasingly recognize that regulatory and enforcement strategies in isolation are not effective in ensuring or fostering quality. Second, traditional FFS Medicare and Medicaid reward volume and minimal levels of compliance with standards, without regard for quality. Third, current payment models support prac-tices that undermine quality efforts (e.g., Medicare and Medicaid payments do not support preventing hospitalization of skilled nursing care center residents). Public payers are increasingly recognizing that they have a responsibility to ensure public funds are spent on quality services.
While the precise form of future VBP arrange-ments remains somewhat unclear, it is certain that the overall direction for purchasers and the field will be to continue to move away from unmeasured performance with FFS pay-ment and toward a new paradigm of payment driven by performance measurement.
AHCA Quality ReportTrends in Payment for Quality
33
Accountable Care in Colorado
Under Colorado’s Accountable Care Collaborative (ACC) Program, the state contracts with a Regional Care Collaborative Organization (RCCO) in each of the state’s seven regions to create a network of Primary Care Medical Providers (PCMPs). Medicaid provides the regional organizations with support for care management and administration, and the RCCO provides care coordination for Medicaid enrollees to try to better integrate their care with hospitals, specialists and social services. RCCOs and Medicaid contract with the PCMPs to provide comprehensive primary care and coordinate enrollees’ health needs across specialties. Medicaid also contracts with a Statewide Data and Analytics Contractor to analyze performance data for the program.
Enrollment began in May 2011, and as of December 2012, about 30 percent of the Medicaid population was participating. The state hopes to achieve 5 percent reductions in emergency department
utilization, hospital readmissions and high-cost imaging and to achieve overall savings to offset the $20 per-member per-month fee it is currently investing. Incentive payments to the PCMPs and RCCOs will begin in 2013, and the state plans to slowly increase the portion of payment at risk, as well as pilot payment alternatives to FFS contracts. Under a new State Innovation Models Initiative grant, Colorado will plan incentives that promote integration of behavioral and clinical care.
The state is also considering how to integrate behavioral health and long term care programs with physical health care. As part of this effort, RCCOs are already working with regional behavioral health organizations, and the state has enacted legislation that will enable long term care providers to serve as health homes. In addition, the state has proposed that the ACC program be the vehicle to integrate care for those dually eligible for Medicare and Medicaid starting in 2013.
Data Source: Commonwealth Fund, http://www.commonwealthfund.org/~/media/Files/Publications/Case%20Study/2013/Mar/1666_Rodin_Medicaid_Colorado_case_study_FINAL_v2.pdf
BOX 4.1

AHCA Quality Report
REFERENCES
(n.d.). Retrieved from http://pinnacleqi.com/
(n.d.). Retrieved from http://www.myinnerview.com/index.php
(n.d.). Retrieved from http://www.providigm.com/solutions/customer-satisfaction/
(n.d.). Retrieved from http://www.servicetrac.com/company/news/
Abt Associates (2013). Nursing Home Compare five-star quality rating system: Year three report. Retrieved from http://www.cms.gov/ Medicare/Provider-Enrollment-and-Certification/CertificationandComplianc/Downloads/FSQRS-Report.pdf
Advancing excellence in America’s nursing homes campaign. (2011). Retrieved from http://www.nhqualitycampaign.org/
American Health Care Association (2013). 2011 staffing survey report. Retrieved from http://www.ahcancal.org/research_data/staffing/ Documents/2011 Staffing Survey Report.pdf
Ballard, C.G., Waite, J., & Birks, J. (2006). Atypical antipsychotics and psychosis in Alzheimer’s disease. Cochrane Database of Systematic Reviews. Retrieved from http://onlinelibrary.wiley.com/doi/10.1002/14651858.CD003476.pub2/full
Briesacher, B. A., Field, T. S., Baril, J., & Gurwitz, J. H. (2009). Pay-for-performance in nursing homes. Health Care Finance Review, 30(3), 1–13.
Castle, N. G., & Anderson, R. A. (2011). Caregiver staffing in nursing homes and their influence on quality. Medical Care, 49(6), 545–552.
Castle, N.G., Engberg, J., Lave, J., Fisher, A. (2009) Factors associated with increasing nursing home closures. Health Services Research. June 44(3): 1088–109.
Centers for Medicare & Medicaid Services, (2013). Medicare 2013 costs at a glance. Retrieved from http://www.medicare.gov/your- medicare-costs/costs-at-a-glance/costs-at-glance.html
Eljay, LLC. (2011). A report on shortfalls in Medicaid funding for nursing center care. Retrieved from http://www.ahcancal.org/research_data/funding/Documents/2011%20Report%20on%20Shortfalls%20in%20Medicaid%20Funding%20for%20Nursing%20Home%20Care.pdf
Eljay, LLC. (2012). A report on shortfalls in Medicaid funding for nursing center care. Retrieved from http://www.ahcancal.org/research_data/funding/Documents/FINAL Medicaid Underfunding for Nursing Home Care Report.pdf
Grabowski, D.C., Angelelli, J.J., Mor, V. (2004) Medicaid payment and risk-adjusted nursing home quality measures. Health Affairs, Sept–Oct 23(5): 243–52.
Hyer, K., Thomas, K. S., Branch, L. G., Harman, J. S., Johnson, C. E., & Weeck-Maldonado, R. (2011). The influence of nursing staffing levels on quality of care in nursing homes. The Gerontologist, Retrieved from http://gerontologist.oxfordjournals.org/content/ early/2011/05/20/geront.gnr050.abstract
34

AHCA Quality ReportReferences
Jones AL, Dwyer LL, Bercovitz AR, Strahan GW. (2009). The National Nursing Home Survey: 2004 overview. National Center for Health Statistics. Vital Health Stat 13(167).
Kaldy, J. (2013, June). QAPI: Weaving the old with the new. Provider, 39(6), 24–36. Retrieved from http://www.providermagazine.com/ archives/2013_Archives/Pages/0613/QAPI-Weaving-The-Old-With-The-New.aspx
Laderman, M., Loehrer, S., & McCarthy, D. The effect of Medicare readmissions penalties on hospitals’ efforts to reduce readmissions: Perspectives from the field. The Commonwealth Fund Blog, February 2013.
Maher, A.R., Maglione, M., Bagley, S., Suttorp, M., Hu, J., Ewing, B., …Shekelle, P.G. (2011). Efficacy and comparative effectiveness of atypical antipsychotic medications for off-label uses in adults. JAMA, 306, 1359–1369.
Medicare Payment Advisory Commission. (2012). Report to The Congress: Medicare payment policy. Washington, DC: MedPAC.
Medicare Payment Advisory Commission. (2013). Report to The Congress: Medicare payment policy. Washington, DC: MedPAC.
MetLife Market Institute. (2012, November). Market survey of long-term care costs the 2012 MetLife market survey of nursing home, assisted living, adult day services, and home care costs. Retrieved from https://www.metlife.com/assets/cao/mmi/publications/studies/2012/studies/mmi-2012-market-survey-long-term-care-costs.pdf
Mor, V., Grunier, A., Feng, A., Grabowski, D.C., Intrator, O., Zinn, J. (2011) The effect of state policies on nursing home resident outcomes. Journal of the American Geriatrics Society, Jan 59(1): 3–9.
Mor, V., Intrator, O., Feng, Z., & Grabowski, D.C. (2010). The revolving door of rehospitalization from skilled nursing facilities. Health Affairs, 29, 57–64.
Rodin, D. & Silow-Carroll, S. (2013). Medicaid payment and delivery reform in Colorado: ACOs at the regional level. The Commonwealth Fund, Retrieved from http://www.commonwealthfund.org/~/media/Files/Publications/Case Study/2013/Mar/1666_Rodin_ Medicaid_Colorado_case_study_FINAL_v2.pdf
Saucier, P., et al. The Growth of Managed Long-Term Services and Supports (MLTSS) Programs: A 2012 Update (July 2012). Additions based on AHCA research.
U.S. Bureau of the Census. (2013). State & county quickfacts USA. Retrieved from http://quickfacts.census.gov/qfd/states/00000.html
U.S. Department of Labor, Bureau of Labor Statistics. (2012). National Industry-Specific Occupational Employment Estimates. Retrieved from http://www.bls.gov/oes/current/oessrci.htm
35

AHCA Quality Report
DATA SOURCE DESCRIPTIONS
36
Minimum Data Set (MDS) 3.0: The MDS is a comprehensive, standardized assessment instrument completed by the nurs-ing center staff for every resident on admission and at regular intervals during each person’s stay. The assessment includes the resident’s physical, cognitive, emotional and clinical conditions and abilities; care needs; preferences; and life care choices. Nursing center staff use the assessment to develop a plan of care for each resident. Information collected using the MDS assessment is also used to determine payment rates for all Medicare stays and in many state Medicaid programs. The data are also used to generate quality measures. The data collected using the MDS is housed in a national database.
CMS Nursing Home Compare (Five-Star Rating): The overall Five-Star rating includes the following domains: (1) health inspec-tions, (2) direct care staffing and (3) MDS-based quality measures. The ratings are updated on a monthly basis with any new data generated as a result of recent annual, complaint and revisit health inspections, and on a quarterly basis with new quality measure data.
Health Inspections Domain: A health inspection score is calculated based on points assigned to deficiencies identified during a nursing center’s most recent and two prior annual health inspections, referred to as surveys, as well as any deficiency findings resulting from surveys conducted based on complaints over the most recent three years and during revisit surveys, conducted to verify resolution of previously identified deficiencies. More weight is placed on recent inspections in calculating a rating.
Staffing Domain: The staffing domain is based on two mea-sures: (1) registered nurse hours per resident day and (2) total staffing hours per resident day. Total staffing hours include registered nurses, licensed practical nurses/licensed vocational nurses and certified nursing assistants. The rating is adjusted to account for the acuity of residents being served in the center. The data for this domain are derived from a report centers are required to complete and submit to state surveyors at the time of their annual health inspection.
Quality Measure Domain: The quality measure domain is based on nine of the 18 quality measures that are currently on the
Nursing Home Compare website, which can be found at www.medicare.gov. These include seven measures specific to long-stay residents and two specific to short-stay residents. Quality measure data are updated quarterly in January, April, July and October. The nursing home quality measures are calculated using the MDS resident assessment data that nursing homes routinely collect about residents at specified intervals during their stay (see above description of MDS 3.0). These measures capture specific care processes and clinical outcomes.
AHCA Annual Staffing Survey: The Nursing Facility Staffing Survey is conducted annually by AHCA to collect retention and turnover information for all nursing center employees, including administrative and management, nursing, therapy, food services, housekeeping and maintenance, and social services and activities staff. All federally certified nursing homes in the nation are invited to participate in this survey, regardless of AHCA membership.
CMS Certification and Survey Provider Enhanced Reporting (CASPER): This database includes information on resident census, staffing, health and life safety deficiency citations, as well as com-plaint investigations for all Medicare- and Medicaid-certified nursing centers in the nation. Onsite inspections, referred to as standard surveys, are conducted by state agencies and are required by federal law for each nursing center every 12 to 15 months.
PointRight OnPoint-30™: PointRight’s risk-adjusted measure of 30-day, all cause reshopitalizations from skilled nursing facilities is calculated using data from MDS 3.0 assessments over a 12-month period. The rehospitalization measure was developed by PointRight and has been provided to AHCA for our use and for distribution to members. Admission assessments are used to generate the denominator (admissions from acute care hospitals) and 33 variables used in risk adjustment, while discharge assessments are used to determine the numerator (returns to the hospital).
Medicare Part A Claims: The skilled nursing facility (SNF) file contains final action, fee-for-service claims data submitted by SNF providers. The file includes diagnosis and procedure codes, dates of service, reimbursement amounts, SNF provider numbers and beneficiary demographic information. These data are updated on an annual basis.

AHCA Quality Report
APPENDIXTABLE A.1
Characteristics of Individuals Receiving Services in Skilled Nursing Care Centers
Medicare Admissions N=2,452,848
Non-Medicare Admissions
N=798,513
Long-Stay Residents (>12 Months) N= 850,906
Age 78.8% 74.4% 79.8%
Age CategoryUnder 65 10.6% 26.3% 15.0%Age 65–84 53.7% 43.1% 39.1%85 and Older 35.8% 30.6% 45.9%
GenderMale 37.7% 39.6% 30.6%Female 62.3% 60.4% 69.4%
Race/EthnicityAmerican Indian 0.0% 0.0% 0.0%Asian 2.7% 3.4% 2.1%Black 10.0% 13.1% 14.7%Hispanic 3.8% 6.2% 4.9%White 82.1% 75.2% 76.4%Native Hawaiian or Pacific Islander 0.2% 0.4% 0.1%Unknown 1.1% 1.8% 1.6%
Common Active DiagnosesAnemia 31.0% 26.1% 29.8%Arteriosclerotic Heart Disease 17.9% 21.5% 17.9%Congestive Heart Failure 22.8% 17.1% 19.5%COPD 25.2% 21.5% 19.9%Depression 32.3% 33.4% 53.9%Diabetes 34.4% 33.3% 32.6%Hip Fracture 7.1% 5.0% 0.9%Hypertension 75.4% 71.2% 72.9%Osteoporosis 44.9% 11.1% 17.9%Stroke 12.4% 12.7% 18.2%
Special Treatment and ServicesBrain Injury 0.1% 0.9% 1.4%Hospice 0.4% 5.9% 3.0%IV Medication 9.1% 7.7% 0.8%Parenteral/IV Nutrition 0.6% 0.4% 0.1%Respite 0.0% 0.9% 0.0%Ventilator/Respirator 0.4% 0.7% 0.5%
Data Source: CMS MDS 3.0, 2012 data reported
37

AHCA Quality ReportAppendix
38
TABLE A.2
National Long Term Care Community
State
Ownership
Total Beds Total Beds Average Number of Beds Certified FacilitiesNumber Percent
Facilities For-ProfitNot-for-
Profit Government For-ProfitNot-for-
Profit GovernmentTotal # Beds
Medicare Only
Medicaid Only
Medicare/Medicaid
Non- Certified (Other)*
Avg # Beds
Medicare Only
Medicaid Only
Medicare/Medicaid
Non-Certified (Other)* Medicare Medicaid
Medicare/Medicaid
(Dual Certified)
US 15,681 10,839 3,930 912 69.1% 25.1% 5.8% 1,702,661 97,870 81,447 1,489,088 34,256 108.6 6.3 5.3 95.1 4.8 5.0% 3.4% 91.6%AK 17 1 9 7 5.9% 52.9% 41.2% 775 108 0 664 3 45.6 6.4 0 39.1 0.2 0.0% 0.0% 100.0%AL 228 183 29 16 80.3% 12.7% 7.0% 26,685 436 259 25,982 8 117 1.9 1.1 114 1.2 3.9% 0.9% 95.2%AR 231 190 31 10 82.3% 13.4% 4.3% 24,501 426 1,263 22,685 127 106.1 1.9 5.5 98.2 2.3 3.0% 3.0% 93.9%AZ 146 117 27 2 80.1% 18.5% 1.4% 16,659 1,970 635 13,884 170 114.1 13.6 4.4 95.8 4.7 19.9% 0.0% 80.1%CA 1,230 1,011 181 38 82.2% 14.7% 3.1% 121,831 4,154 6,719 109,904 1,054 99 3.4 5.5 89.4 3.3 5.4% 4.6% 90.0%CO 215 158 39 18 73.5% 18.1% 8.4% 20,406 2,022 1,936 16,430 18 94.9 9.4 9 76.4 5.3 10.7% 6.5% 82.8%CT 231 184 44 3 79.7% 19.0% 1.3% 27,837 570 16 27,247 4 120.5 2.5 0.1 118 0.1 4.8% 0.0% 95.2%DC 19 9 10 — 47.4% 52.6% 0.0% 2,766 33 40 2,633 60 145.6 1.7 2.1 138.6 3.2 0.0% 5.3% 94.7%DE 46 27 15 4 58.7% 32.6% 8.7% 4,943 276 432 4,235 0 107.5 6 9.4 92.1 8.6 6.5% 10.9% 82.6%FL 684 492 178 14 71.9% 26.0% 2.0% 82,981 7,383 986 74,258 354 121.3 11.1 1.5 108.6 1.4 4.1% 0.4% 95.5%GA 360 234 106 20 65.0% 29.4% 5.6% 39,996 701 1,732 37,563 0 111.1 1.9 4.8 104.3 2.3 3.6% 1.1% 95.3%HI 48 24 14 10 50.0% 29.2% 20.8% 4,260 119 55 3,976 110 88.8 2.5 1.1 82.8 3.4 2.1% 2.1% 95.8%IA 444 245 179 20 55.2% 40.3% 4.5% 34,918 566 2,441 28,264 3,647 78.6 1.3 5.5 63.7 10.2 2.3% 5.4% 92.3%ID 76 53 10 13 69.7% 13.2% 17.1% 5,887 165 5 5,717 0 77.5 2.2 0.1 75.2 0 6.6% 0.0% 93.4%IL 773 551 193 29 71.3% 25.0% 3.8% 99,652 10,900 22,437 60,815 5,500 128.9 14.2 29.2 78.7 20.4 5.8% 8.7% 85.5%IN 516 280 140 96 54.3% 27.1% 18.6% 59,466 7,099 1,689 41,525 9,153 115.2 14 3.5 80.8 19.4 5.0% 2.7% 92.2%KS 345 179 126 40 51.9% 36.5% 11.6% 25,836 669 3,172 19,044 2,951 74.9 2 9.2 55.2 13.2 3.5% 18.6% 78.0%KY 285 208 71 6 73.0% 24.9% 2.1% 26,107 2,096 253 23,628 130 91.6 7.4 0.9 82.9 1 6.7% 0.0% 93.3%LA 280 224 43 13 80.0% 15.4% 4.6% 35,678 2,597 0 32,162 919 127.4 9.6 0 115.7 3.3 7.5% 0.0% 92.5%MA 422 299 118 5 70.9% 28.0% 1.2% 48,597 831 1,059 45,972 735 115.2 2 2.5 108.9 3.4 3.3% 1.4% 95.3%MD 230 161 63 6 70.0% 27.4% 2.6% 28,496 978 227 26,993 298 123.9 4.3 1 117.4 1.6 4.3% 1.7% 93.9%ME 107 74 32 1 69.2% 29.9% 0.9% 7,006 140 277 6,589 0 65.5 1.3 2.6 61.6 2.6 0.9% 0.0% 99.1%MI 427 292 97 38 68.6% 22.5% 8.9% 46,741 3,862 921 41,825 133 109.5 9.2 2.2 98 1.2 4.0% 2.1% 93.9%MN 381 113 233 35 29.7% 61.2% 9.2% 30,555 486 990 28,977 102 80.2 1.5 3.1 76.5 1 2.1% 2.6% 95.3%MO 513 383 98 32 74.7% 19.1% 6.2% 55,108 2,875 5,107 44,728 2,398 107.4 5.7 10.1 87.4 9.3 1.9% 4.5% 93.6%MS 204 156 20 28 76.5% 9.8% 13.7% 18,426 411 2,326 15,683 6 90.3 2 11.6 76.9 5.2 3.9% 13.2% 82.8%MT 85 37 34 14 43.5% 40.0% 16.5% 6,823 36 112 6,675 0 80.3 0.4 1.3 78.5 0.1 3.5% 1.2% 95.3%NC 421 322 89 10 76.5% 21.1% 2.4% 44,363 770 549 42,459 585 105.4 1.8 1.3 100.9 2.3 3.8% 0.5% 95.7%ND 83 3 78 2 3.6% 94.0% 2.4% 6,299 37 0 6,258 4 75.9 0.4 0 75.4 0 2.4% 0.0% 97.6%NE 218 107 62 49 49.1% 28.4% 22.5% 15,942 930 1,299 13,468 245 73.1 4.3 6 61.8 3.9 0.5% 10.1% 89.4%NH 76 41 23 12 53.9% 30.3% 15.8% 7,564 195 420 6,949 0 99.5 2.6 5.5 91.4 4.9 2.6% 5.3% 92.1%NJ 366 259 88 19 70.8% 24.0% 5.2% 52,227 2,767 633 48,719 108 142.7 7.6 1.7 133.1 1.5 8.7% 0.0% 91.3%NM 72 52 15 5 72.2% 20.8% 6.9% 6,894 121 113 6,660 0 95.8 1.8 1.7 92.5 0.5 5.6% 2.8% 91.7%NV 51 38 7 6 74.5% 13.7% 11.8% 5,992 137 323 5,491 41 117.5 2.7 6.5 107.7 7.1 5.9% 3.9% 90.2%NY 632 336 252 44 53.2% 39.9% 7.0% 117,042 163 234 116,476 169 185.2 0.3 0.4 184.3 0.6 0.9% 0.3% 98.7%OH 954 745 188 21 78.1% 19.7% 2.2% 91,696 1,035 0 90,657 4 96.1 1.1 0 95 0 2.7% 0.0% 97.3%OK 310 264 38 8 85.2% 12.3% 2.6% 29,163 1,260 1,512 26,097 294 94.1 4.1 4.9 84.2 3.7 4.5% 5.8% 89.7%OR 139 113 21 5 81.3% 15.1% 3.6% 12,298 460 1,482 10,300 56 88.5 3.3 10.7 74.1 7.8 5.0% 11.5% 83.5%PA 707 364 307 36 51.5% 43.4% 5.1% 88,547 4,120 3,303 81,100 24 125.2 5.8 4.7 115 2.3 11.3% 1.0% 87.7%RI 84 68 16 — 81.0% 19.0% 0.0% 8,715 148 162 8,389 16 103.8 1.8 1.9 99.9 0.2 1.2% 0.0% 98.8%SC 189 143 34 12 75.7% 18.0% 6.3% 19,636 2,108 374 16,852 302 103.9 11.7 2.1 89.6 3.6 18.0% 0.0% 82.0%SD 112 39 67 6 34.8% 59.8% 5.4% 6,955 44 691 6,220 0 62.1 0.4 6.2 55.5 3.1 0.9% 13.4% 85.7%TN 320 247 57 16 77.2% 17.8% 5.0% 37,104 1,489 5,453 29,739 423 116 4.7 17 92.9 12.8 8.8% 4.1% 87.2%TX 1,202 1,041 129 32 86.6% 10.7% 2.7% 134,624 26,022 3,508 101,355 3,739 112 21.9 3.3 84.6 4 6.0% 2.9% 91.1%UT 98 79 14 5 80.6% 14.3% 5.1% 8,467 905 339 7,223 0 86.4 9.3 3.5 74.5 2.4 17.3% 7.1% 75.5%VA 285 193 81 11 67.7% 28.4% 3.9% 32,390 1,588 2,020 28,550 232 113.6 5.6 7.1 100.2 4.1 4.2% 5.6% 90.2%VT 38 25 12 1 65.8% 31.6% 2.6% 3,199 141 0 3,058 0 84.2 3.7 0 80.5 0 2.6% 0.0% 97.4%WA 226 171 41 14 75.7% 18.1% 6.2% 21,757 707 1,196 19,774 80 96.3 3.1 5.3 87.5 4.8 2.7% 2.7% 94.7%WI 390 200 136 54 51.3% 34.9% 13.8% 34,980 451 1,343 33,136 50 89.7 1.3 3.8 85.2 2 2.8% 4.1% 93.1%WV 126 88 28 10 69.8% 22.2% 7.9% 10,888 326 1,203 9,355 4 86.4 2.6 9.5 74.2 7.6 4.8% 7.9% 87.3%WY 39 16 7 16 41.0% 17.9% 41.0% 2,983 37 201 2,745 0 76.5 0.9 5.2 70.4 4.5 5.1% 10.3% 84.6%Data Source: CMS CASPER as of March 2013
*Non-Certified (Other)—This bed category includes beds that are private pay and ICF/IDD beds that are co-located in a nursing center.
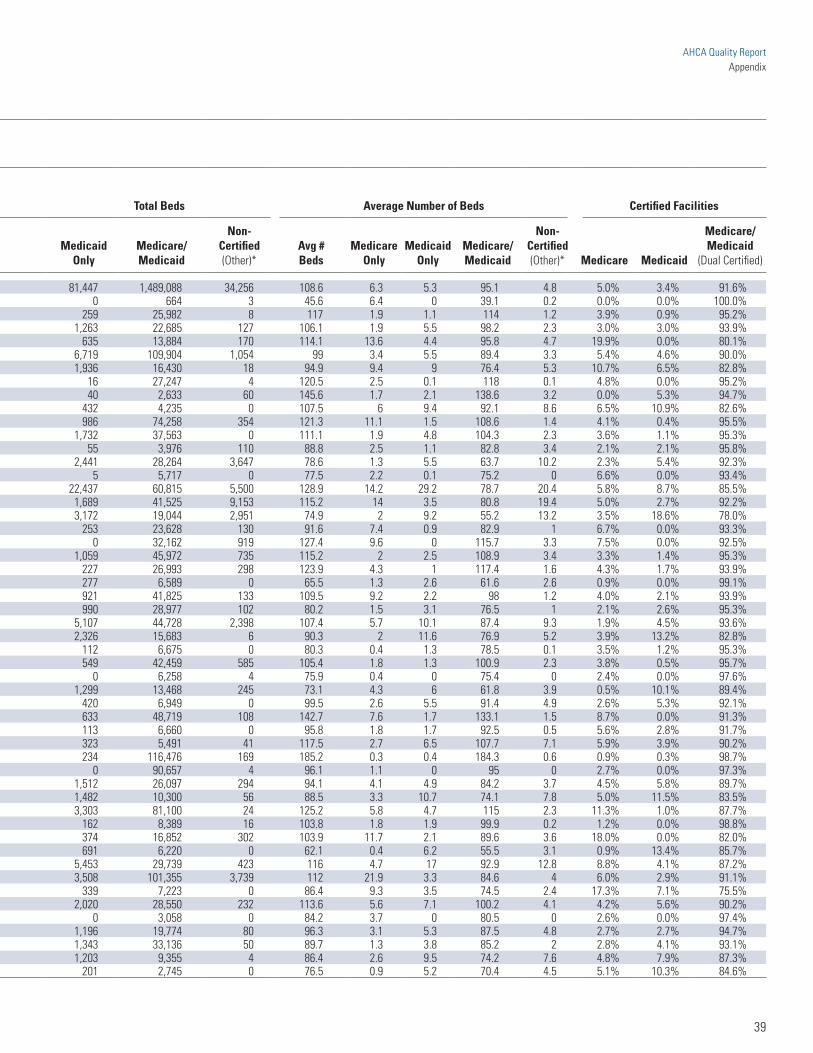
AHCA Quality ReportAppendix
39
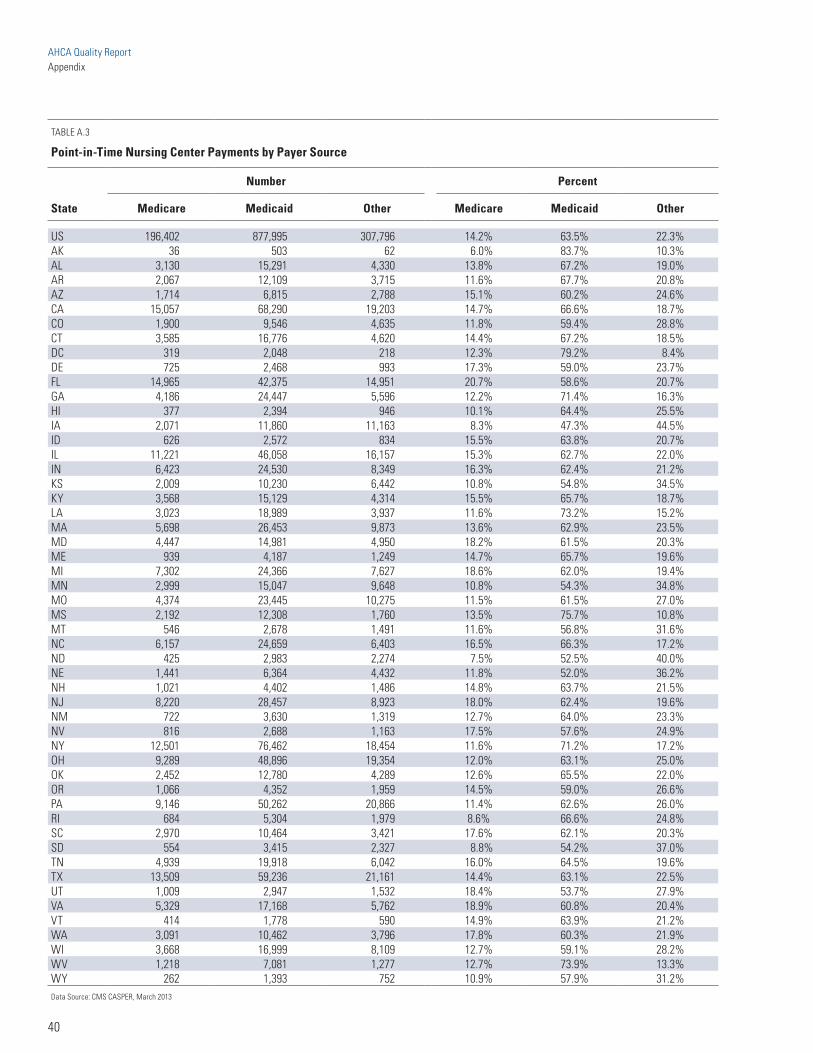
AHCA Quality ReportAppendix
40
TABLE A.3
Point-in-Time Nursing Center Payments by Payer Source
State
Number Percent
Medicare Medicaid Other Medicare Medicaid Other
US 196,402 877,995 307,796 14.2% 63.5% 22.3%AK 36 503 62 6.0% 83.7% 10.3%AL 3,130 15,291 4,330 13.8% 67.2% 19.0%AR 2,067 12,109 3,715 11.6% 67.7% 20.8%AZ 1,714 6,815 2,788 15.1% 60.2% 24.6%CA 15,057 68,290 19,203 14.7% 66.6% 18.7%CO 1,900 9,546 4,635 11.8% 59.4% 28.8%CT 3,585 16,776 4,620 14.4% 67.2% 18.5%DC 319 2,048 218 12.3% 79.2% 8.4%DE 725 2,468 993 17.3% 59.0% 23.7%FL 14,965 42,375 14,951 20.7% 58.6% 20.7%GA 4,186 24,447 5,596 12.2% 71.4% 16.3%HI 377 2,394 946 10.1% 64.4% 25.5%IA 2,071 11,860 11,163 8.3% 47.3% 44.5%ID 626 2,572 834 15.5% 63.8% 20.7%IL 11,221 46,058 16,157 15.3% 62.7% 22.0%IN 6,423 24,530 8,349 16.3% 62.4% 21.2%KS 2,009 10,230 6,442 10.8% 54.8% 34.5%KY 3,568 15,129 4,314 15.5% 65.7% 18.7%LA 3,023 18,989 3,937 11.6% 73.2% 15.2%MA 5,698 26,453 9,873 13.6% 62.9% 23.5%MD 4,447 14,981 4,950 18.2% 61.5% 20.3%ME 939 4,187 1,249 14.7% 65.7% 19.6%MI 7,302 24,366 7,627 18.6% 62.0% 19.4%MN 2,999 15,047 9,648 10.8% 54.3% 34.8%MO 4,374 23,445 10,275 11.5% 61.5% 27.0%MS 2,192 12,308 1,760 13.5% 75.7% 10.8%MT 546 2,678 1,491 11.6% 56.8% 31.6%NC 6,157 24,659 6,403 16.5% 66.3% 17.2%ND 425 2,983 2,274 7.5% 52.5% 40.0%NE 1,441 6,364 4,432 11.8% 52.0% 36.2%NH 1,021 4,402 1,486 14.8% 63.7% 21.5%NJ 8,220 28,457 8,923 18.0% 62.4% 19.6%NM 722 3,630 1,319 12.7% 64.0% 23.3%NV 816 2,688 1,163 17.5% 57.6% 24.9%NY 12,501 76,462 18,454 11.6% 71.2% 17.2%OH 9,289 48,896 19,354 12.0% 63.1% 25.0%OK 2,452 12,780 4,289 12.6% 65.5% 22.0%OR 1,066 4,352 1,959 14.5% 59.0% 26.6%PA 9,146 50,262 20,866 11.4% 62.6% 26.0%RI 684 5,304 1,979 8.6% 66.6% 24.8%SC 2,970 10,464 3,421 17.6% 62.1% 20.3%SD 554 3,415 2,327 8.8% 54.2% 37.0%TN 4,939 19,918 6,042 16.0% 64.5% 19.6%TX 13,509 59,236 21,161 14.4% 63.1% 22.5%UT 1,009 2,947 1,532 18.4% 53.7% 27.9%VA 5,329 17,168 5,762 18.9% 60.8% 20.4%VT 414 1,778 590 14.9% 63.9% 21.2%WA 3,091 10,462 3,796 17.8% 60.3% 21.9%WI 3,668 16,999 8,109 12.7% 59.1% 28.2%WV 1,218 7,081 1,277 12.7% 73.9% 13.3%WY 262 1,393 752 10.9% 57.9% 31.2%Data Source: CMS CASPER, March 2013

AHCA Quality ReportAppendix
TABLE A.4
Member Trends in Risk-Adjusted Rates of 30-Day Rehospitalization*
State
Average Adjusted Rehospitalization RateAverage Percent Change
between Baseline and 2012 Q42011 Q4 Baseline 2012 Q4
AK 13.1 7.7 -41.2%AL 17.8 17.6 -1.1%AR 20.9 20.6 -1.4%AZ 18.6 17.8 -4.3%CA 17.5 17.1 -2.3%CO 14.1 13.5 -4.3%CT 17.9 17.9 0.0%DC 17.3 20.5 18.5%DE 18.9 18.8 -0.5%FL 20.2 19.5 -3.5%GA 18.9 18.1 -4.2%HI 11.6 9.8 -15.5%IA 16.9 17.2 1.8%ID 12.0 12.3 2.5%IN 17.6 17.4 -1.1%KS 17.7 18.6 5.1%KY 19.3 18.9 -2.1%LA 23.5 23.0 -2.1%MA 16.5 16.0 -3.0%MD 20.7 19.7 -4.8%ME 15.2 14.8 -2.6%MI 18.4 17.8 -3.3%MN 16.6 16.9 1.8%MO 19.3 19.7 2.1%MS 21.5 21.5 0.0%NC 18.8 18.1 -3.7%ND 14.2 14.5 2.1%NE 15.8 16.5 4.4%NH 16.2 14.8 -8.6%NJ 20.9 19.7 -5.7%NM 15.2 15.4 1.3%NV 18.7 17.2 -8.0%NY 19.0 18.4 -3.2%OH 17.9 17.6 -1.7%OK 20.9 20.8 -0.5%OR 16.8 16.0 -4.8%PA 19.2 18.0 -6.3%RI 20.7 18.7 -9.7%SC 18.2 17.7 -2.7%SD 12.8 13.8 7.8%TN 18.4 18.7 1.6%TX 19.6 19.2 -2.0%UT 12.2 12.8 4.9%VA 18.0 18.0 0.0%VT 13.3 13.1 -1.5%WA 16.3 15.9 -2.5%WI 16.6 16.6 0.0%WV 18.3 18.9 3.3%WY 14.1 13.0 -7.8%Data Source: MDS 3.0, OnPoint-30 Rehospitalization Measure
*IL and MT are excluded as there was no AHCA affiliate in those states in 2012.
41

AHCA Quality ReportAppendix
42
TABLE A.5
Member Trends in Off-Label Antipsychotic Rates*
State
Average RateAverage Percentage Change
between Baseline and 2012 Q42011 Q4 Baseline 2012 Q4
AK 13.6 12.4 -8.8%AL 26.7 24.0 -10.1%AR 26.0 25.1 -3.5%AZ 25.0 22.1 -11.6%CA 20.1 17.8 -11.4%CO 21.4 19.5 -8.9%CT 26.8 25.0 -6.7%DC 22.0 20.0 -9.1%DE 22.4 20.8 -7.1%FL 24.5 23.3 -4.9%GA 28.4 23.7 -16.5%HI 13.2 12.3 -6.8%IA 21.5 19.9 -7.4%ID 25.5 21.9 -14.1%IN 23.5 21.7 -7.7%KS 25.4 23.7 -6.7%KY 26.7 24.0 -10.1%LA 29.9 28.5 -4.7%MA 26.3 24.3 -7.6%MD 19.2 17.8 -7.3%ME 26.7 24.9 -6.7%MI 16.0 15.8 -1.3%MN 20.7 20.0 -3.4%MO 25.6 24.5 -4.3%MS 26.6 24.5 -7.9%NC 21.3 18.3 -14.1%ND 20.6 18.7 -9.2%NE 22.2 22.7 2.3%NH 25.4 22.5 -11.4%NJ 17.3 17.2 -0.6%NM 21.6 20.2 -6.5%NV 23.2 22.7 -2.2%NY 23.5 20.8 -11.5%OH 24.7 24.2 -2.0%OK 25.4 23.6 -7.1%OR 20.0 18.6 -7.0%PA 23.0 22.3 -3.0%RI 22.9 19.5 -14.8%SC 21.2 19.1 -9.9%SD 20.9 20.1 -3.8%TN 30.7 27.9 -9.1%TX 28.5 28.4 -0.4%UT 27.9 26.9 -3.6%VA 23.5 22.3 -5.1%VT 26.7 25.5 -4.5%WA 24.5 22.8 -6.9%WI 17.9 18.0 0.6%WV 19.6 19.7 0.5%WY 20.5 20.3 -1.0%Source: CMS Nursing Home Compare Quality Measures, 2012
*IL and MT are excluded as there was no AHCA affiliate in those states in 2012.

AHCA Quality ReportAppendix
TABLE A.6
Nursing Home Compare Quality Measures (CMS Publicly Reported Three-Quarter Average) by State, 2012 Q4 Update: Long Stay
StatePain
(Adjusted)
High-Risk Pressure
UlcerPhysical Restraint
Depressive Symptoms
Weight Loss ADL
Indwelling Catheter (Adjusted)
Inconti-nence UTI
Influenza Vaccina-
tion
Pneumo-coccal
Vaccina-tion
Falls with
Injury
Anti- psychotic Medication
US 10.1% 6.4% 1.9% 6.9% 7.3% 15.8% 3.8% 43.1% 7.2% 92.1% 94.3% 3.3% 22.9%AK 22.4% 4.7% 0.2% 9.0% 6.5% 13.1% 4.5% 37.2% 6.6% 97.1% 97.6% 3.9% 12.7%AL 9.0% 5.8% 1.6% 2.4% 7.8% 13.3% 3.2% 36.7% 5.6% 93.1% 91.9% 3.1% 25.9%AR 10.7% 6.5% 2.1% 4.9% 6.9% 16.8% 3.8% 33.0% 5.6% 95.0% 97.1% 3.8% 25.8%AZ 13.6% 6.6% 0.8% 4.8% 7.0% 15.2% 4.7% 49.6% 7.0% 94.9% 96.0% 2.9% 22.4%CA 7.8% 7.0% 3.1% 2.4% 6.0% 12.3% 4.0% 45.1% 6.5% 91.0% 93.8% 1.6% 19.3%CO 11.4% 5.2% 1.7% 6.9% 7.6% 16.3% 5.1% 47.0% 6.7% 87.5% 90.9% 3.8% 19.6%CT 7.5% 4.7% 1.4% 4.6% 6.7% 17.2% 2.6% 41.5% 5.3% 89.9% 94.8% 3.1% 24.3%DC 3.4% 9.3% 0.8% 3.3% 6.7% 11.9% 1.7% 50.7% 6.6% 94.5% 93.9% 1.8% 19.0%DE 7.7% 5.0% 0.7% 4.8% 6.3% 16.1% 2.2% 46.3% 7.4% 94.6% 97.6% 3.6% 21.8%FL 7.4% 6.6% 2.5% 3.2% 7.9% 14.3% 3.3% 45.3% 8.9% 91.3% 95.3% 2.7% 23.6%GA 10.9% 7.0% 1.4% 10.2% 8.3% 15.8% 2.5% 43.0% 7.5% 93.5% 95.3% 3.5% 26.6%HI 6.1% 3.3% 2.4% 4.2% 6.7% 13.7% 2.1% 48.5% 4.7% 95.0% 97.4% 2.2% 12.9%IA 10.5% 4.5% 0.8% 7.4% 6.4% 15.1% 4.4% 39.4% 8.4% 95.3% 97.4% 3.8% 20.9%ID 15.1% 4.1% 1.8% 8.7% 7.0% 15.3% 4.8% 50.3% 7.4% 92.3% 97.8% 3.6% 24.3%IL 8.1% 7.3% 2.2% 7.2% 7.7% 14.8% 4.4% 35.2% 6.7% 91.6% 92.9% 3.3% 25.6%IN 10.1% 6.4% 1.3% 4.9% 7.7% 19.3% 4.0% 45.0% 6.7% 91.8% 93.3% 3.6% 22.9%KS 12.8% 5.6% 0.5% 9.6% 6.9% 15.3% 3.6% 37.7% 8.6% 95.2% 95.3% 5.0% 23.8%KY 12.1% 6.9% 3.3% 5.6% 8.1% 17.0% 4.9% 44.3% 8.6% 93.6% 96.7% 3.6% 24.5%LA 9.5% 9.2% 4.0% 3.7% 7.9% 19.7% 3.7% 33.5% 7.2% 92.9% 93.2% 3.8% 29.2%MA 7.1% 5.4% 2.1% 5.0% 6.1% 13.5% 2.8% 51.0% 6.8% 92.8% 96.6% 3.0% 25.0%MD 5.6% 7.2% 1.2% 4.3% 6.2% 18.8% 2.9% 53.3% 5.8% 92.4% 94.8% 2.8% 18.4%ME 12.5% 4.8% 0.5% 12.3% 8.5% 12.7% 4.2% 65.7% 7.6% 95.0% 94.7% 3.5% 24.9%MI 9.6% 6.2% 2.5% 4.9% 7.5% 14.6% 3.9% 46.7% 6.5% 89.5% 94.2% 2.8% 16.1%MN 11.8% 4.2% 0.9% 7.2% 7.1% 14.9% 4.0% 46.7% 5.3% 93.3% 96.2% 4.0% 17.8%MO 11.0% 6.5% 1.5% 6.0% 6.8% 14.1% 3.5% 31.5% 7.4% 93.1% 89.2% 3.8% 25.3%MS 13.2% 7.2% 4.0% 2.7% 7.9% 18.2% 3.1% 39.9% 7.1% 93.2% 96.9% 2.8% 26.3%MT 15.2% 5.5% 1.4% 7.8% 7.9% 15.1% 5.1% 42.1% 7.6% 92.8% 92.2% 4.7% 19.8%NC 11.1% 7.5% 1.7% 6.0% 9.0% 19.9% 3.1% 53.0% 7.8% 91.6% 96.1% 3.1% 19.8%ND 12.3% 4.8% 0.9% 7.3% 6.8% 17.1% 4.0% 43.5% 6.0% 94.0% 97.5% 4.7% 20.3%NE 12.5% 4.4% 0.7% 8.2% 7.0% 15.5% 5.0% 43.5% 7.6% 94.1% 95.1% 4.2% 22.9%NH 10.1% 3.8% 0.9% 6.8% 7.2% 16.8% 4.5% 40.8% 6.0% 94.2% 98.6% 4.1% 24.2%NJ 5.8% 8.6% 2.5% 6.9% 7.5% 14.2% 3.0% 33.9% 6.3% 93.3% 95.6% 2.6% 17.6%NM 12.2% 7.1% 1.4% 6.3% 8.5% 17.0% 3.4% 41.4% 7.1% 85.6% 79.6% 3.9% 21.1%NV 10.1% 7.2% 1.1% 5.0% 7.0% 16.5% 5.9% 49.6% 6.8% 84.9% 91.0% 2.7% 21.0%NY 7.2% 8.0% 2.2% 12.2% 6.6% 15.4% 3.0% 42.2% 6.6% 92.8% 97.2% 2.9% 20.5%OH 11.3% 6.0% 2.2% 15.7% 7.5% 15.1% 3.9% 38.1% 7.3% 90.9% 94.8% 3.4% 24.8%OK 16.5% 8.1% 1.3% 7.4% 8.3% 14.2% 4.4% 31.7% 9.4% 93.4% 89.3% 5.1% 26.1%OR 15.8% 6.3% 1.6% 6.9% 8.3% 11.9% 5.4% 48.7% 7.9% 89.4% 94.6% 3.0% 19.9%PA 9.6% 5.9% 1.4% 4.4% 7.4% 16.2% 3.9% 56.6% 5.2% 91.8% 94.2% 3.1% 21.8%RI 8.7% 5.3% 0.8% 4.0% 6.4% 17.3% 2.9% 40.2% 8.4% 92.4% 94.9% 3.8% 21.7%SC 8.7% 6.5% 3.3% 3.5% 9.2% 15.1% 2.3% 52.5% 8.7% 92.5% 97.1% 2.9% 20.2%SD 11.9% 4.6% 0.9% 9.5% 6.9% 16.9% 5.0% 43.8% 6.1% 95.9% 97.1% 5.0% 20.9%TN 9.1% 5.7% 3.8% 3.8% 8.2% 15.1% 3.9% 41.4% 8.9% 93.3% 92.6% 3.5% 28.6%TX 11.3% 7.2% 1.4% 9.3% 6.5% 20.0% 3.7% 41.6% 8.3% 89.9% 90.5% 3.5% 28.4%UT 21.9% 5.9% 2.5% 16.9% 7.6% 13.7% 4.6% 48.3% 7.8% 92.6% 95.0% 3.7% 28.2%VA 9.9% 6.7% 0.9% 4.5% 7.7% 18.5% 3.1% 51.0% 7.8% 90.2% 93.6% 3.1% 21.9%VT 13.5% 4.9% 0.9% 14.6% 7.6% 19.9% 4.9% 53.6% 7.3% 93.7% 96.3% 4.9% 24.5%WA 13.8% 6.0% 1.2% 12.8% 7.2% 13.7% 4.3% 52.7% 7.8% 90.1% 95.5% 3.1% 21.7%WI 10.3% 4.5% 1.0% 6.8% 7.2% 15.1% 4.5% 43.2% 5.9% 94.0% 98.4% 3.4% 18.5%WV 12.7% 7.0% 2.1% 7.3% 8.4% 20.0% 4.0% 40.9% 8.3% 92.2% 94.3% 4.8% 21.1%WY 14.5% 5.0% 1.5% 8.8% 8.4% 15.9% 4.8% 44.9% 6.1% 93.0% 93.7% 5.7% 17.5%Data Source: CMS Nursing Home Compare, three-quarter average (April 2012–December 2012)
43

AHCA Quality ReportAppendix
44
TABLE A.7
Nursing Home Compare Quality Measures (CMS Publicly Reported Three-Quarter Average) by State, 2012 Q4 Update: Short Stay
State PainWorsening Ulcers
(Adjusted)Influenza
VaccinationPneumococcal
VaccinationAntipsychotic
Medication
US 21.1% 1.5% 82.5% 81.8% 2.8%AK 42.3% 0.8% 90.0% 85.0% 1.2%AL 19.2% 0.9% 85.9% 82.6% 2.9%AR 20.0% 1.4% 87.6% 86.7% 3.7%AZ 26.6% 0.9% 88.6% 87.8% 2.1%CA 19.8% 1.2% 79.6% 78.6% 2.4%CO 23.4% 1.6% 79.6% 77.2% 2.1%CT 20.5% 1.2% 80.7% 80.3% 2.4%DC 12.4% 2.2% 75.9% 67.0% 4.2%DE 17.8% 2.2% 86.3% 88.1% 3.0%FL 19.1% 1.1% 84.0% 85.9% 3.5%GA 21.0% 1.7% 84.5% 83.1% 3.9%HI 14.2% 0.9% 87.2% 84.2% 1.6%IA 20.7% 1.7% 89.0% 87.4% 2.2%ID 26.5% 1.2% 87.4% 87.1% 2.1%IL 18.8% 1.8% 79.4% 79.2% 2.7%IN 21.8% 1.9% 81.8% 79.9% 3.0%KS 23.0% 1.5% 82.6% 78.2% 3.6%KY 23.5% 1.9% 86.8% 86.4% 3.5%LA 19.9% 2.0% 79.7% 79.2% 4.5%MA 20.4% 1.4% 86.2% 85.4% 2.4%MD 15.3% 1.3% 83.3% 83.9% 2.8%ME 23.9% 1.3% 85.2% 83.6% 2.3%MI 20.5% 1.6% 81.4% 81.5% 2.1%MN 25.0% 1.2% 84.3% 84.5% 2.0%MO 21.6% 1.8% 80.7% 74.1% 3.1%MS 22.9% 1.6% 83.9% 85.3% 3.6%MT 28.4% 1.6% 84.0% 78.9% 2.1%NC 21.3% 1.3% 85.3% 85.2% 2.5%ND 20.9% 2.0% 85.2% 85.0% 2.3%NE 23.4% 1.7% 84.1% 82.3% 3.0%NH 18.2% 1.2% 89.6% 91.4% 2.2%NJ 15.6% 1.7% 84.9% 86.6% 1.9%NM 26.8% 1.5% 70.4% 66.2% 2.8%NV 23.7% 1.2% 79.7% 79.3% 3.5%NY 16.1% 1.6% 83.0% 83.9% 3.1%OH 25.0% 1.5% 82.5% 83.9% 2.7%OK 29.6% 2.7% 83.5% 76.8% 3.3%OR 26.7% 1.0% 84.3% 81.6% 1.7%PA 20.4% 1.5% 82.8% 83.3% 2.7%RI 22.1% 1.9% 83.7% 83.1% 2.1%SC 17.4% 1.3% 86.2% 86.1% 2.9%SD 21.6% 2.6% 83.7% 82.3% 2.1%TN 20.1% 1.5% 83.6% 81.6% 3.5%TX 20.8% 1.5% 74.0% 72.8% 3.9%UT 34.8% 1.4% 85.0% 87.0% 2.3%VA 18.8% 1.3% 81.9% 80.7% 3.0%VT 22.6% 1.3% 86.1% 86.3% 2.9%WA 26.5% 1.4% 85.5% 85.1% 2.2%WI 21.7% 1.4% 88.7% 91.0% 1.7%WV 22.7% 2.1% 82.3% 82.9% 3.0%WY 26.8% 1.5% 82.6% 77.9% 2.2%Data Source: CMS Nursing Home Compare, three-quarter average (April 2012–December 2012)


The American Health Care Association1201 L Street, NW | Washington, DC 20005 | www.ahcancal.org