2014 QUALITY REPORT - AHCA Home · 2014 QUALITY REPORT. ... As of March 2014, AHCA membership...
20
2014 QUALITY REPORT
Transcript of 2014 QUALITY REPORT - AHCA Home · 2014 QUALITY REPORT. ... As of March 2014, AHCA membership...

2014 QUALITY REPORT

TABLE OF CONTENTS
1 EXECUTIVE SUMMARY
3 AMERICAN HEALTH CARE ASSOCIATION MEMBERS
11 TRENDS IN QUALITY
16 REFERENCES
17 DATA SOURCE DESCRIPTIONS

EXECUTIVE SUMMARY
The American Health Care Association (AHCA) and National Center for Assisted Living (NCAL) is the nation’s premier association of long term and post-acute care providers. Together, the organization rep-resents more than 12,000 non-profit and proprietary skilled nursing care centers,1 assisted living communities, sub-acute centers, and homes for individuals with intellectual and developmental disabilities. This report focuses on all skilled nursing care centers (SNCCs) nation-ally, including both our members as well as non-members. By delivering solutions for quality care, the Association aims to improve the lives of the millions of frail, elderly and individuals with disabilities who receive long term or post-acute care in our member centers each day.
The annual AHCA Quality Report uses mostly government data to provide an overview of the latest trends in quality for the skilled nurs-ing care sector. The report also highlights member centers’ efforts to improve quality care through specific programs and initiatives.
THE CHANGING LONG TERM CARE POPULATIONSkilled nursing care centers (SNCCs) serve individuals who have increasingly complex medical conditions and extensive needs for care and support, as demonstrated by measures of both physical and cognitive function. In an analysis concentrating on five activities of daily living (bathing, bed mobility, transfer, toilet use and eating), nearly all (95 percent) individuals who enter a center for a Medicare-covered, post-acute stay require assistance with four or five of these activities. Among long-stay residents at centers for at least one year, 86 percent need that same level of assistance. In addition, almost two-thirds (61 percent) of long-stay residents have dementia (AHCA Quality Report, 2013).
In response to the increasing level of dependence of individuals entering SNCCs, the profession has increased the hours provided for direct nursing care. From 2009 through 2014, direct care nursing hours per resident day have steadily increased at all levels of nurs-ing staff. Additionally, the percent of SNCCs receiving the top rat-ings of four or five stars in the staffing component of the Centers for Medicare & Medicaid Services (CMS) Five-Star Quality Rating System has steadily increased since 2009. Five years ago, 40 per-cent of centers received four or five stars on the staffing component, compared to 56 percent of centers in 2014.
OBJECTIVE MEASURES OF QUALITY CAREOn a national level, we also see quality improving steadily. In recent years, there have been across-the-board improvements in almost all the quality measures generally used in this field. The proportion of centers receiving the highest rating (i.e., five stars) on the CMS Five-Star Quality Rating System scale has increased from 13 percent in 2009 to 28 percent in 2014. However, starting in early 2015, CMS plans to rebase the scoring for the Five-Star Quality Rating System, which will result in an abrupt change, with a decrease in the propor-tion of centers receiving four or five stars and an increase in those receiving one or two stars.2 This will occur not because of a change in quality but due to CMS’ rebasing of the scoring cut points in order to force the distribution of star ratings back to an earlier time period. Thus, we will not be able to compare trends prior to 2015 once CMS rebases the rating thresholds.
In early 2012, the Association launched the Quality Initiative, a member-wide challenge to meet specific, measurable targets in four distinct areas: hospital readmissions, staff stability, customer satis-faction and the off-label use of antipsychotic medications. Since the launch of the initiative, members have demonstrated meaningful improvements in quality care for the two goals that we are able to measure using national data sets: rehospitalization and antipsy-chotic use.
AHCA members have reduced hospital readmissions by 14.2 per-cent (18.3 percent in 2011 to 15.7 percent in 2014). In that same time period, member centers reduced the off-label use of antipsychotic medications by 21.1 percent (23.7 percent in 2011 to 18.7 percent in 2014). National data on turnover and satisfaction is not yet available to adequately evaluate these two goals.
The AHCA/NCAL National Quality Award Program, based on the Baldrige framework for performance excellence, seeks to recog-nize those centers that embrace a broad and systematic approach to improving the overall quality of their organizations. By enhanc-ing business practices and implementing strategic approaches to quality care, members commit to long term systematic changes in their centers. Centers that have earned awards at the Silver and/or Gold level consistently outperform other centers in objective quality metrics.
1. Skilled Nursing Care Centers (SNCCs) is the same as Skilled Nursing Facilities (SNFs). For the purpose of this report, SNF is only utilized to refer to government programs and legislation.
2. At the time of publication, CMS had not announced the new changes to the Five-Star Quality Rating System.
EXECUTIVE SUMMARY | AHCA QUALITY REPORT
1

A PROFESSION CENTERED ON QUALITY OUTCOMESIn addition to our Quality Initiative and Quality Award Program, AHCA has supported national policy changes to improve quality in long term care. In the past year, AHCA supported the passage of the IMPACT Act of 2014 (H.R. 4994; Pub.L. 113–185) that will standard-ize the clinical assessments used across all post-acute providers, and require hospitals to provide consumers with information on the quality of post-acute providers prior to discharge from the hospital. In addition, AHCA supported the passage of the Protecting Access to Medicare Act of 2014 (H.R. 4302; Pub.L. 113–93) that will imple-ment a 2 percent withhold of Medicare payments to all SNCCs that can be earned back based on a center’s rehospitalization rates. Both statutes also call for greater transparency with public reporting on numerous new quality measures related to post-acute care, includ-ing rehospitalization rates, discharges back to the community and improvement in functional outcomes.
The Association also supported the President’s action to strengthen the Five-Star Quality Rating System by adding new measures (e.g., rehospitalization, discharges back to the community, antipsychotic use, staffing turnover and retention) and verifying the accuracy of the information used to calculate the measures in the Five-Star Quality Rating System.
In addition, AHCA developed several new quality measures that were submitted to the National Quality Forum (NQF) for endorse-ment, with plans for additional measure development in the coming years. The first measure submitted to NQF, PointRight® Pro 30™, is a 30-day SNF rehospitalization measure that received endorsement in 2014.
23.7%
AHCA members safely reduced the off-label use of antipsychotic medications between Q4 2011 and Q2 2014.
ANTIPSYCHOTICS
18.7%
AHCA QUALITY REPORT | EXECUTIVE SUMMARY
2

AMERICAN HEALTH CARE ASSOCIATION MEMBERS
The American Health Care Association (AHCA) represents a diverse group of SNCCs across the United States. AHCA and its sister orga-nization, the National Center for Assisted Living (NCAL), also repre-sent assisted living communities and homes for persons with intel-lectual and developmental disabilities. This report focuses on the skilled nursing care sector.
As of March 2014, AHCA membership includes 9,296 or 59.4 per-cent of the 15,663 SNCCs across the nation. Our members are a combination of for-profit, not-for-profit and government centers. AHCA’s membership includes 68.5 percent of the nation’s for-profit centers, 37.9 percent of the not-for-profit centers and 40.8 percent of the government-owned centers (Table 1.1).
TABLE 1.1
NATIONAL PROFILE OF SKILLED NURSING CARE CENTERS
Member Non-Member Total
Total Number of Centers 9,296 6,367 15,663
Number of For-Profit Centers 7,456 3,425 10,881
Number of Not-for-Profit Centers 1,459 2,390 3,849
Number of Government Centers 381 552 933
Number of Centers Owned by Multi-Facility Organizations* 5,867 2,773 8,640
Number of Independently Owned Centers* 3,429 3,594 7,023
Number of Urban Centers 6,362 4,532 10,894
Number of Rural Centers 2,934 1,835 4,769
Average Occupancy 86.2% 84.2% 85.6%
Average Number of Beds per Center 105.6 109.9 108.7
Source: The Centers for Medicare & Medicaid Services (CMS) CASPER Data, March 2014; AHCA CRM Membership, as of March 2014.
* Based on the CMS definition of multi-facility and independently owned. A Multi-Facility Organization is an organization that owns two or more long term care facilities. The owner may be an individual or a corporation. Leasing of facilities by corporate chains is included in this definition. All others are defined as independent facilities.
Nationally, 69.6 percent of all SNCCs are located in urban settings and 30.4 percent are located in rural settings. Members tend to have a slightly lower average number of beds per center, at 105.6, than
non-member centers, which have an average of 109.9 beds per center. However, members have slightly higher average occupancy than non-members, at 86.2 percent, compared to 84.2 percent (Table 1.1).
NOT-FOR-PROFIT CENTERS (3,849 centers nationwide)
37.9% AHCA Members
GOVERNMENT-OWNED CENTERS (933 centers nationwide)
40.8% AHCA MembersFOR-PROFIT CENTERS (10,881 centers nationwide)
68.5% AHCA Members
NATIONAL PROFILE OF SKILLED NURSING CARE CENTERS
NATIONAL BREAKDOWN
AMERICAN HEALTH CARE ASSOCIATION MEMBERS | AHCA QUALITY REPORT
3

AHCA QUALITY INITIATIVE AND ACTIVITIESThe Association is committed to quality improvement and encour-ages its members to participate in quality improvement efforts, including the AHCA Quality Initiative, LTC Trend Trackersm, the AHCA/NCAL National Quality Award Program, and Advancing Excellence.
AHCA Quality Initiative
AHCA announced its Quality Initiative in February 2012 and set four specific, measureable goals with a target date to accomplish them. They include:
• Safely Reduce Hospital Readmissions: By March 2015, safely reduce the number of hospital readmissions within 30 days during a SNCC stay by 15 percent.
• Safely Reduce the Off-label Use of Antipsychotics: Among long-stay residents by 25 percent by December 2015 and 30 per-cent by December 2016.3
• Increase Staff Stability: By March 2015, reduce turnover among nursing staff (RN, LPN/LVN, CNA)4 by 15 percent.
• Increase Customer Satisfaction: By March 2015, increase the percentage of customers who would recommend the center to others up to 90 percent.
The Quality Initiative embraces and supports the triple aim of improving the patient care experience, improving the health of pop-ulations and reducing the per-capita cost of health care.
Safely Reduce Hospital Readmissions
Hospital readmissions from SNCCs have potentially negative impacts on the physical, mental and emotional well-being of individ-uals. The high number of readmissions has been identified by policy-makers as a key opportunity to reduce health care costs and improve quality of care. This past year Congress passed the AHCA-supported SNF Value Based Purchasing (VBP) legislation that imposes a 2 per-cent withhold on all SNF Part A payments, of which between 50–70 percent may be earned back based on a center’s rehospital-ization rates (H.R. 4302; Pub.L. 113–93). This aligns nursing centers with the Hospital Readmission Reduction Program that levies a pay-ment penalty to hospitals for high readmission rates.
AHCA is measuring progress of this goal using the PointRight® Pro 30™ rehospitalization metric, which has been endorsed by the National Quality Forum (NQF). This is an all-cause measure of 30-day readmissions from the SNCC setting that is risk-adjusted using 33 demographic and clinical factors to achieve comparability across centers, which is available at ahcancal.org/research. It is calculated using Minimum Data Set (MDS) 3.0 data from a 12-month period.
FIGURE 1.1
AVERAGE REHOSPITALIZATION RATE—AHCA MEMBERS
20%
19%
18%
17%
16%
15%2011 Q4
2012 Q1
2012 Q2
2012 Q3
2012 Q4
2013 Q1
2013 Q2
2013 Q3
2013 Q4
2014 Q1
2014 Q2
Source: CMS MDS data based on PointRight® Pro 30™ measure.
Note: AHCA membership as of October 2014.
From the baseline period of the fourth quarter of 2011 through the second quarter of 2014, AHCA members have reduced hospital readmissions by 14.2 percent (18.3 percent in 2011 to 15.7 percent in 2014) (Figure 1.1). During this period, 50.5 percent of AHCA member centers have already achieved the three-year goal of a 15 percent reduction. As a result, members have successfully avoided a total of 38,011 hospital readmissions in the first two years of this initiative. Figure 1.2 shows the change in rehospitalization rates by state from 2011 to 2014. Twenty-four states have already achieved an average 15 percent reduction in rehospitalization rates.
3. Updated September 2014.
4. RN: registered nurse; LPN/LVN: licensed practical nurse/licensed vocational nurse; CNA: certified nursing assistant.
AHCA QUALITY REPORT | AMERICAN HEALTH CARE ASSOCIATION MEMBERS
4

FIGURE 1.2
PERCENT IMPROVEMENT IN REHOSPITALIZATION RATE FOR AHCA MEMBERS (2011 Q4 TO 2014 Q2) BY STATE
50%
40%
30%
20%
10%
0%
24 states have achieved the 15% reduction goal.
UT ME
NM
MN DC SD AR SC ID MS
OH MO IA NE TX IN VT DE OK VA FL AL LA WI
NC CT PA OR MD
MA KY ND MI
CO WA GA NY HI
WV CA KS TN IL NJ RI NH NV AZ
MT
WY AK
States achieving the 15% reduction goal Goal not met
Source: CMS MDS data based on PointRight® Pro 30™ measure.
Note: AHCA membership as of October 2014.
Safely Reduce the Off-Label Use of Antipsychotics
Studies have demonstrated that antipsychotic medications provide only a small benefit for a limited set of individuals with dementia, but pose a large risk of adverse events (Ballard, Waite, & Birks, 2006; Maher et al., 2011). In 2012, the Centers for Medicare & Medicaid Services (CMS) launched the National Partnership to Improve Dementia Care in Nursing Homes, which AHCA supported, setting the goal of a 15 percent reduction. That goal was achieved as of the end of 2014. In September 2014, CMS along with AHCA and others set new goals to continue reducing the use of antipsychotic medica-tions in nursing centers by 25 percent in 2015 and 30 percent in 2016, as compared to the original 2011 baseline period.
The progress on this goal is measured using the CMS quality mea-sure on the prevalence of off-label use of antipsychotic medications in SNCCs for long-stay residents, which is published on Nursing Home Compare. Member centers have seen a steady decrease in the use of antipsychotics from 2011 to 2014 (Figure 1.3). Overall, AHCA members have achieved an average 21.1 percent decrease in the use of antipsychotic medications, with 57.0 percent exceeding the initial 15 percent reduction goal. As a result of these efforts, about 32,400 individuals in AHCA member centers are no longer receiving these medications.
FIGURE 1.3
AVERAGE RATE OF OFF-LABEL USE OF ANTIPSYCHOTICS—AHCA MEMBERS OVER TIME
25%
20%
15%
10%
5%
0%2011 Q4
2012 Q1
2012 Q2
2012 Q3
2012 Q4
2013 Q1
2013 Q2
2013 Q3
2013 Q4
2014 Q1
2014 Q2
Source: CMS Nursing Home Compare (one quarter average).
Note: AHCA membership as of October 2014.
AMERICAN HEALTH CARE ASSOCIATION MEMBERS | AHCA QUALITY REPORT
5

Figure 1.4 shows the average change in off-label use of antipsychot-ics in each state from 2011 to 2014 compared to the goals set for 2014, 2015 and 2016. Overall, 43 states have exceeded the 2014
goal of a 15 percent reduction and 16 states have already achieved the 2015 goal, of which nine states also have achieved the 2016 goal of a 30 percent reduction compared to their 2011 baseline rates.
FIGURE 1.4
PERCENT IMPROVEMENT IN RATE OF OFF-LABEL USE OF ANTIPSYCHOTICS FOR AHCA MEMBERS BY STATE
50%
40%
30%
20%
10%
0%
NE
NV
WY TX IL OH IA ND OR LA FL MI
MS CO AL SD PA KY NJ
MO IN NY WI
MD
WA KS CT VA WV OK MA
NM MT
MN AZ
AR ME
TN DC UT SC NC
GA CA RI NH HI VT DE ID AK
States achieving 25% reduction goal States achieving 30% reduction goal States achieving 15% reduction goal Goal not met
Source: CMS Nursing Home Compare (one quarter average).
Note: AHCA membership as of October 2014.
Increase Staff Stability
Studies have found that higher levels of turnover in SNCCs are asso-ciated with lower quality of care (Castle & Anderson, 2011). The largest national source of nursing care center turnover and retention data is the Nursing Facility Staffing Survey conducted by AHCA. The survey is distributed to all nursing care centers in the United States, regardless of AHCA membership, and measures turnover and reten-tion from the prior year. Survey responses can be submitted elec-tronically or via hard copy. More than 4,000 SNCCs participated in the most recent survey, reporting data for calendar year 2013. This survey measures turnover by dividing the number of staff who left (voluntarily or otherwise) in a given year by the total number of cur-rent employees at the end of the calendar year. Retention is mea-sured by dividing the number of employees who have worked in the center for at least 12 months by the total number of employees at the end of the calendar year.
In 2013, median turnover rates for all staff and direct care staff were lower than in 2011. Additionally, median turnover rates for the direct care staff categories of RN, LPN and CNA were lower in 2013 than 2011 (Table 1.2).
REDUCTION IN OFF-LABEL USE OF ANTIPSYCHOTICSAs of 2014, 43 states have exceeded the 2014 goal of a 15 percent reduction. Nine states have achieved the 2016 goal of a 30 percent reduction compared to their 2011 rates.
States achieving the 2014 goal of 15% reduction
States achieving the 2015 goal of 25% reduction
States achieving the 2016 goal of 30% reduction
Goal not met
AHCA QUALITY REPORT | AMERICAN HEALTH CARE ASSOCIATION MEMBERS
6

TABLE 1.2
AHCA MEMBER MEDIAN TURNOVER RATES
2011 2012 2013
All Staff 45.1% 45.2% 40.6%
Direct Care Staff 50.0% 51.4% 44.4%
RN 50.0% 50.0% 44.4%
LPN 36.8% 37.5% 30.8%
CNA 51.9% 52.4% 45.8%
Source: Nursing Facility Staffing Survey conducted by AHCA.
Note: AHCA membership as of October 2014.
In 2013, median retention rates also improved for all staff, direct care staff, LPNs and CNAs from those in 2011, and stayed the same for RNs (Table 1.3).
TABLE 1.3
AHCA MEMBER MEDIAN RETENTION RATES
2011 2012 2013
All Staff 71.5% 71.0% 73.1%
Direct Care Staff 68.7% 67.8% 70.0%
RN 66.7% 66.7% 66.7%
LPN 75.0% 74.1% 76.0%
CNA 68.3% 67.5% 69.6%
Source: Nursing Facility Staffing Survey conducted by AHCA.
Note: AHCA membership as of October 2014.
Increase Customer Satisfaction
Measuring customer satisfaction enables SNCCs to gain essential insight into their performance in offering quality of care and quality of life from the perspective of the individuals they serve and their families. There is no single customer satisfaction survey that is con-sistently used in the long term and post-acute care field. As there is no one commonly used survey, AHCA lacks the data to allow mea-surement of progress on this goal across all members.
To address this, AHCA’s Customer Experience Committee—in con-junction with Dr. Nicholas Castle from the University of Pittsburgh—has developed the CoreQ, a set of three questions for long-stay residents and family members and an additional fourth question for individuals discharged following short-stay rehabilitation care.
These two questionnaires along with the resulting quality measure (percent of respondents who are satisfied) have been pilot tested and validated. AHCA is in the process of submitting the measure based on the CoreQ questionnaire to NQF for endorsement. Several satisfaction vendors are also adding these questions to their ques-tionnaires, which will allow for national benchmarking in the future.
CoreQ Questions and Rating Scales
CoreQ—Short-Stay Discharge
1. In recommending this facility to your friends and family, how would you rate it overall?
1 Poor 2 Average 3 Good 4 Very Good 5 Excellent
2. Overall, how would you rate the staff?
1 Poor 2 Average 3 Good 4 Very Good 5 Excellent
3. How would you rate the care you receive?
1 Poor 2 Average 3 Good 4 Very Good 5 Excellent
4. How would you rate how well your discharge needs were met?
1 Poor 2 Average 3 Good 4 Very Good 5 Excellent
CoreQ—Long-Stay Residents and/or Long-Stay Family Members
1. In recommending this facility to your friends and family, how would you rate it overall?
1 Poor 2 Average 3 Good 4 Very Good 5 Excellent
2. Overall, how would you rate the staff?
1 Poor 2 Average 3 Good 4 Very Good 5 Excellent
3. How would you rate the care you receive?*
1 Poor 2 Average 3 Good 4 Very Good 5 Excellent
*The question for family members is “How would you rate the care your family member received?”
AMERICAN HEALTH CARE ASSOCIATION MEMBERS | AHCA QUALITY REPORT
7

AHCA PROGRAMS TO ADVANCE PERFORMANCEAHCA provides its members resources to help improve the quality of care they provide. Two of these are highlighted below.
LTC Trend Tracker
LTC Trend Trackersm is an exclusive web-based tool for members that allows them to access key information that can help their organizations succeed (Figure 1.5.). It offers important metrics not found elsewhere such as an MDS-based, risk adjusted readmis-sions measure (PointRight® Pro 30™), discharge back to the com-munity and length of stay measures. Additionally, members can use prediction tools to identify changes to their Five-Star Quality Rating System performance, search for Resource Utilization Group (RUG) information and keep track of their quality improvement. LTC Trend Trackersm allows the creation of custom reports, and offers member centers options to choose their peer group comparisons so that they can individualize analysis to meet their performance improve-ment needs.
FIGURE 1.5
INFORMATION AVAILABLE ON LTC TREND TRACKER
Data Available
Survey History
Resident Characteristics
Staffing Information
AHCA Post-Acute Measures
CMS Five-Star Rating
AHCA/NCAL National Quality Award Program
The AHCA/NCAL National Quality Award Program is a progressive, three-step pro-gram based on the nationally recognized Baldrige Performance Excellence crite-ria. Members can apply for recognition at the Bronze, Silver and Gold levels. As an organization progresses through the levels, applicants must showcase a more detailed and comprehensive demonstration of systematic quality performance and organiza-tional effectiveness.
The program is a member of the Alliance for Performance Excellence, an association of the 33 recognized Baldrige-based award programs in the nation. The AHCA/NCAL program is the largest of these programs, with a volume of applications that exceeds the combined total of all the other 32 programs and the National Baldrige program. From 2010–2013, the state and national Baldrige programs received a total of 691 applications; whereas, in the same timeframe, the AHCA/NCAL Quality Award Program received 3,946 applications.
As of the 2014 award cycle, 2,988 members have achieved the Bronze Award, 365 members have achieved the Silver Award, and 24 members have achieved the Gold Award. These members are well suited to meet the forthcoming regulatory requirements of Quality Assurance and Performance Improvement (QAPI), mandated for implementation in SNCCs by the Affordable Care Act (ACA), due to the parallels that exist between the criteria of the Quality Award Program and the five elements of QAPI. Both QAPI and the Quality Award Program utilize a systematic approach to organizational per-formance and focus on leadership, responding to staff and custom-ers, and demonstrating results (Kaldy, 2013).
Research demonstrates that AHCA/NCAL Gold and Silver Quality Award recipients have better outcomes than other AHCA mem-bers. For instance, Silver and Gold Award recipients from 2012–2014 have lower rates of readmissions and antipsychotic use (Figures 1.6 and 1.7).
AHCA QUALITY REPORT | AMERICAN HEALTH CARE ASSOCIATION MEMBERS
8

FIGURE 1.6
TREND IN AVERAGE RISK-ADJUSTED REHOSPITALIZATION RATE FOR SILVER AND GOLD QUALITY AWARD RECIPIENTS AND ALL OTHER MEMBERS
All Other AHCA Members Silver and Gold
20%
18%
16%
14%2011 Q4 2012 Q1 2012 Q2 2012 Q3 2012 Q4 2013 Q1 2013 Q2 2013 Q3 2013 Q4 2014 Q1 2014 Q2
Source: CMS MDS data based on PointRight® Pro 30™ measure.
Note: Silver and Gold Quality Award Recipients (2012–2014). AHCA membership as of October 2014.
FIGURE 1.7
TREND IN AVERAGE RATE OF OFF-LABEL USE OF ANTIPSYCHOTICS FOR SILVER AND GOLD QUALITY AWARD RECIPIENTS AND ALL OTHER MEMBERS
25%
23%
21%
19%
17%
15%2011 Q4 2012 Q1 2012 Q2 2012 Q3 2012 Q4 2013 Q1 2013 Q2 2013 Q3 2013 Q4 2014 Q1 2014 Q2
All Other AHCA Members Silver and Gold
Source: CMS Nursing Home Compare (one quarter average).
Note: Silver and Gold Quality Award Recipients (2012–2014). AHCA membership as of October 2014.
AMERICAN HEALTH CARE ASSOCIATION MEMBERS | AHCA QUALITY REPORT
9

Silver and Gold recipients also have better performance on CMS’ Five-Star Quality Rating System than other AHCA/NCAL members. For instance, in 2014 35.9 percent of Silver and Gold recipients from
2012–2014 had a 5-star rating compared to 29.8 percent of other members (Figure 1.8).
FIGURE 1.8
TREND IN FIVE-STAR OVERALL RATING FOR SILVER AND GOLD QUALITY AWARD RECIPIENTS AND ALL OTHER MEMBERS
100%
80%
60%
40%
20%
0%2009 2010 2011 2012 2013 2014 2009 2010 2011 2012 2013 2014
1 Star 2 Star 3 Star 4 Star 5 Star
Silver and Gold All Other AHCA Members
11.8%19.0% 14.6% 14.3% 12.4% 8.8% 7.3%3.1%3.6%7.7%8.2%6.2%
19.0%20.5%
20.5% 19.8% 19.7% 20.1% 19.8%20.0%19.0%15.4%19.5%19.0%
17.4%
21.1%21.2% 21.3% 20.4%
18.6% 17.0%14.4%15.4%14.9%
17.4%20.5%
29.2%
26.3%28.0% 28.0% 28.0%
27.0%26.0%
26.7%31.8%
40.5%31.3%30.3%
22.6%13.1% 15.6% 16.6% 19.6% 25.4% 29.8%35.9%30.3%
21.5%23.6%24.1%
Source: CMS Nursing Home Compare, October data for each year.
Note: Silver and Gold Quality Award Recipients (2012–2014). AHCA membership as of October 2014.
Lastly, on average Silver and Gold recipients (2012–2014) also tend to have a higher occupancy rate than other AHCA/NCAL members. This serves as evidence that a focus on quality can translate into better business outcomes. In the first quarter of 2014, Silver and
Gold recipients (2012–2014) had an average occupancy rate of 86.1 percent compared to the 82.6 percent occupancy rate of other members (Figure 1.9).
FIGURE 1.9
TRENDS IN OCCUPANCY RATE FOR SILVER AND GOLD QUALITY AWARD RECIPIENTS AND ALL OTHER MEMBERS
100%
95%
90%
85%
80%2009 Q1 2010 Q1 2011 Q1 2012 Q1 2013 Q1 2014 Q1
All Other AHCA Members Silver and Gold
Source: CMS CASPER Data, March of each year.
Note: Silver and Gold Quality Award Recipients (2012–2014). AHCA membership as of October 2014.
AHCA QUALITY REPORT | AMERICAN HEALTH CARE ASSOCIATION MEMBERS
10
TRENDS IN QUALITY
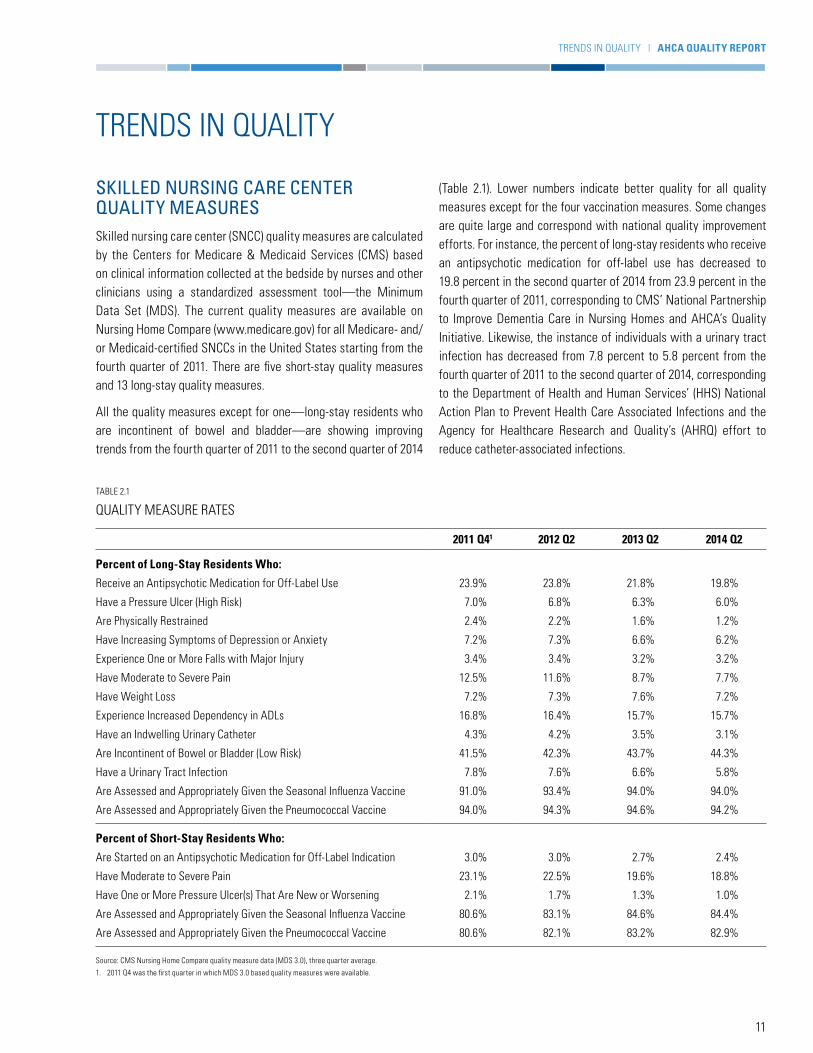
SKILLED NURSING CARE CENTER QUALITY MEASURESSkilled nursing care center (SNCC) quality measures are calculated by the Centers for Medicare & Medicaid Services (CMS) based on clinical information collected at the bedside by nurses and other clinicians using a standardized assessment tool—the Minimum Data Set (MDS). The current quality measures are available on Nursing Home Compare (www.medicare.gov) for all Medicare- and/or Medicaid-certified SNCCs in the United States starting from the fourth quarter of 2011. There are five short-stay quality measures and 13 long-stay quality measures.
All the quality measures except for one—long-stay residents who are incontinent of bowel and bladder—are showing improving trends from the fourth quarter of 2011 to the second quarter of 2014
(Table 2.1). Lower numbers indicate better quality for all quality measures except for the four vaccination measures. Some changes are quite large and correspond with national quality improvement efforts. For instance, the percent of long-stay residents who receive an antipsychotic medication for off-label use has decreased to 19.8 percent in the second quarter of 2014 from 23.9 percent in the fourth quarter of 2011, corresponding to CMS’ National Partnership to Improve Dementia Care in Nursing Homes and AHCA’s Quality Initiative. Likewise, the instance of individuals with a urinary tract infection has decreased from 7.8 percent to 5.8 percent from the fourth quarter of 2011 to the second quarter of 2014, corresponding to the Department of Health and Human Services’ (HHS) National Action Plan to Prevent Health Care Associated Infections and the Agency for Healthcare Research and Quality’s (AHRQ) effort to reduce catheter-associated infections.
TABLE 2.1
QUALITY MEASURE RATES
2011 Q41 2012 Q2 2013 Q2 2014 Q2
Percent of Long-Stay Residents Who:
Receive an Antipsychotic Medication for Off-Label Use 23.9% 23.8% 21.8% 19.8%
Have a Pressure Ulcer (High Risk) 7.0% 6.8% 6.3% 6.0%
Are Physically Restrained 2.4% 2.2% 1.6% 1.2%
Have Increasing Symptoms of Depression or Anxiety 7.2% 7.3% 6.6% 6.2%
Experience One or More Falls with Major Injury 3.4% 3.4% 3.2% 3.2%
Have Moderate to Severe Pain 12.5% 11.6% 8.7% 7.7%
Have Weight Loss 7.2% 7.3% 7.6% 7.2%
Experience Increased Dependency in ADLs 16.8% 16.4% 15.7% 15.7%
Have an Indwelling Urinary Catheter 4.3% 4.2% 3.5% 3.1%
Are Incontinent of Bowel or Bladder (Low Risk) 41.5% 42.3% 43.7% 44.3%
Have a Urinary Tract Infection 7.8% 7.6% 6.6% 5.8%
Are Assessed and Appropriately Given the Seasonal Influenza Vaccine 91.0% 93.4% 94.0% 94.0%
Are Assessed and Appropriately Given the Pneumococcal Vaccine 94.0% 94.3% 94.6% 94.2%
Percent of Short-Stay Residents Who:
Are Started on an Antipsychotic Medication for Off-Label Indication 3.0% 3.0% 2.7% 2.4%
Have Moderate to Severe Pain 23.1% 22.5% 19.6% 18.8%
Have One or More Pressure Ulcer(s) That Are New or Worsening 2.1% 1.7% 1.3% 1.0%
Are Assessed and Appropriately Given the Seasonal Influenza Vaccine 80.6% 83.1% 84.6% 84.4%
Are Assessed and Appropriately Given the Pneumococcal Vaccine 80.6% 82.1% 83.2% 82.9%
Source: CMS Nursing Home Compare quality measure data (MDS 3.0), three quarter average.
1. 2011 Q4 was the first quarter in which MDS 3.0 based quality measures were available.
TRENDS IN QUALITY | AHCA QUALITY REPORT
11

FIVE-STAR RATINGThe CMS Five-Star Quality Rating System was incorporated into CMS’ Nursing Home Compare web-based consumer information system in 2008. The system provides a rating from one star (lower quality) through five stars (higher quality) for each of the following areas: health inspections, staffing and quality measures, as well as an overall aggregate rating combining all three areas. From 2009 to 2014, the proportion of SNCCs receiving five stars has increased from 13 percent to 28 percent. At the same time, the proportion of SNCCs receiving one star has decreased from 21 percent to 9 per-cent (Figure 2.1). However, starting in early 2015 CMS plans to rebase the scoring for the Five-Star Rating System, which will result in an abrupt change with a decrease in the proportion of SNCCs receiving four or five stars and an increase in those receiving one or two stars. This will occur not because of a change in quality but due to CMS’ rebasing of the scoring cut points.
FIGURE 2.1
TRENDS IN SKILLED NURSING CARE CENTER OVERALL FIVE-STAR RATINGS
100%
80%
60%
40%
20%
0%2009 2010 2011 2012 2013 2014
1 Star 2 Star 3 Star 4 Star 5 Star
21%
21%
21%
25%
13%
16%
21%
21%
27%
15%
9%
20%
17%
26%
28%
11%
21%
18%
26%
24%
14%
20%
21%
26%
19%
16%
20%
21%
27%
16%
Source: CMS Nursing Home Compare; October of each year.
Improvements in quality measures noted in Table 2.1 translate into a significant increase in the proportion of centers receiving four or five stars for the Quality Measures Component on CMS’ Five-Star Quality Rating System, while those receiving one or two stars has decreased significantly (Figure 2.2). In October 2014, 44 percent of SNCCs had a 5-star rating for this component, com-pared to the 11 percent that had a 5-star rating in 2009. From 2011 to 2012, CMS froze every SNCC’s quality measure rating as they transitioned from MDS 2.0 to MDS 3.0, which provides the clinical information used to calculate each quality measure.
Starting in July 2012, CMS set and maintained cut points to achieve each level of star rating. Knowing the cut points to achieve the rating allowed SNCCs to set targets for improvement and resulted in dramatic improvements, as seen in Figure 2.2, consistent with the academic literature on the power of setting targets to drive improvement in healthcare.
FIGURE 2.2
TRENDS IN SKILLED NURSING CARE CENTER STAR RATINGS FOR THE QUALITY MEASURE COMPONENT OF FIVE-STAR
100%
80%
60%
40%
20%
0%2009 2010 2011 2012 2013 2014
1 Star 2 Star 3 Star 4 Star 5 Star
16%
21%
24%
27%
11%
12%
19%
24%
30%
16%
2%6%14%
34%
44%
3%9%
17%
36%
35%
8%
16%
23%
33%
20%
11%
18%
24%
31%
16%
Source: CMS Nursing Home Compare; October of each year.
REGULATORY COMPLIANCE MEASURESFederal law requires that SNCCs that are Medicare- and/or Medicaid-certified comply with the requirements that are present in 42 CFR Part 483, Subpart B. To assess this compliance, SNCCs are inspected by state surveyors who are contracted by CMS. These inspections are conducted unannounced annually and are referred to as “standard surveys.” Each Medicare- and/or Medicaid-certified center is required to have a standard survey conducted at least once every nine to 15 months. If a complaint is lodged against the nursing center or the SNCC self-reports a potentially bad out-come (e.g., a fall), a focused survey, referred to as a “complaint survey,” may also be conducted at a separate time from the stan-dard survey. A citation is given to the center during a survey if it fails to comply with any of the 174 different regulatory require-ments, referred to as “F-tags.” Each citation is rated based on the scope of the deficiency (e.g., how common the deficiency is) and its severity (e.g., how much potential or actual harm may occur). Certain citations are classified as Substandard Quality of Care (SQC). These citations are for deficiencies in the regulatory catego-ries of resident behavior and center practices, quality of life or
AHCA QUALITY REPORT | TRENDS IN QUALITY
12

quality of care that are also rated as more severe, such as immedi-ate jeopardy; or a pattern of widespread actual harm; or a wide-spread potential for more than minimal harm. Points are assigned
for each deficiency, which CMS uses to calculate a survey score that is used in the Five-Star Quality Rating System (Table 2.2).
TABLE 2.2
HEALTH INSPECTION SCORE: WEIGHTS FOR DIFFERENT TYPES OF DEFICIENCIES
Severity
Scope
Isolated Pattern Widespread
Immediate Jeopardy to Resident Health or Safety J50 points*(75 points)
K100 points*(125 points)
L150 points*(175 points)
Actual Harm That Is Not Immediate Jeopardy G20 points
H35 points(40 points)
I45 points(50 points)
No Actual Harm with Potential for More Than Minimal Harm That Is Not Immediate Jeopardy
D4 points
E8 points
F16 points
(20 points)
No Actual Harm with Potential for Minimal Harm A0 points
B0 points
C0 points
Note: Figures in parentheses indicate points for deficiencies that are for substandard quality of care. Shaded cells denote deficiency scope/severity levels that constitute substandard quality of care if the requirement that is not met is one that falls under the following federal regulations: 42 CFR 483.13 resident behavior and nursing home practices; 42 CFR 483.15 quality of life; 42 CFR 483.25 quality of care.
Table 2.3 shows that from 2009 to 2012, the average total number of survey citations in SNCCs steadily decreased and has since remained essentially unchanged through 2014. Similarly, the per-cent of SNCCs with citations at scope and severity level G or above, with SQC citations or with citations classified as posing immediate jeopardy (IJ) to residents also decreased from 2009 to 2012 and then remained essentially unchanged through 2014.
The percent of SNCCs that have had citation-free standard and complaint surveys has increased from 2009 to 2014, going from 6.2 percent to 8.3 percent (Figure 2.3). Because CMS fixes the distribution of SNCCs receiving one to five stars on the survey component in the Five-Star Quality Rating System, these improve-ments in deficiencies cited by CMS are not apparent in the 5-star ratings.
TABLE 2.3
TRENDS IN SKILLED NURSING CARE CENTER CITATIONS
2009 2010 2011 2012 2013 2014
Average Number of Deficiency Citations in Nursing Centers 8.8 8.3 7.8 7.0 7.3 7.2
Percent of Nursing Centers Cited at Level “G” or Above 25.2% 22.7% 21.7% 17.5% 17.6% 17.3%
Percent of Nursing Centers with Substandard Quality of Care Citations 7.1% 6.4% 6.1% 5.0% 5.1% 5.1%
Percent of Nursing Centers with Immediate Jeopardy Citations 6.1% 5.3% 5.5% 4.2% 4.4% 4.5%
Source: CMS CASPER, March of each year. Standard and Complaint Health Survey Data.
TRENDS IN QUALITY | AHCA QUALITY REPORT
13

FIGURE 2.3
PERCENT OF STANDARD HEALTH/COMPLAINT SURVEY CITATION-FREE SKILLED NURSING CARE CENTERS
10%
9%
8%
7%
6%
5%2009 2010 2011 2012 2013 2014
Source: CMS CASPER, March of each year. Standard and Complaint Health Survey Data.
Adverse events and patient safety issues are also an important quality metric gaining national attention in SNCCs. Table 2.4 reports on trends in specific citations for three safety-related deficiencies. In the six-year time period reported, the frequency of centers with-out a medication error citation steadily increased, with a small drop
in 2014 to 90.3 percent. In other words, 90 percent of centers did not have a citation for medication error in 2014. However, the number of nursing centers free of citations for use of unnecessary drugs and infection control has dropped since 2009.
TABLE 2.4
TRENDS IN SKILLED NURSING CARE CENTER SAFETY MEASURES
2009 2010 2011 2012 2013 2014
Percent of Centers without a Medication Error Citation 88.9% 89.1% 90.3% 91.5% 91.8% 90.3%
Percent of Centers without an Unnecessary Drug Citation 79.9% 79.5% 79.9% 79.9% 79.4% 74.9%
Percent of Centers without an Infection Control Citation 79.3% 74.9% 62.8% 60.4% 59.7% 61.4%
Source: CMS CASPER, March of each year. Standard and Complaint Health Survey Data.
WORKFORCEThe SNCC workforce consists of individuals from many professions, including CNAs, LPNs, RNs, nurses with administrative duties (ARNs), nurse practitioners, therapists, dietary staff, social workers, housekeeping personnel, social services staff, activity professionals and administrative workers. In 2013, SNCCs employed a total of 1,656,760 individuals (United States Department of Labor, Bureau of Labor Statistics, 2013).
AHCA QUALITY REPORT | TRENDS IN QUALITY
14

SKILLED NURSING CARE CENTER STAFFINGCMS collects information on actual staffing hours worked during the two-week period prior to their unannounced annual survey inspection. CMS uses this data combined with data on the residents in each SNCC to calculate and report the hours per resident per day. During the period from 2009 through 2014, the direct care nursing hours per resident day have steadily increased at all levels of nurs-ing staff (Figure 2.4). For instance, RN hours per resident day have increased from 0.32 in 2009 to 0.46 in 2014. This is a positive trend, as research has demonstrated that staffing is associated with the quality of care in SNCCs and correlates with the trends we see of improvements in survey deficiencies and quality measures. For instance, a 2011 study shows that every additional hour of CNA staffing per resident day is associated with a 10 percent decrease in the total deficiency score of a center. A six-minute increase is asso-ciated with a 3 percent decrease in the quality of care deficiency score. Conversely, a one-hour decrease in CNA staffing per resident day is associated with a 33 percent increase in quality of care defi-ciencies (Hyer et al., 2011).
The staffing component of the Five-Star Quality Rating System is based on the number of RN hours per resident day and the number of total nursing hours per resident day (including RNs, LPNs and CNAs). The staffing measures are adjusted to account for varia-tions in the acuity of residents in different nursing care centers (Abt Associates, 2013). As shown in Figure 2.5 the percent of nurs-ing care centers receiving the top ratings of four or five stars in the staffing component has steadily increased since 2009. In 2009, 40 percent of centers received either four or five stars, compared to 56 percent that received those ratings in 2014. The converse trend of decreases in one and two stars also holds true. In 2009, 40 percent of centers had one or two stars, compared to only 25 percent in 2014.
FIGURE 2.4
TRENDS IN DIRECT CARE NURSING STAFF HOURS PER RESIDENT DAY
3.0
2.5
2.0
1.5
1.0
0.5
0.02009 2010 2011 2012 2013 2014
RN LPN CNAs
0.32
0.81
2.35 2.40
0.83
0.36 0.39
0.82
2.24 2.
420.
830.
42 0.44
0.82
2.42 2.44
0.83
0.46
Source: CMS CASPER Data, March of each year.
FIGURE 2.5
TRENDS IN SKILLED NURSING CARE CENTER STAR RATINGS FOR THE STAFFING COMPONENT OF FIVE-STAR
100%
80%
60%
40%
20%
0%2009 2010 2011 2012 2013 2014
1 Star 2 Star 3 Star 4 Star 5 Star
21%
19%
20%
33%
7%
16%
18%
21%
37%
8%
11%
14%
19%
44%
12%
12%
15%
20%
42%
10%
13%
16%
21%
41%
10%
14%
17%
21%
39%
9%
Source: CMS Nursing Home Compare; October of each year.
Since 2009, the proportion of skilled nursing care centers receiving a 5-star rating in the staffing component has increased from 7 percent to 12 percent, an increase of more than 70 percent.
20142009
7%
MORE THAN
70%INCREASE
12%
STAFFING COMPONENT
TRENDS IN QUALITY | AHCA QUALITY REPORT
15

REFERENCES
Abt Associates (2013). Nursing Home Compare Five-Star Quality Rating System: Year Three Report. Retrieved from http://www.cms.gov/Medicare/Provider-Enrollment-and-Certification/CertificationandComplianc/Downloads/FSQRS-Report.pdf
American Health Care Association (2013). 2013 AHCA Quality Report. Retrieved from http://www.ahcancal.org/qualityreport/Documents/AHCA_2013QR_ONLINE.pdf
Ballard, C. G., Waite, J., & Birks, J. (2006). Atypical antipsychotics and psychosis in Alzheimer’s disease. Cochrane Database of Systematic Reviews. Retrieved from http://onlinelibrary.wiley.com/doi/10.1002/14651858.CD003476.pub2/full
Castle, N. G., & Anderson, R. A. (2011). Caregiver staffing in nursing homes and their influence on quality. Medical Care, 49(6), 545–552.
Hyer, K., Thomas, K. S., Branch, L. G., Harman, J. S., Johnson, C. E., & Weeck-Maldonado, R. (2011). The influence of nursing staffing levels on quality of care in nursing homes. The Gerontologist. Retrieved from http://www.ncbi.nlm.nih.gov/pmc/articles/PMC3218638/
Improving Medicare Post-Acute Care Transformation (IMPACT) Act of 2014 (H.R. 4994; Pub.L. 113–185).
Kaldy, J. (2013, June). QAPI: Weaving the old with the new. Provider, 39(6), 24–36. Retrieved from http://www.providermagazine.com/archives/2013_Archives/Pages/0613/QAPI-Weaving-The-Old-With-The-New.aspx
Maher, A. R., Maglione, M., Bagley, S., Suttorp, M., Hu, J., Ewing, B., …Shekelle, P. G. (2011). Efficacy and comparative effectiveness of atypical antipsychotic medications for off-label uses in adults. JAMA, 306, 1359–1369.
Protecting Access to Medicare Act of 2014 (H.R. 4302; Pub.L. 113–93).
U.S. Department of Labor, Bureau of Labor Statistics (2013). National Industry-Specific Occupational Employment Estimates. Retrieved from http://www.bls.gov/oes/current/oessrci.htm
AHCA QUALITY REPORT | REFERENCES
16

DATA SOURCE DESCRIPTIONS
Minimum Data Set (MDS) 3.0: The MDS is a comprehensive, standardized assessment instrument completed by the nursing center staff for every resident on admission and at regular inter-vals during each person’s stay. The assessment includes the resi-dent’s physical, cognitive, emotional and clinical conditions and abilities; care needs; preferences; and life care choices. Nursing center staff use the assessment to develop a plan of care for each resident. Information collected using the MDS assessment is also used to determine payment rates for all Medicare stays and in many state Medicaid programs. The data are also used to gener-ate quality measures. The data collected using the MDS is housed in a national database.
CMS Nursing Home Compare (Five-Star Quality Rating System): The overall 5-star rating includes the following domains: (1) health inspections, (2) direct care staffing and (3) MDS-based quality measures. The ratings are updated on a monthly basis with any new data generated as a result of recent annual, complaint and revisit health inspections, and on a quarterly basis with new quality measure data.
Health Inspections Domain: A health inspection score is cal-culated based on points assigned to deficiencies identified during a nursing center’s most recent and two prior annual health inspections, referred to as surveys, as well as any defi-ciency findings resulting from surveys conducted based on com-plaints over the most recent three years and during revisit sur-veys, conducted to verify resolution of previously identified deficiencies. More weight is placed on recent inspections in calculating a rating.
Staffing Domain: The staffing domain is based on two mea-sures: (1) registered nurse hours per resident day and (2) total staffing hours per resident day. Total staffing hours include reg-istered nurses, licensed practical nurses/licensed vocational nurses and certified nursing assistants. The rating is adjusted to account for the acuity of residents being served in the center. The data for this domain are derived from a report centers are required to complete and submit to state surveyors at the time of their annual health inspection.
Quality Measure Domain: The quality measure domain is based on nine of the 18 quality measures that are currently on the Nursing Home Compare website, which can be found at www.medicare.gov. These include seven measures specific to long-stay residents and two specific to short-stay residents. Quality measure data are updated quarterly in January, April, July and October. The nursing home quality measures are calcu-lated using the MDS resident assessment data that nursing homes routinely collect about residents at specified intervals during their stay (see above description of MDS 3.0). These mea-sures capture specific care processes and clinical outcomes.
Nursing Facility Staffing Survey: The survey is conducted annu-ally by AHCA to collect retention and turnover information for all nursing center employees, including administrative and manage-ment, nursing, therapy, food services, housekeeping and mainte-nance, and social services and activities staff. All federally certified nursing homes in the nation are invited to participate in this survey, regardless of AHCA membership.
CMS Certification and Survey Provider Enhanced Reporting (CASPER): This database includes information on resident census, staffing, health and life safety deficiency citations, as well as com-plaint investigations for all Medicare- and Medicaid-certified nurs-ing centers in the nation. Onsite inspections, referred to as stan-dard surveys, are conducted by state agencies and are required by federal law for each nursing center. Each skilled nursing care center is surveyed every nine to 15 months, and each state agency must average 12 months between the surveys for all of the nursing cen-ters in their state.
PointRight® Pro 30™: PointRight’s risk-adjusted measure of 30-day, all-cause reshopitalizations from skilled nursing facilities is calculated using data from MDS 3.0 assessments over a 12-month period. The rehospitalization measure was developed by PointRight, validated by Brown University and endorsed by the National Quality Forum. AHCA has adopted the measure for our use and for distribu-tion to members. Admission assessments are used to generate the denominator (admissions from acute care hospitals) and 33 vari-ables used in risk adjustment, while discharge assessments are used to determine the numerator (returns to the hospital).
DATA SOURCE DESCRIPTIONS | AHCA QUALITY REPORT
17

THE AMERICAN HEALTH CARE ASSOCIATION1201 L Street, NW | Washington, DC 20005 | www.ahcancal.org