
2013 overall results
12
2013 NC and SC Festivals and Events Planner Survey Wayne W. Smith, Ph.D.
-
Upload
wayne-smith -
Category
Education
-
view
759 -
download
0
Transcript of 2013 overall results

2013 NC and SC Festivals and Events Planner Survey
Wayne W. Smith, Ph.D.

Introduction
• Purpose: Gain a better understanding of festivals and events in NC and SC• General Questions: Size, Type• Financial: Budgetary Issues, Revenues• Operational: Partnerships, Trends and Support

Item 2008 2009 2010 2011 2012 2013
Avg. Attendance 29,860 28,473 30,000 31,833 25,376 29,725
Avg. Length 3.5 2.8 3.3 2.5 2.4 2.9
Avg. Attendance per Day 8,531 10,169 9,646 12,247 10,573 10,250
Est. Total Number of Festivals
853 794 778 758 725 750
Overview Statistics

Attendance
08-09 09-10 10-11 11-12 12-13
Avg. Attendance -4.9% 5.1% 5.8% -25.4% 14.6%
Avg. Attendance per Day 16.1% -5.4% 21.2% -15.8% -3.2%
-30.0%
-20.0%
-10.0%
0.0%
10.0%
20.0%
30.0%
Pe
rce
nta
ge
of
Ch
ang
e
Average Attandence Change

Item 2008 2009 2010 2011 2012 2013
FTE Employees(Avg.)
N/A 2,058(3.6)
2,100(2.7)
2,274(3.0)
2030(2.8)
2,250(3.0)
Volunteers (Avg.) N/A 25,302(31.9)
38,511(49.5)
30,016(39.6)
21,750(30.0)
30,000(40.0)
Board members(Avg.)
N/A 7,940(10.0)
8,169(10.5)
8,944(11.8)
6,742(9.3)
6,675(8.9)
Total Human Resources(Avg.)
N/A 36,127(45.5)
48,781(62.7)
41,235(54.4)
30,523(42.1)
38,925(51.9)
Human Resources
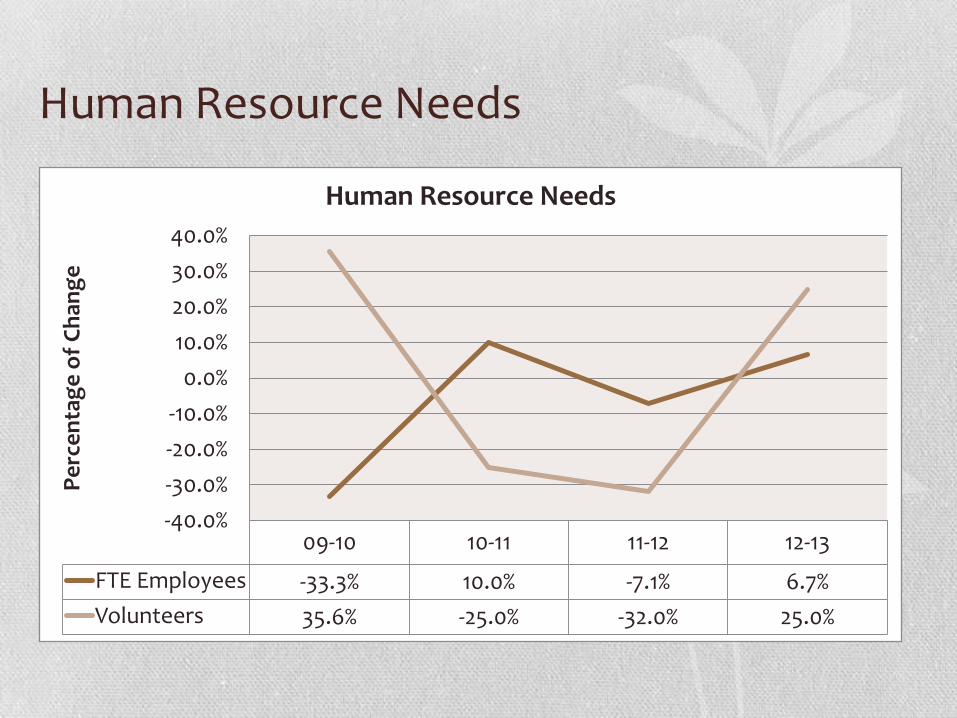
Human Resource Needs
09-10 10-11 11-12 12-13
FTE Employees -33.3% 10.0% -7.1% 6.7%
Volunteers 35.6% -25.0% -32.0% 25.0%
-40.0%
-30.0%
-20.0%
-10.0%
0.0%
10.0%
20.0%
30.0%
40.0%
Pe
rce
nta
ge
of
Ch
ang
e
Human Resource Needs
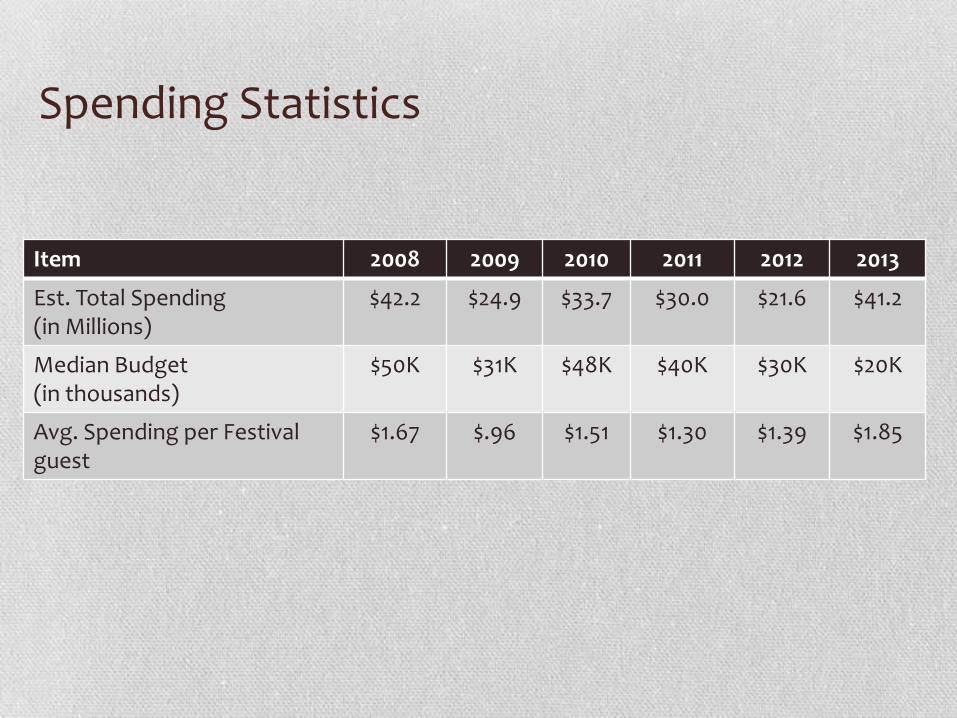
Item 2008 2009 2010 2011 2012 2013
Est. Total Spending(in Millions)
$42.2 $24.9 $33.7 $30.0 $21.6 $41.2
Median Budget (in thousands)
$50K $31K $48K $40K $30K $20K
Avg. Spending per Festival guest
$1.67 $.96 $1.51 $1.30 $1.39 $1.85
Spending Statistics

Item 2008 2009 2010 2011 2012 2013
Police 83% 71% 65% 81% 79% 65%
Park
Services45 % 38% 39% 38% 41% 40%
Fire 63% 54% 55% 70% 70% 56%
EMS 75% 61% 65% 67% 70% 49%
Trash 76% 70% 69% 75% 75% 67%
Venue N/A 57% 65% 63% 62% 65%
Access to Resources

Last Year Versus Next Year
Budget Vendors Sponsors Renvenue Ticket Prices Attendance
Actual Last year 31% 34% 41% 55% 13% 53%
Anticipate Next Year 45% 51% 49% 43% 19% 62%
0%
10%
20%
30%
40%
50%
60%
70%
Pe
rce
nta
ge
Re
po
rtin
g/
Ex
pe
ctin
g In
cre
ase

Figure 1: 2009 Trends
Figure 2: 2011 Trends
Figure 3: 2011 Trends
Figure 4: 2012 Trends
Trends
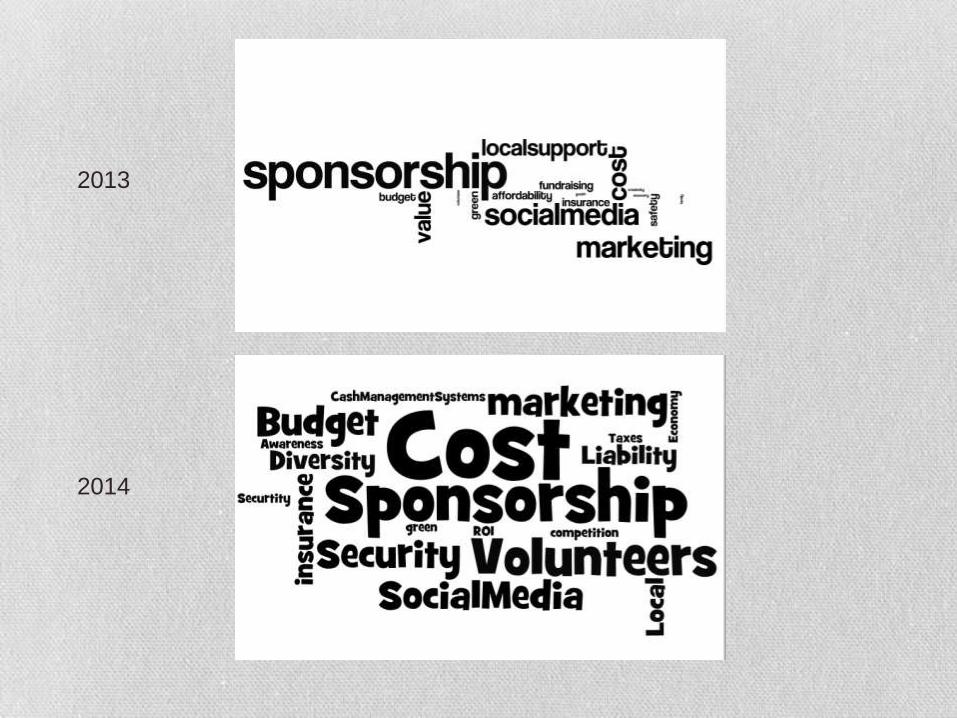
2013
2014