Roche - Solid overall results
28
Media Release F. Hoffmann-La Roche Ltd 4070 Basel Switzerland Group Communications Roche Group Media Relations Tel. +41 61 688 88 88 Fax +41 61 688 27 75 www.roche.com 1/28 Basel, 2 February 2011 Solid overall results Mid-single digit sales growth in local currencies excluding Tamiflu Strong profit growth Promising late stage pharmaceutical pipeline of twelve new molecular entities Group • Group sales increase 5% in local currencies, excluding Tamiflu; including Tamiflu, Group sales remain stable in local currencies at 47.5 billion Swiss francs. • Growth momentum maintained throughout 4 th quarter due to continued uptake for Actemra, Herceptin, MabThera and immunoassays. • Core operating profit increases 7% in local currencies to 16.6 billion Swiss francs, core operating profit margin up by 1.7 percentage points to 34.9%; operating free cash flow of 14.1 billion Swiss francs underscores financial strength. • Net income increases 4% to 8.9 billion Swiss francs despite significant costs in connection with the ‘Operational Excellence’ initiative. • Core Earnings per Share 10% higher at constant exchange rates and 4% higher in Swiss francs. • Implementation of Operational Excellence on track; Group-wide review of structures and processes aims to accelerate productivity improvements and strengthen innovation capacity; cost savings of 2.4 billion Swiss francs from 2012 onwards; restructuring charges of 2.7 billion Swiss francs, of which 1.3 billion Swiss francs were included in the 2010 operating results. • Board proposes a dividend increase of 10% to 6.60 Swiss francs, the 24 th consecutive year of dividend growth; this would increase the payout ratio to 52%. Key figures In millions of CHF % change As % of sales 2010 2009 In CHF In LC 1 2010 2009 Sales 47,473 49,051 -3 0 Research and development 9,050 9,509 -5 -2 19.1 19.4 Core operating profit 16,591 16,272 +2 +7 34.9 33.2 Operating free cash flow 14,149 15,722 -10 -6 29.8 32.1 Net income attributable to Roche shareholders 8,666 7,784 +11 Net income 8,891 8,510 +4 18.7 17.3 Core Earnings per share (CHF) 12.78 12.34 +4 +10 Dividend per share 2 (CHF) 6.60 6.00 +10 1 LC= local currencies 2 Dividend 2010 as proposed by the Board of Directors
Transcript of Roche - Solid overall results

Media Release
F. Hoffmann-La Roche Ltd 4070 Basel Switzerland
Group Communications Roche Group Media Relations
Tel. +41 61 688 88 88 Fax +41 61 688 27 75 www.roche.com
1/28
Basel, 2 February 2011
Solid overall results Mid-single digit sales growth in local currencies excluding Tamiflu Strong profit growth Promising late stage pharmaceutical pipeline of twelve new molecular entities Group • Group sales increase 5% in local currencies, excluding Tamiflu; including Tamiflu, Group sales
remain stable in local currencies at 47.5 billion Swiss francs. • Growth momentum maintained throughout 4th quarter due to continued uptake for Actemra,
Herceptin, MabThera and immunoassays. • Core operating profit increases 7% in local currencies to 16.6 billion Swiss francs, core
operating profit margin up by 1.7 percentage points to 34.9%; operating free cash flow of 14.1 billion Swiss francs underscores financial strength.
• Net income increases 4% to 8.9 billion Swiss francs despite significant costs in connection with the ‘Operational Excellence’ initiative.
• Core Earnings per Share 10% higher at constant exchange rates and 4% higher in Swiss francs. • Implementation of Operational Excellence on track; Group-wide review of structures and
processes aims to accelerate productivity improvements and strengthen innovation capacity; cost savings of 2.4 billion Swiss francs from 2012 onwards; restructuring charges of 2.7 billion Swiss francs, of which 1.3 billion Swiss francs were included in the 2010 operating results.
• Board proposes a dividend increase of 10% to 6.60 Swiss francs, the 24th consecutive year of dividend growth; this would increase the payout ratio to 52%.
Key figures In millions of CHF % change As % of sales
2010 2009 In CHF In LC1 2010 2009Sales 47,473 49,051 -3 0 Research and development 9,050 9,509 -5 -2 19.1 19.4Core operating profit 16,591 16,272 +2 +7 34.9 33.2Operating free cash flow 14,149 15,722 -10 -6 29.8 32.1Net income attributable to Roche shareholders
8,666 7,784 +11
Net income 8,891 8,510 +4 18.7 17.3Core Earnings per share (CHF) 12.78 12.34 +4 +10 Dividend per share2 (CHF) 6.60 6.00 +10
1 LC= local currencies 2 Dividend 2010 as proposed by the Board of Directors

2/28
Pharmaceuticals • Pharmaceuticals sales up 5% in local currencies, excluding Tamiflu, above the global market.
Major growth drivers are key products for cancer, Actemra/RoActemra for rheumatoid arthritis and Lucentis in ophthalmology.
• Core operating profit margin increases significantly, by 1.9 percentage points to 39.9%. • Late-stage development pipeline with twelve innovative new molecular entities, including six
potential personalised healthcare medicines with planned companion diagnostic tests. • Roche personalized investigational medicine RG7204 shows survival benefit in advanced skin
cancer. • Four new molecular entities moved into late-stage clinical development: lebrikizumab
(asthma), MetMAb (lung cancer), RG 7128 (hepatitis C) and ocrelizumab (multiple sclerosis). • Roche has made the decision to stop the development of taspoglutide for type 2 diabetes and to
return the product to Ipsen.
Diagnostics • Diagnostics sales increase 8% in local currencies to 10.4 billion Swiss francs, significantly ahead
of the market, driven by Professional Diagnostics and Diabetes Care. • Core operating profit margin up substantially, 3.8 percentage points to 21.1%. • Fifty tests and instruments launched in key markets. • cobas 8000 modular analyser series rolled out in US; new immunoassay module enables
consolidation of serum work area for high-volume laboratories. • ATHENA clinical trial demonstrates high medical value of cobas 4800 HPV test, which detects
high-risk genotypes 16 and 18, in screening for cervical cancer.
Outlook • Full-year 2011 sales for Pharmaceutical and the Group expected to grow at low single-digit
rates in local currencies (excluding Tamiflu), in line with expected market growth. • Diagnostics sales expected to grow significantly ahead of the market. • Target of high single-digit Core Earnings per Share growth in 2011 at constant exchange rates. • Planned dividend increase in line with Core Earnings per Share growth. • Based on the strong operating free cash flow, Roche expects to reduce debt progressively and to
return to a net cash position by 2015. Barring unforeseen events.

3/28
Commenting on the Group’s 2010 performance, Roche CEO Severin Schwan said: ‘The Group results are
solid despite an increasingly challenging market environment. Excluding Tamiflu the Pharma Division grew
above the market. Diagnostics kept its strong momentum and grew significantly ahead of the market. The
twelve innovative new molecular entities in our late-stage pharmaceutical pipeline form a strong basis for
the company’s future success. Six of these drug candidates are being developed for specific patient
subpopulations with the aim to advance personalised healthcare in key therapeutic areas such as cancer and
asthma.’
Group Results and Outlook Overall results
The Roche Group posted solid overall results in 2010. Group sales were stable in local currencies at 47.5
billion Swiss francs (–3% in Swiss francs; 1% in US dollars). The good underlying growth of both divisions
compensated for the expected decline in Tamiflu sales and the impacts of healthcare reforms and austerity
measures. Excluding Tamiflu, sales increased by 5% in local currencies. The Pharmaceuticals Division
represented 78% of Group sales and the Diagnostics Division contributed 22%.
Sales in the Pharmaceuticals Division declined by 2% in local currencies to 37.1 billion Swiss francs.
Excluding Tamiflu, local growth was 5%, above market growth. Demand for the oncology drugs Avastin,
MabThera/Rituxan, Herceptin, Xeloda and Tarceva continued to grow strongly. Additional major growth
drivers were Actemra/RoActemra in rheumatoid arthritis, Mircera in anemia and Lucentis in
ophthalmology. Actemra, which is now launched in some 50 countries including the United States, the EU
and Japan, reached sales of 397 million Swiss francs in 2010. These positive factors compensated for most of
the expected strong decline in Tamiflu sales, the reduction in CellCept sales due to US patent expiry in May
2009 and the impacts of the US healthcare reforms, European austerity measures and price cuts in Japan.
The Diagnostics Division increased sales to 10.4 billion Swiss francs in 2010, growing 8% in local currencies
(4% in Swiss francs; 8% in US dollars), thereby strengthening its leading market position. Major drivers
were Professional Diagnostics with 11% sales growth and Diabetes Care with 4% sales growth.
The Group’s core operating profit increased by 7% in local currencies (2% in Swiss francs). The
Pharmaceuticals Division increased its core operating profit by 4% in local currencies, driven primarily by
cost synergies from the Genentech integration and productivity improvements. Core operating profit

4/28
growth in the Diagnostics Division was 30% in local currencies, mainly resulting from sales growth due to
new product launches and the ongoing operational efficiency programmes. The Group’s core operating
profit margin increased by 1.7 percentage points to 34.9%, with the Pharmaceuticals Division improving by
1.9 percentage points to 39.9% and the Diagnostics Division by 3.8 percentage points to 21.1%.
In 2010 the Group’s net income increased by 4% to 8.9 billion Swiss francs compared to 2009. Net income
attributable to Roche shareholders rose 11% to 8.7 billion Swiss francs.
The Group’s operating free cash flow remained strong at 14.1 billion Swiss francs. A free cash flow of
4.7 billion Swiss francs was achieved in 2010 despite higher interest, tax and dividend payments.
Of the debt raised in early 2009 to finance the Genentech transaction, 33% had already been repaid by 31
December 2010. In addition, the Group exercised its option to call for redemption a portion of the US dollar
notes due 1 March 2014. Of the total principal amount of 2.75 billion US dollars, 1.0 billion US dollars will
be redeemed in March 2011. The net debt position of the Group is 19.2 billion Swiss francs, a decrease of 4.7
billion Swiss francs from 31 December 2009.
Financial implications of Operational Excellence
On 17 November 2010 the Group announced implementation plans for its Operational Excellence
programme, which is aimed at adapting cost structures to an increasingly challenging market environment
and achieving significant efficiency and productivity gains. The initiative is expected to generate savings of
1.8 billion Swiss francs in 2011, with projected savings of 2.4 billion Swiss francs from 2012 onwards.
Implementation is scheduled to be substantially completed by the end of 2012. During the period from 2010
through 2012 Roche expects to incur restructuring costs totalling 2.7 billion Swiss francs.
As a consequence of implementing the respective restructuring measures, significant costs were already
incurred in 2010. The costs in 2010 of 1.3 billion Swiss francs mainly relate to severance payments and
impairments of intangible assets. The Pharmaceuticals Division accounts for 1.2 billion Swiss francs of these
costs, and 0.1 billion Swiss francs relate to the Diagnostics Division. Roughly 40% of the charges are non-
cash, being mainly impairments of property, plant and equipment and intangible assets.

5/28
Outlook 2011
In 2011, Group and Pharmaceuticals sales (excluding Tamiflu) are expected to grow at low single-digit rates
in local currencies, reflecting the impact of US healthcare reform and European austerity measures.
Pharmaceuticals sales are thus expected to grow in line with the market.
In 2011, Diagnostics sales are again expected to grow significantly ahead of the market, driven by further
rollout of new products in all business areas.
In spite of a more challenging environment and the introduction of an excise tax in the United States, Roche
aims for Core Earnings per Share to grow at a high single-digit rate at constant exchange rates in 2011.
Roche aims to increase the dividend in line with Core Earnings per Share.
Based on the strong operating free cash flow, Roche expects to reduce debt progressively and to return to a
net cash position by 2015.
Proposals to the Annual General Meeting 2011
The Board of Directors is proposing an increase of 10% in the dividend for 2010 to 6.60 Swiss francs per
share and non-voting equity security (2009: 6.00 Swiss francs) for approval at the Annual General Meeting.
This would be the 24th consecutive increase of the dividend and corresponds to an increase in payout ratio
from 49% in 2009 to 52% for 2010.
Roche announced in December 2010 that Walter Frey and Wolfgang Ruttenstorfer will not stand for re-
election to the Board of Directors. Paul Bulcke (CEO of Nestlé), Christoph Franz (chairman and CEO of
Deutsche Lufthansa AG) and Peter Voser (CEO of Royal Dutch Shell plc) will be proposed for election to
the Board of Directors at the 2011 Annual General Meeting.
Furthermore Roche will propose that the term of Board members will be reduced from three to two years.

6/28
Pharmaceuticals Division
y Key figures
In millions of
CHF% change
in CHF% change in
local currencies % of sales
Sales 37,058 -5 -2 100— United States 14,071 -5 -1 38— Western Europe 9,467 -13 -5 25— Japan 4,319 -9 -12 12— International (Asia-Pacific, CEMAI1, Latin America, Canada, Others)
9,201 7 8 25
Core operating profit 14,776 0 4 39.9Operating free cash flow 12,933 -13 -9 34.9Research and development (core basis)
8,160 -5 -2 22.0
1 CEMAI: Central and Eastern Europe, Middle East, Africa, Central Asia, Indian Subcontinent.
Sales by the Pharmaceuticals Division in 2010 declined 2% in local currencies (-5% in Swiss francs, -1% in
US dollars) compared with 2009 to 37.1 billion Swiss francs. Excluding Tamiflu, the division’s local-
currency sales grew 5%, above the global market. In addition to the Group’s five main cancer medicines, the
primary sales drivers were Lucentis, Actemra/RoActemra and Mircera. Growth from these and other
pharmaceuticals largely compensated for lower sales of Tamiflu, CellCept and NeoRecormon/ Epogin.
Together, the top six sales drivers — Avastin, MabThera/Rituxan, Herceptin, Lucentis, Actemra/
RoActemra and Xeloda — contributed over 1.3 billion Swiss francs in additional sales in 2010. Due to the
passing of the influenza A (H1N1) pandemic, a relatively mild influenza season and the completion of most
government stockpiling orders, sales of Tamiflu declined strongly, to 873 million Swiss francs (2.3 billion
francs lower than in 2009).
Sales expanded fastest in the International region (8%, or 11% excluding Tamiflu), driven by demand for
MabThera, Herceptin, Avastin and other key medicines in emerging markets. Particularly strong growth
was recorded in Latin America (20%), led by Brazil and Venezuela. Solid growth in the Asia–Pacific region
(8%) was led by China and Taiwan. A slight decrease in the United States (-1%) reflects significantly lower
sales of Tamiflu and CellCept, as well as healthcare reform impacts affecting all major products. A 5%
decline in sales in Western Europe was due primarily to markedly lower sales of Tamiflu and NeoRecormon

7/28
and the effects of government austerity measures introduced in a number of countries, including Greece
and Spain in the second quarter and Germany in the third quarter. Together, healthcare reforms in the
United States and austerity measures in Europe had a negative impact on total sales of approximately 530
million Swiss francs or 1.5 percentage points. Excluding Tamiflu, sales in the US and Western Europe
increased 4% and 2%, respectively, compared with market growth1 of 3% and 2%. A decline in sales of 12%
in Japan reflects both significantly lower demand for Tamiflu and the impact of revised National Health
Insurance reimbursement prices that came into effect in April. Excluding Tamiflu, Japanese sales grew 3%
in a virtually flat market.
Core operating profit grew 4% in local currencies and was stable in Swiss francs at 14.8 billion Swiss francs.
The corresponding margin increased 1.9 percentage points to 39.9%, driven by synergies from the merger
with Genentech and productivity improvements. This was achieved despite the expected sharp decline in
Tamiflu sales and the impact of healthcare reforms and austerity measures. A reduction of 1% in marketing
expenses was achieved through tight cost management, which more than covered an increase in allowances
for bad debts in Southern Europe. Research and development expenses declined 2% versus 2009 thanks to
resource prioritisation while securing long-term growth through the rich R&D pipeline. In addition to
investments in phase III initiations, the metabolism franchise and the earlier-stage neurology portfolio,
research and development expenses included costs associated with the discontinuation of the ocrelizumab
rheumatoid arthritis programme and project termination costs associated with the Operational Excellence
programme.
The division’s full-year operating free cash flow remained strong at 12.9 billion Swiss francs. The decrease of
9% compared with 2009 primarily reflects the payment in 2010 of certain large 2009 year-end accruals,
including employee retention and severance payments, and high royalty payments relating to strong
Tamiflu sales in the second half of 2009. The Pharmaceuticals Division is on track to achieve its goal of pre-
tax annual synergies from the Genentech merger of approximately 1 billion Swiss francs by 2011. Synergies
of over 800 million Swiss francs were achieved in 2010.
1 Pharmaceutical market growth according to IMS (to end of September 2010)

8/28
Sales review - selected key products
Total United States Western Europe Japan International
CHF m % CHF m % CHF m % CHF m % CHF m %
Avastin 6,461 9% 3,190 0% 1,762 7% 625 51% 884 31%MabThera/ Rituxan
6,356 9% 3,026 4% 1,639 8% 273 9% 1,418 20%
Herceptin 5,429 7% 1,591 6% 2,075 6% 300 -15% 1,463 18%Pegasys 1,645 2% 389 0% 352 -4% 124 -6% 780 9%Lucentis 1,458 27% 1,458 27% - - - - - -Xeloda 1,426 17% 530 17% 305 6% 128 62% 463 17%Tarceva 1,325 6% 523 5% 432 -1% 94 37% 276 16%CellCept 1,290 -15% 275 -48% 451 -2% 61 16% 503 5%NeoRecormon/ Epogin
1,285 -15% - - 474 -24% 476 -10% 335 -4%
Bonviva/Boniva 1,013 1% 526 -4% 293 5% - - 194 10%
Growth rates in local currencies.
Oncology
Global sales of Avastin (bevacizumab), for advanced colorectal, breast, lung and kidney cancer, and for
relapsed glioblastoma (a type of brain tumour), rose 9% to 6.5 billion Swiss francs, reflecting continued
positive uptake of the product overall. Sales growth in Western Europe (7%) was driven primarily by
continued uptake for breast cancer and improved uptake for colorectal and lung cancer. Austerity measures
introduced during the year in Greece, Spain, Germany and other markets resulted in a progressive
flattening of growth in the region as a whole that was particularly noticeable in the fourth quarter. Sales in
the US were flat for the year, reflecting reserve adjustments due to the healthcare reforms enacted in 2010
and regulatory and reimbursement uncertainty regarding the metastatic breast cancer indication; together
these factors led to a decline in sales in the second half-year, especially the fourth quarter. Avastin
maintained its high US market share in its metastatic colorectal and lung cancer indications. Very strong
sales growth in Japan (51%) was driven by continued good uptake in colorectal and non-small cell lung
cancer. Very strong growth was also recorded in Latin America (42%). In the third quarter Avastin was
launched in China in its first indication, first-line treatment of metastatic colorectal cancer; initial uptake
has been very encouraging.
In December the European and US health authorities announced decisions that are pivotal in determining

9/28
whether Avastin remains available as a treatment for metastatic breast cancer. Roche believes strongly that
patients should have this option and are pleased that the European authorities continue to support the use
of Avastin in this indication. It is disappointing that the US Food and Drug Administration (FDA) has
come to a different conclusion after reviewing the same set of data. Roche believes that women with HER2-
negative metastatic breast cancer living in the US should also have Avastin as a treatment option, and has
requested a hearing with the FDA accordingly. Full-year sales (oncology and autoimmune diseases) of MabThera/Rituxan (rituximab), for non-Hodgkin’s lymphoma (NHL), chronic lymphocytic leukemia (CLL) and rheumatoid arthritis (RA), totalled 6.4 billion Swiss francs in 2010, an increase of 9% versus 2009. Sustained growth in the oncology segment was driven by uptake in CLL and continued strong use in NHL in Western Europe and the US. Solid double-digit growth in the International region, including strong gains in key emerging markets, reflects uptake of the medicine in its NHL indications. The European rollout of MabThera in a new indication, first-line maintenance treatment of patients with follicular lymphoma, commenced in the fourth quarter. Estimated sales of MabThera/Rituxan in the RA segment reached the 1 billion Swiss franc mark in 2010 (16% of the product’s total sales), 17% higher than in 2009. Growth is being driven by increased use in patients with an inadequate response to one or more tumour necrosis factor inhibitors and by growing acceptance of six-month repeat treatment intervals. Global sales of Herceptin (trastuzumab), for HER2-positive breast cancer and HER2-positive metastatic stomach cancer, rose 7% to 5.4 billion Swiss francs on sustained, solid single-digit growth in the United States and Western Europe, and double-digit gains in the International region. Herceptin maintained its high market penetration in breast cancer, with sales also benefitting from initial uptake for stomach cancer in EU countries and other markets. In addition, improvements in the quality of HER2 testing are expanding the population of patients eligible for treatment with Herceptin. In Japan, where Herceptin has a market share of approximately 90% in its breast cancer indications, a stable sales volume and revised reimbursement prices from April resulted in a significant decline in sales revenue compared with 2009. Xeloda (capecitabine), for colorectal, stomach and breast cancer, generated total sales of 1.4 billion Swiss francs, an increase of 17% compared with 2009. Growth was driven primarily by strong gains in the United States, Japan and China, the product’s three largest markets. Global sales of Xeloda are benefitting from a number of new indications, including stomach cancer in China, an expanded metastatic colorectal cancer indication in Japan, and adjuvant2 colon cancer in Europe, as well as increased patient share in metastatic breast cancer in the US and EU.

10/28
2 Adjuvant treatment is given after surgical removal of the tumour to lower the risk of relapse.
Sales of Tarceva (erlotinib), for advanced lung and pancreatic cancer, increased 6% to 1.3 billion Swiss
francs, driven mainly by increased use in the second-line non-small cell lung cancer setting. The main
contributions to growth came from the International region, Japan and the US. Mid-single-digit growth in
the US reflects steady demand in the lung and pancreatic cancer indications and the impact of government
healthcare reforms. Against a background of stable demand, sales in Western Europe declined slightly,
mainly as a result of government-mandated price reductions and rebates in several major markets.
Sustained strong sales growth in Japan (37%) reflects continued market penetration and oncologists’
increasing confidence in the benefits of treatment with Tarceva.
Virology
Worldwide sales of Pegasys (peginterferon alfa-2a), for hepatitis B and C, increased 2% to 1.6 billion Swiss
francs in 2010. Flat sales in the United States and sales decreases in Western Europe, Japan and certain other
mature markets were offset by growth in the International region, especially Asia–Pacific and CEMAI3
countries. The product’s market share continued to expand in the main European markets, the US and
Japan. Global sales continued to benefit from clinical data reinforcing the superiority of Pegasys over other
treatment options and increased use in hepatitis B. The hepatitis C market is poised for major expansion,
with the introduction of a new generation of direct-acting antiviral agents expected from 2011 onwards.
Because Pegasys — the leading pegylated interferon — is used in most hepatitis treatment development
programmes today, it is expected to become the backbone of future combination therapies with the new
antivirals.
Following exceptional demand in 2009 due to the influenza A (H1N1) pandemic, sales of Tamiflu
(oseltamivir), for influenza A and B, totalled 873 million Swiss francs in 2010, 73% (2.3 billion francs) lower
than in 2009. With government stockpiling orders largely completed by early 2010 and the influenza A
(H1N1) pandemic passing its peak, sales fell sharply in the last three quarters. Sales were also affected by
relatively mild influenza seasons in both hemispheres during 2010. Roche remains ready to address
potential threats posed by influenza and is maintaining production capacity in cooperation with external
manufacturing partners to enable a rapid response to future significant outbreaks or government
stockpiling orders.
3 CEMAI: Central and Eastern Europe, Middle East, Africa, Central Asia, Indian Subcontinent.

11/28
Ophthalmology
US sales of Lucentis (ranibizumab), for wet age-related macular degeneration and macular edema following
retinal vein occlusion, rose 27% to 1.5 billion Swiss francs. Strong growth throughout 2010 was driven
primarily by increases in the total number of patients receiving Lucentis and the time patients are on
treatment. The US launch of Lucentis for the treatment of macular edema (swelling in the retina) following
retinal vein occlusion began in late June, and initial uptake is encouraging.
Inflammation and autoimmune disorders
As the global rollout of the novel rheumatoid arthritis medicine Actemra (tocilizumab, known as
RoActemra in the EU) continued, sales in 2010 totalled 397 million Swiss francs, a rise of 177% over 2009.
Uptake of Actemra/RoActemra in the EU, the United States and other launch markets remains very
encouraging. Around 60% of US rheumatologists have already prescribed the medicine. Continued strong
sales growth in Japan reflects increasing use of Actemra as a first-line biologic. Chugai announced in August
that the Japanese health authorities had removed the approval conditions for Actemra for the rheumatoid
arthritis and polyarticular-course juvenile idiopathic arthritis indications. The decision gives more patients
access to Actemra and follows positive results from a routine post-marketing surveillance programme.
Actemra/RoActemra is now available in some 50 countries worldwide.
Anemia and transplantation
Sales of the renal anemia medication Mircera (methoxy polyethylene glycol-epoetin beta) rose 51% to 255
million Swiss francs. Demand for Mircera, which is now available in over 100 countries worldwide, is
coming mainly from the predialysis segment and new patient commencements. Combined sales of the
Group’s established anemia medicines, Roche’s NeoRecormon and Chugai’s Epogin (epoetin beta),
declined 15% to 1.3 billion Swiss francs. Roche Pharmaceuticals’ overall share of the European anemia
market remained stable despite increasing biosimilar competition, due mainly to the strong performance of
Mircera in the major EU countries and a robust market share by volume for NeoRecormon in the renal
indication. A 10% decline in sales of Epogin in Japan was due mainly to competition in the dialysis market
and a lower National Health Insurance reimbursement price, factors which outweighed increased demand
for the medicine in the predialysis segment.
At 1.3 billion Swiss francs for the full year, sales revenue from CellCept (mycophenolate mofetil), for the
prevention of solid organ transplant rejection, remained significant. The sales decrease of 15% was due
primarily to the loss of patent exclusivity in the United States in 2009. The resulting losses to competition

12/28
from generic versions were partly offset by sales growth in Japan and the International region.
Development highlights — key marketed products
Roche achieved important product development successes in 2010, including expanded marketing
approvals for Actemra/RoActemra for rheumatoid arthritis in the US and the EU, Herceptin for stomach
cancer (EU and US), MabThera/Rituxan for chronic lymphocytic leukemia (US) and maintenance
treatment of follicular lymphoma (EU and, in January 2011, US), and Lucentis for macular edema following
retinal vein occlusion (US). Key regulatory filings included marketing applications for Actemra/RoActemra
for juvenile idiopathic arthritis in the EU and US, Herceptin for stomach cancer in Japan and Avastin for
advanced ovarian cancer in the EU.
In 2010 the Pharmaceuticals Division filed 20 major new marketing applications and gained 18 major
regulatory approvals. The following summaries present approvals, filings and major clinical trial results for
key marketed products, by indication.
Major regulatory filings in 20101
Product Clinical data supporting filing
Indication and/or dosage form Country
Actemra/ RoActemra
LITHE (2-year data) rheumatoid arthritis, reduction or inhibition of progression of joint damage and improvement of physical function
USA
ML21753 rheumatoid arthritis signs and symptoms, progressive joint damage
China (refiled)
TENDER systemic onset juvenile idiopathic arthritis EU, USA
Avastin RIBBON-2 metastatic breast cancer, second-line treatment
USA
ICON-7, GOG 218 metastatic ovarian cancer EU
Herceptin ToGA advanced HER2-positive gastric cancer USA, China
Herceptin + Xeloda
ToGA advanced HER2-positive gastric cancer Japan
MabThera/Rituxan
PRIMA advanced follicular lymphoma, first-line maintenance following induction treatment with MabThera/Rituxan plus chemotherapy
EU, USA, Switzerland
RAVE ANCA-associated vasculitis USA

13/28
Mircera ML20680 renal anemia China
CORDATUS (NH20052)
correction of symptomatic anemia in adults with chronic kidney disease who do not yet need dialysis, once-monthly administration
EU, Switzerland
Tarceva emerging data from clinical trials, ongoing clinical experience
metastatic non-small cell lung cancer with EGFR-activating mutations, first-line treatment
EU
Xeloda NO16968 (XELOXA) adjuvant colon cancer, combination with oxaliplatin
Switzerland
data in the public domain
advanced or refractory gastric cancer in patients who are not candidates for curative surgery
Japan
XELOX (NO16966) metastatic colorectal cancer, combination with oxaliplatin
China (refiled)
Major regulatory approvals in 20101
Product Clinical data supporting filing
Indication and/or dosage form Country
Actemra/ RoActemra
OPTION, TOWARD, RADIATE, AMBITION, LITHE (6-month data)
rheumatoid arthritis signs and symptoms
USA
LITHE (2-year data)
rheumatoid arthritis, reduction or inhibition of progression of joint damage and improvement of physical function
EU, Switzerland, USA2
Avastin AVF 2107, E3200, NO16966 (global); ARTIST (China)
metastatic colorectal cancer China
Herceptin ToGA advanced HER2-positive gastric cancer EU, USA, Switzerland
Lucentis CRUISE, BRAVO macular edema following retinal vein occlusion
USA
MabThera/Rituxan CLL-8 first-line chronic lymphocytic leukemia USA
REACH relapsed or refractory chronic USA

14/28
lymphocytic leukemia
PRIMA advanced follicular lymphoma, first-line maintenance following induction treatment with MabThera/Rituxan plus chemotherapy
EU, Switzerland, USA2
REFLEX rheumatoid arthritis, inhibition of progression of joint damage and improvement of physical function
EU
Mircera CORDATUS (NH20052)
correction of symptomatic anemia in adults with chronic kidney disease who do not yet need dialysis, once-monthly administration
EU, Switzerland
Tarceva SATURN non-small cell lung cancer, first-line maintenance after chemotherapy
USA, EU
Xeloda NO16968 (XELOXA)
adjuvant colon cancer, combination with oxaliplatin
EU
1 Includes supplemental indications. 2 January 2011
Research and development
During the year Roche made decisions to move several projects into late-stage development, including
ocrelizumab for multiple sclerosis, RG7128 for hepatitis C, lebrikizumab for asthma and RG3638
(MetMAb) for lung cancer. Positive results from clinical trials with other late-stage compounds such as
RG7204 (BRAF inhibitor) for melanoma, RG7159 (GA101) for non-Hodgkin’s lymphoma and chronic
lymphocytic leukemia, and T–DM1 and pertuzumab for HER2-positive breast cancer were published or
presented at major medical conferences during 2010. These targeted compounds are designed to move the
standard of care for these diseases and improve patient survival. Roche’s pharmaceutical pipeline currently
includes 12 new molecular entities in late-stage development.
Two recent examples of the progress that Roche is making towards PHC in the development of therapies for
difficult-to-treat diseases are RG3638 (MetMAb) for lung cancer and RG7204 (BRAF inhibitor) for
malignant melanoma. Roche Diagnostics is developing diagnostic tests designed to guide appropriate use of
both compounds in their target patient populations. Roche’s research on antibody–drug conjugates as a
means of treating cancer is another example of a highly targeted approach with the potential of improving
outcomes while reducing the side effects of treatment. T–DM1, for HER2-positive breast cancer, is the most
advanced of these projects.

15/28
At the beginning of 2011 the division’s R&D pipeline included 102 projects in clinical development (phase I
to III and filed for regulatory review). Of these, 62 involved new molecular entities (NMEs) and 40 involved
additional indications. Twelve NMEs are in late-stage development. Twenty-two projects investigating
additional indications for existing products are in phase III.
Twelve new molecular entities in ongoing or planned late-stage studies Compound Indication Status Expected first
filing RG7204 (BRAF inhibitor)
metastatic melanoma phase III trial in first-line treatment met primary endpoints in January 2011
2011
RG3616 (hedgehog pathway inhibitor)
advanced basal cell carcinoma
pivotal phase II started in first quarter 2009
2011
pertuzumab HER2-positive metastatic breast cancer, first line
phase III started in 2008 2011
trastuzumab–DM1
HER2-positive metastatic breast cancer, first and second line
phase III started in first quarter 2009 2012
RG7159 (GA101)
chronic lymphocytic leukemia, non-Hodgkin’s lymphoma
phase III started in fourth quarter 2009 (chronic lymphocytic leukemia)
2013
dalcetrapib dyslipidemia, cardiovascular high risk
phase III enrolment completed in second quarter 2010
2013
RG1678 (glycine reuptake inhibitor)
negative symptoms of schizophrenia, suboptimally controlled positive symptoms of schizophrenia
phase III started November 2010 2013
RG7128 (HCV polymerase inhibitor)
hepatitis C LIP1 decision made, preparing for phase III
2013
ocrelizumab multiple sclerosis phase III planned to start in first post-2013

16/28
(RRMS and PPMS) quarter (PPMS) and second quarter (RRMS) 2011
RG3638 (MetMAb)
solid tumours LIP1 decision made, preparing for phase III
post-2013
lebrikizumab asthma LIP1 decision made, preparing for phase III
post-2013
aleglitazar cardiovascular risk reduction in type 2 diabetes
phase III initiated in first quarter 2010
post-2013
1 Lifecycle investment point (decision to commence late-stage development leading to submission of marketing applications).
Discontinuation of taspoglutide programme
A decision to stop dosing of patients in the taspoglutide Phase III trials was taken in September 2010. This
was based on higher than expected patient discontinuation rates, mainly due to gastrointestinal (GI)
tolerability, observed in the T-emerge programme, and also resulting from the previously communicated
risk mitigation plan to address serious hypersensitivity reactions.
After further extensive analysis, Roche has now made the decision to stop the development of taspoglutide
and to return the product to Ipsen.

17/28
Diagnostics Division Key figures
In millions of
CHF% change
in CHF% change in
local currencies % of sales
Sales 10,415 4 8 100— Professional Diagnostics 4,858 7 11 47— Diabetes Care 2,959 0 4 28— Molecular Diagnostics 1,189 1 4 12— Applied Science 868 0 4 8— Tissue Diagnostics 541 13 17 5Core operating profit 2,202 26 30 21.1Operating free cash flow 1,634 42 48 15.7Research and development (core basis)
890 -6 -2 8.6
In 2010 the Diagnostics Division recorded sales of 10.4 billion Swiss francs, an increase of 8% in local
currencies over 20091 (4% in Swiss francs; 8% in US dollars). This was significantly above the estimated IVD
market growth rate (5%)2. All five divisional business areas contributed to sales growth, led by Professional
Diagnostics and Diabetes Care. Immunoassays and blood glucose monitoring systems remained these
businesses’ primary growth drivers. Strong demand for advanced tissue staining products continued to fuel
above-market growth in Tissue Diagnostics. Virology was the main contributor to sustained sales growth in
Molecular Diagnostics. Strong sales of cell analysis and genomics systems were Applied Science’s main
growth drivers. Instrument placements were again up significantly for the division as a whole and were a
major growth driver in all segments.
1 Unless otherwise stated, all growth rates are in local currencies. 2 In-vitro-diagnostic (IVD) market growth based on company and independent reports (to end of September 2010).

18/28
Sales again outpaced the market in all regions. Growth was very strong in Asia-Pacific (20%) — particularly
in China and South Korea — driven mainly by Professional Diagnostics. Despite pricing challenges, sales
outperformed the market in both mature and emerging EMEA3 economies (6%), helped by strong
performances by Professional Diagnostics and Diabetes Care. Professional Diagnostics and Tissue
Diagnostics were the primary growth drivers in North America (5%). In Japan (4%) overall divisional sales
grew faster than the market with Professional Diagnostics’ strong performance offsetting continuing
challenges in Diabetes Care. Increased investment and strong demand for immunoassays and other leading-
edge Roche products contributed to robust above-market growth in the E7 markets (21%)4, which in 2010
accounted for almost 13% of total divisional revenues.
On a Swiss franc basis, the division’s core operating profit for 2010 increased 26% (30% in local currencies)
to 2,202 million Swiss francs, while the core operating profit margin advanced 3.8 percentage points to
21.1%. These increases largely reflect the strong performance of Roche’s key diagnostic products as well as
ongoing initiatives to improve operational excellence.
The division launched a total of 39 tests, which expanded the immunoassay menu in infectious diseases,
extended the molecular test panel in virology and further strengthened the tissue assay portfolio in
oncology. In addition, 11 instruments were launched in key markets facilitating maximum efficiency in
state-of-the-art testing in clinical laboratories, research centres and point-of-care units. In 2011 the division
plans to launch 18 key products, including the US introduction of Accu-Chek Combo for the management
of blood glucose in diabetes, the cobas 4800 HPV Test for cervical cancer screening and the cobas 4800
BRAF Mutation Test in melanoma.
In 2010 Roche completed major acquisitions in Diabetes Care (Medingo Ltd.) and Tissue Diagnostics
(BioImagene Inc.) and entered into a number of research and technology collaborations in Diabetes Care
(with InterComponentWare), Molecular Diagnostics (with the German Cancer Research Centre) and
Applied Science (with IBM and DNA Electronics). Moreover, the division signed over 80 licensing
agreements, approximately half of them in-licensing IP to broaden Roche’s innovation base.
3 EMEA = Europe, Middle East, Africa. 4 E7 countries = Brazil, Russia, India, China, South Korea, Mexico and Turkey

19/28
Professional Diagnostics
Professional Diagnostics’ full-year sales grew about twice as fast as the global market, rising 11% to 4,858
million Swiss francs and outpacing market growth in all regions. Immunoassays were a key growth driver,
with sales up 17% in 2010. For a decade this segment has consistently grown at double-digit rates, thanks to
a strong installed base and an ever-expanding test menu. Sales of clinical chemistry and coagulation
monitoring products grew 5% and 19%, respectively.
Diabetes Care
In 2010 Diabetes Care’s sales rose 4% to 2,959 million Swiss francs. This was well above the global market
growth rate in an environment that remains challenging due to the uncertain economic recovery and
general price pressure. Sales of blood glucose monitoring systems (4%) were driven by Accu-Chek Aviva
and Accu-Chek Performa, which showed strong double-digit growth, supported by strong market uptake of
the sleek versions Accu-Chek Aviva Nano and Accu-Chek Performa Nano. The Accu-Chek Mobile also
posted significant sales growth. In the EU maltose-independent strip chemistries for the Accu-Chek Aviva,
Accu-Chek Performa, Accu-Chek Compact and Accu-Chek Mobile product lines received regulatory
approval in June and were immediately rolled out. Insulin delivery systems posted double digit sales growth,
driven mainly by continued strong uptake of the new interactive insulin pump system Accu-Chek Combo.
Molecular Diagnostics
Molecular Diagnostics continued its steady performance in 2010, with sales advancing 4% to 1,189 million
Swiss francs. Growth was led by virology (2%), which currently accounts for about half of the business area’s
sales. Demand for the cobas 4800 system, launched in late 2009, was strong with the system now installed in
25 countries in Europe, Asia-Pacific, Latin America and Canada. Regionally, North America sales showed
good growth, while sales held steady in the EU. Latin America and Asia-Pacific posted excellent double-
digit growth. Strong contribution from the E7 markets was led by Russia and Mexico. Supported by the
ATHENA results, Roche filed the HPV test in the US in June, with approval expected in the second half of
2011. This test received CE Mark certification in late 2009 and experienced a strong market uptake in CE
markets throughout 2010.

20/28
Applied Science
Applied Science posted 4% growth on sales totalling 868 million Swiss francs. Growth drivers were the cell
analysis segment (thanks to increased demand for solutions in oncology and stem cell research), genomics
(formerly reported as sequencing and microarray businesses) and custom biotech (due to recovery of the
global economy). Sales of the MagNA Pure and LightCycler product lines for sample preparation and
quantitative PCR analysis declined due to dramatically lower demand for influenza A (H1N1) virus testing.
All regions showed sales increases except Latin America, where the negative effect of decreased H1N1
testing was particularly pronounced. Sales in Asia-Pacific were exceptionally strong (15%), led by China and
India.
Tissue Diagnostics
Tissue Diagnostics significantly outpaced the market in 2010, recording sales of 541 million Swiss francs, an
increase of 17% compared to the year-earlier period. Advanced tissue staining — immunohistochemistry
(IHC) and in situ hybridisation (ISH) — was the main growth driver (17%), reflecting strong reagent sales
and robust uptake of the fully automated BenchMark ULTRA system for simultaneous IHC and ISH testing
on a single platform. The business area performed strongly worldwide, growing two to four times as fast as
the market in Europe, Latin America and Asia-Pacific. Sales in these regions benefited from intensified
commercialisation efforts outside the US, synergies with Roche Pharmaceuticals in HER2 testing in breast
and gastric cancer and the introduction of BenchMark GX at an economic price in emerging markets.
Research and development
Data from three clinical studies were presented at major scientific congresses: ATHENA, a large registration
trial investigating the benefits of HPV testing in screening for cervical cancer, PROTECT, a randomised
trial studying the NT-proBNP biomarker-guided approach in treatment of heart failure, and the STeP trial
aiming at improvement of diabetes management through structured testing. All three trials demonstrated
the high medical value of Roche diagnostic products.
In addition to the medical value of IVD tests applied in the clinic, diagnostics today play a number of
critical roles in drug development, from identifying new therapeutic targets and screening out unpromising
drug candidates to selecting appropriate patient populations for clinical trials. Some may also become
companion diagnostics for patient selection, response prediction or therapeutic monitoring. Every drug
under development at Roche has its own associated biomarker programme, and Diagnostics expertise and
advice are made available for each of these programmes. In 2010 the Diagnostics and Pharmaceuticals

21/28
Divisions, including pRED, gRED, Pharma Medicines and Chugai, collaborated on more than 160 projects
across all disease areas of interest at Roche. More than half of these projects were in oncology, followed by
inflammation, CNS, virology and metabolic diseases. In addition, the Diagnostics Division collaborated
with several other pharmaceutical companies to develop companion diagnostics for key biomarkers,
particularly in oncology.
About Roche
Headquartered in Basel, Switzerland, Roche is a leader in research-focused healthcare with combined
strengths in pharmaceuticals and diagnostics. Roche is the world’s largest biotech company with truly
differentiated medicines in oncology, virology, inflammation, metabolism and CNS. Roche is also the world
leader in in-vitro diagnostics, tissue-based cancer diagnostics and a pioneer in diabetes management.
Roche’s personalised healthcare strategy aims at providing medicines and diagnostic tools that enable
tangible improvements in the health, quality of life and survival of patients. In 2010, Roche had over 80,000
employees worldwide and invested over 9 billion Swiss francs in R&D. The Group posted sales of 47.5
billion Swiss francs. Genentech, United States, is a wholly owned member of the Roche Group. Roche has a
majority stake in Chugai Pharmaceutical, Japan. For more information: www.roche.com.
All trademarks used or mentioned in this release are protected by law.
Additional information
- Media release including a full set of tables: www.roche.com/med-cor-2011-02-02
- Annual Report 2010: www.roche.com/annual_reports.htm
- Roche Pharmaceuticals pipeline: www.roche.com/pipeline.htm
- Roche Finance Info System: rofis.roche.com/dynasight/rofis.html
- Photographs of the media conference (as from 4:00 pm CET):
http://download.roche.com/selection/20110202/
Roche Group Media Relations
Phone: +41 -61 688 8888 / e-mail: [email protected]
- Alexander Klauser (Head)
- Silvia Dobry
- Daniel Grotzky
- Claudia Schmitt
- Annette Walz

22/28
Disclaimer: Cautionary statement regarding forward-looking statements This document contains certain forward-looking statements. These forward-looking statements may be identified by words such as ‘believes’, ‘expects’, ‘anticipates’, ‘projects’, ‘intends’, ‘should’, ‘seeks’, ‘estimates’, ‘future’ or similar expressions or by discussion of, among other things, strategy, goals, plans or intentions. Various factors may cause actual results to differ materially in the future from those reflected in forward-looking statements contained in this document, among others: (1) pricing and product initiatives of competitors; (2) legislative and regulatory developments and economic conditions; (3) delay or inability in obtaining regulatory approvals or bringing products to market; (4) fluctuations in currency exchange rates and general financial market conditions; (5) uncertainties in the discovery, development or marketing of new products or new uses of existing products, including without limitation negative results of clinical trials or research projects, unexpected side-effects of pipeline or marketed products; (6) increased government pricing pressures; (7) interruptions in production; (8) loss of or inability to obtain adequate protection for intellectual property rights; (9) litigation; (10) loss of key executives or other employees; and (11) adverse publicity and news coverage. The statement regarding earnings per share growth is not a profit forecast and should not be interpreted to mean that Roche’s earnings or earnings per share for any current or future period will necessarily match or exceed the historical published earnings or earnings per share of Roche.

23/28
Roche Group consolidated income statement for the year ended 31 December 2010 | in millions of CHF
Pharma-ceuticals
Diagnostics Corporate Group
Sales 37,058 10,415 47,473Royalties and other operating income 1,537 157 1,694 Cost of sales (8,169) (5,124) (13,293) Marketing and distribution (6,964) (2,524) (9,488) Research and development (9,090) (936) (10,026) General and administration (2,071) (409) (394) (2,874) Operating profit 12,301 1,579 (394) 13,486 Associates (3) Financial income 557 Financing costs (2,829) Profit before taxes 11,211 Income taxes (2,320) Net income 8,891 Attributable to - Roche shareholders 8,666 - Non-controlling interests 225 Earnings per share and non-voting equity security Basic (CHF) 10.14 Diluted (CHF) 10.11

24/28
Core results reconciliation - 2010 | in millions of CHF
IFRS Global restructuring
Intangibles - amortisation
Intangibles - impairment
Alliances & Business combinations
Legal & environmental
Normalisation of ECP tax benefit
Core
Sales 47,473 - - - - - - 47,473 Royalties and other operating income 1,694 - - - - - - 1,694 Cost of sales (13,293) 157 592 33 - - - (12,511) Marketing and distribution (9,488) 317 4 - - - - (9,167) Research and development (10,026) 319 23 634 - - - (9,050) General and administration (2,874) 722 - - 5 299 - (1,848) Operating profit 13,486 1,515 619 667 5 299 - 16,591 Associates (3) - - - - - - (3) Financial income 557 - - - - - - 557 Financing costs (2,829) - - - - - - (2,829) Profit before taxes 11,211 1,515 619 667 5 299 - 14,316 Income taxes (2,320) (398) (207) (185) (1) (107) 83 (3,135) Net income 8,891 1,117 412 482 4 192 83 11,181 Attributable to - Roche shareholders 8,666
1,117 412 482 4
191
83 10,955
- Non-controlling interests 225
- - - -
1
- 226
EPS 10.11 1.30 0.48 0.56 0.01 0.22 0.10 12.78

25/28
Divisional core results reconciliation - 2010 | in millions of CHF
IFRS Global restructuring
Intangibles -
amortisation
Intangibles -
impairment
Alliances &
Business combinat
ions
Legal & environmental
Core
Pharmaceuticals Sales 37,058 - - - - - 37,058 Royalties and other operating income 1,537 - - - - - 1,537 Cost of sales (8,169) 66 156 - - - (7,947) Marketing and distribution (6,964) 312 - - - - (6,652) Research and development (9,090) 277 19 634 - - (8,160) General and administration (2,071) 709 - - 1 301 (1,060) Operating profit 12,301 1,364 175 634 1 301 14,776 Diagnostics Sales 10,415 - - - - - 10,415 Royalties and other operating income 157 - - - - - 157 Cost of sales (5,124) 91 436 33 - - (4,564) Marketing and distribution (2,524) 5 4 - - - (2,515) Research and development (936) 42 4 - - - (890) General and administration (409) 6 - - 4 (2) (401) Operating profit 1,579 144 444 33 4 (2) 2,202 Corporate General and administration (394) 7 - - - - (387) Operating profit (394) 7 - - - - (387)

26/28
Roche Group consolidated balance sheet | in millions of CHF
31 December
201031 December
2009 31 December
2008Non-current assets Property, plant and equipment 16,729 17,697 18,190 Goodwill 7,722 8,261 8,353 Intangible assets 5,133 6,005 7,121 Associates 13 16 9 Financial long-term assets 428 481 940 Other long-term assets 456 452 451 Deferred income tax assets 2,368 2,573 1,829 Post-employment benefit assets 559 601 592 Total non-current assets 33,408 36,086 37,485 Current assets Inventories 4,972 5,648 5,830 Accounts receivable 9,403 10,461 9,755 Current income tax assets 168 244 268 Other current assets 2,168 3,577 1,980 Marketable securities 9,060 16,107 15,856 Cash and cash equivalents 1,841 2,442 4,915 Total current assets 27,612 38,479 38,604 Total assets 61,020 74,565 76,089 Non-current liabilities Long-term debt (27,857) (36,143) (2,972) Deferred income tax liabilities (885) (1,099) (1,409) Post-employment benefit liabilities (4,367) (4,726) (4,669) Provisions (934) (700) (654) Other non-current liabilities (337) (416) (459) Total non-current liabilities (34,380) (43,084) (10,163) Current liabilities Short-term debt (2,201) (6,273) (1,117) Current income tax liabilities (2,037) (2,478) (2,193) Provisions (2,146) (1,618) (804) Accounts payable (2,068) (2,300) (2,017) Accrued and other current liabilities (6,526) (9,398) (5,973) Total current liabilities (14,978) (22,067) (12,104) Total liabilities (49,358) (65,151) (22,267) Total net assets 11,662 9,414 53,822 Equity Capital and reserves attributable to Roche shareholders 9,469 7,366 44,479 Equity attributable to non-controlling interests 2,193 2,048 9,343 Total equity 11,662 9,414 53,822

27/28
Roche Group consolidated statement of cash flows | in millions of CHF
Year ended 31 December 2010 2009
Cash flows from operating activities Cash generated from operations 19,436 19,304 (Increase) decrease in working capital (1,266) 349 Payments made for defined benefit post-employment plans (334) (467) Utilisation of provisions (729) (709) Disposal of products 30 169 Other operating cash flows (6) 167 Cash flows from operating activities, before income taxes paid 17,131 18,813 Income taxes paid (2,789) (1,767) Total cash flows from operating activities 14,342 17,046 Cash flows from investing activities Purchase of property, plant and equipment (2,671) (2,984) Purchase of intangible assets (339) (235) Disposal of property, plant and equipment 112 113 Disposal of intangible assets - 3 Business combinations (504) (98) Divestments of subsidiaries - 15 Interest and dividends received 59 306 Sales of marketable securities 43,057 14,968 Purchases of marketable securities (36,345) (15,171) Other investing cash flows 165 5 Total cash flows from investing activities 3,534 (3,078) Cash flows from financing activities Proceeds from issue of bonds and notes - 48,197 Redemption and repurchase of bonds and notes (8,625) (7,421) Increase (decrease) in commercial paper (86) (261) Increase (decrease) in other debt (51) (133) Hedging and collateral arrangements (1,717) 3,264 Change in ownership interest in subsidiaries - Genentech - (52,708) - Memory - (6) Equity contribution by non-controlling interests 14 - Interest paid (1,931) (748) Dividends paid (5,265) (4,395) Genentech equity compensation plans - 108 Equity-settled equity compensation plans, net of transactions in own equity instruments (773) (651) Chugai share repurchases - (14) Other financing cash flows - -
28/28
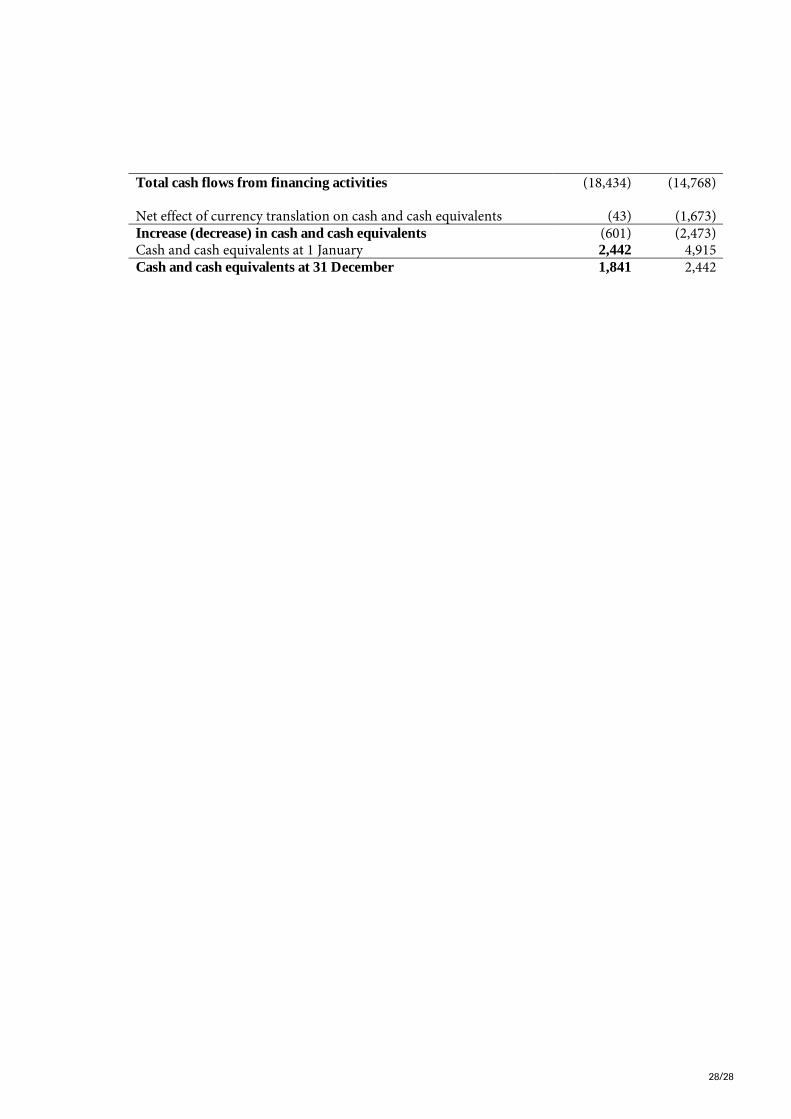
Total cash flows from financing activities (18,434) (14,768) Net effect of currency translation on cash and cash equivalents (43) (1,673) Increase (decrease) in cash and cash equivalents (601) (2,473) Cash and cash equivalents at 1 January 2,442 4,915 Cash and cash equivalents at 31 December 1,841 2,442