2013 Changes in Store Mobility Meets Retail's Big...
64
10th Annual IHL/RIS News Store Systems Study 2013 Changes in Store Mobility Meets Retail's Big Data Analysts Lee Holman & Greg Buzek Publication Date: January 5, 2013
Transcript of 2013 Changes in Store Mobility Meets Retail's Big...

10th Annual IHL/RIS News Store Systems Study
2013 Changes in StoreMobility Meets Retail's Big DataAnalystsLee Holman & Greg Buzek
Publication Date: January 5, 2013

IHL Group License and Fair Use Agreement
All of IHL Group’s generally available research products and databases are electronic licenses andcan be shared freely within the purchasing organization and wholly owned subsidiaries. We only askthat this information not be shared with partners or others outside the purchasing company withoutauthorization from IHL Group. The license does not extend to joint ventures or other partnerships.If the relationship is not a wholly owned subsidiary, then both parties would need a license.
Practically, this implies the following:1. The purchasing company can use the reports worldwide internally as long as the international
organizations are wholly owned subsidiaries of the purchasing company.2. The research reports and databases cannot be distributed in whole or in part to partners or
customers without express written approval from IHL Group.3. The purchasing company may quote components of the data (limited use) in presentations to
customers such as specific charts. This is limited to percentage components, not individual unit information. Unit data cannot be shared externally without express written approval from IHL Group.All references to the data in presentations should include credit to IHL Group for the data.
4. The purchasing company can reference qualitative quotes in printed material with written approvalfrom IHL Group.
5. All requests requiring written approval should be submitted to [email protected] and will be reviewed within one business day.
For any questions regarding this policy, please contact us at 615-591-2955 or email us at [email protected]
1064 Cedarview Lane | Franklin, TN 37067 | Phone +1 615-591-2955 | www.ihlservices.com

About IHL Group
Who We AreIHL Group is a global research and advisory firm specializing in technologies for the retailand hospitality industries. The company, based in Franklin, Tenn., generates timely datareports, offers advisory services and serves as the leading retail technology spokespersonfor industry and vendor events.
What We DoIHL provides customized business intelligence for retailers and retail technology vendors,with particular expertise in supply chain and store level systems. Our customers are retailersand retail technology providers who want to better understand what is going on in the overalltechnology market, or wish to identify specific equipment needs for the retail market.
When We StartedGreg Buzek served as Product Development Manager for two Fortune 500 retail technologysuppliers for 6 years. Faced with making recommendations to senior management withspotty reports stuffed with technical jargon and unsubstantiated data, in 1996 he left toform IHL Group as an arms length consulting firm that delivers exacting research to corporatemanagers.
How We WorkReliable market analysis is essential for corporations to accelerate revenue and expand theirmarket share. Most research providers do not disclose data sources or statistically defend thevalidity of their assumptions. We do. We disclose in precise detail exactly how and why wereached our conclusions so that our customers can be comfortable with the data they are using.
What We KnowOur associates and advisors have over 100 years combined years of retail technology experience.Our associates have worked as product managers, sales representatives and executives in theretail market. We have the relationships, tools, and experience to meet your research andconsulting needs.
1064 Cedarview Lane | Franklin, TN 37067 | Phone +1 615-591-2955 | www.ihlservices.com
© Copyright 2013 IHL Group – All Rights Reserved. www.ihlservices.com 4
2013 RIS News/IHL Group Store Systems Study
Table of Contents
Summary of Findings ..................................................................................................... 7
1.0 Introduction .......................................................................................................... 10 1.1 Background and Objectives ............................................................................ 10 1.2 How to Read This Document ......................................................................... 12 1.3 Methodology ..................................................................................................... 12 1.4 Demographics – Who Responded? ................................................................ 13
2.0 Financial Expectations & Expanding Horizons ............................................. 16 2.1 Enterprise Growth ........................................................................................... 16 2.2 2013 IT Spend Growth ..................................................................................... 18
2.2.1 Enterprise IT Spend Growth ............................................................... 20 2.2.2 Store IT Spend Growth ........................................................................ 21
2.3 Store IT Spend Growth by POS Software Vendors Under Consideration 24
3.0 Store System Priorities ....................................................................................... 26 3.1 Store System Priorities ..................................................................................... 26
4.0 Point of Sale .......................................................................................................... 29 4.1 Key POS Software Vendors with the Most Interest ..................................... 29 4.2 POS Software Purchase Intentions and the Impact on Vendor ................. 31 4.3 POS & Peripheral Purchase Trends ............................................................... 33
4.3.1 POS Client – Base System .................................................................... 34 4.3.2 POS Software ......................................................................................... 35 4.3.3 POS Printers .......................................................................................... 36 4.3.4 POS Scanners (2D) ................................................................................ 37 4.3.5 POS Scanners (Image from a Cell Phone Screen) ............................. 38 4.3.6 EFT / Debit / Signature Capture ......................................................... 39
4.4 Other Store Systems ......................................................................................... 40 4.5 Mobile Effect on Traditional POS ................................................................... 40
5.0 Card Payment Security ....................................................................................... 42
6.0 There’s No Avoiding It, Mobile is Here to Stay ............................................ 45 6.1 Mobility Platforms for Store Managers and Associates .............................. 45 6.2 Store Associate Mobility Plans ....................................................................... 48 6.3 Support for Consumer Mobile Applications ................................................ 53 6.4 Support for Payment Oriented Mobile Apps ............................................... 54 6.5 Which Payment Solutions Will Retailers Use? ............................................. 56
7.0 A Word on Big Data ............................................................................................ 57
8.0 Channels Continue to Blur ................................................................................ 58

© Copyright 2013 IHL Group – All Rights Reserved. www.ihlservices.com 5
2013 RIS News/IHL Group Store Systems Study
9.0 RFID: Everything Old is New Again ............................................................... 60
10. References ............................................................................................................. 63
List of Figures Figure 1 – Respondents by Retail Segment ............................................................................. 13 Figure 2 – Respondents by Title / Position .............................................................................. 14 Figure 3 – Respondents by Annual Revenue .......................................................................... 15 Figure 4 – Retailer’s Plans for Store Count Growth for 2013 ................................................ 16 Figure 5 – Retailer’s Plans for IT Headcount Growth for 2013 ............................................ 17 Figure 6 – 2013 IT Spend Growth by Retailer Annual Revenue .......................................... 18 Figure 7 – Enterprise IT Spend Growth for 2013 ................................................................... 20 Figure 8 – Store IT Spend Growth for 2013 ............................................................................. 21 Figure 9 – Store IT Spend Growth by POS Software Vendor ............................................... 24 Figure 10 – Top Store System Priorities ................................................................................... 26 Figure 11 – Top Store Priorities by Retail Segment ............................................................... 28 Figure 12 – Top 10 POS Software Vendors Under Consideration ....................................... 29 Figure 13 – Top 10 POS SW Vendor Responses by Retail Tier ............................................ 30 Figure 14 – POS SW Vendors Considered by Retail Segment ............................................. 31 Figure 15 – POS SW Vendor Share of 0‐12 Month Purchase Intent .................................... 31 Figure 16 – 0‐12 Month Purchase Intent Share of POS SW Vendors ................................... 32 Figure 17 – POS & Peripheral Purchase Trends ..................................................................... 33 Figure 18 – POS Client – Base Systems Purchase Trend by Retail Segment ...................... 34 Figure 19 – POS Client – Base System Purchase Trend by Retail Tier ................................ 34 Figure 20 – POS Software Purchase Trend By Retail Segment ............................................ 35 Figure 21 – POS Software Purchase Trend by Retail Tier ..................................................... 35 Figure 22 – POS Printers Purchase Trend by Retail Segment .............................................. 36 Figure 23 – POS Printers Purchase Trend by Retail Tier ...................................................... 36 Figure 24 – POS Scanner (2D) Purchase Trend by Retail Segment ...................................... 37 Figure 25 – POS Scanners (2D) Purchase Trend by Retail Tier ............................................ 37 Figure 26 – POS Scanner (Cell Phone) Purchase Trend by Retail Segment ....................... 38 Figure 27 – POS Scanners (Cell Phone) Purchase Trend by Retail Tier .............................. 38 Figure 28 – EFT/Debit/Signature Capture Purchase Trend by Retail Segment ................. 39 Figure 29 – EFT/Debit/Signature Capture Purchase Trend by Retail Tier ......................... 39 Figure 30 – Other Store Systems ............................................................................................... 40 Figure 31 – Reduced POS HW Purchases Due to Mobile ..................................................... 40 Figure 32 – Security Technology Purchase Plans ................................................................... 42 Figure 33 – Store Mobile Spending Plans ................................................................................ 45 Figure 34 – Mobility Platform for Store Associates ............................................................... 46
© Copyright 2013 IHL Group – All Rights Reserved. www.ihlservices.com 6
2013 RIS News/IHL Group Store Systems Study
Figure 35 – Mobile Platform for Store Associates / Managers by Retail Segment ............ 47 Figure 36 – Mobile Platform for Store Associates / Managers by Retail Tier ..................... 48 Figure 37 – Store Associate Mobility Hardware Plans .......................................................... 48 Figure 38 – Store Associate Mobility Hardware Plans .......................................................... 49 Figure 39 – Store Associate Mobility Software Plans ............................................................ 50 Figure 40 – Plans for Protecting Consumer Grade Devices .................................................. 52 Figure 41 – Consumer Mobile App Purchase Intent ............................................................. 53 Figure 42 – Consumer Payment Through Smartphones ....................................................... 54 Figure 43 – Mobile Payment Solutions Plans ......................................................................... 56 Figure 44 – Big Data Impact ...................................................................................................... 57 Figure 45 – Cross Channel Purchase Intent ............................................................................ 58 Figure 46 – Status of RFID Implementation ............................................................................ 60 Figure 47 – Timeframe for Most SKU’s to be RFID Tagged ................................................. 61

© Copyright 2013 IHL Group – All Rights Reserved. www.ihlservices.com 7
2013 RIS News/IHL Group Store Systems Study
SUMMARY OF FINDINGS
In no particular order, here are some of the key findings contained in this report.
• Retailers expect to step up the pace of expansion as 66% of the respondents are planning new stores in 2013 and 58% are planning an increase in IT headcount.
• This increased expansion parallels IT investment, as both Enterprise IT spend and Store IT Spend are expected to grow for 2013.
o Enterprise IT Spend is expected to grow 4.8% from last year (last year’s number was 2.6%). Mobile technology and Big Data will have a healthy say in the spend numbers.
Specialty Softgoods and Hospitality providers are the expected leaders, as both anticipate a 6.6% increase over last year. Food/Drug/C‐Stores are at 4.6% and Specialty Hardgoods are at 4.5%.
Tier III‐V retailers anticipate 6.2% growth over last year, followed by Tier II and Tier I (4.5% and 4.4% respectively).
o Store IT Spend is expected to grow 4.0% from last year (last year’s number was 3.1%). Mobile technology, involving devices owned by both retailers and consumers, will have a big impact.
Hospitality providers are the clear leaders as they anticipate a 6.8% increase over last year. Specialty Softgoods are next at 5.7%. Department Stores and Mass Merchants are anticipating a 0.6% decline from last year.
Tier III‐V retailers are the leaders here as well, as they anticipate 5.5% growth over last year, followed by Tier II and Tier I (4.3% and 3.4% respectively).
• POS Shipments are showing growth, but it looks to be more subdued than in 2012, as the effect of Mobile continues to take hold.
o Food/Grocery retailers are the leading targets for POS Hardware (25% plan to purchase in the next 12 months) and Software (31%).
o The smallest retailers are showing the greatest desire for POS Hardware and Software for the coming year, with 25% and 29% respectively planning purchases.
o The top store system priorities were the same as last year, as Mobile for Associates and Mobile for Consumers took the top two spots, respectively. Advanced CRM/Loyalty was third and Cross Channel

© Copyright 2013 IHL Group – All Rights Reserved. www.ihlservices.com 8
2013 RIS News/IHL Group Store Systems Study
Integration was fourth. PCI Compliance continues to move down the list; it is tied for seventh this year, down from fourth last year.
• Longtime leaders Epicor, MICROS and Retalix are the POS software vendors with the most consideration going forward for the respondent retailers. That said, IBM, who has held the leading ranking in this report in years past, has dropped precipitously since their acquisition by Toshiba in 2012. This is less a technical issue than a marketing/name recognition issue (the new company name is Toshiba Global Commerce).
• As with the past couple of years, Mobile looms large, as nearly one‐third of retailers are looking to adopt Tablets or Non‐Rugged Handhelds in the next 12 months.
o Specialty retailers, already the spend leaders for In‐store Mobile, expect to further increase that spend, with Softgoods and Hardgoods retailers planning for increases of 7.2% and 5.5%, respectively.
Softgoods retailers will be buying Tablets (38% claim a planned purchase).
Hardgoods retailers will be buying Non‐Rugged Handhelds (smartphones, 44%).
o Department Stores offer the contrarian view, as they expect a decrease in Store IT spend, but a 2.9% increase in In‐Store Mobile spend. Forty percent (40%) of them plan to purchase Tablets for their stores.
o Thirty‐eight percent (38%) of Food/Grocery retailers plan to purchase Tablets in the next 12 months.
o Those retailers planning to use Mobile POS in the next 3 years anticipate a 12.4% decline in the number of traditional POS terminals they will be purchasing.
• Big Data makes its presence known this year, as 74% of respondents expect their IT spend on the technology to increase.
o Food/Drug/C‐stores and Specialty Softgoods retailers are the most bullish, with expected spend increases of 5.8% and 5.6% respectively.
o Department Stores will be the ones watching their investment most closely, since they are anticipating an overall decline in IT Spend of 0.4%, while their spend on Big Data increases 4.4%.
• Of the survey respondents, 53% were retailers with over $1 Billion in annual revenue. These are the players driving the most in terms of IT spend dollars.
• Twenty‐one percent (21%) of retailers claim that they currently have EMV/Chip&PIN capability in their stores (one year after VISA announced a new

© Copyright 2013 IHL Group – All Rights Reserved. www.ihlservices.com 9
2013 RIS News/IHL Group Store Systems Study
push to accelerate the technology’s use in the US). Another 37% plan to adopt within the next 24 months.
• Forty‐six percent (46%) of all retailers say that they use end‐to‐end encryption for payments, and forty‐three percent (43%) claim their payment app is on a separate network. These figure are both up from last year.
• Over one‐quarter of retailers (27%) indicated that they will adopt item‐level RFID for most of their SKU’s within three years.
• Key payment apps for use on consumer‐owned devices include Daily Deals/Flash Sales (29% of retailers are making plans) and Coupons on a Mobile Phone (40% of Department Stores, 36% of Specialty Softgoods).
• Currently, 21% of retailers claim that their merchandise planning and allocation systems are truly integrated cross‐channel. Their expectations are to have 50% of them fully integrated within the next 2 years.
© Copyright 2013 IHL Group – All Rights Reserved. www.ihlservices.com 10
2013 RIS News/IHL Group Store Systems Study
1.0 INTRODUCTION
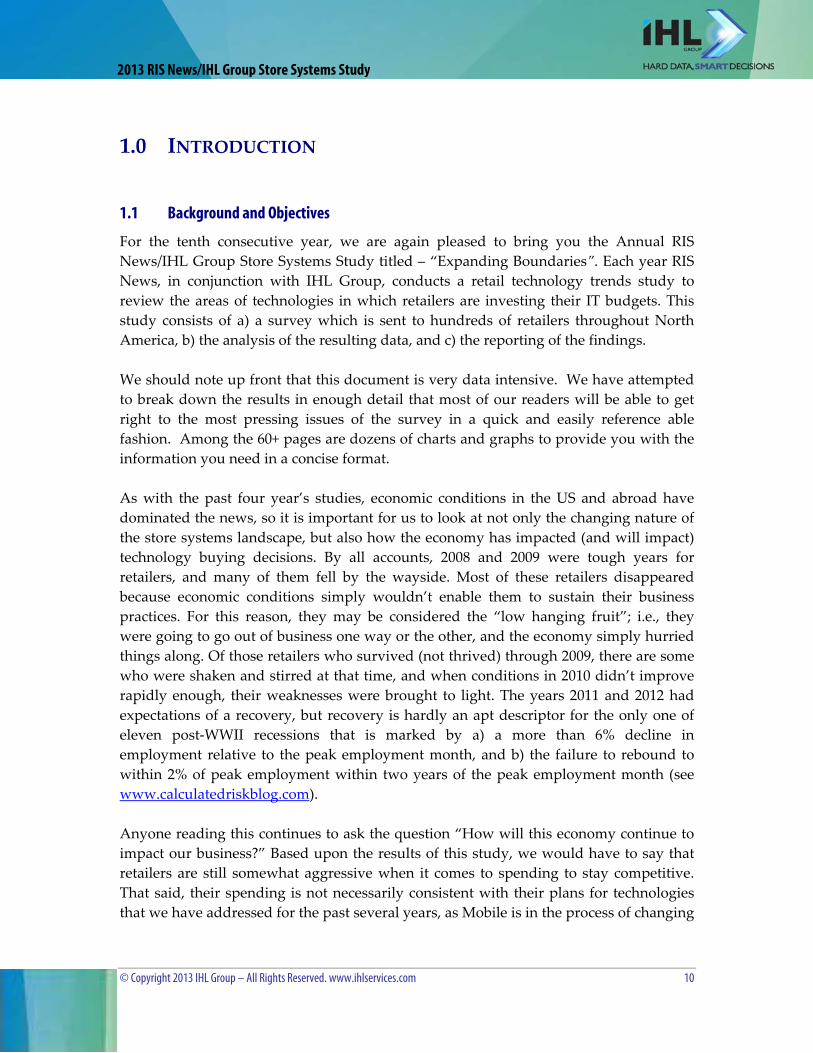
1.1 Background and Objectives
For the tenth consecutive year, we are again pleased to bring you the Annual RIS News/IHL Group Store Systems Study titled – “Expanding Boundaries”. Each year RIS News, in conjunction with IHL Group, conducts a retail technology trends study to review the areas of technologies in which retailers are investing their IT budgets. This study consists of a) a survey which is sent to hundreds of retailers throughout North America, b) the analysis of the resulting data, and c) the reporting of the findings. We should note up front that this document is very data intensive. We have attempted to break down the results in enough detail that most of our readers will be able to get right to the most pressing issues of the survey in a quick and easily reference able fashion. Among the 60+ pages are dozens of charts and graphs to provide you with the information you need in a concise format. As with the past four year’s studies, economic conditions in the US and abroad have dominated the news, so it is important for us to look at not only the changing nature of the store systems landscape, but also how the economy has impacted (and will impact) technology buying decisions. By all accounts, 2008 and 2009 were tough years for retailers, and many of them fell by the wayside. Most of these retailers disappeared because economic conditions simply wouldn’t enable them to sustain their business practices. For this reason, they may be considered the “low hanging fruit”; i.e., they were going to go out of business one way or the other, and the economy simply hurried things along. Of those retailers who survived (not thrived) through 2009, there are some who were shaken and stirred at that time, and when conditions in 2010 didn’t improve rapidly enough, their weaknesses were brought to light. The years 2011 and 2012 had expectations of a recovery, but recovery is hardly an apt descriptor for the only one of eleven post‐WWII recessions that is marked by a) a more than 6% decline in employment relative to the peak employment month, and b) the failure to rebound to within 2% of peak employment within two years of the peak employment month (see www.calculatedriskblog.com). Anyone reading this continues to ask the question “How will this economy continue to impact our business?” Based upon the results of this study, we would have to say that retailers are still somewhat aggressive when it comes to spending to stay competitive. That said, their spending is not necessarily consistent with their plans for technologies that we have addressed for the past several years, as Mobile is in the process of changing
© Copyright 2013 IHL Group – All Rights Reserved. www.ihlservices.com 11
2013 RIS News/IHL Group Store Systems Study
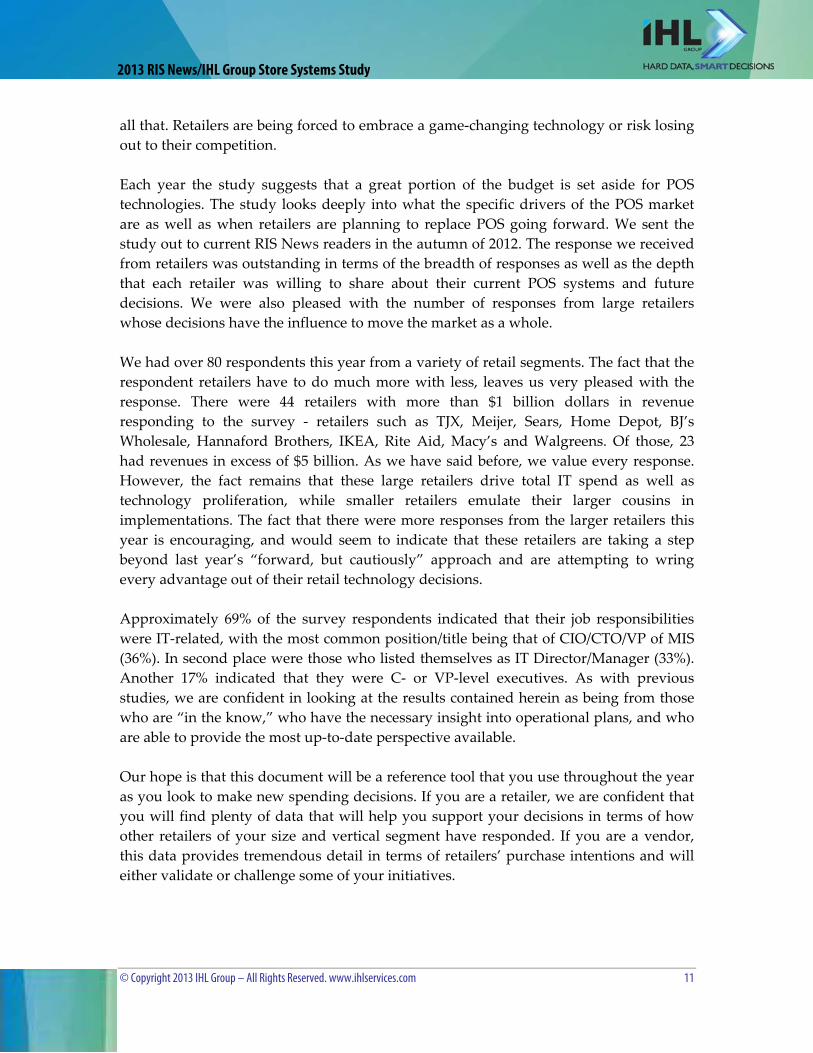
all that. Retailers are being forced to embrace a game‐changing technology or risk losing out to their competition. Each year the study suggests that a great portion of the budget is set aside for POS technologies. The study looks deeply into what the specific drivers of the POS market are as well as when retailers are planning to replace POS going forward. We sent the study out to current RIS News readers in the autumn of 2012. The response we received from retailers was outstanding in terms of the breadth of responses as well as the depth that each retailer was willing to share about their current POS systems and future decisions. We were also pleased with the number of responses from large retailers whose decisions have the influence to move the market as a whole. We had over 80 respondents this year from a variety of retail segments. The fact that the respondent retailers have to do much more with less, leaves us very pleased with the response. There were 44 retailers with more than $1 billion dollars in revenue responding to the survey ‐ retailers such as TJX, Meijer, Sears, Home Depot, BJ’s Wholesale, Hannaford Brothers, IKEA, Rite Aid, Macy’s and Walgreens. Of those, 23 had revenues in excess of $5 billion. As we have said before, we value every response. However, the fact remains that these large retailers drive total IT spend as well as technology proliferation, while smaller retailers emulate their larger cousins in implementations. The fact that there were more responses from the larger retailers this year is encouraging, and would seem to indicate that these retailers are taking a step beyond last year’s “forward, but cautiously” approach and are attempting to wring every advantage out of their retail technology decisions. Approximately 69% of the survey respondents indicated that their job responsibilities were IT‐related, with the most common position/title being that of CIO/CTO/VP of MIS (36%). In second place were those who listed themselves as IT Director/Manager (33%). Another 17% indicated that they were C‐ or VP‐level executives. As with previous studies, we are confident in looking at the results contained herein as being from those who are “in the know,” who have the necessary insight into operational plans, and who are able to provide the most up‐to‐date perspective available. Our hope is that this document will be a reference tool that you use throughout the year as you look to make new spending decisions. If you are a retailer, we are confident that you will find plenty of data that will help you support your decisions in terms of how other retailers of your size and vertical segment have responded. If you are a vendor, this data provides tremendous detail in terms of retailers’ purchase intentions and will either validate or challenge some of your initiatives.

© Copyright 2013 IHL Group – All Rights Reserved. www.ihlservices.com 12
2013 RIS News/IHL Group Store Systems Study
1.2 How to Read This Document
Before you start reading these results we want to offer you some direction. First, although we talk about percentages of interest in things like POS Scanners, desires for certain new technologies, lack of interest in others, keep in mind that this is a purchase intention study – not a market share study. And although there is a temptation to equate purchase intention with future market share, this would be an erroneous use of the data. There are many other factors that must be considered such as # of store locations, # of POS units, and whether all stores will be replaced that would have to be weighted to get a true market share document. Secondly, we are not naïve in our view of the market and the realization that a significant factor in any purchase decision is how far out the retailer is from actually signing the contracts. In our study we often reference several items where the data changes significantly as the date of final decision nears. It would be the data on decisions in the next 6‐12 months that would be the best predictor of the final decisions. Finally, it may be important for you understand the complete context of the survey in the manner in which the questions are asked. If you would like to review the entire survey, you can do so at the following link:
http://www.surveymonkey.com/s.aspx?PREVIEW_MODE=DO_NOT_USE_THIS_LINK_FOR_COLLECTION&sm=Gw9LRFI%2b0%2fhSdreQUHReT%2bT1rtG7vT5WMnYD2x%2bmm14%3d
1.3 Methodology
The data for this study were obtained by performing a web‐based survey, the invitations for which were distributed to RIS News readers during the October‐November 2012 timeframe. The survey consisted of 21 questions, the topics of which included:
• Demographic Information – Retail segment, title/position, annual sales, store count, etc.
• Financial Issues – Store & Headcount growth, spend trends, etc.
• Store System Issues – Store system priorities, purchase timeframes, POS replacement due to Mobile POS, preferred POS software vendors, etc.
• Mobility – Platforms being considered for Stores and the Enterprise, functions to be incorporated, mobile payment solutions, consumer interaction, etc
• Other Issues – Payment security technologies, IT and Marketing relationship, technology impact on IT infrastructure, workforce management, cross channel issues, Big Data, RFID
When the response timeframe expired, we set about cleaning and analyzing the data. Once we obtained the key summary points from the data, we delivered these for the

© Copyright 2013 IHL Group – All Rights Reserved. www.ihlservices.com 13
2013 RIS News/IHL Group Store Systems Study
Respondents by Retail Segment
Specialty Hard 33%
Specialty Soft 29%
Hospitality5%
Dept. Stores / Mass Merch
8%
Food / Drug / C‐Stores25%
summary publication mentioned above, a live presentation at NRF, and a Webex presentation (which can be found at http://www.risnews.com by clicking on the Events link in the navigation bar at the top of the page). After the summary data were delivered, detailed analysis work continued, with the result being this document. We believe the reader will be extremely intrigued by the results that we found.
1.4 Demographics – Who Responded?
Figure 1 – Respondents by Retail Segment
The 80+ respondents to this year’s survey came from a variety of retail segments. Given the nature of increasing workloads and perhaps a more detailed questionnaire this year, we couldn’t be more pleased with the response. As in previous years, the three most predominant categories of retailers responding to the survey were Specialty Hardgoods (33%), Specialty Softgoods (29%) and Food/Drug/C‐Stores (25%), which together accounted for 87% of the survey responses. This percentage is a bit higher than in previous years as we continue to see these retailers solidify their technology position. And while that 87% figure might seem like it is too large a portion of the sample as a whole, it is actually not an unreasonable
© Copyright 2013 IHL Group – All Rights Reserved. www.ihlservices.com 14
2013 RIS News/IHL Group Store Systems Study
Respondents by Title / Position
IT Dir ‐ Mgr33% CIO/CTO/VP
of MIS36%
Other14%
Non‐IT C‐Level 10%
Non‐IT VP‐Level 7%
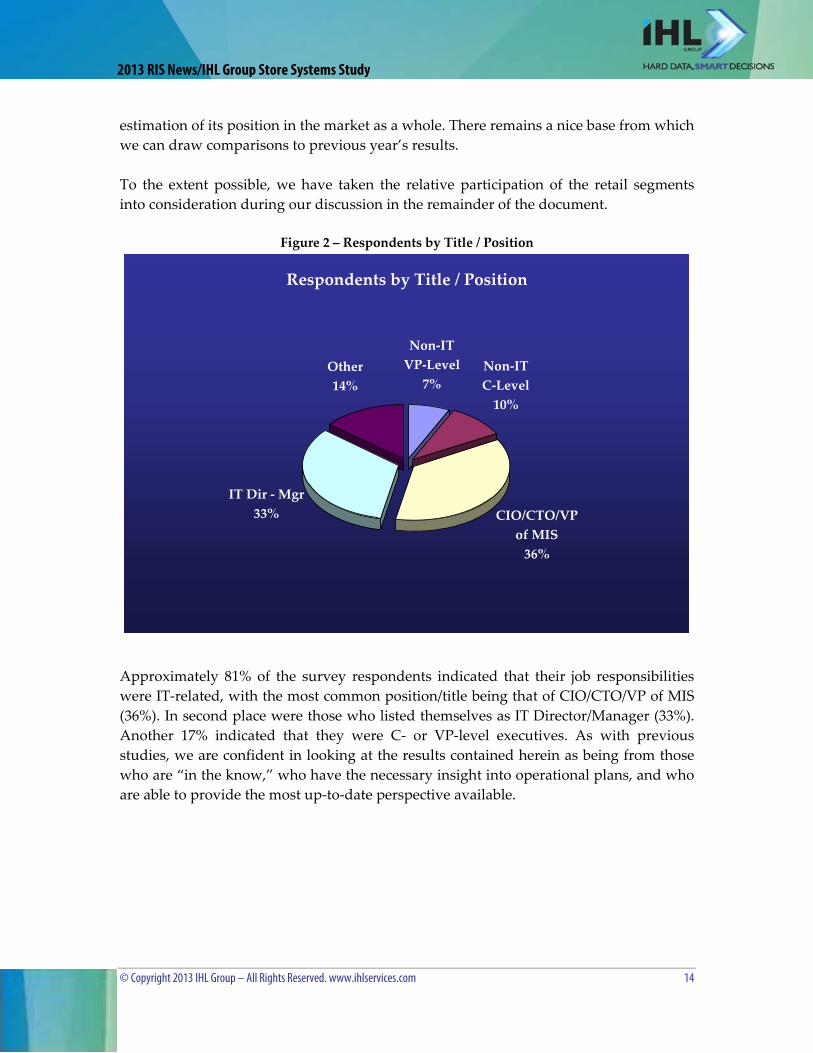
estimation of its position in the market as a whole. There remains a nice base from which we can draw comparisons to previous year’s results. To the extent possible, we have taken the relative participation of the retail segments into consideration during our discussion in the remainder of the document.
Figure 2 – Respondents by Title / Position
Approximately 81% of the survey respondents indicated that their job responsibilities were IT‐related, with the most common position/title being that of CIO/CTO/VP of MIS (36%). In second place were those who listed themselves as IT Director/Manager (33%). Another 17% indicated that they were C‐ or VP‐level executives. As with previous studies, we are confident in looking at the results contained herein as being from those who are “in the know,” who have the necessary insight into operational plans, and who are able to provide the most up‐to‐date perspective available.
© Copyright 2013 IHL Group – All Rights Reserved. www.ihlservices.com 15
2013 RIS News/IHL Group Store Systems Study
Respondents by Annual Revenue
$250 Million ‐ $1 Billion27%
Under $250 Million
20%
$1‐5 Billion25%
Over $5 Billion 28%
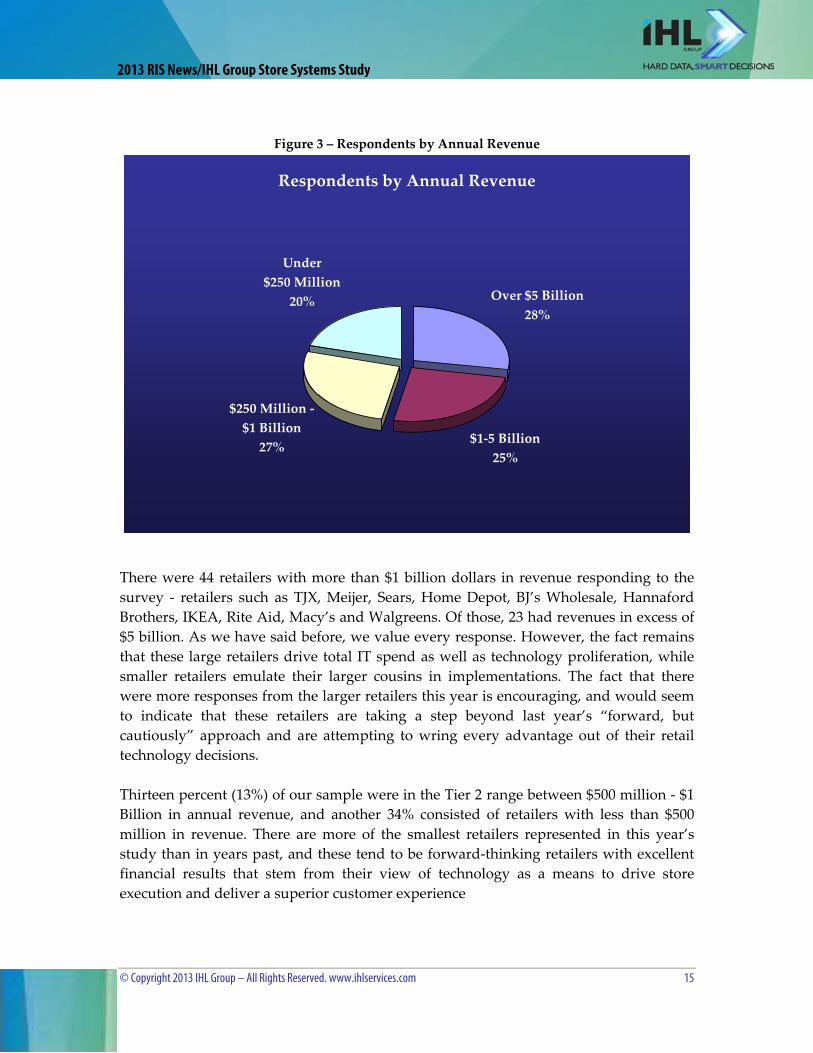
Figure 3 – Respondents by Annual Revenue
There were 44 retailers with more than $1 billion dollars in revenue responding to the survey ‐ retailers such as TJX, Meijer, Sears, Home Depot, BJ’s Wholesale, Hannaford Brothers, IKEA, Rite Aid, Macy’s and Walgreens. Of those, 23 had revenues in excess of $5 billion. As we have said before, we value every response. However, the fact remains that these large retailers drive total IT spend as well as technology proliferation, while smaller retailers emulate their larger cousins in implementations. The fact that there were more responses from the larger retailers this year is encouraging, and would seem to indicate that these retailers are taking a step beyond last year’s “forward, but cautiously” approach and are attempting to wring every advantage out of their retail technology decisions. Thirteen percent (13%) of our sample were in the Tier 2 range between $500 million ‐ $1 Billion in annual revenue, and another 34% consisted of retailers with less than $500 million in revenue. There are more of the smallest retailers represented in this year’s study than in years past, and these tend to be forward‐thinking retailers with excellent financial results that stem from their view of technology as a means to drive store execution and deliver a superior customer experience
© Copyright 2013 IHL Group – All Rights Reserved. www.ihlservices.com 16
2013 RIS News/IHL Group Store Systems Study
2.0 FINANCIAL EXPECTATIONS & EXPANDING HORIZONS
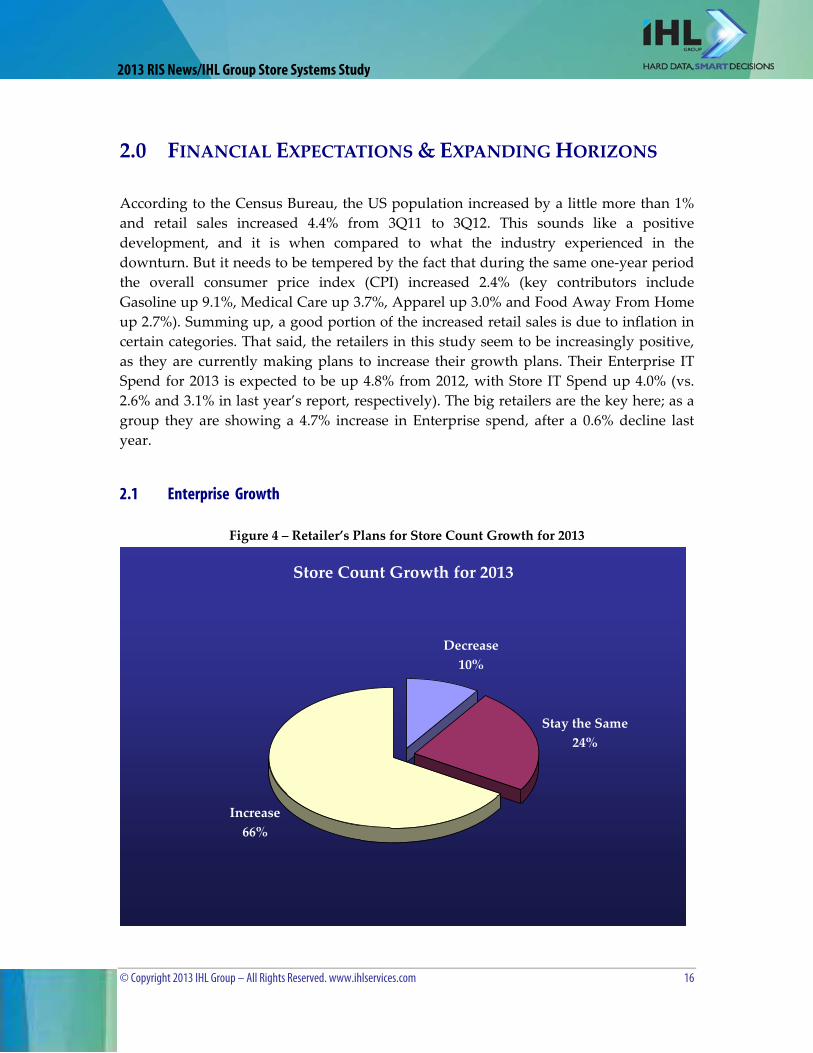
According to the Census Bureau, the US population increased by a little more than 1% and retail sales increased 4.4% from 3Q11 to 3Q12. This sounds like a positive development, and it is when compared to what the industry experienced in the downturn. But it needs to be tempered by the fact that during the same one‐year period the overall consumer price index (CPI) increased 2.4% (key contributors include Gasoline up 9.1%, Medical Care up 3.7%, Apparel up 3.0% and Food Away From Home up 2.7%). Summing up, a good portion of the increased retail sales is due to inflation in certain categories. That said, the retailers in this study seem to be increasingly positive, as they are currently making plans to increase their growth plans. Their Enterprise IT Spend for 2013 is expected to be up 4.8% from 2012, with Store IT Spend up 4.0% (vs. 2.6% and 3.1% in last year’s report, respectively). The big retailers are the key here; as a group they are showing a 4.7% increase in Enterprise spend, after a 0.6% decline last year.
2.1 Enterprise Growth
Figure 4 – Retailer’s Plans for Store Count Growth for 2013
Store Count Growth for 2013
Increase66%
Stay the Same24%
Decrease10%

© Copyright 2013 IHL Group – All Rights Reserved. www.ihlservices.com 17
2013 RIS News/IHL Group Store Systems Study
IT Hiring for 2013
Increase58%
Stay the Same36%
Decrease6%
This is the third consecutive year that we see consistent plans for store growth. This is encouraging, since retailers apparently continue to gain confidence in their business prospects going forward. Food/Grocery retailers are the most bullish when it comes to their expectations for 2013, as 88% of them expect an increase in store count. Specialty Softgoods retailers are not too far behind at 67% and Specialty Hardgoods retailers are at 61%. While the largest retailers (annual revenues greater than $25 Billion) are the “laggards” with only 40% expecting store count growth, over two‐thirds (68%) of retailers with annual revenues of $1 Billion or more anticipate increasing store count. Retailers may not be thrilled with the overall economy, but they have been able to demonstrate to themselves (and the market) that they can perform when the chips are down. Those that have survived to this point are looking to grow their footprint in days ahead, which means the competition for prime retail real estate will be fierce.
Figure 5 – Retailer’s Plans for IT Headcount Growth for 2013
In addition to growing their store count, retailers are also looking to add to their IT headcount. As before, Specialty Softgoods retailers are the ones who will be hiring most, as 67% of them expect to see an increase in their IT headcount, with an average increase
© Copyright 2013 IHL Group – All Rights Reserved. www.ihlservices.com 18
2013 RIS News/IHL Group Store Systems Study
IT Spend by Retailer Annual Revenue
4.5%4.5%
6.1%
6.8%
4.7%
3.5%3.6%
4.3%
5.5%5.8%
0.0%
1.0%
2.0%
3.0%
4.0%
5.0%
6.0%
7.0%
8.0%
Under $250Million
$250‐500 Million $500 Million ‐$1 Billion
$1‐5 Billion Over $5 Billion
Store‐Level IT Spend
Enterprise IT Spend
of 4.5%. Food/Drug/C‐Store retailers also expect to add to their numbers, as 57% expect to hire more, with an average increase of 3.1%. Specialty Hardgoods retailers will be trailing a bit, as 54% expect to add to their headcount, with the increase averaging 2.6%. The previous two figures indicate that retailers continue to be bullish on store count and IT headcount growth (66% and 58%, respectively) for 2013. Both these numbers are well up from last year, which means that retailers may be breaking out of their self‐imposed “do more with less” mentality.
2.2 2013 IT Spend Growth
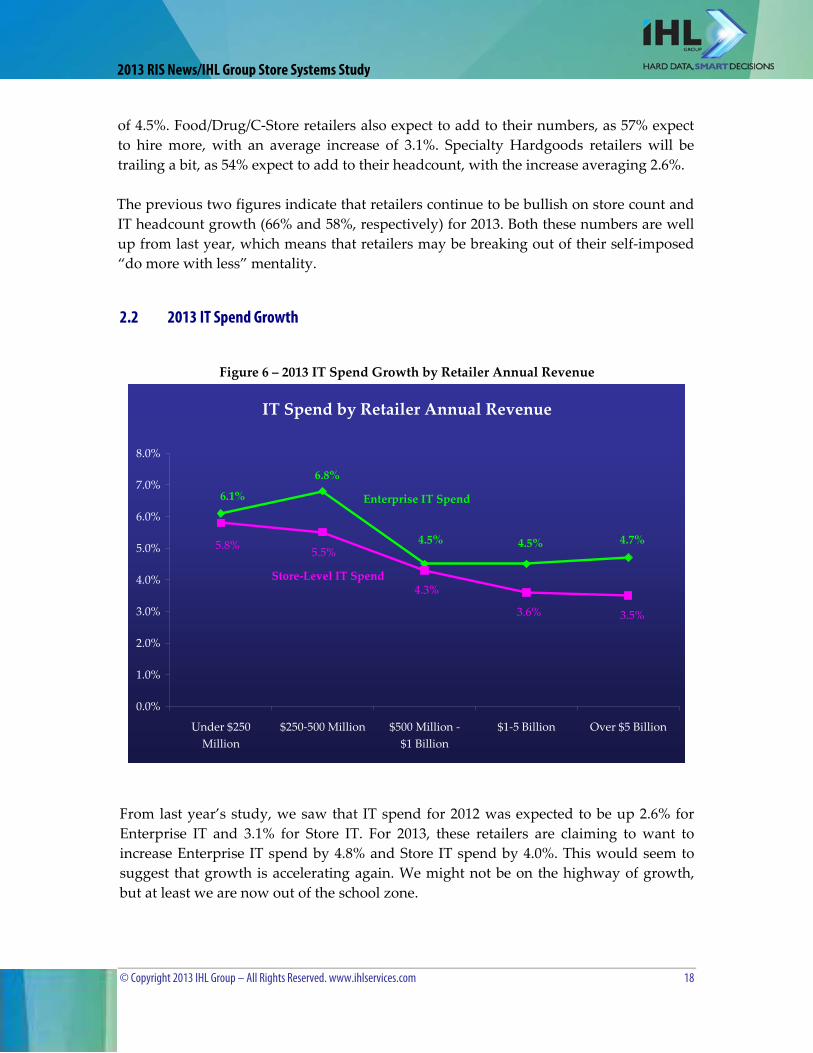
Figure 6 – 2013 IT Spend Growth by Retailer Annual Revenue
From last year’s study, we saw that IT spend for 2012 was expected to be up 2.6% for Enterprise IT and 3.1% for Store IT. For 2013, these retailers are claiming to want to increase Enterprise IT spend by 4.8% and Store IT spend by 4.0%. This would seem to suggest that growth is accelerating again. We might not be on the highway of growth, but at least we are now out of the school zone.

© Copyright 2013 IHL Group – All Rights Reserved. www.ihlservices.com 19
2013 RIS News/IHL Group Store Systems Study
Enterprise IT spend for last year’s largest retailers showed a 0.6% decline, while this year it is up 4.7%. This is significant, since these retailers represent the bulk of overall Retail IT spend. We believe that spend on Big Data and healthcare‐related IT overhead is responsible for this anticipated increase, and the forces opposing it include the declines in storage costs and cloud services (most of which were implemented last year). The smallest retailers show the heaviest increase in IT Spend growth, and this is due in part to the adoption of mobile technologies (which at this point are additive to existing systems). Those with plans for increasing their store count for 2013 are also more inclined to increase their IT Spend, with Enterprise IT going up 5.8% and Store IT going up 5.4%. Retailers do not necessarily look at capital spending for store expansion and capital spending for technology as an either/or proposition. They can do both, in measured amounts, and the data indicates they want to do so at a greater level in 2012. The flip side of that is valid also; those retailers who anticipate a net decrease in store count for 2013 are also expecting to see a decrease of 1.6% in Enterprise IT spend and a decrease of 4.3% in Store IT spend. The story there is these retailers are in a serious retrenching mode; they not only have to worry about footprint changes and the effect on profitability, they also have to make technology decisions while downsizing. Looking a bit closer at the data, 74% of our respondents plan to increase their Enterprise IT Spend for next year (compared to 54% from last year’s study). Of those, the average of the intended increase was 7.0%. For those planning a decrease in Enterprise IT Spend for 2013, their average decrease was 4.9%, which puts us in mind of a “haves vs. have nots” scenario. Those planning for their Enterprise IT Spend to stay the same totaled 19% of the respondents. When it comes to Store IT Spend, 76% planned an increase for 2013, up from 52% last year. The average increase for these retailers is 6.0%, which is down considerably from last year’s 7.6%. As with last year, the key purchases for these retailers are mobile devices, including Non‐Rugged Handhelds (36% of these retailers plan to make a purchase), Tablets (33%) and Rugged Handhelds (27%). Those mobile devices used for Mobile POS purposes continue to kick the slats out of traditional store system purchases, as only 17% of these retailers are planning a POS terminal upgrade within the next 12 months, and 22% plan to upgrade their POS software. Tablets are also at the top of their list, with 29% anticipating a purchase within the next 12 months. Fifteen percent (15%) of all retailers are anticipating a flat Store IT Spend for 2013. Of those, fully 69% claim that their current POS terminals are up‐to‐date, which means they have no serious upgrade plans for the next year. These data, coupled with that from
© Copyright 2013 IHL Group – All Rights Reserved. www.ihlservices.com 20
2013 RIS News/IHL Group Store Systems Study
previous years, serve to confirm the cyclical trend that drives POS hardware replacement and the impact of mobile. The figures for POS Printer are at 13%, and the fact that 51% claim that their printers are up‐to‐date simply means that these upgrades were accomplished in the previous year or so.
2.2.1 Enterprise IT Spend Growth
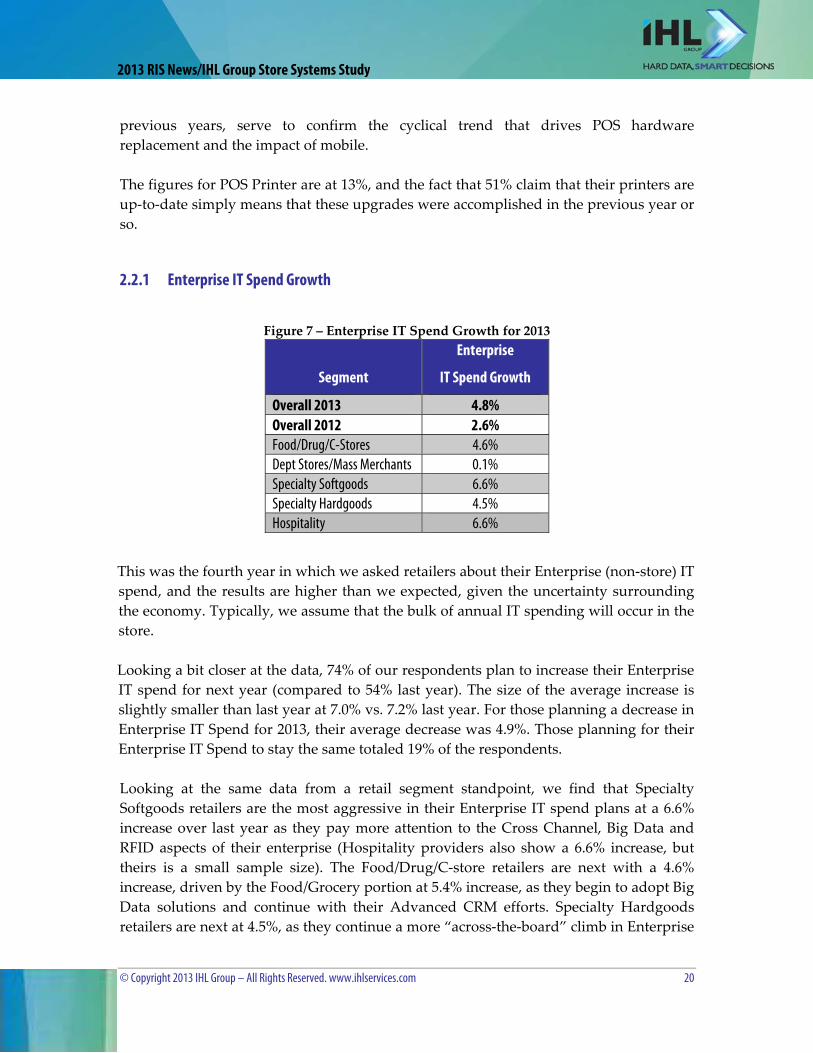
Figure 7 – Enterprise IT Spend Growth for 2013
Segment
Enterprise
IT Spend Growth
Overall 2013 4.8%Overall 2012 2.6%Food/Drug/C-Stores 4.6%Dept Stores/Mass Merchants 0.1%Specialty Softgoods 6.6%Specialty Hardgoods 4.5%Hospitality 6.6%
This was the fourth year in which we asked retailers about their Enterprise (non‐store) IT spend, and the results are higher than we expected, given the uncertainty surrounding the economy. Typically, we assume that the bulk of annual IT spending will occur in the store. Looking a bit closer at the data, 74% of our respondents plan to increase their Enterprise IT spend for next year (compared to 54% last year). The size of the average increase is slightly smaller than last year at 7.0% vs. 7.2% last year. For those planning a decrease in Enterprise IT Spend for 2013, their average decrease was 4.9%. Those planning for their Enterprise IT Spend to stay the same totaled 19% of the respondents. Looking at the same data from a retail segment standpoint, we find that Specialty Softgoods retailers are the most aggressive in their Enterprise IT spend plans at a 6.6% increase over last year as they pay more attention to the Cross Channel, Big Data and RFID aspects of their enterprise (Hospitality providers also show a 6.6% increase, but theirs is a small sample size). The Food/Drug/C‐store retailers are next with a 4.6% increase, driven by the Food/Grocery portion at 5.4% increase, as they begin to adopt Big Data solutions and continue with their Advanced CRM efforts. Specialty Hardgoods retailers are next at 4.5%, as they continue a more “across‐the‐board” climb in Enterprise
© Copyright 2013 IHL Group – All Rights Reserved. www.ihlservices.com 21
2013 RIS News/IHL Group Store Systems Study
IT spend. As with Specialty Softgoods retailers, their spend will focus on Cross Channel, Big Data and RFID. Department Stores are the true laggards here, with expectations of a 0.4% decline in Enterprise IT spend from last year. Their focus will be on Big Data and Cross Channel, with a healthy dose of PCI Compliance tossed in. These retailers continue to be under great pressure to not only reduce store counts but remain viable in the marketplace. Convenience/Gas retailers (0.0%) and Hospitality providers (3.3%) both have small sample size issues, but both are showing a decreased aversion to spending in the enterprise, as both were in the negative region last year (C‐Stores were at ‐4.9% and Hospitality was at ‐5.0%).
2.2.2 Store IT Spend Growth
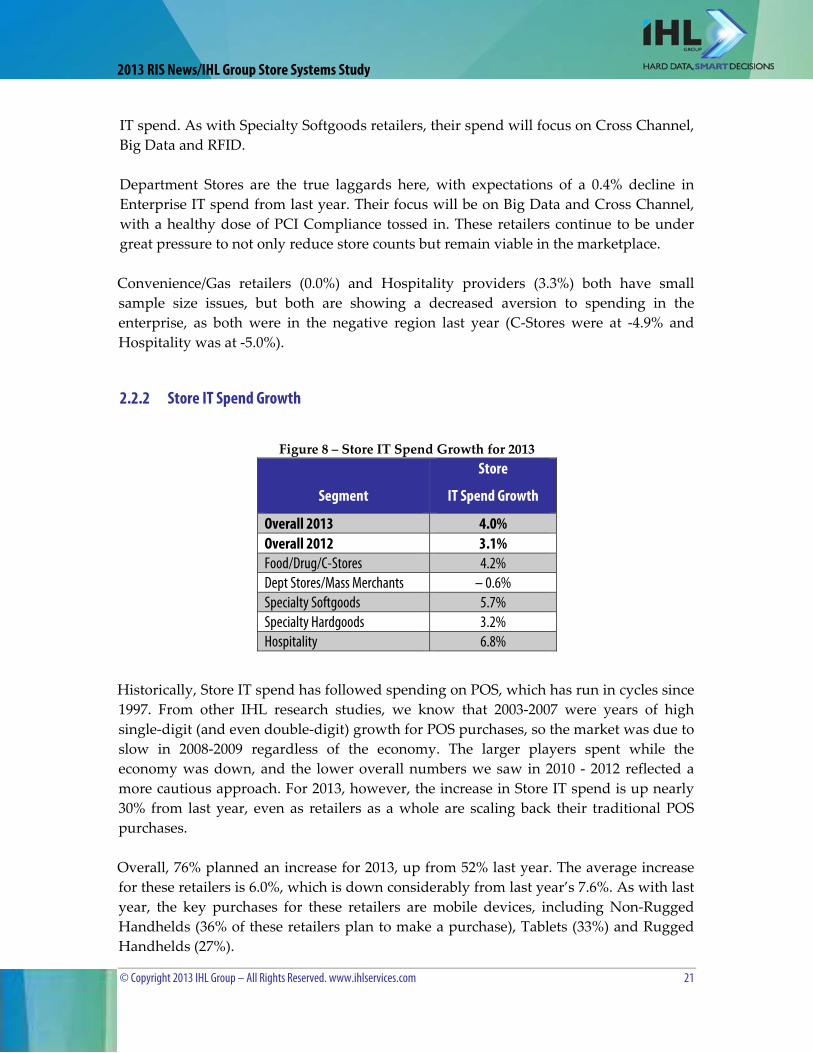
Figure 8 – Store IT Spend Growth for 2013
Segment
Store
IT Spend Growth
Overall 2013 4.0%Overall 2012 3.1%Food/Drug/C-Stores 4.2%Dept Stores/Mass Merchants – 0.6%Specialty Softgoods 5.7%Specialty Hardgoods 3.2%Hospitality 6.8%
Historically, Store IT spend has followed spending on POS, which has run in cycles since 1997. From other IHL research studies, we know that 2003‐2007 were years of high single‐digit (and even double‐digit) growth for POS purchases, so the market was due to slow in 2008‐2009 regardless of the economy. The larger players spent while the economy was down, and the lower overall numbers we saw in 2010 ‐ 2012 reflected a more cautious approach. For 2013, however, the increase in Store IT spend is up nearly 30% from last year, even as retailers as a whole are scaling back their traditional POS purchases. Overall, 76% planned an increase for 2013, up from 52% last year. The average increase for these retailers is 6.0%, which is down considerably from last year’s 7.6%. As with last year, the key purchases for these retailers are mobile devices, including Non‐Rugged Handhelds (36% of these retailers plan to make a purchase), Tablets (33%) and Rugged Handhelds (27%).

© Copyright 2013 IHL Group – All Rights Reserved. www.ihlservices.com 22
2013 RIS News/IHL Group Store Systems Study
Those devices used for Mobile POS purposes continue to kick the slats out of traditional store system purchases, as only 17% of the retailers planning an increase in Store IT spend are planning a POS terminal upgrade within the next 12 months, and 22% plan to upgrade their POS software. Tablets are also at the top of their list, with 29% anticipating a purchase within the next 12 months. The figures for POS Printer are at 13%, and the fact that 51% claim that their printers are up‐to‐date simply means that these upgrades were accomplished in the previous year or so. Fifteen percent (15%) of all retailers are anticipating a flat Store IT Spend for 2013. Of those, fully 69% claim that their current POS terminals are up‐to‐date, which means they have no serious upgrade plans for the next year. These data, coupled with that from previous years, serve to confirm the cyclical trend that drives POS hardware replacement and the impact of mobile. It also confirms that big POS upgrades require significantly higher budgets for the stores for those years, and then the budgets drop off in subsequent years at a similar rate. From a retail segment standpoint, we see Specialty Softgoods retailers out front again, with a 5.7% increase over last year, with store‐level mobile solutions Cross Channel capabilities and Advanced CRM, with a bit of POS Software thrown in, as being the drivers. Half of these retailers will be looking for a POS terminal upgrade within the next 3 years, and an equal number will be looking for Tablets in the same timeframe. The difference comes in the next 12 months, as 38% will be looking for Tablets, and 25% for POS terminals. Food/Grocery is close behind with an expected Store IT spend increase of 5.2% for 2013. They too are looking at Tablets over the next 12 months (38% claim to be), as well as POS Scanners and POS Software (31% each). There is no doubt that food shopping behaviors have changed in the past couple of years to less expensive options. The growth of generic food sales and the ever‐expanding presence of chains like Aldi (who currently has about 1,300 stores in the US) are ample evidence of this. The key to this segment is using tools like IHL’s Sophia product to identify which accounts are increasing and which accounts are decreasing their spend. Case in point, at least six of the top 20 retailers in this segment in North America will have storecount declines in 2012. In our survey, of the 87% of grocers increasing spending, their average planned increase is 6.0%. The remaining 13% plan to keep their Store IT spend level the same. Key technologies these retailers will be seeking include Advanced CRM, Store‐level BI and Mobile. The sustenance nature of their offerings drives their continued Store IT investment (sustenance takes precedence in uncertain economic times).

© Copyright 2013 IHL Group – All Rights Reserved. www.ihlservices.com 23
2013 RIS News/IHL Group Store Systems Study
Specialty Hardgoods are next in line, and they expect to see a 3.2% increase in Store IT spend, which is close to the 3.3% increase they saw last year. Non‐rugged Handhelds (44% plan a purchase in the next 12 months) and Tablets (31%) are big for them, as are 2D POS Scanners (26%) and Cross Channel capability (36%). Drug Store retailers have scaled back their spend plans from last year’s 7.3% increase to a more modest 3.3% for 2013 (note that this segment is one with a small sample size). We have mentioned before the footprint problem that Drug Stores have. Simply, the trend over the past decade or so shows them to have an ever‐increasing portion of their revenues coming from prescription drug sales. The pharmacy tends to occupy a smaller portion of the overall store footprint than the “front‐of‐store” items. If this trend continues, we expect to see Drug Stores spending money in the stores, but for renovations to increase this footprint, with only a small portion going to IT. That said, we are seeing more Drug Stores adopting some of the smaller footprint Self‐Checkout, and their spend plans for the next 12 months are aimed at Kiosks, POS Scanners and Non‐rugged Handhelds. Hospitality providers (small sample size) are anticipating a 6.8% increase in Store IT spend, which is up considerably from last year’s 1.3% increase. That increase will be driven mainly by increased restaurant counts, along with purchases in the next 12 months of Digital Signage and Kiosks (50% indicate so for each) and POS Printers (25%) Mass Merchants (1.3% increase in Store IT spend) continue to evolve as Walmart continues to replace their Discount Store format with the Supercenter format. For every one of those stores that gets converted, 8‐10 dollar stores need to crop up just to keep the POS installed base the same, and that doesn’t even touch on the other store IT involved (networking, communications, kiosks, etc). POS Scanners and EFT devices are their main focus of spend for the coming year. Convenience Stores anticipate a 2.5% decrease in Store IT spend for 2013, though this is based upon a small sample size. These are the smallest retailers in this report, and as gas prices remain in the $3.50 range, people continue to shy away from buying the higher margin items in the store. These retailers spent a fair amount on updating older technology and bringing about PCI compliance in the past handful of years, so a slowdown in spending is understandable. Department Stores don’t suffer quite the small sample size issues of some other segments, but they expect a 1.4% decline in Store IT spend from last year. These retailers are showing no interest whatsoever for spending on traditional POS technologies in the next 12 months. Still, that is to be expected because they hold onto their POS systems longer than anyone except Food/Grocery. Their heaviest interest over the next 12 months lies in Tablets, for which 40% of them claim to want to spend.

© Copyright 2013 IHL Group – All Rights Reserved. www.ihlservices.com 24
2013 RIS News/IHL Group Store Systems Study
For those planning a decrease in Store IT spend, their average decrease is expected to be 6.6%, which is better than last year’s 8.0% decline. Still, tablets are also at the top of their list, with 29% anticipating a purchase within the next 12 months. Forty‐two percent (42%) of these retailers say that their purchase timeframe for new POS terminals is 3 years or more out. All this said, from other IHL research studies we know that the POS market was due for an increase in 2010 and 2011 driven by replacement cycles rather than the economy as a whole. For 2012, we saw a slight increase, with a smaller increase expected for 2013. Store IT spend may be increasing, but it is being directed at non‐traditional POS avenues.
2.3 Store IT Spend Growth by POS Software Vendors Under Consideration
Figure 9 – Store IT Spend Growth by POS Software Vendor Store IT Spend Growth by POS SW Vendor
Planned IT Spend Growth
Overall 4.0%Microsoft POS 5.5%Wincor-Nixdorf 5.4%JDA 5.4%CrossView 4.8%Oracle 4.7%Epicor 4.5%NCR 4.4%MICROS 3.3%Red Prairie 3.3%Retalix 2.8%
The table above resulted from our desire to look at the spend outlook for the retailers in relation to the POS software vendors they were considering for their next upgrade. In reviewing this data, we recommend that the reader avoid a chicken‐or‐the‐egg line of thinking. Simply, the group of retailers who are looking at Microsoft for their next POS upgrade are planning a 5.5% increase in their Store IT spend; we would hesitate in claiming that they are planning this increase because they are considering Microsoft. Further, it is simply not valid to claim that choosing Retalix will result in a 40% lower IT spend increase than choosing Oracle. Rather, the resulting figures have more to do with the type of retailers considering a particular company for their POS software (i.e., JDA is
© Copyright 2013 IHL Group – All Rights Reserved. www.ihlservices.com 25
2013 RIS News/IHL Group Store Systems Study
considered by Specialty retailers, Retalix is considered by Food/Grocery, etc). From that standpoint, it is valid to say that if a retailer is considering Vendor A for their next POS software purchase, then the like‐minded group of retailers who are also considering Vendor A are expecting to see IT Spend Growth of X%.
© Copyright 2013 IHL Group – All Rights Reserved. www.ihlservices.com 26
2013 RIS News/IHL Group Store Systems Study
Top Store System Priorities
32%
32%
36%
38%
45%
54%
58%
61%
32%
23%
21%
0% 10% 20% 30% 40% 50% 60% 70%
Clientelling/Assisted Selling
Workforce Management
Customer Centricity
Business Intelligence (Store Level)
PCI Compliance
Inventory Visibility
Updated Payment Terminals
Cross Channel Integration
Advanced CRM/Loyalty Programs
Mobile for Consumers
Mobile for Associates
3.0 STORE SYSTEM PRIORITIES
3.1 Store System Priorities
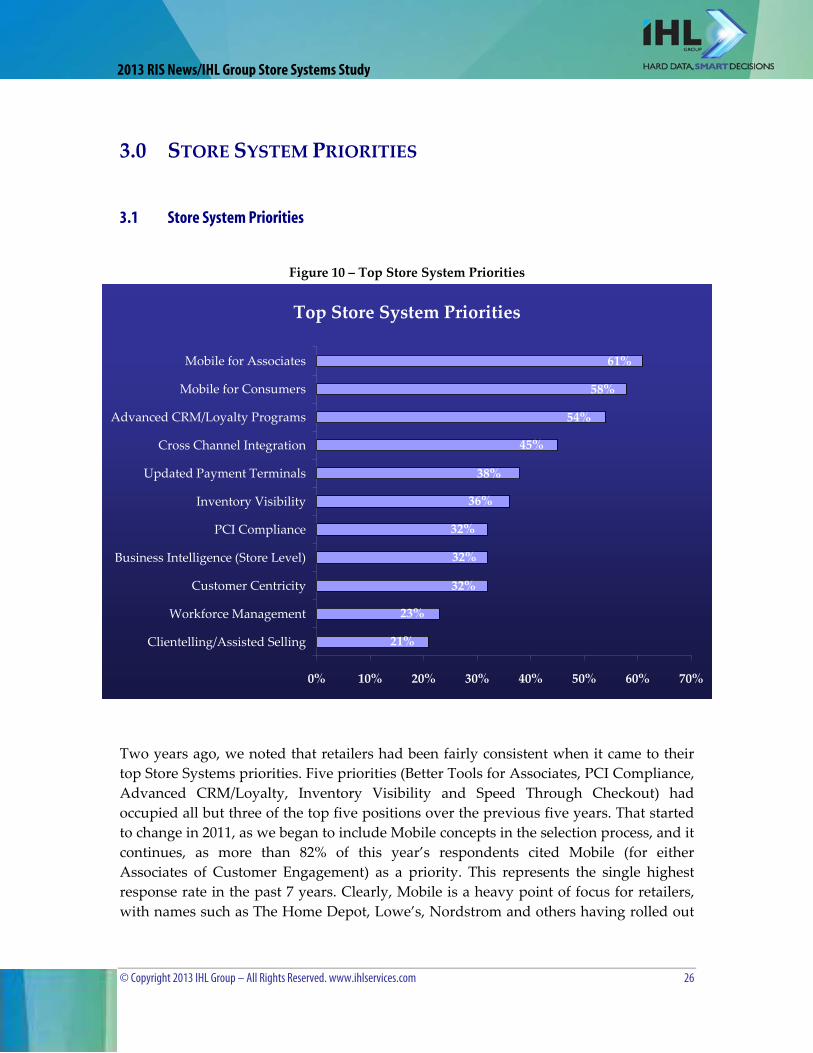
Figure 10 – Top Store System Priorities
Two years ago, we noted that retailers had been fairly consistent when it came to their top Store Systems priorities. Five priorities (Better Tools for Associates, PCI Compliance, Advanced CRM/Loyalty, Inventory Visibility and Speed Through Checkout) had occupied all but three of the top five positions over the previous five years. That started to change in 2011, as we began to include Mobile concepts in the selection process, and it continues, as more than 82% of this year’s respondents cited Mobile (for either Associates of Customer Engagement) as a priority. This represents the single highest response rate in the past 7 years. Clearly, Mobile is a heavy point of focus for retailers, with names such as The Home Depot, Lowe’s, Nordstrom and others having rolled out
© Copyright 2013 IHL Group – All Rights Reserved. www.ihlservices.com 27
2013 RIS News/IHL Group Store Systems Study
hundreds of thousands of devices to their stores, in part to put their store associates on somewhat equal footing with their smartphone‐weilding customers. Breaking it down a bit this year, Mobile for Associates claimed a 61% response rate, down slightly from last year’s 63%, while Mobile for Consumers garnered 58% (up from 48%). We’ll have more to say about it in the Mobility section. Close behind the Mobile pair was Advanced CRM/Loyalty Programs, which is the only priority that retailers have selected in the top 5 each of the last 7 years. This year it moved from fifth to third on the list, bumping Cross Channel Integration down one notch. For its part, Cross Channel Integration has seen a pretty impressive move up the rankings since 2007 when it was 14th on the list. Consumers desire to have multiple channels for purchasing, receiving, and returning items, and retailers have been taking steps to bring that about. Retailers (and consumers) continue to see progress, and the retailers that get this right the quickest will reap great rewards. GMS retailers, especially Department Stores (80%) and Specialty Softgoods retailers (71%) especially cite this as a priority. The next tier of priorities includes Updated Payment Terminals, which continues to be important, especially in light of VISA’s 2011 announcement to step up EMV adoption in the US. Inventory Visibility is also here, which takes on added significance as retailers incorporate this functionality for mobile devices, both their own and those the customer brings to their store. Inventory Visibility showed a 36% response rate, and we expect this to climb as consumers utilize the function through their smartphones. Business Intelligence at the Store Level (32%) is up slightly from last year (when it made its first appearance), as retailers seek a more granular view of what is going on in their stores. Workforce Management (23%) is down from last year’s 29%, but it continues to be a focus for retailers as labor costs continue to climb and the labor pool continues to shift. PCI Compliance continues its descent down the list of retailer store priorities. When it first became an issue, retailers were willing to rank it as the number 1 store systems priority in our 2008 and 2009 studies as those retailers struggled to come to grips with the wiles of cyber bad guys. Since then it has dropped to 7th in terms of priority. The single biggest reason for this is that many retailers have put the payment on a completely separate network. We’ll have more on this topic in a later section. As we’ve said before, the constantly evolving nature of PCI compliance, coupled with the news that retailers that were certified PCI compliant have been compromised, makes for a rather troubling revelation; PCI on its own is inadequate for overall security, and the heavy focus on it precludes spending on more innovative technologies that can enhance

© Copyright 2013 IHL Group – All Rights Reserved. www.ihlservices.com 28
2013 RIS News/IHL Group Store Systems Study
the security and efficiency of retailers. We have argued before that PCI is really Y2K with no end date, and the data confirms this.
Figure 11 – Top Store Priorities by Retail Segment
Top Store Systems Priorities M
obile
for A
ssocia
tes
Mob
ile fo
r Con
sum
ers
Adva
nced
CRM
/ Lo
yalty
Prog
ram
s
Cros
s Cha
nnel
Inte
grat
ion
Upda
ted P
aym
ent
Term
inals
Inve
ntor
y Visi
bility
PCI C
ompli
ance
Busin
ess I
ntell
igenc
e (S
tore
Leve
l)
Wor
kforce
M
anag
emen
t
Overall – 2013 61% 58% 54% 45% 38% 36% 32% 32% 23%Overall – 2012 63% 48% 39% 47% 29% 19% 42% 31% 29%Food/Drug/C-Stores 43% 62% 67% 33% 43% 29% 24% 48% 38%Dept Stores/Mass Merchants 57% 71% 57% 57% 43% 43% 71% 14% 0%Specialty Softgoods 54% 63% 58% 71% 38% 46% 38% 42% 25%Specialty Hardgoods 82% 50% 36% 36% 36% 32% 21% 18% 11%Hospitality 50% 50% 75% 0% 25% 25% 50% 25% 50%
No two retailers are alike; therefore no two retailers will have the exact same priorities when it comes to their store systems. The Food/Grocery and Drug Store retailers place a heavy emphasis on Advanced CRM (69% for Food, 100% for Drug, with a small sample size) and Mobile for Consumers (56% for Food, 100% for Drug). C‐Stores and Department Stores/Mass Merchants are concerned about Mobile Engagement for Consumers (50% for C‐Stores, 71% for the others) and PCI Compliance (again, 50% and 71%, respectively). Specialty Softgoods retailers are all about customer service, so their priorities are Cross Channel (71%), Mobile for the Consumer (58%) and Advanced Loyalty/CRM (54%). Their Hardgoods cousins take a bit different approach, with Mobile, both for Store Associates (82%) and Consumers (50%), taking the lead.
© Copyright 2013 IHL Group – All Rights Reserved. www.ihlservices.com 29
2013 RIS News/IHL Group Store Systems Study
Top POS Software Vendors Under Consideration
7%
7%
8%
14%
17%
20%
21%
23%
23%
23%
0% 5% 10% 15% 20% 25%
Toshiba Global Commerce (IBM)
Wincor‐Nixdorf
JDA
Fujitsu
Microsoft POS
NCR
Oracle
MICROS
Retalix
Epicor
4.0 POINT OF SALE
4.1 Key POS Software Vendors with the Most Interest
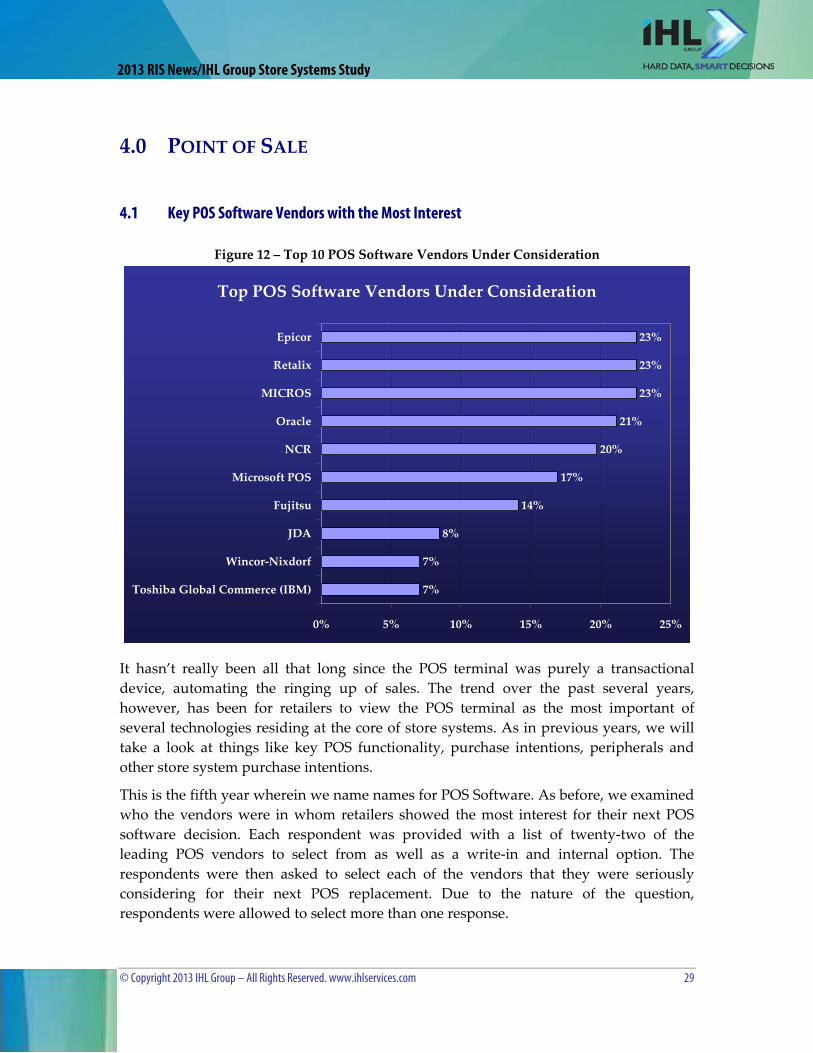
Figure 12 – Top 10 POS Software Vendors Under Consideration
It hasn’t really been all that long since the POS terminal was purely a transactional device, automating the ringing up of sales. The trend over the past several years, however, has been for retailers to view the POS terminal as the most important of several technologies residing at the core of store systems. As in previous years, we will take a look at things like key POS functionality, purchase intentions, peripherals and other store system purchase intentions.
This is the fifth year wherein we name names for POS Software. As before, we examined who the vendors were in whom retailers showed the most interest for their next POS software decision. Each respondent was provided with a list of twenty‐two of the leading POS vendors to select from as well as a write‐in and internal option. The respondents were then asked to select each of the vendors that they were seriously considering for their next POS replacement. Due to the nature of the question, respondents were allowed to select more than one response.
© Copyright 2013 IHL Group – All Rights Reserved. www.ihlservices.com 30
2013 RIS News/IHL Group Store Systems Study
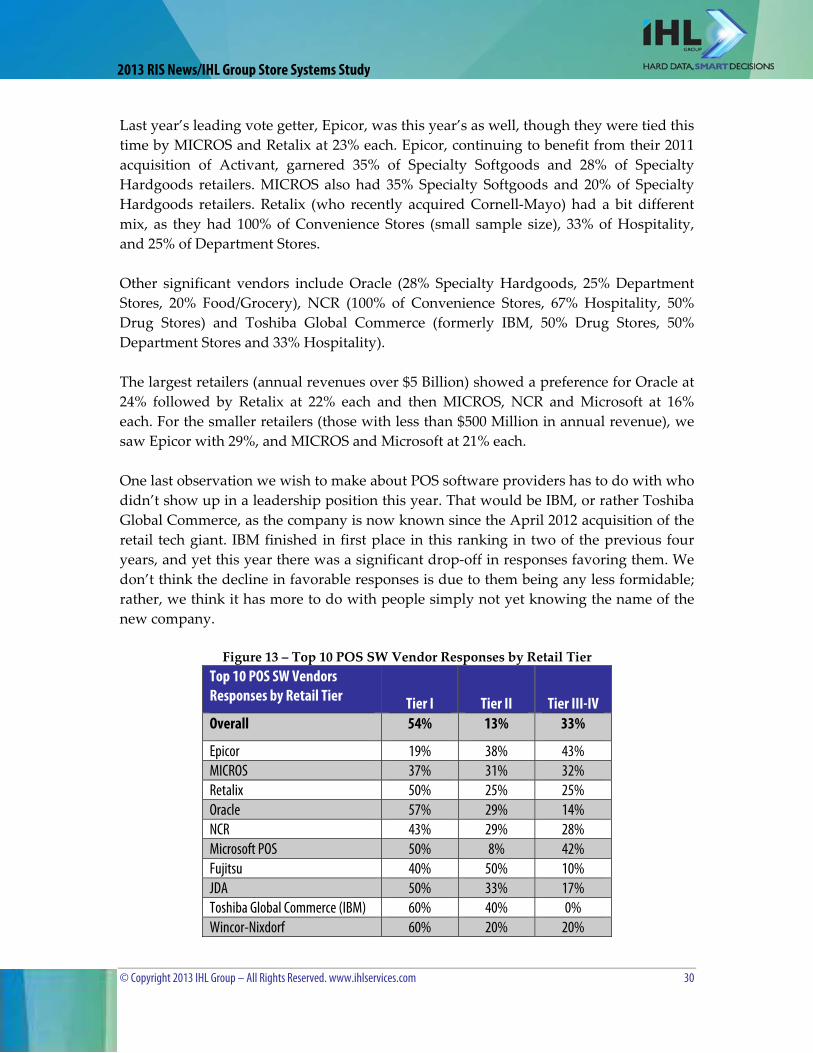
Last year’s leading vote getter, Epicor, was this year’s as well, though they were tied this time by MICROS and Retalix at 23% each. Epicor, continuing to benefit from their 2011 acquisition of Activant, garnered 35% of Specialty Softgoods and 28% of Specialty Hardgoods retailers. MICROS also had 35% Specialty Softgoods and 20% of Specialty Hardgoods retailers. Retalix (who recently acquired Cornell‐Mayo) had a bit different mix, as they had 100% of Convenience Stores (small sample size), 33% of Hospitality, and 25% of Department Stores. Other significant vendors include Oracle (28% Specialty Hardgoods, 25% Department Stores, 20% Food/Grocery), NCR (100% of Convenience Stores, 67% Hospitality, 50% Drug Stores) and Toshiba Global Commerce (formerly IBM, 50% Drug Stores, 50% Department Stores and 33% Hospitality). The largest retailers (annual revenues over $5 Billion) showed a preference for Oracle at 24% followed by Retalix at 22% each and then MICROS, NCR and Microsoft at 16% each. For the smaller retailers (those with less than $500 Million in annual revenue), we saw Epicor with 29%, and MICROS and Microsoft at 21% each. One last observation we wish to make about POS software providers has to do with who didn’t show up in a leadership position this year. That would be IBM, or rather Toshiba Global Commerce, as the company is now known since the April 2012 acquisition of the retail tech giant. IBM finished in first place in this ranking in two of the previous four years, and yet this year there was a significant drop‐off in responses favoring them. We don’t think the decline in favorable responses is due to them being any less formidable; rather, we think it has more to do with people simply not yet knowing the name of the new company.
Figure 13 – Top 10 POS SW Vendor Responses by Retail Tier Top 10 POS SW Vendors Responses by Retail Tier Tier I Tier II Tier III-IV Overall 54% 13% 33%
Epicor 19% 38% 43% MICROS 37% 31% 32% Retalix 50% 25% 25% Oracle 57% 29% 14% NCR 43% 29% 28% Microsoft POS 50% 8% 42% Fujitsu 40% 50% 10% JDA 50% 33% 17% Toshiba Global Commerce (IBM) 60% 40% 0% Wincor-Nixdorf 60% 20% 20%

© Copyright 2013 IHL Group – All Rights Reserved. www.ihlservices.com 31
2013 RIS News/IHL Group Store Systems Study
A particular vendor’s solution may or may not be geared for use by retailers of different size. The table above attempts to shed some light on this. The proper way to read this table is as follows; “Of those respondents seriously considering MICROS for their next POS software, 37% were Tier I retailers, 31% were in Tier II, and 32% were in Tiers III‐IV.” The tendency here is to use a broad brush and characterize certain vendors as targeting large or small retailers at the exclusion of those in other tiers. For instance, Retalix and Oracle have a high percentage of respondents in Tier I, while Epicor has a high percentage of respondents in Tiers II‐IV. While such characterizations may be considered accurate (and actually borne out in practice), we don’t want to overlook any vendor attempts to serve retailers that reside in other tiers.
Figure 14 – POS SW Vendors Considered by Retail Segment Retail Segment Top POS SW Vendors Considered
Food/Drug/C-Stores Retalix, NCR, FujitsuDepartment Stores/Mass Merchants Toshiba GC, Retalix, FujitsuSpecialty Softgoods Epicor, MICROS, OracleSpecialty Hardgoods Epicor, Oracle, MICROSConvenience Stores Retalix, NCRHospitality NCR, MICROS, Retalix
The table above is simply an attempt to show qualitatively which POS software vendors a particular retail segment tends to consider for their next POS purchase.
4.2 POS Software Purchase Intentions and the Impact on Vendor
Figure 15 – POS SW Vendor Share of 0‐12 Month Purchase Intent POS Software Vendor Share of Purchase Intent for 0-12 Month Purchase Window 0-12 Months
Epicor 24%Fujitsu 18%MICROS 18%Microsoft 18%NCR 18%Oracle 18%Wincor Nixdorf 18%

© Copyright 2013 IHL Group – All Rights Reserved. www.ihlservices.com 32
2013 RIS News/IHL Group Store Systems Study
The table above shows the breakdown of retailers looking to make a POS software purchase within the next twelve months by the POS software vendors under consideration. In other words, of the retailers looking to purchase POS software in the next year, 24% of them are considering Epicor as their POS software vendor, with the remaining vendors shown above at 18%.
Figure 16 – 0‐12 Month Purchase Intent Share of POS SW Vendors 0-12 Month Purchase Window Share of POS Software Vendor Purchase Intentions 0-12 Months Retalix 44%JDA 33%Fujitsu 30%Epicor 25%Microsoft POS 25%NCR 21%Oracle 20%Toshiba Global Commerce (IBM) 20%MICROS 19%
This table looks similar to the previous one, but the intent is very different. In this case, we are looking at the percentage of a particular POS software vendor’s potential purchase intentions that occur within the next 12 months. In other words, we’re giving the vendors a little insight on how busy their sales people should expect to be over the next year. For Retalix, 44% of the retailers who are considering their POS software are expecting to make a purchase within the next 12 months. At the other end of the scale, MICROS can expect 19% of the retailers who are considering their POS software to make a purchase in that timeframe.
© Copyright 2013 IHL Group – All Rights Reserved. www.ihlservices.com 33
2013 RIS News/IHL Group Store Systems Study
4.3 POS & Peripheral Purchase Trends
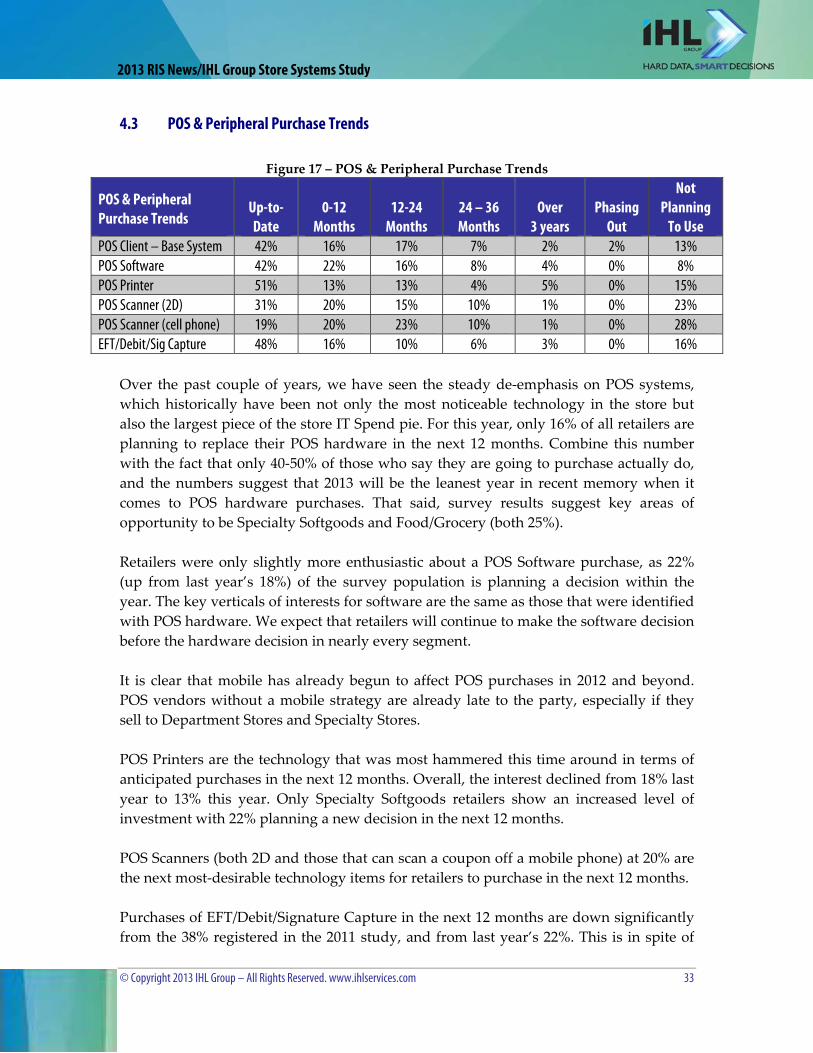
Figure 17 – POS & Peripheral Purchase Trends
POS & Peripheral Purchase Trends
Up-to-Date
0-12 Months
12-24 Months
24 – 36 Months
Over 3 years
Phasing Out
Not Planning
To Use POS Client – Base System 42% 16% 17% 7% 2% 2% 13%POS Software 42% 22% 16% 8% 4% 0% 8%POS Printer 51% 13% 13% 4% 5% 0% 15%POS Scanner (2D) 31% 20% 15% 10% 1% 0% 23%POS Scanner (cell phone) 19% 20% 23% 10% 1% 0% 28%EFT/Debit/Sig Capture 48% 16% 10% 6% 3% 0% 16% Over the past couple of years, we have seen the steady de‐emphasis on POS systems, which historically have been not only the most noticeable technology in the store but also the largest piece of the store IT Spend pie. For this year, only 16% of all retailers are planning to replace their POS hardware in the next 12 months. Combine this number with the fact that only 40‐50% of those who say they are going to purchase actually do, and the numbers suggest that 2013 will be the leanest year in recent memory when it comes to POS hardware purchases. That said, survey results suggest key areas of opportunity to be Specialty Softgoods and Food/Grocery (both 25%). Retailers were only slightly more enthusiastic about a POS Software purchase, as 22% (up from last year’s 18%) of the survey population is planning a decision within the year. The key verticals of interests for software are the same as those that were identified with POS hardware. We expect that retailers will continue to make the software decision before the hardware decision in nearly every segment. It is clear that mobile has already begun to affect POS purchases in 2012 and beyond. POS vendors without a mobile strategy are already late to the party, especially if they sell to Department Stores and Specialty Stores. POS Printers are the technology that was most hammered this time around in terms of anticipated purchases in the next 12 months. Overall, the interest declined from 18% last year to 13% this year. Only Specialty Softgoods retailers show an increased level of investment with 22% planning a new decision in the next 12 months. POS Scanners (both 2D and those that can scan a coupon off a mobile phone) at 20% are the next most‐desirable technology items for retailers to purchase in the next 12 months. Purchases of EFT/Debit/Signature Capture in the next 12 months are down significantly from the 38% registered in the 2011 study, and from last year’s 22%. This is in spite of
© Copyright 2013 IHL Group – All Rights Reserved. www.ihlservices.com 34
2013 RIS News/IHL Group Store Systems Study
constantly evolving PCI compliance standards. The survey indicates that 16% of respondents plan a purchase in the next year. We originally thought that due to the low cost for most of these devices along with the PCI mandates and interest in Mobile Payments, we would see these numbers hold pretty strong for the year. It is likely that retailers are content to use the MSR built into the keyboard or display and treat every card use as a credit transaction.
4.3.1 POS Client – Base System
Figure 18 – POS Client – Base Systems Purchase Trend by Retail Segment
POS Client – Base System
Purchase Trends Up-to-Date
0-12 Months
12-24 Months
24 – 36 Months
Over 3 years
Phasing Out
Not Planning
To Use Overall – 2013 42% 16% 17% 7% 2% 2% 13%Overall – 2012 N/A 18% 16% 7% 11% N/A 48%Food/Drug/C-Stores 57% 19% 10% 0% 5% 0% 10%Dept Stores/Mass Merchants 43% 0% 43% 0% 0% 0% 14%Specialty Softgoods 33% 25% 13% 13% 0% 4% 13%Specialty Hardgoods 37% 11% 19% 11% 4% 4% 15%Hospitality 50% 0% 25% 0% 0% 0% 25%
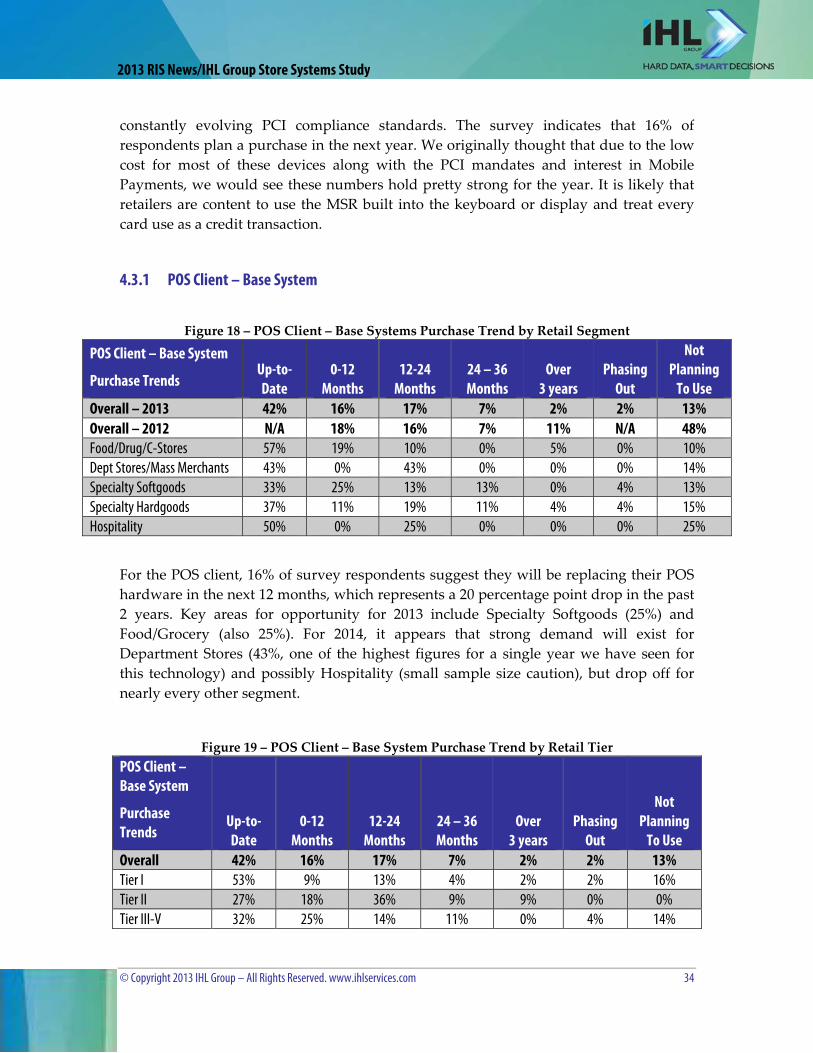
For the POS client, 16% of survey respondents suggest they will be replacing their POS hardware in the next 12 months, which represents a 20 percentage point drop in the past 2 years. Key areas for opportunity for 2013 include Specialty Softgoods (25%) and Food/Grocery (also 25%). For 2014, it appears that strong demand will exist for Department Stores (43%, one of the highest figures for a single year we have seen for this technology) and possibly Hospitality (small sample size caution), but drop off for nearly every other segment.
Figure 19 – POS Client – Base System Purchase Trend by Retail Tier POS Client – Base System
Purchase Trends
Up-to-Date
0-12 Months
12-24 Months
24 – 36 Months
Over 3 years
Phasing Out
Not Planning
To Use Overall 42% 16% 17% 7% 2% 2% 13%Tier I 53% 9% 13% 4% 2% 2% 16%Tier II 27% 18% 36% 9% 9% 0% 0%Tier III-V 32% 25% 14% 11% 0% 4% 14%

© Copyright 2013 IHL Group – All Rights Reserved. www.ihlservices.com 35
2013 RIS News/IHL Group Store Systems Study
The largest retailers continue to be the most reluctant to purchase POS hardware in the next 12 months, with only nine percent (9%) indicating so. The next 12 months appear to be very good for the smallest retailers, and this is reflected in the IT spend numbers we discussed earlier. The mid‐tier retailers show a quasi‐normal 20% for the coming year, but 36% more will be looking in 2014. Remember, these retailers are indicating a purchase decision here; this is not the continued roll‐out of a previous decision.
4.3.2 POS Software
Figure 20 – POS Software Purchase Trend By Retail Segment
POS Software
Purchase Trends Up-to-Date
0-12 Months
12-24 Months
24 – 36 Months
Over 3 years
Phasing Out
Not Planning
To Use Overall – 2013 42% 22% 16% 8% 4% 0% 8%Overall – 2012 N/A 18% 18% 16% 7% N/A 41%Food/Drug/C-Stores 57% 29% 0% 0% 5% 0% 10%Dept Stores/Mass Merchants 57% 0% 29% 0% 0% 0% 14%Specialty Softgoods 29% 29% 21% 17% 0% 0% 4%Specialty Hardgoods 33% 19% 19% 11% 7% 0% 11%Hospitality 75% 0% 25% 0% 0% 0% 0%
The POS Software story is a bit brighter than that of POS Hardware, as 22% of the survey population is planning to purchase POS software within the year, which is a 22% bump from the previous year. The key verticals of interests for POS software will be the Food/Grocery (31%) and Specialty Softgoods retailers (29%). The 12‐24 month window looks slightly more promising for the Department Stores/Mass Merchants, which will mesh nicely with their POS hardware decision, but beyond then, there is little interest shown. As we have seen in years past, the software decision is typically made before the hardware decision in nearly every segment.
Figure 21 – POS Software Purchase Trend by Retail Tier POS Software
Purchase Trends
Up-to-Date
0-12 Months
12-24 Months
24 – 36 Months
Over 3 years
Phasing Out
Not Planning
To Use Overall 42% 22% 16% 8% 4% 0% 8%Tier I 53% 13% 13% 4% 4% 0% 11%Tier II 18% 36% 36% 9% 0% 0% 0%Tier III-V 36% 29% 11% 14% 4% 0% 7%

© Copyright 2013 IHL Group – All Rights Reserved. www.ihlservices.com 36
2013 RIS News/IHL Group Store Systems Study
Here, we see the largest retailers as showing great reluctance to purchase POS software over the next 12 months, with only 13% indicating such a desire, down from 15% last year. These retailers spent fairly well in the down years, so now it is time to back off a bit. The mid‐tier retailers especially show consistent high intent over the next couple of years, but then the bottom drops out.
4.3.3 POS Printers
Figure 22 – POS Printers Purchase Trend by Retail Segment
POS Printers
Purchase Trends Up-to-Date
0-12 Months
12-24 Months
24 – 36 Months
Over 3 years
Phasing Out
Not Planning
To Use Overall – 2013 51% 13% 13% 4% 5% 0% 15%Overall – 2012 N/A 18% 13% 11% 15% N/A 43%Food/Drug/C-Stores 65% 5% 15% 0% 10% 0% 5%Dept Stores/Mass Merchants 33% 0% 17% 0% 0% 0% 50%Specialty Softgoods 52% 22% 9% 4% 0% 0% 13%Specialty Hardgoods 41% 11% 15% 7% 7% 0% 19%Hospitality 75% 25% 0% 0% 0% 0% 0%
POS Printers continue to show a decline in purchase interest, as they are down for the past 4 years. Only 13% of our sample says they are planning to replace their printers in the next 12 months, and the 12‐24 month outlook is the same. The Specialty Softgoods retailers and Hospitality providers show the most significant desire during 2013, but Food/Grocery and Hardgoods lead in the following year. Hospitality providers show no desire whatsoever after 2014, but theirs is a small sample size. Once again, about 33% of these decisions are often delayed, so 2013 looks to be down heavily from 2012 for POS printers.
Figure 23 – POS Printers Purchase Trend by Retail Tier POS Printers
Purchase Trends
Up-to-Date
0-12 Months
12-24 Months
24 – 36 Months
Over 3 years
Phasing Out
Not Planning
To Use Overall 51% 13% 13% 4% 5% 0% 15%Tier I 51% 14% 9% 5% 2% 0% 19%Tier II 55% 9% 27% 0% 9% 0% 0%Tier III-V 48% 15% 11% 4% 7% 0% 15%
The most likely target in the next 24 months for POS Printers is among the Tier II retailers, where 36% plan a purchase. After that, demand is low, regardless of tier.

© Copyright 2013 IHL Group – All Rights Reserved. www.ihlservices.com 37
2013 RIS News/IHL Group Store Systems Study
4.3.4 POS Scanners (2D)
Figure 24 – POS Scanner (2D) Purchase Trend by Retail Segment
POS Scanner (2D)
Purchase Trends Up-to-Date
0-12 Months
12-24 Months
24 – 36 Months
Over 3 years
Phasing Out
Not Planning
To Use Overall 31% 20% 15% 10% 1% 0% 23%Food/Drug/C-Stores 40% 15% 20% 10% 0% 0% 15%Dept Stores/Mass Merchants 43% 14% 14% 0% 0% 0% 29%Specialty Softgoods 30% 17% 17% 9% 0% 0% 26%Specialty Hardgoods 26% 26% 11% 11% 4% 0% 22%Hospitality 0% 25% 0% 25% 0% 0% 50%
These scanners are a step above traditional POS scanners in that they are capable of reading not only standard barcodes but also PDF417 (for customer ID functions) and QR codes, as well as signatures. Specialty Hardgoods (26%) and Hospitality (25%) show the strongest adoption over the next 12 months, but it falls rapidly after then. For 2014, the most likely vendor targets would be Food/Drug/C‐Stores and Specialty Softgoods.
Figure 25 – POS Scanners (2D) Purchase Trend by Retail Tier POS Scanners (2D)
Purchase Trends
Up-to-Date
0-12 Months
12-24 Months
24 – 36 Months
Over 3 years
Phasing Out
Not Planning
To Use Overall 31% 20% 15% 10% 1% 0% 23%Tier I 32% 18% 16% 11% 0% 0% 23%Tier II 60% 20% 10% 0% 0% 0% 10%Tier III-V 18% 21% 14% 11% 4% 0% 32%
There is little difference in the adoption rate by tier over the next couple of years, but the Tier I retailers show the most consistent purchase potential over the next three years. The smallest retailers trail in terms of current adoption, but that is mainly due to them having other priorities that must be addressed.

© Copyright 2013 IHL Group – All Rights Reserved. www.ihlservices.com 38
2013 RIS News/IHL Group Store Systems Study
4.3.5 POS Scanners (Image from a Cell Phone Screen)
Figure 26 – POS Scanner (Cell Phone) Purchase Trend by Retail Segment
POS Scanner (cell phone)
Purchase Trends Up-to-Date
0-12 Months
12-24 Months
24 – 36 Months
Over 3 years
Phasing Out
Not Planning
To Use Overall 19% 20% 23% 10% 1% 0% 28%Food/Drug/C-Stores 19% 29% 29% 10% 0% 0% 14%Dept Stores/Mass Merchants 14% 14% 43% 0% 0% 0% 29%Specialty Softgoods 30% 13% 22% 9% 4% 0% 22%Specialty Hardgoods 8% 20% 16% 12% 0% 0% 44%Hospitality 25% 25% 0% 25% 0% 0% 25%
These scanners are among the most advanced in retail, and this is reflected in an adoption rate that is lower than that found for 2D scanners. As with the 2D scanners Specialty Hardgoods (20%) and Hospitality (25%) show strong adoption over the next 12 months. The real story, though, is the heavy interest shown by Food/Grocery retailers (29% for both 2013 and 2014) and Department Stores/Mass Merchants (14% for 2013, then 43% for 2014). The Food retailers clearly have an agenda for these scanners that helps get them away from having to deal with printed coupons (publishing, redeeming, handling, disposing). Likewise the Department Stores and Mass merchants, but in addition it enables them to reach out to a more technically savvy (read “wealthy”) clientele. The numbers here tell us that retailers have listened to what we told them over the past couple of years, they did their homework and made scanner purchases in order to make use of enhanced scanner capabilities to read coupons off mobile device screens.
Figure 27 – POS Scanners (Cell Phone) Purchase Trend by Retail Tier POS Scanner (cell phone)
Purchase Trends
Up-to-Date
0-12 Months
12-24 Months
24 – 36 Months
Over 3 years
Phasing Out
Not Planning
To Use Overall 19% 20% 23% 10% 1% 0% 28%Tier I 22% 18% 24% 11% 0% 0% 24%Tier II 36% 36% 18% 0% 0% 0% 9%Tier III-V 4% 16% 20% 12% 4% 0% 44%
The Tier II retailers show the greatest purchase potential over the next two years, and the desire for mobile integration may be driving them to offer enhanced services that the larger retailers cannot yet offer. Purchase intent is low for the smallest retailers and will stay low; they have higher priorities that must be addressed.

© Copyright 2013 IHL Group – All Rights Reserved. www.ihlservices.com 39
2013 RIS News/IHL Group Store Systems Study
4.3.6 EFT / Debit / Signature Capture
Figure 28 – EFT/Debit/Signature Capture Purchase Trend by Retail Segment EFT / Debit /
Sig. Capture
Purchase Trends Up-to-Date
0-12 Months
12-24 Months
24 – 36 Months
Over 3 years
Phasing Out
Not Planning
To Use Overall – 2013 48% 16% 10% 6% 3% 0% 16%Overall – 2012 N/A 22% 25% 3% 2% N/A 47%Food/Drug/C-Stores 67% 14% 5% 5% 0% 0% 10%Dept Stores/Mass Merchants 43% 14% 0% 14% 0% 0% 29%Specialty Softgoods 48% 17% 9% 9% 0% 0% 17%Specialty Hardgoods 33% 21% 21% 4% 4% 0% 17%Hospitality 50% 0% 0% 0% 25% 0% 25%
EFT/Debit/Signature capture is down considerably from 2011, as retailers have probably caught onto the idea that constantly evolving PCI compliance standards are a moving target. From our survey responses, 21% of Specialty Hardgoods retailers indicate replacement in 2013, and an equal number in 2014. We have yet to see any serious movement due to VISA’s EMV/Chip & PIN announcement for the US.
Figure 29 – EFT/Debit/Signature Capture Purchase Trend by Retail Tier EFT / Debit /
Sig. Capture
Purchase Trends
Up-to-Date
0-12 Months
12-24 Months
24 – 36 Months
Over 3 years
Phasing Out
Not Planning
To Use Overall 48% 16% 10% 6% 3% 0% 16%Tier I 59% 14% 2% 9% 2% 0% 14%Tier II 55% 9% 27% 0% 0% 0% 9%Tier III-V 28% 24% 16% 4% 4% 0% 24%
The smallest retailers are the ones looking to spend money on these devices in the near term, as 40% of Tier III‐V retailers are expected to purchase in the next 24 months. The larger retailers already show better than a 50% adoption rate, which may also be code for, “We’ll continue using the display/keyboard MSR and treat every card transaction as a credit transaction.”

© Copyright 2013 IHL Group – All Rights Reserved. www.ihlservices.com 40
2013 RIS News/IHL Group Store Systems Study
4.4 Other Store Systems
Figure 30 – Other Store Systems
Other Store Systems
Purchase Trends Up-to-Date
0-12 Months
12-24 Months
24 – 36 Months
Over 3 years
Phasing Out
Not Planning
To Use Self Checkout 19% 5% 5% 4% 0% 3% 65%Digital Signage 22% 17% 27% 2% 1% 0% 30%Kiosks 29% 20% 15% 4% 0% 1% 30%
Self Checkout plans for the next 12 months are down from last year, but the real story is that the vast majority of those retailers looking to adopt within the next 2 years are Specialty retailers (Hard and Soft), not the traditional Food/Grocery. That said, we did have one Food/Grocery retailer that claimed that they were phasing out Self‐Checkout. Digital Signage plans for the next 24 months show the most promise of these three technologies. Hospitality providers especially (100% in the next 2 years) and Food/Grocery (19% for 2013 and 25% for 2014) are the most aggressive adopters. Specialty retailers also are proponents of these systems, being responsible for 50% of the choices made for the next 24 months. Kiosks are down from last year’s numbers, and we see mobility ultimately having a repressive effect upon kiosks in this light. Still, 35% of respondents indicate a purchase intent in 2013 and 2014.
4.5 Mobile Effect on Traditional POS
Figure 31 – Reduced POS HW Purchases Due to Mobile
Segment
Expected POS Reduction
(next 3 years)
Overall – 12.4%Food/Drug/C-Stores – 6.1%Dept Stores/Mass Merchants – 5.5%Specialty Softgoods – 19.8%Specialty Hardgoods – 10.4%Hospitality – 0.1%
So, if Mobile is going to have an effect on Traditional POS, how big is that effect going to be? We asked retailers the question, “If you plan to use Mobile devices for POS in the

© Copyright 2013 IHL Group – All Rights Reserved. www.ihlservices.com 41
2013 RIS News/IHL Group Store Systems Study
next 3 years, when it comes time to replace your traditional POS, what percent reduction will there be in the number of traditional POS terminals that you will purchase?” We looked at this for the first time last year, and the results were unsettling enough that we received inquiries from various industry participants seeking confirmation. Last year’s overall response indicated a 13.1% decline in the number of traditional POS terminals over the next three years, and as such it represented a watershed moment in Retail IT. This year we see this figure slightly tempered at 12.4% decline, primarily due to General Merchandise retailers being slightly less bullish on the prospect of mobile replacing their traditional POS. Yes, there have been several retailers make claims that they are no longer buying traditional POS terminals at all, but most retailers are not ready to make that jump just yet.

© Copyright 2013 IHL Group – All Rights Reserved. www.ihlservices.com 42
2013 RIS News/IHL Group Store Systems Study
Payment Security Plans
21%
25%
15%
10%
17%
25%
23%
27%
6%
20%
13%
15%
6%
9%
5%
3%46%
43%
11%
2%
0% 10% 20% 30% 40% 50% 60% 70% 80% 90% 100%
Mobile Phone NFCPayment
Payment App on aSeparate Network
EMV Chip & PIN
Card TransactionTokenization
End‐to‐End Encryption
Currently Use Within 12 Months 12‐24 Months 24‐36 Months
5.0 CARD PAYMENT SECURITY
Figure 32 – Security Technology Purchase Plans
In previous studies we have documented the PCI‐DSS effort back to its origin in 2004. At that time, the intent was to create an additional level of protection for customers by ensuring that merchants meet minimum levels of security when they store, process and transmit cardholder data. Since then, PCI/DSS compliance has served as a major disrupter in the area of IT spend. Billions of dollars have already been diverted from planned and existing IT projects and spent to ostensibly ensure security. The fact remains, however, that retailers are still spending months and years after their deadlines have passed. The key observation IHL has made throughout this process is that PCI is Y2K without an end date. We briefly mentioned PCI compliance in the Store Priorities section, but here we get a bit more granular in our look at retailers’ security plans. The figure above shows the purchase intent for five specific security technologies designed to combat all forms of transaction fraud. The five technologies we asked about were End‐to‐End Encryption,

© Copyright 2013 IHL Group – All Rights Reserved. www.ihlservices.com 43
2013 RIS News/IHL Group Store Systems Study
Tokenization of the Card Transaction, EMV / Chip & PIN, Payment Application on a Separete Network and Mobile Phone NFC Payment. End‐to‐End Encryption is exactly what it sounds like; the pertinent data is encrypted during the entire transaction while on a retailer’s IT systems. It shows a potential for over 84% adoption by 2014. Department Stores were expected to have exuberance for this technology, and they did not disappoint, having an 80% current usage (but with a smaller sample size than other segments). Food/Grocery retailers, with their high transaction rates, have a 56% current adoption, with another 32% in the next 24 months. Specialty Softgoods retailers were a bit late to the game in this area, but they have a 39% current usage (and another 39% planning adoption in the next 24 months). Specialty Hardgoods retailers, no slouches themselves when it comes to transaction rates, show healthy current and future adoption as well as the lowest “No Plans” rate. From a retail tier standpoint, we find it interesting that there seems to be “either/or” adoption rates; one is either in the 30% or the 60% range. The lower Tier I retailers ($1‐10 Billion in annual sales) and the very smallest retailers (less than $250 Million) show around 30%, and the rest show at 60%. Tokenization is a process where sensitive data is replaced with a unique identifier that retains all the essential information without compromising its security. First developed for payment cards by Shift4 in 2005, it is currently the second‐leading method for payment card security, at least in the minds of the respondent retailers, and shows a potential for 63% adoption by 2014. The Specialty retailers are big proponents of the technology, most likely due to the fact that the technology doesn’t require anything approaching a rip‐and‐replace effort. Here we see the smaller retailers having only slightly less urgency for purchasing this technology, but 35% have no plans to be using it. This may be due to the fact that some of these retailers can’t justify the expense based upon their transaction level; their thinking might be that other retailers would be more ripe targets for the bad guys. EMV Chip & PIN was a choice in our survey for the first time last year. EMV (Europay, MasterCard, VISA) is a global standard for the use of smart cards and their assiociated smart card‐capable terminals for authenticating credit and debit card transactions. Use has been heavy in Europe, but has been increasing in the US since the August 2011 announcement by VISA that they were accelerating the migration of EMV in the US. The largest retailers will lead in adoption, but the smaller retailers will be right on their heels. Currently, Tier I shows 27% usage, with another 37% in the next two years. Tiers II and III‐V have current adoption rates of 17% and 12%, respectively. Department Stores, Specialty Softgoods (mainly due to their exposure to fraud) and Food/Grocery retailers (mainly due to their transaction volumes) are the ones showing the keenest desire for this technology.

© Copyright 2013 IHL Group – All Rights Reserved. www.ihlservices.com 44
2013 RIS News/IHL Group Store Systems Study
Currently, having the payment application on a separate network is practiced by 43% of retailers, with another 10% joining up in 2013. This technology saw a nearly 60% jump from last year in terms of those retailers who currently use it. Department Stores, and right behind them Food/Grocery retailers, show the highest current usage of this technology. The Specialty retailers are running slightly behind, but both show an overall greater propensity to adopt this technology. They are almost equally inclined to adopt the separate network technology as they are the End‐to‐End Encryption. The smaller retailers here have slightly less desire to use a separate network than the larger ones. Compared to the other choices, End‐to‐End Encryption actually garners more of the smaller retailers’ interest. The technology that sticks out like a sore thumb here is Payment Using NFC on a Mobile Phone, which shows only 11% of retailers currently using it. This particular technology has been around for about 10 years, yet adoption here in North America still lags expectations. The major contributor to these unmet expectations is the lack of consumer confidence concerning the security of such transactions. Also contributing is the lack of sufficient infrastructure, which has as its root the disparity in approach between the two primary competitors (Google and Isis). Long story short, the widespread adoption that is depicted in the 12‐24 month bar in the figure above has been pushed out each of the last few years, and we expect that the widespread adoption will be “just around the corner” for the next couple years at least. Whether these technology efforts are part of a documented and systematic PCI compliance plan or simply an effort by retailers to deny access to the bad guys independent of any regulating authority, we don’t know. One thing to note about these technologies is the fact that the use of them is not an either/or proposition. Over 40% of respondents (42%) reported current usage of more than one of these technologies. Overall it’s clear that retailers are spending more time and effort to thwart the bad guys than ever before, and we don’t see this changing anytime soon.

© Copyright 2013 IHL Group – All Rights Reserved. www.ihlservices.com 45
2013 RIS News/IHL Group Store Systems Study
6.0 THERE’S NO AVOIDING IT, MOBILE IS HERE TO STAY
6.1 Mobility Platforms for Store Managers and Associates
The transformation of Mobile in Retail has been nothing short of astonishing in the past four years. We originally introduced Mobile as a secondary topic, then promoted it to a primary subject, then to serious game changer, and now, finally, to a way of life over the last four years. Mobile devices have turned the 340 year history of retail in North America on its head, and it has caused retailers to completely rethink the manner in which their store associates interact with their customers. To this end, we want to take a look at not only the retailer’s adoption rate of the various mobile devices and the mobile platforms and applications they are considering for their stores and the rest of the enterprise, but also the payment‐ and non‐payment applications/functions they are considering for use on a customer‐owned device.
Figure 33 – Store Mobile Spending Plans
Retail Segment
% Who Expect Store Mobile Spend
to Increase from 2012
Expected Store Mobile
Increase
Expected Store IT Spend
Increase Overall 77% 5.6% 4.8% Food/Drug/C-Stores 86% 5.1% 4.2% Department Stores 40% 2.9% –1.4% Specialty Hardgoods 71% 5.5% 3.2% Specialty Softgoods 88% 7.2% 5.7% Hospitality 100% 4.9% 6.8%
Before we get into the details of the devices and platforms, however, we want to take a quick glance at how the specific retail segments plan to approach their Mobile spend in the next 12 months. The figure above helps in this regard, as it shows what percentage of each retail segment plans to increase their Store Mobile spend, how much they plan to increase that spend from 2012, and how much they plan to increase (or decrease) their overall Store IT spend from 2012. Simply, it helps show how much relative emphasis a segment has on mobile in the stores. Approximately 80% of all Specialty retailers plan to increase their Store Mobile spend for 2013. These retailers are historically the spend leaders for In‐store Mobile, and they expect to further increase that spend, with Softgoods and Hardgoods retailers planning for 2013 increases of 7.2% and 5.5%, respectively. Department Stores, on the other hand, have about half the interest in increasing their Store Mobile spend. It is noteworthy that while they plan a decrease in Store IT spend for 2013, they plan to increase their Store Mobile spend by a factor of two times that decrease.

© Copyright 2013 IHL Group – All Rights Reserved. www.ihlservices.com 46
2013 RIS News/IHL Group Store Systems Study
Mobile Platforms Under Consideration
14%
24%
40%
41%
69%
36%
6%
4%
8%
8%
5%
13%
24%
41%
19%
65%
0% 10% 20% 30% 40% 50% 60% 70% 80%
Blackberry
iPod Touch
Windows CE/7
Windows Mobile
Windows 8
iPhone
Android
iPad
Store Non‐Store
Figure 34 – Mobility Platform for Store Associates
We asked retailers about the mobile platforms they plan to provide for use in their stores and elsewhere in the retail enterprise, and the results are in the figure above. Currently, the iPad is the clear leader, with the iPhone tied for second place. Outside research continues to show Android growing faster than iOS, and it shares second place, in the stores at least. The lower non‐store presence of Android is due in part to the lingering installed base of Blackberry devices, but more so due to its “new kid on the block” status. We have said before that Android will be the platform that creates hardware price competition similar to what Microsoft Windows brought to PCs.
The various flavors of Windows make a reasonably good showing here, and we believe this has more to do with the ability of the retailers themselves to be able to develop mobile applications on the Windows platform (without having to subject them to the Apple App Store) rather than other any inherent benefit of a Windows device. The Windows 8 tablets were just being released at the time of this writing. We expect these devices to grow dramatically in 2013 in retail, particularly since many applications will run without being changed on the device. That is very compelling to CIOs. We suspect that the reason the non‐store adoption of the various Windows products is more due to

© Copyright 2013 IHL Group – All Rights Reserved. www.ihlservices.com 47
2013 RIS News/IHL Group Store Systems Study
self‐cannibalization brought about by product confusion in the marketplace (“Which is best for my application?”, “Which will be supported going forward?”, etc). RIM’s Blackberry continues to slide down the scale in importance, though it has been the standard for mobile email for the past several years.
Figure 35 – Mobile Platform for Store Associates / Managers by Retail Segment
Mobile Platform For Store Associates / Managers iP
ad
iPho
ne
Blac
kber
ry
Andr
oid
Phon
e
Othe
r An
droi
d
Win
dow
s CE
/ 7
Win
dow
s M
obile
Win
dow
s 8
Overall 69% 40% 4% 13% 28% 14% 24% 36%Food/Drug/C-Stores 75% 44% 0% 6% 25% 13% 19% 44%Dept Stores/Mass Merchants 86% 29% 0% 0% 14% 14% 14% 43%Specialty Softgoods 80% 50% 10% 20% 25% 15% 15% 30%Specialty Hardgoods 54% 31% 4% 12% 35% 15% 38% 31%Hospitality 67% 67% 0% 33% 33% 0% 0% 67%
When we slice the data by retail segment, we see strong acceptance of the Apple platforms across all segments. The Department Store and Specialty Softgoods retailers are especially enamoured of the iPad, which lends itself nicely to making these fashion conscious retailers seem current with the latest trends. All told, Apple products were selected by no less than 80% of the respondents (the comparable figures for Android and Windows products were 35% and 49%, respectively). As the new kid on the block, Android devices have found a home in several of the segments, most notably Specialty Hardgoods and Hospitality. External research shows Android to be growing faster than iOS, and in fact in 3Q2012 IDC claimed that Android had a 75% shipshare compared to 15% for iOS. Blackberry continues to fade, as only Specialty Softgoods show significant interest, and that is probably more legacy‐based. Windows 8 is showing more interest than we would expect (it was released to the public during the survey period), with Department Stores, Food/Grocery and Hospitality showing greater than 40%. From the figures above, it is clear that a significant portion of retailers see the potential for Apple mobile products to play a key role in accessing information and delivering actionable customer service within the store. Regardless of whether the “cool factor” embraces having a full wine list presented in visual form on an iPad in a restaurant, or being able to see additional color/style combinations at a Softgoods retailer, or to show a digital photograph of what a room would look like after a particular paint was selected at a Hardgoods retailer, all of these applications and more can be made available to store associates. Delivering them on a modern, sleek, and user friendly device simply makes good business sense, regardless of whether that device is “enterprise friendly”.

© Copyright 2013 IHL Group – All Rights Reserved. www.ihlservices.com 48
2013 RIS News/IHL Group Store Systems Study
Figure 36 – Mobile Platform for Store Associates / Managers by Retail Tier
Mobile Platform For Store Associates / Managers iP
ad
iPho
ne
Blac
kber
ry
Andr
oid
Phon
e
Othe
r An
droi
d
Win
dow
s CE
/ 7
Win
dow
s M
obile
Win
dow
s 8
Overall 69% 40% 4% 13% 28% 14% 24% 36%Tier I 62% 32% 5% 8% 24% 24% 32% 35%Tier II 78% 44% 0% 0% 33% 0% 11% 33%Tier III-V 74% 48% 4% 26% 33% 7% 19% 41%
The most interesting take from cutting the data by retail tier is a higher‐than‐average embrace by the smallest retailers of the Android platforms. That said, as we mentioned before Android products are out‐shipping iOS and Windows products by a wide margin, so maybe it is just an extension of what these retailers are already using at home.
6.2 Store Associate Mobility Plans
Figure 37 – Store Associate Mobility Hardware Plans
Store Associate Mobile Device Adoption
13%
32%
26%
32%
10%
6%
20%
4%
4%
5%
26%
13%
0% 10% 20% 30% 40% 50% 60% 70% 80%
Non‐Rugged Handhelds
Rugged Handhelds
Tablets
UpToDate Within 12 Months 12‐24 Months 24‐36 Months

© Copyright 2013 IHL Group – All Rights Reserved. www.ihlservices.com 49
2013 RIS News/IHL Group Store Systems Study
In the case of both Tablets and Non‐Rugged Handhelds (NRHH, which includes iPhones, iPod Touches, other smartphones, etc), they are showing a current adoption of 13% and an expectation that 32% of these retailers will be making a purchase going forward. Note further, these are not either/or decisions, as no less than 43% of these retailers are either currently using or are considering using more than one of the three mobile device types in their stores.
Figure 38 – Store Associate Mobility Hardware Plans
Other Store Systems
Purchase Trends Up-to-Date
0-12 Months
12-24 Months
24 – 36 Months
Over 3 years
Phasing Out
Not Planning
To Use Rugged Handhelds 26% 26% 6% 4% 1% 1% 35% Food/Drug/C-Stores 29% 29% 14% 0% 0% 0% 29% Dept Stores/Mass Merchants 50% 17% 0% 17% 0% 0% 17% Specialty Softgoods 24% 28% 0% 4% 0% 4% 40% Specialty Hardgoods 21% 29% 7% 0% 4% 0% 39% Hospitality 0% 33% 0% 17% 0% 0% 50%Non-Rugged Handhelds 13% 32% 10% 4% 0% 0% 40% Food/Drug/C-Stores 10% 30% 25% 0% 0% 0% 35% Dept Stores/Mass Merchants 43% 14% 14% 14% 0% 0% 14% Specialty Softgoods 9% 35% 4% 9% 0% 0% 43% Specialty Hardgoods 11% 44% 4% 0% 0% 0% 41% Hospitality 0% 17% 0% 0% 0% 0% 83%Tablets 13% 32% 20% 5% 2% 0% 28% Food/Drug/C-Stores 14% 29% 19% 0% 0% 0% 38% Dept Stores/Mass Merchants 14% 43% 14% 14% 0% 0% 14% Specialty Softgoods 15% 38% 12% 4% 4% 0% 27% Specialty Hardgoods 11% 32% 29% 7% 4% 0% 18% Hospitality 0% 17% 50% 0% 0% 0% 33%
Department Stores/Mass Merchants are the ones who have no apparent qualms about using these newer devices, as they show a current adoption rate of 43% for NRHH and 14% for Tablets (and 43% in the next 12 months), which leads all retailers for these two device types through the end of 2013. Next in line are the Specialty Hardgoods retailers, who show adoption rates of 55% for NRHH and 43% for Tablets through 2013. Close behind them are the Specialty Softgoods retailers, who show 44% and 53% respectively. For the Hardgoods retailers, the efforts by the likes of Lowe’s and Home Depot have advanced the cause of NRHH, with those retailers (and others) having deployed thousands of these devices. For the Softgoods retailers, style and fashion sense sometimes drive technology decisions, because more so than any other retail segment, these retailers must appear to be on the cutting edge at all times. Even the perception of

© Copyright 2013 IHL Group – All Rights Reserved. www.ihlservices.com 50
2013 RIS News/IHL Group Store Systems Study
Store Associate Mobility Apps
13%
7%
11%
16%
39%
13%
26%
27%
21%
30%
30%
26%
27%
12%
14%
16%
27%
10%
22%
19%
11%
4%
6%
4%
7%
5%
3%
5%
6%
19%
13%
14%
0% 10% 20% 30% 40% 50% 60% 70% 80% 90%
HR
Line Busting w/Suspend
Cross Channel Save‐the‐Sale
Mobile POS w/Tender
Messaging
CRM
Task Management
Inventory Management
Currently Use Within 12 Months 12‐24 Months 24‐36 Months
trailing can be a death knell for some of these retailers, so a stylish tablet, unencumbered by a bulky, rugged case, is a perfect fit. Food/Grocery retailers, not to be outdone, have an unexpectedly healthy embrace of Tablets that nearly equals that of Specialty Softgoods, and they have plans to move forward. Key targets for Tablets for the next 12 months are Department Stores, Specialty retailers, and Food/Drug/C‐Stores. For NRHH, it’s Specialty Hardgoods, Specialty Softgoods, and Food/Grocery, in that order. Rugged Handhelds have been a mainstay in retail for a couple of decades, and as a result we tend to treat them a bit differently than their more sexy cousins. Truth be told, times have never been better for Rugged Handhelds, with 26% of our sample saying they’re going to make a purchase decision in the next 12 months. Most likely targets include Specialty Hardgoods (29% plan a purchase), Food/Drug/C‐Stores (29%), and Specialty Softgoods (28%). The numbers for Department Stores are low for 2013 because they already have so many already installed.
Figure 39 – Store Associate Mobility Software Plans
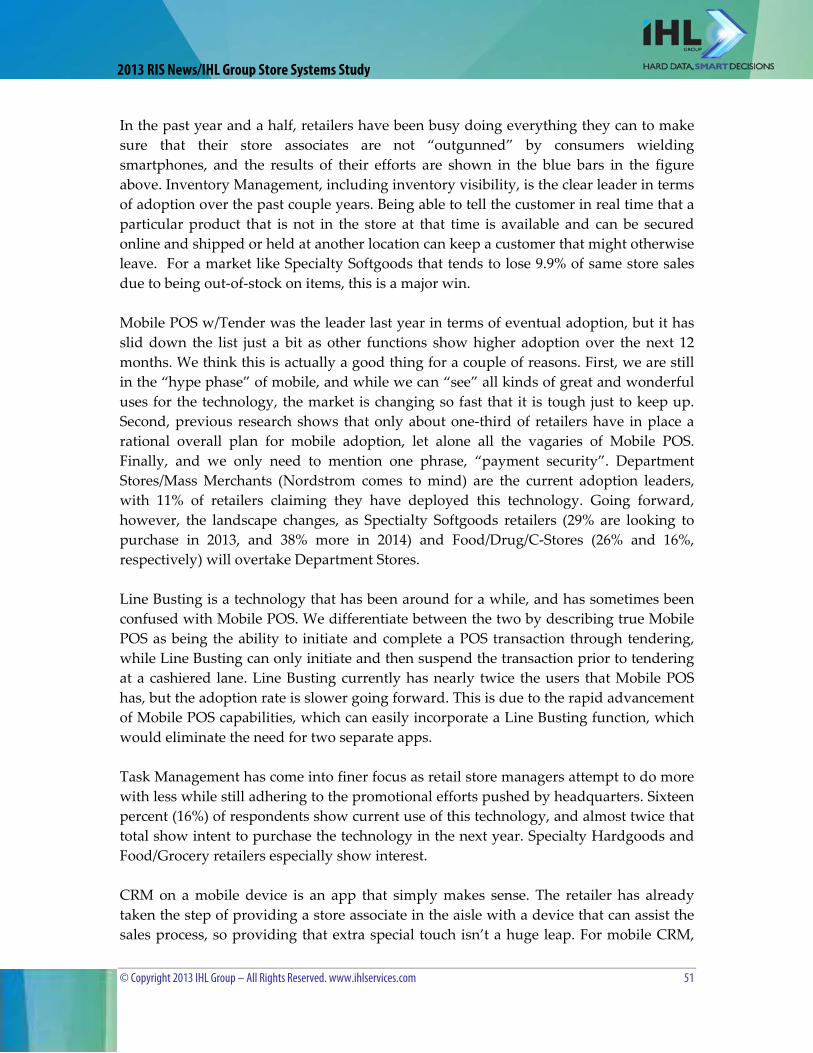
© Copyright 2013 IHL Group – All Rights Reserved. www.ihlservices.com 51
2013 RIS News/IHL Group Store Systems Study
In the past year and a half, retailers have been busy doing everything they can to make sure that their store associates are not “outgunned” by consumers wielding smartphones, and the results of their efforts are shown in the blue bars in the figure above. Inventory Management, including inventory visibility, is the clear leader in terms of adoption over the past couple years. Being able to tell the customer in real time that a particular product that is not in the store at that time is available and can be secured online and shipped or held at another location can keep a customer that might otherwise leave. For a market like Specialty Softgoods that tends to lose 9.9% of same store sales due to being out‐of‐stock on items, this is a major win. Mobile POS w/Tender was the leader last year in terms of eventual adoption, but it has slid down the list just a bit as other functions show higher adoption over the next 12 months. We think this is actually a good thing for a couple of reasons. First, we are still in the “hype phase” of mobile, and while we can “see” all kinds of great and wonderful uses for the technology, the market is changing so fast that it is tough just to keep up. Second, previous research shows that only about one‐third of retailers have in place a rational overall plan for mobile adoption, let alone all the vagaries of Mobile POS. Finally, and we only need to mention one phrase, “payment security”. Department Stores/Mass Merchants (Nordstrom comes to mind) are the current adoption leaders, with 11% of retailers claiming they have deployed this technology. Going forward, however, the landscape changes, as Spectialty Softgoods retailers (29% are looking to purchase in 2013, and 38% more in 2014) and Food/Drug/C‐Stores (26% and 16%, respectively) will overtake Department Stores. Line Busting is a technology that has been around for a while, and has sometimes been confused with Mobile POS. We differentiate between the two by describing true Mobile POS as being the ability to initiate and complete a POS transaction through tendering, while Line Busting can only initiate and then suspend the transaction prior to tendering at a cashiered lane. Line Busting currently has nearly twice the users that Mobile POS has, but the adoption rate is slower going forward. This is due to the rapid advancement of Mobile POS capabilities, which can easily incorporate a Line Busting function, which would eliminate the need for two separate apps. Task Management has come into finer focus as retail store managers attempt to do more with less while still adhering to the promotional efforts pushed by headquarters. Sixteen percent (16%) of respondents show current use of this technology, and almost twice that total show intent to purchase the technology in the next year. Specialty Hardgoods and Food/Grocery retailers especially show interest. CRM on a mobile device is an app that simply makes sense. The retailer has already taken the step of providing a store associate in the aisle with a device that can assist the sales process, so providing that extra special touch isn’t a huge leap. For mobile CRM,

© Copyright 2013 IHL Group – All Rights Reserved. www.ihlservices.com 52
2013 RIS News/IHL Group Store Systems Study
Retailersʹ Plan to Protect Consumer‐Grade Devices
15%
24%
58%
29%
11%
7%
0% 10% 20% 30% 40% 50% 60% 70%
Spare in the AirReplacement
Nothing
Sled
Combined Case/Scanner
Protective Case
We donʹt know yet
2013 looks to be a great year, as 40% of Department Stores, 39% of Specialty Softgoods retailers, 36% of Specialty Hardgoods retailers and 19% of Food/Grocery retailers are looking to make a purchase. The following year doesn’t look too bad either, as the numbers for Specialty retailers (36% Hardgoods, 22% Softgoods) and Food/Grocery (19%) attest.
Figure 40 – Plans for Protecting Consumer Grade Devices
We tossed this question into the mix purely for curiosity purposes, since there is such a heavy competition from consumer‐grade devices being considered for incorporation into the IT stack of retailers who through the years have helped define the term “retail hardened”. We asked the retailers what steps they will take to protect the consumer‐grade devices they were planning to incorporate. In the ten years that we have conducted this study, and the thousands of responses we have received and analyzed, we can safely say that the response, “We don’t know yet” ranks as the most transparent. It is also indicative of the speed with which these devices are being incorporated into the retail enterprise.
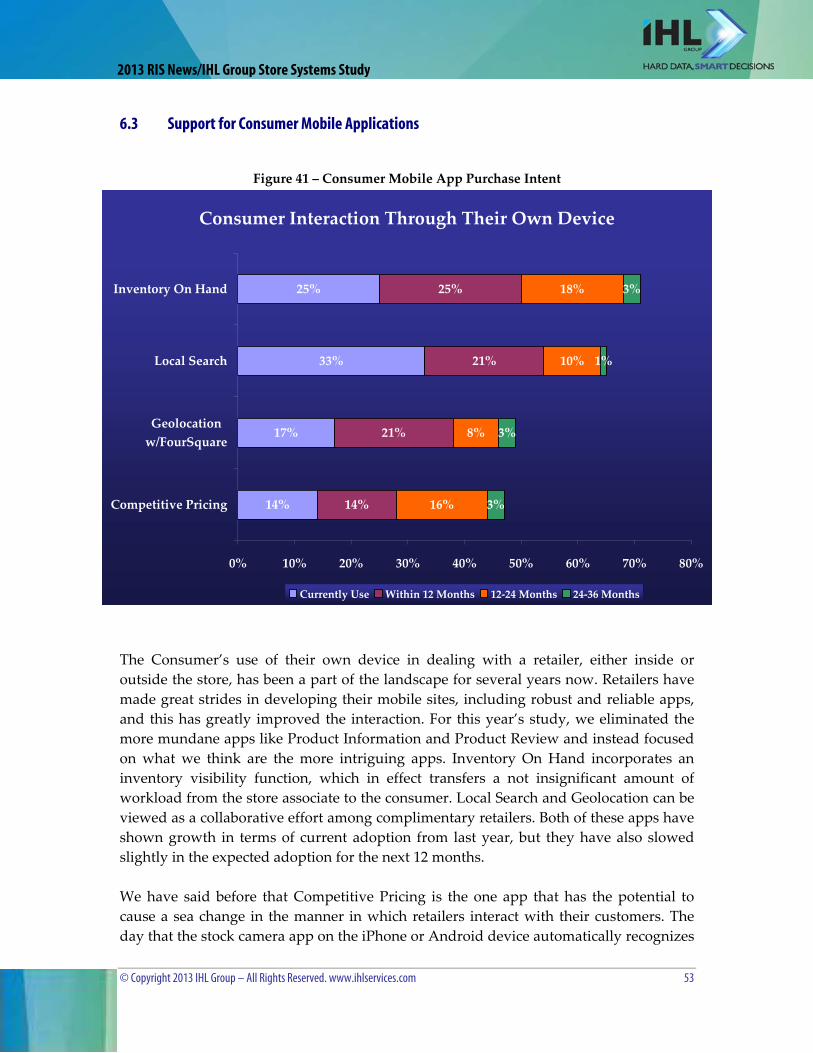
© Copyright 2013 IHL Group – All Rights Reserved. www.ihlservices.com 53
2013 RIS News/IHL Group Store Systems Study
Consumer Interaction Through Their Own Device
33%
25%
14%
21%
21%
25%
16%
8%
10%
18%
3%
3%
1%
3%
17%
14%
0% 10% 20% 30% 40% 50% 60% 70% 80%
Competitive Pricing
Geolocationw/FourSquare
Local Search
Inventory On Hand
Currently Use Within 12 Months 12‐24 Months 24‐36 Months
6.3 Support for Consumer Mobile Applications
Figure 41 – Consumer Mobile App Purchase Intent
The Consumer’s use of their own device in dealing with a retailer, either inside or outside the store, has been a part of the landscape for several years now. Retailers have made great strides in developing their mobile sites, including robust and reliable apps, and this has greatly improved the interaction. For this year’s study, we eliminated the more mundane apps like Product Information and Product Review and instead focused on what we think are the more intriguing apps. Inventory On Hand incorporates an inventory visibility function, which in effect transfers a not insignificant amount of workload from the store associate to the consumer. Local Search and Geolocation can be viewed as a collaborative effort among complimentary retailers. Both of these apps have shown growth in terms of current adoption from last year, but they have also slowed slightly in the expected adoption for the next 12 months. We have said before that Competitive Pricing is the one app that has the potential to cause a sea change in the manner in which retailers interact with their customers. The day that the stock camera app on the iPhone or Android device automatically recognizes

© Copyright 2013 IHL Group – All Rights Reserved. www.ihlservices.com 54
2013 RIS News/IHL Group Store Systems Study
Consumer Payment Through Their Own Device
18%
18%
6%
19%
28%
29%
23%
17%
22%
14%
11%
21%
1%
9%
0%
3%
3%27%
6%
4%
0% 10% 20% 30% 40% 50% 60% 70% 80%
Consumer Self Checkout
Coupons by NFC/RFID
Regular Bar CodeScanning
Daily Deals / Flash Sales
Coupons on MobileScreen
Currently Use Within 12 Months 12‐24 Months 24‐36 Months
a barcode and launches an application for pricing comparison will be a bad day for those retailers that are not willing or able to do price match guarantees. Currently most smartphone users do not know what to do with the QR code. When this becomes average everyday knowledge, retail will never be the same. Fortunately, the data here would suggest that retailers are coming to grips with this reality, as they are beginning to figure out ways to compete in spite of their allowing their customer to view competing prices, even while in the store.
6.4 Support for Payment Oriented Mobile Apps
Figure 42 – Consumer Payment Through Smartphones
Retailers continue to reach out to the high‐tech portion of their clientele through promotional efforts and enhancements to the transaction process. Last year we saw a 20% current adoption of retailers enabling the scanning of a coupon off the screen of a mobile device. This year, it has risen to 27%, with a 50% adoption rate expected to be reached in the next 12 months, driven mainly by Department Stores (40%) and Specialty Softgoods retailers (36%). This is a far cry from clipped coupons from Sunday’s paper that just get tossed into the kitchen junk drawer and forgotten for months.

© Copyright 2013 IHL Group – All Rights Reserved. www.ihlservices.com 55
2013 RIS News/IHL Group Store Systems Study
Daily Deals/Flash Sales represent those promotions that are specifically targeted to that portion of a retailer’s clientele that use technology, whether Mobile or simply online capabilities. Eighteen percent (18%) currently claim that they use this technology for their Mobile users, with another 29% coming online in the next 12 months. Support for Regular Bar Code Scanning revealed 18% of retailers currently have the capability; this was down slightly from last year’s 20%, but the 2 year window expects to see 60% of retailers adopting this capability. Delivering Coupons via NFC continues to be the red‐headed stepchild technology; just 6% of retailers currently use it (but 2/3 of Drug Stores, though this was a small sample size). That said, nearly 50% of retailers claim that they expect to adopt this within the next 2 years. Consumers checking themselves out with their own device seems to have the hardest pushback from retailers, as less than 30% plan to adopt the technology in the next 3 years (an eternity in Mobile). This is mainly due to security and operational issues surrounding how consumers can demonstrate that they actually paid for an item as they are walking out the door with it. It is important to keep in mind the fact that this data represents the retailer’s plans for supporting applications that will launch from the Consumer’s mobile device. There is promise going forward, as four of the five technologies show decent adoption rates in the next 12 months.
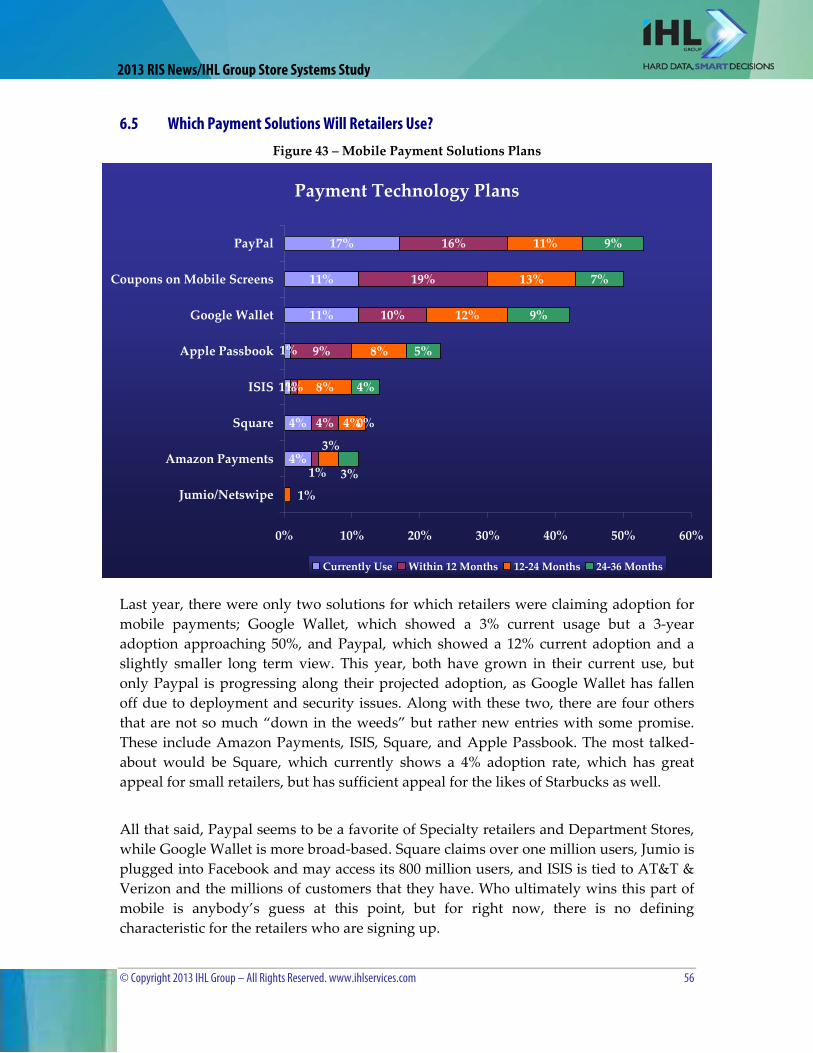
© Copyright 2013 IHL Group – All Rights Reserved. www.ihlservices.com 56
2013 RIS News/IHL Group Store Systems Study
Payment Technology Plans
4%
1%
11%
11%
17%
4%
1%
9%
10%
19%
16%
4%
8%
8%
12%
13%
11%
0%
4%
5%
9%
7%
9%
1%
4%
1%
1%
3%
3%
0% 10% 20% 30% 40% 50% 60%
Jumio/Netswipe
Amazon Payments
Square
ISIS
Apple Passbook
Google Wallet
Coupons on Mobile Screens
PayPal
Currently Use Within 12 Months 12‐24 Months 24‐36 Months
6.5 Which Payment Solutions Will Retailers Use?
Figure 43 – Mobile Payment Solutions Plans
Last year, there were only two solutions for which retailers were claiming adoption for mobile payments; Google Wallet, which showed a 3% current usage but a 3‐year adoption approaching 50%, and Paypal, which showed a 12% current adoption and a slightly smaller long term view. This year, both have grown in their current use, but only Paypal is progressing along their projected adoption, as Google Wallet has fallen off due to deployment and security issues. Along with these two, there are four others that are not so much “down in the weeds” but rather new entries with some promise. These include Amazon Payments, ISIS, Square, and Apple Passbook. The most talked‐about would be Square, which currently shows a 4% adoption rate, which has great appeal for small retailers, but has sufficient appeal for the likes of Starbucks as well.
All that said, Paypal seems to be a favorite of Specialty retailers and Department Stores, while Google Wallet is more broad‐based. Square claims over one million users, Jumio is plugged into Facebook and may access its 800 million users, and ISIS is tied to AT&T & Verizon and the millions of customers that they have. Who ultimately wins this part of mobile is anybody’s guess at this point, but for right now, there is no defining characteristic for the retailers who are signing up.

© Copyright 2013 IHL Group – All Rights Reserved. www.ihlservices.com 57
2013 RIS News/IHL Group Store Systems Study
7.0 A WORD ON BIG DATA
Figure 44 – Big Data Impact
Retail Segment
% Who Expect Big Data Spend
to Increase from 2012
Expected Big Data Increase
Expected Total IT Spend
Increase Overall 74% 4.7% 4.8% Food/Drug/C-Stores 90% 5.8% 4.6% Department Stores 80% 4.4% – 0.4% Specialty Hardgoods 61% 3.3% 4.5% Specialty Softgoods 71% 5.6% 6.6% Hospitality 100% 4.9% 6.6%
Big Data is a term that is used to describe data sets whose size and complexity prohibits the use of the heretofore commonly‐used software tools. Transaction volumes, customer data, environmental matters and SKU details are among the factors that have exacerbated the situation in retail for the past several years. The fact that the Big Data market is growing twice as fast as the software market as a whole is reason enough to take a look at what is going on. From the figure above, it’s pretty clear that the Food/Drug/C‐stores and Specialty Softgoods retailers are the most bullish on Big Data in the coming year, and for different reasons. Transaction volumes tend to drive the Big Data needs for Food/Drug/C‐Store retailers, while customer data and SKU details are the primary drivers for Specialty Softgoods. That said, Department Stores are the ones to watch in the coming year, since they are anticipating an overall decline in IT Spend of 0.4%, while their spend on Big Data increases 4.4%. From a Retail Tier standpoint, 78% of Tier I (average 4.5% increase) and 83% of Tier II retailers (average 4.9% increase) anticipate an increase in IT Spend for Big Data in the next 12 months. As can be expected, the smallest retailers trail by a wide margin, anticipating an average 1.9% increase. We mention this in a study geared towards store systems because the data for Big Data is being generated in the stores while the IT spend for dealing with the data is happening outside the stores.

© Copyright 2013 IHL Group – All Rights Reserved. www.ihlservices.com 58
2013 RIS News/IHL Group Store Systems Study
Status of Cross‐Channel Implementation
21%
39%
37%
48%
30%
8%
15%
14%
19%
25%
18%
14%
26%
10%
14%
18%
6%
18%
10%
9%
16%
3%
3%
7%
3%
3%
5%
1%
1%
23%
23%
5%
0% 10% 20% 30% 40% 50% 60% 70% 80%
Showrooming Prevention
Stores as Fulfillment Centers
True Cross‐channel Merchandising
Return Online Purchases
Order Online from POS
Order inventory at other stores
Check Inventory at Other Stores
Pick Up Online Purchases
Currently Use Within 12 Months 12‐24 Months 24‐36 Months
8.0 CHANNELS CONTINUE TO BLUR
Figure 45 – Cross Channel Purchase Intent
The Sears catalog marked a period of retail where the expectation of customers was to see different product lines and different purchase transactions depending upon the channel through which an item is sold. Those days are long since gone, but retailers are still a long way from meeting their customer’s expectations in this area. The cross channel technologies addressed in this report enjoy a higher adoption rate than many other technologies. The ability to deal with online purchases at a local store (pick up or return) is a real win for the consumer. Once again, the data show a higher adoption of the technologies required for returning the item ordered online than for picking up the item. This would seem to be backwards, since the returns process would involve higher costs (processing, shipping, etc.) borne by the retailer. That said, the aspect of true customer service comes into play here, as retailers are first ensuring they have a satisfied customer who is able to successfully return a product. This helps to lay the groundwork for establishing a successful online purchase & in‐store pickup transaction. That said, Returning Online Purchases at a local store has been stagnant this

© Copyright 2013 IHL Group – All Rights Reserved. www.ihlservices.com 59
2013 RIS News/IHL Group Store Systems Study
past year, as the current 39% adoption rate (and another 19% within the year) is almost exactly the same as last year. The ability to Check the Inventory at Another Store continues to gain momentum, with 48% of respondent retailers (up from 38% last year) already using the technology and another 14% are expected to do so within the year. The penetration across verticals is broad, with obvious allowance made for Food/Grocery and Convenience retailers. The ability to Order Inventory from Another Store is a logical follow‐on to Checking the Inventory at Another Store, and adoption rates of both are increasing and tracking nicely. Order Online from the POS continues to gain momentum (23% currently use it, up from 15% last year), and adoption of this technology will nearly triple in the next two years. Concerning where retailers truly believe they stand in terms of having their Merchandise Planning and Allocation being truly integrated cross‐channel, we see the data tracking nicely from last year’s study. At that time, seventeen percent (17%) claimed that they were already there, and just over 50% were expected to be there within 3 years. Currently, 21% claim there are already there, and just over 50% claim they will be there in the next two years, which provides a nice correlation. Again, this tells us that not only do retailers still have a ways to go in this area, but that they are also maintaining a more sober view of their systems’ performance than before. As we will see in the next section RFID can play a significant role in improving the effectiveness of cross channel availability.
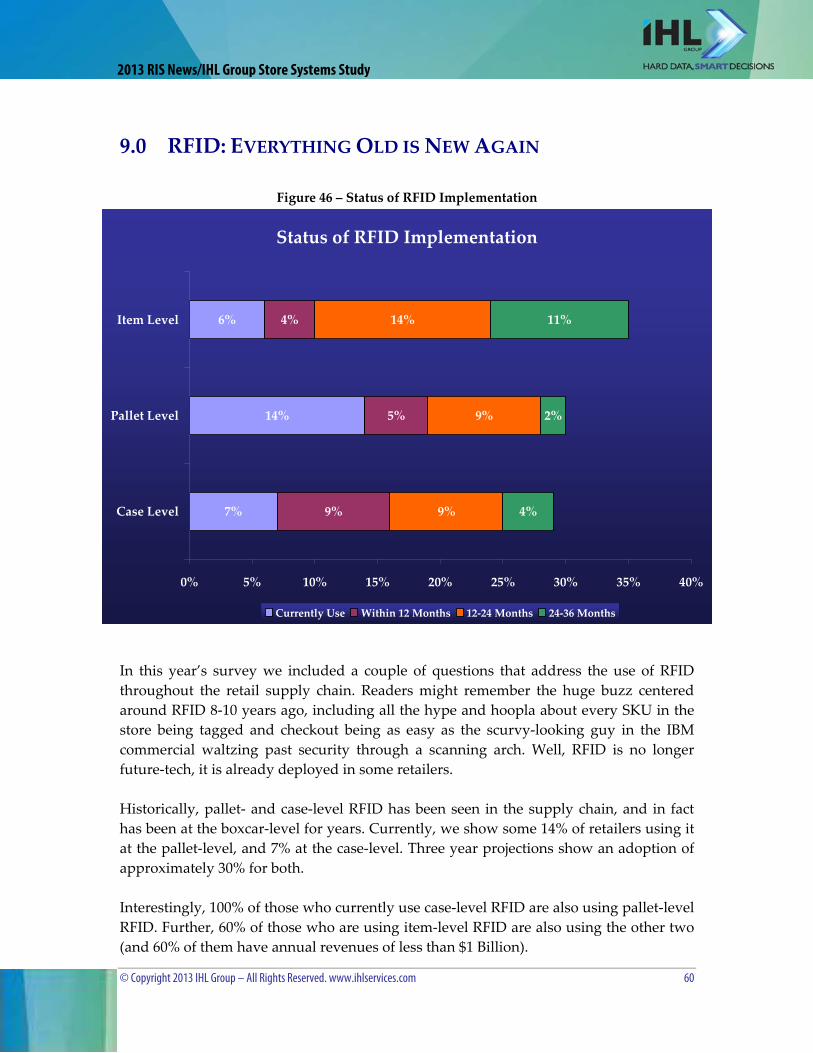
© Copyright 2013 IHL Group – All Rights Reserved. www.ihlservices.com 60
2013 RIS News/IHL Group Store Systems Study
Status of RFID Implementation
6%
9%
5%
4%
9%
9%
14%
4%
2%
11%
14%
7%
0% 5% 10% 15% 20% 25% 30% 35% 40%
Case Level
Pallet Level
Item Level
Currently Use Within 12 Months 12‐24 Months 24‐36 Months
9.0 RFID: EVERYTHING OLD IS NEW AGAIN
Figure 46 – Status of RFID Implementation
In this year’s survey we included a couple of questions that address the use of RFID throughout the retail supply chain. Readers might remember the huge buzz centered around RFID 8‐10 years ago, including all the hype and hoopla about every SKU in the store being tagged and checkout being as easy as the scurvy‐looking guy in the IBM commercial waltzing past security through a scanning arch. Well, RFID is no longer future‐tech, it is already deployed in some retailers. Historically, pallet‐ and case‐level RFID has been seen in the supply chain, and in fact has been at the boxcar‐level for years. Currently, we show some 14% of retailers using it at the pallet‐level, and 7% at the case‐level. Three year projections show an adoption of approximately 30% for both. Interestingly, 100% of those who currently use case‐level RFID are also using pallet‐level RFID. Further, 60% of those who are using item‐level RFID are also using the other two (and 60% of them have annual revenues of less than $1 Billion).

© Copyright 2013 IHL Group – All Rights Reserved. www.ihlservices.com 61
2013 RIS News/IHL Group Store Systems Study
Timeframe for Item‐Level RFID Adoption (Most SKUʹs)
1‐3 Years 24%
3‐5 Years 11%
10+ Years 1%
No Plans 50%
5‐10 Years 11%
Within the Year2%
Currently Use1%
The research from early users is showing that the real value of RFID at the item level is not loss prevention, or understanding that an item was stolen out of a particular door or didn’t even show up at the store. Rather, the real value is improving inventory accuracy and the ability to meet the customer need while they are in the store. Other IHL research has shown that consumers in certain segments are leaving the store without buying at least one item 37% of the time. This is because the real inventory may be off as much as 25% so the stores are not ordering items that are out of stock. RFID therefore brings the promise of more accurate inventory because of more cycle counts, and thus cross channel inventory accuracy and ship‐from‐the‐store is a real economic possibility. Ship‐from‐the‐store simply does not work in an environment where physical inventory is only taken once a year. The data is simply too inaccurate. That said, only Macy’s and a few others are far enough down the road to begin seeing these real benefits. The increase in sales for these categories is often striking as you can imagine. It’s amazing what happens when you are actually in stock for what the customer wants to buy.
Figure 47 – Timeframe for Most SKU’s to be RFID Tagged
© Copyright 2013 IHL Group – All Rights Reserved. www.ihlservices.com 62
2013 RIS News/IHL Group Store Systems Study
Most retailers however have not reached that place of moving to item level RFID. As we can see only 1% currently use RFID at the item level. And only 16% of those who currently claim to be using item‐level RFID actually have it deployed and operable on most of their SKU’s. About a quarter say they will have it working within 3 years, and another quarter say it’ll take them between 3 and 10 years. The rest have no plans at all. As we move further into this decade, we expect to see dramatic increases in the number of retailers deploying RFID at the item level. It may not be a replacement for EAS or even the barcode, but a key technology for the core items within a store to ensure inventory availability. Because of retailers lose the advantage of being able to get the item today versus online competitors, in many segments they lose their competitive advantage altogether.

© Copyright 2013 IHL Group – All Rights Reserved. www.ihlservices.com 63
2013 RIS News/IHL Group Store Systems Study
10. REFERENCES
Sophia Retail Data Service
IHL Group Market Studies:
• Mobility – A Gutenberg Moment for Retail, A Threat to Point‐of‐Sale, Authors Lee Holman, Greg Buzek
• Mobile POS: The First Real Test, Authors Lee Holman, Greg Buzek • Consumer Mobile, The End of the Store As We Know It?, Authors Lee Holman, Greg
Buzek • POS Software for Hardgoods Retailers, Authors Sean M. Alexander, Jerry Sheldon,
Greg Buzek • North American Retail POS Terminal Market Study, Authors Lee Holman, Greg
Buzek • North American Self‐Service Kiosk Study, Authors Lee Holman, Greg Buzek • Small/Medium POS Sizing, Authors Jerry Sheldon, Greg Buzek • North America Hospitality POS Terminal Study, Authors Sean M. Alexander, Greg
Buzek • RIS News/IHL Store Systems Study, Authors Lee Holman, Greg Buzek
Vendor and Retailer Discussions
Vendor, Technology, and Economic Websites
© Copyright 2013 IHL Group – All Rights Reserved. www.ihlservices.com 64
2013 RIS News/IHL Group Store Systems Study
Other IHL Reports Available Include:
Mobile POS: The First Real Test ‐ $3,500 Consumer Mobile: The End of the Store As We Know It? ‐ $1,995
POS Software for Hardgoods Retailers ‐ $795 POS Software for Hardgoods Retailers ‐ $795
North American Retail POS Terminal Market Study ‐ $3,495 Europe/Middle East/Africa POS Terminal Market Study ‐ $3,495
Asia/Pacific POS Terminal Market Study ‐ $3,495 Latin/South American POS Terminal Market Study ‐ $3,495
North American Self‐Service Kiosk Study ‐ $995 North American POS Printer Report ‐ $2,695
Small/Medium POS Sizing ‐ $4,000 What’s the Deal with Out‐of‐Stocks ‐ $1,995
North America Hospitality POS Terminal Study ‐ $1,695 RIS News/IHL Store Systems Study ‐ $3,500
All pricing contained herein is valid as of the publication date and supersedes any pricing from previous price lists.
For details and free market summaries, please see our website or see below for more contact information.
Retail Technology Data Services Include:
Sophia is the most comprehensive review of retail technology in our industry, providing the key performance, technology, and contact information on 3,500 Retailers and 2.5 Million records. It is the only Subscription data service that takes an enterprise view of the technology that retailers are deploying AND the performance that they are achieving with the use of these technologies. For Details and a Free Report, visit our website at www.ihlservices.com
Prepared by:
For Questions or Information:
Phone: +1 615.591.2955 http://www.ihlservices.com