2013 Annual Hospital-Acquired Condition Rate and Estimates ...2013 Annual Hospital-Acquired...
28
2013 Annual Hospital-Acquired Condition Rate and Estimates of Cost Savings and Deaths Averted From 2010 to 2013 Agency for Healthcare Research and Quality 540 Gaither Road Rockville, MD 20850 www.ahrq.gov AHRQ Publication No. 16-0006-EF October 2015
Transcript of 2013 Annual Hospital-Acquired Condition Rate and Estimates ...2013 Annual Hospital-Acquired...

2013 Annual Hospital-Acquired Condition Rate and Estimates of Cost Savings and Deaths Averted From 2010 to 2013
Agency for Healthcare Research and Quality
540 Gaither Road
Rockville, MD 20850
www.ahrq.gov
AHRQ Publication No. 16-0006-EF
October 2015

Methods Used To Estimate the Annual PFP National Hospital-Acquired Condition (HAC) Rate
This document is in the public domain and may be reproduced without permission. Citation of
the source is appreciated.
Suggested Citation
2013 Annual Hospital-Acquired Condition Rate and Estimates of Cost Savings and Deaths
Averted From 2010 to 2013. Rockville, MD: Agency for Healthcare Research and Quality;
October 2015. AHRQ Publication No. 16-0006-EF. http://www.ahrq.gov/professionals/quality-
patient-safety/pfp/index.html

2013 Final HAC Rates 1
2013 Annual Hospital-Acquired Condition Rate and Estimates of Cost Savings and Deaths Averted From 2010 to 2013
Summary
Final estimates for 2013 show a further 9 percent decline in the rate of hospital-acquired
conditions (HACs) from 2012 to 2013, and a 17 percent decline, from 145 to 121 HACs per
1,000 discharges, from 2010 to 2013. A cumulative total of 1.3 million fewer HACs were
experienced by hospital patients over the 3 years (2011, 2012, 2013) relative to the number of
HACs that would have occurred if rates had remained steady at the 2010 level. We estimate that
approximately 50,000 fewer patients died in the hospital as a result of the reduction in HACs,
and approximately $12 billion in health care costs were saved from 2010 to 2013.
Although the precise causes of the decline in patient harm are not fully understood, the increase
in safety has occurred during a period of concerted attention by hospitals throughout the country
to reduce adverse events, spurred in part by Medicare payment incentives and catalyzed by the
U.S. Department of Health and Human Services (HHS) Partnership for Patients initiative led by
the Centers for Medicare & Medicaid Services (CMS).
Introduction
Much attention has been focused on preventing patient harm since the Institute of Medicine’s
(IOM’s) 1999 publication of To Err Is Human: Building a Safer Health System and its
subsequent 2001 publication of Crossing the Quality Chasm: A New Health System for the 21st
Century. These reports, and others that followed, helped to shine a spotlight on patient safety but
also highlighted the fact that making progress to reduce patient harm would be difficult. This
attention also prompted an increase in research funding and associated activities in an effort to
better understand and address this national problem.
Important principles highlighted by the IOM and leaders in the field established a foundation on
which to develop approaches to improve patient safety. Among those principles was an
awareness that many threats to patient safety originate in bad systems, not bad people. Patients
and their skilled providers find themselves in systems that do not always take into account the
factors and challenges presented by the complexities of modern health care. Persistent support
for research focused on understanding health care harm—why it occurs, what can be done to
prevent it, and how to spread and implement proven practices on a national scale—seems to be
making a difference.
Through the aligned efforts of various organizations—including the U.S. Department of Health
and Human Services’ Agency for Healthcare Research and Quality (AHRQ), Centers for Disease
Control and Prevention (CDC), and Centers for Medicare & Medicaid Services (CMS), along
with public-private collaboratives such as the Partnership for Patients (PfP)—significant progress
has been made to reduce certain HACs. Some HACs have declined dramatically in the Nation’s

2 2013 Final HAC Rates
hospitals. For example, according to CDC’s March 2014 Healthcare-Associated Infections
Progress Report,1
central line-associated bloodstream infections (CLABSIs) dropped 44 percent
from 2008 to 2012, and some surgical site infections (SSIs) dropped as much as 20 percent.
Similar results on CLABSIs have also been documented in AHRQ’s nationwide Comprehensive
Unit-based Safety Program (CUSP) to prevent CLABSI.2
In 2010 an HHS Office of the Inspector General (OIG) team identified the rate of harm—that is,
injuries to patients associated with their care—among hospitalized Medicare patients as 27
percent. Half of these inpatients experienced one or more adverse events that resulted in a
prolonged hospital stay, permanent harm, a life-sustaining intervention, or death. Almost half of
all events identified in the OIG report were considered preventable.3
The persistence of this
challenge prompted formation of the nationwide PfP initiative, which aimed to save lives by
preventing HACs and improving the transition of care from one care setting to another in order to
reduce readmissions.
The PfP is a very large national quality improvement learning collaborative with two aims: to
improve safety in acute care hospitals and to improve coordination of care at discharge to prevent
readmissions. The PfP is much more than a collection of hospital engagement network (HEN)
contracts. It is a public-private partnership that seeks national change by setting clear aims,
aligning and engaging multiple Federal partners and programs, aligning and engaging multiple
private partners and payers, and establishing a national learning network through a CMS
investment in 26 HEN contractors. These contractors successfully enrolled more than 3,700
acute care hospitals in the initiative and had these hospitals engaged in achieving the aims
throughout 2012, 2013, and 2014. These hospitals account for 80 percent of the Nation’s acute
care discharges.
Simultaneously, CMS pursued aligned changes in payment policy, a nationwide program of
technical assistance aimed at improving hospital safety and care coordination through the
Nation’s Quality Improvement Organizations (QIOs), and a program of work through the CMS
Innovation Center known as the “Community Based Care Transitions Program” (CCTP). The
purpose of CCTP is to also improve care transitions from inpatient hospitals, while documenting
savings to the Medicare program. All these programs were designed to work in synergy and
cooperation with one another. The PfP is a fully aligned “full-court press” to achieve two aims:
40 percent reduction in preventable harm4
and 20 percent reduction in 30 day readmissions.
1 Centers for Disease Control and Prevention. 2012 National and State Healthcare-Associated Infections Progress
Report. Published March 26, 2014. http://www.cdc.gov/hai/progress-report/index.html. 2 Initial groundbreaking work was published by Pronovost, et al., in 2006 in the New England Journal of Medicine
(full text is available online at: http://www.nejm.org/doi/full/10.1056/NEJMoa061115#t=article). The AHRQ final
report on this work is online at http://www.ahrq.gov/professionals/quality-patient-safety/cusp/clabsi-
final/index.html. 3 Based on information from the HHS OIG and other sources, the preventable fraction of inpatient HACs
wasestimated at 44 percent. This report is available online at http://oig.hhs.gov/oei/reports/oei-06-09-00090.pdf. 4 Based on the OIG report estimating that 44 percent of HACs are preventable, a 40 percent reduction in preventable
HACs equates to an overall 17.6 percent reduction in total HACs. See Exhibits A2 and A4 in the Appendix for more
information on estimates and projections of cost savings and deaths averted that are based on projected and measured
reductions of HACs.
2013 Final HAC Rates 3
At the outset of the PfP initiative, HHS agencies contributed their expertise to developing a
measurement strategy by which to track national progress in patient safety—both in general and
specifically related to the preventable HACs being addressed by the PfP. In conjunction with
CMS’s overall leadership of the PfP, AHRQ has helped coordinate development and use of the
national measurement strategy. The results using this national measurement strategy have been
referred to as the “AHRQ National Scorecard,” which provides summary data on the national
HAC rate.5
The results reported in this brief are based on this national measurement strategy.
Data and Methods
Estimating the Rate of Hospital-Acquired Conditions
Data on the rate of HACs comes from three sources:
Review of approximately 18,000 to 33,000 medical records in each year, using a
structured protocol and software tool, to determine whether any of 21 types of adverse
events—such as adverse drug events, falls, and pressure ulcers—occurred. The medical
records used for the Medicare Patient Safety Monitoring System (MPSMS) come from
the CMS Inpatient Quality Reporting (IQR) Program.6
After the medical records are
abstracted with the MPSMS software tool, the data are used to calculate 7 of 9 PfP HACs
(2 of 9 PfP HACs are calculated differently as described below). Overall, this represents
approximately 92 percent of measured HACs calculated for the PfP. The 9 types of HACs
selected for special focus (“core HACs”) by the PfP are listed in Exhibit A1 in the
Appendix, along with the MPSMS and other measures used. Ten of the MPSMS
measures are used to generate the majority of HACs in the “All Other HACs” group,
which was established to allow tracking of a variety of other important sources of harm to
patients in addition to the 9 “core” HACs referred to above;
Data on SSIs are generated by a special calculation performed by CDC in support of the
PfP. The data are based on 17 major surgical procedure types, composed of the 12
operations included in the Surgical Care Improvement Project, and 5 other frequent
operations, such as cesarean sections. The underlying data are reported by hospitals as
part of the National Healthcare Safety Network (NHSN), operated by CDC. These data
on SSIs are used to calculate the HAC rates, overall, for approximately 2 percent of all
measured HACs in the PfP initiative; and
5 The overall national strategy for measurement activities associated with the PfP was described recently in the
Journal of Patient Safety (available at: http://journals.lww.com/journalpatientsafety/Abstract/2014/09000/
An_Overview_of_Measurement_Activities_in_the.2.aspx). Baseline HAC data for the 2010 AHRQ National
Scorecard, and for 2011 and 2012, are available online at http://www.ahrq.gov/professionals/quality-patient-
safety/pfp/pfphac.pdf and http://www.ahrq.gov/professionals/quality-patient-safety/pfp/hacrate2011-12.pdf, respectively. 6 Information regarding the CMS IQR Program is available at https://www.cms.gov/Medicare/Quality-Initiatives-
Patient-Assessment-Instruments/HospitalQualityInits/HospitalRHQDAPU.html. Information about the MPSMS
sample is also described in the article “National Trends in Patient Safety for Four Common Conditions, 2005–2011,”
available at http://www.nejm.org/doi/full/10.1056/NEJMsa1300991.

4 2013 Final HAC Rates
Data for obstetric adverse events come from AHRQ Patient Safety Indicators (PSIs) 18
and 19. In addition, data on four other PSIs were selected to contribute to the “All Other
HACs” referred to above. These 6 PSIs are derived from Healthcare Cost and Utilization
Project (HCUP) data7
and account for approximately 6 percent of all measured HACs in
the PfP initiative.
The MPSMS data come from a system in which a sample of IQR medical records are reviewed
by trained abstractors who use a structured protocol and software tool to determine whether any
of 21 specific measures of adverse events occurred during the hospital stay.8 Inter-rater reliability
is high.9
The methods for acquiring the IQR sample have changed little from 2010 through 2013, and the
protocols for determining if specific adverse events have occurred has not changed
significantly.10 The use of a consistent data source and a consistent measurement technique gives
us confidence that our estimates of the change in the HAC rate from 2010 to 2013 are unbiased.11
We also have a relatively large sample size.
The methods to estimate the national HAC rate are described in detail in the document “Methods
Used To Estimate the Annual PfP National Hospital-Acquired Condition (HAC) Rate,” available
at http://www.ahrq.gov/professionals/quality-patient-safety/pfp/index.html; and the 2011 and
2012 HAC data are available at http://www.ahrq.gov/professionals/quality-patient-
safety/pfp/hacrate2011-12.html.
Estimating the Impact of HAC Reduction on Deaths Averted and Costs Saved
As described above, the analysis of the data allows us to directly measure the number of HACs,
and the vast majority (>90%) of the data are gathered through review of medical records. In
contrast, our estimates of deaths averted and cost savings result from computations based on
7 HCUP is a family of databases and related software tools and products developed through a Federal-State-industry
partnership and sponsored by AHRQ. HCUP databases are derived from administrative data and contain encounter-
level, clinical, and nonclinical information, including all-listed diagnoses and procedures, discharge status, patient
demographics, and charges for all patients, regardless of payer (e.g., Medicare, Medicaid, private insurance,
uninsured). The HCUP databases are based on the data collection efforts of organizations in participating States that
maintain statewide data systems and are partners with AHRQ. http://www.ahrq.gov/research/data/hcup/index.html 8 MPSMS methods are described in a recent publication: Wang Y, Eldridge N, Metersky M, et al. National trends in
patient safety for four common conditions, 2005–2011. N Engl J Med 2014;370:341-51. This publication and
detailed appendixes are available online at: http://www.nejm.org/doi/full/10.1056/NEJMsa1300991#t=article. 9 The measured agreement rates between abstractors using the MPSMS software tool have ranged from 94 percent to
99 percent for data elements used to identify adverse events. (Source is same as above: Wang Y, Eldridge N,
Metersky M, et al.) 10
The abstraction protocol used for MPSMS has only undergone minor changes since the PfP measurement plan was
established, such as when updates were necessary regarding the names of medications and other minor corrections
that allow abstractors to accurately answer the questions that lead to the generation of the MPSMS rates. 11
The use of the “present on admission” indicator in billing data has likely changed over time, as hospitals have
become more careful in documenting which conditions were present on admission in the billing data they submit to
CMS and other payers. However, greater use of the “present on admission” indicator in billing data would not affect
the results of the medical record review we used to estimate 92 percent of the HACs.

2013 Final HAC Rates 5
changes in the number of each type of HAC. The estimated cost savings and deaths averted per
HAC, shown in Exhibit 1 and Exhibit A4, and used in Exhibit A2, were based on a review of
available information in published peer-reviewed articles; published and internal CMS, AHRQ,
and CDC reports; and other sources, in combination with expert opinion from inside and outside
the team.
These cost and mortality estimates per HAC were developed in 2010 and early 2011, prior to the
start of the PfP, and were based on data available to the HHS team at the time. In preparation for
the analysis conducted in 2010, we identified estimates of the association of each HAC with
excess mortality and with increased costs of care. Estimating the precise impact of HACs is
challenging and complex due, in part, to variable severity of individual HACs, potential for
interaction among different HACs and patient comorbidities, degree to which various analyses
have addressed these factors, and variable methodologies that have been used to study the impact
of individual HACs on excess mortality and costs.
For many HACs, the literature did not provide precise estimates of the effects of an HAC on
either mortality or costs, and, for many HACs, more than one estimate was available. In these
cases judgment was used to estimate the effects of an HAC on mortality and costs. Estimates of
the impact from individual HACs were also considered in light of estimates of overall hospital
mortality and costs, nationally, as well as aggregate mortality and excess costs due to HACs.
Exhibit 1 displays the cost and mortality estimates that were used for each HAC and are based on
analyses done in late 2010 and 2011.12
Exhibit 1. Excess Cost and Mortality Estimated in 2011 (at the Launch of PfP), by Hospital- Acquired Condition
PfP Hospital Acquired Condition Estimated Additional
Cost* per HAC Estimated Additional
Inpatient Mortality per HAC
Adverse Drug Events $5,000 .020
Catheter-Associated Urinary Tract Infections
$1,000 .023
Central Line-Associated Bloodstream Infections
$17,000 .185
Falls $7,234 .055
Obstetric Adverse Events $3,000 .0015
Pressure Ulcers $17,000 .072
Surgical Site Infections $21,000 .028
Ventilator-Associated Pneumonia
$21,000 .144
Postoperative Venous Thromboembolism
$8,000 .104
12
See Exhibit A4 in the Appendix for additional information.
6 2013 Final HAC Rates
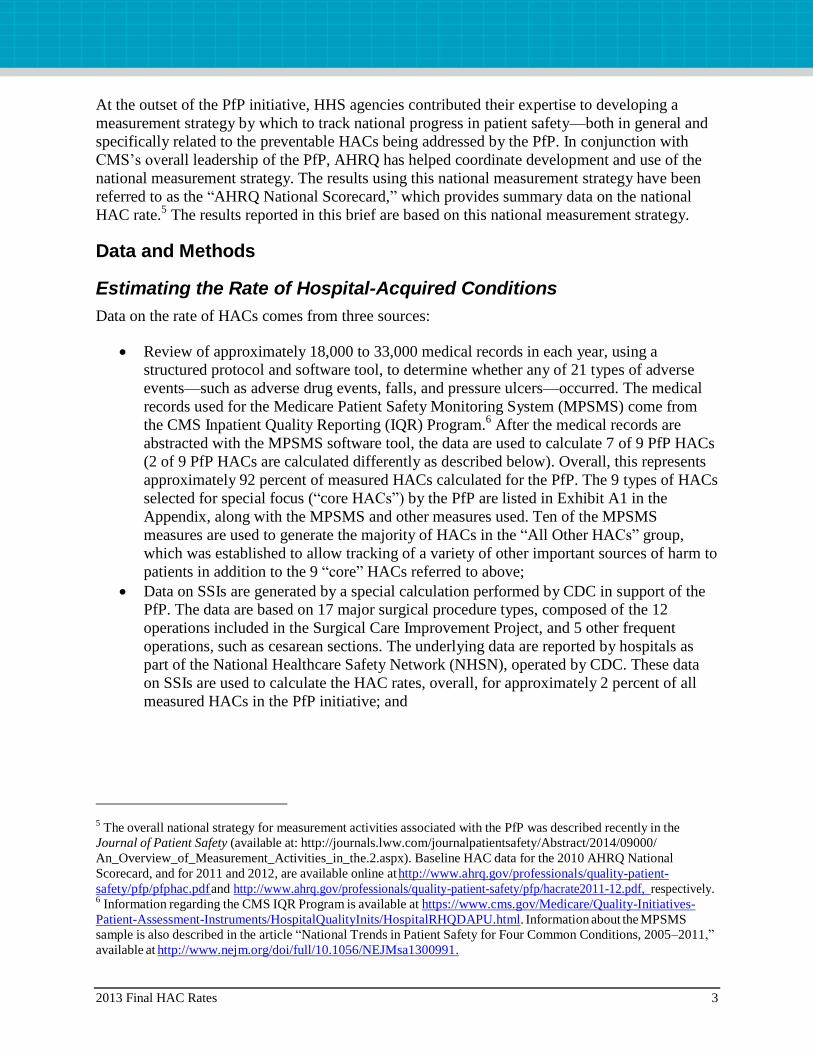
As shown in the results section below, the largest effects on estimates of the deaths averted and
cost savings come from declines in pressure ulcers and adverse drug events. As shown in Exhibit
1 we estimate that pressure ulcers are associated with an excess mortality rate of 72 deaths per
1,000 and excess costs of $17,000/case, and adverse drug events (ADEs) with an excess
mortality of 20 deaths per 1,000 and excess costs of $5,000/case.
The estimated cost per pressure ulcer was based on a report for CMS by RTI international
(Kandilov, et al.; the HHS team accessed a draft report in 2010-2011, and the final October 2011
report is referenced in the Appendix). RTI estimated that the difference in costs between patients
with hospital-acquired Stage III and Stage IV pressure ulcers and matched patients without
hospital-acquired Stage III and IV pressure ulcers, based on bivariate descriptive analysis, is
$17,286.
This estimate was derived by first identifying hospital claims paid under the inpatient prospective
payment system (IPPS) and discharged in FY 2009 that had 1 of 10 selected HACs. These were
considered index claims. Costs included the initial hospital stay and costs of other inpatient sites
of care that occurred within 90 days of discharge. For each index HAC claim, there were five
IPPS claims with the same Medicare Severity diagnosis-related group (MS- DRG), sex, race, and
age that did NOT have a Stage III or IV pressure ulcer that were used as a matched control
group. They then used bivariate (descriptive) and multivariate analysis to examine the differences
in Medicare program costs between the two groups.
The estimate for deaths associated with pressure ulcers was based primarily on the paper by Zhan
and Miller in 2003 (see reference in Appendix). Zhan and Miller estimated that excess mortality
due to pressure ulcers was 72 deaths per 1,000 pressure ulcers. This estimate is based on analysis
of data from HCUP identifying injuries in 7.45 million hospital discharge abstracts from 994
acute care hospitals across 28 States in 2000. Mortality for patients with pressure ulcer was
compared to mortality among a matched set of patients, where patients were matched on DRG,
comorbidities, age, gender, race, and hospital. References to all the documents used in these
estimates and projections are provided in the Appendix.
The team also had access to MPSMS annual reports available at the time (results through CY
2009). MPSMS data provide inpatient mortality data for the patients who experienced each type
of adverse event, and for patients who were exposed to risk for the event.13
These MPSMS
mortality data were of interest even though they could not be used directly for attribution of
deaths to adverse events.
13
For pressure ulcers and falls, 100 percent of patients are exposed to risk for the event; but for other event types,
such as CLABSIs, only a fraction of patients are exposed to risk for the event. In the case of CLABSI, only patients
who received a central line as part of their inpatient care are considered at risk for the event.

2013 Final HAC Rates 7
Results
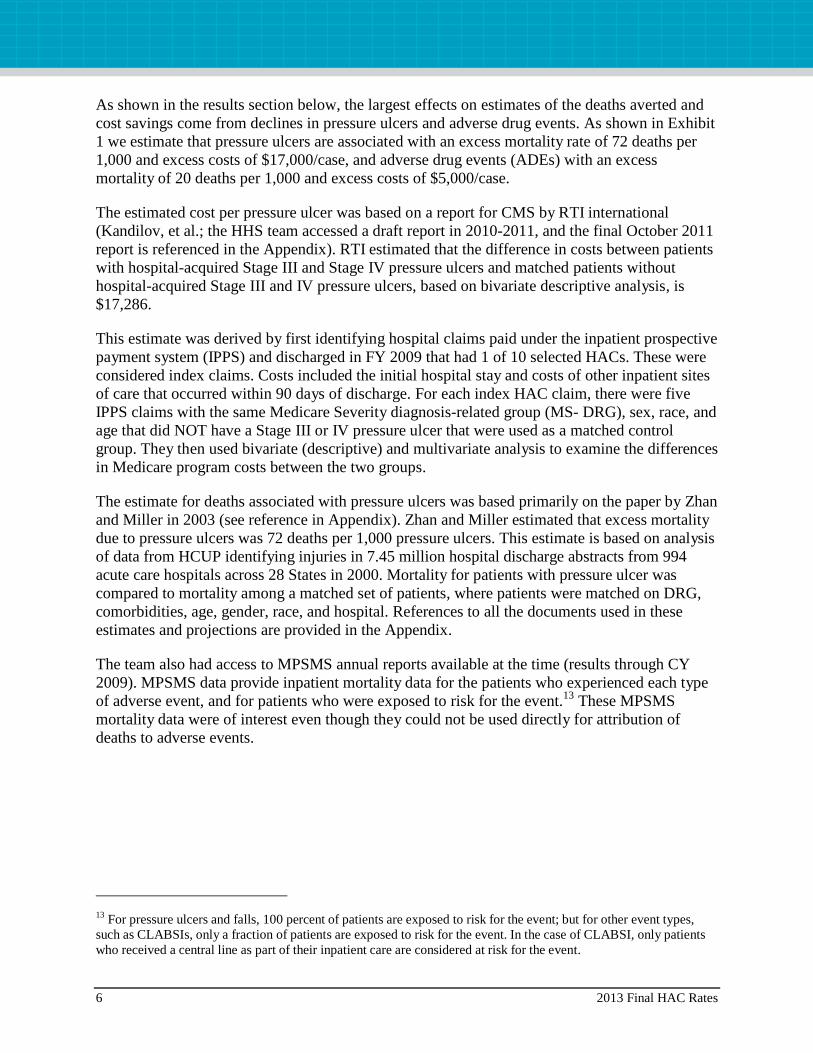
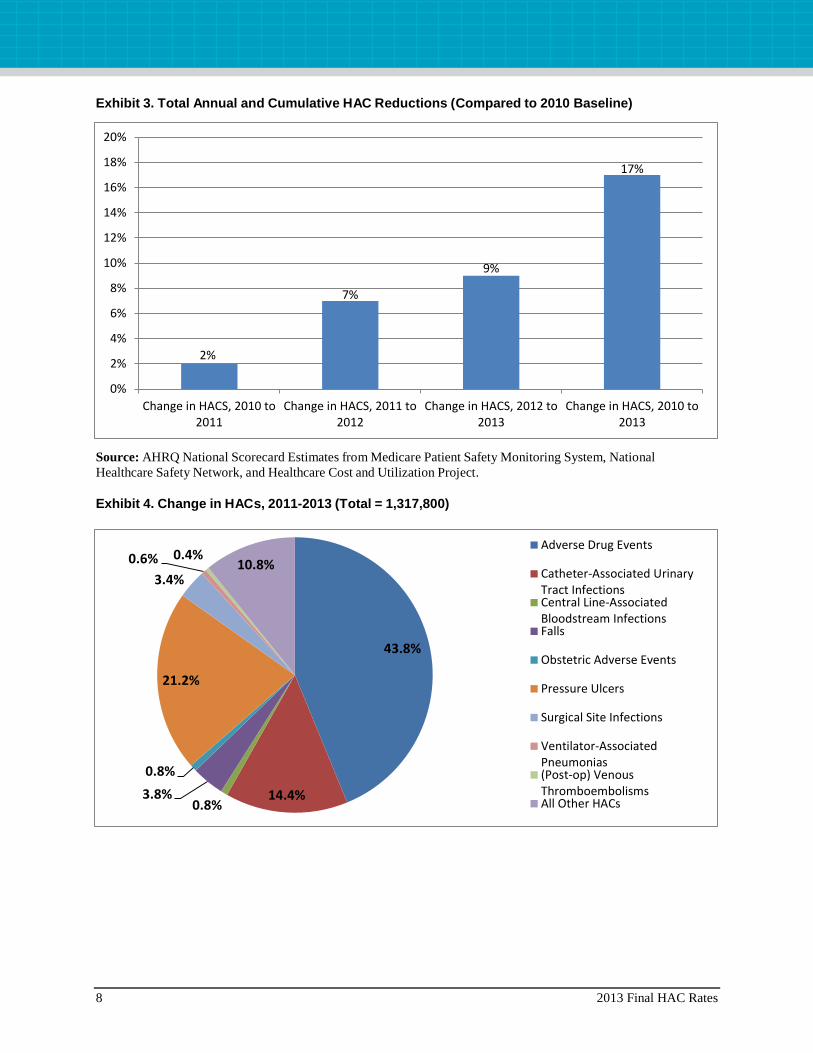
Final estimates for 2013 show that the national HAC rate declined by 9 percent from 2012 to
2013 and was 17 percent lower in 2013 than in 2010 (see Exhibit 2). As a result of the reduction
in the rate of HACs, we estimate that approximately 800,000 fewer incidents of harm occurred in
2013 than would have occurred if the rate of HACs had remained steady at the 2010 level
(Exhibit 3). Cumulatively, approximately 1.3 million fewer incidents of harm occurred in 2011,
2012, and 2013 (compared to 2010), with most of the improvement occurring in 2012 and 2013.
About 40 percent of this reduction is from ADEs, about 20 percent is from pressure ulcers, and
about 14 percent from catheter-associated urinary tract infections (CAUTIs) (Exhibit 4). These
HACs constituted about 34 percent, 27 percent, and 8 percent of the HACs measured in the 2010
baseline rate (Exhibit A2).
Exhibit 2. Annual and Cumulative Changes in HACs, 2010 to 2013*
Source: AHRQ National Scorecard Estimates from Medicare Patient Safety Monitoring System, National Healthcare
Safety Network, and Healthcare Cost and Utilization Project.
Note: The 17 percent change from 2010 to 2013 is not the sum of 2 percent, 7 percent, and 9 percent due to different
total HAC rates in 2010, 2011, and 2012.
98,000
420,000
799,800
1,317,800
0
200,000
400,000
600,000
800,000
1,000,000
1,200,000
1,400,000
2011 2012 2013 Cumulative (2010-2013)
8 2013 Final HAC Rates
Exhibit 3. Total Annual and Cumulative HAC Reductions (Compared to 2010 Baseline)
Source: AHRQ National Scorecard Estimates from Medicare Patient Safety Monitoring System, National
Healthcare Safety Network, and Healthcare Cost and Utilization Project.
Exhibit 4. Change in HACs, 2011-2013 (Total = 1,317,800)
2%
7%
9%
17%
0%
2%
4%
6%
8%
10%
12%
14%
16%
18%
20%
Change in HACS, 2010 to2011
Change in HACS, 2011 to2012
Change in HACS, 2012 to2013
Change in HACS, 2010 to2013
43.8%
14.4% 0.8%
3.8%
0.8%
21.2%
3.4%
0.6% 0.4% 10.8%
Adverse Drug Events
Catheter-Associated UrinaryTract InfectionsCentral Line-AssociatedBloodstream InfectionsFalls
Obstetric Adverse Events
Pressure Ulcers
Surgical Site Infections
Ventilator-AssociatedPneumonias(Post-op) VenousThromboembolismsAll Other HACs
2013 Final HAC Rates 9
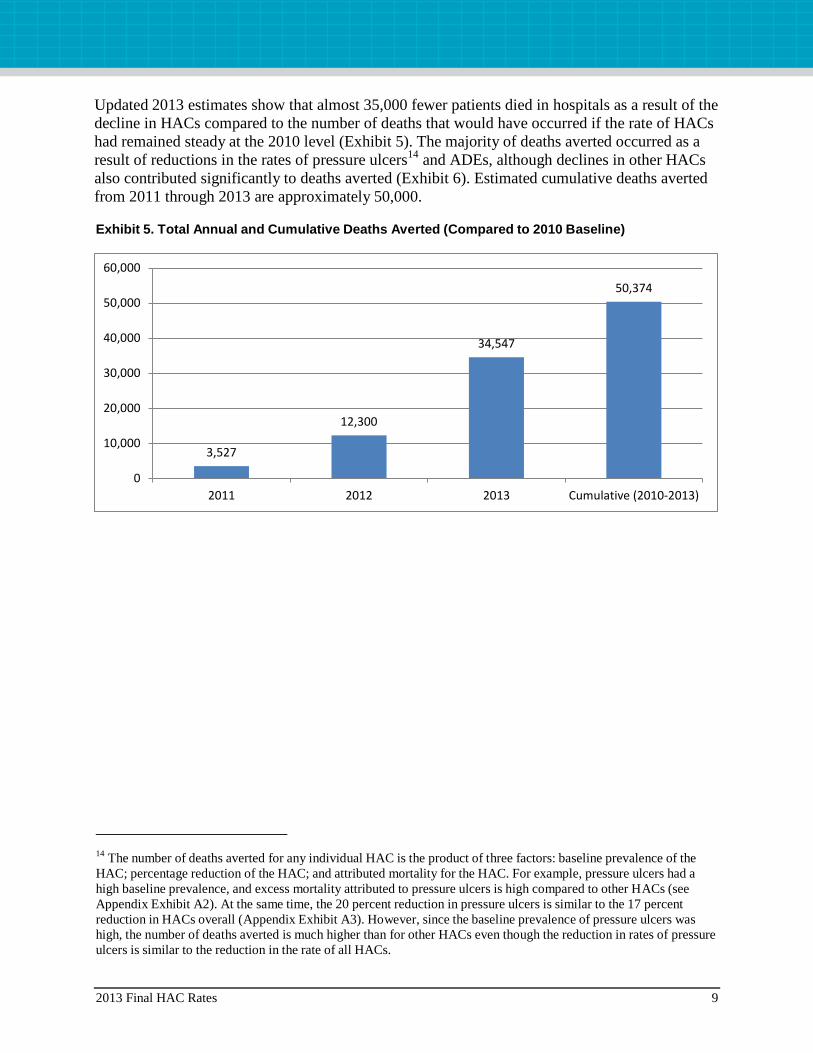
Updated 2013 estimates show that almost 35,000 fewer patients died in hospitals as a result of the
decline in HACs compared to the number of deaths that would have occurred if the rate of HACs
had remained steady at the 2010 level (Exhibit 5). The majority of deaths averted occurred as a
result of reductions in the rates of pressure ulcers14
and ADEs, although declines in other HACs
also contributed significantly to deaths averted (Exhibit 6). Estimated cumulative deaths averted
from 2011 through 2013 are approximately 50,000.
Exhibit 5. Total Annual and Cumulative Deaths Averted (Compared to 2010 Baseline)
14
The number of deaths averted for any individual HAC is the product of three factors: baseline prevalence of the
HAC; percentage reduction of the HAC; and attributed mortality for the HAC. For example, pressure ulcers had a
high baseline prevalence, and excess mortality attributed to pressure ulcers is high compared to other HACs (see
Appendix Exhibit A2). At the same time, the 20 percent reduction in pressure ulcers is similar to the 17 percent
reduction in HACs overall (Appendix Exhibit A3). However, since the baseline prevalence of pressure ulcers was
high, the number of deaths averted is much higher than for other HACs even though the reduction in rates of pressure
ulcers is similar to the reduction in the rate of all HACs.
3,527
12,300
34,547
50,374
0
10,000
20,000
30,000
40,000
50,000
60,000
2011 2012 2013 Cumulative (2010-2013)

10 2013 Final HAC Rates
Exhibit 6. Estimated Deaths Averted, by Hospital-Acquired Condition (HAC), 2011-2013
Final 2013 estimates show that the decline in HACs resulted in estimated cost savings of
approximately $8 billion in 2013. Estimated cumulative savings for 2011, 2012, and 2013 are
approximately $12 billion (Exhibit 7). As was the case for the deaths averted estimates, the
majority of cost savings are estimated to result from declines in pressure ulcers and ADEs
(Exhibit 8).
Exhibit 7. Total Annual and Cumulative Cost Savings (Compared to 2010 Baseline)
11,540
4,427
1,998 2,750
15
20,272
1,269
1,150
520 6,433
Adverse Drug Events
Catheter-Associated UrinaryTract InfectionsCentral Line-AssociatedBloodstream InfectionsFalls
Obstetric Adverse Events
Pressure Ulcers
Surgical Site Infections
Ventilator-AssociatedPneumonias(Post-op) VenousThromboembolismsAll Other HACs
$894,000,000
$3,097,020,000
$7,986,280,000
$11,977,300,000
$0
$2,000,000,000
$4,000,000,000
$6,000,000,000
$8,000,000,000
$10,000,000,000
$12,000,000,000
$14,000,000,000
2011 2012 2013 Cumulative (2010-2013)

2013 Final HAC Rates 11
Exhibit 8. Estimated Cost Savings, by Hospital-Acquired Condition (HAC), 2010-2013
Discussion
The estimated 17 percent reduction in HACs from 2010 to 2013 indicates that hospitals have
made substantial progress in improving safety. An estimated 1.3 million fewer harms were
experienced by patients from 2010 to 2013 than would have occurred if the rate of harm had
remained at the 2010 level. The reasons for this progress are not fully understood. Likely
contributing causes are financial incentives created by CMS and other payers’ payment policies,
public reporting of hospital-level results, technical assistance offered by the QIO program to
hospitals, and technical assistance and catalytic efforts of the HHS PfP initiative led by CMS.15
There is still much more work to be done, even with the 17 percent decline in the HACs we have
measured for the PfP since 2010. The 2013 HAC rate of 121 HACs per 1,000 discharges means
that almost 10 percent16
of hospitalized patients experienced one or more of the HACs we
measured. That rate is still too high.
15
The independent evaluator of the PfP has a comprehensive evaluation design in place that will work to assess the
overall contribution of the PfP initiative to the improvements documented in this paper. The CMS Office of the
Actuary will use this evaluation and other data to make judgments about the overall impact of the PfP model test 16
The rate of 121 HACs per 1,000 discharges does not equate to 12.1% of patients experiencing HACs because some
patients experience more than one HAC during an inpatient hospital stay. Based on prior experience reviewing HAC
data, the 121 HACs per 1,000 discharges are probably experienced by fewer than 100 patients among 1,000
discharges (10 percent of inpatients).
$2,885,000,000
$190,000,000
$183,600,000
$361,700,000
$30,000,000
$4,760,000,000
$945,000,000
$168,000,000
$40,000,000 $2,414,000,000
Adverse Drug Events Catheter-Associated Urinary Tract InfectionsCentral Line-Associated Bloodstream Infections FallsObstetric Adverse Events Pressure UlcersSurgical Site Infections Ventilator-Associated Pneumonias(Post-op) Venous Thromboembolisms All Other HACs
12 2013 Final HAC Rates
Prevention of approximately 50,000 deaths in the 2011 to 2013 period as a result of the decline in
HACs, with almost 35,000 of these deaths averted in 2013 alone, is a remarkable achievement.
As indicated in the results section, the estimate of deaths averted is less precise than the estimate
of the size of the reduction in HAC rates. We directly estimate the size of the reduction in HAC
rates but rely on analysis from other researchers of the complex relationship between HACs and
mortality to extrapolate the impact of the reduction in HACs on deaths averted. These estimates
used in our analysis originate from a variety of sources and methodologies. Even with the
uncertainty inherent in our statistical extrapolations, it is clear that approximately 1 million
Americans have avoided harm as a result of the reduction in HACs, and that tens of thousands of
deaths have been averted as a result.
We estimate an associated reduction of $12 billion in health care costs from 2011 to 2013 as a
result of the reduction in HACs, with $8 billion of those cost savings accruing in 2013 alone. As
is the case for the estimate of deaths averted, there is less precision regarding the cost savings
estimates than there is about the estimates of the magnitude of reduction in HACs. Even with less
precision in the estimates, the potential cost savings are compelling and warrant serious attention
by hospital associations, hospital systems, and executives.
Despite the tremendous progress to date in reducing HACs, much work remains to be done to
ensure that the U.S. health care system is as safe as it can possibly be. HHS and other public and
private partners are continuing to work to improve hospital safety. These latest data indicate that
it is possible to make substantial progress in reducing virtually all types of HACs simultaneously.
PfP leaders have termed this objective as achieving “Safety Across the Board” and believe it
should be a national goal.
2013 Final HAC Rates 13
Appendix: Incidence of Hospital-Acquired Conditions in the Partnership for Patients: Estimates and Projected and Measured Impact
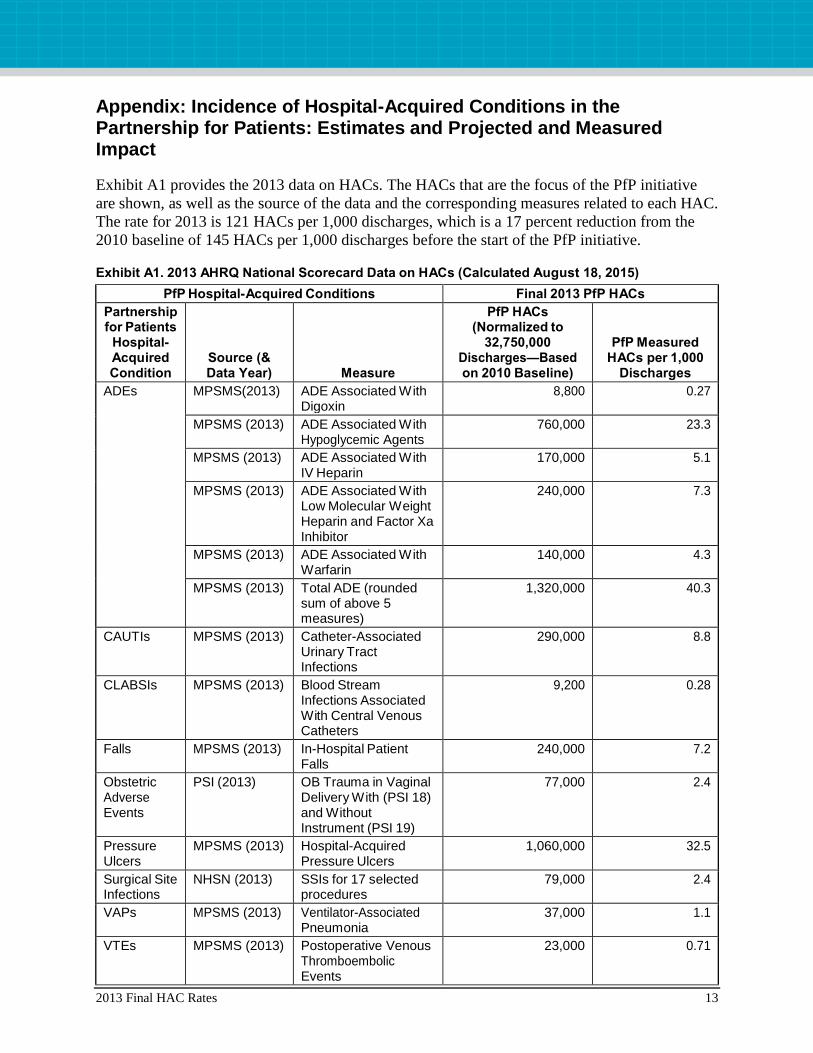
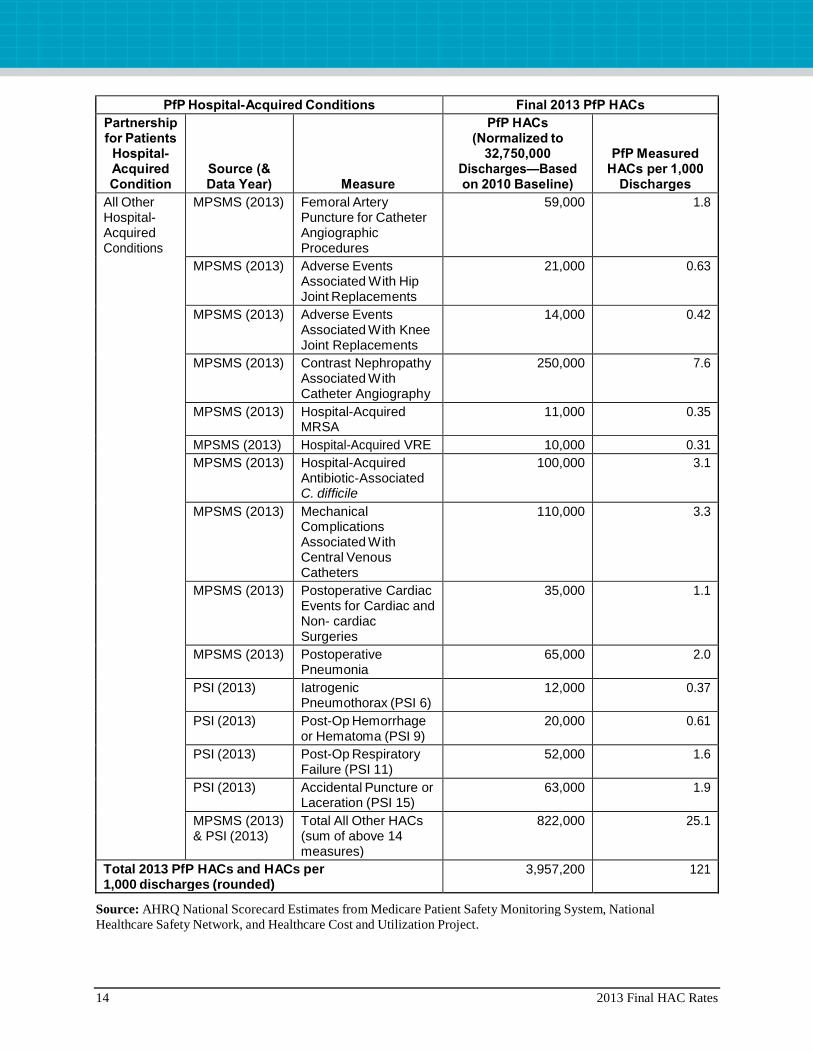
Exhibit A1 provides the 2013 data on HACs. The HACs that are the focus of the PfP initiative
are shown, as well as the source of the data and the corresponding measures related to each HAC.
The rate for 2013 is 121 HACs per 1,000 discharges, which is a 17 percent reduction from the
2010 baseline of 145 HACs per 1,000 discharges before the start of the PfP initiative.
Exhibit A1. 2013 AHRQ National Scorecard Data on HACs (Calculated August 18, 2015)
PfP Hospital-Acquired Conditions Final 2013 PfP HACs
Partnership for Patients
Hospital- Acquired Condition
Source (& Data Year) Measure
PfP HACs (Normalized to
32,750,000 Discharges—Based on 2010 Baseline)
PfP Measured HACs per 1,000
Discharges
ADEs MPSMS(2013) ADE Associated With Digoxin
8,800 0.27
MPSMS (2013) ADE Associated With Hypoglycemic Agents
760,000 23.3
MPSMS (2013) ADE Associated With IV Heparin
170,000 5.1
MPSMS (2013) ADE Associated With Low Molecular Weight Heparin and Factor Xa Inhibitor
240,000 7.3
MPSMS (2013) ADE Associated With Warfarin
140,000 4.3
MPSMS (2013) Total ADE (rounded sum of above 5 measures)
1,320,000 40.3
CAUTIs MPSMS (2013) Catheter-Associated Urinary Tract Infections
290,000 8.8
CLABSIs MPSMS (2013) Blood Stream Infections Associated With Central Venous Catheters
9,200 0.28
Falls MPSMS (2013) In-Hospital Patient Falls
240,000 7.2
Obstetric Adverse Events
PSI (2013) OB Trauma in Vaginal Delivery With (PSI 18) and Without Instrument (PSI 19)
77,000 2.4
Pressure Ulcers
MPSMS (2013) Hospital-Acquired Pressure Ulcers
1,060,000 32.5
Surgical Site Infections
NHSN (2013) SSIs for 17 selected procedures
79,000 2.4
VAPs MPSMS (2013) Ventilator-Associated Pneumonia
37,000 1.1
VTEs MPSMS (2013) Postoperative Venous Thromboembolic Events
23,000 0.71
14 2013 Final HAC Rates
PfP Hospital-Acquired Conditions Final 2013 PfP HACs
Partnership for Patients
Hospital- Acquired Condition
Source (& Data Year) Measure
PfP HACs (Normalized to
32,750,000 Discharges—Based on 2010 Baseline)
PfP Measured HACs per 1,000
Discharges
All Other Hospital- Acquired Conditions
MPSMS (2013) Femoral Artery Puncture for Catheter Angiographic Procedures
59,000 1.8
MPSMS (2013) Adverse Events Associated With Hip Joint Replacements
21,000 0.63
MPSMS (2013) Adverse Events Associated With Knee Joint Replacements
14,000 0.42
MPSMS (2013) Contrast Nephropathy Associated With Catheter Angiography
250,000 7.6
MPSMS (2013) Hospital-Acquired MRSA
11,000 0.35
MPSMS (2013) Hospital-Acquired VRE 10,000 0.31
MPSMS (2013) Hospital-Acquired Antibiotic-Associated C. difficile
100,000 3.1
MPSMS (2013) Mechanical Complications Associated With Central Venous Catheters
110,000 3.3
MPSMS (2013) Postoperative Cardiac Events for Cardiac and Non- cardiac Surgeries
35,000 1.1
MPSMS (2013) Postoperative Pneumonia
65,000 2.0
PSI (2013) Iatrogenic Pneumothorax (PSI 6)
12,000 0.37
PSI (2013) Post-Op Hemorrhage or Hematoma (PSI 9)
20,000 0.61
PSI (2013) Post-Op Respiratory Failure (PSI 11)
52,000 1.6
PSI (2013) Accidental Puncture or Laceration (PSI 15)
63,000 1.9
MPSMS (2013) & PSI (2013)
Total All Other HACs (sum of above 14 measures)
822,000 25.1
Total 2013 PfP HACs and HACs per 1,000 discharges (rounded)
3,957,200 121
Source: AHRQ National Scorecard Estimates from Medicare Patient Safety Monitoring System, National
Healthcare Safety Network, and Healthcare Cost and Utilization Project.
2013 Final HAC Rates 15
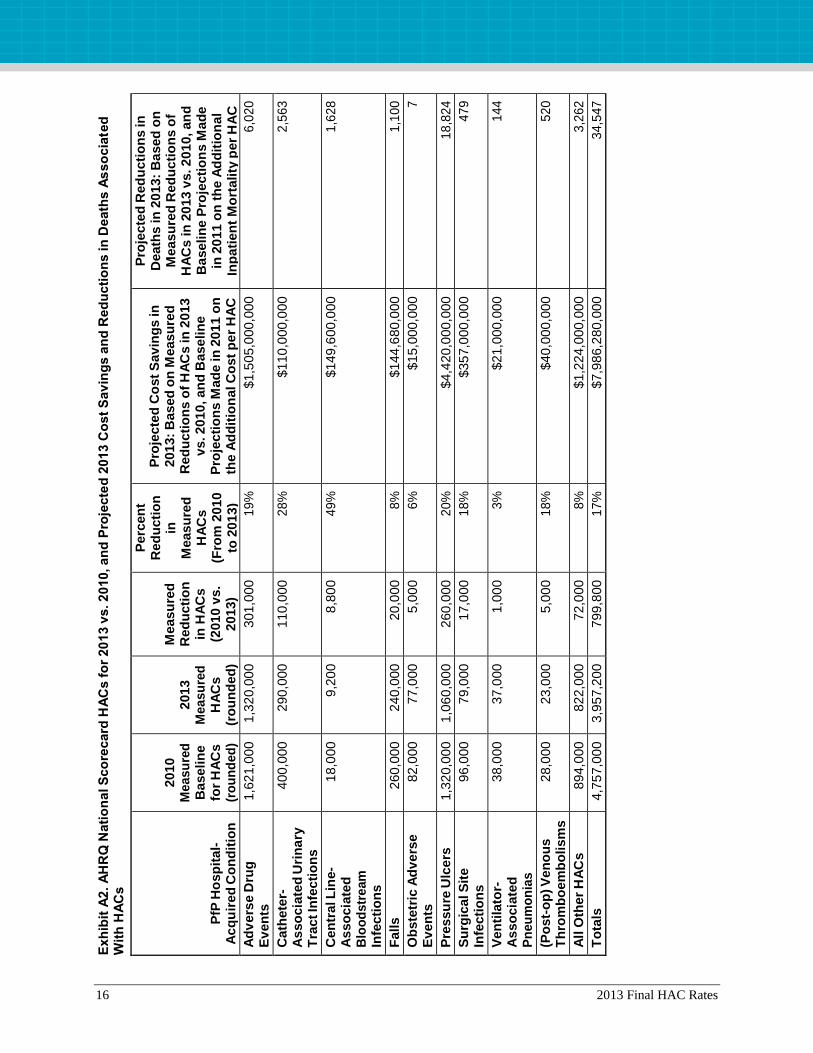
Exhibit A2 shows the summary results for 2010 and 2013 after measurement of HACs was
implemented and measured values replaced the baseline estimates shown in Exhibit A4 for 2010.
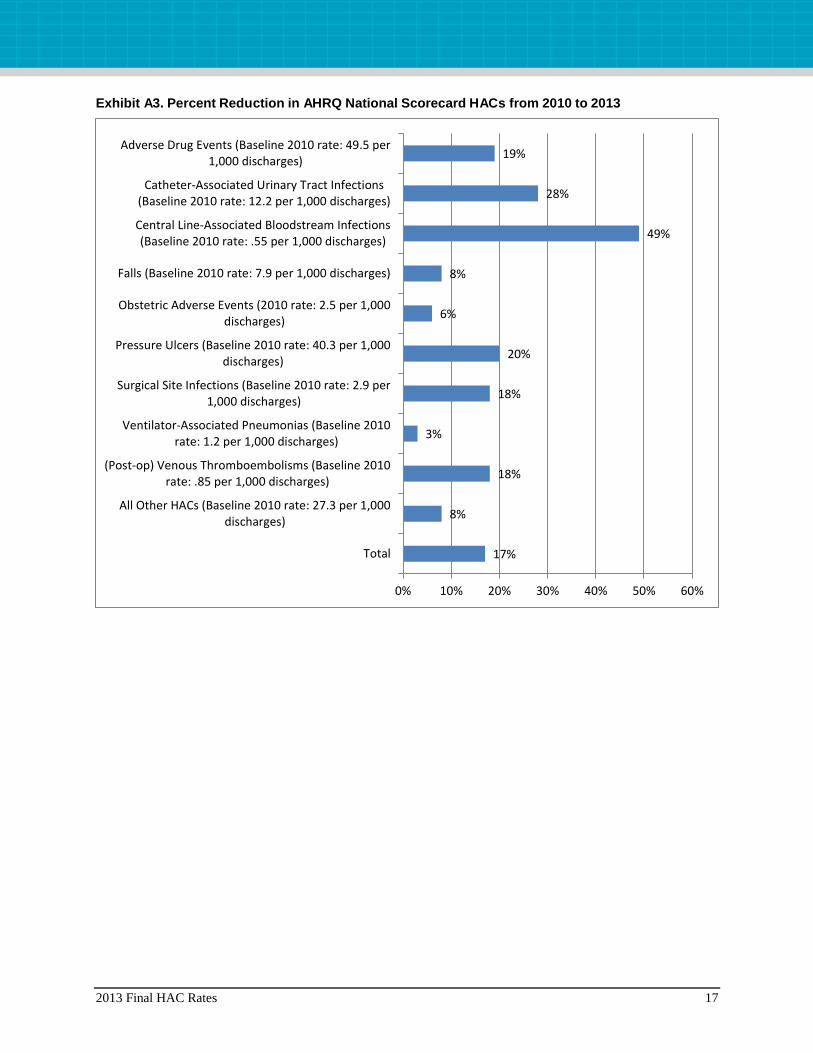
Exhibit A3 shows just the percent change in HACs from the 2010 baseline to the 2013 rate. The
cost savings and death reductions estimated for 2013 in Exhibit A2 are based on the measured
2010 and 2013 HACs and the estimated rates shown in Exhibit 1 and Exhibit A4 as to the
additional cost per HAC and the additional inpatient mortality per HAC. As noted in the main
body of this document, the overall measurement strategy for the PfP was published in the
Journal of Patient Safety in September 2014 (http://journals.lww.com/journalpatientsafety/
Abstract/2014/09000/An_Overview_of_Measurement_Activities_in_the.2.aspx), and specific
details as to how the HAC data and rates shown were acquired and calculated was posted starting
in May 2014 on the AHRQ Web site; methods and 2010-2012 data are available at
http://www.ahrq.gov/professionals/quality-patient-safety/pfp/index.html#methods.
16 2013 Final HAC Rates
Exh
ibit
A2
. A
HR
Q N
ati
on
al S
co
recard
HA
Cs f
or
20
13 v
s. 2
010, an
d P
roje
cte
d 2
013 C
ost
Sav
ing
s a
nd
Red
ucti
on
s in
Death
s A
sso
cia
ted
W
ith
HA
Cs
PfP
Ho
sp
ital-
A
cq
uir
ed
Co
nd
itio
n
2010
Me
asu
red
B
aseli
ne
fo
r H
AC
s
(ro
un
ded
)
2013
Me
asu
red
H
AC
s
(ro
un
ded
)
Measu
red
R
ed
ucti
on
in
HA
Cs
(2
010 v
s.
2013)
Perc
en
t R
ed
ucti
on
in
M
easu
red
H
AC
s
(Fro
m 2
010
to 2
01
3)
Pro
jecte
d C
ost
Sav
ing
s in
2013:
Based
on
Measu
red
R
ed
ucti
on
s o
f H
AC
s in
20
13
v
s. 2010
, an
d B
ase
lin
e
Pro
jecti
on
s M
ad
e in
201
1 o
n
the A
dd
itio
nal C
ost
pe
r H
AC
Pro
jecte
d R
ed
ucti
on
s in
D
eath
s in
20
13:
Ba
sed
on
M
ea
su
red
Red
ucti
on
s o
f H
AC
s in
20
13 v
s. 2
010, an
d
Ba
seli
ne
Pro
jecti
on
s M
ad
e
in 2
011 o
n t
he A
dd
itio
nal
Inp
ati
en
t M
ort
ality
per
HA
C
Ad
ve
rse D
rug
E
ven
ts
1,6
21,0
00
1,3
20,0
00
301,0
00
1
9%
$1,5
05,0
00,0
00
6
,02
0
Cath
ete
r-A
sso
cia
ted
Uri
na
ry
Tra
ct In
fecti
on
s
400,0
00
2
90,0
00
110,0
00
2
8%
$110
,000,0
00
2
,56
3
Cen
tral L
ine-
As
so
cia
ted
B
loo
dstr
eam
In
fecti
on
s
18,0
00
9,2
00
8,8
00
4
9%
$149
,600,0
00
1
,62
8
Fall
s
260,0
00
2
40,0
00
20,0
00
8
%
$144
,680,0
00
1
,10
0
Ob
ste
tric
Ad
ve
rse
E
ven
ts
82,0
00
77,0
00
5,0
00
6
%
$15,0
00,0
00
7
Pre
ssu
re U
lce
rs
1,3
20,0
00
1,0
60,0
00
260,0
00
2
0%
$4,4
20,0
00,0
00
1
8,8
24
Su
rgic
al S
ite
In
fecti
on
s
96,0
00
79,0
00
17,0
00
1
8%
$35
7,0
00
,00
0
47
9
Ven
tila
tor-
As
so
cia
ted
P
neu
mo
nia
s
38,0
00
37,0
00
1,0
00
3
%
$21,0
00,0
00
1
44
(Po
st-
op
) V
en
ou
s
Th
rom
bo
em
bo
lism
s
28,0
00
23,0
00
5,0
00
1
8%
$40,0
00,0
00
5
20
All
Oth
er
HA
Cs
894,0
00
8
22,0
00
72,0
00
8
%
$1,2
24,0
00,0
00
3
,26
2
To
tals
4,7
57,0
00
3,9
57,2
00
799,8
00
1
7%
$7,9
86,2
80,0
00
3
4,5
47
2013 Final HAC Rates 17
Exhibit A3. Percent Reduction in AHRQ National Scorecard HACs from 2010 to 2013
17%
8%
18%
3%
18%
20%
6%
8%
49%
28%
19%
0% 10% 20% 30% 40% 50% 60%
Total
All Other HACs (Baseline 2010 rate: 27.3 per 1,000discharges)
(Post-op) Venous Thromboembolisms (Baseline 2010rate: .85 per 1,000 discharges)
Ventilator-Associated Pneumonias (Baseline 2010rate: 1.2 per 1,000 discharges)
Surgical Site Infections (Baseline 2010 rate: 2.9 per1,000 discharges)
Pressure Ulcers (Baseline 2010 rate: 40.3 per 1,000discharges)
Obstetric Adverse Events (2010 rate: 2.5 per 1,000discharges)
Falls (Baseline 2010 rate: 7.9 per 1,000 discharges)
Central Line-Associated Bloodstream Infections(Baseline 2010 rate: .55 per 1,000 discharges)
Catheter-Associated Urinary Tract Infections(Baseline 2010 rate: 12.2 per 1,000 discharges)
Adverse Drug Events (Baseline 2010 rate: 49.5 per1,000 discharges)

18 2013 Final HAC Rates
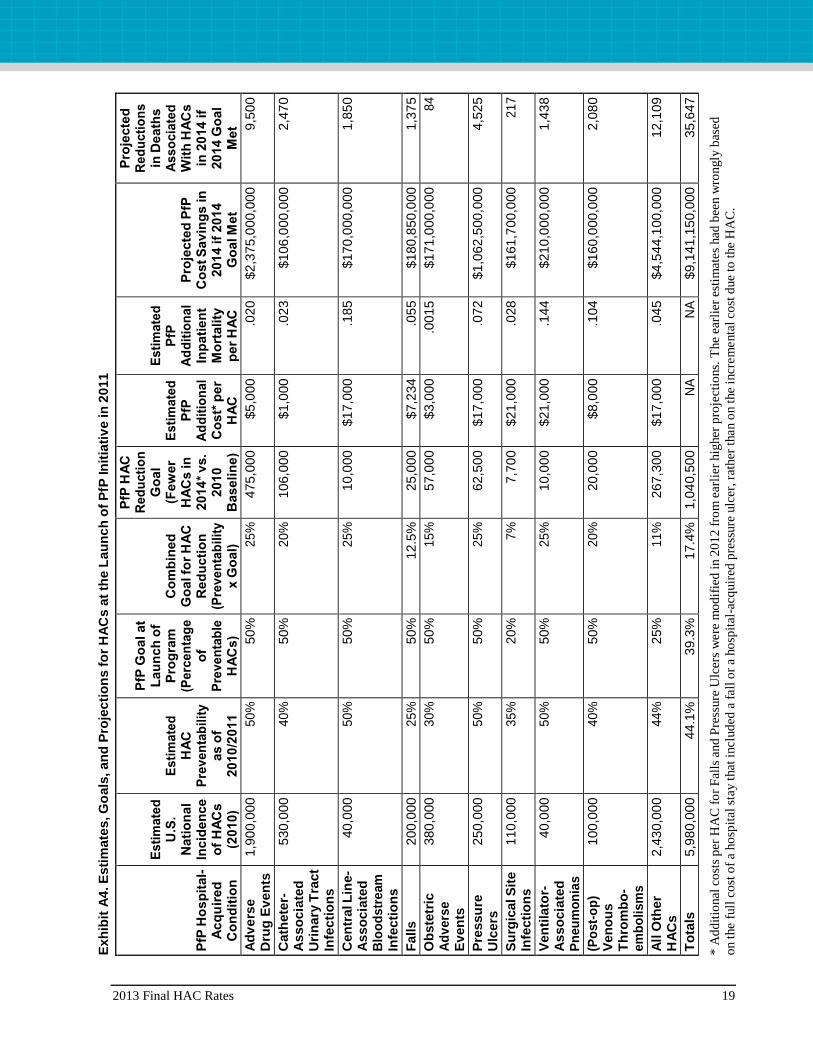
Exhibit A4 contains projections of the estimated impact of the initiative that would be launched
in April 2011 as the “Partnership for Patients.” Several projections were needed for each of the
types of hospital-acquired conditions (HACs) that were selected for special focus. For each
HAC, the incidence, preventability, cost, and additional mortality were assessed; and a goal was
set as to the percentage of preventable HACs to be prevented.17
These assessments and the
associated projections are provided below in Exhibit A4.
The basis of the derivation of the overall 44 percent preventability estimate (which corresponds
to the previously referenced 2010 OIG estimate) is shown in the table, as is the basis for the PfP
goal of a 40 percent reduction in preventable HACs. Also shown is the estimate that, if 44
percent were considered preventable, the overall PfP goal to prevent 40 percent of preventable
HACs would result in reducing the overall rate of HACs by approximately 17 percent.
The sources of the estimates in Exhibit A4 were identified based primarily on peer-reviewed
articles published through early 2011. Other sources included reports and other information from
HHS and other federally sponsored programs, and expert opinions.
Complete references to the documents accessed to make these assessments and projections,
organized by HAC type, are provided at the end of this document. In general, all references listed
were available in early 2011, except for several documents that were available only in a draft
form prior to the launch of the PfP in April 2011; in these cases the final document is listed.
17
In 2011, this work was completed using the best available information to generate 2010 incidences and other
information regarding the HACs. After these estimates were made, processes were established to measure and
estimate national HACs starting with a 2010 measured baseline (4,757,000 HACs). In order to produce consistent
estimates of cost savings and deaths averted for 2010 to 2013, the per-HAC estimates established for the costs and
deaths associated with HACs in 2011 have not been modified.
2013 Final HAC Rates 19
Exh
ibit
A4
. E
sti
mate
s, G
oals
, an
d P
roje
cti
on
s f
or
HA
Cs a
t th
e L
au
nch
of
PfP
In
itia
tiv
e in
20
11
PfP
Ho
sp
ital-
A
cq
uir
ed
C
on
dit
ion
Esti
mate
d
U.S
. N
ati
on
al
Incid
en
ce
o
f H
AC
s
(2010)
Esti
mate
d
HA
C
Pre
ven
tab
ilit
y
as o
f 2010
/2011
PfP
Go
al at
Lau
nch
of
Pro
gra
m
(Pe
rce
nta
ge
of
Pre
ven
tab
le
HA
Cs)
Co
mb
ined
G
oal fo
r H
AC
R
ed
ucti
on
(P
rev
en
tab
ilit
y
x G
oal)
PfP
HA
C
Red
ucti
on
G
oal
(Few
er
HA
Cs
in
2014
* v
s.
2010
B
aseli
ne)
Esti
mate
d
PfP
A
dd
itio
nal
Co
st*
pe
r H
AC
Esti
mate
d
PfP
A
dd
itio
nal
Inp
ati
en
t M
ort
ality
p
er
HA
C
Pro
jecte
d P
fP
Co
st S
av
ing
s in
201
4 if
2014
G
oal M
et
Pro
jecte
d
Red
ucti
on
s
in D
eath
s
Ass
oc
iate
d
Wit
h H
AC
s
in 2
014 if
2014 G
oal
Met
Ad
ve
rse
Dru
g E
ven
ts
1,9
00,0
00
5
0%
50%
2
5%
475,0
00
$5,0
00
.0
20
$2,3
75
,000,0
00
9,5
00
Cath
ete
r-A
sso
cia
ted
U
rin
ary
Tra
ct
Infe
cti
on
s
530,0
00
4
0%
50%
2
0%
106,0
00
$1,0
00
.0
23
$106
,000,0
00
2,4
70
Cen
tral L
ine-
As
so
cia
ted
B
loo
dstr
eam
In
fecti
on
s
40,0
00
5
0%
50%
2
5%
10,0
00
$17,0
00
.1
85
$170
,000,0
00
1,8
50
Fall
s
200,0
00
2
5%
50%
12.5
%
25,0
00
$7,2
34
.0
55
$180
,850,0
00
1,3
75
Ob
ste
tric
A
dv
ers
e
Ev
en
ts
380,0
00
3
0%
50%
1
5%
57,0
00
$3,0
00
.0
015
$171
,000,0
00
8
4
Pre
ssu
re
Ulc
ers
250,0
00
5
0%
50%
2
5%
62,5
00
$17,0
00
.0
72
$1,0
62
,500,0
00
4,5
25
Su
rgic
al S
ite
In
fecti
on
s
110,0
00
3
5%
20%
7
%
7,7
00
$21,0
00
.0
28
$161
,700,0
00
2
17
Ven
tila
tor-
A
sso
cia
ted
P
neu
mo
nia
s
40,0
00
5
0%
50%
2
5%
10,0
00
$21,0
00
.1
44
$210
,000,0
00
1,4
38
(Po
st-
op
) V
en
ou
s
Th
rom
bo
-em
bo
lism
s
100,0
00
4
0%
50%
2
0%
20,0
00
$8,0
00
.1
04
$160
,000,0
00
2,0
80
All
Oth
er
HA
Cs
2,4
30,0
00
4
4%
25%
1
1%
267,3
00
$17,0
00
.0
45
$4,5
44
,100,0
00
12,1
09
To
tals
5,9
80,0
00
44.1
%
39.3
%
17.4
%
1,0
40,5
00
N
A
NA
$9,1
41
,150,0
00
35,6
47
* A
dd
itio
nal
co
sts
per
HA
C f
or
Fal
ls a
nd
Pre
ssure
Ulc
ers
were
mo
dif
ied
in 2
01
2 f
rom
ear
lier
hig
her
pro
ject
ions.
The
earl
ier
esti
mat
es
had
bee
n w
ron
gly
bas
ed
on t
he
full
co
st o
f a
ho
spit
al s
tay t
hat
incl
ud
ed a
fall
or
a ho
spit
al-a
cquir
ed p
ress
ure
ulc
er, ra
ther
than o
n t
he
incr
em
enta
l co
st d
ue t
o t
he
HA
C.
20 2013 Final HAC Rates
References (organized by type of HAC or topic addressed)
Adverse Drug Events
Aspden P, Wolcott J, Bootman JL, et al. Preventing medication errors. Washington, DC: National Academies Press;
2006. http://www.iom.edu/Reports/2006/Preventing-Medication-Errors-Quality-Chasm-Series.aspx
Bates DW, Cullen DJ, Laird N, et al. Incidence of adverse drug events and potential adverse drug events.
Implications for prevention. ADE Prevention Study Group. JAMA 1995;274:29-34.
http://www.ncbi.nlm.nih.gov/pubmed/7791255
Bates DW, Leape LL, Cullen DJ, et al. Effect of computerized physician order entry and a team intervention on
prevention of serious medication errors. JAMA 1998, 280:1311-6. http://www.ncbi.nlm.nih.gov/pubmed/9794308
Cohen MM, Kimmel NL, Benage MK, et al. Medication safety program reduces adverse drug events in a community
hospital. Qual Saf Health Care 2005;14(3):169-74. http://www.ncbi.nlm.nih.gov/pubmed/15933311
Classen DC, Jaser L, Budnitz DS. Adverse drug events among hospitalized patients: epidemiology and national
estimates from a new approach. Jt Comm J Qual Patient Saf 2010,36(1): 12-20, online supplements AP1-AP9.
http://www.ncbi.nlm.nih.gov/pubmed/20112660
Classen, Jaser, reference: Classen DC, Pestotnik SL, Evans RS, et al. Adverse drug events in hospitalized patients.
Excess length of stay, extra costs, and attributable mortality. JAMA. 1997 Jan 22-29;277(4):301-6.
http://www.ncbi.nlm.nih.gov/pubmed/9002492
Corrigan JM, Donaldson MS, Kohn LT, et al. To err is human: building a safer healthcare system. Washington, DC:
National Academies Press; 1999. http://books.nap.edu/catalog.php?record_id=9728
Elixhauser A, Owens P. Adverse drug events in U.S. hospitals, 2004. HCUP Statistical Brief #29. Rockville, MD:
Agency for Healthcare Research and Quality; April 2007. http://www.hcup-us.ahrq.gov/reports/statbriefs/sb29.jsp
Hicks RW, Becker SC, Cousins DD, eds. MEDMARX data report. A report on the relationship of drug names and
medication errors in response to the Institute of Medicine’s call for action. Rockville, MD: Center for the
Advancement of Patient Safety, US Pharmacopeia; 2008.
Johnson CL, Carlson RA, Tucker CL, et al. Using BCMA software to improve patient safety in Veterans
Administration Medical Centers. J Healthc Inf Manag 2003;16:46-51.
http://www.ncbi.nlm.nih.gov/pubmed/11813523
Office of the Inspector General. Adverse events in hospitals: national incidence among Medicare beneficiaries. OEI-
06-09-00090. Washington, DC: U.S. Department of Health and Human Services; November 2010.
http://oig.hhs.gov/oei/reports/oei-06-09-00090.pdf
Pennsylvania Patient Safety Authority 2009 Annual Report. Harrisburg: Pennsylvania PSA; April 28, 2010.
http://patientsafetyauthority.org/PatientSafetyAuthority/Documents/Annual_Report_2009.pdf
Poon EG, Keohane CA, Yoon CS, et al. Effect of bar-code technology on the safety of medication administration. N
Engl J Med 2010;362;1698-1707. http://www.ncbi.nlm.nih.gov/pubmed/20445181
Catheter-Associated Urinary Tract Infections
Apisarnthanarak A, Thongphubeth K, Sirinvaravong S, et al. Effectiveness of multifaceted hospitalwide quality
improvement programs featuring an intervention to remove unnecessary urinary catheters at a tertiary care center in
Thailand. Infect Control Hosp Epidemiol 2007;28:791-8. http://www.ncbi.nlm.nih.gov/pubmed/17564980
2013 Final HAC Rates 21
Gould CV, Umscheid CA, Agarwal RK, et al. Guideline for prevention of catheter-associated urinary tract infections
2009. Infect Control Hosp Epidemiol 2010 Apr;31(4):319-26. http://www.jstor.org/stable/10.1086/651091
Klevens RM, Edwards JR, Richards CL, et al. Estimating health care-associated infections and deaths in U.S.
hospitals, 2002. Pub Hlth Rep 2007;122:160-6. http://www.ncbi.nlm.nih.gov/pubmed/17357358
Rosenthal VD, Guzman S, Safdar N. Effect of education and performance feedback on rates of catheter-associated
urinary tract infection in intensive care units in Argentina. Infect Control Hosp Epidemiol 2004;25:47-50.
http://www.ncbi.nlm.nih.gov/pubmed/14756219
Saint S, Kowalski CP, Forman J, et al. A multicenter qualitative study on preventing hospital-acquired urinary tract
infection in U.S. hospitals. Infect Control Hosp Epidemiol 2008;29:333-41.
http://www.ncbi.nlm.nih.gov/pubmed/18462146
Stephan F, Sax H, Wachsmuth M, et al. Reduction of urinary tract infection and antibiotic use after surgery: A
controlled, prospective, before-after intervention study. Clin Infect Dis 2006;42:1544-51.
http://www.ncbi.nlm.nih.gov/pubmed/16652311
U.S. Department of Health and Human Services. HHS Action Plan to Prevent Healthcare-Associated Infections.
2009. http://www.hhs.gov/ash/initiatives/hai/infection.html
Zhan C, Elixhauser A, Richards CL Jr, et al. Identification of hospital-acquired catheter-associated urinary tract
infections from Medicare claims: sensitivity and positive predictive value. Med Care 2009 Mar;47(3):364-9.
http://www.ncbi.nlm.nih.gov/pubmed/19194330
Central Line-Associated Bloodstream Infections
CDC Vital Signs—Central line associated blood stream infections—U.S. 2001, 2008, 2009. MMWR 2011 Mar
4;60(08):243-8 (e-release March 1, 2011).
http://www.cdc.gov/mmwr/preview/mmwrhtml/mm6008a4.htm?s_cid=mm6008a4_w
Klevens RM, Edwards JR, Richards CL, et al. Estimating health care-associated infections and deaths in U.S.
hospitals, 2002. Pub Hlth Rep 2007;122:160-6. http://www.ncbi.nlm.nih.gov/pubmed/17357358
Marschall J, Mermell LA, Classen D, et al. Strategies to prevent central line–associated bloodstream infections in
acute care hospitals. Infect Control Hosp Epidemiol 2008;29 Suppl 1:S22-30.
http://www.ncbi.nlm.nih.gov/pubmed/18840085
McCarthy D, Chase D. Advancing patient safety in the U.S. Department of Veterans Affairs. New York, NY:
Commonwealth Fund; 2011. Pub 1477. Vol. 9. http://www.commonwealthfund.org/publications/case-
studies/2011/mar/advancing-patient-safety
Muto C, Herbert C, Harrison E, et al. Reduction in central line-associated bloodstream infections among patients in
intensive care units—Pennsylvania, April 2001–March 2005. MMWR 2005;54(40):1013-6.
http://www.cdc.gov/mmwr/preview/mmwrhtml/mm5440a2.htm
O’Grady NP, Alexander M, Dellinger EP, et al. Guidelines for the prevention of intravascular catheter-related
infections. MMWR 2002 Aug 9;51(RR10):1-26. http://www.cdc.gov/mmwr/preview/mmwrhtml/rr5110a1.htm
Pronovost P, Needham D, Berenholtz S, et al. An intervention to decrease cathether-related bloodstream infections in
the ICU. N Engl J Med 2006;355(26):2725-32. http://www.ncbi.nlm.nih.gov/pubmed/17192537
Roselle GA. VA healthcare-associated infections activities/initiatives. Slide presentation to HHS HAI Steering
Committee, December 9, 2009 (unpublished), and VA “LinKS” data at:
http://www.hospitalcompare.va.gov/aspire/index.asp.

22 2013 Final HAC Rates
Scott RD. The direct medical costs of healthcare-associated infections in U.S. hospitals and the benefits of
prevention. Atlanta, GA: Centers for Disease Control and Prevention; March 2009.
http://stacks.cdc.gov/view/cdc/11550/
Timsit JF, Schwebel C, Bouadma L, et al. Chlorhexidine-impregnated sponges and less frequent dressing changes for
prevention of catheter-related infections in critically ill adults, a randomized controlled trial. JAMA
2009;301(12):1231-41. http://www.ncbi.nlm.nih.gov/pubmed/19318651
U.S. Department of Health and Human Services. National Action Plan to Prevent Healthcare-Associated Infections.
2009. http://www.hhs.gov/ash/initiatives/hai/infection.html
Injury From Falls
Barrett JA, Bradshaw M, Hutchinson K, et al. Reduction of falls-related injuries using a hospital inpatient falls
prevention program. J Am Geriatr Soc 2004;52:1969-70. http://onlinelibrary.wiley.com/doi/10.1111/j.1532-
5415.2004.52529_8.x/full
Centers for Medicare & Medicaid Services. Medicare program; proposed changes to the hospital inpatient
prospective payment systems and fiscal year 2009 rates; proposed changes to disclosure of physician ownership in
hospitals and physician self-referral rules; proposed collection of information regarding financial relationships
between hospitals and physicians. Fed Reg 2008 Apr 30;73(84):23528-23938. http://www.gpo.gov/fdsys/pkg/FR-
2008-04-30/html/08-1135.htm
Currie L. Fall and injury prevention (Chapter 10). In: Hughes RG, ed. Patient safety and quality: an evidence-based
handbook for nurses. Rockville, MD: Agency for Healthcare Research and Quality; 2008. AHRQ Publication No. 08-
0043. http://www.ahrq.gov/qual/nurseshdbk/
Dacenko-Grawe L, Holm K. Evidence-based practice: a falls prevention program that continues to work. Medsurg
Nurs 2008 Aug;17(4):223-7, 235.
Department of Veterans Affairs, National Center for Patient Safety. Unpublished data for 2006-2008. (Indicates more
than 40% of all reports of adverse events and close calls were of falls: approximately 170,000 of 390,000 reports.)
Dykes PC, Carroll DL, Hurley A, et al. Fall prevention in acute care hospitals: a randomized trial. JAMA
2010;304(17):1912-8. http://www.ncbi.nlm.nih.gov/pubmed/21045097
Hitcho EB, Krauss MJ, Birge S, et al. Characteristics and circumstances of falls in a hospital setting: a prospective
analysis. J Gen Intern Med 2004;19:732-9. http://www.ncbi.nlm.nih.gov/pubmed/15209586
Inouye SK, Bogardus ST Jr, Charpentier PA, et al. A multicomponent intervention to prevent delirium in hospitalized
older patients. N Engl J Med 1999;340:669-76. http://www.ncbi.nlm.nih.gov/pubmed/10053175
Inouye SK, Brown CJ, Tinetti ME. Medicare nonpayment, hospital falls, and unintended consequences. N Engl J
Med 2009;360(23):2390-3. http://www.nejm.org/doi/full/10.1056/NEJMp0900963 (Information on Hospital Elder
Life Program (HELP) referred to in this article can be found at www.hospitalelderlifeprogram.org.)
Kandilov A, Dalton K, Coomer N. Analysis report: estimating the incremental costs of hospital-acquired conditions
(HACS). (Prepared by RTI International under Contract No. 500-T00007.) Baltimore, MD: Centers for Medicare &
Medicaid Services; 2011.
Lancaster AD, Ayers A, Belbot B, et al. Preventing falls and eliminating injury at Ascension Health. Jt Comm J Qual
Patient Saf 2007 Jul;33(7):367-75. http://www.ncbi.nlm.nih.gov/pubmed/17711138
Mills PD, Neily J, Luan D, Using aggregate root cause analysis to reduce falls. Jt Comm J Qual Patient Saf
2005;31(1):21-31. http://www.ncbi.nlm.nih.gov/pubmed/15691207

2013 Final HAC Rates 23
Patient Safety Reporting Initiative Updates - February 2006. 2006 Issue 2. Trenton: New Jersey Department of
Health and Senior Services. http://www.state.nj.us/health/ps/documents/feb2006_newsletter.pdf
Stalhandske E, Mills P, Quigley P, et al. VHA’s national falls collaborative and prevention programs. In: Advances
in patient safety: new directions and alternative approaches. Vol. 2. Culture and Redesign. Rockville, MD: Agency
for Healthcare Research and Quality; 2008. AHRQ Publication No. 08-0034-2.
http://www.ncbi.nlm.nih.gov/books/NBK43724/
Obstetric Adverse Events
Abuhamad A, Grobman WA. Patient safety and medical liability: current status and an agenda for the future. Obstet
Gynecol 2010 Sep;116(3):570-7.
Agency for Healthcare Research and Quality, Healthcare Cost and Utilization Project. Nationwide Inpatient Sample.
http://www.hcup-us.ahrq.gov/nisoverview.jsp
Janakiraman V, Ecker J. Quality in obstetric care: measuring what matters. Obstet Gynecol 2010 Sep;116(3):728-32.
http://www.ncbi.nlm.nih.gov/pubmed/20733459
Mann S, Pratt S, Gluck P, et al. Assessing quality in obstetrical care: development of standardized measures. Jt
Comm J Qual Patient Saf 2006;32:497-505. http://www.ncbi.nlm.nih.gov/pubmed/17987873
Mazza F, Kitchens J, Akin M, et al. The road to zero preventable birth injuries. Jt Comm J Qual Patient Saf
2008;34:201-5. http://www.ncbi.nlm.nih.gov/pubmed/18468357
Mazza F, Kitchens J, Kerr S, et al. Eliminating birth trauma at Ascencion Health. Jt Comm J Qual Patient Saf
2007;33:15-24. http://www.ncbi.nlm.nih.gov/pubmed/17283938
Osborne M, Graham J, Cowley K, et al. Because one is too many: Catholic Health Initiatives’ success in reducing
preventable birth injuries. J Healthc Qual 2010;32(4):24-30. http://www.ncbi.nlm.nih.gov/pubmed/20618568
Pettker CM, Thung SF, Norwitz ER, et al. Impact of a comprehensive strategy on obstetric adverse events. Am J
Obstet Gynecol 2009;200(492):e1-8. http://www.ncbi.nlm.nih.gov/pubmed/19249729
Pratt SD, Mann S, Salisbury M, et al. John M. Eisenberg Patient Safety and Quality Awards. Impact of CRM-based
training on obstetric outcomes and clinicians’ patient safety attitudes. Jt Comm J Qual Patient Saf 2007
Dec;33(12):720-5.
Simpson KR, Kortz CC, Knox GE. A comprehensive perinatal patient safety program to reduce preventable adverse
outcomes and costs of liability claims. Jt Comm J Qual Patient Saf 2009 Nov;35(11):565-74.
http://www.ncbi.nlm.nih.gov/pubmed/19947333
The Joint Commission. Preventing maternal death. Sentinel Event Alert Issue 44; January 26, 2010.
http://www.jointcommission.org/assets/1/18/SEA_44.PDF
Toward improving the outcome of pregnancy III - enhancing perinatal health through quality, safety, and
performance initiatives. White Plains, NY: March of Dimes; December 2010. Financial support provided by
American Academy of Pediatrics, the American College of Obstetrics and Gynecology, and the Association of
Women’s Health Obstetric and Neonatal Nurses. www.marchofdimes.org/materials/toward-improving-the-outcome-
of-pregnancy-iii.pdf
Pressure Ulcers
Agency for Healthcare Research and Quality. Healthcare Cost and Utilization Project. Nationwide Inpatient Sample.
PSI 3. http://qualityindicators.ahrq.gov/Modules/PSI_TechSpec.aspx

24 2013 Final HAC Rates
Centers for Medicare & Medicaid Services. Medicare program: proposed changes to the hospital inpatient
prospective payment systems and fiscal year 2009 rates; proposed changes to disclosure of physician ownership in
hospitals and physician self-referral rules; proposed collection of information regarding financial relationships
between hospitals and physicians. Fed Reg 2008 Apr 30;73(84):23528–23938. http://www.gpo.gov/fdsys/pkg/FR-
2008-04-30/html/08-1135.htm
Gibbons W, Shanks HT, Kleinhelter P, et al. Eliminating facility-acquired pressure ulcers at Ascension Health . Jt
Comm J Qual Patient Saf 2006 Sep;32(9):488-96. http://www.ncbi.nlm.nih.gov/pubmed/17987872
Kandilov A, Dalton K, Coomer N. Analysis report: estimating the incremental costs of hospital-acquired conditions
(HACS). (Prepared by RTI International under Contract No. 500-T00007). Baltimore, MD: Centers for Medicare &
Medicaid Services; 2011.
Nalezny D, et al. Improvement report on reduction of nosocomial pressure ulcers, University of Minnesota Medical
Center, Fairview (Minneapolis, Minnesota). Cambridge, MA: Institute for Healthcare Improvement; 2006.
Preventing pressure ulcers in hospitals: a toolkit for improving quality of care. Rockville, MD: Agency for
Healthcare Research and Quality; April 2011. AHRQ Publication No. 11-0053-EF.
http://www.ahrq.gov/professionals/systems/long-term-care/resources/pressure-ulcers/pressureulcertoolkit/index.html
Zhan C, Miller MR. Excess length of stay, charges, and mortality attributable to medical injuries during
hospitalization. JAMA 2003 Oct 8;290(14):1868-74. http://www.ncbi.nlm.nih.gov/pubmed/14532315
Surgical Site Infections
Darouiche RO, Wall MJ, Itani KMF, et al. Chlorhexidine–alcohol versus povidone–iodine for surgical-site antisepsis.
N Engl J Med 2010; 362:18-26. http://www.ncbi.nlm.nih.gov/pubmed/20054046
Haynes AB, Weiser TG, Berry WR, et al. A surgical safety checklist to reduce morbidity and mortality in a global
population. N Engl J Med 2009 Jan 29;360(5):491-9. http://www.ncbi.nlm.nih.gov/pubmed/19144931
Klevens RM, Edwards JR, Richards CL, et al. Estimating health care-associated infections and deaths in U.S.
hospitals, 2002. Pub Hlth Rep 2007;122:160-6. http://www.ncbi.nlm.nih.gov/pubmed/17357358
Stulberg, J, Delaney, C, Neuhauser, et al, Adherence to Surgical Care Improvement Project measures and association
with postoperative infections, JAMA 2010 Jun 23/30;303:2479-85.
http://www.ncbi.nlm.nih.gov/pubmed?term=JAMA%202010%20Stulberg%2C%20J
U.S. Department of Health and Human Services. National Action Plan to Prevent Healthcare-Associated Infections.
2009. http://www.hhs.gov/ash/initiatives/hai/infection.html
Venous Thromboembolisms (post-surgery)
AHRQ Health Care Innovations Exchange. Algorithm enhances provision of preventive treatment to at-risk
inpatients, reducing incidence of venous thromboembolism. https://innovations.ahrq.gov/profiles/algorithm-
enhances-provision-preventive-treatment-risk-inpatients-reducing-incidence-venous
AHRQ. Healthcare Cost and Utilization Project. Nationwide Inpatient Sample. PSI 12.
http://qualityindicators.ahrq.gov/Modules/PSI_TechSpec.aspx
Geerts WH, Pineo GF, Heit JA, et al. Prevention of venous thromboembolism: the Seventh ACCP Conference on
Antithrombotic and Thrombolytic Therapy. Chest 2004;126(3 Suppl):338S-400S.
http://www.ncbi.nlm.nih.gov/pubmed/15383478. Also see the Surgeon General’s Call to Action to Prevent Deep
Vein Thrombosis and Pulmonary Embolism at: http://www.ncbi.nlm.nih.gov/books/NBK44178/.

2013 Final HAC Rates 25
Heit JA, O’Fallon WM, Petterson TM, et al. Relative impact of risk factors for deep vein thrombosis and pulmonary
embolism: a population-based study. Arch Intern Med 2002;162:1245-8.
http://www.ncbi.nlm.nih.gov/pubmed/12038942
Johanson NA, Lachiewicz PF, Lieberman JR, et al. Prevention of symptomatic pulmonary embolism in patients
undergoing total hip or knee arthroplasty. J Am Acad Orthop Surg 2009;17:183-96.
http://www.ncbi.nlm.nih.gov/pubmed/19264711
Kearon C, Kahn SR, Agnelli G, et al. Antithrombotic therapy for venous thromboembolic disease: American College
of Chest Physicians Evidence-Based Clinical Practice Guidelines (8th Edition). Chest 2008 Jun;133(6 Suppl):454S-
545S. (Erratum in Chest 2008 Oct; 134(4):892.) http://www.ncbi.nlm.nih.gov/pubmed/18574272
Kucher N, Koo S, Quiroz R, et al Electronic alerts to prevent venous thromboembolism among hospitalized patients.
N Engl J Med 2005 Mar 10;352(10):969-77. http://www.ncbi.nlm.nih.gov/pubmed/15758007
Maynard G, Stein J. Preventing hospital-acquired venous thromboembolism: a guide for effective quality
improvement. Prepared by the Society of Hospital Medicine. Rockville, MD: Agency for Healthcare Research and
Quality; August 2008. AHRQ Publication No. 08-0075. http://www.ahrq.gov/qual/vtguide/
Maynard GA, Morris TA, Jenkins IH, et al. Optimizing prevention of hospital-acquired venous thromboembolism
(VTE): prospective validation of a VTE risk assessment model. J Hosp Med 2010 Jan;5(1):10-18.
http://www.ncbi.nlm.nih.gov/pubmed/19753640
Spyropoulos AC, Lin J. Direct medical costs of venous thromboembolism and subsequent hospital readmission rates:
an administrative claims analysis from 30 managed care organizations. J Manag Care Pharm 2007 Jul-
Aug;13(6):475-86. http://www.ncbi.nlm.nih.gov/pubmed/17672809
Tapson VF, Hyers TM, Waldo AL, et al. Antithrombotic therapy practices in US hospitals in an era of practice
guidelines. Arch Intern Med 2005;165:1458-64. http://www.ncbi.nlm.nih.gov/pubmed/16009860
Ventilator-Associated Pneumonias
Berenholtz S, Pham, J, Thompson D, et al. Collaborative cohort study of an intervention to reduce ventilator-
associated pneumonia in the intensive care unit. J Infect Control Hosp Epidemiol 2011 Apr;32(4):305-14.
http://www.ncbi.nlm.nih.gov/pubmed/21460481
de Smet AM, Kluytmans JA, Cooper BS, et al. Decontamination of the digestive tract and oropharynx in ICU
patients. New Engl J Med 2009;360(1):20-31. http://www.ncbi.nlm.nih.gov/pubmed/19118302
Klevens RM, Edwards JR, Richards CL, et al. Estimating health care-associated infections and deaths in U.S.
hospitals, 2002. Public Health Rep 2007;122:160-6. http://www.ncbi.nlm.nih.gov/pubmed/17357358
McCarthy D, Chase D, Advancing patient safety in the U.S. Department of Veterans Affairs. New York, NY:
Commonwealth Fund; 2011. Pub 1477. Vol. 9. http://www.commonwealthfund.org/publications/case-
studies/2011/mar/advancing-patient-safety.
Roselle GA. VA healthcare-associated infections activities/initiatives. Slide presentation to HHS HAI Steering
Committee, December 9, 2009 (unpublished), and VA “LinKS” data at:
http://www.hospitalcompare.va.gov/aspire/index.asp.
U.S. Department of Health and Human Services. National Action Plan to Prevent Healthcare-Associated Infections.
2009. http://www.hhs.gov/ash/initiatives/hai/infection.html

26 2013 Final HAC Rates
All Other HACs
de Vries EN, Ramrattan MA, Smorenburg SM, et al. The incidence and nature of in-hospital adverse events: a
systematic review. Qual Saf Health Care 2008;17:216-23. http://www.ncbi.nlm.nih.gov/pubmed/18519629
Gawande A. The checklist manifesto: how to get things right. New York, NY: Metropolitan Books; 2010. p. 31.
http://gawande.com/the-checklist-manifesto
Hall M, Hamilton B, Richards K, et al. Does surgical quality improve in the American College of Surgeons national
Surgical Quality Improvement Program: an evaluation of participating hospitals. Ann Surg 2009 Sep;250(3):363-76.
http://www.ncbi.nlm.nih.gov/pubmed/19644350
Landrigan CP, Parry GJ, Bones CB, et al. Temporal trends in rates of patient harm resulting from medical care. N
Engl J Med 2010 Nov 25;363(22):2124-34. http://www.ncbi.nlm.nih.gov/pubmed/21105794
Neily J, Mills PD, Young-Xu Y, et al. Association between implementation of a medical team training program and
surgical mortality. JAMA 2010 Oct 20;304(15):1693-700. http://www.ncbi.nlm.nih.gov/pubmed/20959579
Office of the Inspector General. Adverse events in hospitals: methods for identifying events. Washington, DC: U.S.
Department of Health and Human Services; 2010. Publication No. OEI-06-08-00221.
http://oig.hhs.gov/oei/reports/oei-06-08-00221.pdf
Office of the Inspector General. Adverse events in hospitals: national incidence among Medicare beneficiaries.
Washington, DC: U.S. Department of Health and Human Services; 2010. Publication No. OEI-06-09-00090.
http://oig.hhs.gov/oei/reports/oei-06-09-00090.pdf
Total HACs
AHRQ and CMS. Medicare Patient Safety Monitoring System Annual Reports (Qualidigm): Unpublished data for
2005, 2006, and 2009.
de Vries EN, Ramrattan MA, Smorenburg SM, et al. The incidence and nature of in-hospital adverse events: a
systematic review. Qual Saf Health Care 2008;17:216-23. http://www.ncbi.nlm.nih.gov/pubmed/18519629
Hunt DR, Verzier N, Abenda S, et al. Fundamentals of Medicare safety surveillance: intent, relevance, and
transparency. In: Henriksen K, Battles JB, Marks ES, et al., eds. Advances in patient safety: from research to
implementation. Vol. 2: Concepts and Methodology. Rockville, MD: Agency for Healthcare Research and Quality;
2005. http://www.ncbi.nlm.nih.gov/books/NBK20489/
Office of the Inspector General. Adverse events in hospitals: methods for identifying events. Washington, DC: U.S.
Department of Health and Human Services; 2010. Publication No. OEI-06-08-00221.
http://oig.hhs.gov/oei/reports/oei-06-08-00221.pdf
Office of the Inspector General. Adverse events in hospitals: national incidence among Medicare beneficiaries.
Washington, DC: U.S. Department of Health and Human Services; 2010. Publication No. OEI-06-09-00090.
http://oig.hhs.gov/oei/reports/oei-06-09-00090.pdf