2012 State of Nonprofit Data Report
35
The State of Nonprofit Data NOVeMbeR 2012 An NTEN Report Prepared by www.nten.org | 1020 SW Taylor Street | Suite 800 | Portland, Oregon 97205 | p: 415.397.9000 |f: 415.814.4056
Transcript of 2012 State of Nonprofit Data Report

The State of Nonprofit Datanovember 2012
An NTEN Report Prepared by
www.nten.org | 1020 SW Taylor Street | Suite 800 | Portland, Oregon 97205 | p: 415.397.9000 | f: 415.814.4056

�
Table of ContentsExECuTivE SummARy ................................................................................. 2
iNTRODuCTiON ............................................................................................. 3
WhAT DATA ARE NONPROfiTS uSiNg? .................................................. 5
financial and internal Operations Data......................................... 5
marketing, Communications, and fundraising Data .................. 6
Programs and Outcomes Data......................................................... 8
External Data......................................................................................10
hOW DOES ThiS DiffER by TyPE Of ORgANizATiON? ..................... 11
WhAT ARE ThE iNTERNAl fACTORS?..................................................... 13
Data Collection.................................................................................. 14
Prioritization and Time .................................................................... 15
Expertise ..............................................................................................17
Technology......................................................................................... 18
money................................................................................................. 19
hOW DO fuNDERS fiT iN? ...................................................................... 20
funder Support ................................................................................ 20
funder Reporting Requirements .................................................. 20
The Challenges for foundations .................................................... 21
RECOmmENDATiONS................................................................................. 23
AbOuT iDEAlWARE.................................................................................... 26
AbOuT NTEN ................................................................................................ 27
APPENDix A: mEThODOlOgy................................................................. 28
APPENDix b: SuRvEy TExT ...................................................................... 29
NTEN: A COmmuNiTy TRANSfORmiNg TEChNOlOgy iNTO SOCiAl ChANgEThE STATE Of NONPROfiT DATA · NOvEmbER 2012

�
executive Summaryin April 2012 NTEN and idealwareconducted a survey of nonprofits abouttheir relationships with data, and whatwe found was a large dichotomy—either they were doing a lot with theirmetrics or not much at all.
Too often barriers keep nonprofits from collectingand integrating important data into their dailywork. The barriers are familiar to those who workin and with nonprofits: not enough staff or timeto collect or analyze this data; not knowing whatdata to collect or how to make use of it;competing demands or conflicting reportingrequirements; money or technology limitations.
most nonprofits are tracking financial andoperations data and using it to make decisionsabout budgeting or programs. less than two-thirds of nonprofits track outreach data used formarketing, communications and fundraisingprograms, and fewer still find that data to beuseful for decision-making. A similar percentagemeasure program metrics, and only about halftrack outcome data for their clients. The least-tracked data, according to our survey, wereexternal data related to a nonprofit’s mission.
Organizations with larger budgets, as well ashuman services and health nonprofits, were morelikely to be tracking and using data than othersurvey respondents.
There were, however, significant barriers for manyorganizations. The four most commonly citedwere as follows:
• issues related to collecting and working withdata (27 percent of responses).
• lack of expertise (24 percent of responses)
• issues of time and prioritization (22 percent ofresponses).
• Challenges with technology (23 percent).
in addition, external demands and stakeholders—including funders; local, state and federalgovernments; donors; clients; and communitygroups—also hinder an organization’s ability tomake strategic use of data they have collected.
how nonprofits are currently usingdata does not necessarily reflect howthey would like to use it.
99% of respondents track somesort of metrics
89% track financial data and findit useful for making decisions
50% are tracking data aboutoutcomes ofclients/constituents
41% are tracking external dataabout their issue area
39% use donor data to makebudgeting decisions
26% use donor data to makeprogram decisions
NTEN: A COmmuNiTy TRANSfORmiNg TEChNOlOgy iNTO SOCiAl ChANgEThE STATE Of NONPROfiT DATA · NOvEmbER 2012

�
IntroductionData offers nonprofits a means of measuring their progress toward their missions, but also a way ofimproving that progress. And when their missions are collectively effecting change in the world, theirprogress is important. Without data, it is impossible to measure financial and operational health, identifyproblems and measure organizational impact. What data metrics are nonprofits collecting and tracking,and how are they using that data to make decisions?
NTEN set out to measure the state of data among nonprofits and learn just how organizations are usingthese metrics to grow and succeed. in April 2012, we worked with idealware to conduct a survey ofnonprofits to learn more about what data metrics nonprofits are collecting and tracking and how that data isused to make decisions. in total, 398 people from nonprofits representing 17 states responded to the survey.This means our sample should be considered somewhat indicative of nonprofit trends, but not arepresentative sample of nonprofits nationwide.
At the conclusion of the survey, we conducted six one-hour-long telephone focus groups with individualsfrom nonprofits, consulting firms that work with nonprofits, and foundations—a total of 38 people. Thesediscussions focused on the core metrics that nonprofits should track, what they were successfully tracking,barriers to success, and the role of foundations in this area. for more information on our methodology,see Appendix A.
The information we gathered from the survey and focus groups paints a picture about the state of dataamong nonprofit organizations. This report provides a comprehensive review of these results, including:
• The types of data nonprofits are tracking, and whether they find this data to be useful for decisionmaking.
• how data collection and analysis differs by type of organization and budget.
• The internal forces and barriers that affect the collection and use of data in nonprofits.
• how external forces impact nonprofit data use.
• Recommendations to improve the ability of nonprofits to collect important data and use it to makestrategic decisions.
What we found was a large dichotomy in nonprofits’ use of data—either they were doing a lot with theirmetrics or not much at all. We also discovered that individuals have very different frames of reference whenit comes to understanding exactly what data is. many focus group participants came to the table withpre-existing narrow definitions of what we mean when we say “data.”
There’s a huge range of data and metrics that can all play a role in optimizing organizations and the workthey do. however, too often barriers keep nonprofits from collecting and integrating these metrics into theirdaily work. The barriers are familiar to those who work in and with nonprofits—not enough staff or time tocollect or analyze this data; not knowing what data to collect or how to make use of it; competing demandsor conflicting reporting requirements; money or technology limitations.
NTEN: A COmmuNiTy TRANSfORmiNg TEChNOlOgy iNTO SOCiAl ChANgEThE STATE Of NONPROfiT DATA · NOvEmbER 2012

�
We find it helpful to think of the process by which nonprofits use data as akin to a complicated machine:data is collected and fed into one end, massaged and affected by the internal and external factors that shapedecision-making at a nonprofit, and then pushed out the other end as data-driven decisions. This metaphor,of course, overly simplifies complex organizational dynamics—even in an ideal case, it’s not likely that staffcan automatically crank out decisions based on data. but it’s a useful mental model in understanding someof the factors at work. for instance, in our survey and focus groups, we found that when the process runswell, the internal and external forces provide context and expertise that make the decisions valuable andstrategic. however, we found too many cases where those forces were barriers that did not result in usefuloutput from the machine, or even actively prevented it. in a number of cases, the processes—the machineitself—were not strategically designed and thus no amount of data input could help to create betterdecisions.
The Data machine
A well-functioning nonprofit data decision-making process provides numerous possibilities for nonprofits tooptimize their programs and grow. Even small organizations can use data such as feedback, surveys and self-assessments to measure their impact and determine what is working well and what needs to be addressed.As a representative from an educational organization said in one of our focus group sessions, “The moreadept we have gotten at proving what our children do, it’s blown our hair back—we didn’t know we werethat good.”
NTEN: A COmmuNiTy TRANSfORmiNg TEChNOlOgy iNTO SOCiAl ChANgEThE STATE Of NONPROfiT DATA · NOvEmbER 2012
InternalFactors
ExternalFactors
InputsInputs
xternal FunderRequirements
Expertise Money Technology
FunderSupport
Financial andOperations Data
Prioritizationof Time
Marketing,Communicationsand Fundraising
Data
Programs andOutcomes
Data
ExternalData
Data-Driven
DecisionMaking

�
What Data Are nonprofits Using?• Nearly all nonprofits track some sort of metrics.
• A much lower percentage use the data they collect to make strategy orprogram decisions.
• The vast majority of nonprofits track finance and operations data while onlyabout two-thirds track marketing, communications and program data.
in our survey we found that all but three of the 398 participating nonprofits said they are tracking some sortof data. These metrics run the gamut from financial and operations data to marketing, communications andfundraising performance, program effectiveness, and client outcomes. Some nonprofits even acquire andtrack external data about their clients or issue areas.
by far, the most commonly tracked data is related to finance and operations. for the most part nonprofitsare using metrics in this area to help with decision-making about budgets and programs. many also trackcommunications and fundraising data—primarily the size of their mailing lists and the number of newdonors—but far fewer use these metrics to make budget or program decisions. Programmatic metrics fallsomewhere in between. more nonprofits than not are tracking this kind of data, and most of those trackingit are also using it for decision-making.
This section looks more deeply at the types of data tracked bynonprofits, and how those organizations are using thosemetrics.
Financial and Internal operations Data
it should come as no surprise that the majority of thenonprofits who responded to our survey—89 percent—notonly track financial actuals, but find them to be usefulmetrics. The vast majority of respondents also said they deemthis information “critical” or “very useful” for budgeting,while nearly three-quarters said such information was“critical” or “very useful” for program and services decisions.
Data tracked by respondents includes such typical financialmetrics as expenses, income and cash-on-hand, as well asoperations metrics such as volunteer hours and staff training.
Consultants in our focus group were quick to point out thedifferent things financial and operations data can showorganizations. for example, it can help them take actions thatminimize overhead or show the effectiveness of managementor the composition and health of an organization’s board ofdirectors. it can also help management make staffingdecisions by measuring turnover, technical expertise of staff,as well as staff, volunteer and partner resources. in addition,this data can serve as a crisis indicator by tracking days of
NTEN: A COmmuNiTy TRANSfORmiNg TEChNOlOgy iNTO SOCiAl ChANgEThE STATE Of NONPROfiT DATA · NOvEmbER 2012
100%
90%
80%
70%
60%
50%
40%
30%
20%
10%
0%Your financial actuals vs
budget
�8�
68�6�76
This isn’t useful for our organization
We don’t know how to track this
We don’t have the technology toeffectively track this
We don’t have the time/money toeffectively track this
We are tracking this, but not rigorously
We rigorously track this
6

6
cash on hand, accounts receivable, cash flow and participants per program, and can help an organizationmake quick decisions about whether to borrow money.
for example, one focus group participant from a youth services nonprofit noted that his organization usesequipment utilization and member retention data to help measure operational efficiency. An executivedirector at a domestic violence prevention organization reported that her nonprofit monitors volunteerhours to understand how many hours they can expect at different times of the year.
“i rely heavily on the data so i can produce reports that show the value of each office,” said anotherexecutive director, helping her organization make decisions as to the viability of an office when a lease is up,for example, as well as to judge whether or not to invest more resources into a service or community.
The 11 percent of nonprofits surveyed that don’t track these metrics primarily feel that they’re not able to doso—44 percent of those respondents report that they do not have the technology to do so, while 41 percentreport they lack the time and/or money.
marketing, Communications and Fundraising DataWhile many nonprofits are tracking various type of marketing, communications and fundraising data—whatwe refer to as “outreach” data—our survey indicated a surprisingly low number are actually using that datato make decisions.
Among this outreach data, metrics related to fundraising performance—such as the number of new peopleadded to an organization’s mailing list or the number of new donors—are tracked by more than two-thirds ofrespondents, but far fewer use these numbers to inform budgeting or program decisions. Only 39 percent ofrespondents use the number of new donors to make budget decisions and 26 percent use this data to makeprogram decisions, and fewer than one quarter of the respondents use the number of people on the mailinglist to make budget or program decisions. Only about half of the organizations surveyed are tracking othermarketing and communications metrics, such as the number of website visitors, facebook comments andemail opens, and fewer than 20 percent use those types of data for budget or program decision-making.
NTEN: A COmmuNiTy TRANSfORmiNg TEChNOlOgy iNTO SOCiAl ChANgEThE STATE Of NONPROfiT DATA · NOvEmbER 2012
80%
70%
60%
50%
40%
30%
20%
10%
0%number of people on
your mailing list
7�%
��%�7%
number of newdonors in the past
year
69%
�9%�6%
number of visitors toyour website
�6%
�7%��%
number of commentsyou receive on
7% 8%
number of peoplewho open emails that
you send out
��%9%
Tracking this metric
Finding it Useful for Spending orbudgeting Decisions
Finding it Useful for ProgrammingDecisions
n= �96
�8%��%

7
if organizations that are tracking outreach metrics are not finding it useful for budgeting or programpurposes, what are they using it for? Participants in our focus groups mentioned the usefulness of thesekinds of metrics in tracking the success of marketing and fundraising campaigns, but if this kind of trackingnever filters up to impact budget decisions, does that reduce their value? Or are nonprofits tracking thesenumbers because, as we heard in our focus groups, they feel they are “supposed” to? As one participant, aconsultant, noted, there may be an “over-interest” in easily trackable communications benchmarks, but notas much knowledge as to how to actually use these metrics to make decisions.
fundraisers and marketers have the most specific use for this data. They use data to measure whichconstituents respond to particular channels of communication and then adjust their tactics to maximizeresponse; some track the costs of acquisition mailings against revenue raised from those mailings todetermine whether a campaign is cost-effective.
One nonprofit fundraiser gave the example that her organization had a very good response to its mailednewsletter one year, and is using that data to decide whether to do more newsletters or to redesign adifferent document to try to achieve a similar result.
yet one foundation officer we spoke with noted that most of the nonprofits she deals with don’t havesystems in place to understand the key metrics that could help them understand the effectiveness of theirfundraising strategy, such as donor retention, average gift and cost per donor.
Not every nonprofit has the basic infrastructure in place to even track the seemingly easily collectable datapoints, however. Among the one-third of nonprofits not tracking these metrics, many reported that they didnot have the technology to track these relatively straightforward numbers. for example, nearly a third citednot having the technology or knowledge to track email opens as their reason for not measuring thisparticular metric.
NTEN: A COmmuNiTy TRANSfORmiNg TEChNOlOgy iNTO SOCiAl ChANgEThE STATE Of NONPROfiT DATA · NOvEmbER 2012
60%
50%
40%
30%
20%
10%
0%
�%
The number of peopleon your mailing list
��%
��%
�%
The number ofnew donors in the
past year
��%
��%
�7%
The number ofvisitors to your
website
�6%
�9%
��%
The number ofcomments you receive
on Facebook
��%
�7%
The number of peoplewho open emails that
you send out
�0%
�7%
We don’t know how to track this
We don’t have the technology toeffectively track this
We don’t have the time/money toeffectively track this
��%

8
Tracking Programs and outcomesTracking program and outcome-related data should be the bread-and-butter for nonprofits because it’s oneof the best ways to articulate what they are delivering and the extent to which they are delivering on theirmission. however, fewer than two-thirds of survey respondents said they were measuring information aboutprograms in which their clients or constituents take part, and just half reported tracking information aboutclient or constituent outcomes.
The ones who are tracking this information find it useful for making decisions about programs, and most ofthem find it useful for budgeting purposes as well.
As the focus groups showed, the range of programmatic data that nonprofits track runs the gamut ofcomplexity. many were tracking simple counts—number of cases per social worker, attendance data, clientdemographics and geography—while others were tracking metrics to analyze the financial success of theirprograms, such as reimbursement rates on unit of services, profitability by product or service line, cost perunit of service, program expense compared to total expense, and how much time people spend servingprograms.
When it comes to tracking the actual impact of their programs, we heard many possibilities for looking atthe direct effect of programs—for instance, client satisfaction surveys, number of repeat clients, clientrecidivism, and the percent of issues resolved for clients, all of which can help to inform nonprofits’operations. many of the organizations in our focus groups wanted to move beyond this level to look at theiractual impact in the community, but were struggling to do so.
While many nonprofits look at metrics that would actually measure the long term outcomes of their workas the “holy grail” of data-based decision-making, it’s unclear that this level of measurement is practical oreven possible for many nonprofits. many orgs need to either rely on metrics which are indirect measures oflong term impact—like the number of repeat clients, client satisfaction, or percent of client issues resolved—or invest in expensive, long-term longitudinal research. for instance, one of the nonprofits in our focusgroup was interested in measuring to what degree they were improving high school students’ success inschool by engaging them in creative writing. To directly measure a high-level impact like this, however, onewould need years of high quality data summarizing success in school (grades and attendance, for example)and, ideally, a control group with very similar demographics and attributes. This kind of data would bedifficult to get from schools, and the research design, data tracking and analysis would be time-consumingand expensive.
NTEN: A COmmuNiTy TRANSfORmiNg TEChNOlOgy iNTO SOCiAl ChANgEThE STATE Of NONPROfiT DATA · NOvEmbER 2012
90%
80%
70%
60%
50%
40%
30%
20%
10%
0%Your financial actuals vs budget
89%8�%
7�%
Information about what programsspecific clients/constituents take part in
�9%
�9%
�9%
Information about outcomesof clients/constituents
�0%
��%
�9%
Tracking
Finding it Useful for Spending orbudgeting Decisions
Finding it Useful for ProgrammingDecisions

9
it is likely that much of this data collection is driven by funder orgovernment requirements—at least initially. As one fundraiser whoparticipated in our focus groups pointed out, “grants and contractswere requiring some of that data and that was our initial impetus, butnow we have theories that if we do this service in a certain way it willhave x effect. We want to make sure that’s the case.”
however, data collection does notnecessarily translate into strategicdecision-making. Another organization inour focus group noted that they collect acertain amount of data related to goalsand objectives in their strategic plan, anddifferent data every month in aggregateto send to the state Department ofEducation. They would like to determinemore strategically which pieces of dataare needed to make certain decisions—not only to identify the problems, but tomake sure they have the right things inplace to solve them.
Not surprisingly, organizations thatprioritize measuring program success aremore likely to be collecting this data.more than three-quarters of those that
had a defined plan in place for measuring the success of programswere collecting data about programs and outcomes compared to onlyhalf of those without a defined plan.
how nonprofits are currently using data does not necessarily reflecthow they would like to use it. individuals who participated in our focusgroups indicated that they want to move beyond collecting data andstart using those metrics to make strategic decisions. They want to getaway from, as one consultant put it, the “anecdote as evidence” model.
“We have tons of anecdotal information about how we change lives,”explained a focus group participant. “Now we’re asking how wemeasure our effectiveness.” She and her board are looking for thetypes of data they need to measure in order to demonstrate how theyare making change in their community and having an impact on thepeople they serve.
for some nonprofits, this is a natural evolution. They go from reportingwhat is required of them (whether by the government or funders) toidentifying and tracking metrics that support strategic planning todetermining from the outset what data will support potential newprograms.
NTEN: A COmmuNiTy TRANSfORmiNg TEChNOlOgy iNTO SOCiAl ChANgEThE STATE Of NONPROfiT DATA · NOvEmbER 2012
Case Study:All In on Data:Committed to theCauseA large metropolitanorganization is so dedicated todata that it has created a full-time performance improvementanalysis team. The team’s goalis twofold: to measureoperational efficiency—whatwe’re calling organizational andprogram health—and tomeasure outcomes, whichinvolves larger questions thatseem harder to quantify. Forexample: How are theorganization’s afterschoolprograms helping kids bestronger leaders? How manypeople in the metro area havemet their fitness goals andlowered significant risk factorsthanks to the health centers?How is this organization makingits city a better place to live?
one of the analysts notes thatclient retention is a criticalmetric, and that he measuresthis faithfully to see howcommitted his organization’smembers are from year to year.He looks specifically for toolsand measures that are bothsensitive to change and reliableand valid indicators of thosechanges. He’s gotorganizational buy-in from theCeo, who’s a convert to thepower of data, but he’s also hadgreat success getting everyonein the organization on boardwith more serious datacollection by pointing out thatthis isn’t about numbers—it’sabout people. He’s convincedhis colleagues that this dataanalysis will help individuals.
Not surprisingly,organizations thatprioritize measuringprogram success aremore likely to becollecting this data.More than 75% ofthose with a de�nedplan for measuring thesuccess of programswere collecting dataabout programs andoutcomes compared toonly half of thosewithout a plan.

�0
external DataAmong the types of data we asked about in the survey, externaldata was the least-tracked, with only 41 percent of respondents.Among those who do track external data, nearly 60 percent saidthey find it useful for budgeting and program decisions. Overall,roughly one-third of survey respondents found this data to beuseful.
Certain types of organizations were more likely to track externaldata, particularly employment, environmental and housingnonprofits.
most examples of external data we heard in our focus group wereused in tracking program outcomes. for instance, a staffer at oneTexas-based nonprofit noted that her organization imported statedata about her clients into its own database to help measure howeffectively it was keeping clients out of nursing homes, and to triageeligible individuals to see who was in greatest need of services.
Perhaps one reason more nonprofits don’t use external data isthat it can be more difficult to get than some of the other datadiscussed in this report. “There’s not always within the organizationa desire to evaluate the capabilities of evaluation,” one consultanttold us, “but the biggest piece can be getting the data that’soutside of the organization to determine your effectiveness interms of outcomes and outputs…to know if the services you’reproviding are actually fixing what you’re trying to fix.”
for example, focus group participants noted that privacy and legalissues make it difficult to connect their data with data from otherorganizations. for instance, although it may be desirable to trackwhether your afterschool program has had an impact on schoolattendance, it can be difficult to get that data from a schoolsystem. Some nonprofits have worked out arrangements wherethey can receive data about their participants in aggregate—oneof the organizations in our focus group had worked out apartnership with a local university that already had data-sharingagreements in place to help skirt some of the privacy and legalissues nonprofits face in trying to get personal data. however, itmay not be immediately obvious with whom an organization canpartner in order to get this data.
NTEN: A COmmuNiTy TRANSfORmiNg TEChNOlOgy iNTO SOCiAl ChANgEThE STATE Of NONPROfiT DATA · NOvEmbER 2012
Case Study:Using Data to Swaythe GovernorA director of a public policywatchdog group wishes he had abetter way of assessing the impactof his organization on people’slives. The nonprofit has won somehigh-profile policy victories and isable to get helpful external datafrom state agencies surroundingthe issues with which it isconcerned. The group is doing itsbest to put a more personal faceon its work—for example, howmany new citizens were helpedthrough a recent immigrationreform law.
His organization has alsopartnered with several others tomeasure health coverage for kidsin its state. It provides individuallegal representation and was ableto measure outcomes of how manypeople benefited from some sortof coverage and how many medicalbills have been forgiven. Theylearned that many were notenrolled either in CHIP (Children’sHealth Insurance Program) ormedicaid, which helped spur publicsupport for increased benefits.Ultimately the governor of thestate agreed to enroll morechildren in the programs.
What’s next? The director isexperimenting withSalesforce.com’s nonprofit StarterPack—which offers up to �0 freelicenses for nonprofits—as hisorganization’s Crm tool. Hisorganization has grown quickly,and he’s concerned with makingsure that all his donors feelappreciated and loyal. He hopesusing technology to harness hisfundraising data can help himmeet this goal.

��
How Does this Differ by Type of organization?• Organizations with the largest budgets are more likely to be tracking and
using data for strategic purposes.
• human services and health organization are more likely to have a plan formeasuring success.
The organizations that responded to our survey represented a diverse range of issues and sizes. Theyspanned more than 15 issue areas, with budgets that ranged from zero to over $10 million. The greatestnumber of responses were from human services and education organizations.
While there was not a direct correlation between the size of an organization and the degree to which theyused data to make decisions, in general, larger organizations were more likely to be tracking metrics toevaluate progress toward a defined strategic plan, to have a defined plan for how they use data to determinethe success of programs, and have a defined plan for how they use data to measure their organization’shealth.
NTEN: A COmmuNiTy TRANSfORmiNg TEChNOlOgy iNTO SOCiAl ChANgEThE STATE Of NONPROfiT DATA · NOvEmbER 2012
60%
50%
40%
30%
20%
10%
0%none - allvolunteer
�%
below$�00,000
�0%
$�00,000-$��0,000
��%
$��0,000-$�00,000
��%
$�00,00-$� million
��%
$�-�million
��%
$�-�million
�9%
$�-�0million
��%
more than$�0 million
��%
We track specific metrics to evaluate our process towardsa defined strategic plan (% who agree)

��
Among the different issue areas, human services and health organizations were more likely to have definedplans for how data would be used to measure the success of their programs. Some of this is partly driven bystate government reporting or data-collection requirements, but could also be related to the fact that thedelivery of these programs and services is more measurement-oriented than the work of an arts and cultureorganization, for example.
NTEN: A COmmuNiTy TRANSfORmiNg TEChNOlOgy iNTO SOCiAl ChANgEThE STATE Of NONPROfiT DATA · NOvEmbER 2012
50%
40%
30%
20%
10%
0%Human Services
��%
Health
�6%
Arts/Culture
�9%
education
�9%
(everything else)
��%
We have a defined plan for how data will be used todefine the success of our programs
60%
50%
40%
30%
20%
10%
0%Human Services
�0%
Health
�8%
Arts/Culture
�6%
education
��%
(everything else)
��%
our decision-making processes are generallyinformed by data
��
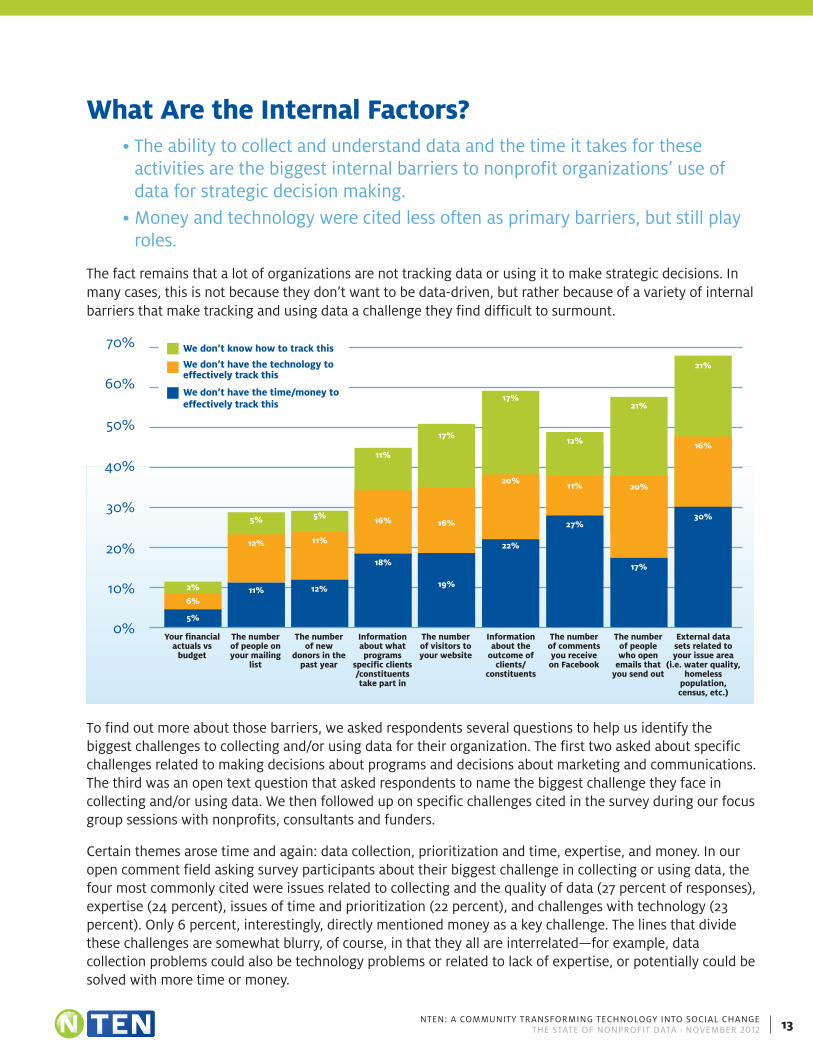
What Are the Internal Factors?• The ability to collect and understand data and the time it takes for these
activities are the biggest internal barriers to nonprofit organizations’ use ofdata for strategic decision making.
• money and technology were cited less often as primary barriers, but still playroles.
The fact remains that a lot of organizations are not tracking data or using it to make strategic decisions. inmany cases, this is not because they don’t want to be data-driven, but rather because of a variety of internalbarriers that make tracking and using data a challenge they find difficult to surmount.
To find out more about those barriers, we asked respondents several questions to help us identify thebiggest challenges to collecting and/or using data for their organization. The first two asked about specificchallenges related to making decisions about programs and decisions about marketing and communications.The third was an open text question that asked respondents to name the biggest challenge they face incollecting and/or using data. We then followed up on specific challenges cited in the survey during our focusgroup sessions with nonprofits, consultants and funders.
Certain themes arose time and again: data collection, prioritization and time, expertise, and money. in ouropen comment field asking survey participants about their biggest challenge in collecting or using data, thefour most commonly cited were issues related to collecting and the quality of data (27 percent of responses),expertise (24 percent), issues of time and prioritization (22 percent), and challenges with technology (23percent). Only 6 percent, interestingly, directly mentioned money as a key challenge. The lines that dividethese challenges are somewhat blurry, of course, in that they all are interrelated—for example, datacollection problems could also be technology problems or related to lack of expertise, or potentially could besolved with more time or money.
NTEN: A COmmuNiTy TRANSfORmiNg TEChNOlOgy iNTO SOCiAl ChANgEThE STATE Of NONPROfiT DATA · NOvEmbER 2012
70%
60%
50%
40%
30%
20%
10%
0%
�%
Your financialactuals vs
budget
6%
�%
The numberof people onyour mailing
list
��%
�%
The numberof new
donors in thepast year
��%
��%
��%
Informationabout whatprograms
specific clients/constituentstake part in
�6%
�8%
The numberof visitors toyour website
�6%
�9%
We don’t know how to track this
We don’t have the technology toeffectively track this
We don’t have the time/money toeffectively track this
�7%
Informationabout the
outcome ofclients/
constituents
�0%
��%
�7%
The numberof commentsyou receiveon Facebook
�7%
The numberof peoplewho open
emails thatyou send out
�0%
�7%
��%
external datasets related toyour issue area
(i.e. water quality,homeless
population,census, etc.)
�0%
��%
��%
�%
�6%��%
��%

��
The following section explores these challenges in greater detail.
Data CollectionThe ability to collect and work with data is a barrier reported by many nonprofits. in the course of thesurvey, we asked specific questions about organizations’ abilities to collect data on programs and onmarketing and communications. While slightly more than half of survey respondents felt confident in theirability to collect program data, nearly two-thirds of people surveyed find it difficult to collect data aboutmarketing and communications.
Among those individuals who found it difficult to collect the raw data about communications from theirsystems, nearly 40 percent reported that either they didn’t have the technology to track or did not knowhow to track the number of people who open their emails, and about one-third did not have the technologyor did not know how to track the number of visitors to their websites.
NTEN: A COmmuNiTy TRANSfORmiNg TEChNOlOgy iNTO SOCiAl ChANgEThE STATE Of NONPROfiT DATA · NOvEmbER 2012
30%
25%
20%
15%
10%
5 %
0%Data
Collection/Quality
�7%
expertise
��%
Technology
��%
Prioritization andTime
��%
money
6%
400
350
300
250
200
150
100
50
0Collecting the raw data about thecommunications from your staff
Tracking the data in systems orspreadsheets
Translating the data to metricsyou can use to make decisions
We often find this extremely difficult
We often struggle with this
This takes effort but we’ve got it mostly down
This is generally easy for us in most areas
When it comes to making decisions about marketing andcommunications, how challenging are the following tasks?

��
likewise, among those individuals who found it difficult to collectraw data about programs, one third cited that they lack thetechnology or knowledge to track information on either programparticipation or client outcomes.
Organizational budget size plays a large factor in this inability tocollect data. more than two-thirds of the organizations withdifficulties collecting either program or communications data hadbudgets under $1 million, and more than half had budgets under$500,000.
for some, the problem is that they just don’t have the necessarytools. One-third of respondents who reported “technology” as aprimary difficulty mentioned that they did not currently have adatabase or other suitable software for recording, tracking andreporting on data. Additionally, 11 percent of respondentsmentioned that their existing database was old or out-of-date.
Prioritization and TimeA number of the difficulties organizations experienced incollecting and interpreting data may be related to the ability ofstaff to prioritize and make time for measurement. While only 3percent of survey respondents mentioned “priorities” as thebiggest data challenge they faced, 21 percent reported that makingtime for data-based activities was their biggest challenge. focusgroup participants, particularly the consultants and foundations,felt that both of these issues came down to a matter ofprioritization. They gave us the sense that their organizations
NTEN: A COmmuNiTy TRANSfORmiNg TEChNOlOgy iNTO SOCiAl ChANgEThE STATE Of NONPROfiT DATA · NOvEmbER 2012
Case Study:Improvingmeasurement Fromthe Top Down“We may possibly be asking for alot of information that we don’tlook at or use,” admitted onefoundation grants manager,confirming the suspicions of quitea few nonprofit staffers who areoverwhelmed by the reportingrequirements of their nonprofits.She noted that she really wants tosee data about a program or set ofactivities that is valid, meaningfuland reliable, not qualitativenarratives that indicate in ageneral way that a grantsucceeded.
She acknowledges, though, thatfoundations contribute to theproblem by providing fuzzyreporting instructions.
“The data that we get is asymptom of the form that wedesigned,” she said.
400
350
300
250
200
150
100
50
0Collecting the raw data about the
programs from your staffTracking the data using databases
or systemsTranslating the data to metricsyou can use to make decisions
We often find this extremely difficult
We often struggle with this
This takes effort but we’ve got it mostly down
This is generally easy for us in most areas
When it comes to making decisions about programs,how challenging are the following tasks?

�6
perceived the time it took to collect and analyze metrics fell underthe category of overhead, which took away from time spentdelivering programs and services.
“Ninety percent of grantees are so understaffed and overextendedin their efforts to simply do the program,” noted a foundationexecutive director in a focus group. “They talk about evaluativethinking, but every drop of ‘blood, sweat, and dollars’ goes tothe doing, instead of what they think of as the separate track ofthinking. if they need to see 17 clients in an hour and they havean extra 15 minutes, they’ll see an eighteenth client.”
The implication of this statement is that, by over-extending orover-emphasizing program-delivery capacity, organizations may beneglecting opportunities to identify ways it can save money orimprove capacity. As a couple of consultants said in our focusgroups, it’s hard to get people to prioritize the measurement piece,but nonprofits need someone who is thinking about this on a day-to-day basis. One way to do this is to make it part of a nonprofit’sprogram work, by aligning data collection to the organization’sprocess for program delivery.
Often, data collection and analysis is conducted as a standaloneproject. “These measurement projects often come in as projects,”a consultant told us. “They’re free-standing projects, they wereasked for by a funder or a prospective major donor or a newleadership staffer or a board member, so it’s a standalone projectthat isn’t baked into the organization’s normal work. So theorganization spends a ton of time trying to collect this data and getit into the system and make it useful, by which time the need mayhave disappeared.” She advised organizations try to adjust theirworkflows to make it part of the ordinary course of a work day sothat someone on the team can spend five minutes a day on it ratherthan cramming it into an entire day at the end of the quarter.
for nonprofits with fewer staff and smaller budgets, there aremany priorities and only so many hours in the day. if there’s noclear delineation of measurement duties in people’s jobresponsibilities, one nonprofit staffer said, figuring out who’s goingto carve the time out of which job description to do this is a realchallenge. Some nonprofits spread the responsibilities acrossmultiple staffers, a solution with its own set of challenges. “for usit’s a part of everyone’s job,” a staffer for a human servicesnonprofit explained in the focus group. “Things might move fasterand be more precise if we could hire a performance measurementperson.”
NTEN: A COmmuNiTy TRANSfORmiNg TEChNOlOgy iNTO SOCiAl ChANgEThE STATE Of NONPROfiT DATA · NOvEmbER 2012
Case Study:Learning to TrackData to FightDomestic violenceone leader of a domestic violenceprevention organization hasprioritized smart data collectionand evaluation. She overseesmultiple locations, all of which arenetworked so that staffers atdifferent sites can share data andhave all their information at theirfingertips, even if they’re workingat another site. The sharing hasproved quite helpful, and she usesthe data to measure eachlocation’s effectiveness.
This director still struggles withhow best to collect data. Tocapture information aboutprograms, her organizationsurveys clients at the time ofintervention, which she feels leadsto inaccurate information becauseit’s collected during a time ofcrisis. For that reason, she’sconsidering changing this process.She worries, too, about the ethicsof keeping a “control group” tomeasure how effective certainprograms are against the currentmodel—shouldn’t everyonebenefit from new models?
As for external data, she’d love tobe able to see how many“protection from abuse” orderswere filed in the county, and ofthose, how many her organizationhelped enact. She wants to able tocapture a percentage for howmany of these cases out of thetotal have been handled by hernonprofit.

�7
Another focus group participant said that at her organization, they make sure everyone who is involved knowshow to collect data and access it so they can avoid the problems that arise when one person becomes thekeeper, and the data is not accessible or collected properly or efficiently.
for some nonprofits, this is not as easy as it sounds. Nonprofit staffers tend to have a natural inclination thataligns them more toward working with people than working with numbers. During more pragmatic dataplanning, like a build-the-database meeting, “We’re finding executive directors want to be a part of that fromtheir perspective,” a consultant told us. “many times in the past, they would just say, ‘i don’t do that kind ofwork. i’m on the conceptual level.’”
Another focus group participant pointed out, “People who tend to be attracted to the nonprofit sector careabout the individuals. Numbers are very scary to put on individuals.”
The fear runs a little deeper than that at some organizations—a participant working for a human servicesnonprofit brought up that she thinks there is resistance to what the numbers will show because people thinkthey will get into trouble if the numbers don’t come out the way they think they should come out. As shepoints out, that is a barrier to getting people to dive into more difficult questions.
Time is particularly challenging. A whopping 61 percent of those who reported “resources” as a primarydifficulty in collecting or using data mentioned time as the biggest challenge. Regardless of what anorganization measures, it takes time and effort that would otherwise be devoted to a different project. “Oncean organization has a dashboard, whatever those metrics are, and they start measuring whether it’s annually,or daily, or monthly…people forget about the time that needs to be dedicated toward analyzing data orinterpreting the data, or toward making decisions, or toward communication,” a focus group participant said.
expertiselack of knowledge is frequently cited as a barrier to collecting and working with data—24 percent of thosewho provided an answer to the free-text survey question about challenges cited issues with understandingwhat they should do with data, understanding the data itself, or defining metrics.
“be it a nonprofit or a foundation, we find it to be a fairly mixed bag,” a focus group participant said. “it is therare case today that you find an organization that doesn’t have interest in evaluation, but the reality is thatmost of them, even some of them that are high-performing in some aspects, they just lack the in-houseexpertise to really do evaluation and learning and improvement well. And i don’t think it’s an issue of tools somuch as it is general starving and underfunding of a lot of nonprofit sector work.”
Consultants and foundations with whom we spoke noted that nonprofits have a lot of data but haven’t definedtheir goals enough to use it for decision making. in fact, more than 67 percent of survey respondents reporteddifficulties translating marketing and communications data into usable metrics for decision-making and nearly60 percent said they had similar difficulties with program data.
There is a perception that you need specialized staff to do data analysis, but as we discussed previously, somenonprofits are distributing the duties across the organization. Staff that aren’t as comfortable with dataanalysis also have problems knowing where to start, and as such, get overwhelmed by the amount of data it’spossible to collect and measure. This is not to say that everyone on staff is able to play the role of data analyst.in fact, as one consultant pointed out, your best staff members might not be the best measurers.
NTEN: A COmmuNiTy TRANSfORmiNg TEChNOlOgy iNTO SOCiAl ChANgEThE STATE Of NONPROfiT DATA · NOvEmbER 2012

�8
Organizations that lack expertise in working with data have veryreal concerns about the quality of data and analysis they do get,primarily around the issues of consistency in data quality amongindividuals with varying levels of expertise. This is a particularconcern for organizations that rely on volunteers for data entry.One nonprofit staffer shared her challenges with consistency ininput and measurement, noting that they have a lot of volunteerswith various levels of computer experience and savvy and thismakes it difficult for her to have confidence that the data is goodenough to use for decision-making.
This is also a challenge when a nonprofit is growing. Another focusgroup participant shared with us that as his staff grew from two toeight people, he saw a problem with consistency in the use oftheir system and now feels the need to be managing how peopleenter the data.
TechnologyTwenty-three percent of those who reported a challenge said thattechnology was one of their biggest issues when it comes totracking data, and 33 percent of those mentioned specifically thatthey felt they needed a better database to help while 15 percentcited issues using the databases (often, several of them) they hadin an organized way to get the information they needed. Otherissues include system ease-of-use, and out-of-date technologies.
Often, the same organizations that under-invest in planning forthe strategic metrics that could help the organization also under-invest in the technologies that could help them track them. bothare seen, in the words of a foundation executive, “as taking awayfrom program delivery rather than being part of it. it’s stealing themoney away from the doing of the program.”
This perception is a shame, because technology can in fact be asubstantial help in integrating data collection into the everydaystaff process. As several consultants in our focus group noted,understanding the process of front-line staff and then designingdata systems that help them gather data in a natural way thathelps them with the data they need can be a critical step increating a data-based decision making culture.
NTEN: A COmmuNiTy TRANSfORmiNg TEChNOlOgy iNTO SOCiAl ChANgEThE STATE Of NONPROfiT DATA · NOvEmbER 2012
Case Study:State-Imposed Datarequirementsbecome anImpositionA homeless services nonprofitstruggling to collect accurate anduseful data in the face of limitedresources currently uses a state-mandated database to keep trackof clients, and Quicken forfinances, but doesn’t have anysoftware to track metrics aboutcommunications, volunteers oruseful donation information. Theorg recently enrolled in a databaseto track grants, but the staffer wespoke with doesn’t find itparticularly useful.
She reported that her organizationstill needs to track specific datapoints like client income, servicesneeded and demographics to becompliant with regulations, andfor grant seeking and reporting,but uses the state-mandateddatabase since the organizationdoesn’t see the value in multiplepoints of entry for the same data.The staff is facing more pressurefrom the federal government—forwhom they provide services—toimplement more rigorous datacollection and evaluation policies.now they’re looking to partnerorganizations for help and tryingto come up with ways that thestate database could be helpful tomeasure their own organizationalhealth. but lack of time, moneyand staff training are allimpediments to the organization’sprogress when it comes togathering useful data.

�9
moneyNo discussion of nonprofit barriers would be complete without delving into the role that money—or the lackof it—plays. interestingly, we found from both the survey and focus groups that money is a factor, but farfrom the only reason people aren’t measuring. in fact, only 17 percent of those who reported “resources” asa primary difficulty reported money as the biggest challenge.
What we do know is that organizations with more money are more likely to have defined plans in place andto be measuring data toward those plans. money also can be put toward other issues to, for instance,overcome technology challenges and hire additional staff to overcome time constraints.
“A big problem for me is the cost of good data systems,” explained an administrator of early childhoodeducation programs.
Another focus group participant, an executive director of a rural community organization, noted, “Clearly,money provides time in the form of more people to do the work.”
however, a blast of money from a funder isn’t necessarily a help in the long run—not only is it hard to getfunding for things like evaluation and technology, as they’re not always perceived as directly applicable toservices, but it also needs to be sustainable over the long term to support the ongoing effort.
NTEN: A COmmuNiTy TRANSfORmiNg TEChNOlOgy iNTO SOCiAl ChANgEThE STATE Of NONPROfiT DATA · NOvEmbER 2012
Case Study:Healthy Appetite for Data Leads to ImprovementsA local meals on Wheels program uses data in a variety of ways, and even has a database manager on staffto work with client data required for state reporting. This lets staff access profiles, demographics, healthissues and mental health issues, and identify the population segment that is close to needing a nursinghome.
In addition, staff can measure how long a program has helped keep clients from needing a nursing home.Since there’s a waitlist for services, staff use data to help triage people eligible for the program by usingtests such as the “mini nutritional assessment” to identify who is in most urgent need of their service.Having all of this data in the database ultimately helps the organization assess the long-term health ofclients.
The development director is interested in measuring communications data to evaluate organizationalhealth, too. She noticed that the nonprofit had a very good response to the mailed newsletter one year,which brought in a lot of donations, and is looking at that data to decide whether it’s the physicalnewsletter that’s compelling or whether her e-newsletters could be redesigned to achieve similar results.She’s tried to measure email metrics, like open rate and click-through, to see if particular approaches aremore effective.
As enthusiastic as she is about data, though, she still gets frustrated when her funders make impossibledemands. She’s happy they’re interested in the data, but noted that “the difficult part is when fundershave their own measure and they want a variety of nonprofits that they fund to fit their work into theirmeasure. I appreciate it more when foundations say, “What are your goals? What do you measure? Andhow are your results?… instead of only fitting it into the funder’s mold.”

�0
How Do Funders Fit In?• Nonprofits often find compliance with the number and diverse range of funder
reporting requirements overwhelming.
• These reporting requirements can be very beneficial, in that they also are oftenthe impetus that spurs a nonprofit to begin tracking and analyzing data in thefirst place.
• however, this “data regime” imposed on nonprofits takes away ownership and,often, their ability to see the big picture of what they are measuring.
internal barriers are not the only factors that weigh on a nonprofit’s ability to track and analyze data—organizations are also subject to external demands and stakeholders, including foundations, local, state andfederal governments, donors, clients and community groups.
Funder Supportfunders and government agencies are the biggest external forces that affect data collection and analysis.in recent years, many of these organizations have devoted more attention to specific metrics and outcomesmeasures, creating a positive force to encourage data-based decision-making. A number of the nonprofitsin our focus groups were spurred to develop a data collection and analysis strategy based on funderrequirements, but have since found it very useful for their own purposes. “grants and contracts wererequiring some of that data and that was our initial impetus [for measurement],” said one focus groupparticipant, “but now we have theories that if we do this service in a certain way we are going to have xeffect.”
Funder reporting requirementsThe reporting demands placed on nonprofits related to financial support and government regulations can beoverwhelming, however. One focus group participant whose organization administers education programsfor low income children said they collect data on “basically everything,” using several different databases.in addition, they collect data on program information reports for the federal government—all required data.She says the “overwhelmingness” of it all is exhausting, and that because the data is all piecemeal shedoesn’t get the big picture of what the organization is measuring.
in addition to the pressures resulting from reporting requirement for multiple funders, foundations oftenask for a number of things—a request often driven by concerns about the validity and reliability of datanonprofits provide them. A program officer at a foundation pointed out that organizations of all sizes havereal challenges articulating the changes they want to make and showing the progress that they’re making.
As one consultant noted, this is a mixed bag—while asking people to measure their work is good, requiringthem to measure it 50 different ways is problematic. The issue is one of volume and degree.
Nonprofits supported by multiple funders are often subject to separate reporting requirements spanning avariety of databases and tools. in a focus group, a specialist for a poverty relief foundation pointed out thatit’s easier for smaller agencies because the larger the group, and the more diverse the funders, the moredifficult to report back.
NTEN: A COmmuNiTy TRANSfORmiNg TEChNOlOgy iNTO SOCiAl ChANgEThE STATE Of NONPROfiT DATA · NOvEmbER 2012

��
Nonprofits were also frustrated by the “one size fits all” reportingapproach taken by some funders and government agencies whorequire the same broad swath of data reporting to a variety ofdifferent program efforts. in addition, many government agenciesand foundations require grantees and program participants to usetheir proprietary tools for data collection, which often don’t matchup with the tools the nonprofits are using.
When many funders impose what one consultant referred to as a“data regime” on organizations from the outside in, there’s adanger of taking away the organization’s ownership over the datathey need for their own purposes. because funder reportingrequirements sometimes have the effect of encouragingnonprofits to think short-term and focus on responding to specificrequests, it can remove them a step from the strategic knowledgethey need to run their own programs better.
in some cases, as one executive director pointed out,organizations try to ensure the data will show their programs aseffective, to put them in the best possible position for futurefunding. This further muddies the waters when it comes to makingdecisions with the data – both the funder and the organizationthemselves may believe a program is effective simply because themetrics tracked were designed to show it as effective, regardlessof the actual outcome.
The Challenges for Foundationsfoundations acknowledge that reporting is time-consuming andexpensive, that the design of research requires skill, and that datacollection is time-consuming and difficult. however, they oftenhave their own set of stakeholders that want clear metrics as tothe impact of the provided funding. funders and governmentagencies want to understand impact, to see a clear andquantifiable strategic plan, and how an organization plans tomeasure its success, but they find that nonprofits are often notable to provide that information.
The information that they do receive comes in bits and pieces.“The universal reporting tool is called Word,” jokes one foundationchief information officer, referring to microsoft Word documentsoftware. While program officers often find a narrative a moreuseful summary of the actual result than a set of metrics, theformat makes it difficult to extract useful data to analyzeoutcomes across grantees.
NTEN: A COmmuNiTy TRANSfORmiNg TEChNOlOgy iNTO SOCiAl ChANgEThE STATE Of NONPROfiT DATA · NOvEmbER 2012
Case Study:Using Data toDemonstrateProgressone youth services program usesdata to help parents of programparticipants become more investedin the program. each child in theprogram has three objectives atany given time, so the org hasstarted collecting data logs oneach child’s objectives. once achild masters one of his objectives,that achievement goes on his datalog as “mastered.”
The organization can then bringthe log to parents who haven’tbeen bringing their children inconsistently and demonstrate thechildren’s progress. Such datahelps convince parents of theprogram’s value and effectiveness.The organization’s executivedirector is proud of her staff’sability to use data, to understandwhat it is used for and to share itwith families.
“The more adept we have gottenat proving what our children do,it’s blown our hair back,” she says.“We didn’t know we were thatgood.”
She wants to make sure hermodel is replicable, and knowshow expensive good data systemsare—she’s eager to share her bestpractices with peer organizationsbut not sure quite how. She’s alsointerested in getting control of herfinancial data. right now, she doesher budget projections in excel,and the process is time-consumingand arduous.
��
The foundations we talked to said that they feel that often the only reliable quantitative information theycan get from organizations they fund is “who they are, and how many people have been touched.”
in addition, many program officers themselves are not experts at evaluating the impact of a grant. As anevaluation director for a poverty relief foundation said, “We’re trying to pull questions out of an infinite setof possible questions.” When a program officer isn’t sure what to ask, it can seem easier to ask multiplethings.
between the nonprofits’ difficulty in providing data, and the funders’ difficulty in figuring out what to ask,funders can sometimes over-engineer reporting requirements to get as much data as possible to make theirown determinations later as to whether a project’s goals are being reached. As one foundation staff membersaid, “We may possibly be asking for a lot of information that we don’t look at or use.”
There are a number of things organizations and those who fund them can do to build a richer, more strategicapproach to measuring impact, which we will discuss in our next section.
NTEN: A COmmuNiTy TRANSfORmiNg TEChNOlOgy iNTO SOCiAl ChANgEThE STATE Of NONPROfiT DATA · NOvEmbER 2012
Case Study:Funding organizations, encouraging Data-TrackingA director of evaluation for a small community foundation believes strongly that data collection andevaluation help the organizations she funds stay nimble. She recommends that organizations come up witha clear, metrics-driven strategic plan to help drive their missions and shape their work. She recognizes,though, that the competing demands of multiple funders can create unnecessary barriers fororganizations.
She acknowledged that they may be measuring the same thing at three different times, spending time thatcould be devoted to providing services. That’s why she encourages grantees to streamline their processesand share best practices. She wants them to recognize that a lot of the information they need to measurewill be universal, no matter the mission of the organization or the grant they’re reporting on.
She’s also making an effort to align requests and measurements with her peer foundations to alleviate thestrain on their grantees. A group of foundations in her area have hired a consultant to find the overlapbetween their different reporting systems, but right now “it’s a mess,” she said, with no clear way tocombine them.
And the director of evaluation still meets with resistance from her grantees when she emphasizes theimportance of establishing clear internal processes around data. She notes that it’s sometimes hard toeven get nonprofits to accept funding earmarked for evaluation infrastructure, as they worry that suchexpenditure will increase their apparent overhead expenditure and draw negative attention fromgovernment funders.

��
recommendationsWith all these internal barriers and external forces, how can nonprofits be both better at data collection andmore strategic in their analysis? it takes a village to build this type of success. The following arerecommendations for nonprofits, funders, and consultants to help organizations become more data-drivenentities.
Start somewhere. “i think a piece of it is letting nonprofits know that it’s not a matter of doing all ornothing,” a consultant told us. “Starting with a little bit, starting with assessing a program—something—isbetter than doing nothing at all.” As discussed earlier, with all the different types of data available, manynonprofits are at a loss as to where to start. Rather than throwing your hands up in the air, consultantsadvise nonprofits to start small. “Pick one measure thoughtfully, measure one thing, and don’t try tomeasure everything,” one consultant said. She advised nonprofits to come up with success stories, lookat the data and tweak what they’re already doing.
Another consultant suggests that this first effort be a discrete project with a beginning and end. Nothingbuilds buy-in like success; if your organization doesn’t yet have a data-driven decision-making culture, trydefining one thing you’d like to improve or change, define one metric to measure it that would be usefuland not too difficult to track, collect that data over time, and then use the data to help understand whetheryou’re making change in the organization. if staff see that this data is useful, it can start the ball rolling oncollecting more metrics to support a data-focused culture.
Connect your goals to your mission to your metrics. Data is most useful when it encompasses metricsthat measure whether or not you are succeeding as an organization. in order to do this, you need to comeup with quantifiable goals related to what you’re trying to do and determine the best way to measurewhether or not you are meeting them. One foundation officer suggests starting by asking what success lookslike, and how you will know it when you see it.
Once you’ve defined success and how to measure it, you can hypothesize about ways to move toward it. Thedata will tell you whether you’re moving in the right direction. however, it’s critical in this model to ensurethat your goals are strategic in and of themselves. As one consultant pointed out, you often get what youmeasure—if you’re measuring outputs that don’t actually relate substantially to organizational success, it’seasy to expend a lot of time trying to improve a metric without actually strengthening your mission ororganization. One example of a good way to connect your goals to your metrics is if you have a goal ofincreasing volunteer involvement, setting a benchmark that you would like to meet such as the number ofvolunteers you need to recruit to serve a particular community. you can then hypothesize about differentways to recruit volunteers, and use data to tell you if that method worked.
Once an organization starts to dive into data, the temptation is to measure everything. however, oneconsultant cautioned, more is not necessarily better—and it doesn’t mean you’re necessarily measuring theright things. Another consultant agreed, noting that organizations shouldn't just measure what they’re“supposed” to measure. That’s why it is so critical to match your metrics with your mission and goals.
funders and government agencies can help with this as well by working with grantees to developmeasurement plans that relate to the specific goals of their programs or grants, rather than requiringreporting on a broad swath of data that may or may not be useful. A small investment in refining reporting
NTEN: A COmmuNiTy TRANSfORmiNg TEChNOlOgy iNTO SOCiAl ChANgEThE STATE Of NONPROfiT DATA · NOvEmbER 2012
��
requirements can have a big impact on grantees’ ability to use funder requested data for their ownpurposes, and ensure time spent in gathering data for reports is valuable as opposed to simplyadministrative time that can’t be spent on programs.
Don’t start by obsessing about outcomes. When asked about methods for measuring organizationalhealth and success, many of the organizations involved in the focus groups immediately jumped to methodsfor tracking program outcomes—ways to quantify the impact their organizations are having in the world. infact, many found the concept of data-based decision-making essentially synonymous with outcomestracking.
however, there are many different types of data that can be useful to nonprofits, and outcomes are oftensome of the most difficult. it may make sense to start your data strategy with other metrics that are easierto pin down, like financial, fundraising or program status. Defining an evaluation strategy to gather clearoutcome metrics may well be more complicated, as you often need to first think critically about what ispossible to measure and what’s practical to expect from your staff. “let go of the expectation that you’regoing to be able to measure exactly what you want,” counseled one consultant. “Perfect is the enemy ofthe good.”
if you’re a funder, think critically about what you can expect nonprofits to be able to produce. it’s reasonableto ask them to measure their own activities, but measuring their impact on a community might well be aresearch project that would run into the hundreds of thousands even for a trained evaluation firm. Does itmake sense for them to take on a project of such scope to be able to report back for your grant?
Learn from others. There’s a tendency among nonprofits to think that their circumstances are unique, butthere are commonalities among many different metrics—especially for organizational health and programprocess. understanding what other nonprofits do can provide valuable insight into what can work for yourown organization.
Change your culture to value data. buy-in from the top-down is critical to creating a data-drivenorganization. Start with your board members, one funder counseled, and convince them of the importanceof asking questions like “where are we under-investing” rather than “where are we overspending.”
Several of the consultants who participated in our focus groups offered advice on how to do this. One wayto do this is to share a dashboard of meaningful information to get everyone familiar and engaged with thedata. Another is to identify, as defined above, the data you can get without investing large amounts ofresources, and make it clear that your organization prioritizes data-based decisions—often this results inmeasurement becoming systematized in an organic fashion. The goal here is for staff to shift their mentalmodels of themselves, for example leading a counselor to become a data-driven counselor.
Train staff. your staff members are the front line of data collection and analysis. Perhaps the most valuablething you can do to build a culture that values data is to make sure your staff knows how to use yourdatabase, understands what data you are collecting, and feels like data-based decision-making can helpthem do their jobs.
Evaluate the existing ability of your staff for data collection and evaluation and decide if training canincrease their comfort with data. Nonprofit staffers are more likely to have a stronger affinity for people orprograms than for numbers, so it can be very useful to actively cultivate an appreciation, through training,for what data is good for, and how to interpret the data appropriately to understand nuances and gain
NTEN: A COmmuNiTy TRANSfORmiNg TEChNOlOgy iNTO SOCiAl ChANgEThE STATE Of NONPROfiT DATA · NOvEmbER 2012

��
insight. Obviously, training is easier if the processes you’re asking people to take on are easier to beingwith—make sure your systems and workflow are easy to use and integrated into the day-to-day performanceof people’s jobs.
foundations can help support these efforts by developing educational programs on evaluation topics andproviding funding support for capacity building in this area.
make an investment. in general, funders are reluctant to provide money for things not directly related toservices, but technology and evaluation are critical to getting funding for future projects. As one officer at asmall foundation said, funders are realizing that technology and evaluation aren’t optional line items—they’re part of an organization’s capacity building.
Organizations also need to make investments in time. in order to use data to make decisions, nonprofitsneed to test hypotheses, which takes time. As one consultant noted, data strategies often fall short becausenonprofits don’t actually take the time needed to collect and analyze it.
Tracking the right data in the right ways can help your nonprofit measure your progress toward yourmission. While there are still barriers to overcome, the moment you begin to track and measure, you’realready over the first one.
NTEN: A COmmuNiTy TRANSfORmiNg TEChNOlOgy iNTO SOCiAl ChANgEThE STATE Of NONPROfiT DATA · NOvEmbER 2012

�6NTEN: A COmmuNiTy TRANSfORmiNg TEChNOlOgy iNTO SOCiAl ChANgEThE STATE Of NONPROfiT DATA · NOvEmbER 2012
About the AuthorsKyle AndreiAs idealware’s Research Analyst, Kyle is responsible for researching software through demos, interviews andsurveys, and using that information to create idealware’s reports and articles. in addition, Kyle also producesidealware’s Askidealware videos, drawing on his broadcasting experience. he’s a graduate of indiana Stateuniversity, where he split his time between managing the student radio station, researching video gamecommunication and working on local elections.
elizabeth PopeAs idealware’s Senior Researcher, Elizabeth Pope leads software research projects, conducting interviewsand product demos, writing articles and reports, and helping to design project methodology. She earned anm.S. in library and information Science from the university of illinois at Champaign-urbana, where shehoned her research, instruction and tech skills. before moving to maine, Elizabeth worked in archives andlibraries in New york City for several years. her background also includes fundraising and contentdevelopment for nonprofit organizations.
Amadie HartAmadie is a contract writer and researcher for idealware, and president of hart Strategic marketing llC, afirm providing marketing and communications consulting to nonprofits and small businesses. A self-professed “data geek,” Amadie has helped a number of nonprofits interpret and use their data for strategicdecision-making, both in her work with hSm and previously as online campaigns and marketing director forbeaconfire. This data has helped organizations measure and plan for fundraising strategy, onlinecommunications strategy and online marketing campaigns.
Laura S. QuinnAs idealware’s founder and Executive Director, laura has been working in the software sector for more than15 years. She directs idealware’s research and writing to provide candid reports and articles about nonprofitsoftware. Prior to idealware, laura founded Alder Consulting, where she helped nonprofits create internetstrategies, select appropriate software, and then build sophisticated websites on a limited budget. She hasalso selected software, designed interfaces and conducted user research for multi-million dollar softwareand website implementations with such companies as Accenture and ixl. laura is a frequent speaker andwriter on nonprofit technology topics.
About Idealwareidealware, a 501(c)(3) nonprofit, provides thoroughly researched,impartial and accessible resources about software to helpnonprofits make smart software decisions. by synthesizing vastamounts of original research into credible and approachableinformation, idealware helps nonprofits make the most of theirtime and financial resources.
idealware specializes in combining traditional research techniques like interviews and surveys withsoftware-selection methodologies—like detailed ratings of software tools against a rubric—to generateimportant new knowledge on affordable budgets. We then package our findings into approachable reports,articles, and trainings that help nonprofits make the on-the-ground decisions important to them.

�7NTEN: A COmmuNiTy TRANSfORmiNg TEChNOlOgy iNTO SOCiAl ChANgEThE STATE Of NONPROfiT DATA · NOvEmbER 2012
About nTenA CommunityTransformingTechnology IntoSocial Changewww.nten.org
Who We AreA community of nonprofit professionals, we aspireto a world where nonprofit groups of all types andsizes use technology strategically and confidentlyto fulfill their missions. Together, the NTENcommunity helps members put technology towork so they can bring about the change theywant to see in the world.
What We DoNTEN connects members with one another andoffers many opportunities for learning andprofessional development—all so you can focus onachieving your goals and meeting your mission.
How We Do ItNTEN helps members, with their diverse jobfunctions and levels of tech comfort andexpertise, share best practices, and glean insightsfrom one another both online and off: training,research and industry analysis, regional meet-ups,our signature Nonprofit Technology Conference.As a member, you gain instant access to asupportive community that shares your passionsand challenges, as well as to valuable resourcesfor professional development.
Connectonline networking / www.my.nten.orgWhether you’re a webmaster, marketer, executivedirector, fundraiser, blogger, program manager, orplay another role in the nonprofit sector, connectwith your peers online. Join our Affinity groupsand social networks, browse the memberDirectory, post in our online forums.
events / www.nten.org/eventsNTEN’s Nonprofit Technology Conference andlocal meet-ups bring nonprofit professionalstogether to share ideas and best practices. get toknow colleagues. Develop a support network.Talk shop. vent. Congratulate. Collaborate. Thepossibilities are endless.
LearnnTen Webinars / www.nten.org/webinarsChanging the world isn’t easy. NTEN members arealways looking to learn more about how to usetechnology to further their missions. gain awealth of knowledge without ever leaving yourdesk through NTEN’s extensive schedule of livewebinars and archived events.
nTen research / www.nten.org/researchNTEN collaborates with renowned industry,academic, and nonprofit partners to conductresearch on key subjects related to nonprofittechnology like iT staffing and spending, salaries,social networking, and data ecosystems. Ourreports and benchmarks studies offer actionabledata and invaluable insider information.
ChangenTen: Change / www.nten.org/ntenchangeNTEN: Change is a quarterly journal for nonprofitleaders. you’ll find guidance on the strategic andpractical considerations necessary to make thesound investments and decisions that will helpyour organization achieve its mission.
nTen Connect newsletter /www.nten.org/signupRead how NTEN members are fulfilling theirmissions and changing the world—and how youcan too. The free monthly NTEN Connectnewsletter brings you solid advice, successstories, and best practices related to technologyand the nonprofit sector.

�8
APPenDIX A: methodologyin April 2012, NTEN worked with idealware to conduct a survey of nonprofits to learn more about what datametrics nonprofits are collecting and tracking, and how that data is used to make decisions. Surveyparticipants answered questions asking them what specific example metrics their organizations weretracking, how important each metric was to both financial and programmatic decisions, and what specificchallenges they have had in the past with collecting, monitoring, and understanding data.
We distributed the survey nationally through 5 individual nonprofit state associations (Texas, Kentucky,Pennsylvania, North Carolina, and Connecticut). While some states had greater representation than others,all regions were represented, and we have no reason to believe the results were biased toward any particularregion in any way that would affect the survey results.
The invitation to participate specified that the survey was intended for each organization’s executivedirector. in total, 398 people responded to the survey. This means our sample should be consideredsomewhat indicative of nonprofit trends, but not a representative sample of nonprofits nationwide.
With the survey complete, we then conducted six hour-long telephone focus groups that included a total of38 people. These discussions focused on the core metrics that nonprofits should track, what they weresuccessfully tracking, barriers to success, and the role of foundations in this area. The six focus groupsconducted were:
• Two discussions with nonprofit staff members who were strategically thinking about data. Themajority of the participants were survey participants whose answers to the survey suggested theywere thinking strategically about data, and that they were willing to talk in more detail. A few of theparticipants were from organizations known to idealware to be actively using data. The firstdiscussion group contained five people; the second contained six.
• Two discussions with consultants and staff from capacity-building organizations that help nonprofitsthinks about technology and data collection. idealware reached out to individuals that havediscussed data issues with us before or work in a related field. Each of the these discussion groupscontained seven different people.
• One discussion with program officers and evaluation professionals from smaller private andcommunity foundations. idealware recruited three “co-hosts” that we knew to be thinkingstrategically about this area. idealware and the co-hosts then recruited five more participants for thisgroup, for a total of eight.
• One discussion with program officers and evaluation professionals from larger private foundations.idealware recruited two “co-hosts” that we knew to be thinking strategically about this area.idealware and the co-hosts then recruited three more participants for this group, for a total of five.
NTEN: A COmmuNiTy TRANSfORmiNg TEChNOlOgy iNTO SOCiAl ChANgEThE STATE Of NONPROfiT DATA · NOvEmbER 2012

�9
APPenDIX b: Survey Text
Thank you for participating in this survey.
NTEN and idealware have created this survey to get an idea of what types of data nonprofits are collectingand using to make organizational decisions.
What data are we talking about? Any online or offline data you collect, from program data to email statisticsto census records.
upon completion of this survey, you will also have the opportunity to participate in a series of free webinars.
NTEN: A COmmuNiTy TRANSfORmiNg TEChNOlOgy iNTO SOCiAl ChANgEThE STATE Of NONPROfiT DATA · NOvEmbER 2012
�. What best describes your organization'sprimary issue area?
• Animal rights/Animal welfare
• legal
• museum/library
• Public/Social benefit
• housing
• Arts/Culture
• Education
• N/A
• youth
• Environmental
• Employment
• faith-based
• Civil Rights/Advocacy
• health
• human Services
• international
• Other (please specify)
�. What is the approximate annual budget ofyour organization?
• none - all volunteer
• below $100,000
• $100,000 - $250,000
• $250,001 - $500,000
• $500,001 - $1 million
• $1 - $2 million
• $2 - $5 million
• $5 - $10 million
• more than $10 million
�. In which state is your organization'sheadquarters?
• Alabama • Alaska
• Arizona • Arkansas
• California • Colorado
• Connecticut • Delaware
• District of Columbia • florida
• georgia • hawaii
• idaho • illinois
• indiana • iowa
• Kansas • Kentucky
• louisiana • maine
• maryland • massachusetts
• michigan • minnesota
• mississippi • missouri
• montana • Nebraska
• Nevada • New hampshire
• New Jersey • New mexico
• New york • North Carolina
• North Dakota • Ohio
• Oklahoma • Oregon
• Pennsylvania • Rhode island
• South Carolina • South Dakota
• Tennessee • Texas
• utah • vermont
• virginia • Washington
• West virginia • Wisconsin
• Wyoming • Other

�0
�. on a scale of � to �, how well do the following statements reflect how your organization usesthe data it collects?
�. Which of the following best describes how you’re tracking the following metrics
NTEN: A COmmuNiTy TRANSfORmiNg TEChNOlOgy iNTO SOCiAl ChANgEThE STATE Of NONPROfiT DATA · NOvEmbER 2012
� � � � �Strongly StronglyDisagree Agree
We track specific metrics to evaluate our processtowards a defined strategic plan
We have a defined plan for how data will be usedto define the success of our programs
We have a defined plan for how data will be usedto measure our organization's overall health
Our decision making processes are generallyinformed by data
We don't have the data that would help us makeimportant decisions
This isn't We don’t We don’t We don’t We are Weuseful know how have the have the tracking rigorouslyfor our to track technology time/money this, but not track thisorganization this to effectively to effectively rigorously
track this track this
your financial actuals vs. budget
The number of people on yourmailing list
The number of comments youreceive on facebook
The number of new donors inthe past year
information about what programsspecific clients/constituents takepart in information about theoutcomes of clients/constituents
External data sets related to yourissue area (i.e. water quality,homeless population, census, etc.)
The number of people whoopen emails that you send out
The number of visitors to yourwebsite

��
6. of the metrics you’re tracking, which have you used in the past to help make spending orbudgeting decisions for your organization?
NTEN: A COmmuNiTy TRANSfORmiNg TEChNOlOgy iNTO SOCiAl ChANgEThE STATE Of NONPROfiT DATA · NOvEmbER 2012
We don’t not used Somewhat very Criticaltrack this for this useful useful
your financial actuals vs. budget
The number of people on yourmailing list
The number of comments youreceive on facebook
The number of new donors inthe past year
information about what programsspecific clients/constituents take part in
information about the outcomes ofclients/constituents
External data sets related to your issuearea (i.e. water quality, homelesspopulation, census, etc.)
The number of people who open emailsthat you send out
The number of visitors to your website

��
7. of the metrics you’re tracking, which have you used in the past to help make decisions aboutthe direction of programs or services?
8. Which of the following types of external data have you used in the past?
NTEN: A COmmuNiTy TRANSfORmiNg TEChNOlOgy iNTO SOCiAl ChANgEThE STATE Of NONPROfiT DATA · NOvEmbER 2012
We don’t not used Somewhat very Criticaltrack this for this useful useful
your financial actuals vs. budget
The number of people on yourmailing list
The number of comments youreceive on facebook
The number of new donors inthe past year
information about what programsspecific clients/constituents take part in
information about the outcomes ofclients/constituents
External data sets related to your issuearea (i.e. water quality, homelesspopulation, census, etc.)
The number of people who open emailsthat you send out
The number of visitors to your website
never Used once Sometimes Use allUsed or twice use the time
Public federal government data(e.g. census, unemployment)
Public state or local government data
Public data about the community you serve
Public data about potential donors(e.g. wealth screening)
Private data shared with you by otherorganizations
Are there other sources of data fromoutside your organization that you use?

��NTEN: A COmmuNiTy TRANSfORmiNg TEChNOlOgy iNTO SOCiAl ChANgEThE STATE Of NONPROfiT DATA · NOvEmbER 2012
9. When it comes to making decisions about programs, how challenging are the following tasks?
�0. When it comes to making decisions about marketing and communications, how challenging arethe following tasks?
This is This takes We often We often findgenerally effort but struggle this extremelyeasy for us in we’ve got it with this difficultmost areas mostly down
Collecting the raw data aboutprograms from your staff
Tracking the data usingdatabases or systems
Translating the data to metricsyou can use to make decisions
This is This takes We often We often findgenerally effort but struggle this extremelyeasy for us in we’ve got it with this difficultmost areas mostly down
Collecting the raw data aboutcommunications from yoursystems
Tracking the data insystems or spreadsheets
Translating the data to metricsyou can use to make decisions
��. What is the biggest challenge for yourorganization, currently, when it comes tocollecting and/or using data for your work?
��. As a thank-you for completing this survey,nTen and Idealware would like to invite youto a series of free webinars on using datastrategically . Would you like to be invited toparticipate in these webinars?
• yes, please!
• No, thank you.
��. After this survey, we are doing additionalresearch into what types of data nonprofits arecollecting, and how that data is used. Are youwilling to be contacted to participate in a focusgroup?
• yes, i am willing to be contacted
• No, i do not wish to be contacted
if you answered yes to either or both of the abovequestions, please include your contact informationbelow.
��. name
�6. organization

��NTEN: A COmmuNiTy TRANSfORmiNg TEChNOlOgy iNTO SOCiAl ChANgEThE STATE Of NONPROfiT DATA · NOvEmbER 2012
APPenDIX C: Survey Demographics
In which state is yourorganization's headquarters? Total
Arkansas 1
Connecticut 41
Delaware 1
georgia 1
Kentucky 40
maryland 1
mississippi 1
montana 1
Nevada 1
New Jersey 1
New york 3
North Carolina 9
Pennsylvania 107
Tennessee 23
Texas 94
virginia 1
Washington 69
(blank) 2
Grand Total �97
What is the approximate annualbudget of your organization? Total
$1 - $2 million 60
$100,000 - $250,000 58
$2 - $5 million 37
$250,001 - $500,000 55
$5 - $10 million 31
$500,001 - $1 million 58
below $100,000 54
more than $10 million 24
none - all volunteer 20
Grand Total �97
What best describes yourorganization's primary issue area? Total
Animal rights/Animal welfare 2
Arts/Culture 31
Civil Rights/Advocacy 6
Education 48
Employment 8
Environmental 19
faith-based 12
health 39
housing 19
human Services 109
international 2
legal 5
museum/library 20
N/A 25
Public/Social benefit 24
youth 17
(blank) 11
Grand Total �97