2012 Annual Report - Interactive Brokers
172
2012 Annual Report Interactive Brokers
Transcript of 2012 Annual Report - Interactive Brokers

2012 Annual Report
Interactive Brokers

Interactive Brokersis an automated global electronic broker that specializes in catering to financial professionals by offering:
• State-of-the-art trading technology• Superior execution capabilities• Worldwide electronic access • Sophisticated risk management tools at
exceptionally low costs
For 36 years we have been
building electronic access
trading technology that
delivers real advantages
to traders, investors and
institutions worldwide.

A-/A-2 S&P Credit Rating1
$4.8B equity capital
Trade in 100+ markets and 20 countries
Superior price executions – significantly better than the industry2
Rated lowest margin rates3 by Barron’s and low cost broker
eight years in a row4 by Barron’s
Largest U.S. electronic broker with 413,000 DARTs in 20125
(Daily Average Revenue Trades)
The future of trading
[1] Interactive Brokers LLC[2] Source: The Transaction Auditing Group (TAG). Industry as a whole for the referenced periods according to TAG. For additional information,
see www.interactivebrokers.com/bestexecution[3] Interactive Brokers’ margin rates are the lowest of the entire group surveyed, according to Barron’s online broker review Making the Right Connection -
March 14, 2011. Barron’s is a registered trademark of Dow Jones & Company, Inc.[4] For additional information regarding Barron’s rating of low cost broker, see www.interactivebrokers.com/compare [5] Daily Average Revenue Trades (DARTs) are based on customer orders.
32105text.indd 1 3/6/13 1:41 PM

Dear Fellow Shareholders,
2012 was a difficult year for Interactive Brokers Group and our industry. Global financial transaction volume continued to diminish and financial professionals, reluctant or unable to leave the industry, are competing ever more desperately for whatever opportunities still remain.
The continuing role of market makers is being called into question. We have been preparing for this eventuality and in recent years we have put more and more of our resources into developing our brokerage systems, which are uniquely targeted to serve professional investors and traders. As a result, we are proud to offer a brokerage platform that is unparalleled among its peers for low cost, exceptional execution quality, versatility and breadth of products.
In planning our business we aim to ride on the front edge of long-term trends. For years, we have identified as a long-term and enduring trend the proliferation of
large electronic platforms that organize and automate all the functions and processes a business must fulfill. Please think of the software supporting Wal-Mart’s inventory or Amazon’s fulfillment centers. By now such software has likely grown into systems that also run the rest of these organizations’ functions.
This is not unlike Interactive Brokers, in which our trading and back office software has been integrated with our customer service, account and market data management systems, our treasury, securities lending, accounting, compliance and regulatory systems, and our management information systems.
Such integrated, multi-function platforms are becoming ever more prevalent in almost all industries. They reduce time and labor requirements, errors, and costs. Price compression and unemployment rise in their wake, hopefully followed not too far behind by emerging new technologies and industries.
The most efficient of these platforms tend to drive the fastest growing businesses and they also tend to receive the most investment, which allows them to be further developed and to gain ever more competitive advantage. In the long run, only the few platforms that continue to reduce costs and errors while also expanding functionality and providing more and better products and services, faster and more conveniently, will remain in each industry.
Your task as investors is to identify these winners and our task at Interactive Brokers is to assure that we are among them.
Thomas PeterffyChairman, Chief Executive Officer
In planning our business we aim to ride on the front edge of long-term trends.“ “
32105text.indd 2 3/5/13 1:46 PM

Our differentiators
We invite you to learn more...
These are the key areas that have defined our success and that continue to drive customers to Interactive Brokers.
Financial strength and stabilityIn the wake of the headlines over brokerage failures, we continue to emphasize our strong capital position and conservative, liquid balance sheet, our A-/A-2 S&P credit rating and automated risk controls that protect IB and its customers from excessive trading losses. Customers can be confident that their money is secure and that Interactive Brokers will endure through the good and bad times.
Low cost and best executionCustomers understand the impact of costs on their results, especially active traders like ours, and this has probably been the strongest driver of customers to our platform.
Global accessOur customers literally have the world’s markets at their fingertips. They can trade on over 100 market centers in 20 countries and 21 currencies, and have direct market access to stocks, options, futures, forex, bonds, ETFs and CFDs from a single IB Universal AccountTM.
Award winning technologyAwarded a 4.5 star rating by Barron’s magazine in Best for Frequent Traders category1, we build electronic access trading technology that delivers real advantages to traders, investors and institutions worldwide.
[1] According to Barron’s Cut the Cord - March 12, 2012, Interactive Brokers was awarded 4.5 stars to qualify for the top two for Best for Frequent Traders.
32105text.indd 3 3/5/13 1:46 PM
Accounts (thousands)
‘07 ‘08 ‘09 ‘10 ‘11 ‘12
95111
134
158
189
210
Customer Equity($ in billions)
‘07 ‘08 ‘09 ‘10 ‘11 ‘12
$8.8 $8.9
$15.2
$22.1
$25.1
$32.9
Total Daily Average Revenue Trades
(thousands)
‘07 ‘08 ‘09 ‘10 ‘11 ‘12
265
357 347379
444 413
Brokerage Pretax Profit ($ in millions)
‘07 ‘08 ‘09 ‘10 ‘11 ‘12
$194.0 $222.4 $229.6
$274.0
$370.3 $341.7
17% CAGR
30% CAGR
9% CAGR
12% CAGR
Our differentiators have driven industry leading growthWe measure the growth and success of our brokerage business by the metrics below. Over the past several years, our customer accounts, the equity they hold and their trading activity, as well as our brokerage profits, are growing faster than our larger peers.
32105text.indd 4 3/5/13 1:46 PM
‘07 ‘08 ‘09 ‘10 ‘11 ‘12
‘07 ‘08 ‘09 ‘10 ‘11 ‘12
$0
$1
$2
$3
$4
$5
$6
$0
$5
$10
$15
$20
$25
$30
$35
$40
Liquid Balance Sheet
Low Financial Leverage
Billio
ns
US
D
Liquid Assets
Total Assets
Billio
ns
US
D
IBG LLC Equity
IBG LLC Debt
98.7%Liquid
Paid $400M special
dividend
Paid $1B special
dividend
Financial strength and stabilityOur customers take comfort in the fact that
• Our executive officers have an average tenure of 27 years with the firm
• Employees and affiliates collectively own over 88% of the company
• Our brokerage business conducts no proprietary trading
• We hold no material positions in over-the-counter securities or derivatives
32105text.indd 5 3/5/13 1:46 PM

$25K
U.S. Margin Loan Rates1 U.S. Commission Rates1
$200K $1.5M $3.5M
1.62% 1.37% 0.99% 0.76%
100 Shares1 Stock Option
1 E-mini S&P 500 Future
$1.00 $1.00 $0.85
Execution Price Improvement Comparison*
Interactive Brokers
Industry IB Advantage
$0.72
$0.86
€0.37
US Stocks(per 100 shares)
US Options(per contract)
European Stocks(per 100 shares)
$0.31
$0.62
€-1.39
$0.41
$0.24
€1.76
Low cost andbest execution
Rates were obtained on February 1, 2013.[1] For additional information regarding commissions and margin loan rates, see www.interactivebrokers.com/compare. IB calculates the interest charged on
margin loans using the applicable rates for each interest rate tier and currency listed on its website. For additional information on margin loan rates, seewww.interactivebrokers.com/interest
[2] For additional information on best price execution see www.interactivebrokers.com/bestexecution
* Based on independent measurements, the Transaction Auditing Group, Inc. (TAG),a third-party provider of transaction analysis, has determined that Interactive Brokers’ US stock and options price executions were significantly better than the industry2 during the second half of 2012.
Net Dollar Price Improvementvs. National Best Bid/Offer2
Significantly better than the industry as a whole for the second half of 2012.
Source: The Transaction Auditing Group, Inc. (TAG), a third-party provider of transaction analysis.
Our commissions and margin rates are among the lowest in the industry1. This distinction, combined with IB SmartRoutingSM which achieves the industry’s best execution, gives our customers a clear advantage.
32105text.indd 6 3/9/13 12:53 PM

% Profit % LossTotal
AccountsSpread
MarkupsQ4 2012
Percentage of profitable and unprofitable accounts as reported to the NFA
Interactive Brokers Broker 1
Broker 2 Broker 3
46.5%
43.0%
40.5%
36.0%
53.5%
57.0%
59.5%
64.0%
16,712
610
21,704
10,566
NO3
YES
YES
YES
The same philosophy and technology that enabled our clients to achieve superior forex trading results also drives our clients’ trading and investing of stocks, options, futures and bonds worldwide.
We have always strived to offer the best price execution and lowest trading and financing costs so our customers can realize more profits.
“ “
– Thomas Peterffy, CEO
Lower investment costs will increase your overall return on investment, but lower costs do not guarantee that your investment will be profitable. Supporting documentation for any claims and statistical information will be provided upon request. [3] Interactive Brokers charges a discrete commission of 0.2 basis points * Trade Value with a USD 2.50 minimum. There is a substantial risk of loss in foreign exchange trading. The settlement date of foreign exchange trades can vary due to time zone differences and bank holidays. When trading across foreign exchange markets, this may necessitate borrowing funds to settle foreign exchange trades. The interest rate on borrowed funds must be considered when computing the cost of trades across multiple markets.
Data provided by forexmagnates.com, includes the impact of any commissions
Interactive Brokers’ Customers Top Forex Trading Results
32105text.indd 7 3/7/13 2:04 PM

A global platform…
IB Office Locations
IB ElectronicMarket Access
We have a substantial head start in building the world’s largest and most globally diverse trading platform. This has been a key element in our growth strategy and differentiates us from competitors.
32105text.indd 8 3/5/13 1:46 PM

Accounts by Region
Europe & Africa27%
Asia-Pacific & Middle East18%
Other10%
U.S.45%
Customer Segments1
Individualtraders
andinvestors
41%Proprietary trading groups
16%
Introducing brokers
11%
Hedge and mutual funds
6%
Financialadvisors
26%
… serving a diversified customer baseOur customers reside in over 170 countries and institutional accounts are our fastest growing segment.
[1] Customer equity at December 31, 2012.
32105text.indd 9 3/5/13 1:46 PM

Award Winning Technology
• Best Trading Experience & Technology
• Best for International Traders
• Best Range of Offerings
• Best for Frequent Traders
Wall Street Letter 2012
Institutional Trading Awards
• Best Use of Technology Broker-Dealer
• Best Broker-Dealer Options
Rated - Best Online Broker
by 2012
• Best Portfolio Analysis & Reports
• Low Cost for the 8th consecutive year
• Best Overall
Recognized as an industry leader
32105text.indd 10 3/5/13 1:46 PM

2012 Technology Enhancements
Mobile Trading AssistantOur powerful servers simultaneously monitor global market action, account performance, and the performance of each of your positions, and proactively inform you of significant developments in real time.
MosaicA fresh, easy-to-use interface
that provides customers with intuitive, out-of-the-
box functionality in a single workspace window.
IB Money Manager MarketplaceThe first electronic meeting place for Wealth and Money Manager advisors. Money Managers with expertise in investing and trading post their credentials and Wealth Managers search IB’s database and contact Money Managers.
Continuously enhancing the value of our trading technology and customer experience
TradingAssistant
WorldMarkets
AccountPerformance
PositionPerformance
32105text.indd 11 3/5/13 1:46 PM

Since our inception, we have focused on developing
sophisticated trading software that can navigate the
world’s markets at top speeds and seek out the best
pricing, and deliver this technology to our customers in a
single, powerful platform.
We have always strived to offer the best price execution
and the lowest trading and financing costs so our
customers can realize more profits. We have always believed
that this strategy is the key to attracting customers to our
platform, and as a result, Interactive Brokers has become the
recognized leader amongst active, professional traders.
32105text.indd 12 3/5/13 1:46 PM

Interactive Brokers Group, Inc. 2012 Financial Information
Form 10-K

(This page has been left blank intentionally.)
UNITED STATESSECURITIES AND EXCHANGE COMMISSION
Washington, D.C. 20549
FORM 10-KANNUAL REPORT PURSUANT TO SECTION 13 OR 15(d) OF THE
SECURITIES EXCHANGE ACT OF 1934For the year ended December 31, 2012
Commission File Number: 001-33440
INTERACTIVE BROKERS GROUP, INC.(Exact name of registrant as specified in its charter)
Delaware 30-0390693(State or other jurisdiction (I.R.S. Employer
of incorporation or organization) Identification No.)One Pickwick Plaza
Greenwich, Connecticut 06830(Address of principal executive office)
(203) 618-5800(Registrant’s telephone number, including area code)
Securities registered pursuant to Section 12(b) of the Act:Title of each class Name of the each exchange on which registered
Common Stock, par value $.01 per share The NASDAQ Stock Market LLC(NASDAQ Global Select Market)
Securities registered pursuant to Section 12(g) of the Act: None
Indicate by check mark whether the registrant is a well-known seasoned issuer, as defined in Rule 405 of thesecurities act. Yes � No �.
Indicate by check mark whether the registrant is not required to file reports pursuant to Section 13 or 15(d) of theact. Yes � No �.
Indicate by check mark whether the registrant (1) has filed all reports required to be filed by Section 13 or 15(d) ofthe Securities Exchange Act of 1934 during the preceding 12 months (or for such shorter period that the registrant wasrequired to file such reports), and (2) has been subject to such filing requirements for the past 90 days. Yes � No �.
Indicate by check mark if disclosure of delinquent filers pursuant to Item 405 of Regulation S-K is not containedherein, and will not be contained, to the best of registrant’s knowledge, in definitive proxy or information statementsincorporated by reference in Part III of this Form 10-K or any amendment to this Form 10-K. �
Indicate by check mark whether the registrant has submitted electronically and posted on its corporate Web site, ifany, every Interactive Data File required to be submitted and posted pursuant to Rule 405 of Regulation S-T during thepreceding 12 months (or for such shorter period that the registrant was required to submit and post such files).Yes � No �
Indicate by check mark whether the registrant is a large accelerated filer, an accelerated filer, a non-acceleratedfiler, or a smaller reporting company. See the definitions of ‘‘large accelerated filer,’’ ‘‘accelerated filer’’ and ‘‘smallerreporting company’’ in Rule 12b-2 of the Exchange Act. (Check one):
Large accelerated filer � Accelerated filer � Non-accelerated filer � Smaller reporting company �(Do not check if a
smaller reporting company)
Indicate by check mark whether the registrant is a shell company (as defined in Rule 12b-2 of the Exchange Act).Yes � No �.
The aggregate market value of the voting and non-voting common equity stock held by non-affiliates of theregistrant was approximately $699,028,556 computed by reference to the $14.72 closing sale price of the common stockon the NASDAQ Global Select Market, on June 29, 2012, the last business day of the registrant’s most recentlycompleted second fiscal quarter.
As of March 1, 2013, there were 47,499,739 shares of the issuer’s Class A common stock, par value $0.01 per share,outstanding and 100 shares of the issuer’s Class B common stock, par value $0.01 per share, outstanding.
Documents Incorporated by Reference: Portions of Registrant’s definitive proxy statement for its 2012 annualmeeting of shareholders are incorporated by reference in Part III of this Form 10-K.

(This page has been left blank intentionally.)
ANNUAL REPORT ON FORM 10-K FOR THE YEAR ENDED DECEMBER 31, 2012Table of Contents
Cautionary Note Regarding Forward Looking Statements . . . . . . . . . . . . . . . . . . . . . . . . . . . . . . 1PART IITEM 1. Business . . . . . . . . . . . . . . . . . . . . . . . . . . . . . . . . . . . . . . . . . . . . . . . . . . . . 2ITEM 1A. Risk Factors . . . . . . . . . . . . . . . . . . . . . . . . . . . . . . . . . . . . . . . . . . . . . . . . . 21ITEM 1B. Unresolved Staff Comments . . . . . . . . . . . . . . . . . . . . . . . . . . . . . . . . . . . . . 35ITEM 2. Properties . . . . . . . . . . . . . . . . . . . . . . . . . . . . . . . . . . . . . . . . . . . . . . . . . . . 35ITEM 3. Legal Proceedings and Regulatory Matters . . . . . . . . . . . . . . . . . . . . . . . . . . . 35ITEM 4. Mine Safety Disclosures . . . . . . . . . . . . . . . . . . . . . . . . . . . . . . . . . . . . . . . . 36PART IIITEM 5. Market for Registrant’s Common Equity, Related Stockholder Matters and
Issuer Purchases of Equity Securities . . . . . . . . . . . . . . . . . . . . . . . . . . . . . 37ITEM 6. Selected Financial Data . . . . . . . . . . . . . . . . . . . . . . . . . . . . . . . . . . . . . . . . . 40ITEM 7. Management’s Discussion and Analysis of Financial Condition and Results of
Operations . . . . . . . . . . . . . . . . . . . . . . . . . . . . . . . . . . . . . . . . . . . . . . . . 44ITEM 7A. Quantitative and Qualitative Disclosures about Market Risk . . . . . . . . . . . . . . 79ITEM 8. Financial Statements and Supplementary Data . . . . . . . . . . . . . . . . . . . . . . . . 83ITEM 9. Changes in and Disagreements with Accountants on Accounting and Financial
Disclosure . . . . . . . . . . . . . . . . . . . . . . . . . . . . . . . . . . . . . . . . . . . . . . . . . 128ITEM 9A. Controls and Procedures . . . . . . . . . . . . . . . . . . . . . . . . . . . . . . . . . . . . . . . . 128ITEM 9B. Other Information . . . . . . . . . . . . . . . . . . . . . . . . . . . . . . . . . . . . . . . . . . . . 133PART IIIITEM 10. Directors, Executive Officers and Corporate Governance . . . . . . . . . . . . . . . . 133ITEM 11. Executive Compensation . . . . . . . . . . . . . . . . . . . . . . . . . . . . . . . . . . . . . . . . 133ITEM 12. Security Ownership of Certain Beneficial Owners and Management and
Related Stockholder Matters . . . . . . . . . . . . . . . . . . . . . . . . . . . . . . . . . . . 133ITEM 13. Transactions with Related Persons, Promoters and Certain Control Persons . . . 133ITEM 14. Principal Accountant Fees and Services . . . . . . . . . . . . . . . . . . . . . . . . . . . . . 133PART IVITEM 15. Exhibits and Financial Statement Schedules . . . . . . . . . . . . . . . . . . . . . . . . . . 134ITEMS 15 (a)(1) Index to Financial Statements and Financial Statement Schedule . . . . . . . . . . . 136
and 15 (a)(2)SIGNATURES
i

(This page has been left blank intentionally.)
CAUTIONARY NOTE REGARDING FORWARD-LOOKING STATEMENTS
We have included or incorporated by reference in this Annual Report on Form 10-K, and fromtime to time our management may make statements that may constitute ‘‘forward-looking statements’’within the meaning of the safe harbor provisions of the Private Securities Litigation Reform Act of1995. Forward-looking statements are not historical facts, but instead represent only our beliefsregarding future events, many of which, by their nature, are inherently uncertain and outside ourcontrol. These statements include statements other than historical information or statements of currentcondition and may relate to our future plans and objectives and results, among other things, and mayalso include our belief regarding the effect of various legal proceedings, as set forth under ‘‘LegalProceedings’’ in Part I, Item 3 of this Annual Report on Form 10-K, as well as statements about theobjectives and effectiveness of our liquidity policies, statements about trends in or growth opportunitiesfor our businesses, in ‘‘Management’s Discussion and Analysis of Financial Condition and Results ofOperations’’ in Part II, Item 7 of this Annual Report on Form 10-K. By identifying these statements foryou in this manner, we are alerting you to the possibility that our actual results may differ, possiblymaterially, from the anticipated results indicated in these forward-looking statements. Important factorsthat could cause actual results to differ from those in the forward-looking statements include, amongothers, those discussed below and under ‘‘Risk Factors’’ in Part I, Item 1A of this Annual Report onForm 10-K and ‘‘Management’s Discussion and Analysis of Financial Condition and Results ofOperations’’ in Part II, Item 7 of this Annual Report on Form 10-K.
Factors that could cause actual results to differ materially from any future results, expressed orimplied, in these forward-looking statements include, but are not limited to, the following:
• general economic conditions in the markets where we operate;
• increased industry competition and downward pressures on bid/offer spreads and electronicbrokerage commissions;
• risks inherent to the electronic market making and brokerage businesses;
• implied versus actual price volatility levels of the products in which we make markets;
• the general level of interest rates;
• failure to protect or enforce our intellectual property rights in our proprietary technology;
• our ability to keep up with rapid technological change;
• system failures and disruptions;
• non-performance of third-party vendors;
• conflicts of interest and other risks due to our ownership and holding company structure;
• the loss of key executives and failure to recruit and retain qualified personnel;
• the risks associated with the expansion of our business;
• our possible inability to integrate any businesses we acquire;
• compliance with laws and regulations, including those relating to the securities industry; and
• other factors discussed under ‘‘Risk Factors’’ in Part I, Item 1A of this Annual Report onForm 10-K or elsewhere in this Annual Report on Form 10-K.
We undertake no obligation to publicly update or revise any forward-looking statements to reflectevents or circumstances that may arise after the date of this Annual Report on Form 10-K.
1

PART I
ITEM 1. BUSINESS
Overview
Interactive Brokers Group, Inc. (‘‘IBG, Inc.’’ or the ‘‘Company’’) is an automated global electronicbroker and market maker specializing in routing orders and executing and processing trades insecurities, futures, foreign exchange instruments, bonds and mutual funds on more than 100 electronicexchanges and trading venues around the world. In the U.S., our business is conducted from ourheadquarters in Greenwich, Connecticut, Chicago, Illinois and Jersey City, New Jersey. Abroad, weconduct business through offices located in Canada, England, Switzerland, Hong Kong, India, Australiaand Japan. At December 31, 2012 we had 891 employees worldwide.
IBG, Inc. is a holding company and our primary assets are our ownership of approximately 11.9%of the membership interests of IBG LLC (the ‘‘Group’’), the current holding company for ourbusinesses. We are the sole managing member of IBG LLC. On May 3, 2007, IBG, Inc. priced its initialpublic offering (the ‘‘IPO’’) of shares of common stock. In connection with the IPO, IBG, Inc.purchased 10.0% of the membership interests in IBG LLC and began to consolidate IBG LLC’sfinancial results into its financial statements. When we use the terms ‘‘we,’’ ‘‘us,’’ and ‘‘our,’’ we meanIBG LLC and its subsidiaries for periods prior to the IPO, and IBG, Inc. and its subsidiaries (includingIBG LLC) for periods from and after the IPO. Unless otherwise indicated, the term ‘‘common stock’’refers to the Class A common stock of IBG, Inc.
We are a successor to the market making business founded by our Chairman and Chief ExecutiveOfficer, Thomas Peterffy, on the floor of the American Stock Exchange in 1977. Since our inception,we have focused on developing proprietary software to automate broker-dealer functions. During thattime, we have been a pioneer in developing and applying technology as a financial intermediary toincrease liquidity and transparency in the capital markets in which we operate. The advent of electronicexchanges in the last 22 years has provided us with the opportunity to integrate our software with anincreasing number of exchanges and trading venues into one automatically functioning, computerizedplatform that requires minimal human intervention. Three decades of developing our automatedmarket making platform and our automation of many middle and back office functions has allowed usto become one of the lowest cost providers of broker- dealer services and significantly increase thevolume of trades we handle.
Our activities are divided into two principal business segments: (1) electronic brokerage and(2) market making:
• As a direct market access broker, we serve the customers of both traditional brokers and primebrokers. We provide our customers with an advanced order management, trade execution andportfolio management platform at a very low cost. Our customers can simultaneously accessdifferent financial markets worldwide and trade across multiple asset classes (stocks, options,futures, foreign exchange (‘‘forex’’), bonds and mutual funds) denominated in 21 differentcurrencies, on one screen, from a single account based in any major currency. Our large bankand broker-dealer customers may ‘‘white label’’ our trading interface (i.e., make our tradinginterface available to their customers without referencing our name), or can select from amongour modular functionalities, such as order routing, trade reporting or clearing on specificproducts or exchanges where they may not have up-to-date technology, to offer their customersa complete global range of services and products. During the fourth quarter of 2011, weintroduced the Interactive Brokers Information System (‘‘IBIS’’). IBIS is a comprehensive andcustomizable market information workspace, which provides subscribers with real-time marketdata, research, analytics, stock scanners, charts and alerts. To provide greater value to our
2

customers we decided to make IBIS available to all of our existing customers free of charge thispast year.
• As a market maker, we provide continuous bid and offer quotations on over 867,000 securitiesand futures products listed on electronic exchanges around the world. Our quotes are driven byproprietary mathematical models that assimilate market data and reevaluate our outstandingquotes each second. Unlike firms that trade over-the-counter (‘‘OTC’’) derivative products, ourbusiness creates liquidity and transparency on electronic exchanges.
Our electronic brokerage and market making businesses are complementary. Both benefit from ourcombined scale and volume, as well as from our proprietary technology. Our brokerage customersbenefit from the technology and market structure expertise developed in our market making business.The expense of developing and maintaining our unique technology, clearing, settlement, banking andregulatory structure required by any specific exchange or market center is shared by both of ourbusinesses. This, in turn, enables us to provide lower transaction costs to our customers than ourcompetitors, whether they use our services as a broker, market maker or both. In addition, we believewe gain a competitive advantage by applying the software features we have developed for a specificproduct or market to newly-introduced products and markets over others who may have less automatedfacilities in one or both of our businesses or who operate only in a subset of the exchanges and marketcenters on which we operate. Our trading system contains unique architectural aspects that, togetherwith our massive trading volume in markets worldwide, may impose a significant barrier to entry forfirms wishing to compete in our specific businesses and permit us to compete favorably against ourcompetitors.
Our internet address is www.interactivebrokers.com and the investor relations section of our website is located at www.interactivebrokers.com/ir. We make available free of charge, on or through theinvestor relations section of our web site, this Annual Report on Form 10-K, Quarterly Reports onForm 10-Q, related Interactive Data exhibits, Current Reports on Form 8-K and amendments to thosereports filed or furnished pursuant to Section 13(a) or 15(d) of the Securities Exchange Act of 1934, aswell as proxy statements, as soon as reasonably practicable after we electronically file such materialwith, or furnish it to, the U.S. Securities and Exchange Commission (‘‘SEC’’). Also posted on our website are our Bylaws, our Amended and Restated Certificate of Incorporation, charters for the AuditCommittee, Compensation Committee and Nominating and Corporate Governance Committee of ourboard of directors, our Accounting Matters Complaint Policy, our Whistle Blower Hotline, ourCorporate Governance Guidelines and our Code of Business Conduct and Ethics governing ourdirectors, officers and employees. Within the time periods required by SEC and the NASDAQ StockMarket (‘‘NASDAQ’’), we will post on our web site any amendment to the Code of Business Conductand Ethics and any waiver applicable to any executive officer, director or senior financial officer. Inaddition, our web site includes information concerning purchases and sales of our equity securities byour executive officers and directors, as well as disclosure relating to certain non-GAAP financialmeasures (as defined in Regulation G) promulgated under the Securities Act of 1933, as amended (the‘‘Securities Act’’) and the Securities Exchange Act of 1934, as amended (the ‘‘Exchange Act’’) that wemay make public orally, telephonically, by webcast, by broadcast or by similar means from time to time.
Our Investor Relations Department can be contacted at Interactive Brokers Group, Inc., EightGreenwich Office Park, Greenwich, Connecticut 06831, Attn: Investor Relations, telephone:203-618-4070, e-mail: [email protected].
3
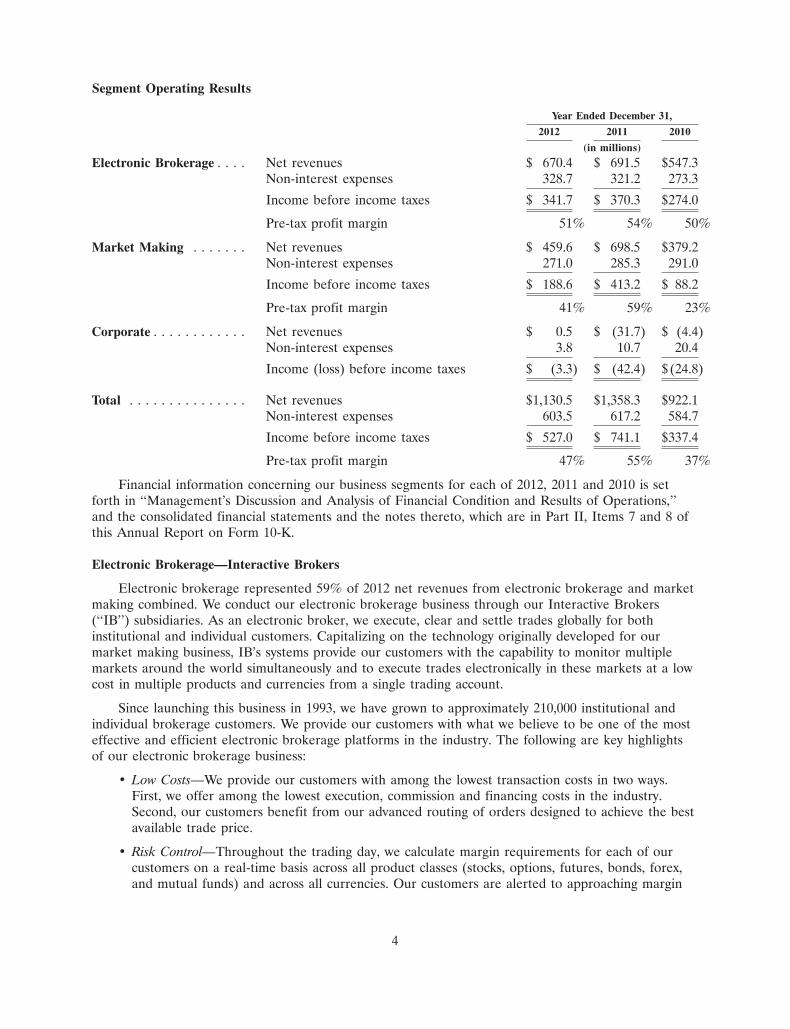
Segment Operating Results
Year Ended December 31,
2012 2011 2010
(in millions)
Electronic Brokerage . . . . Net revenues $ 670.4 $ 691.5 $547.3Non-interest expenses 328.7 321.2 273.3
Income before income taxes $ 341.7 $ 370.3 $274.0
Pre-tax profit margin 51% 54% 50%
Market Making . . . . . . . Net revenues $ 459.6 $ 698.5 $379.2Non-interest expenses 271.0 285.3 291.0
Income before income taxes $ 188.6 $ 413.2 $ 88.2
Pre-tax profit margin 41% 59% 23%
Corporate . . . . . . . . . . . . Net revenues $ 0.5 $ (31.7) $ (4.4)Non-interest expenses 3.8 10.7 20.4
Income (loss) before income taxes $ (3.3) $ (42.4) $(24.8)
Total . . . . . . . . . . . . . . . Net revenues $1,130.5 $1,358.3 $922.1Non-interest expenses 603.5 617.2 584.7
Income before income taxes $ 527.0 $ 741.1 $337.4
Pre-tax profit margin 47% 55% 37%
Financial information concerning our business segments for each of 2012, 2011 and 2010 is setforth in ‘‘Management’s Discussion and Analysis of Financial Condition and Results of Operations,’’and the consolidated financial statements and the notes thereto, which are in Part II, Items 7 and 8 ofthis Annual Report on Form 10-K.
Electronic Brokerage—Interactive Brokers
Electronic brokerage represented 59% of 2012 net revenues from electronic brokerage and marketmaking combined. We conduct our electronic brokerage business through our Interactive Brokers(‘‘IB’’) subsidiaries. As an electronic broker, we execute, clear and settle trades globally for bothinstitutional and individual customers. Capitalizing on the technology originally developed for ourmarket making business, IB’s systems provide our customers with the capability to monitor multiplemarkets around the world simultaneously and to execute trades electronically in these markets at a lowcost in multiple products and currencies from a single trading account.
Since launching this business in 1993, we have grown to approximately 210,000 institutional andindividual brokerage customers. We provide our customers with what we believe to be one of the mosteffective and efficient electronic brokerage platforms in the industry. The following are key highlightsof our electronic brokerage business:
• Low Costs—We provide our customers with among the lowest transaction costs in two ways.First, we offer among the lowest execution, commission and financing costs in the industry.Second, our customers benefit from our advanced routing of orders designed to achieve the bestavailable trade price.
• Risk Control—Throughout the trading day, we calculate margin requirements for each of ourcustomers on a real-time basis across all product classes (stocks, options, futures, bonds, forex,and mutual funds) and across all currencies. Our customers are alerted to approaching margin
4

violations and if a customer’s equity falls below what is required to support that customer’smargin, we automatically liquidate positions on a real-time basis to bring the customer’s accountinto margin compliance. This is done to protect IB, as well as the customer, from excessivelosses.
• IB Universal AccountSM—From a single point of entry in one IB Universal AccountSM ourcustomers are able to trade products denominated in 21 currencies, across multiple classes oftradable, exchange-listed products, including stocks, options, futures, bonds, forex and mutualfunds traded on more than 100 exchanges and market centers and in 20 countries around theworld seamlessly. We continue to grow our subsidiaries in India and Japan and ourrepresentative office in Shanghai, China. In the United Kingdom, we became a carrying broker,supporting customer trading in gold, silver and Contracts for Differences (‘‘CFDs’’), in 2011.
• IB SmartRoutingSM—Our customers benefit from our advanced order routing. IB SmartRoutingSM
retains control of the customer’s order, continuously searches for the best available price and,unlike most other routers, dynamically routes and re-routes all or parts of a customer’s order toachieve optimal execution and among the lowest execution and commission costs in the industry.To highlight the quality of our price executions, we publish on our website independentmeasurements performed by a third party provider of transaction analysis to illustrate IB’s netprice improvement versus the industry.
• Flexible and Customizable System—Our platform is designed to provide an efficient customerexperience, beginning with a highly automated account opening process and ending with a fasttrade execution, with real-time position monitoring. Our sophisticated interface providesinteractive real-time views of account balances, positions, profits or losses, buying power and‘‘what-if’’ scenarios to enable our customers to more easily make informed investment decisionsand trade efficiently. Our system is configured to remember the user’s preferences and isspecifically designed for multi-screen systems. When away from their main workstations,customers are able to access their accounts through our IB WebTraderSM or MobileTraderinterfaces.
• Interactive AnalyticsSM and IB Options AnalyticsSM—We offer our customers state-of-the-art tools,which include a customizable trading platform, advanced analytic tools and sophisticated ordertypes such as guaranteed combination trades. IB also provides real-time option analytics, anarbitrage meter (a tool that illustrates the extent of the premium (or discount) of the leadmonth futures price above (or below) its fair future value with respect to the index price) andvarious combinations of charts and other analytical tools.
• IB Risk NavigatorSM—We offer free to all customers our real-time market risk managementplatform that unifies exposure across multiple asset classes around the globe. The system iscapable of identifying overexposure to risk by starting at the portfolio level and drilling downinto successively greater detail within multiple report views. Report data is updated every tenseconds or upon changes to portfolio composition. Predefined reports allow the summarizationof a portfolio from different risk perspectives, and allow views of Exposure, Value at Risk(‘‘VaR’’), Delta, Gamma, Vega and Theta, profit and loss and position quantity measures for thedifferent portfolio views. The system also offers the customer the ability to modify positionsthrough ‘‘what-if’’ scenarios that show hypothetical changes to the risk summary.
• White Labeling—Our large bank and broker-dealer customers may ‘‘white label’’ our tradinginterface or can select from among our modular functionalities, such as order routing, tradereporting or clearing, on specific products or exchanges where they may not have up-to-datetechnology, in order to offer to their customers a complete global range of services andproducts.
5

• Interactive Brokers Information System—The Interactive Brokers Information System is acomprehensive and customizable market information workspace. Subscribers to this researchplatform receive real-time market data, research, news services, analytics, stock scanners, chartsand alerts.
• Stock Yield Enhancement Program—This program allows our customers to lend their fully-paidstock shares to IB in exchange for cash collateral. In turn, IB lends these stocks in exchange forcollateral and earns stock lending fees. Customers receive 50% of the fees collected fromlending their stocks. This allows customers holding fully-paid, long stock positions to enhancetheir returns.
• Money Manager Marketplace—This program is the first electronic meeting place that bringstogether wealth managers and money management advisors. Wealth managers, who focus ongathering client assets, can seek out money managers who have trading expertise in various assetclasses and markets. Existing IB professional advisors can log into our account managementsystem and view participating money managers and relevant information, make contact, linkaccounts and specify amounts for trading. And Money Managers who advertise their expertise inthe marketplace can focus on trading, but gain access to a large pool of potential new clients byletting Wealth Advisors take care of client marketing and relationships.
IB provides its customers with high-speed trade execution at low commission rates, in large partbecause it utilizes the backbone technology developed for Timber Hill’s market making operations. Asa result of our advanced electronic brokerage platform, IB attracts sophisticated and active investors.No single customer represents more than 1% of our commissions and execution fees.
Market Making—Timber Hill
Market making represented 41% of 2012 net revenues from electronic brokerage and marketmaking combined. We conduct our market making business through our Timber Hill (‘‘TH’’)subsidiaries. As one of the largest market makers on many of the world’s leading electronic exchanges,we provide liquidity by offering competitively tight bid/offer spreads over a broad base of over867,000 tradable, exchange-listed products, including equity derivative products, equity index derivativeproducts, equity securities and futures. As principal, we commit our own capital and derive revenues orincur losses from the difference between the price paid when securities are bought and the pricereceived when those securities are sold. Historically, our profits have been principally a function oftransaction volume and price volatility of electronic exchange-traded products rather than the directionof price movements. Other factors, including the ratio of actual to implied volatility and shifts inforeign currency exchange rates, can also have a meaningful impact on our results, as described furtherin ‘‘Business Environment’’ in Part II, Item 7 of this Annual Report on Form 10-K.
Our strategy is to calculate quotes at which supply and demand for a particular security are likelyto be in balance a few seconds ahead of the market and execute small trades at tiny but favorabledifferentials. Because we provide continuous bid and offer quotations and we are continuously bothbuying and selling quoted securities, we may have either a long or a short position in a particularproduct at a given point in time. As a matter of practice, we will generally not take portfolio positionsin either the broad market or the financial instruments of specific issuers in anticipation that prices willeither rise or fall. Our entire portfolio is evaluated each second and continuously rebalancedthroughout the trading day, thus minimizing the risk of our portfolio at all times. This real-timerebalancing of our portfolio, together with our real-time proprietary risk management system, enablesus to curtail risk and to be profitable in both up-market and down-market scenarios. Our quotes arebased on our proprietary model rather than customer order flow, and we believe that this approachprovides us with a competitive advantage.
6

We are a market leader in exchange-traded equity options and equity-index options and futures.Together with our electronic brokerage customers, in 2012 we accounted for approximately 9.7% ofexchange-listed equity options traded worldwide and approximately 13.3% of exchange-listed equityoptions volume traded on those markets in which we actively trade, according to data received fromexchanges worldwide. Our ability to make markets in such a large number of exchanges and marketcenters simultaneously around the world is one of our core strengths and has contributed to the largevolumes in our market making business. We engage in market making operations in North and SouthAmerica, Europe and in the Asia/Pacific regions as described below.
North and South American Market Making Activities. Our U.S. market making activities areconducted through Timber Hill LLC (‘‘TH LLC’’), a SEC-registered securities broker-dealer thatconducts market making in equity derivative products, equity index derivative products and equitysecurities. Since its inception in 1982, TH LLC has grown to become one of the largest listed optionsmarket makers in the United States. As of December 31, 2012, TH LLC held specialist, primary marketmaker or lead market maker designations in options on approximately 1,190 underlying securities listedin the United States. TH LLC is a member of the Boston Options Exchange, BATS exchange, ChicagoBoard Options Exchange, Chicago Mercantile Exchange, Chicago Board of Trade, InternationalSecurities Exchange, NYSE AMEX Options Exchange, NYSE Arca, OneChicago, NASDAQ OMXPHLX and the New York Mercantile Exchange. TH LLC also conducts market making activities inMexico at the MEXDER and the Mexican Stock Exchange and in Brazil at the Sao Paulo StockExchange and the Brazilian Mercantile and Futures Exchange. We conduct market making activities inCanada through our Canadian subsidiary, Timber Hill Canada Company (‘‘THC’’) at the Toronto StockExchange and Montreal Exchange. In addition, we participate in stock trading at the notable ElectronicCommunications Networks (‘‘ECNs’’) in both the U.S. and Canada.
European, Asian, and Australian Market Making Activities. Our European, Asian, and Australianmarket making subsidiaries, primarily Timber Hill Europe AG (‘‘THE’’), conduct operations in20 countries, comprising the major securities markets in these regions.
We began our market making operations in Europe in 1990. In Germany and Switzerland, we havebeen among the largest equity options market makers in terms of volume on Eurex, one of the world’slargest futures and options exchanges, which is jointly operated by Deutsche Borse AG and SIX SwissExchange. We have also been active in trading German stocks and warrants as a member of XETRA,the German electronic stock trading system, and the Frankfurt and Stuttgart stock exchanges; and inSwitzerland as a member of the SIX Swiss Exchange. Our other European operations are conducted onthe London Stock Exchange; the Weiner Borse AG; the Copenhagen Stock Exchange; the HelsinkiStock Exchange; the NYSE Euronext exchanges in Amsterdam, Paris, Brussels and London; NASDAQOMX Nordic in Sweden, Finland and Denmark; the Swedish Stock Exchange; the MEFF and Bolsa deValores Madrid in Spain; the IDEM and Borsa Valori de Milano in Milan; and the OTOB in Vienna.
Since 1995, we have conducted market making operations in Hong Kong. Our Hong Kongsubsidiary, Timber Hill Securities Hong Kong Ltd (‘‘THSHK’’), is a member of the cash and derivativesmarkets of the Hong Kong Exchanges. Since 1997, we have conducted operations in Australia. OurAustralian subsidiary, Timber Hill Australia Pty Ltd (‘‘THA’’), is a member of the Australian StockExchange, and routes orders for its trading on the Sydney Futures Exchange through its affiliate,Interactive Brokers LLC. We commenced trading in Japan during 2002, Korea and Singapore during2004 and Taiwan in 2007. In 2008, we began our market making operation in India through oursubsidiary, Interactive Brokers (India) Private Limited (‘‘IBI’’), which is a member of the NationalStock Exchange of India and the Bombay Stock Exchange.
Most of the above trading activities take place on exchanges and all securities and commoditiesthat we trade are cleared by exchange owned or authorized clearing houses.
7

Technology
Our proprietary technology is the key to our success. We built our business on the belief that afully computerized market making system that could integrate pricing and risk exposure informationquickly and continuously would enable us to make markets profitably in many different financialinstruments simultaneously. We believe that integrating our system with electronic exchanges andmarket centers results in transparency, liquidity and efficiencies of scale. Together with the IBSmartRoutingSM system and our low commissions, this reduces overall transaction costs to ourcustomers and, in turn, increases our transaction volume and profits. Over the past 35 years, we havedeveloped an integrated trading system and communications network and have positioned our companyas an efficient conduit for the global flow of risk capital across asset and product classes on electronicexchanges around the world, permitting us to have one of the lowest cost structures in the industry. Webelieve that developing, maintaining and continuing to enhance our proprietary technology provides usand our customers with the competitive advantage of being able to adapt quickly to the changingenvironment of our industry and to take advantage of opportunities presented by new exchanges,products or regulatory changes before our competitors.
The quotes that we provide as market makers are driven by proprietary mathematical models thatassimilate market data and re-evaluate our outstanding quotes each second. Because our technologyinfrastructure enables us to process large volumes of pricing and risk exposure information rapidly, weare able to make markets profitably in securities with relatively low spreads between bid and offerprices. As market makers, we must ensure that our interfaces connect effectively and efficiently witheach exchange and market center where we make markets and that they are in complete conformitywith all the applicable rules of each local venue. Utilizing up-to-date computer and telecommunicationssystems, we transmit continually updated pricing information directly to exchange computer devices andreceive trade and quote information for immediate processing by our systems. As a result, we are ableto maintain more effective control over our exposure to price and volatility movements on a real-timebasis than many of our competitors. This is important, not only because our system must process, clearand settle several hundred thousand market maker trades per day with a minimal number of errors, butalso because the system monitors and manages the risk on the entire portfolio, which generally consistsof more than fifteen million open contracts distributed among more than 200,000 different products.Using our system, which we believe affords an optimal interplay of decentralized trading activity andcentralized risk management, we quote markets in over 867,000 securities and futures products tradedaround the world.
In our electronic brokerage business, our proprietary technology infrastructure enables us toprovide our customers with the ability to execute trades at among the lowest commission costs in theindustry. Additionally, our customers benefit from real-time systems optimization for our marketmaking business. Customer trades are both automatically captured and reported in real time in oursystem. Our customers trade on more than 100 exchanges and market centers in 20 countries aroundthe world. All of these exchanges are partially or fully electronic, meaning that a customer can buy orsell a product traded on that exchange via an electronic link from his or her computer terminal throughour system to the exchange. We offer our products and services through a global communicationsnetwork that is designed to provide secure, reliable and timely access to the most current marketinformation. We provide our customers with a variety of means to connect to our brokerage systems,including dedicated point-to-point data lines, virtual private networks and the Internet.
Specifically, our customers receive worldwide electronic access connectivity through our TraderWorkstation (our real-time Java-based trading platform), our proprietary Application ProgrammingInterface (‘‘API’’), and/or industry standard Financial Information Exchange (‘‘FIX’’) connectivity.Customers who want a professional quality trading application with a sophisticated user interface utilizeour Trader Workstation. Customers interested in developing program trading applications in MS-Excel,
8

Java, Visual Basic or C++ utilize our API. Large institutions with FIX infrastructure prefer to use ourFIX solution for seamless integration of their existing order gathering and reporting applications.
While many brokerages, including online brokerages, rely on manual procedures to execute manyday-to-day functions, IB employs proprietary technology to automate, or otherwise facilitate, many ofthe following functions:
• account opening process;
• order routing and best execution;
• seamless trading across all types of securities and currencies around the world from one account;
• order types and analytical tools offered to customers;
• delivery of customer information, such as confirmations, customizable real-time accountstatements and audit trails;
• customer service; and
• risk management through automated real-time credit management of all new orders and marginmonitoring.
Research and Development
One of our core strengths is our expertise in the rapid development and deployment of automatedtechnology for the financial markets. Our core software technology is developed internally, and we donot generally rely on outside vendors for software development or maintenance. To achieve optimalperformance from our systems, we are continuously rewriting and upgrading our software. Use of thebest available technology not only improves our performance but also helps us attract and retaintalented developers. Our software development costs are low because the employees who oversee thedevelopment of the software are the same employees who design the application and evaluate itsperformance. This also enables us to add features and further refine our software rapidly.
Our internally-developed, fully integrated trading and risk management systems are unique andtransact across all product classes on more than 100 markets and in 23 currencies around the world.These systems have the flexibility to assimilate new exchanges and new product classes withoutcompromising transaction speed or fault tolerance. Fault tolerance, or the ability to maintain systemperformance despite exchange malfunctions or hardware failures, is crucial to successful market makingand ensuring best executions for brokerage customers. Our systems are designed to detect exchangemalfunctions and quickly take corrective actions by re-routing pending orders.
Our company is technology-focused, and our management team is hands-on and technology-savvy.Most members of the management team write detailed program specifications for new applications.The development queue is prioritized and highly disciplined. Progress on programming initiatives isgenerally tracked on a weekly basis by a steering committee consisting of senior executives. Thisenables us to prioritize key initiatives and achieve rapid results. All new business starts as a softwaredevelopment project. We generally do not engage in any business that we cannot automate andincorporate into our platform prior to entering into the business.
The rapid software development and deployment cycle is achieved by our ability to leverage ahighly integrated, object oriented development environment. The software code is modular, with eachobject providing a specific function and being reusable in multiple applications. New software releasesare tracked and tested with proprietary automated testing tools. We are not hindered by disparate andoften limiting legacy systems assembled through acquisitions. Virtually all of our software has beendeveloped and maintained with a unified purpose.
9

For over 35 years, we have built and continuously refined our automated and integrated, real-timesystems for world-wide trading, risk management, clearing and cash management, among others. Wehave also assembled a proprietary connectivity network between us and exchanges around the world.Efficiency and speed in performing prescribed functions are always crucial requirements for oursystems. As a result, our trading systems are able to assimilate market data, recalculate and distributestreaming quotes for tradable products in all product classes each second.
Risk Management Activities
The core of our risk management philosophy is the utilization of our fully integrated computersystems to perform critical, risk-management activities on a real-time basis. In our market makingbusiness, our real-time integrated risk management system seeks to ensure that overall IBG positionsare continuously hedged at all times, curtailing risk. In our electronic brokerage business, integratedrisk management seeks to ensure that each customer’s positions are continuously credit checked andbrought into compliance if equity falls short of margin requirements, curtailing bad debt losses.
We actively manage our global currency exposure on a continuous basis by maintaining our equityin a basket of currencies we call the GLOBAL. In 2011, we expanded the composition of the GLOBALfrom six to 16 currencies to better reflect the expanding breadth of our businesses around the world.We define the GLOBAL as consisting of fractions of a U.S. dollar, Euro, Japanese yen, British pound,Canadian dollar, Australian dollar, Swiss franc, Hong Kong dollar, Swedish krona, Mexican peso,Danish krone, Norwegian krone, South Korean won, Brazilian real, Indian rupee and Singapore dollar.The Company currently transacts business and is required to manage balances in each of these 16currencies. The currencies comprising the GLOBAL and their relative proportions can change overtime. Additional information regarding our currency hedging strategy is set forth in ‘‘Quantitative andQualitative Disclosures About Market Risk’’ in Part II, Item 7A of this Annual Report on Form 10-K.
Electronic Brokerage
IB calculates margin requirements for each of its customers on a real-time basis across all productclasses (stocks, options, futures, forex, bonds and mutual funds) and across all currencies. Recognizingthat IB’s customers are experienced investors, we expect our customers to manage their positionsproactively and we provide tools to facilitate our customers’ position management. However, if acustomer’s equity falls below what is required to support that customer’s margin, IB will automaticallyliquidate positions on a real-time basis to bring the customer’s account into margin compliance. We dothis to protect IB, as well as the customer, from excessive losses and further contributes to our low-coststructure. The entire credit management process is completely automated, and IB does not employ amargin department.
As a safeguard, all liquidations are displayed on custom built liquidation monitoring screens thatare part of the toolset our technical staff uses to monitor performance of our systems at all times themarkets around the world are open. In the event our systems absorb erroneous market data fromexchanges, which prompts liquidations, risk specialists on our technical staff have the capability to haltliquidations that meet specific criteria. The liquidation halt function is highly restricted.
IB’s customer interface includes color coding on the account screen and pop-up warning messagesto notify customers that they are approaching their margin limits. This feature allows customers to takeaction, such as entering margin reducing trades, to avoid having IB liquidate their positions. Thesetools and real-time margining allow IB’s customers to understand their trading risk at any moment ofthe day and help IB maintain low commissions, by not having to price in the cost of credit losses.
10

Market Making
We employ certain hedging and risk management techniques to protect us from a severe marketdislocation. Our risk management policies are developed and implemented by our Chairman and oursteering committee, which is comprised of senior executives of our various companies. Our strategy isto calculate quotes a few seconds ahead of the market and execute small trades at a tiny but favorabledifferential as a result. This is made possible by our proprietary pricing model, which evaluates andmonitors the risks inherent in our portfolio, assimilates market data and reevaluates the outstandingquotes in our portfolio each second. Our model automatically rebalances our positions throughout eachtrading day to manage risk exposures both on our options and futures positions and the underlyingsecurities, and will price the increased risk that a position would add to the overall portfolio into thebid and offer prices we post. Under risk management policies implemented and monitored primarilythrough our computer systems, reports to management, including risk profiles, profit and loss analysisand trading performance, are prepared on a real-time basis as well as daily and periodical bases.Although our market making is completely automated, the trading process and our risk are monitoredby a team of individuals who, in real time, observe various risk parameters of our consolidatedpositions. Our assets and liabilities are marked-to-market daily for financial reporting purposes andre-valued continuously throughout the trading day for risk management and asset/liability managementpurposes.
Over the years, we have expanded our market presence and the number of financial instruments inwhich we make markets. This diversification acts as a passive form of portfolio risk management.
We trade primarily the options on stocks (and individual stocks) where the underlying equitymarket capitalization is greater than $500 million. Throughout the trading day we produce online,real-time profit and loss, risk evaluation, activity and other management reports. Our softwareassembles from external sources a balance sheet and income statements for our accounting departmentto reconcile the trading system results.
The adaptability of our portfolio risk management system and trading methods have allowed us toexpand the number of financial instruments traded and the number of markets on which we trade.
Operational Controls
We have automated the full cycle of controls surrounding the market making and brokeragebusiness. Key automated controls include the following:
• Our technical operations section continuously monitors our network and the proper functioningof each of our nodes (exchanges, internet service providers (‘‘ISPs’’), leased customer lines andour own data centers) around the world.
• Our real-time credit manager software provides pre- and post-execution controls by:
• testing every customer order to ensure that the customer’s account holds enough equity tosupport the execution of the order, rejecting the order if equity is insufficient or directingthe order to an execution destination without delay if equity is sufficient; and
• continuously updating a customer account’s equity and margin requirements and, if theaccount’s equity falls below its minimum margin requirements, automatically issuingliquidating orders in a smart sequence designed to minimize the impact on account equity.
• Our market making system continuously evaluates over 867,000 securities and futures productsin which we provide bid and offer quotes and changes its bids and offers in such a way as tomaintain an overall hedge and a low-risk profile. The speed of communicating with exchangesand market centers is maximized through continuous software and network engineeringinnovation, thereby allowing the firm to achieve real-time controls over market exposure.
11
• Our clearing system captures trades in real-time and performs automated reconciliation of tradesand positions, corporate action processing, customer account transfer, options exercise, securitieslending and inventory management, allowing the firm to effectively manage operational risk.
• Our accounting system operates with automated data feeds from clearing and banking systems,allowing the firm to produce financial statements for all parts of our business every day bymid-day on the day following trade date.
• Software developed to interface with the accounting and market making systems performs dailyprofit and loss reconciliations, which provide tight financial controls over market makingfunctions.
Transaction Processing
Our transaction processing is automated over the full life cycle of a trade. Our market makingsoftware generates and disseminates to exchanges and market centers continuous bid and offer quoteson over 867,000 tradable, exchange listed products. Our fully automated smart router system searchesfor the best possible combination of prices available at the time a customer order is placed andimmediately seeks to execute that order electronically or send it where the order has the highestpossibility of execution at the best price.
At the moment a trade is executed, our systems capture and deliver this information back to thesource, either the market making system or via the brokerage system to the customer, in most caseswithin a fraction of a second. Simultaneously, the trade record is written into our clearing system,where it flows through a chain of control accounts that allow us to reconcile trades, positions andmoney until the final settlement occurs. Our integrated software tracks other important activities, suchas dividends, corporate actions, options exercises, securities lending, margining, risk management andfunds receipt and disbursement.
IB SmartRoutingSM
IB SmartRoutingSM searches for the best destination price in view of the displayed prices, sizes andaccumulated statistical information about the behavior of market centers at the time an order is placed,and IB SmartRoutingSM immediately seeks to execute that order electronically. Unlike other smartrouters, IB SmartRoutingSM never relinquishes control of the order, and constantly searches for the bestprice. It continuously evaluates fast-changing market conditions and dynamically re-routes all or partsof the order seeking to achieve optimal execution. IB SmartRoutingSM represents each leg of a spreadorder independently and enters each leg at the best possible venue. IB SmartRouting AutorecoverySM
re-routes a customer’s U.S. options order in the case of an exchange malfunction, with IB undertakingthe risk of double executions. In addition, IB SmartRoutingSM checks each new order to see if it couldbe executed against any of its pending orders. As the system gains more users, this feature becomesmore important for customers in a world of multiple exchanges and trading venues and penny pricedorders because it increases the possibility of best executions for our customers ahead of customers ofother brokers. As a result of this feature, our customers have a greater chance of executing limit ordersand can do so sooner than those who use other routers.
Clearing and Margining
Our activities in the United States are entirely self-cleared. We are a full clearing member of TheOptions Clearing Corporation (‘‘OCC’’), the Chicago Mercantile Exchange Clearing House(‘‘CMECH’’), The Depository Trust Clearing Corporation and ICE Clear U.S.
Due to our large positions in broad based index products, we benefit from the cross-margin systemmaintained by OCC and CMECH. For example, if we hold a position in an OCC-cleared product and
12

have an offsetting position in a CMECH cleared product, the cross-margin computation takes bothpositions into account, thereby reducing the overall margin requirement. The reduced margin benefitproves especially useful during times of market stress, such as on days with large price movementswhen intra-day margin calls may be reduced or eliminated by the cross-margin calculation.
In addition, we are fully or partially self-cleared in Canada, Great Britain, Switzerland, France,Germany, Belgium, Austria, the Netherlands, Norway, Sweden, Denmark, Finland, Hong Kong, Indiaand Japan.
Customers
We established our electronic brokerage subsidiary, IB, in 1993 to enhance the use of our globalnetwork of trading interfaces, exchange and clearinghouse memberships and regulatory registrationsassembled over the prior 16 years to serve our market making business. We realized that electronicaccess to market centers worldwide through our network could easily be utilized by the very same floortraders and trading desk professionals who, in the coming years, would be displaced by the conversionof exchanges from open outcry to electronic systems.
We currently service approximately 210,000 cleared customer accounts. Our customers reside inapproximately 175 countries around the world.
The target IB customer is one that requires the latest in trading technology, derivatives expertise,and worldwide access and expects low overall transaction costs. IB’s customers are mainly comprised of‘‘self-service’’ individuals, former floor traders, trading desk professionals, electronic retail brokers,financial advisors who are comfortable with technology, banks that require global access and hedgefunds.
Our customers fall into three groups based on services provided: cleared customers, tradeexecution customers and wholesale customers. By offering portfolio margining, we have been able topersuade more of our trade execution hedge fund customers to utilize our cleared business solution,which benefits the hedge funds in terms of cost savings. Many prime brokers once offered increasedleverage over Regulation T credit limitations and NYSE margin requirements through offshore entitiesand joint back office arrangements. Following the market turmoil of late 2008 and the resultingtightening of credit, we observed competition in this area diminish. Through portfolio margining, IB isable to offer similar leverage with lower margin requirements that reflect the reduced risk of a hedgedportfolio.
• Cleared Customers: We provide trade execution and clearing services to our cleared customerswho are generally attracted to our low commissions, low financing rates, high interest paid andbest price execution. From small market making groups and individual market makers, ourcleared customer base has expanded over the years to include institutional and individual tradersand investors, financial advisors and introducing brokers.
• Trade Execution Customers: We offer trade execution for customers who choose to clear withanother prime broker or a custodian bank; these customers are able to take advantage of ourlow commissions for trade execution as well as our best price execution.
• Wholesale Customers: Our wholesale customers, which include some of the largest banks andretail electronic brokers, are generally self-clearing. These customers count on us for oursuperior options and option/stock combination trade routing and execution and our ability toassist them in satisfying their regulatory requirements to provide best execution to theircustomers.
Our non-cleared customers include large online brokers and increasing numbers of the proprietaryand customer trading units of U.S., Canadian and European commercial banks. These customers are
13

attracted by the IB SmartRouting SM technology as well as our direct access to stock, options, futures,forex and bond markets worldwide.
Our customers receive worldwide electronic access connectivity in one of three ways: the TraderWorkstation (our real-time Java-based trading platform), our proprietary API, and/or industry standardFIX connectivity.
Employees and Culture
We take pride in our technology-focused company culture and embrace it as one of ourfundamental strengths. We remain committed to improving our technology, and we try to minimizecorporate hierarchy to facilitate efficient communication among employees. We have assembled whatwe believe is a highly talented group of employees. As we grow, we expect to continue to providesignificant rewards for our employees who provide significant value to us and the world’s financialmarkets.
As of December 31, 2012, we had 891 employees, all of whom were employed on a full-time basis.None of our employees are covered by collective bargaining agreements. We believe that our relationswith our employees are good.
Competition
Electronic Brokerage
The market for electronic brokerage services is rapidly evolving and highly competitive. IB believesthat it fits neither within the definition of a traditional broker nor that of a prime broker. IB’s primarycompetitors include offerings targeted to professional traders by large retail online brokers (such as TDAmeritrade’s thinkorswim, E*TRADE Pro business, and The Charles Schwab Corporation’sStreetSmart Pro and optionsXpress businesses) and the prime brokerage and electronic brokerage armsof major investment banks and brokers (such as Goldman Sachs’ REDIPlus business and MorganStanley’s Passport business). We also encounter competition to a lesser extent from full commissionbrokerage firms including Bank of America Merrill Lynch and Morgan Stanley Smith Barney, as well asother financial institutions, most of which provide online brokerage services. The electronic brokeragebusinesses of many of our competitors are relatively insignificant in the totality of their firms’ business.IB provides access to a global range of products from a single IB Universal AccountSM and professionallevel executions and pricing, which positions it in competition with niche direct-access providers andprime brokers. In addition to offering low commissions and financing rates, IB provides sophisticatedorder types and analytical tools that give a competitive edge to its customers.
Market Making
Historically, competition has come from registered market making firms which range from soleproprietors with very limited resources to large, integrated broker-dealers. Today, Timber Hill’s majorcompetitors continue to be large broker-dealers, such as Goldman Sachs, Morgan Stanley, UBS,Citigroup, Bank of America Merrill Lynch, and niche players such as Citadel, Susquehanna, WolverineTrading, Group One Trading, Peak6 and Getco. The financial market turmoil and large lossesexperienced by some of these firms during the past few years have diminished their effectiveness asstrong competitors. Some of our competitors in market making are larger than we are and have morecaptive order flow, although this is less true with respect to our narrow focus on options, futures andETFs listed on electronic exchanges.
14

The competitive environment for market makers has evolved considerably in the past several years,most notably with the rise in high frequency trading firms (‘‘HFTs’’). HFTs transact significant tradingvolume on electronic exchanges by using complex algorithms and high speed execution software thatanalyzes market conditions. Before 2010, many HFTs that were not registered market makers were ableto act similarly to market makers on exchanges that maintain a traditional fee model, and use theircustomer status to gain advantages over registered market makers. In particular, they did not payexchange fees and their orders were given priority over registered market makers who were biddingand offering at the same prices. In early 2010, several exchanges implemented rules to remove theseadvantages and charge HFTs exchanges fees, thus helping to level the playing field for marketparticipants. However, HFTs that are not registered market makers operate with fewer regulatoryrestrictions and are able to move more quickly and trade more cheaply. This is currently an area offocus amongst regulators who are examining the practices of HFTs and their impact on marketstructure.
To compete successfully, we believe that we must have more sophisticated, versatile and robustsoftware than our competitors. This is our primary focus, as contrasted with many of our competitors.With respect to these competitors, Timber Hill maintains the advantage of having had much longerexperience with the development and usage of its proprietary electronic brokerage and market makingsystems. Market conditions that are difficult for other market participants often present Timber Hillwith the opportunities inherent in diminished competition. Our advantage is our expertise and decadesof single-minded focus on developing our technology. This enables us to have a unique platformspecializing strictly in electronic market making and brokerage.
Regulation
Our securities and derivatives businesses are extensively regulated by U.S. federal and stateregulators, foreign regulatory agencies, numerous exchanges and self-regulatory organizations (‘‘SROs’’)of which our subsidiaries are members. In the current era of heightened regulation of financialinstitutions, we expect to incur increasing compliance costs, along with the industry as a whole.
Overview
As registered U.S. broker-dealers, Interactive Brokers LLC (‘‘IB LLC’’) and TH LLC are subjectto the rules and regulations of the Exchange Act, and as members of various exchanges, we are alsosubject to such exchanges’ rules and requirements. Additionally, as registered futures commissionmerchants, IB LLC and TH LLC are subject to the Commodity Exchange Act and rules promulgatedby the Commodity Futures Trading Commission (‘‘CFTC’’) and the various commodity exchanges ofwhich they are members. Finally, we are subject to the requirements of various self-regulatoryorganizations such as the Financial Industry Regulatory Authority (‘‘FINRA’’) and the National FuturesAssociation (‘‘NFA’’). Our foreign affiliates are similarly regulated under the laws and institutionalframework of the countries in which they operate.
U.S. broker-dealers and futures commission merchants are subject to laws, rules and regulationsthat cover all aspects of the securities and derivatives business, including:
• sales methods;
• trade practices;
• use and safekeeping of customers’ funds and securities;
• capital structure;
• record-keeping;
• financing of customers’ purchases; and
• conduct of directors, officers and employees.
15
In addition, the businesses that we may conduct are limited by our agreements with and ouroversight by FINRA. Participation in new business lines, including trading of new products orparticipation on new exchanges or in new countries often requires governmental and/or exchangeapprovals, which may take significant time and resources. As a result, we may be prevented fromentering new businesses that may be profitable in a timely manner, or at all.
As certain of our subsidiaries are members of FINRA, we are subject to certain regulationsregarding changes in control of our ownership. FINRA Rule 1017 generally provides that FINRAapproval must be obtained in connection with any transaction resulting in a change in control of amember firm. The FINRA defines control as ownership of 25% or more of the firm’s equity by a singleentity or person and would include a change in control of a parent company. As a result of theseregulations, our future efforts to sell shares or raise additional capital may be delayed or prohibited byFINRA.
Net Capital Rule
The SEC, FINRA, CFTC and various other regulatory agencies within the United States havestringent rules and regulations with respect to the maintenance of specific levels of net capital byregulated entities. Generally, a broker-dealer’s capital is net worth plus qualified subordinated debt lessdeductions for certain types of assets. The Net Capital Rule requires that at least a minimum part of abroker-dealer’s assets be maintained in a relatively liquid form.
If these net capital rules are changed or expanded, or if there is an unusually large charge againstour net capital, our operations that require the intensive use of capital would be limited. A largeoperating loss or charge against our net capital could adversely affect our ability to expand or evenmaintain these current levels of business, which could have a material adverse effect on our businessand financial condition.
The SEC and FINRA impose rules that require notification when net capital falls below certainpredefined criteria. These rules also dictate the ratio of debt-to-equity in the regulatory capitalcomposition of a broker-dealer, and constrain the ability of a broker-dealer to expand its businessunder certain circumstances. If a firm fails to maintain the required net capital, it may be subject tosuspension or revocation of registration by the applicable regulatory agency, and suspension orexpulsion by these regulators could ultimately lead to the firm’s liquidation. Additionally, the NetCapital Rule and certain FINRA rules impose requirements that may have the effect of prohibiting abroker-dealer from distributing or withdrawing capital and requiring prior notice to and approval fromthe SEC and FINRA for certain capital withdrawals.
At December 31, 2012, aggregate excess regulatory capital for all of the operating companies was$2.56 billion.
TH LLC and IB LLC are subject to the Uniform Net Capital Rule (Rule 15c3-1) under theExchange Act and the CFTC’s minimum financial requirements (Regulation 1.17), and THE is subjectto the Swiss Financial Market Supervisory Authority eligible equity requirement. Additionally, THSHKis subject to the Hong Kong Securities Futures Commission liquid capital requirement, THA is subjectto the Australian Stock Exchange liquid capital requirement, THC and IBC are subject to theInvestment Industry Regulatory Organization of Canada risk adjusted capital requirement, IBUK issubject to the U.K. Financial Services Authority financial resources requirement, IBI is subject to theNational Stock Exchange of India net capital requirements and IBSJ is subject to the Japanese
16

Financial Supervisory Agency capital requirements. The following table summarizes capital, capitalrequirements and excess regulatory capital (millions):
Net Capital/Eligible Equity Requirement Excess
IB LLC . . . . . . . . . . . . . . . . . . . . . . . . . . . . . . $1,633 $219 $1,414TH LLC . . . . . . . . . . . . . . . . . . . . . . . . . . . . . 394 42 352THE . . . . . . . . . . . . . . . . . . . . . . . . . . . . . . . . 646 211 435Other regulated Operating Companies . . . . . . . . 379 24 355
$3,052 $496 $2,556
At December 31, 2012, all of the operating companies were in compliance with their respectiveregulatory capital requirements. For additional information regarding our net capital requirements seeNote 17 to the consolidated financial statements in Part II , Item 8 of this Annual Report onForm 10-K.
Protection of Customer Assets
To conduct customer activities, IB LLC is obligated under rules mandated by its primaryregulators, the SEC and the CFTC, to segregate cash or qualified securities belonging to customers. Inaccordance with the Securities Exchange Act of 1934, IB LLC is required to maintain separate bankaccounts for the exclusive benefit of customers. In accordance with the Commodity Exchange Act,IB LLC is required to segregate all monies, securities and property received from commoditiescustomers in specially designated accounts.
To further enhance the protection of our customers’ assets, in 2011 IB LLC sought and receivedapproval from FINRA to perform and report the reserve computation on a daily basis, instead of onceper week. IB LLC initiated daily computations in December 2011, along with daily adjustments of themoney set aside in safekeeping for our customers.
Supervision and Compliance
Our Compliance Department supports and seeks to ensure proper operations of our marketmaking and electronic brokerage businesses. The philosophy of the Compliance Department, and ourcompany as a whole, is to build automated systems to try to eliminate manual steps and errors in thecompliance process and then to augment these systems with human staff who apply their judgmentwhere needed. We have built automated systems to handle wide-ranging compliance issues such astrade and audit trail reporting, financial operations reporting, enforcement of short sale rules,enforcement of margin rules and pattern day trading restrictions, review of employee correspondence,archival of required records, execution quality and order routing reports, approval and documentationof new customer accounts, and anti-money laundering and anti-fraud surveillance. In light of ourautomated operations and our automated compliance systems, we have a smaller and more efficientCompliance Department than many traditional securities firms. Nonetheless, we have increased thestaffing in our Compliance Department over the past several years to meet the increased regulatoryburdens faced by all industry participants.
IB LLC and TH LLC each has a Chief Compliance Officer who reports to its General Counseland its internal audit and compliance committee. These Chief Compliance Officers, plus certain othersenior staff members, are FINRA-registered principals with supervisory responsibility over the variousaspects of our businesses. Staff members in the Compliance Department or in other departments of thefirm are also registered with FINRA, NFA or other regulatory organizations.
17
Patriot Act and Increased Anti-Money Laundering (‘‘AML’’) and ‘‘Know Your Customer’’ Obligations
Registered broker-dealers traditionally have been subject to a variety of rules that require that they‘‘know their customers’’ and monitor their customers’ transactions for suspicious financial activities.With the passage of the Uniting and Strengthening America by Providing Appropriate Tools Requiredto Intercept and Obstruct Terrorism Act of 2001 (the ‘‘Patriot Act’’), broker-dealers are now subject toeven more stringent requirements. Likewise, the SEC, CFTC, foreign regulators, and the variousexchanges and SROs, of which IB companies are members, have passed numerous AML and customerdue diligence rules. Significant criminal and civil penalties can be imposed for violations of the PatriotAct, and significant fines and regulatory penalties for violations of other governmental and SRO AMLrules.
As required by the Patriot Act and other rules, we have established comprehensive anti-moneylaundering and customer identification procedures, designated an AML compliance officer, trained ouremployees and conducted independent audits of our program. Our anti-money laundering screening isconducted using a mix of automated and manual reviews and has been structured to comply withregulations. We collect required information through our new account opening process and then screenaccounts with databases for the purposes of identity verification and for review of negative informationand appearance on the Office of Foreign Assets and Control, Specially Designated Nationals andBlocked Persons lists. Additionally, we have developed methods for risk control and continue to addupon specialized processes, queries and automated reports designed to identify money laundering, fraudand other suspicious activities.
Dodd-Frank Reform Act
The Dodd-Frank Wall Street Reform and Consumer Protection Act will be imposing stricterreporting and disclosure requirements on the financial services industry. Management is monitoring thisand other accounting and regulatory rulemaking developments for their potential effect on theCompany’s financial statements and internal controls over financial reporting.
Business Continuity Planning
Federal regulators and industry self-regulatory organizations have passed a series of rules in thepast several years requiring regulated firms to maintain business continuity plans that describe whatactions firms would take in the event of a disaster (such as a fire, natural disaster or terrorist incident)that might significantly disrupt operations. IB has developed business continuity plans that describesteps that the firm and its employees would take in the event of various scenarios. The firm has built abackup site for certain key operations at its Chicago facilities that would be utilized in the event of asignificant outage at the firm’s Greenwich headquarters. In addition, the firm has strengthened theinfrastructure at its Greenwich headquarters and has built redundancy of systems so that certainoperations can be handled from multiple offices. The firm continually evaluates opportunities to furtherits business continuity planning efforts.
Foreign Regulation
Our international subsidiaries are subject to extensive regulation in the various jurisdictions wherethey have operations. The most significant of our international subsidiaries are: THE, registered to dobusiness in Switzerland as a securities dealer; THSHK, registered to do business in Hong Kong as asecurities dealer; THA, registered to do business in Australia as a securities dealer and futures broker;IBUK, registered to do business in the U.K. as a broker; IBC and THC, registered to do business inCanada as an investment dealer and securities dealer, respectively; IBI, registered to do business inIndia as a stock broker and IBSJ, registered in Japan as a financial instruments firm with the KantoRegional Finance Bureau and the Financial Supervisory Agency.
18

In Hong Kong, the Securities and Futures Commission (‘‘SFC’’) regulates our subsidiary, THSHK,as a securities dealer. The compliance requirements of the SFC include, among other things, net capitalrequirements and stockholders’ equity requirements. The SFC regulates the activities of the officers,directors, employees and other persons affiliated with THSHK and requires the registration of suchpersons.
In Canada, both THC and IBC are subject to the Investment Industry Regulatory Organization ofCanada (‘‘IROC’’) risk adjusted capital requirement. In Switzerland, THE is subject to the SwissFinancial Market Supervisory Authority eligible equity requirement. In Australia, THA is subject to theAustralian Stock Exchange liquid capital requirement. In the United Kingdom, IBUK is subject to theU.K Financial Services Authority financial resources requirement.
In India, IBI is subject to the National Stock Exchange and Bombay Stock Exchange capitalrequirements. In Japan, IBSJ is subject to the Financial Supervisory Agency, the Osaka SecuritiesExchange and the Tokyo Stock Exchange capital requirements.
Executive Officers and Directors of Interactive Brokers Group, Inc.
The following table sets forth the names, ages and positions of our current directors and executiveofficers.
Name Age Position
Thomas Peterffy . . . 68 Chairman of the Board of Directors, Chief Executive Officer and PresidentEarl H. Nemser . . . 65 Vice Chairman and DirectorPaul J. Brody . . . . . 52 Chief Financial Officer, Treasurer, Secretary and DirectorThomas A. Frank . . 57 Executive Vice President and Chief Information OfficerMilan Galik . . . . . . 46 Senior Vice President, Software Development and DirectorLawrence E. Harris 56 DirectorHans R. Stoll . . . . . 73 DirectorIvers W. Riley . . . . 80 DirectorRichard Gates . . . . 41 Director
Thomas Peterffy. Mr. Peterffy emigrated from Hungary to the United States in 1965. Afterworking for 10 years as a computer programmer, he became a member of the American StockExchange in 1977. As an individual floor trader, he founded the firm which became our company. AsChief Executive Officer and President, Mr. Peterffy is active in our day-to-day management.
Earl H. Nemser. Mr. Nemser has been our Vice Chairman since 1988 and also serves as a directorand/or officer for various subsidiaries of IBG LLC. Mr. Nemser has served as Special Counsel to thelaw firm Dechert LLP since January 2005. Prior to such time Mr. Nemser served as Partner at the lawfirms of Swidler Berlin Shereff Friedman, LLP from 1995 to December 2004 and Cadwalader,Wickersham & Taft LLP prior to 1995. Mr. Nemser received a Bachelor of Arts degree in economicsfrom New York University in 1967 and a Juris Doctor, magna cum laude, from Boston UniversitySchool of Law in 1970.
Paul J. Brody. Mr. Brody joined us in 1987 and has served as Chief Financial Officer sinceDecember 2003. Mr. Brody serves as a director and/or officer for various subsidiaries of IBG LLC.From 2005 to 2012 Mr. Brody served as a director, and for a portion of that time as member ViceChairman, of The Options Clearing Corporation, of which Timber Hill LLC and InteractiveBrokers LLC are members. He also serves as a director of Quadriserv Inc., an electronic securitieslending platform provider. Mr. Brody received a Bachelor of Arts degree in economics from CornellUniversity in 1982.
19

Thomas A. Frank. Dr. Frank joined us in 1985 and has served since July 1999 as Executive VicePresident and Chief Information Officer of Interactive Brokers LLC. In addition, Dr. Frank has servedas Vice President of Timber Hill LLC since December 1990. Dr. Frank received a Ph.D. in physicsfrom the Massachusetts Institute of Technology in 1985.
Milan Galik. Mr. Galik joined us in 1990 as a software developer and has served since October2003 as Senior Vice President, Software Development of IBG LLC. In addition, Mr. Galik has servedas Vice President of Timber Hill LLC since April 1998. Mr. Galik received a Master of Science degreein electrical engineering from the Technical University of Budapest in 1990.
Lawrence E. Harris. Dr. Harris has been a director since July 2007. He is a professor of Financeand Business Economics at the University of Southern California, where he holds the Fred V. KeenanChair in Finance at the Marshall School of Business. Dr. Harris also serves as a director of the ClipperFund and as the research coordinator of the Institute for Quantitative Research in Finance. Dr. Harrisformerly served as Chief Economist of the U.S. Securities and Exchange Commission. Dr. Harrisearned his Ph.D. in Economics from the University of Chicago, and is a CFA charterholder. He is anexpert in the economics of securities market microstructure and the uses of transactions data infinancial research. He has written extensively about trading rules, transaction costs, index markets, andmarket regulation. Dr. Harris is also the author of the widely respected textbook ‘‘Trading andExchanges: Market Microstructure for Practitioners.’’
Hans R. Stoll. Dr. Stoll has been a director since April 2008. Dr. Stoll has been The Anne Marieand Thomas B. Walker, Jr., Professor of Finance and Director of the Financial Markets ResearchCenter at the Owen Graduate School of Management, Vanderbilt University since 1980. Dr. Stoll haspublished several books and more than 60 articles on numerous securities and finance related subjects.He is known for developing the put call parity relation and for his work in market microstructure.Dr. Stoll served as a member of the board of directors of the Options Clearing Corporation from 2005to 2008. He has been President of the American Finance Association. Dr. Stoll received his A.B.degree from Swarthmore College in 1961 and his M.B.A. and Ph.D. degrees from the Graduate Schoolof Business of the University of Chicago in 1963 and 1966, respectively.
Ivers W. Riley. Mr. Riley has been a director since April 2008. He served as chairman of theInternational Securities Exchange, the first fully electronic U.S. options exchange, until 2006. From1994 to 1997, and again from 1999 to 2000, he was chief executive of the Hong Kong Futures Exchangeand chairman of the HKFE Clearing Corporation. Mr. Riley was Senior Executive Vice President incharge of all derivatives activity at the American Stock Exchange from 1986 to 1993. While at Amex,he was the driving force in the development of SPDRs, a popular exchange-traded fund based on theS&P 500 index. Mr. Riley received his Bachelor of Science degree in finance from The University ofCalifornia, Los Angeles in 1955 and completed an advanced management program at HarvardUniversity in 1986.
Richard Gates. Mr. Gates co-founded TFS Capital in 1997. TFS is an independent advisory firmthat has been dedicated to the construction of quantitative models that are designed to identify marketinefficiencies. As a portfolio manager at this firm, he oversees several hedge funds and mutual fundsthat take both long and short positions in equities and futures. At TFS, his focus is on trade execution,factor research and business development. Mr. Gates graduated from the University of Virginia in 1994with a bachelor’s degree in Chemical Engineering. As a result of these professional and otherexperiences, Mr. Gates possesses particular knowledge and experience in a variety of areas, includingtrade execution and evaluation of new trading technologies and platforms that strengthens the Board’scollective knowledge, capabilities and experience.
20

ITEM 1A. RISK FACTORS
We face a variety of risks that are substantial and inherent in our businesses, including market,liquidity, credit, operational, legal and regulatory. In addition to the risks identified elsewhere in thisAnnual Report on Form 10-K, the following risk factors apply to our business results of operations andfinancial condition:
Risks Related to Our Company Structure
Control by Thomas Peterffy of a majority of the combined voting power of our common stock may give rise toconflicts of interests and could discourage a change of control that other stockholders may favor, which couldnegatively affect our stock price, and adversely affect stockholders in other ways.
Thomas Peterffy, our founder, Chairman and Chief Executive Officer, and his affiliates beneficiallyown approximately 86.3% of the economic interests and all of the voting interests in Holdings, whichowns all of our Class B common stock, representing approximately 88.1% of the combined votingpower of all classes of our voting stock. As a result, Mr. Peterffy has the ability to elect all of themembers of our board of directors and thereby to control our management and affairs, includingdeterminations with respect to acquisitions, dispositions, material expansions or contractions of ourbusiness, entry into new lines of business, borrowings, issuances of common stock or other securities,and the declaration and payment of dividends on our common stock. In addition, Mr. Peterffy is ableto determine the outcome of all matters requiring stockholder approval and will be able to cause orprevent a change of control of our company or a change in the composition of our board of directorsand could preclude any unsolicited acquisition of our company. The concentration of ownership coulddiscourage potential takeover attempts that other stockholders may favor and could deprivestockholders of an opportunity to receive a premium for their common stock as part of a sale of ourcompany and this may adversely affect the market price of our common stock.
Moreover, because of Mr. Peterffy’s substantial ownership, we are eligible to be and are, treated asa ‘‘controlled company’’ for purposes of the NASDAQ Marketplace Rules. As a result, we are not berequired by NASDAQ to have a majority of independent directors or to maintain Compensation andNominating and Corporate Governance Committees composed entirely of independent directors tocontinue to list the shares of our common stock on The NASDAQ Global Select Market (‘‘NASDAQGS’’). Our Compensation Committee is comprised of Messrs. Thomas Peterffy (Chairman of theCompensation Committee) and Earl H. Nemser (our Vice Chairman). Mr. Peterffy’s membership onthe Compensation Committee may give rise to conflicts of interests in that Mr. Peterffy is able toinfluence all matters relating to executive compensation, including his own compensation.
We are dependent on IBG LLC to distribute cash to us in amounts sufficient to pay our tax liabilities andother expenses.
We are a holding company and our primary assets are our approximately 11.9% equity interest inIBG LLC and our controlling interest and related rights as the sole managing member of IBG LLCand, as such, we operate and control all of the business and affairs of IBG LLC and are able toconsolidate IBG LLC’s financial results into our financial statements. We have no independent meansof generating revenues. IBG LLC is treated as a partnership for U.S. federal income tax purposes and,as such, is not subject to U.S. federal income tax. Instead, its taxable income is allocated on a pro ratabasis to Holdings and us. Accordingly, we incur income taxes on our proportionate share of the nettaxable income of IBG LLC, and also incur expenses related to our operations. We intend to causeIBG LLC to distribute cash to its members in amounts at least equal to that necessary to cover theirtax liabilities, if any, with respect to the earnings of IBG LLC. To the extent we need funds to pay suchtaxes, or for any other purpose, and IBG LLC is unable to provide such funds, it could have a materialadverse effect on our business, financial condition or results of operations.
21

We are required to pay Holdings for the benefit relating to additional tax depreciation or amortizationdeductions we claim as a result of the tax basis step-up our subsidiaries received in connection with our IPOand certain subsequent redemptions of Holdings membership interests.
In connection with our IPO, we purchased interests in IBG LLC from Holdings for cash. InAugust 2011, in connection with a redemption of Holdings membership interests, we acquiredadditional interests in IBG LLC by issuing shares of Class A common stock in exchange for anequivalent number of shares of member interests in IBG LLC (the ‘‘2011 Redemption’’). In addition,IBG LLC membership interests held by Holdings may be sold in the future to us and financed by ourissuances of shares of our common stock. The initial purchase and the 2011 Redemption did, and thesubsequent purchases may, result in increases in the tax basis of the tangible and intangible assets ofIBG LLC and its subsidiaries that otherwise would not have been available. Such increase will beapproximately equal to the amount by which our stock price at the time of the purchase exceeds theincome tax basis of the assets of IBG LLC underlying the IBG LLC interests acquired by us. Theseincreases in tax basis will result in increased deductions in computing our taxable income and resultingtax savings for us generally over the 15 year period which commenced with the initial purchase. Wehave agreed to pay 85% of these tax savings, if any, to Holdings as they are realized as additionalconsideration for the IBG LLC interests that we acquire.
As a result of the IPO and the 2011 Redemption, the increase in the tax basis attributable to ourinterest in IBG LLC is $0.96 billion. The tax savings that we would actually realize as a result of thisincrease in tax basis likely would be significantly less than this amount multiplied by our effective taxrate due to a number of factors, including the allocation of a portion of the increase in tax basis toforeign or non-depreciable fixed assets, the impact of the increase in the tax basis on our ability to useforeign tax credits and the rules relating to the amortization of intangible assets, for example. Based oncurrent facts and assumptions, including that subsequent purchases of IBG LLC interests will occur infully taxable transactions, the potential tax basis increase resulting from the initial and future purchasesof the IBG LLC interests held by Holdings could be as much as $1.57 billion. The tax receivableagreement requires 85% of such tax savings, if any, to be paid to Holdings, with the balance to beretained by us. The actual increase in tax basis depends, among other factors, upon the price of sharesof our common stock at the time of the purchase and the extent to which such purchases are taxableand, as a result, could differ materially from this amount. Our ability to achieve benefits from any suchincrease, and the amount of the payments to be made under the tax receivable agreement, dependsupon a number of factors, as discussed above, including the timing and amount of our future income.
The tax basis of $1.57 billion assumes that (a) all remaining IBG LLC membership interests heldby Holdings are purchased by the Company and (b) such purchases in the future are made at pricesthat reflect the closing share price at December 31, 2012. In order to have a $1.57 billion tax basis, theoffering price per share of Class A common stock in such future public offering will need to exceed thethen current cost basis per share of Class A common stock by approximately $1.74.
If either immediately before or immediately after any purchase or the related issuance of ourstock, the Holdings members own or are deemed to own, in the aggregate, more than 20% of ouroutstanding stock, then all or part of any increase in the tax basis of goodwill may not be amortizableand, thus, our ability to realize the annual tax savings that otherwise would have resulted if such taxbasis were amortizable may be significantly reduced. Although the Holdings members are prohibitedunder the exchange agreement among us, IBG LLC, Holdings and the historical members of IBG LLC(the ‘‘Exchange Agreement’’) from purchasing shares of Class A common stock, grants of our stock toemployees and directors who are also members or related to members of Holdings and the applicationof certain tax attribution rules, such as among family members and partners in a partnership, couldresult in Holdings members being deemed for tax purposes to own shares of Class A common stock.
22

If the IRS successfully challenges the tax basis increase, under certain circumstances, we could berequired to make payments to Holdings under the tax receivable agreement in excess of our cash taxsavings.
Our senior secured revolving credit facility imposes certain restrictions. A failure to comply with theserestrictions could lead to an event of default, resulting in an acceleration of indebtedness, which may affectour ability to finance future operations or capital needs, or to engage in other business activities.
As of December 31, 2012, our total indebtedness (consisting of the aggregate amounts outstandingunder senior notes, senior secured revolving credit facility and short-term borrowings) wasapproximately $110.4 million. On May 17, 2012, IBG LLC entered into a new $100 million three-yearsenior secured revolving credit facility with a syndicate of banks. This credit facility replaced a similartwo-year facility that was expiring on May 18, 2012. At maturity, subject to meeting certain terms of thefacility, IBG LLC will have an option to convert the facility to a one-year term loan. IBG LLC is thesole borrower under this credit facility, which is required to be guaranteed by IBG LLC’s domesticnon-regulated subsidiaries (currently there are no such entities). In addition, subject to restrictions inour senior secured revolving credit facility and our senior notes, we may incur additional first-prioritysecured borrowings under the senior secured revolving credit facility.
In January 2012, the Company decided to discontinue the Senior Notes Program. It is theCompany’s intention that no new Senior Notes will be issued. All previously issued Senior Notes,$101.4 million outstanding as of December 31, 2011, were redeemed prior to December 31, 2012.
The operating and financial restrictions and covenants in our debt agreements, including the seniorsecured revolving credit facility and our senior notes, may adversely affect our ability to finance futureoperations or capital needs or to engage in other business activities. Our senior secured revolving creditfacility requires us to maintain specified financial ratios and tests, including interest coverage and totalleverage ratios and maximum capital expenditures, which may require that we take action to reducedebt or to act in a manner contrary to our business objectives. In addition, the senior secured revolvingcredit facility and the senior notes restrict our ability to, among other things:
• incur additional indebtedness;
• dispose of assets;
• guarantee debt obligations;
• repay indebtedness or amend debt instruments;
• pay dividends;
• create liens on assets;
• make investments;
• make acquisitions;
• engage in mergers or consolidations; or
• engage in certain transactions with subsidiaries and affiliates and otherwise restrict corporateactivities.
A more detailed discussion of the restrictions contained in our senior secured revolving creditfacility can be found in Part II, Item 7 ‘‘Management’s Discussion and Analysis of Financial Conditionand Results of Operations’’ of this Annual Report on Form 10-K. A failure to comply with therestrictions contained in the senior secured revolving credit facility could lead to an event of default,which could result in an acceleration of our indebtedness. Such an acceleration would constitute anevent of default under our senior notes. A failure to comply with the restrictions in our senior notes
23
could result in an event of default under our senior notes. Our future operating results may not besufficient to enable compliance with the covenants in the senior secured revolving credit facility, oursenior notes or other indebtedness or to remedy any such default. In addition, in the event of anacceleration, we may not have or be able to obtain sufficient funds to refinance our indebtedness ormake any accelerated payments, including those under the senior notes. In addition, we may not beable to obtain new financing. Even if we were able to obtain new financing, we would not be able toguarantee that the new financing would be on commercially reasonable terms or terms that would beacceptable to us. If we default on our indebtedness, our business financial condition and results ofoperation could be materially and adversely affected.
Future sales of our common stock in the public market could lower our stock price, and any additional capitalraised by us through the sale of equity or convertible securities may dilute your ownership in us.
The members of Holdings have the right to cause the redemption of their Holdings membershipinterests over time in connection with offerings of shares of our common stock. We intend to selladditional shares of common stock in public offerings in the future, which may include offerings of ourcommon stock to finance future purchases of IBG LLC membership interests which, in turn, willfinance corresponding redemptions of Holdings membership interests. These offerings and relatedtransactions were anticipated to occur on or about each of the first eight years following the IPO.Given the absence of any public offering subsequent to our IPO in 2007 through 2010 (and therelatively minor amount associated with the 2011 redemption) and depending on the timing ofredemptions, this offering schedule will be extended into the future in accordance with an exchangeagreement among us, IBG LLC, Holdings and the historical members of IBG LLC. The size andoccurrence of these offerings may be affected by market conditions. We may also issue additionalshares of common stock or convertible debt securities to finance future acquisitions or businesscombinations. We currently have approximately 47.5 million outstanding shares of common stock.Assuming no anti-dilution adjustments based on combinations or divisions of our common stock, theofferings referred to above could result in the issuance by us of up to an additional approximately352.7 million shares of common stock. It is possible, however, that such shares could be issued in oneor a few large transactions.
We cannot predict the size of future issuances of our common stock or the effect, if any, thatfuture issuances and sales of shares of our common stock may have on the market price of ourcommon stock. Sales of substantial amounts of our common stock (including shares issued inconnection with an acquisition), or the perception that such sales could occur, may cause the marketprice of our common stock to decline.
Certain provisions in our amended and restated certificate of incorporation may prevent efforts by ourstockholders to change our direction or management.
Provisions contained in our amended and restated certificate of incorporation could make it moredifficult for a third party to acquire us, even if doing so might be beneficial to our stockholders. Forexample, our amended and restated certificate of incorporation authorizes our board of directors todetermine the rights, preferences, privileges and restrictions of unissued series of preferred stock,without any vote or action by our stockholders. We could issue a series of preferred stock that couldimpede the completion of a merger, tender offer or other takeover attempt. These provisions maydiscourage potential acquisition proposals and may delay, deter or prevent a change of control of us,including through transactions, and, in particular, unsolicited transactions, that some or all of ourstockholders might consider to be desirable. As a result, efforts by our stockholders to change ourdirection or management may be unsuccessful.
24

Risks Related to Our Business
Our business may be harmed by global events beyond our control, including overall slowdowns in securitiestrading.
Like other brokerage and financial services firms, our business and profitability are directlyaffected by elements that are beyond our control, such as economic and political conditions, broadtrends in business and finance, changes in volume of securities and futures transactions, changes in themarkets in which such transactions occur and changes in how such transactions are processed. Aweakness in equity markets, such as a slowdown causing reduction in trading volume in U.S. or foreignsecurities and derivatives, has historically resulted in reduced transaction revenues and would have amaterial adverse effect on our business, financial condition and results of operations.
Because our revenues and profitability depend on trading volume, they are prone to significant fluctuationsand are difficult to predict.
Our revenues are dependent on the level of trading activity on securities and derivatives exchangesin the United States and abroad. In the past, our revenues and operating results have variedsignificantly from period to period due primarily to the willingness of competitors to trade moreaggressively by decreasing their bid/offer spreads and thereby assuming more risk in order to acquiremarket share, to movements and trends in the underlying markets, and to fluctuations in trading levels.As a result, period to period comparisons of our revenues and operating results may not be meaningful,and future revenues and profitability may be subject to significant fluctuations or declines.
Our reliance on our computer software could cause us great financial harm in the event of any disruption orcorruption of our computer software. We may experience technology failures while developing our software.
We rely on our computer software to receive and properly process internal and external data. Anydisruption for any reason in the proper functioning or any corruption of our software or erroneous orcorrupted data may cause us to make erroneous trades or suspend our services and could cause usgreat financial harm. To maintain our competitive advantage, our software is under continuousdevelopment. As we identify and enhance our software, there is risk that software failures may occurand result in service interruptions and have other unintended consequences.
Our business could be harmed by a systemic market event.
Some market participants could be overleveraged. In case of sudden, large price movements, suchmarket participants may not be able to meet their obligations to brokers who, in turn, may not be ableto meet their obligations to their counterparties. As a result, the financial system or a portion thereofcould collapse, and the impact of such an event could be catastrophic to our business.
We may incur material trading losses from our market making activities.
A substantial portion of our revenues and operating profits is derived from our trading as principalin our role as a market maker and specialist. We may incur trading losses relating to these activitiessince each primarily involves the purchase or sale of securities for our own account. In any period, wemay incur trading losses in a significant number of securities for a variety of reasons including:
• price changes in securities;
• lack of liquidity in securities in which we have positions; and
• the required performance of our market making and specialist obligations.
These risks may limit or restrict our ability to either resell securities we purchased or torepurchase securities we sold. In addition, we may experience difficulty borrowing securities to make
25

delivery to purchasers to whom we sold short, or lenders from whom we have borrowed. From time totime, we have large position concentrations in securities of a single issuer or issuers engaged in aspecific industry or traded in a particular market. Such a concentration could result in higher tradinglosses than would occur if our positions and activities were less concentrated.
In our role as a market maker, we attempt to derive a profit from the difference between theprices at which we buy and sell, or sell and buy, securities. However, competitive forces often requireus to match the quotes other market makers display and to hold varying amounts of securities ininventory. By having to maintain inventory positions, we are subjected to a high degree of risk. Wecannot assure you that we will be able to manage such risk successfully or that we will not experiencesignificant losses from such activities, which could have a material adverse effect on our business,financial condition and operating results.
Reduced spreads in securities pricing, levels of trading activity and trading through market makers and/orspecialists could harm our business.
Computer-generated buy/sell programs and other technological advances and regulatory changes inthe marketplace may continue to tighten spreads on securities transactions. Tighter spreads andincreased competition could make the execution of trades and market making activities less profitable.In addition, new and enhanced alternative trading systems such as ECNs have emerged as analternative for individual and institutional investors, as well as broker-dealers, to avoid directing theirtrades through market makers, and could result in reduced revenues derived from our market makingbusiness.
We may incur losses in our market making activities in the event of failures of our proprietary pricing model.
The success of our market making business is substantially dependent on the accuracy of ourproprietary pricing mathematical model, which continuously evaluates and monitors the risks inherentin our portfolio, assimilates market data and reevaluates our outstanding quotes each second. Ourmodel is designed to automatically rebalance our positions throughout the trading day to manage riskexposures on our positions in options, futures and the underlying securities. In the event of a flaw inour pricing model and/or a failure in the related software, our pricing model may lead to unexpectedand/or unprofitable trades, which may result in material trading losses.
The valuation of the financial instruments we hold may result in large and occasionally anomalous swings inthe value of our positions and in our earnings in any period.
The market prices of our long and short positions are reflected on our books at closing priceswhich are typically the last trade price before the official close of the primary exchange on which eachsuch security trades. Given that we manage a globally integrated portfolio, we may have large andsubstantially offsetting positions in securities that trade on different exchanges that close at differenttimes of the trading day. As a result, there may be large and occasionally anomalous swings in thevalue of our positions daily and, accordingly, in our earnings in any period. This is especially true onthe last business day of each calendar quarter.
We are exposed to losses due to lack of perfect information.
As market makers, we provide liquidity by buying from sellers and selling to buyers. Quite often,we trade with others who have different information than we do, and as a result, we may accumulateunfavorable positions preceding large price movements in companies. Should the frequency ormagnitude of these events increase, our losses will likely increase correspondingly.
26

Rules governing specialists and designated market makers may require us to make unprofitable trades orprevent us from making profitable trades.
Specialists and designated market makers are granted certain rights and have certain obligations to‘‘make a market’’ in a particular security. They agree to specific obligations to maintain a fair andorderly market. In acting as a specialist or designated market maker, we are subjected to a high degreeof risk by having to support an orderly market. In this role, we may at times be required to maketrades that adversely affect our profitability. In addition, we may at times be unable to trade for ourown account in circumstances in which it may be to our advantage to trade, and we may be obligatedto act as a principal when buyers or sellers outnumber each other. In those instances, we may take aposition counter to the market, buying or selling securities to support an orderly market. Additionally,the rules of the markets which govern our activities as a specialist or designated market maker aresubject to change. If these rules are made more stringent, our trading revenues and profits as specialistor designated market maker could be adversely affected.
We are subject to potential losses as a result of our clearing and execution activities.
As a clearing member firm providing financing services to certain of our brokerage customers, weare ultimately responsible for their financial performance in connection with various stock, options andfutures transactions. Our clearing operations require a commitment of our capital and, despitesafeguards implemented by our software, involve risks of losses due to the potential failure of ourcustomers to perform their obligations under these transactions. If our customers default on theirobligations, we remain financially liable for such obligations, and although these obligations arecollateralized, we are subject to market risk in the liquidation of customer collateral to satisfy thoseobligations. There can be no assurance that our risk management procedures will be adequate. Anyliability arising from clearing operations could have a material adverse effect on our business, financialcondition and/or operating results.
As a clearing member firm of securities and commodities clearing houses in the United States andabroad, we are also exposed to clearing member credit risk. Securities and commodities clearing housesrequire member firms to deposit cash and/or government securities to a clearing fund. If a clearingmember defaults in its obligations to the clearing house in an amount larger than its own margin andclearing fund deposits, the shortfall is absorbed pro rata from the deposits of the other clearingmembers. Many clearing houses of which we are members also have the authority to assess theirmembers for additional funds if the clearing fund is depleted. A large clearing member default couldresult in a substantial cost to us if we are required to pay such assessments.
We may not pay dividends on our common stock at any time in the foreseeable future.
As a holding company for our interest in IBG LLC, we will be dependent upon the ability ofIBG LLC to generate earnings and cash flows and distribute them to us so that we may pay anydividends to our stockholders. To the extent (if any) that we have excess cash, any decision to declareand pay dividends in the future will be made at the discretion of our board of directors and willdepend on, among other things, our results of operations, financial conditions, cash requirement,contractual restrictions and other factors that our board of directors may deem relevant. In December2010 and December 2012, special cash dividends were paid to holders of our common stock. Since thesecond quarter of 2011, the Company has declared and paid a quarterly cash dividend of $0.10 pershare. Although not required, we currently intend to pay quarterly dividends of $0.10 per share to ourcommon stockholders for the foreseeable future.
27

Regulatory and legal uncertainties could harm our business.
The securities and derivatives businesses are heavily regulated. Firms in financial service industrieshave been subject to an increasingly regulated environment over recent years, and penalties and finessought by regulatory authorities have increased accordingly. This regulatory and enforcementenvironment has created uncertainty with respect to various types of transactions that historically hadbeen entered into by financial services firms and that were generally believed to be permissible andappropriate. Our broker-dealer subsidiaries are subject to regulations in the United States and abroadcovering all aspects of their business. Regulatory bodies include, in the United States, the SEC,FINRA, the Board of Governors of the Federal Reserve System, the Chicago Board Options Exchange,the Chicago Mercantile Exchange, the Commodity Futures Trading Commission, and the NationalFutures Association; in Switzerland, the Swiss Financial Market Supervisory Authority; in the UnitedKingdom, the Financial Services Authority; in Hong Kong, the Securities and Futures Commission; inAustralia, the Australian Securities and Investment Commission; in India, the Securities and ExchangeBoard of India; in Canada, the Investment Industry Regulatory Organization of Canada and variousCanadian securities commissions; and in Japan, the Financial Supervisory Agency and the JapanSecurities Dealers Association. Our mode of operation and profitability may be directly affected byadditional legislation changes in rules promulgated by various domestic and foreign governmentagencies and self-regulatory organizations that oversee our businesses, and changes in the interpretationor enforcement of existing laws and rules, including the potential imposition of transaction taxes.Noncompliance with applicable laws or regulations could result in sanctions being levied against us,including fines and censures, suspension or expulsion from a certain jurisdiction or market or therevocation or limitation of licenses. Noncompliance with applicable laws or regulations could adverselyaffect our reputation, prospects, revenues and earnings. In addition, changes in current laws orregulations or in governmental policies could adversely affect our operations, revenues and earnings.
Domestic and foreign stock exchanges, other self-regulatory organizations and state and foreignsecurities commissions can censure, fine, issue cease-and-desist orders, suspend or expel a broker-dealeror any of its officers or employees. Our ability to comply with all applicable laws and rules is largelydependent on our internal system to ensure compliance, as well as our ability to attract and retainqualified compliance personnel. We could be subject to disciplinary or other actions in the future dueto claimed noncompliance, which could have a material adverse effect on our business, financialcondition and results of operations. To continue to operate and to expand our services internationally,we may have to comply with the regulatory controls of each country in which we conduct, or intend toconduct business, the requirements of which may not be clearly defined. The varying compliancerequirements of these different regulatory jurisdictions, which are often unclear, may limit our ability tocontinue existing international operations and further expand internationally.
Our future efforts to sell shares or raise additional capital may be delayed or prohibited by regulations.
As certain of our subsidiaries are members of FINRA, we are subject to certain regulationsregarding changes in control of our ownership. FINRA Rule 1017 generally provides that FINRAapproval must be obtained in connection with any transaction resulting in a change in control of amember firm. FINRA defines control as ownership of 25% or more of the firm’s equity by a singleentity or person and would include a change in control of a parent company. Interactive Brokers (U.K.)Limited is subject to similar change in control regulations promulgated by the FSA in the UnitedKingdom. As a result of these regulations, our future efforts to sell shares or raise additional capitalmay be delayed or prohibited. We may be subject to similar restrictions in other jurisdictions in whichwe operate.
28

We depend on our proprietary technology, and our future results may be impacted if we cannot maintaintechnological superiority in our industry.
Our success in the past has largely been attributable to our sophisticated proprietary technologythat has taken many years to develop. We have benefited from the fact that the type of proprietarytechnology equivalent to that which we employ has not been widely available to our competitors. If ourtechnology becomes more widely available to our current or future competitors for any reason, ouroperating results may be adversely affected. Additionally, adoption or development of similar or moreadvanced technologies by our competitors may require that we devote substantial resources to thedevelopment of more advanced technology to remain competitive. The markets in which we competeare characterized by rapidly changing technology, evolving industry standards and changing tradingsystems, practices and techniques. Although we have been at the forefront of many of thesedevelopments in the past, we may not be able to keep up with these rapid changes in the future,develop new technology, realize a return on amounts invested in developing new technologies orremain competitive in the future.
The loss of our key employees would materially adversely affect our business.
Our key executives have substantial experience and have made significant contributions to ourbusiness, and our continued success is dependent upon the retention of our key managementexecutives, as well as the services provided by our staff of trading system, technology and programmingspecialists and a number of other key managerial, marketing, planning, financial, technical andoperations personnel. The loss of such key personnel could have a material adverse effect on ourbusiness. Growth in our business is dependent, to a large degree, on our ability to retain and attractsuch employees.
We are exposed to risks associated with our international operations.
During 2012, approximately 26% of our net revenues were generated by our operating companiesoutside the United States. We are exposed to risks and uncertainties inherent in doing business ininternational markets, particularly in the heavily regulated brokerage industry. Such risks anduncertainties include political, economic and financial instability; unexpected changes in regulatoryrequirements, tariffs and other trade barriers; exchange rate fluctuations; applicable currency controls;and difficulties in staffing, including reliance on newly hired local experts, and managing foreignoperations. These risks could cause a material adverse effect on our business, financial condition orresults of operations.
We do not have fully redundant systems. System failures could harm our business.
If our systems fail to perform, we could experience unanticipated disruptions in operations, slowerresponse times or decreased customer service and customer satisfaction. Our ability to facilitatetransactions successfully and provide high quality customer service also depends on the efficient anduninterrupted operation of our computer and communications hardware and software systems. Ourservice has experienced periodic system interruptions, which we believe will continue to occur fromtime to time. Our systems and operations also are vulnerable to damage or interruption from humanerror, natural disasters, power loss, telecommunication failures, break-ins, sabotage, computer viruses,intentional acts of vandalism and similar events. While we currently maintain redundant servers toprovide limited service during system disruptions, we do not have fully redundant systems, and ourformal disaster recovery plan does not include restoration of all services. For example, we have backupfacilities at our disaster recovery site that enable us, in the case of complete failure of our main NorthAmerica data center, to recover and complete all pending transactions, provide customers with accessto their accounts to deposit or withdraw money, transfer positions to other brokers and manage theirrisk by continuing trading through the use of marketable orders. These backup services are currently
29

limited to U.S. markets. We do not currently have separate backup facilities dedicated to our non-U.S.operations. It is our intention to provide for and progressively deploy backup facilities for our globalfacilities over time. In addition, we do not carry business interruption insurance to compensate forlosses that could occur to the extent not required. Any system failure that causes an interruption in ourservice or decreases the responsiveness of our service could impair our reputation, damage our brandname and materially adversely affect our business, financial condition and results of operations.
Failure of third-party systems on which we rely could adversely affect our business.
We rely on certain third-party computer systems or third-party service providers, including clearingsystems, exchange systems, Internet service, communications facilities and other facilities. Anyinterruption in these third-party services, or deterioration in their performance, could be disruptive toour business. If our arrangement with any third party is terminated, we may not be able to find analternative source of systems support on a timely basis or on commercially reasonable terms. This couldhave a material adverse effect on our business, financial condition and results of operations.
We face competition in our market making activities.
In our market making activities, we compete with other firms based on our ability to provideliquidity at competitive prices and to attract order flow. These firms include registered market makersas well as high frequency trading firms (‘‘HFTs’’) that act as market makers. Both types of competitorsrange from sole proprietors with very limited resources to a few highly sophisticated groups which havesubstantially greater financial and other resources, including research and development personnel, thanwe do. These larger and better capitalized competitors may be better able to respond to changes in themarket making industry, to compete for skilled professionals, to finance acquisitions, to fund internalgrowth and to compete for market share generally. HFTs that are not registered market makers havecertain advantages over registered market making firms that may allow them to bypass regulatoryrestrictions and trade more quickly and cheaply than registered market makers at some exchanges. Wemay not be able to compete effectively against HFTs or market makers with greater financial resources,and our failure to do so could materially and adversely affect our business, financial condition andresults of operations. As in the past, we may in the future face enhanced competition, resulting innarrowing bid/offer spreads in the marketplace that may adversely impact our financial performance.This is especially likely if HFTs continue to receive advantages in capturing order flow or if others canacquire systems that enable them to predict markets or process trades more efficiently than we can.
Our direct market access clearing and non-clearing brokerage operations face intense competition.
With respect to our direct market access brokerage business, the market for electronic andinteractive bidding, offering and trading services in connection with equities, options and futures isrelatively new, rapidly evolving and intensely competitive. We expect competition to continue andintensify in the future. Our current and potential future competition principally comes from fivecategories of competitors:
• prime brokers who, in an effort to satisfy the demands of their customers for hands-onelectronic trading facilities, universal access to markets, smart routing, better trading tools, lowercommissions and financing rates, have embarked upon building such facilities and productenhancements;
• direct market access and online options and futures firms;
• direct market access and online equity brokers;
• software development firms and vendors who create global trading networks and analytical toolsand make them available to brokers; and
• traditional brokers.
30
In addition, we compete with financial institutions, mutual fund sponsors and other organizations,many of which provide online, direct market access or other investing services. A number of brokersprovide our technology and execution services to their customers, and these brokers will become ourcompetitors if they develop their own technology. Some of our competitors in this area have greatername recognition, longer operating histories and significantly greater financial, technical, marketing andother resources than we have and offer a wider range of services and financial products than we do.Some of our competitors may also have an ability to charge lower commissions. We cannot assure youthat we will be able to compete effectively or efficiently with current or future competitors. Theseincreasing levels of competition in the online trading industry could significantly harm this aspect of ourbusiness.
We are subject to risks relating to litigation and potential securities laws liability.
We are exposed to substantial risks of liability under federal and state securities laws, other federaland state laws and court decisions, as well as rules and regulations promulgated by the SEC, the CFTC,the Federal Reserve, state securities regulators, the self-regulatory organizations and foreign regulatoryagencies. We are also subject to the risk of litigation and claims that may be without merit. We couldincur significant legal expenses in defending ourselves against and resolving lawsuits or claims. Anadverse resolution of any future lawsuits or claims against us could result in a negative perception ofour company and cause the market price of our common stock to decline or otherwise have an adverseeffect on our business, financial condition and/or operating results. See Part I, Item 3, ‘‘LegalProceedings and Regulatory Matters.’’
Any future acquisitions may result in significant transaction expenses, integration and consolidation risks andrisks associated with entering new markets, and we may be unable to profitably operate our consolidatedcompany.
Although our growth strategy has not focused historically on acquisitions, we may in the futureengage in evaluations of potential acquisitions and new businesses. We may not have the financialresources necessary to consummate any acquisitions in the future or the ability to obtain the necessaryfunds on satisfactory terms. Any future acquisitions may result in significant transaction expenses andrisks associated with entering new markets in addition to integration and consolidation risks. Becauseacquisitions historically have not been a core part of our growth strategy, we have no materialexperience in successfully utilizing acquisitions. We may not have sufficient management, financial andother resources to integrate any such future acquisitions or to successfully operate new businesses andwe may be unable to profitably operate our expanded company.
Internet-related issues may reduce or slow the growth in the use of our services in the future.
Critical issues concerning the commercial use of the Internet, such as ease of access, security,privacy, reliability, cost, and quality of service, remain unresolved and may adversely impact the growthof Internet use. If Internet usage continues to increase rapidly, the Internet infrastructure may not beable to support the demands placed on it by this growth, and its performance and reliability maydecline. Although our larger institutional customers use leased data lines to communicate with us, ourability to increase the speed with which we provide services to consumers and to increase the scope andquality of such services is limited by and dependent upon the speed and reliability of our customers’access to the Internet, which is beyond our control. If periods of decreased performance, outages ordelays on the Internet occur frequently or other critical issues concerning the Internet are not resolved,overall Internet usage or usage of our web based products could increase more slowly or decline, whichwould cause our business, results of operations and financial condition to be materially and adverselyaffected.
31

Our computer infrastructure may be vulnerable to security breaches. Any such problems could jeopardizeconfidential information transmitted over the Internet, cause interruptions in our operations or cause us tohave liability to third persons.
Our computer infrastructure is potentially vulnerable to physical or electronic computer break-ins,viruses and similar disruptive problems and security breaches. Any such problems or security breachescould cause us to have liability to one or more third parties, including our customers, and disrupt ouroperations. A party able to circumvent our security measures could misappropriate proprietaryinformation or customer information, jeopardize the confidential nature of information transmittedover the Internet or cause interruptions in our operations. Concerns over the security of Internettransactions and the privacy of users could also inhibit the growth of the Internet or the electronicbrokerage industry in general, particularly as a means of conducting commercial transactions. To theextent that our activities involve the storage and transmission of proprietary information such aspersonal financial information, security breaches could expose us to a risk of financial loss, litigationand other liabilities. Our estimated annual losses from reimbursements to customers whose accountshave been negatively affected by unauthorized access have historically been less than $500,000 annually,but instances of unauthorized access of customer accounts have been increasing recently on anindustry-wide basis. Our current insurance program may protect us against some, but not all, of suchlosses. Any of these events, particularly if they (individually or in the aggregate) result in a loss ofconfidence in our company or electronic brokerage firms in general, could have a material adverseeffect on our business, results of operations and financial condition.
We may not be able to protect our intellectual property rights or may be prevented from using intellectualproperty necessary for our business.
We rely primarily on trade secret, contract, copyright, patent and trademark laws to protect ourproprietary technology. It is possible that third parties may copy or otherwise obtain and use ourproprietary technology without authorization or otherwise infringe on our rights. We may also faceclaims of infringement that could interfere with our ability to use technology that is material to ourbusiness operations.
In the future, we may have to rely on litigation to enforce our intellectual property rights, protectour trade secrets, determine the validity and scope of the proprietary rights of others or defend againstclaims of infringement or invalidity. Any such litigation, whether successful or unsuccessful, could resultin substantial costs and the diversion of resources and the attention of management, any of which couldnegatively affect our business.
Our future success will depend on our response to the demand for new services, products and technologies.
The demand for market making services, particularly services that rely on electroniccommunications gateways, is characterized by:
• rapid technological change;
• changing customer demands;
• the need to enhance existing services and products or introduce new services and products; and
• evolving industry standards.
New services, products and technologies may render our existing services, products andtechnologies less competitive. Our future success will depend, in part, on our ability to respond to thedemand for new services, products and technologies on a timely and cost-effective basis and to adapt totechnological advancements and changing standards to address the increasingly sophisticatedrequirements and varied needs of our customers and prospective customers. We cannot assure you that
32

we will be successful in developing, introducing or marketing new services, products and technologies.In addition, we may experience difficulties that could delay or prevent the successful development,introduction or marketing of these services and products, and our new service and productenhancements may not achieve market acceptance. Any failure on our part to anticipate or respondadequately to technological advancements, customer requirements or changing industry standards, orany significant delays in the development, introduction or availability of new services, products orenhancements could have a material adverse effect on our business, financial condition and operatingresults.
The expansion of our market making activities into forex-based products entails significant risk, andunforeseen events in such business could have an adverse effect on our business, financial condition andresults of operation.
Over the past several years we entered into market making for forex-based products. This includesthe trading of cash in foreign currencies with banks and exchange-listed futures, options on futures,options on cash deposits and currency-based ETFs. All of the risks that pertain to our market makingactivities in equity-based products also apply to our forex-based market making. In addition, we havecomparatively less experience in the forex markets and even though we are expanding this activityslowly, any kind of unexpected event can occur that can result in great financial loss.
We are subject to counterparty risk whereby defaults by parties with whom we do business can have anadverse effect on our business, financial condition and/or operating results.
In our electronic brokerage business, our customer margin credit exposure is to a great extentmitigated by our policy of automatically evaluating each account throughout the trading day and closingout positions automatically for accounts that are found to be under-margined. While this methodologyis effective in most situations, it may not be effective in situations in which no liquid market exists forthe relevant securities or commodities or in which, for any reason, automatic liquidation for certainaccounts has been disabled. If no liquid market exists or automatic liquidation has been disabled, weare subject to risks inherent in extending credit, especially during periods of rapidly declining markets.Any loss or expense incurred due to defaults by our customers in failing to repay margin loans or tomaintain adequate collateral for these loans would cause harm to our business.
We have identified a material weakness in our internal control over financial reporting.
Our management is responsible for establishing and maintaining adequate internal control overour financial reporting, as defined in Rule 13a-15(f) under the Securities Exchange Act of 1934. Asdisclosed in Item 9A, ‘‘Controls and Procedures,’’ management identified a material weakness in ourinternal control over financial reporting related to the review and interpretation of complex accountingissues, specifically, redeemable noncontrolling interests in IBG LLC attributable to Holdings and stockbased compensation. A material weakness is defined as a deficiency, or combination of deficiencies, ininternal control over financial reporting, such that a reasonable possibility exists that a materialmisstatement of our annual or interim financial statements will not be prevented or detected on atimely basis. As a result of this material weakness, our management concluded that our internal controlover financial reporting and related disclosure controls and procedures were not effective based oncriteria set forth by the Committee of Sponsoring Organization of the Treadway Commission inInternal Control—An Integrated Framework. We have been actively engaged in developing andimplementing a remediation plan designed to address this material weakness. As of December 31, 2012,we believe that significant progress has been made toward remediation. If our remedial measures areinsufficient to address the material weakness or if additional material weaknesses or significantdeficiencies in our internal control are discovered or occur in the future, our consolidated financial
33

statements may contain material misstatements and we could be required to restate our financialresults.
We may face risks related to recent restatements of our financial statements.
We previously restated our consolidated financial statements for the three years endedDecember 31, 2011 principally to correct for errors in the review and interpretation of complexaccounting issues, specifically, redeemable noncontrolling interests in IBG LLC attributable to Holdingsand stock based compensation. Companies that restate their financial statements sometimes facelitigation claims from third parties or stockholders and/or enforcement proceedings by the SECfollowing such a restatement. We could face monetary judgments, penalties or other sanctions whichcould adversely affect the financial condition, results of operations or cash flows of the Company orany of its subsidiaries and could cause our stock price to decline.
Risks related to delays in filing our financial statements for the quarter ended March 31, 2012.
The delayed filing of our Form 10-Q for the quarter ended March 31, 2012 rendered us ineligibleto file registration statements on Form S-3, or to use our existing shelf registration statement onForm S-3. We expect future filings to be submitted timely and that in September 2013 we will againbecome eligible to file a Form S-3 registration statement as a ‘‘well known seasoned issuer’’.
34

ITEM 1B. UNRESOLVED STAFF COMMENTS
None.
ITEM 2. PROPERTIES
Our headquarters are located in Greenwich, Connecticut. We also lease facilities in 14 otherlocations throughout parts of the world where we conduct our operations as set forth below. Unlessotherwise indicated, all properties are used by both our market making and electronic brokeragesegments. We believe our present facilities, together with our current options to extend lease terms, areadequate for our current needs.
The following table sets forth certain information with respect to our leased facilities:
Location Space (sq. feet) Expiration Principal Usage
Greenwich, CT . . . . . . . . . . . . . . . . . . . . . . 81,266 2019 Headquarters and data centerGreenwich, CT . . . . . . . . . . . . . . . . . . . . . . 37,404 2019 Office spaceJersey City, NJ . . . . . . . . . . . . . . . . . . . . . . 5,869 2018 Office spaceChicago, IL . . . . . . . . . . . . . . . . . . . . . . . . 61,492 2017 Office space and data centerWashington, D.C. . . . . . . . . . . . . . . . . . . . . 745 2013 Office spaceMontreal, Canada . . . . . . . . . . . . . . . . . . . . 4,566 2014 Office spaceLondon, United Kingdom . . . . . . . . . . . . . . 2,283 2015 Office spaceZug, Switzerland . . . . . . . . . . . . . . . . . . . . . 27,115 2015 Office space and data centerSydney, Australia . . . . . . . . . . . . . . . . . . . . 2,649 2014 Office spaceHong Kong . . . . . . . . . . . . . . . . . . . . . . . . 7,846 2015 Office space and data centerBudapest, Hungary . . . . . . . . . . . . . . . . . . . 4,297 2013 Office spaceSt. Petersburg, Russia . . . . . . . . . . . . . . . . . 2,563 2013 Office spaceTallinn, Estonia . . . . . . . . . . . . . . . . . . . . . 3,638 2016 Office spaceMumbai, India . . . . . . . . . . . . . . . . . . . . . . 5,700 2015 Office spaceTokyo, Japan . . . . . . . . . . . . . . . . . . . . . . . 2,161 2014 Office spaceShanghai, China . . . . . . . . . . . . . . . . . . . . . 2,177 2014 Office space
ITEM 3. LEGAL PROCEEDINGS AND REGULATORY MATTERS
The securities industry is highly regulated and many aspects of our business involve substantial riskof liability. In recent years, there has been an increasing incidence of litigation involving the securitiesbrokerage industry, including class action suits that generally seek substantial damages, including insome cases punitive damages. Compliance and trading problems that are reported to federal, state andprovincial securities regulators, securities exchanges or other self-regulatory organizations by dissatisfiedcustomers are investigated by such regulatory bodies, and, if pursued by such regulatory body or suchcustomers, may rise to the level of arbitration or disciplinary action. We are also subject to periodicregulatory audits and inspections.
Like other securities brokerage firms, we have been named as a defendant in lawsuits and fromtime to time we have been threatened with, or named as a defendant in, arbitrations and administrativeproceedings. The following contains information regarding potentially material pending litigation andpending regulatory inquiries. We may in the future become involved in additional litigation orregulatory proceedings in the ordinary course of our business, including litigation or regulatoryproceedings that could be material to our business.
Trading Technologies Matter
On February 3, 2010, Trading Technologies International, Inc. (‘‘Trading Technologies’’) filed acomplaint in the United States District Court for the Northern District of Illinois, Eastern Division,
35

against Interactive Brokers Group, Inc., IBG LLC, Holdings, and Interactive Brokers LLC. Thereafter,Trading Technologies dismissed Interactive Brokers Group, Inc. and Holdings from the case, leavingonly IBG LLC and Interactive Brokers LLC as defendants (‘‘Defendants’’). The operative complaint, asamended, alleges that the Defendants have infringed and continue to infringe twelve U.S. patents heldby Trading Technologies. Trading Technologies is seeking, among other things, unspecified damages andinjunctive relief. The case is in the early stages and discovery has yet to begin. While it is too early topredict the outcome of the matter, we believe we have meritorious defenses to the allegations made inthe complaint and intend to defend ourselves vigorously against them. However, litigation is inherentlyuncertain and there can be no guarantee that the Company will prevail or that the litigation can besettled on favorable terms.
Pending Regulatory Inquiries
IB’s businesses are heavily regulated by state, federal and foreign regulatory agencies as well asnumerous exchanges and self-regulatory organizations. IB’s various companies are regulated under statesecurities laws, U.S. and foreign securities, commodities and financial services laws and under the rulesof more than 25 exchanges and SROs. In the current era of dramatically heightened regulatory scrutinyof financial institutions, IB has incurred sharply increased compliance costs, along with the industry as awhole. Increased regulation also creates increased barriers to entry, however, and IB has built humanand automated infrastructure to handle increased regulatory scrutiny, which provides IB an advantageover potential newcomers to the business.
IB receives hundreds of regulatory inquiries each year in addition to being subject to frequentregulatory examinations. The great majority of these inquiries do not lead to fines or any further actionagainst IB. Most often, regulators do not inform IB as to when and if an inquiry has been concluded.IB is currently the subject of regulatory inquiries regarding topics such as order audit trail reporting,trade reporting, short sales, market making obligations, anti-money laundering, business continuityplanning and other topics of recent regulatory interest. There are no formal regulatory enforcementactions pending against IB’s regulated entities, except as specifically disclosed herein and IB is unawareof any specific regulatory matter that, itself, or together with similar regulatory matters, would have amaterial impact on IB’s financial condition. Nonetheless, in the current climate, we expect to paysignificant regulatory fines on various topics on an ongoing basis, as other regulated financial servicesbusinesses do. The amount of any fines, and when and if they will be incurred, is impossible to predictgiven the nature of the regulatory process.
ITEM 4. MINE SAFETY DISCLOSURES
Not applicable.
36
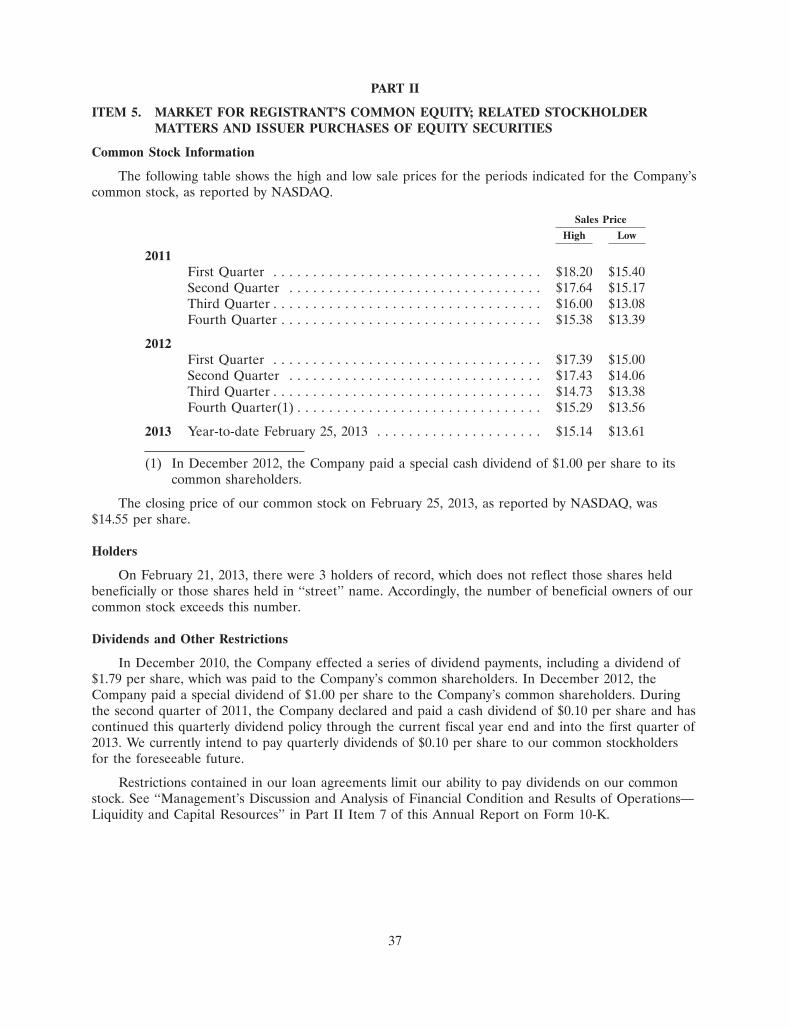
PART II
ITEM 5. MARKET FOR REGISTRANT’S COMMON EQUITY; RELATED STOCKHOLDERMATTERS AND ISSUER PURCHASES OF EQUITY SECURITIES
Common Stock Information
The following table shows the high and low sale prices for the periods indicated for the Company’scommon stock, as reported by NASDAQ.
Sales Price
High Low
2011First Quarter . . . . . . . . . . . . . . . . . . . . . . . . . . . . . . . . . . $18.20 $15.40Second Quarter . . . . . . . . . . . . . . . . . . . . . . . . . . . . . . . . $17.64 $15.17Third Quarter . . . . . . . . . . . . . . . . . . . . . . . . . . . . . . . . . . $16.00 $13.08Fourth Quarter . . . . . . . . . . . . . . . . . . . . . . . . . . . . . . . . . $15.38 $13.39
2012First Quarter . . . . . . . . . . . . . . . . . . . . . . . . . . . . . . . . . . $17.39 $15.00Second Quarter . . . . . . . . . . . . . . . . . . . . . . . . . . . . . . . . $17.43 $14.06Third Quarter . . . . . . . . . . . . . . . . . . . . . . . . . . . . . . . . . . $14.73 $13.38Fourth Quarter(1) . . . . . . . . . . . . . . . . . . . . . . . . . . . . . . . $15.29 $13.56
2013 Year-to-date February 25, 2013 . . . . . . . . . . . . . . . . . . . . . $15.14 $13.61
(1) In December 2012, the Company paid a special cash dividend of $1.00 per share to itscommon shareholders.
The closing price of our common stock on February 25, 2013, as reported by NASDAQ, was$14.55 per share.
Holders
On February 21, 2013, there were 3 holders of record, which does not reflect those shares heldbeneficially or those shares held in ‘‘street’’ name. Accordingly, the number of beneficial owners of ourcommon stock exceeds this number.
Dividends and Other Restrictions
In December 2010, the Company effected a series of dividend payments, including a dividend of$1.79 per share, which was paid to the Company’s common shareholders. In December 2012, theCompany paid a special dividend of $1.00 per share to the Company’s common shareholders. Duringthe second quarter of 2011, the Company declared and paid a cash dividend of $0.10 per share and hascontinued this quarterly dividend policy through the current fiscal year end and into the first quarter of2013. We currently intend to pay quarterly dividends of $0.10 per share to our common stockholdersfor the foreseeable future.
Restrictions contained in our loan agreements limit our ability to pay dividends on our commonstock. See ‘‘Management’s Discussion and Analysis of Financial Condition and Results of Operations—Liquidity and Capital Resources’’ in Part II Item 7 of this Annual Report on Form 10-K.
37
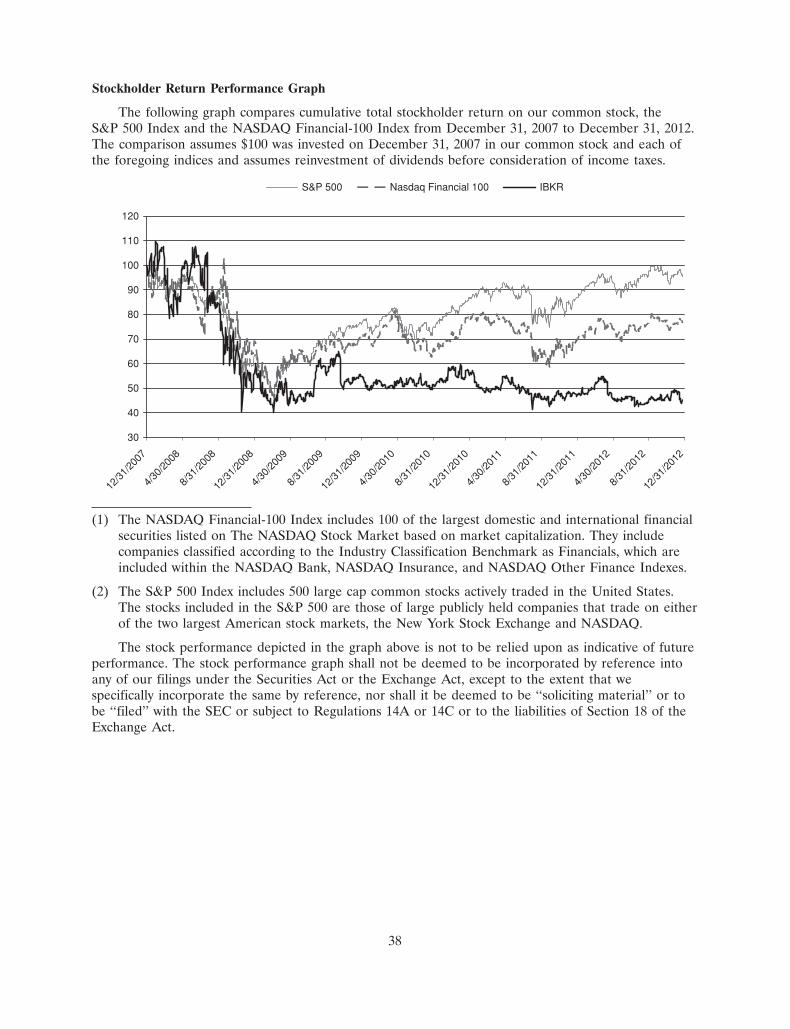
6MAR201318294238
Stockholder Return Performance Graph
The following graph compares cumulative total stockholder return on our common stock, theS&P 500 Index and the NASDAQ Financial-100 Index from December 31, 2007 to December 31, 2012.The comparison assumes $100 was invested on December 31, 2007 in our common stock and each ofthe foregoing indices and assumes reinvestment of dividends before consideration of income taxes.
30
40
50
60
70
80
90
100
110
120
12/3
1/20
07
4/30
/200
8
8/31
/200
8
12/3
1/20
08
4/30
/200
9
8/31
/200
9
12/3
1/20
09
4/30
/201
0
8/31
/201
0
12/3
1/20
10
4/30
/201
1
8/31
/201
1
12/3
1/20
11
4/30
/201
2
8/31
/201
2
12/3
1/20
12
S&P 500 Nasdaq Financial 100 IBKR
(1) The NASDAQ Financial-100 Index includes 100 of the largest domestic and international financialsecurities listed on The NASDAQ Stock Market based on market capitalization. They includecompanies classified according to the Industry Classification Benchmark as Financials, which areincluded within the NASDAQ Bank, NASDAQ Insurance, and NASDAQ Other Finance Indexes.
(2) The S&P 500 Index includes 500 large cap common stocks actively traded in the United States.The stocks included in the S&P 500 are those of large publicly held companies that trade on eitherof the two largest American stock markets, the New York Stock Exchange and NASDAQ.
The stock performance depicted in the graph above is not to be relied upon as indicative of futureperformance. The stock performance graph shall not be deemed to be incorporated by reference intoany of our filings under the Securities Act or the Exchange Act, except to the extent that wespecifically incorporate the same by reference, nor shall it be deemed to be ‘‘soliciting material’’ or tobe ‘‘filed’’ with the SEC or subject to Regulations 14A or 14C or to the liabilities of Section 18 of theExchange Act.
38

Securities Authorized for Issuance under Equity Compensation Plans
The following table provides information about shares of common stock available for future awardsunder all of the Company’s equity compensation plans as of December 31, 2012. The Company has notmade grants of common stock outside of its equity compensation plans:
Number of securities to be Number of securitiesissued upon exercise of Weighted-average exercise remaining available for
outstanding options, price of outstanding options future issuance underwarrants and rights warrants and rights equity compensation plans(1)
Equity compensation plansapproved by securityholders . . . . . . . . . . . . . . N/A N/A 2,694,537
Equity compensation plansnot approved by securityholders . . . . . . . . . . . . . . N/A N/A —
Total . . . . . . . . . . . . . . . . . — — 2,694,537
(1) Amount represents shares available for future issuance of grants under the Company’s 2007 StockIncentive Plan (‘‘SIP’’). The amount excludes forfeitures and shares purchased from employees tosatisfy their tax withholding obligations for vested shares, which are held as treasury stock. OnJune 15, 2011, the Company filed a Registration Statement on Form S-8 (File No. 333-174913) toregister an additional 10,800,000 shares to be distributed under the SIP. This increased the totalnumber of shares available to be distributed under this plan to 20,000,000 shares, from 9,200,000shares. There are no shares available for future issuance of grants under the 2007 ROI Unit StockPlan; all shares under this plan have been granted.
39

ITEM 6. SELECTED FINANCIAL DATA
The following tables set forth selected historical consolidated financial and other data of IBG, Inc.They are presented for the years ended, and as of, December 31, 2008, 2009, 2010, 2011 and 2012.
On May 3, 2007, IBG, Inc. priced its initial public offering of shares of Common Stock. Inconnection with the IPO, IBG, Inc. purchased 10.0% of the membership interests in IBG LLC, becamethe sole managing member for IBG LLC and began to consolidate IBG LLC’s financial results into itsfinancial statements. The consolidated statements of financial condition data as of December 31, 2008,2009, 2010, 2011 and 2012 reflect the audited condensed consolidated statements of financial conditionof IBG, Inc. and its subsidiaries.
The following selected historical consolidated financial and other data should be read inconjunction with ‘‘Management’s Discussion and Analysis of Financial Condition and Results of
40

Operations,’’ and the audited consolidated financial statements and related notes included elsewhere inthis Annual Report on Form 10-K.
Year Ended December 31,
2012 2011 2010 2009 2008
(in millions, except share and per share data)Consolidated Statement of Comprehensive Income Data:Revenues:
Trading gains . . . . . . . . . . . . . . . . . . . . . . . . . . $ 435.1 $ 665.2 $ 368.6 $ 633.9 $ 1,304.0Commissions and execution fees . . . . . . . . . . . . . 412.6 456.2 386.8 353.0 359.5Interest income . . . . . . . . . . . . . . . . . . . . . . . . 268.4 280.2 172.5 121.6 437.2Other income . . . . . . . . . . . . . . . . . . . . . . . . . 76.4 43.0 60.4 61.3 81.7
Total revenues . . . . . . . . . . . . . . . . . . . . . . . 1,192.5 1,444.6 988.3 1,169.8 2,182.4
Interest expense . . . . . . . . . . . . . . . . . . . . . . . . 62.0 86.3 66.2 69.5 332.0
Total net revenues . . . . . . . . . . . . . . . . . . . . . 1,130.5 1,358.3 922.1 1,100.3 1,850.4
Non-interest expenses:Execution and clearing . . . . . . . . . . . . . . . . . . . 251.0 281.3 272.6 273.2 322.7Employee compensation and benefits . . . . . . . . . . 244.5 216.3 203.6 182.0 164.9Occupancy, depreciation and amortization . . . . . . . 38.8 37.1 37.3 40.4 37.7Communications . . . . . . . . . . . . . . . . . . . . . . . 23.3 23.6 23.5 22.8 18.7General and administrative . . . . . . . . . . . . . . . . . 45.9 58.9 47.7 43.6 63.3
Total non-interest expenses . . . . . . . . . . . . . . . 603.5 617.2 584.7 562.0 607.3
Income before income taxes . . . . . . . . . . . . . . . . . . . 527.0 741.1 337.4 538.3 1,243.1Income tax expense . . . . . . . . . . . . . . . . . . . . . . . . 30.0 53.9 60.3 54.1 128.0
Net Income . . . . . . . . . . . . . . . . . . . . . . . . . . . . . . 497.0 687.2 277.1 484.2 1,115.1Less Income attributable to noncontrolling interests(1) 456.3 625.3 286.7 448.4 1,022.5
Net income (loss) attributable to commonstockholders(2) . . . . . . . . . . . . . . . . . . . . . . . . . . $ 40.7 $ 61.9 $ (9.6) $ 35.8 $ 92.6
Earnings per share(2)Basic . . . . . . . . . . . . . . . . . . . . . . . . . . . . . . . $ 0.89 $ 1.39 $ (0.23) $ 0.80 $ 2.38
Diluted . . . . . . . . . . . . . . . . . . . . . . . . . . . . . $ 0.89 $ 1.37 $ (0.23) $ 0.79 $ 2.32
Weighted average common shares outstandingBasic . . . . . . . . . . . . . . . . . . . . . . . . . . . . . . . 46,814,676 43,924,554 41,870,926 40,973,290 40,434,273Diluted . . . . . . . . . . . . . . . . . . . . . . . . . . . . . 47,070,522 44,364,902 42,498,705 41,799,489 41,461,018
Comprehensive income:Net income (loss) . . . . . . . . . . . . . . . . . . . . . . . $ 40.7 $ 61.9 $ (9.6) $ 35.8 $ 92.6Other comprehensive income (loss):
Cumulative translation adjustment, before incometaxes . . . . . . . . . . . . . . . . . . . . . . . . . . . . 2.2 (4.5) 16.3 11.1 (0.3)
Income taxes related to items of othercomprehensive income(3) . . . . . . . . . . . . . . . (9.1) (1.8) 6.0 4.1 (0.1)
Other comprehensive income (loss), net of tax . . . . 11.3 (2.7) 10.3 7.0 (0.2)
Comprehensive income attributable to commonstockholders . . . . . . . . . . . . . . . . . . . . . . . . . . . . $ 52.0 $ 59.2 $ 0.7 $ 42.8 $ 92.4
Comprehensive income attributable to noncontrollinginterests:
Net income attributable to noncontrolling interests . $ 456.3 $ 625.3 $ 286.7 $ 448.4 $ 1,022.5Other comprehensive income (loss)—cumulative
translation adjustment . . . . . . . . . . . . . . . . . . 17.0 (27.8) 132.2 93.7 (1.4)
Comprehensive income attributable to noncontrollinginterests . . . . . . . . . . . . . . . . . . . . . . . . . . . . . . $ 473.3 $ 597.5 $ 418.9 $ 542.1 $ 1,021.1
(1) Adoption of SFAS No. 160, Noncontrolling Interests in Consolidated Financial Statements, an amendment of ARBNo. 51, now a sub-topic within ASC 810-10, Consolidation, as of January 1, 2009 required the Company to reportnoncontrolling interests in subsidiaries (formerly reported as ‘‘minority interests’’). ASC 810-10 also required changes in
41

presentation and retrospective disclosure of noncontrolling interests in the statements of income for all periodspresented. Net income attributable to noncontrolling interests in subsidiaries of IBG LLC, which is collectivelyimmaterial, has been reclassified from other income to net income attributable to noncontrolling interests for allperiods presented.
(2) In 2011, earnings per share were impacted by a tax benefit that the Company recognized during preparation of its 2010income tax returns. In connection with the special dividend paid by our Swiss operating company in December 2010,we were able to capture additional foreign tax credits, which resulted in an estimated $0.12 increase in diluted earningsper share.
In December 2010, we effected a series of dividend payments, culminating in a cash dividend of $1.79 per share, whichwas paid to holders of IBKR common stock. Funding for this dividend originated with our Swiss company and wasmade from earnings that were not previously taxed in the U.S. As a result, this triggered a U.S. federal income taxliability for the Company, which was reported as income tax expense in the consolidated statement of comprehensiveincome. This income tax liability was funded by reserving a portion of the dividend that the Company received. Theremaining after-tax amount was paid to the Company’s common stockholders. The result was cash-flow neutral for thepublic company.
During 2010, the Company also paid a dividend equivalent to employees holding unvested shares in our StockIncentive Plan which was recorded as compensation expense.
In summary, the 2010 transactions reduced diluted EPS by approximately $0.71 for the year ended December 31, 2010.
On a Non-GAAP basis, which excludes the effect of this non-operating item, diluted earnings per share were:
Year endedDecember 31,
2010
Diluted earnings per share as reported . . . . . . . . . . . . . . . . . . . . . . . . . . . . . . . . . . $(0.23)Effect of special dividend on earnings per share . . . . . . . . . . . . . . . . . . . . . . . . . . . . 0.71
Adjusted diluted earnings per share . . . . . . . . . . . . . . . . . . . . . . . . . . . . . . . . . . . . $ 0.48
This Non-GAAP measure is discussed in further detail in ‘‘Non-GAAP Financial Measures’’ and for a full GAAP toNon-GAAP reconciliation see ‘‘GAAP to Non-GAAP Reconciliation and Footnotes’’ in ‘‘Management’s Discussion andAnalysis of Financial Condition and Results of Operations’’ on page 78 in this Annual Report on Form 10-K.
(3) During the preparation of the consolidated financial statements for the year ended December 31, 2012, the Companydetermined that deferred income taxes had been provided for on OCI for certain of its foreign subsidiaries in error.Accordingly, deferred income taxes of $9.2 million, previously provided on OCI in periods from 2007 through 2011,were reversed.
December 31,
2012 2011 2010 2009 2008
(in millions)Cash, cash equivalents and short-term investments(1) . . . . . . $14,525.9 $12,140.8 $ 9,578.6 $ 7,948.5 $ 6,651.4Total assets(2)(3) . . . . . . . . . . . . . . . . . . . . . . . . . . . . . . $33,199.6 $30,404.4 $28,500.0 $26,606.7 $28,357.5Total liabilities(3) . . . . . . . . . . . . . . . . . . . . . . . . . . . . . $28,386.5 $25,592.4 $24,207.0 $21,644.0 $23,887.6Redeemable noncontrolling interests(4) . . . . . . . . . . . . . . . $ 0.0 $ 5,269.6 $ 6,320.8 $ 6,318.4 $ 6,396.8Stockholders’ equity(5) . . . . . . . . . . . . . . . . . . . . . . . . . . $ 598.5 $ (459.5) $(2,029.2) $(1,356.8) $(1,927.7)Non-controlling interests . . . . . . . . . . . . . . . . . . . . . . . . . $ 4,214.6 $ 1.8 $ 1.5 $ 1.2 $ 0.9
(1) Cash, cash equivalents and short-term investments represent cash and cash equivalents, cash and securities segregatedunder federal and other regulations, short-term investments and securities purchased under agreements to resell.
(2) At December 31, 2012, approximately $32.77 billion, or 98.7%, of total assets were considered to be liquid andconsisted primarily of cash, marketable securities and collateralized receivables.
(3) As a result of our acquisition from Holdings of IBG LLC membership interests, we received not only an interest inIBG LLC but also, for federal income tax purposes, a step-up to the federal income tax basis of the assets of IBG LLCunderlying such additional interest. This increased tax basis is expected to result in tax benefits as a result of increasedamortization deductions. We will retain 15% of the tax benefits actually realized. As set forth in the tax receivableagreement we entered into with Holdings, we will pay the remaining 85% of the realized tax benefits relating to anyapplicable tax year to Holdings. The deferred tax asset was $281.6 million, $297.9 million, $313.6 million, $333.3 million
42

and $351.6 million and the corresponding payable to Holdings was $258.6 million, $271.6 million, $284.9 million,$299.0 million and $313.8 million at December 31, 2012, 2011, 2010, 2009 and 2008, respectively.
(4) As discussed in Note 4 to the consolidated financial statements included elsewhere in this Annual Report onForm 10-K, prior to June 6, 2012, the Company reported Holdings’ interests in IBG LLC as redeemable noncontrollinginterests, at redemption value and separate from equity. Redemption value for these redeemable noncontrollinginterests was measured as the number of equivalent shares of IBG LLC member interests owned by Holdingsmultiplied by the then current market price per share of the Company’s common stock. The excess of the redemptionvalue over the book value of these interests, which did not affect net income attributable to common stockholders orcash flows, was required to be accounted for as a reduction of the Company’s stockholders’ equity in the consolidatedstatement of financial condition. These fair value adjustments had the effect of decreasing reported stockholders’ equityby $1.0 billion, $2.5 billion, $1.9 billion and $2.4 billion as of December 31, 2011, 2010, 2009 and 2008, respectively.Accordingly, the above condensed consolidated statement of financial condition information is presented as if ASC810-10 and ASC 480-10-S99 had been applied historically.
(5) In December of 2010 and 2012, the Company paid special cash dividends of $1.79 and $1.00 per share, respectively, toholders of the Company’s common stock. The payment of these dividends resulted in a decrease in the Company’sstockholders’ equity (deficit) balances from prior years.
43
ITEM 7. MANAGEMENT’S DISCUSSION AND ANALYSIS OF FINANCIAL CONDITION ANDRESULTS OF OPERATIONS
The following discussion should be read in conjunction with the audited consolidated financialstatements and the related notes in Item 8, included elsewhere in this report. In addition to historicalinformation, the following discussion also contains forward-looking statements that include risks anduncertainties. Our actual results may differ materially from those anticipated in these forward-lookingstatements as a result of certain factors, including those set forth under the heading ‘‘Risk Factors’’ inPart I, Item 1A of this Annual Report on Form 10-K.
Business Overview
We are an automated global electronic market maker and broker specializing in routing orders andexecuting and processing trades in securities, futures and foreign exchange instruments on more than100 electronic exchanges and trading venues around the world. Since our inception in 1977, we havefocused on developing proprietary software to automate broker-dealer functions. The advent ofelectronic exchanges in the last 22 years has provided us with the opportunity to integrate our softwarewith an increasing number of exchanges and trading venues into one automatically functioning,computerized platform that requires minimal human intervention.
In connection with our IPO priced on May 3, 2007, IBG, Inc. purchased 10.0% of the membershipinterests in IBG LLC, became the sole managing member of IBG LLC and began to consolidateIBG LLC’s financial results into its financial statements.
Overview of Recapitalization Transactions and Our Organizational Structure
Prior to the IPO, we had historically conducted our business through a limited liability companystructure. Our primary assets are our ownership of approximately 11.9% of the membership interests ofIBG LLC, the current holding company for our businesses, and our controlling interest and relatedcontractual rights as the sole managing member of IBG LLC. The remaining approximately 88.1% ofIBG LLC membership interests are held by Holdings, a holding company that is owned by our founder,Chairman and Chief Executive Officer, Thomas Peterffy, and his affiliates, management and otheremployees of IBG LLC, and certain other members. The IBG LLC membership interests held byHoldings will be subject to purchase by us over time in connection with offerings by us of shares of ourcommon stock.
Purchases of IBG LLC membership interests, held by Holdings, by the Company are governed bythe Exchange Agreement, a copy of which was filed as an exhibit to our Quarterly Report onForm 10-Q for the quarter ended September 30, 2009 and filed with the SEC on November 9, 2009.The Exchange Agreement, as amended June 6, 2012, provides that the Company may facilitate theredemption by Holdings of interests held by its members through the issuance of shares of commonstock through a public offering in exchange for the interests in IBG LLC being redeemed by Holdings.The June 6, 2012 amendment (the ‘‘Amendment’’), which was filed as an exhibit to our Form 8-K filedwith the SEC on June 6, 2012, eliminated from the Exchange Agreement an alternative fundingmethod, which provided that upon approval by the board of directors and by agreement of theCompany, IBG LLC and Holdings, redemptions could be made in cash.
At the time of the Company’s IPO in 2007, three hundred sixty (360) million shares of authorizedCommon Stock were reserved for future sales and redemptions. From 2008 through 2010, Holdingsredeemed 5,013,259 IBG LLC shares for a total of $114 million, which redemptions were funded usingcash on hand at IBG LLC. Upon cash redemption these IBG LLC shares were retired.
In June 2011, with the consent of Holdings and the Company (on its own behalf and acting as thesole managing member of IBG LLC), IBG LLC agreed to redeem certain membership interests from
44

Holdings through the sale of common stock and to distribute the proceeds of such sale to the beneficialowners of such membership interests. On August 4, 2011, the Company filed a ‘‘shelf’’ RegistrationStatement on Form S-3 with the SEC for the issuance of additional shares in connection with Holdingsrequesting redemption of a portion of its member interests in IBG LLC. On August 4, 2011, aProspectus Supplement (File Number 333-176053) was filed by the Company with the SEC to issue1,983,624 shares of common stock (with a fair value of $29 million) in exchange for an equivalentnumber of shares of member interests in IBG LLC.
As part of a redeployment of the Company’s capital to its shareholders, the Company affected aseries of dividend payments, including a dividend of $1.79 per share, which was paid to the Company’scommon shareholders in December 2010. In December 2012, the company declared and paid a specialdividend of $1.00 per share to its common shareholders. During the second quarter of 2011, theCompany declared and paid a cash dividend of $0.10 per share and has continued this quarterlydividend policy through the current fiscal year end. We expect to pay a quarterly dividend of $0.10 pershare to our common stockholders for the foreseeable future.
Business Segments
The Company reports its results in two business segments, electronic brokerage and marketmaking. These segments are analyzed separately as we derive our revenues from these two principalbusiness activities as well as allocate resources and assess performance.
• Electronic Brokerage. We conduct our electronic brokerage business through our IB subsidiaries.As an electronic broker, we execute, clear and settle trades globally for both institutional andindividual customers. Capitalizing on the technology originally developed for our market makingbusiness, IB’s systems provide our customers with the capability to monitor multiple marketsaround the world simultaneously and to execute trades electronically in these markets at a lowcost, in multiple products and currencies from a single trading account. We offer our customersaccess to all classes of tradable, primarily exchange-listed products, including stocks, bonds,options, futures, forex and mutual funds traded on more than 100 exchanges and market centersand in 20 countries around the world seamlessly.
• Market Making. We conduct our market making business through our TH subsidiaries. As one ofthe largest market makers on many of the world’s leading exchanges, we provide liquidity byoffering competitively tight bid/offer spreads over a broad base of over 867,000 tradable,exchange-listed products. As principal, we commit our own capital and derive revenues or incurlosses from the difference between the price paid when securities are bought and the pricereceived when those securities are sold. Because we provide continuous bid and offer quotationsand we are continuously both buying and selling quoted securities, we may have either a long ora short position in a particular product at a given point in time. Our entire portfolio is evaluatedeach second and continuously rebalanced throughout the trading day, thus minimizing the risk ofour portfolio at all times. This real-time rebalancing of our portfolio, together with our real-timeproprietary risk management system, enables us to curtail risk and to be profitable in bothup-market and down-market scenarios.
Business Environment
Throughout 2012, investors endured an extended period of uncertainty as they awaited keyeconomic and political events to play out, including the continuation of talks to resolve the Euro zonedebt crisis, the U.S. presidential election and the looming fiscal cliff. Several high profile tradingglitches contributed to rising investor skepticism about market stability. Waning confidence by marketparticipants likely contributed to falling exchange traded volumes and volatility levels throughout theyear as investors were unsure where to invest and kept high levels of cash. These market conditions
45
dampened our results in both the electronic brokerage and market making segments, which rely ongrowing investor participation, trading volumes and higher volatility levels.
While our customer trading levels decreased in conjunction with these adverse market conditions,the decline was not as pronounced as that of the overall industry. Our daily average revenue trades bycleared customers declined 6% from the prior year, compared to a 9.6% decline in global tradingvolumes of exchange-listed equity based options and a 12.2% decline in U.S. trading volumes,according to data obtained from exchanges worldwide.
Despite the decrease in customer activity, we continued to see strong account growth as ourreputation for being the broker of choice amongst professional traders continued to spread, byword-of-mouth, through advertising and in favorable third-party reviews. Our customer accounts grewby 11% in 2012, which exceeded the annual growth rate of the larger electronic brokers. This growthwas predominantly in institutional accounts. Financial advisors, hedge and mutual funds, andproprietary trading firms were our fastest growing customer segments. We are benefiting from the surgein independent advisors, who are leaving traditional brokerage firms and require sophisticated tradeallocation technology, to manage complex portfolio strategies across several separately managedaccounts. We have also developed a niche by offering prime brokerage services to hedge funds that aretoo small to be serviced well by the larger investment banks.
The following is a summary of the key profit drivers that affect our business and how theycompared to the prior year:
Global trading volumes. According to data received from exchanges worldwide, volumes inexchange-listed equity-based options decreased by approximately 9.6% globally and 12.2% in the U.S.for the year ended December 31, 2012, as compared to 2011. During 2012 (2011) we accounted forapproximately 9.7% (9.9%) of the exchange-listed equity-based options (including options on ETFs andstock index products) volume traded worldwide and approximately 13.3% (13.4%) of exchange-listedequity-based options volume traded in the U.S. It is important to note that this metric is not directlycorrelated with our profits.
See the tables on pages 61-62 of this Annual Report on Form 10-K for additional details regardingour trade volumes, contract and share volumes and brokerage statistics.
Volatility. Our market making profits are generally correlated with market volatility since wetypically maintain an overall long volatility position, which protects us against a severe marketdislocation in either direction. Based on the Chicago Board Options Exchange Volatility Index(‘‘VIX�’’), the average volatility level fell to historic lows, averaging 18 in 2012, 26% lower than it wasduring 2011, While the VIX� spent 75 days above 30 in 2011, it never reached this level in 2012.
The ratio of actual to implied volatility is also meaningful to our results. Because the cost ofhedging our positions is based on implied volatility, while our trading profits are, in part, based onactual market volatility, a higher ratio is generally favorable and a lower ratio generally has a negativeeffect on our trading gains. This ratio averaged approximately 69% during 2012, about 18% lower thanit was in 2011.
Bid/Offer Spreads. Bid/offer spreads on U.S. exchange-traded options widened only slightly in2012. As reported by the NASDAQ OMX PHLX market, bid/offer spreads in 2012 were approximately6% wider than in 2011. We believe this increase can be attributed to the heightened scrutiny over highfrequency trading firms (‘‘HFT’’) that began after the May 2010 Flash Crash. Regulators and exchangeshave since been enacting rules that eliminate some of the advantages HFTs had over registered marketmakers and have increased oversight of these firms. The Dodd-Frank Wall Street Reform andConsumer Protection Act has also imposed stricter reporting and disclosure requirements on the hedgefund industry. Yet persistently low volatility levels have help keep spreads relatively tight.
46

Currency fluctuations. As a global market maker trading on exchanges around the world inmultiple currencies, we are exposed to foreign currency risk. We actively manage this exposure bykeeping our net worth in proportion to a defined basket of 16 currencies we call the ‘‘GLOBAL’’ inorder to diversify our risk and to align our hedging strategy with the currencies that we use in ourbusiness. Because we report our financial results in U.S. dollars, the change in the value of theGLOBAL to the U.S. dollar affects our earnings. The value of the GLOBAL, as measured in U.S.dollars, at December 31, 2012 declined 0.4% compared to its value at December 31, 2011. This had arelatively small negative impact on our comprehensive earnings.
Financial Overview
Diluted earnings per share were $0.89 for year ended December 31, 2012. The calculation ofdiluted earnings per share is detailed in Note 4, to the audited consolidated financial statements, inPart II, Item 8 of this Annual Report on Form 10-K. Diluted earnings per share were $1.37 for theyear ended December 31, 2011.
On a comprehensive basis, which includes the effect of changes in the U.S. dollar value of theCompany’s non-U.S. subsidiaries, diluted earnings per share were $1.13 for the year endedDecember 31, 2012, inclusive of the $0.20 effect of reversing deferred taxes on other comprehensiveincome provided in error in prior years. This compares to diluted earnings per share of $1.31 for thesame period in 2011.
For the year ended December 31, 2012, our net revenues were $1,130.5 million and income beforeincome taxes was $527.0 million, compared to net revenues of $1,358.3 million and income beforeincome taxes of $741.1 million for 2011. Compared to 2011, trading gains decreased by 35% in 2012,commissions and execution fees decreased by 10% and net interest income increased by 6%. Ourpre-tax margin for the year ended December 31, 2012 was 47%, compared to 55% for 2011.
During the year ended December 31, 2012, income before income taxes in our electronicbrokerage segment decreased by 8% compared to 2011. Commissions and execution fees decreased by10% on a decline in customer trade volumes while net interest income grew by 9% from the prior year.Pre-tax margin decreased from 54% to 51% in the same time periods. Customer accounts grew 11%from the prior year and customer equity increased 31% during 2012. Total Daily Average RevenueTrades (‘‘DARTs’’) for cleared and execution-only customers decreased 7% to 413,000 during the yearended December 31, 2012, compared to 444,000 during the year ended December 31, 2011.
During the year ended December 31, 2012, income before income taxes in our market makingsegment decreased by 54%, compared with 2011. Trading gains were negatively impacted by a decreasein currency translation gains, which contributed 20% of the decrease from the prior year; low volatilitylevels, as measured by the VIX�; and an 18% decrease in the ratio of actual to implied volatility.Pre-tax margin decreased to 41% in 2012, as compared to 59% in 2011.
Market making, by its nature, does not produce predictable earnings. Our results in any givenperiod may be materially affected by volumes in the global financial markets, the level of competitionand other factors. Electronic brokerage is more predictable, but it is dependent on customer activity,growth in customer accounts and assets, interest rates and other factors. For a further discussion of thefactors, that may affect our future operating results, please see the description of risk factors in Part I,Item 1A of this Annual Report on Form 10-K.
Comprehensive Income
The Company reports results on a comprehensive basis, as required by Accounting StandardsUpdate 2011-05, Comprehensive Income (‘‘ASU 2011-05’’). This standard requires the presentation of aStatement of Comprehensive Income, replacing the former Statement of Income. The Statement of
47

Comprehensive Income reports currency translation results that are a component of OtherComprehensive Income (‘‘OCI’’) directly in this statement. Prior to adoption as of June 30, 2011, OCIwas reported as a component of changes in Total Equity in the Statement of Financial Condition.
The following two tables present net revenues and income before income taxes for each of ourbusiness segments for the periods indicated.
Net revenues of each of our business segments and our total net revenues are summarized below:
Year Ended December 31,
2012 2011 2010
(in millions)
Electronic brokerage . . . . . . . . . . . . . . . . . . . . . . . . . $ 670.4 $ 691.5 $547.3Market making . . . . . . . . . . . . . . . . . . . . . . . . . . . . . 459.6 698.5 379.2Corporate(1) . . . . . . . . . . . . . . . . . . . . . . . . . . . . . . . 0.5 (31.7) (4.4)
Total . . . . . . . . . . . . . . . . . . . . . . . . . . . . . . . . . . . . . $1,130.5 $1,358.3 $922.1
(1) Corporate includes corporate related activities as well as inter-segment eliminations.
Income before income taxes of each of our business segments and our total income before incometaxes are summarized below:
Year Ended December 31,
2012 2011 2010
(in millions)
Electronic brokerage . . . . . . . . . . . . . . . . . . . . . . . . . . . . $341.7 $370.3 $274.0Market making . . . . . . . . . . . . . . . . . . . . . . . . . . . . . . . 188.6 413.2 88.2Corporate(1) . . . . . . . . . . . . . . . . . . . . . . . . . . . . . . . . . (3.3) (42.4) (24.8)
Total . . . . . . . . . . . . . . . . . . . . . . . . . . . . . . . . . . . . . . . $527.0 $741.1 $337.4
(1) Corporate includes corporate related activities as well as inter-segment eliminations.
Revenue
Trading Gains
Trading gains are generated in the normal course of market making. Trading revenues are, ingeneral, proportional to the trading activity in the markets. Our revenue base is highly diversified andcomprised of millions of relatively small individual trades of various financial products traded onelectronic exchanges, primarily in stocks, options and futures. Trading gains accounted forapproximately 36%, 46% and 37% of our total revenues for the years ended December 31, 2012, 2011and 2010, respectively. Trading gains include a portion of translation gains and losses stemming fromthe basket of foreign currencies we call the GLOBAL, which we employ to carry out our currencyexposure strategy. A discussion of our approach to managing foreign currency exposure is contained inPart II, Item 7A of this Annual Report on Form 10-K entitled ‘‘Quantitative and QualitativeDisclosures about Market Risk.’’
Trading gains also include revenues from net dividends. Market making activities require us to holda substantial inventory of equity securities. We derive significant revenues in the form of dividendincome from these equity securities. This dividend income is largely offset by dividend expense incurredwhen we make significant payments in lieu of dividends on short positions in securities in our portfolio.Dividend income and expense arise from holding market making positions over dates on whichdividends are paid to shareholders of record. When a stock pays a dividend, its market price is
48

generally adjusted downward to reflect the value paid to the shareholders of record, which will not bereceived by those who purchase the stock after the dividend date. Hence, the apparent gains and lossesdue to these price changes must be taken together with the dividends paid and received, respectively, toaccurately reflect the results of our market making operations.
As a result of the way we have integrated our market making and securities lending systems, ourtrading gains and our net interest income from the market making segment are interchangeable anddepend on the mix of market making positions in our portfolio. When implied interest rates in theequity and equity options and futures markets exceed the actual interest rates available to us, ourmarket making systems tend to buy stock and sell it forward, which produces higher trading gains andlower net interest income. When these rates are inverted, our market making systems tend to sell stockand buy it forward, which produces lower trading gains and higher net interest income.
Our trading gains are geographically diversified. In 2012, 2011 and 2010, we generated 37%, 40%and 17%, respectively, of our trading gains from operations conducted internationally.
Commissions and Execution Fees
We earn commissions and execution fees from our cleared customers for whom we act as executingand clearing brokers and from our non-cleared customers for whom we act as an execution-only broker.We have a commission structure that allows customers to choose between an all-inclusive ‘‘bundled’’rate or an ‘‘unbundled’’ rate that has lower commissions for high volume customers. For ‘‘unbundled’’commissions, we charge regulatory and exchange fees, at our cost, separately from our commissions,adding transparency to our fee structure. Commissions and execution fees accounted for 35%, 32% and39% of our total revenues for the years ended December 31, 2012, 2011 and 2010, respectively.
Our commissions and execution fees are geographically diversified. In 2012, 2011 and 2010 wegenerated 28%, 30% and 27%, respectively, of commissions and execution fees from operationsconducted internationally.
Interest Income and Interest Expense
We earn interest on customer funds segregated in safekeeping accounts; on customer borrowingson margin, secured by marketable securities these customers hold with us; from our investment ingovernment treasury securities; from borrowing securities in the general course of our market makingand brokerage activities, and on bank balances. Interest income accounted for 23%, 19% and 17% oftotal revenues for the years ended December 31, 2012, 2011 and 2010, respectively. Interest income ispartially offset by interest expense.
We pay interest on cash balances customers hold with us; for cash received from lending securitiesin the general course of our market making and brokerage activities; and on our borrowings. During2012 we discontinued our senior notes program, which resulted in a reduction in our senior notesoutstanding by $101.4 million and a reduction in interest expense on our senior notes of $6.9 million, ascompared to the prior year. Interest expense was 5%, 6% and 7% of total revenues for the years endedDecember 31, 2012, 2011 and 2010, respectively.
We have automated and integrated our securities lending system with our trading system. As aresult, we have been able to tailor our securities lending activity to produce more optimal results whentaken together with trading gains (see description under ‘‘Trading Gains’’ above). Our net interestincome accounted for approximately 18%, 14% and 12% of our total net revenues for the years endedDecember 31, 2012, 2011 and 2010, respectively.
49
Other Income
Other income consists primarily of market data fee income, payment for order flow income,minimum activity fee income from customers and mark-to-market gains or losses on non-marketmaking securities (primarily strategic investments). Our other income accounted for approximately 6%,3% and 6% of our total revenues for each of the years ended December 31, 2012, 2011 and 2010,respectively.
Costs and Expenses
Execution and Clearing Expenses
Our largest single expense category is execution and clearing expenses, which includes the costs ofexecuting and clearing our market making and electronic brokerage trades, as well as other directexpenses, including payment for order flow, regulatory fees and market data fees. Execution fees arepaid primarily to electronic exchanges and market centers on which we trade. Clearing fees are paid toclearing houses and clearing agents. Payments for order flow are made as part of exchange-mandatedprograms and to otherwise attract order volume to our system. Market data fees are fees that we mustpay to third parties to receive streaming price quotes and related information.
Employee Compensation and Benefits
Employee compensation and benefits includes salaries, bonuses and other incentive compensationplans, group insurance, contributions to benefit programs and other related employee costs.
Occupancy, Depreciation and Amortization
Occupancy expense consists primarily of rental payments on office and data center leases andrelated occupancy costs, such as utilities. Depreciation and amortization expense results from thedepreciation of fixed assets such as computing and communications hardware as well as amortization ofleasehold improvements and capitalized in-house software development.
Communications
Communications expense consists primarily of the cost of voice and data telecommunications linessupporting our business including connectivity to exchanges around the world.
General and Administrative
Expenses in this category are primarily incurred for professional services, such as legal and auditwork, and other operating expenses such as advertising and exchange membership lease expenses.
Income Tax Expense
We pay U.S. federal, state and local income taxes on our taxable income, which is proportional tothe percentage of IBG LLC owned by IBG, Inc. Our subsidiaries are subject to income tax in therespective jurisdictions in which they operate.
Noncontrolling Interest
We are the sole managing member of IBG LLC and, as such, operate and control all of thebusiness and affairs of IBG LLC and its subsidiaries and consolidate IBG LLC’s financial results intoour financial statements. We hold approximately 11.9% ownership interest in IBG LLC. Holdings isowned by the original members of IBG LLC and holds approximately 88.1% ownership interest inIBG LLC. We reflect Holdings’ ownership as a noncontrolling interest in our consolidated statement of
50
financial condition, consolidated statement of comprehensive income, consolidated statement ofchanges in equity and consolidated statement of cash flows. Our share of IBG LLC’s net income,excluding Holdings’ noncontrolling interest, is approximately 11.9% and similarly, outstanding shares ofour common stock represent approximately 11.9% of the outstanding membership interests ofIBG LLC.
Certain Trends and Uncertainties
We believe that our continuing operations may be favorably or unfavorably impacted by thefollowing trends that may affect our financial condition and results of operations.
• Over the past several years, the effects of market structure changes, competition (in particular,from HFTs) and market conditions have, during certain periods, exerted downward pressure onbid/offer spreads realized by market makers.
• Retail broker-dealer participation in the equity markets has fluctuated over the past few yearsdue to investor sentiment, market conditions and a variety of other factors. Retail transactionvolumes may not be sustainable and are not predictable.
• In recent years, in an effort to improve the quality of their executions as well as increaseefficiencies, market makers have increased the level of automation within their operations, whichmay allow them to compete more effectively with us.
• Scrutiny of equity and option market makers, hedge funds and soft dollar practices by regulatoryand legislative authorities has increased. New legislation or modifications to existing regulationsand rules could occur in the future.
• Additional consolidation among market centers may adversely affect the value of our smartrouting software.
• A driver of our market making profits is the relationship between actual and implied volatility inthe equities markets. The cost of maintaining our conservative risk profile is based on impliedvolatility, while our profitability, in part, is based on actual volatility. Hence, our profitability isincreased when actual volatility runs above implied volatility and it is decreased when actualvolatility falls below implied volatility. Implied volatility tends to lag actual volatility.
See ‘‘Risk Factors’’ in Part I, Item 1A of this Annual Report on Form 10-K for a discussion ofother risks that may affect our financial condition and results of operations.
Non-GAAP Financial Measures
Non-GAAP measures are used to isolate items that the Company’s management views asnon-operating in nature, which is intended to give a clearer presentation of operating results. Given itsmaterial impact on our reported financial results, the following non-GAAP measure is presented for2010:
In December 2010, we effected a series of dividend payments, culminating in a cash dividend of$1.79 per share, which was paid to holders of IBKR common stock. In total, IBG LLC paid out about$1 billion. Funding for this dividend originated with our Swiss company, which paid a dividend toIBG LLC, its parent company. IBG LLC, in turn, paid a dividend to its members, including InteractiveBrokers Group, Inc., the public company. On a consolidated reporting basis, these dividends had noeffect on the Company’s reported income. However, the original dividend from the Swiss company wasmade from earnings that were not previously taxed in the U.S. As a result, this triggered a U.S. federalincome tax liability for the Company, which is reported as income tax expense in the consolidatedstatement of comprehensive income. This income tax liability was funded by reserving a portion of the
51

dividend that the Company received. The remaining after-tax amount was paid to the Company’scommon stockholders. The result was cash-flow neutral for the public company.
At December 31, 2012, approximately $616 million of accumulated earnings that have not beenpreviously subject to income tax in the U.S. were held in the Company’s non-U.S. subsidiaries.Additional dividends originating from these subsidiaries up to this amount (as adjusted over time)would be subject to U.S. income tax, as described above. Dividends paid from the remaining equitycapital would not be subject to additional income tax.
The Company also decided to pay a dividend equivalent to employees holding unvested shares inour Stock Incentive Plan. This amounted to approximately $10 million and was recorded ascompensation expense.
In summary, this item reduced diluted EPS by approximately $0.71 for the 2010 year.
The Company believes that it is appropriate to adjust this non-operating item in the consolidatedstatement of comprehensive income in order to achieve a proper representation of the Company’sfinancial performance. For a reconciliation of our accounting principles generally accepted in theUnited States of America (‘‘U.S. GAAP’’) to non-GAAP results for 2010 see the ‘GAAP toNon-GAAP Reconciliation and Footnotes’ section on page 78 of this Annual Report on Form 10-K.
52

Results of Operations
The tables in the period comparisons below provide summaries of our consolidated results ofoperations. The period-to-period comparisons below of financial results are not necessarily indicative offuture results.
Year Ended December 31,
2012 2011 2010
(in millions)Revenues:
Trading gains . . . . . . . . . . . . . . . . . . . . . . . . . . . . . . . . . . . . . $ 435.1 $ 665.2 $ 368.6Commissions and execution fees . . . . . . . . . . . . . . . . . . . . . . . . 412.6 456.2 386.8Interest income . . . . . . . . . . . . . . . . . . . . . . . . . . . . . . . . . . . . 268.4 280.2 172.5Other income . . . . . . . . . . . . . . . . . . . . . . . . . . . . . . . . . . . . . 76.4 43.0 60.4
Total revenues . . . . . . . . . . . . . . . . . . . . . . . . . . . . . . . . . . . 1,192.5 1,444.6 988.3
Interest expense . . . . . . . . . . . . . . . . . . . . . . . . . . . . . . . . . . . 62.0 86.3 66.2
Total net revenues . . . . . . . . . . . . . . . . . . . . . . . . . . . . . . . . 1,130.5 1,358.3 922.1
Non-interest expenses:Execution and clearing . . . . . . . . . . . . . . . . . . . . . . . . . . . . . . . 251.0 281.3 272.6Employee compensation and benefits . . . . . . . . . . . . . . . . . . . . . 244.5 216.3 203.6Occupancy, depreciation and amortization . . . . . . . . . . . . . . . . . 38.8 37.1 37.3Communications . . . . . . . . . . . . . . . . . . . . . . . . . . . . . . . . . . . 23.3 23.6 23.5General and administrative . . . . . . . . . . . . . . . . . . . . . . . . . . . . 45.9 58.9 47.7
Total non-interest expenses . . . . . . . . . . . . . . . . . . . . . . . . . . 603.5 617.2 584.7
Income before income taxes . . . . . . . . . . . . . . . . . . . . . . . . . . . . . . 527.0 741.1 337.4
Income tax expense . . . . . . . . . . . . . . . . . . . . . . . . . . . . . . . . . . . . 30.0 53.9 60.3
Net Income . . . . . . . . . . . . . . . . . . . . . . . . . . . . . . . . . . . . . . . . . 497.0 687.2 277.1
Less net income attributable to noncontrolling interests . . . . . . . . . . 456.3 625.3 286.7
Net income (loss) attributable to common stockholders . . . . . . . . . . . $ 40.7 $ 61.9 $ (9.6)
Earnings per shareBasic . . . . . . . . . . . . . . . . . . . . . . . . . . . . . . . . . . . . . . . . . . . $ 0.89 $ 1.39 $ (0.23)
Diluted . . . . . . . . . . . . . . . . . . . . . . . . . . . . . . . . . . . . . . . . . $ 0.89 $ 1.37 $ (0.23)
Weighted average common shares outstandingBasic . . . . . . . . . . . . . . . . . . . . . . . . . . . . . . . . . . . . . . . . . . . 46,814,676 43,924,554 41,870,926Diluted . . . . . . . . . . . . . . . . . . . . . . . . . . . . . . . . . . . . . . . . . 47,070,522 44,364,902 42,498,705
Comprehensive income:Net income (loss) . . . . . . . . . . . . . . . . . . . . . . . . . . . . . . . . . . $ 40.7 $ 61.9 $ (9.6)Other comprehensive income (loss):
Cumulative translation adjustment, before income taxes . . . . . . . 2.2 (4.5) 16.3Income taxes related to items of other comprehensive income . . (9.1) (1.8) 6.0
Other comprehensive income (loss), net of tax . . . . . . . . . . . . . . 11.3 (2.7) 10.3
Comprehensive income attributable to common stockholders . . . . . . . . $ 52.0 $ 59.2 $ 0.7
Comprehensive income attributable to noncontrolling interests:Net income attributable to noncontrolling interests . . . . . . . . . . . $ 456.3 $ 625.3 $ 286.7Other comprehensive income (loss)—cumulative translation
adjustment . . . . . . . . . . . . . . . . . . . . . . . . . . . . . . . . . . . . . 17.0 (27.8) 132.2
Comprehensive income attributable to noncontrolling interests . . . . . . $ 473.3 $ 597.5 $ 418.9
53
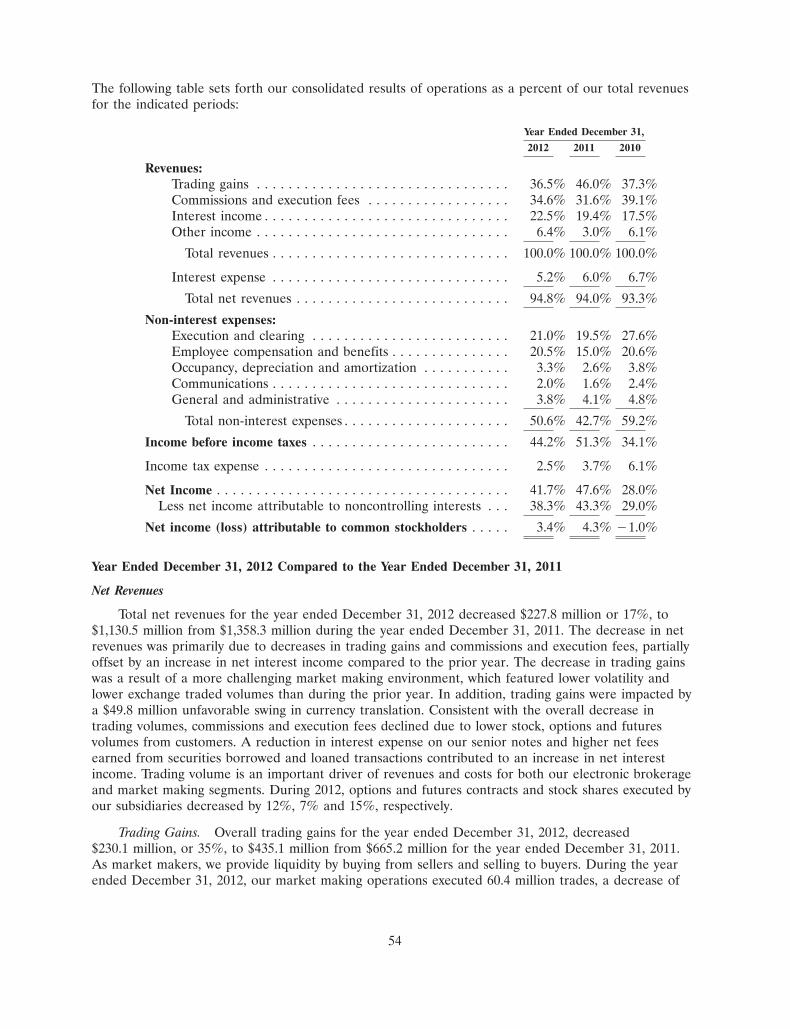
The following table sets forth our consolidated results of operations as a percent of our total revenuesfor the indicated periods:
Year Ended December 31,
2012 2011 2010
Revenues:Trading gains . . . . . . . . . . . . . . . . . . . . . . . . . . . . . . . . 36.5% 46.0% 37.3%Commissions and execution fees . . . . . . . . . . . . . . . . . . 34.6% 31.6% 39.1%Interest income . . . . . . . . . . . . . . . . . . . . . . . . . . . . . . . 22.5% 19.4% 17.5%Other income . . . . . . . . . . . . . . . . . . . . . . . . . . . . . . . . 6.4% 3.0% 6.1%
Total revenues . . . . . . . . . . . . . . . . . . . . . . . . . . . . . . 100.0% 100.0% 100.0%
Interest expense . . . . . . . . . . . . . . . . . . . . . . . . . . . . . . 5.2% 6.0% 6.7%
Total net revenues . . . . . . . . . . . . . . . . . . . . . . . . . . . 94.8% 94.0% 93.3%
Non-interest expenses:Execution and clearing . . . . . . . . . . . . . . . . . . . . . . . . . 21.0% 19.5% 27.6%Employee compensation and benefits . . . . . . . . . . . . . . . 20.5% 15.0% 20.6%Occupancy, depreciation and amortization . . . . . . . . . . . 3.3% 2.6% 3.8%Communications . . . . . . . . . . . . . . . . . . . . . . . . . . . . . . 2.0% 1.6% 2.4%General and administrative . . . . . . . . . . . . . . . . . . . . . . 3.8% 4.1% 4.8%
Total non-interest expenses . . . . . . . . . . . . . . . . . . . . . 50.6% 42.7% 59.2%
Income before income taxes . . . . . . . . . . . . . . . . . . . . . . . . . 44.2% 51.3% 34.1%
Income tax expense . . . . . . . . . . . . . . . . . . . . . . . . . . . . . . . 2.5% 3.7% 6.1%
Net Income . . . . . . . . . . . . . . . . . . . . . . . . . . . . . . . . . . . . . 41.7% 47.6% 28.0%Less net income attributable to noncontrolling interests . . . 38.3% 43.3% 29.0%
Net income (loss) attributable to common stockholders . . . . . 3.4% 4.3% �1.0%
Year Ended December 31, 2012 Compared to the Year Ended December 31, 2011
Net Revenues
Total net revenues for the year ended December 31, 2012 decreased $227.8 million or 17%, to$1,130.5 million from $1,358.3 million during the year ended December 31, 2011. The decrease in netrevenues was primarily due to decreases in trading gains and commissions and execution fees, partiallyoffset by an increase in net interest income compared to the prior year. The decrease in trading gainswas a result of a more challenging market making environment, which featured lower volatility andlower exchange traded volumes than during the prior year. In addition, trading gains were impacted bya $49.8 million unfavorable swing in currency translation. Consistent with the overall decrease intrading volumes, commissions and execution fees declined due to lower stock, options and futuresvolumes from customers. A reduction in interest expense on our senior notes and higher net feesearned from securities borrowed and loaned transactions contributed to an increase in net interestincome. Trading volume is an important driver of revenues and costs for both our electronic brokerageand market making segments. During 2012, options and futures contracts and stock shares executed byour subsidiaries decreased by 12%, 7% and 15%, respectively.
Trading Gains. Overall trading gains for the year ended December 31, 2012, decreased$230.1 million, or 35%, to $435.1 million from $665.2 million for the year ended December 31, 2011.As market makers, we provide liquidity by buying from sellers and selling to buyers. During the yearended December 31, 2012, our market making operations executed 60.4 million trades, a decrease of
54

5% as compared to the number of trades executed in the year ended December 31, 2011. The decreasein trading gains was driven, in part, by a swing in currency translation gains, which contributed 22% ofthe drop; a $38.6 million loss in 2012 compared to an $11.2 million gain in 2011. As part of managingour overall exposure to foreign currency fluctuations, we maintain our capital in a basket of currencieswe call the GLOBAL. A substantial portion of the currency translation effects may result from theholding of our equity in GLOBALs. A discussion of our approach to managing foreign currencyexposure is contained in Part II, Item 7A of this Annual Report on Form 10-K entitled ‘‘Quantitativeand Qualitative Disclosures about Market Risk.’’
Trading gains were negatively impacted by a 26% decrease in average volatility, as measured by theVIX�, for the year ended December 31, 2012 as compared to the prior year. The average ratio ofactual to implied volatility decreased from 85% in 2012 compared to 69% during the prior year. Inaddition, diminishing market participation by retail investors made the trading environment moredifficult than that of the prior year. Acting to offset these factors, bid/offer spreads on U.S. exchange-traded options, as reported by the NASDAQ OMX PHLX market, were approximately 6% widerduring the year ended December 31, 2012 than in the prior year. As a result, our trading gains, afterremoving the effects of currency translation, decreased by 28% from the year-ago period.
Included in trading gains are net dividends. Dividend income and expense arise from holdingmarket making positions over dates on which dividends are paid to shareholders of record. When astock pays a dividend, its market price is generally adjusted downward to reflect the value paid to theshareholders of record, which will not be received by those who purchase stock after the ex-dividenddate. Hence, the apparent gains and losses due to these price changes, reflecting the value of dividendspaid to shareholders, must be taken together with the dividends paid and received, respectively, toaccurately reflect the results of our market making operations.
Commissions and Execution Fees. Commissions and execution fees for the year endedDecember 31, 2012 decreased $43.6 million, or 10%, to $412.6 million, as compared to the year endedDecember 31, 2011. The decrease was driven by lower overall trade volume from our customers, wherevolumes in options and futures contracts and stock shares decreased by 16%, 5%, and 14%,respectively, for the year ended December 31, 2012 from the prior year. During the second half of 2011we observed a surge in volumes driven by concerns over the U.S. debt downgrade and the Europeandebt crisis. Total DARTs for cleared and execution-only customers for the year ended December 31,2012 decreased 7% to approximately 413,000, as compared to approximately 444,000 during the yearended December 31, 2011. DARTs for cleared customers, i.e., customers for whom we execute trades aswell as clear and carry positions, decreased 6% to approximately 384,000, for the year endedDecember 31, 2012, as compared to approximately 409,000 for the year ended December 31, 2011. Thenumber of customer accounts grew by 11% to approximately 210,000 at December 31, 2012, ascompared to approximately 189,000 at December 31, 2011. Average commission per DART for clearedcustomers, for the year ended December 31, 2012, decreased by 2% to $4.17, compared to $4.26 forthe year ended December 31, 2011.
Interest Income and Interest Expense. Net interest income (interest income less interest expense)for the year ended December 31, 2012 increased $12.5 million, or 6%, to $206.4 million, as comparedto the year ended December 31, 2011. The increase in net interest income was driven primarily by areduction in interest expense on our senior notes, higher net fees earned from securities borrowed andloaned transactions and higher customer cash and margin balances.
Interest expense on our senior notes decreased by $6.9 million compared to the year-ago quarteras we discontinued our senior notes program in June 2012.
Average customer cash balances increased by 13%, to $19.54 billion, and average customer fullysecured margin borrowings increased 7%, to $8.67 billion, for the year ended December 31, 2012, ascompared to $17.35 billion and $8.14 billion, respectively, for the year ended December 31, 2011.
55

Interest expense on customer cash balances decreased for the year ended December 31, 2012,compared to the prior year, as lower benchmark rates on foreign currency balances more than offsethigher balances in those currencies. Given the low benchmark interest rates, we did not pay interest oncustomer balances denominated in U.S. dollars in 2012. Interest income from fully secured marginborrowings increased approximately $3.0 million as higher U.S. dollar borrowings and a higher averageFed Funds effective rate more than offset interest rate compression in certain foreign currencies. Theaverage Fed Funds effective rate increased 4 basis points to 0.14% for the year ended December 31,2012 as compared to the year ended December 31, 2011.
We earn fees on securities loaned and borrowed to support customer long and short stock holdingsin margin accounts. In addition, our Stock Yield Enhancement Program provides an opportunity forcustomers with fully-paid stock to allow IB to lend it out. In exchange for lending out their stock, ourcustomers receive 50% of the stock loan fees. IB places cash collateral securing the loans in thecustomer’s account. In the market making segment, as a result of the way we have integrated ourmarket making and securities lending systems, our trading income and our net interest income areinterchangeable and depend on the mix of market making positions in our portfolio. When impliedinterest rates in the equity and equity options and futures markets exceed the actual interest ratesavailable to us, our market making systems tend to buy stock and sell it forward, which produces highertrading gains and lower net interest income. When these rates are inverted, our market making systemstend to sell stock and buy it forward, which produces lower trading gains and higher net interestincome.
Average securities borrowed decreased by 13%, to $2.92 billion, and average securities loanedincreased by 9%, to $1.77 billion, for the year ended December 31, 2012. Net interest earned fromsecurities borrowed and loaned is also affected by the level of demand for securities positions held byour market making companies and by our customers. During the year ended December 31, 2012, netfees earned by our brokerage and market making segments from securities borrowed and loanedtransactions increased $2.7 million compared to the year ended December 31, 2011.
Other Income. Other income, for the year ended December 31, 2012, increased $33.4 million, or78%, to $76.4 million, as compared to the year ended December 31, 2011. The primary revenuecomponents of other income are market data fees collected from customers, order flow fees paid byU.S. options exchanges and minimum activity fees from customers. The increase in other income wasdriven by a $33.2 million decrease in mark-to-market losses on non-market making securities. Duringthe fourth quarter of 2011 we revalued at zero our equity investment in MF Global following itsbankruptcy filing. Our decrease in mark-to-market losses was partially offset by a $2.4 million decreasein order flow income, compared to the prior year.
Non-Interest Expenses
Non-interest expenses, for the year ended December 31, 2012, decreased by $13.7 million, or 2%,to $603.5 million from $617.2 million, during the year ended December 31, 2011. The decrease wasprimarily due to lower execution and clearing expenses and general and administrative expenses,partially offset by higher employee compensation and benefits expenses. As a percentage of total netrevenues, non-interest expenses increased to 53% for the year ended December 31, 2012 from 45%during the year ended December 31, 2011.
Execution and Clearing. Execution and clearing expenses, for the year ended December 31, 2012,decreased $30.3 million, or 11%, to $251.0 million, as compared to the year ended December 31, 2011,as a result of lower trading volume in options futures and stocks product classes. During 2012, optionsand futures contracts and stock shares executed by our subsidiaries decreased by 12%, 7% and 15%,respectively.
56

Employee Compensation and Benefits. Employee compensation and benefits expenses, for the yearended December 31, 2012, increased by $28.2 million, or 13%, to $244.5 million, as compared to theyear ended December 31, 2011. The increase in employee compensation was largely a result of aspecial discretionary grant of $18.4 million of restricted stock units awarded on January 6, 2012. Thespecial award was made to provide our employees with greater equity participation in the Companyand was designed to give lower compensated employees a proportionally higher award. This increasealso reflects the 3% growth in the average number of employees to 885 for the year endedDecember 31, 2012, as compared to 858 for the prior year. As we continue to grow, our focus onautomation has allowed us to maintain a relatively small staff. As a percentage of total net revenues,employee compensation and benefits expenses were 22% and 16%, for the years ended December 31,2012 and 2011, respectively.
Occupancy, Depreciation and Amortization. Occupancy, depreciation and amortization expensesincreased $1.7 million, or 5%, to $38.8 million for the year ended December 31, 2012 as compared tothe year ended December 31, 2011. As a percentage of total net revenues, occupancy, depreciation andamortization expense was 3% for both 2012 and 2011.
Communications. Communications expenses decreased $0.3 million, or 1%, to $23.3 million forthe year ended December 31, 2012, as compared to the year ended December 31, 2011. As apercentage of total net revenues, communications expenses were 2% for both 2012 and 2011.
General and Administrative. General and administrative expenses, for the year endedDecember 31, 2012, decreased $13.0 million, or 22% to $45.9 million, as compared to the year endedDecember 31, 2011. The decrease was due to an $8.1 million decrease in bad debt expenses and a$2.9 million decrease in other administrative fees compared to the prior year.
Income Tax Expense
Income tax expense for the year ended December 31, 2012 decreased $23.9 million, or 44%,compared to income tax expense for the year ended December 31, 2011, while income before taxesdecreased by $214.1 million, or 29%, during the same period. In 2012, we recognized some tax benefitsrelated to prior years, which increased earnings per share for the year ended December 31, 2012 by$0.07.
Year Ended December 31, 2011 Compared to the Year Ended December 31, 2010
Net Revenues
Total net revenues for the year ended December 31, 2011 increased $436.2 million or 47%, to$1,358.3 million from $922.1 million during the year ended December 31, 2010. Trading volume is animportant driver of revenues and costs for both our market making and electronic brokerage segments.During 2011, options and futures contracts executed by our operating companies increased by 16% and11%, respectively, while stock shares volume decreased 8%. Brokerage options and futures contractvolumes increased 18% and 13%, respectively; market making options and futures contract volumesincreased 16% and 1%, respectively; while brokerage stock share volume increased 1% and marketmaking stock share volume decreased 38%. In brokerage, although stock volume for the year wasstable, we observed decreases primarily in low-priced stocks after we raised risk margin requirements,to better protect against sudden price moves, on companies with small market capitalization. In marketmaking, decreases in stock volume resulted from targeted paring back of activity at certain exchanges toimprove profitability and avoid high fees. Increased customer cash and margin balances contributed toan increase of $69.8 million in net interest income in our brokerage segment. In our market makingsegment, wider bid/offer spreads in options, an increase in the ratio of actual to implied volatility and areversal in currency translation losses contributed to an increase of $320.0 million in trading gains.
57

Trading Gains. Overall trading gains for the year ended December 31, 2011, increased$296.6 million, or 80%, to $665.2 million from $368.6 million for the year ended December 31, 2010.As market makers, we provide liquidity by buying from sellers and selling to buyers. During the yearended December 31, 2011, our market making operations executed 63.6 million trades, a decrease of15% as compared to the number of trades executed in the year ended December 31, 2010. Optionscontracts increased 16%, futures contracts increased 1% while stock shares decreased by 38% for theyear ended December 31, 2011 as compared to 2010. Bid/offer spreads on U.S. exchange-tradedoptions, as reported by the NASDAQ OMX PHLX market, on average, were approximately 33% widerduring the year ended December 31, 2011 than during the year ended December 31, 2010.
The increase in trading gains was driven by a swing in currency translation gains, which contributed58% of the rise, reflecting an $11.2 million gain in 2011 as compared to a $160.9 million loss in 2010.As part of managing our overall exposure to foreign currency fluctuations, we maintain our capital in abasket of currencies we call the GLOBAL. A large portion of the currency translation effects resultfrom the holding of our equity in GLOBALs. A discussion of our approach to managing foreigncurrency exposure is contained in Part II, Item 7A of this Annual Report on Form 10-K entitled‘‘Quantitative and Qualitative Disclosures about Market Risk.’’
Included in trading gains are net dividends. Dividend income and expense arise from holdingmarket making positions over dates on which dividends are paid to shareholders of record. When astock pays a dividend, its market price is generally adjusted downward to reflect the value paid to theshareholders of record, which will not be received by those who purchase stock after the ex-dividenddate. Hence, the apparent gains and losses due to these price changes, reflecting the value of dividendspaid to shareholders, must be taken together with the dividends paid and received, respectively, toaccurately reflect the results of our market making operations.
Commissions and Execution Fees. Commissions and execution fees for the year endedDecember 31, 2011 increased $69.4 million, or 18%, to $456.2 million, as compared to the year endedDecember 31, 2010. The increase was driven by higher overall trade volume from our customers.Volume in options and futures contracts and stock shares increased by 18%, 13%, and 1%, respectively,for the year ended December 31, 2011 from the prior year. Total DARTs for cleared and execution-onlycustomers for the year ended December 31, 2011 increased 17% to approximately 444,000, as comparedto approximately 379,000 during the year ended December 31, 2010. DARTs for cleared customers,i.e., customers for whom we execute trades as well as clear and carry positions, increased 19% toapproximately 409,000, for the year ended December 31, 2011, as compared to approximately 343,000for the year ended December 31, 2010. The number of customer accounts grew by 20% toapproximately 189,000 at December 31, 2011, as compared to approximately 158,000 at December 31,2010. Average commission per DART for cleared customers, for the year ended December 31, 2011,decreased by less than 1% to $4.26, as compared to $4.28 for the year ended December 31, 2010.
Interest Income and Interest Expense. Net interest income (interest income less interest expense)for the year ended December 31, 2011 increased $87.6 million, or 82%, to $193.9 million, as comparedto the year ended December 31, 2010. Net interest income was derived primarily from the electronicbrokerage segment during the year ended December 31, 2011. Net interest earned by electronicbrokerage increased $69.8 million, or 71%, to $168.3 million, as compared to the year endedDecember 31, 2010. Average customer cash balances increased by 40%, to $17.35 billion, and averagecustomer fully secured margin borrowings increased 66%, to $8.14 billion, for the year endedDecember 31, 2011, as compared to $12.41 billion and $4.91 billion, respectively, for the year endedDecember 31, 2010. Net fees earned by electronic brokerage from borrowing and lending securitiesincreased $30.3 million, or 131%, for the year ended December 31, 2011 as compared to same periodlast year.
58

The average Fed Funds effective rate decreased 8 basis points to 0.10% for the year endedDecember 31, 2011 as compared to the year ended December 31, 2010.
For market making, net interest income increased $12.3 million from the prior year to$19.8 million. As a result of the way we have integrated our market making and securities lendingsystems, our trading income and our net interest income are interchangeable and depend on the mix ofmarket making positions in our portfolio. When implied interest rates in the equity and equity optionsand futures markets exceed the actual interest rates available to us, our market making systems tend tobuy stock and sell it forward, which produces higher trading gains and lower net interest income. Whenthese rates are inverted, our market making systems tend to sell stock and buy it forward, whichproduces lower trading gains and higher net interest income. Net interest income increased$10.6 million as loan balances with IBG LLC were reduced and the rates paid on those loans werelower than in the prior year. In addition, net interest income from operating cash accounts increased$6.2 million. These increases were offset by a $6.1 million decrease in net interest earned fromsecurities borrowed and loaned. Average securities borrowed decreased by 31%, to $3.34 billion andaverage securities loaned increased by 13%, to $1.63 billion, for the year ended December 31, 2011.Net interest earned from securities borrowed and loaned is also affected by the level of demand forsecurities positions held by our market making companies.
Other Income. Other income, for the year ended December 31, 2011, decreased $17.4 million, or29%, to $43.0 million, as compared to the year ended December 31, 2010. The primary revenuecomponents of other income are market data fees collected from customers, order flow fees paid byU.S. options exchanges and minimum activity fees from inactive customers. The decrease in otherincome was driven by a $39.0 million loss from our equity investment in MF Global, which, followingits bankruptcy filing, we revalued at zero during the fourth quarter of 2011. This loss was partiallyoffset by a $22.8 million increase in translation gains from our brokerage and corporate companiescompared to the prior year. Of our translation gains, $4.1 million was attributable to an increase in thevalue of a $38.7 million tax credit receivable denominated in Swiss francs and $18.0 million was a resultof increases in gains from foreign currency forward positions compared the prior year. Our losses werefurther offset by a $7.2 million increase in market data and minimum activity fees compared to theprior year.
Non-Interest Expenses
Non-interest expenses, for the year ended December 31, 2011, increased by $32.5 million, or 6%,to $617.2 million from $584.7 million, during the year ended December 31, 2010. The increase wasprimarily due to higher execution and clearing expenses, employee compensation and benefits expensesand general and administrative expenses. As a percentage of total net revenues, non-interest expensesdecreased to 45% for the year ended December 31, 2011 from 63% during the year endedDecember 31, 2010.
Execution and Clearing. Execution and clearing expenses, for the year ended December 31, 2011,increased $8.7 million, or 3%, to $281.3 million, as compared to the year ended December 31, 2010, asa result of higher trading volume in futures and options product classes. In addition, regulatory feesincreased $5.8 million for the year ended December 31, 2011 as compared to 2010, in part due to anincrease in the SEC securities transaction fee rate from $16.90 per million to $19.20 per million inJanuary of 2011. This was partially offset by an increase in executions at venues that pay participants toprovide liquidity. As a market maker under the make-or-take pricing model, we are paid for providingliquidity instead of being charged payment-for-order flow fees.
Employee Compensation and Benefits. Employee compensation and benefits expenses, for the yearended December 31, 2011, increased by $12.7 million, or 6%, to $216.3 million, as compared to theyear ended December 31, 2010. This increase reflects the 3% growth in the average number of
59

employees to 858 for the year ended December 31, 2011, as compared to 836 for the prior year. As wecontinue to grow, our focus on automation has allowed us to maintain a relatively small staff. Thecontinued recognition of costs associated with of our stock incentive plan also increased employeecompensation and benefits expense. As a percentage of total net revenues, employee compensation andbenefits expenses were 16% and 22%, for the years ended December 31, 2011 and 2010, respectively.
Occupancy, Depreciation and Amortization. Occupancy, depreciation and amortization expensesdecreased $0.2 million, or 1%, to $37.1 million for the year ended December 31, 2011 as compared tothe year ended December 31, 2010. As a percentage of total net revenues, occupancy, depreciation andamortization expense fell to 3% in the year ended December 31, 2011 from 4% in the year endedDecember 31, 2010.
Communications. Communications expenses increased $0.1 million, or less than 1%, to$23.6 million for the year ended December 31, 2011 as compared to the year ended December 31,2010. This increase was driven by additional telecommunications bandwidth required to supportincreased trading volume at electronic exchanges and an expansion in the number of markets in whichIBG LLC operates offset by savings from market price quotation services and telephonecommunication charges. As a percentage of total net revenues, communications expenses were 2% and3% for the years ended December 31, 2011 and 2010, respectively.
General and Administrative. General and administrative expenses, for the year endedDecember 31, 2011, increased $11.2 million, or 23% to $58.9 million, as compared to the year endedDecember 31, 2010. The increase in general and administrative expenses was due to higher advertisingexpenditures, bad debt reserves and an increase in trading permit fees.
Income Tax Expense
Income tax expense for the year ended December 31, 2011 decreased $6.4 million or 11%compared to income tax expense for the year ended December 31, 2010, while income before taxesincreased by $403.7 million or 120% during the same period.
In December 2010, the Company paid a special cash dividend of $1.79 per share to holders of theCompany’s common stock. The dividend was part of a series of dividends that had no effect on ourreported income before tax on a consolidated basis. However, the U.S. federal income tax liabilitytriggered by the dividends is reported as income tax expense in the consolidated statement ofcomprehensive income. The above dividend resulted from a transaction on December 21, 2010, inwhich Timber Hill Europe AG (‘‘THE AG’’) paid its sole shareholder, IBG LLC, a dividend of$990.3 million. THE AG’s pretax earnings had not previously been subject to taxation in the UnitedStates. U.S. federal income taxes on the Company’s share of this dividend were $40.8 million. Pleaserefer to the section above entitled ‘‘Non-GAAP Financial Measures’’ for a discussion of the impact ofthe dividend on our reported results for 2010.
60

Supplemental Information
The following tables present historical trading volumes for our business. However, volumes are notthe only drivers in our business.
TRADE VOLUMES:(in 000’s, except %)
BrokerageMarket Brokerage Non Avg. TradesMaking % Cleared % Cleared % Total % per U.S.
Period Trades Change Trades Change Trades Change Trades Change Trading Day
2008 . . . . . . . . . . 101,672 120,195 16,966 238,833 9442009 . . . . . . . . . . 93,550 �8% 127,338 6% 13,636 �20% 234,524 �2% 9342010 . . . . . . . . . . 75,169 �20% 133,658 5% 18,732 37% 227,559 �3% 9052011 . . . . . . . . . . 63,602 �15% 160,567 20% 19,187 2% 243,356 7% 9682012 . . . . . . . . . . 60,421 �5% 150,000 �7% 16,118 �16% 226,540 �7% 904
CONTRACT AND SHARE VOLUMES:(in 000’s, except %)
TOTAL
Options % Futures % Stocks %Period (contracts) Change (contracts) Change (shares) Change
2008 . . . . . . . . . . . . . . 757,732 108,984 55,845,4282009 . . . . . . . . . . . . . . 643,380 �15% 82,345 �24% 75,449,891 35%2010 . . . . . . . . . . . . . . 678,856 6% 96,193 17% 84,469,874 12%2011 . . . . . . . . . . . . . . 789,370 16% 106,640 11% 77,730,974 �8%2012 . . . . . . . . . . . . . . 698,140 �12% 98,801 �7% 65,872,960 �15%
MARKET MAKING
Options % Futures % Stocks %Period (contracts) Change (contracts) Change (shares) Change
2008 . . . . . . . . . . . . . . 514,629 21,544 26,008,4332009 . . . . . . . . . . . . . . 428,810 �17% 15,122 �30% 26,205,229 1%2010 . . . . . . . . . . . . . . 435,184 1% 15,371 2% 19,165,000 �27%2011 . . . . . . . . . . . . . . 503,053 16% 15,519 1% 11,788,769 �38%2012 . . . . . . . . . . . . . . 457,384 �9% 12,660 �18% 9,339,465 �21%
Notes:
(1) Futures contract volume includes options on futures
(2) In Brazil, an equity option contract typically represents one share of the underlying stock;however, the typical minimum trading quantity is 100 contracts. To make a faircomparison to volume at other exchanges, we have adopted a policy of reportingBrazilian equity options contracts divided by their trading quantity of 100.
61

BROKERAGE TOTAL
Options % Futures % Stocks %Period (contracts) Change (contracts) Change (shares) Change
2008 . . . . . . . . . . . . . . 243,103 87,440 29,836,9952009 . . . . . . . . . . . . . . 214,570 �12% 67,223 �23% 49,244,662 65%2010 . . . . . . . . . . . . . . 243,672 14% 80,822 20% 65,304,874 33%2011 . . . . . . . . . . . . . . 286,317 18% 91,121 13% 65,942,205 1%2012 . . . . . . . . . . . . . . 240,756 �16% 86,141 �5% 56,533,495 �14%
BROKERAGE CLEARED
Options % Futures % Stocks %Period (contracts) Change (contracts) Change (shares) Change
2008 . . . . . . . . . . . . . . 77,207 85,599 26,334,7522009 . . . . . . . . . . . . . . 93,868 22% 66,241 �23% 46,627,344 77%2010 . . . . . . . . . . . . . . 103,054 10% 79,144 19% 62,077,741 33%2011 . . . . . . . . . . . . . . 145,993 42% 89,610 13% 63,098,072 2%2012 . . . . . . . . . . . . . . 144,539 �1% 84,794 �5% 54,371,351 �14%
Notes:
(1) Futures contract volume includes options on futures
BROKERAGE STATISTICS:(in 000’s, except % and where noted)
4Q2012 4Q2011 % Change
Total Accounts . . . . . . . . . . . . . . . . . . . . . . . . . . . . . 210 189 11%Customer Equity (in billions)* . . . . . . . . . . . . . . . . . . $ 32.9 $ 25.1 31%
Cleared DARTs . . . . . . . . . . . . . . . . . . . . . . . . . . . . 378 412 �8%Total Customer DARTs . . . . . . . . . . . . . . . . . . . . . . . 407 447 �9%
Cleared Customers (in $’s, except DART per account)Commission per DART . . . . . . . . . . . . . . . . . . . . . . . $ 4.24 $ 4.07 4%DART per Avg. Account (Annualized) . . . . . . . . . . . . 457 556 �18%Net Revenue per Avg. Account (Annualized) . . . . . . . $3,233 $3,435 �6%
* Excluding Non-Customers
Business Segments
The following sections discuss results of our operations by business segment, excluding a discussionof corporate income and expense. In the following tables, revenues and expenses directly associatedwith each segment are included in determining income before income taxes. Due to the integratednature of the business segments, estimates and judgments have been made in allocating certain revenueand expense items. Transactions between segments generally result from one subsidiary facilitating thebusiness of another subsidiary through the use of its existing trading memberships and clearingarrangements. In such cases, certain revenue and expense items are eliminated in order to accuratelyreflect the external business conducted in each segment. Rates on transactions between segments aredesigned to approximate full costs. In addition to execution and clearing expenses, which are the maincost driver for both the market making segment and the electronic brokerage segment, each segment’soperating expenses include (i) employee compensation and benefits expenses that are incurred directlyin support of the businesses, (ii) general and administrative expenses, which include directly incurred
62

expenses for property leases, professional fees, travel and entertainment, communications andinformation services, equipment, and (iii) indirect support costs (including compensation and otherrelated operating expenses) for administrative services provided by IBG LLC. Such administrativeservices include, but are not limited to, computer software development and support, accounting, tax,legal and facilities management.
Electronic Brokerage
The following table sets forth the results of our electronic brokerage operations for the indicatedperiods:
Year Ended December 31,
2012 2011 2010
(in millions)
Revenues:Commissions and execution fees . . . . . . . . . . . . . . . . . $412.6 $456.2 $386.8Interest income . . . . . . . . . . . . . . . . . . . . . . . . . . . . . . 211.2 209.6 119.1Other income . . . . . . . . . . . . . . . . . . . . . . . . . . . . . . . 74.6 67.0 62.0
Total revenues . . . . . . . . . . . . . . . . . . . . . . . . . . . . . 698.4 732.8 567.9
Interest expense . . . . . . . . . . . . . . . . . . . . . . . . . . . . . 28.0 41.3 20.6
Total net revenues . . . . . . . . . . . . . . . . . . . . . . . . . . 670.4 691.5 547.3
Non-interest expenses:Execution and clearing . . . . . . . . . . . . . . . . . . . . . . . . 135.8 150.6 127.5Employee compensation and benefits . . . . . . . . . . . . . . 81.6 65.8 57.6Occupancy, depreciation and amortization . . . . . . . . . . 12.1 12.2 13.6Communications . . . . . . . . . . . . . . . . . . . . . . . . . . . . . 8.9 11.4 10.7General and administrative . . . . . . . . . . . . . . . . . . . . . 90.3 81.2 63.9
Total non-interest expenses . . . . . . . . . . . . . . . . . . . . 328.7 321.2 273.3
Income before income taxes . . . . . . . . . . . . . . . . . . . . . . $341.7 $370.3 $274.0
Year Ended December 31, 2012 Compared to the Year Ended December 31, 2011
Electronic brokerage total net revenues for the year ended December 31, 2012 decreased $21.1million, or 3%, to $670.4 million, from $691.5 million during the year ended December 31, 2011,primarily due to a decrease in commission and execution fees from customers, which was partiallyoffset by an increase in net interest income. Commission and execution fees decreased $43.6 million, or10%, for the year ended December 31, 2012 as compared to 2011 as a result of lower customer tradingvolumes. This was consistent with the industry volumes, which declined in 2012 from the prior year.Volumes in options and futures contracts and stock shares decreased 16%, 5% and 14%, respectively,for the year ended December 31, 2012 from 2011. During the second half of 2011 we observed a surgein volumes driven by concerns over the U.S. debt downgrade and the European debt crisis.
Net interest income increased by $14.9 million, or 9%, for the year ended December 31, 2012 ascompared to 2011. The increase in net interest income was attributable to an increase of $10.1 millionin net fees earned from securities borrowed and loaned transactions as well as a $2.19 billion increasein average customer cash balances and an increase of $0.53 billion in average fully secured marginborrowings. The average Fed Funds effective rate increased by approximately 4 basis points to 0.14%for the year ended December 31, 2012 from the prior year.
63

Total DARTs from cleared and execution-only customers for the year ended December 31, 2012decreased 7% to approximately 413,000, as compared to approximately 444,000 during the year endedDecember 31, 2011. DARTs from cleared customers for the year ended December 31, 2012 decreased6% to approximately 384,000, as compared to approximately 409,000 during the year endedDecember 31, 2011. Total customer equity grew by 31% to $32.9 billion at December 31, 2012, from$25.1 billion at December 31, 2011. The number of customer accounts grew 11% from December 31,2011 to approximately 210,000 at December 31, 2012.
Electronic brokerage non-interest expenses for the year ended December 31, 2012 increased $7.5million, or 2%, as compared to the year ended December 31, 2011. Within non-interest expenses,execution and clearing expenses decreased by $14.8 million, driven by lower volume in options andfutures contracts and stock shares. Employee compensation and benefits expenses increased by $15.8million, or 24% during the year ended December 31, 2012 as compared to 2011. As previouslymentioned, the increase in employee compensation and benefits expense was largely a result of aspecial discretionary grant of restricted stock units awarded on January 6, 2012. General andadministrative expenses increased $9.1 million as administrative and consulting fees increased $14.5million, which were partially offset by a $3.9 million decrease in bad debt expense during the yearended December 31, 2012 as compared to 2011. As a percentage of total net revenues, non-interestexpenses increased to 49% from 46% for the year ended December 31, 2012 as compared to 2011.
Electronic brokerage income before income taxes decreased $28.6 million, or 8%, to $341.7 millionfor the year ended December 31, 2012 from $370.3 million for the year ended December 31, 2011. As apercentage of total net revenues for the electronic brokerage segment, income before income taxes was51% and 54% for the years ended December 31, 2012 and 2011, respectively.
Year Ended December 31, 2011 Compared to the Year Ended December 31, 2010
Electronic brokerage total net revenues for the year ended December 31, 2011 increased $144.2million, or 26%, to $691.5 million, from $547.3 million during the year ended December 31, 2010,primarily due to an increase in net interest income and higher commission and execution fees. Netinterest income increased $69.8 million, or 71%, for the year ended December 31, 2011 as compared to2010. The increase in net interest income was attributable to an increase of $4.94 billion in averagecustomer cash balances and an increase of $3.23 billion in average fully secured margin borrowings aswell as a $30.3 million increase in net fees earned from securities borrowed and loaned transactions.Net interest income increased despite a decrease in the average Fed Funds effective rate ofapproximately 8 basis points to 0.10% for the year ended December 31, 2011 as compared to 0.18% forthe year ended December 31, 2010. Commission and execution fees increased $69.4 million, or 18%,for the year ended December 31, 2011 as compared to 2010. The increase in commission and executionfees is directly attributable to increased customer trading volume. Volume in options and futurescontracts and stock shares increased 18%, 13%, and 1% for the year ended December 31, 2011 from2010. Stock volume declines in low priced stocks, which occurred after we raised risk marginrequirements to better protect against sudden price moves on companies with small marketcapitalization, were more than offset by increased volume in other stocks. Total DARTs from clearedand execution-only customers for the year ended December 31, 2011 increased 17% to approximately444,000, as compared to approximately 379,000 during the year ended December 31, 2010. DARTs fromcleared customers for the year ended December 31, 2011 increased 19% to approximately 409,000, ascompared to approximately 343,000 during the year ended December 31, 2010. Total customer equitygrew by 14% to $25.1 billion at December 31, 2011, from $22.1 billion at December 31, 2010. Thenumber of customer accounts grew 20% from December 31, 2010 to approximately 189,000 atDecember 31, 2011.
Electronic brokerage non-interest expenses for the year ended December 31, 2011 increased$47.9 million, or 18%, as compared to the year ended December 31, 2010. Within non-interest
64
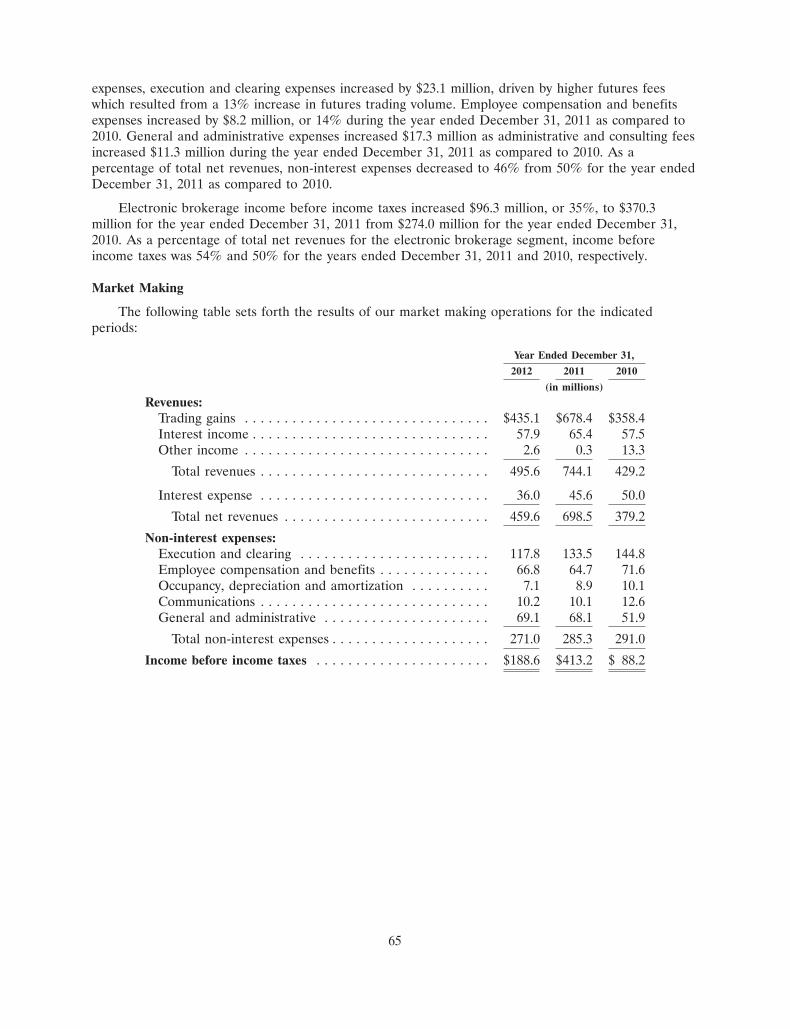
expenses, execution and clearing expenses increased by $23.1 million, driven by higher futures feeswhich resulted from a 13% increase in futures trading volume. Employee compensation and benefitsexpenses increased by $8.2 million, or 14% during the year ended December 31, 2011 as compared to2010. General and administrative expenses increased $17.3 million as administrative and consulting feesincreased $11.3 million during the year ended December 31, 2011 as compared to 2010. As apercentage of total net revenues, non-interest expenses decreased to 46% from 50% for the year endedDecember 31, 2011 as compared to 2010.
Electronic brokerage income before income taxes increased $96.3 million, or 35%, to $370.3million for the year ended December 31, 2011 from $274.0 million for the year ended December 31,2010. As a percentage of total net revenues for the electronic brokerage segment, income beforeincome taxes was 54% and 50% for the years ended December 31, 2011 and 2010, respectively.
Market Making
The following table sets forth the results of our market making operations for the indicatedperiods:
Year Ended December 31,
2012 2011 2010
(in millions)
Revenues:Trading gains . . . . . . . . . . . . . . . . . . . . . . . . . . . . . . . $435.1 $678.4 $358.4Interest income . . . . . . . . . . . . . . . . . . . . . . . . . . . . . . 57.9 65.4 57.5Other income . . . . . . . . . . . . . . . . . . . . . . . . . . . . . . . 2.6 0.3 13.3
Total revenues . . . . . . . . . . . . . . . . . . . . . . . . . . . . . 495.6 744.1 429.2
Interest expense . . . . . . . . . . . . . . . . . . . . . . . . . . . . . 36.0 45.6 50.0
Total net revenues . . . . . . . . . . . . . . . . . . . . . . . . . . 459.6 698.5 379.2
Non-interest expenses:Execution and clearing . . . . . . . . . . . . . . . . . . . . . . . . 117.8 133.5 144.8Employee compensation and benefits . . . . . . . . . . . . . . 66.8 64.7 71.6Occupancy, depreciation and amortization . . . . . . . . . . 7.1 8.9 10.1Communications . . . . . . . . . . . . . . . . . . . . . . . . . . . . . 10.2 10.1 12.6General and administrative . . . . . . . . . . . . . . . . . . . . . 69.1 68.1 51.9
Total non-interest expenses . . . . . . . . . . . . . . . . . . . . 271.0 285.3 291.0
Income before income taxes . . . . . . . . . . . . . . . . . . . . . . $188.6 $413.2 $ 88.2
65

Year Ended December 31, 2012 Compared to the Year Ended December 31, 2011
Market making total net revenues for the year ended December 31, 2012 decreased $238.9 million,or 34%, to $459.6 million, from $698.5 million during the year ended December 31, 2011. As part ofmanaging our overall exposure to foreign currency fluctuations, we maintain our capital in proportionto a basket of currencies we call the GLOBAL. The decrease in trading gains was in part due to anunfavorable swing in currency translation, which contributed 20% of the decrease, reflecting a$38.6 million loss in the year ended December 31, 2012 compared to a $11.2 million gain in 2011. Adiscussion of our approach to managing foreign currency exposure is contained in Part II, Item 7A ofthis Annual Report on Form 10-K entitled ‘‘Quantitative and Qualitative Disclosures about MarketRisk.’’
Trading gains were negatively impacted by a 26% decrease in average volatility, as measured by theVIX�, for the year ended December 31, 2012 compared to the prior year. In addition, the ratio ofactual to implied volatility decreased from 85% to 69% for the years ended December 31, 2011 and2012, respectively. Acting to offset these factors, bid/offer spreads on U.S. exchange-traded options, asreported by the NASDAQ OMX PHLX market, were approximately 6% wider in the year endedDecember 31, 2012 than in the prior year. Diminished market participation by retail investors,combined with these factors, resulted in a more difficult trading environment than that of 2011. As aresult, after removing the effects of currency translation, our trading gains decreased by 29% from theyear-ago period.
Market making options contracts volume decreased 9% while futures contracts and stock sharesvolumes decreased 18% and 21%, respectively, in the year ended December 31, 2012 as compared to2011. The decrease in options volume was curtailed by our decision to tighten our bid/offer spreads,which may have increased volume while reducing per contract gains. The decrease in stock volume inpart reflects our actions over the past year to selectively pare down trading in less profitable products.
Net interest income for the year ended December 31, 2012 increased by $2.1 million, or 11%. Theincrease in net interest income was driven by a $6.1 million decrease in interest expense on operatingloans with IBG LLC as well as $3.5 million increase in interest income from firm cash balancescompared to the prior year. These increases in net interest income were partially offset by a$7.4 million decrease in net fees earned from securities borrowed and loaned transactions comparedthe prior year. As described above, our trading gains and our net interest income are interchangeableand depend on the mix of market making positions in our portfolio and on relative interest rates in thestock and options markets. In the year ended December 31, 2012, these factors, together with securitieslending activity, produced more net interest income than in the year-ago period.
Market making non-interest expenses for the year ended December 31, 2012 decreased$14.3 million, or 5%, as compared to the year ended December 31, 2011. The decrease primarilyresulted from a $15.7 million decrease in execution and clearing fees, partially offset by a $2.1 millionincrease in employee compensation and benefits expenses. The decrease in execution and clearing feeswas driven by lower volumes in options and futures contracts and stock shares traded, compared to theyear-ago period. Employee compensation expenses increased as a result of a one-time discretionarygrant of restricted stock units awarded on January 6, 2012. As a percentage of total net revenues,market making non-interest expenses were 59% and 41% for the years ended December 31, 2012 and2011, respectively.
Market making income before income taxes decreased $224.6 million, or 54%, to $188.6 millionfor the year ended December 31, 2012 from $413.2 million for the year ended December 31, 2011. As apercentage of total net revenues for the market making segment, income before income taxes was 41%and 59% for the years ended December 31, 2012 and 2011, respectively.
66

Year Ended December 31, 2011 Compared to the Year Ended December 31, 2010
Market making total net revenues for the year ended December 31, 2011 increased $319.3 million,or 84%, to $698.5 million, from $379.2 million during the year ended December 31, 2010. Trading gainsfor the year ended December 31, 2011 increased $320.0 million, or 89%, primarily due to a reversal incurrency translation losses and wider bid/offer spreads on exchange-traded options as compared to theyear-ago period. Market making options and futures contract volumes increased 16% and 1%respectively, while stock share volume decreased 38% during the year ended December 31, 2011 ascompared to the prior year. Decreases in stock volume resulted from targeted paring back of activity atcertain exchanges to improve profitability and avoid high fees. Bid/offer spreads on U.S. exchange-traded options, as reported by the NASDAQ OMX PHLX market, on average, were approximately33% wider during the year ended December 31, 2011 than during 2010.
As part of managing our overall exposure to foreign currency fluctuations, we maintain our capitalin proportion to a basket of currencies we call the GLOBAL. Currency translation effects as a result ofholding our equity in GLOBALs had an estimated positive impact on our trading gains of $172.1million for the year December 31, 2011 as compared to the year-ago period. A discussion of ourapproach to managing foreign currency exposure is contained in Part II, Item 7A of this Annual Reporton Form 10-K entitled ‘‘Quantitative and Qualitative Disclosures about Market Risk.’’
Net interest income for the year ended December 31, 2011 increased by $12.3 million to$19.8 million. As described above, our trading gains and our net interest income are interchangeableand depend on the mix of market making positions in our portfolio and on relative interest rates in thestock and options markets. In the year ended December 31, 2011, these factors, together with securitieslending activity, produced more interest income than in the year-ago period.
Market making non-interest expenses for the year ended December 31, 2011 decreased $5.7 million, or2%, as compared to the year ended December 31, 2010. The decrease primarily resulted from an$11.3 million decrease in execution and clearing fees and a $6.9 million decrease in employee compensationand benefits expenses, partially offset by a $16.2 million increase in general and administrative fees. Thedecrease in execution and clearing fees was driven by a greater proportion of our U.S. options volumeexecuted on exchanges with make-or-take pricing, where we are paid for providing liquidity. In addition,ETF issuer fees, a component of execution and clearing fees, decreased $2.7 million. Employeecompensation expenses decreased as a result of an 8% decrease in average staff count during the yearended December 31, 2011 compared to the prior year and, in part, from a refinement in methods that weuse to attribute certain expenses to the electronic brokerage and market making segments as if they werestand-alone businesses. The increase in general and administrative fees was largely a result of a$13.5 million increase in administrative and consulting fees during the year ended December 31, 2011, ascompared to 2010. As a percentage of total net revenues, market making non-interest expenses decreasedto 41% from 77% for the year ended December 31, 2011 and 2010, respectively.
Market making income before income taxes increased $325.0 million, or 368%, to $413.2 millionfor the year ended December 31, 2011 from $88.2 million for the year ended December 31, 2010. As apercentage of total net revenues for the market making segment, income before income taxes were59% and 23% for the years ended December 31, 2011 and 2010, respectively.
Liquidity and Capital Resources
We maintain a highly liquid balance sheet. The majority of our assets consist of exchange-listedmarketable securities inventories, which are marked-to-market daily, investment of customer funds andcollateralized receivables arising from customer-related and proprietary securities transactions.Collateralized receivables consist primarily of customer margin loans, securities borrowed, receivablesfrom clearing houses for settlement of securities transactions and, to a lesser extent, securitiespurchased under agreements to resell. At December 31, 2012, total assets were $33.20 billion of whichapproximately $32.77 billion, or 98.7% were considered liquid.
67

Daily monitoring of liquidity needs and available collateral levels is undertaken to help ensure thatan appropriate liquidity cushion, in the form of unpledged collateral, is maintained at all times. Ourability to quickly reduce funding needs by balance sheet contraction without adversely affecting ourcore businesses and to pledge additional collateral in support of secured borrowings is continuouslyevaluated to ascertain the adequacy of our capital base.
We actively manage our excess liquidity and we maintain significant borrowing facilities throughthe securities lending markets and with banks. In response to changes in the credit market environmentduring late 2008 and into the first quarter of 2009, we continue to maintain sufficient levels of cash onhand to provide us with a buffer should we need immediately available funds for any reason.
To provide additional liquidity and to further increase our regulatory capital reserves, we maintaina committed senior secured revolving credit facility from a syndicate of banks (see ‘‘PrincipalIndebtedness’’ below). As of December 31, 2012, no borrowings were outstanding under this facility.Liability balances in connection with our securities loaned and payables to customers were greater thantheir respective average monthly balances during the year ended December 31, 2012. Based on ourcurrent level of operations, we believe our cash flows from operations, available cash and availableborrowings under our senior secured revolving credit facility will be adequate to meet our futureliquidity needs for more than the next twelve months.
Cash and cash equivalents held by the Company’s non-U.S. operating companies at December 31,2012 were $515.1 million ($683.2 million at December 31, 2011). These funds are primarily intended tofinance each individual operating company’s local operations, and thus would not be available to fundU.S. domestic operations unless repatriated through payment of dividends to IBG LLC. In December2012, a dividend of $131.6 million was paid to IBG LLC from a non-U.S. subsidiary as part of the$400 million funding for the special cash dividend. The underlying earnings of this subsidiary hadpreviously been subject to U.S. income taxes. Therefore, no additional U.S. income taxes were requiredto be provided. It is not currently the Company’s intention to repatriate further amounts from non-U.S.operating companies. In the event dividends were to be paid to the Company in the future by anon-U.S. operating company, as occurred in connection with the special dividend in December 2010,the Company would be required to accrue and pay income taxes on such dividends to the extent thatU.S. income taxes had not been paid previously on the income of the paying company.
Historically, IBG LLC’s consolidated equity has consisted primarily of accumulated retainedearnings, which to date have been sufficient to fund our operations and growth. IBG LLC’sconsolidated equity was $4.78 billion at December 31, 2012. This is attributable to total comprehensiveincome for 2012, offset by dividends paid during 2012.
Cash Flows
The following table sets forth our cash flows from operating activities, investing activities andfinancing activities for the periods indicated:
Year Ended December 31,
2012 2011 2010
(in millions)
Cash provided by operating activities . . . . . . . . . . . . $ 558.4 $1,085.9 $ 1,693.4Cash used in investing activities . . . . . . . . . . . . . . . . (52.4) (137.0) (17.3)Cash used in financing activities . . . . . . . . . . . . . . . . (591.0) (550.7) (1,174.8)Effect of exchange rate changes on cash and cash
equivalents . . . . . . . . . . . . . . . . . . . . . . . . . . . . . 4.1 (56.9) 46.4
Increase (decrease) in cash and cash equivalents . . . . $ (80.9) $ 341.3 $ 547.7
68
Our cash flows from operating activities are largely a reflection of the size and composition oftrading positions held by our market making subsidiaries, and of the changes in customer cash andmargin debit balances in our electronic brokerage business. Our cash flows from investing activities areprimarily related to capitalized internal software development, purchases and sales of memberships atexchanges where we trade and strategic investments where such investments may enable us to offerbetter execution alternatives to our current and prospective customers, or create new opportunities forourselves as market makers or where we can influence exchanges to provide competing products atbetter prices using sophisticated technology. Our cash flows from financing activities are comprised ofshort-term borrowings, long-term borrowings and capital transactions. Short-term borrowings frombanks are part of our daily cash management in support of operating activities. Other borrowingsprovide us with flexible sources of excess liquidity and regulatory capital. These borrowings includesenior notes issued in private placements to certain qualified customers of IB LLC (discontinued in2012) and a committed three-year $100.0 million senior secured revolving credit facility, from asyndicate of banks. This facility was entered into in May 2012 and replaced a two-year $100.0 millionfacility that expired at the same time. Capital transactions consist primarily of the approximately$1 billion special dividend in December 2010, the approximately $400 million special dividend paid inDecember 2012 as well as the three quarterly dividends paid in 2011 and four quarterly 2012 cashdividends paid to common stockholders, and related cash distributions paid to Holdings.
Year Ended December 31, 2012: Our cash and cash equivalents decreased by $80.9 million to$1,614.6 million at the end of 2012. We raised $558.4 million in net cash from operating activities. Weused net cash of $52.4 million in our investing activities to purchase non-market making investmentsand for capital expenditures. We used $591.0 million in financing activities, primarily in dividends paidand the repayment of senior notes outstanding.
Year Ended December 31, 2011: Our cash and cash equivalents increased by $341.3 million to$1,695.5 million at the end of 2011. We raised $1,085.9 million in net cash from operating activities. Weused net cash of $687.7 million in our investing and financing activities to purchase non-market makinginvestments, decrease short-term borrowings and repay borrowings under our senior secured revolvingcredit facility. In addition, we realized a net decrease in senior notes outstanding and paid dividends toHoldings and to our common stockholders.
Year Ended December 31, 2010: Our cash and cash equivalents increased by $547.7 million to$1,354.2 million at the end of 2010. We raised $1,693.4 million in net cash from operating activities. Weused net cash of $17.3 million in our investing and $1,174.8 million in our financing activities primarilydue to dividends paid to public shareholders and to Holdings and redemption of member interests fromHoldings.
Regulatory Capital Requirements
Our principal operating subsidiaries are subject to separate regulation and capital requirements inthe United States and other jurisdictions. TH LLC and IB LLC are registered U.S. broker-dealers andfutures commission merchants, and their primary regulators include the SEC, the Commodity FuturesTrading Commission, the Chicago Board Options Exchange, the Chicago Mercantile Exchange, theFinancial Industry Regulatory Authority and the National Futures Association. THE is registered to dobusiness in Switzerland as a securities dealer and is regulated by the Swiss Financial MarketSupervisory Authority. IBUK is subject to regulation by the U.K. Financial Services Authority. Ourvarious other operating subsidiaries are similarly regulated. See the notes to the consolidated financialstatements in Part II, Item 8 of this Annual Report on Form 10-K for further information regardingour regulated subsidiaries.
69

At December 31, 2012, aggregate excess regulatory capital for all of the operating companies was$2.6 billion, and all of the operating companies were in compliance with their respective regulatorycapital requirements.
Net Capital/Eligible Equity Requirement Excess
IB LLC . . . . . . . . . . . . . . . . . . . . . . . . . . . . . . $1,633 $219 $1,414TH LLC . . . . . . . . . . . . . . . . . . . . . . . . . . . . . 394 42 352THE . . . . . . . . . . . . . . . . . . . . . . . . . . . . . . . . 646 211 435Other regulated Operating Companies . . . . . . . . 379 24 355
$3,052 $496 $2,556
Principal Indebtedness
IBG LLC is the borrower under a $100.0 million senior secured revolving credit facility, which hadno outstanding balance as of December 31, 2012.
Senior Secured Revolving Credit Facility
On May 17, 2012, IBG LLC entered into a new $100 million three-year senior secured revolvingcredit facility with a syndicate of banks. This credit facility replaces a similar two-year facility thatexpired on May 18, 2012. IBG LLC is the sole borrower under this credit facility, which is required tobe guaranteed by IBG LLC’s domestic non-regulated subsidiaries (currently there are no such entities).The facility’s interest rate is indexed to the British Bankers Association LIBOR rate or the overnightfederal funds rate for the relevant term, at the borrower’s option, and is secured by a first priorityinterest in all of the capital stock of each entity owned directly by IBG LLC (subject to customarylimitations with respect to foreign subsidiaries). The facility may be used to finance working capitalneeds and general corporate purposes, including downstreaming funds to IBG LLC’s regulated broker-dealer subsidiaries as regulatory capital. This allows IBG LLC to take advantage of marketopportunities when they arise, while maintaining substantial excess regulatory capital. The financialcovenants contained in this credit facility are as follows:
• minimum consolidated shareholders’ equity, as defined, of $3.6 billion, with quarterly increasesequal to 25% of positive consolidated income;
• maximum total debt to capitalization ratio of 30%;
• minimum liquidity ratio of 1.0 to 1.0; and
• maximum total debt to net regulatory capital ratio of 35%.
At December 31, 2012, IBG LLC was in compliance with all of the covenants of this credit facility.At maturity, subject to meeting certain terms of the facility, the Company will have an option toconvert the facility to a one-year term loan.
Senior Notes
Prior to January 2012, IBG LLC periodically issued senior notes in private placements to certainqualified customers of IB LLC. IBG LLC used the proceeds from sales of the senior notes to providecapital to IBG LLC’s broker-dealer subsidiaries in the form of subordinated loans and for othergeneral purposes. Based on a review of its available liquidity resources, which resulted in adetermination of a strong liquidity position, in January 2012, the Company decided to discontinue theSenior Notes Program. It is the Company’s intention that no new Senior Notes will be issued.
70

There were no senior notes outstanding at December 31, 2012 and senior notes outstanding atDecember 31, 2011 were $101.4 million, all being 3% notes. During the period from January 1 throughDecember 31, 2012, no senior notes were issued, and $101.4 million senior notes were redeemed.
Capital Expenditures
Our capital expenditures are comprised of compensation costs of our software engineering staff fordevelopment of software for internal use and expenditures for computer, networking andcommunications hardware. These expenditure items are reported as property and equipment. Capitalexpenditures for property and equipment were approximately $18.0, $13.5 and $18.1 million for thethree years ended December 31, 2012, 2011 and 2010, respectively. We anticipate that our 2013 grosscapital expenditures will be lower than in 2012 as we complete the expansion of our data center andbackup facilities. In the future, we plan meet capital expenditure needs as we continue our focus ontechnology infrastructure initiatives to further enhance our competitive position. We anticipate that wewill fund capital expenditures with cash from operations and cash on hand. In response to changingeconomic conditions, we believe we have the flexibility to modify our capital expenditures by adjustingthem (either upward or downward) to match our actual performance. If we pursue any strategicacquisitions, we may incur additional capital expenditures.
Contractual Obligations Summary
Our contractual obligations principally include obligations associated with our outstandingindebtedness and interest payments as of December 31, 2012.
Payments Due by Year
Total 2013 - 2014 2015 - 2016 Thereafter
(Dollars in Millions)
Payable to Holdings under Tax Receivable Agreement(1) . . $258.6 $33.2 $33.2 $192.2Interest payments on senior secured revolving credit
facility(2) . . . . . . . . . . . . . . . . . . . . . . . . . . . . . . . . . . . 0.1 0.1 — —Operating leases . . . . . . . . . . . . . . . . . . . . . . . . . . . . . . . . 54.3 22.5 17.0 14.8
Total contractual cash obligations . . . . . . . . . . . . . . . . . . . $313.0 $55.8 $50.2 $207.0
(1) As of December 31, 2012 contractual amounts owed under the tax receivable agreement of$258.6 million have been recorded in payable to affiliate in the consolidated financial statementsrepresenting management’s best estimate of the amounts currently expected to be owed under thetax receivable agreement. Through December 31, 2012, approximately $70.4 million of cumulativecash payments have been made.
(2) Future principal and interest payments are calculated based on the assumption that all debt isoutstanding until maturity.
Seasonality
Our businesses are subject to seasonal fluctuations, reflecting varying numbers of marketparticipants at times during the year and varying numbers of trading days from quarter-to-quarter,including declines in trading activity due to holidays. Typical seasonal trends may be superseded bymarket or world events, which can have a significant impact on prices and trading volume.
71

Inflation
Although we cannot accurately anticipate the effect of inflation on our operations, we believe thatinflation has not had for the three most recent years, and is not likely in the foreseeable future to have,a material impact on our results of operations.
Strategic Investments and Acquisitions
We periodically engage in evaluations of potential strategic investments and acquisitions. TheCompany holds strategic investments in electronic trading exchanges including: Boston OptionsExchange, LLC; OneChicago LLC and CBOE Stock Exchange, LLC. The Company has also madeinvestments in Quadriserv Inc., an electronic securities lending platform provider and FactorAdvisors, LLC, an Exchange Traded Funds (‘‘ETF’’) issuer.
We intend to continue making acquisitions on an opportunistic basis, generally only when theacquisition candidate will, in our opinion, enable us to acquire either technology or customers fasterthan we could develop them on our own. At December 31, 2012, there were no definitive agreementswith respect to any material acquisition.
Certain Information Concerning Off-Balance-Sheet Arrangements
IBG, Inc. may be exposed to a risk of loss not reflected in the consolidated financial statementsfor futures products, which represent obligations of the Company to settle at contracted prices, whichmay require repurchase or sale in the market at prevailing prices. Accordingly, these transactions resultin off-balance sheet risk as IBG, Inc.’s cost to liquidate such futures contracts may exceed the amountsreported in our consolidated statements of financial condition.
Critical Accounting Policies
Valuation of Financial Instruments
Due to the nature of our operations, substantially all of our financial instrument assets, comprisedof financial instruments owned, securities purchased under agreements to resell, securities borrowedand receivables from brokers, dealers and clearing organizations are carried at fair value based onpublished market prices and are marked to market daily, or are assets which are short-term in nature(such as U. S. government treasury bills or spot foreign exchange) and are reflected at amountsapproximating fair value. Similarly, all of our financial instrument liabilities that arise from financialinstruments sold but not yet purchased, securities sold under agreements to repurchase, securitiesloaned and payables to brokers, dealers and clearing organizations are short-term in nature and arereported at quoted market prices or at amounts approximating fair value. Our long and short positionsare valued at either the last consolidated trade price or the last consolidated bid/offer mid-point (whereapplicable) at the close of regular trading hours, in their respective markets. Given that we manage aglobally integrated market making portfolio, we have large and substantially offsetting positions insecurities and commodities that trade on different exchanges that close at different times of the tradingday. As a result, there may be large and anomalous swings in the value of our positions daily and,accordingly, in our earnings in any period. This is especially true on the last business day of eachcalendar quarter, although such swings tend to come back into equilibrium on the first business day ofthe succeeding calendar quarter.
Principles of Consolidation, including Noncontrolling Interests
The consolidated financial statements include the accounts of IBG, Inc. and its majority and whollyowned subsidiaries. As sole managing member of IBG LLC, IBG, Inc. exerts control over the Group’soperations. In accordance with ASC 810, Consolidation, the Company consolidates the Group’s
72

consolidated financial statements and records as noncontrolling interest the interests in the Group thatIBG, Inc. does not own.
We are the sole managing member of IBG LLC and, as such, operate and control all of thebusiness and affairs of IBG LLC and its subsidiaries and consolidate IBG LLC’s financial results intoour financial statements. We hold approximately 11.9% ownership interest in IBG LLC. Holdings isowned by the original members of IBG LLC and holds approximately 88.1% ownership interest inIBG LLC. Our share of IBG LLC’s net income, excluding Holdings’ noncontrolling interest, isapproximately 11.9% and similarly, outstanding shares of our common stock represent approximately11.9% of the outstanding membership interests of IBG LLC.
Prior to the June 6, 2012 amendment to the Exchange Agreement (see Note 4 to the consolidatedfinancial statements), the Company was required to report Holdings’ ownership as redeemablenoncontrolling interests (i.e., temporary equity) pursuant to ASC 810-10-45, ASC 815-40-25 andASC 480-10-S99-3A (formerly FASB Emerging Issues Task Force Topic D-98), outside of total equity inthe consolidated financial statements. Redemption value of these redeemable noncontrolling interestswas measured as the number of equivalent shares of member interests in IBG LLC owned by Holdingsmultiplied by the then current market price per share of the Company’s common stock. The excess ofthe redemption value over the book value of these interests, which did not affect net incomeattributable to common stockholders or cash flows, was required to be accounted for as a reduction ofthe Company’s stockholders’ equity in the consolidated statement of financial condition.
The Company elected to recognize changes in redemption value in each reporting periodimmediately as they occurred as if the end of each reporting period was also the redemption date forthe entire redeemable noncontrolling interest under paragraph 15(b) of ASC 480-10-S99-3A,notwithstanding that the redeemable noncontrolling interests are redeemable over a period of timepursuant to a redemption schedule (see Note 4 to the consolidated financial statements).
For periods after the Amendment, the noncontrolling interests in IBG LLC attributable toHoldings will be reported as a component of total equity.
Earnings per Share
Earnings per share (‘‘EPS’’) are computed in accordance with ASC 260, Earnings per Share. Sharesof Class A and Class B common stock share proportionately in the earnings of IBG, Inc. Basic earningsper share are calculated utilizing net income available for common stockholders divided by theweighted average number of shares of Class A and Class B common stock outstanding for that period.Diluted earnings per share are calculated utilizing the Company’s basic net income available forcommon stockholders divided by diluted weighted average shares outstanding with no adjustments tonet income available to common stockholders for dilutive potential common shares.
The Company has determined to reflect Topic D-98 measurement adjustments for non-fair valueredemption rights through application of the two-class method of calculating earnings per share in lieuof recognizing the impact through the determination of net income attributable to commonshareholders. Furthermore, in accordance with footnote 17 of ASC 480-10-S99-3A, the Company haselected to treat only the portion of the periodic measurement adjustments that reflect a redemption inexcess of fair value as being akin to a dividend, reducing net income attributable to commonstockholders for purposes of applying the two-class method. Decreases in the carrying amount ofredeemable noncontrolling interests through Topic D-98 measurement adjustments are reflected in theapplication of the two-class method only to the extent they represent recoveries of amounts previouslyaccounted for by applying the two-class method.
73

Stock-Based Compensation
IBG, Inc. follows ASC 718, Compensation—Stock Compensation, to account for its stock-basedcompensation plans. ASC 718 requires all share-based payments to employees to be recognized in thefinancial statements using a fair value-based method. As a result, IBG, Inc. expenses the fair value ofawards granted to employees, generally 50% in the year of grant in recognition of plan forfeitureprovisions (described below) and the remaining 50% over the related vesting period utilizing the‘‘graded vesting’’ method permitted under ASC 718-10. In the case of ‘‘retirement eligible’’ employees(those employees older than 59), 100% of awards are expensed when granted.
Awards granted under the stock-based compensation plans are subject to forfeiture in the event anemployee ceases employment with the Company. The plans provide that employees who discontinueemployment with the Company without cause and continue to meet the terms of the plans’post-employment provisions will forfeit 50% of unvested previously granted awards unless the employeeis over the age of 59, in which case the employee would be eligible to receive 100% of unvested awardspreviously granted.
Contingencies
Our policy is to estimate and accrue for potential losses that may arise out of litigation andregulatory proceedings, to the extent that such losses are probable and can be estimated, in accordancewith ASC 450, Contingencies. Potential losses that might arise out of tax audits, to the extent that suchlosses are ‘‘more likely than not,’’ would be estimated and accrued in accordance with ASC 740-10.Significant judgment is required in making these estimates and our final liabilities may ultimately bematerially different. Our total liability accrued with respect to litigation and regulatory proceedings isdetermined on a case-by-case basis and represents an estimate of probable losses based on, amongother factors, the progress of each case, our experience with and industry experience with similar casesand the opinions and views of internal and external legal counsel. Given the inherent difficulty ofpredicting the outcome of our litigation and regulatory matters, particularly in cases or proceedings inwhich substantial or indeterminate damages or fines are sought, or where cases or proceedings are inthe early stages, we cannot estimate losses or ranges of losses for cases or proceedings where there isonly a reasonable possibility that a loss may be incurred.
We have been from time to time subject to certain pending and legal actions which arise out of thenormal course of business. Litigation is inherently unpredictable, particularly in proceedings whereclaimants seek substantial or indeterminate damages, or which are in their early stages. We cannotpredict with certainty the actual loss or range of loss related to such legal proceedings, the manner inwhich they will be resolved, the timing of final resolution or the ultimate settlement. Consequently, wecannot estimate losses or ranges of losses related to such legal matters, even in instances where it isreasonably possible that a future loss will be incurred. As of December 31, 2012, we, along with certainof our subsidiaries, have been named parties to legal actions, which we and/or such subsidiaries intendto defend vigorously. Although the results of legal actions cannot be predicted with certainty, it is theopinion of management that the resolution of these actions is not expected to have a material adverseeffect, if any, on our business or financial condition, but may have a material impact on the results ofoperations for a given period. As of December 31, 2012 and December 31, 2011, reserves provided forpotential losses related to litigation matters were not material.
Use of Estimates
The preparation of financial statements in conformity with U.S. GAAP requires management tomake estimates and assumptions that affect the reported amounts and disclosures in the consolidatedfinancial statements and accompanying notes. Estimates, by their nature, are based on judgment andavailable information. Therefore, actual results could differ materially from those estimates. Such
74

estimates include the estimated fair values of IBG LLC and the Company in connection withaccounting for redeemable noncontrolling interests, value of investments accounted for under theequity method of accounting, the estimated useful lives of property and equipment, includingcapitalized internally developed software, the allowance for doubtful accounts, compensation accruals,current and deferred income taxes and estimated contingency reserves.
Income Taxes
IBG, Inc. accounts for income taxes in accordance with ASC 740, Income Taxes. The Company’sincome tax expense, deferred tax assets and liabilities, and reserves for unrecognized tax benefits arebased on enacted tax laws and reflect management’s best assessment of estimated future taxes to bepaid. We are subject to income taxes in both the United States and numerous foreign jurisdictions.Determining income tax expense requires significant judgments and estimates.
Deferred income tax assets and liabilities arise from temporary differences between the tax andfinancial statement recognition of the underlying assets and liabilities. In evaluating our ability torecover our deferred tax assets within the jurisdiction from which they arise, we consider all availablepositive and negative evidence, including scheduled reversals of deferred tax liabilities, projected futuretaxable income, tax-planning strategies, and results of recent operations. In projecting future taxableincome, we begin with historical results adjusted for the results of discontinued operations and changesin accounting policies and incorporate assumptions including the amount of future state, federal andforeign pretax operating income, the reversal of temporary differences, and the implementation offeasible and prudent tax-planning strategies. These assumptions require significant judgment about theforecasts of future taxable income and are consistent with the plans and estimates we are using tomanage the underlying businesses. In evaluating the objective evidence that historical results provide,we consider three years of cumulative operating income (loss). Deferred income taxes have not beenprovided for U.S. tax liabilities or for additional foreign taxes on the unremitted earnings of foreignsubsidiaries that have been indefinitely reinvested.
The calculation of our tax liabilities involves dealing with uncertainties in the application ofcomplex tax laws and regulations in a multitude of jurisdictions across our global operations. Changesin tax laws and rates could also affect recorded deferred tax assets and liabilities in the future.Management is not aware of any such changes that would have a material effect on the Company’sresults of operations, cash flows, or financial position.
ASC 740 provides that a tax benefit from an uncertain tax position may be recognized when it ismore likely than not that the position will be sustained upon examination, including resolutions of anyrelated appeals or litigation processes, on the basis of the technical merits. ASC 740 also providesguidance on measurement, derecognition, classification, interest and penalties, accounting in interimperiods, disclosure, and transition.
The Company records tax liabilities in accordance with ASC 740 and adjusts these liabilities whenmanagement’s judgment changes as a result of the evaluation of new information not previouslyavailable. Because of the complexity of some of these uncertainties, the ultimate resolution may resultin a payment that is materially different from our current estimate of the tax liabilities. Thesedifferences will be reflected as increases or decreases to income tax expense in the period in which newinformation is available.
75
Recent Accounting Pronouncements
Subsequent to the adoption of the ASC, the FASB will issue Accounting Standards Updates(‘‘ASUs’’) as the means to add to or delete from, or otherwise amend the ASC. In 2012 and 2013, priorto the issuance of the Company’s consolidated financial statements, ASUs 2012-01 through ASU2013-05 were issued. Following is a summary of recently issued ASUs that have affected or may affectthe Company’s consolidated financial statements:
Affects Status
ASU 2011-03 . . . Transfers and Servicing (Topic 860): Fiscal years, and interim periods withinReconsideration of Effective Control for those fiscal years, beginning afterRepurchase Agreements December 15, 2011.
ASU 2011-04 . . . Fair Value Measurement (Topic 820): To be applied prospectively for interimAmendments to Achieve Common Fair and annual periods beginning afterValue Measurement and Disclosure December 15, 2011.Requirements in U.S. GAAP and IFRS
ASU 2011-11 . . . Balance Sheet (Topic 210): Disclosures Effective for fiscal periods beginning onabout Offsetting Assets and Liabilities or after January 1, 2013. Retrospective
disclosures for comparative periodspresented will be required.
ASU 2012-03 . . . Technical Amendments and Corrections Effective upon issuance in August 2012.to SEC Sections—Amendments to SECsection of ASC pursuant to SEC StaffBulletin 114, Technical AmendmentsPursuant to SEC Release No. 33-9520and Corrections Relating to AccountingStandards Update 2010-22.
ASU 2012-04 . . . Technical Corrections and Effective upon issuance in October 2012Improvements—Amendments to the or, in the case of amendments subjectASC correcting for differences between to transitional guidance, for fiscal yearssource literature and the ASC, guidance beginning after December 15, 2012.clarification and reference correctionsand relocation of guidance to moreappropriate locations within the ASC,and Conforming Amendments Relatedto Fair Value (Topic 820).
ASU 2013-01 . . . Balance Sheet (Topic 210): Clarifying the Effective for fiscal periods beginning onScope of Disclosures about Offsetting or after January 1, 2013 (the same asAssets and Liabilities the effective date of ASU 2011-11).
Adoption of those ASUs that became effective during 2012 and 2013, prior to the issuance of theCompany’s consolidated financial statements, did not have a material effect on those financialstatements. Management is assessing the potential impact on the Company’s financial statements ofadopting ASUs that will become effective in the future.
ASC/IFRS Convergence
In February 2010, the SEC issued Commission Statement in Support of Convergence and GlobalAccounting Standards, a formal statement updating the status of its November 2008 Roadmap for thePotential Use of Financial Statements Prepared in Accordance with International Financial Reporting
76
Standards by U.S. Issuers (‘‘IFRS Roadmap’’). The statement supported convergence of accountingstandards and the development of a single set of global accounting standards. As directed in thisstatement, the SEC staff issued Work Plan for the Consideration of Incorporating International FinancialReporting Standards into the Financial Reporting System for U.S. Issuers (the ‘‘Work Plan’’) in May 2010,and issued a follow-up Staff Paper, subtitled Exploring a Possible Method of Incorporation in May 2011.The Work Plan outlines the steps to be taken to provide the SEC with information to be able toconclude whether IFRS should be adopted for U.S. registrants and the Staff Paper discusses alternativeapproaches (‘‘Convergence’’ and ‘‘Endorsement’’) to adoption that could be applied. Within the StaffPaper, the SEC Staff has issued a Request for Comment on these alternatives. The Comment periodended July 31, 2011 and the SEC Staff issued two Staff Papers, A Comparison of U.S. GAAP and IFRSand Analysis of IFRS in Practice on November 16, 2011.
In June 2012 the FASB and IASB issued a joint statement on their continuing deliberationsregarding changes to lease accounting. When issued, new lease accounting standards under the ASCand IFRS will require the reporting of lease assets and related liabilities on issuers’ statements offinancial condition under a mutually agreed upon two-method approach. Exposure Drafts detailingapplicability and implementation considerations are expected to be issued during the second half of2012, and final standards are expected to be issued in 2013. Management will be assessing the potentialeffects of this change in lease accounting as the standard setting process moves forward. Based on thescope of existing lease commitments (approximately 0.1% of total assets as of December 31, 2012—seeNote 15 to the audited financial statements in Item 8 of this Annual Report on Form 10-K), the effecton the Company’s financial statements is not expected to be material.
On July 13, 2012, the SEC’s Office of the Chief Accountant issued its Final Staff Report on theWork Plan. This report considered possible means of aligning IFRS with U.S. GAAP, and raisednumerous concerns about the possible effects of adoption on registrants and investors. The StaffReport did not reject some form of convergence between U.S. GAAP and IFRS, but also did notendorse adoption and did not commit to the extent or timing of adoption. While a formal commitmentregarding possible incorporation of IFRS into U.S. GAAP has not been determined, based oncontinuing joint efforts between the FASB and IASB, it is likely that convergence to some extent willoccur in the future. The Company applies versions of IFRS for the stand alone financial statements ofseveral of the Operating Companies, where required, and continues to assess the potential impact ofadopting IFRS on the Company’s consolidated financial statements.
SEC Derivatives Regulation Roadmap
In June 2012, the SEC issued for comment a policy statement on its proposed plan that wouldsequence the phasing in of final rules to be adopted by the Commission regulating security-based swapsin order to comply with the requirements of the 2010 Dodd-Frank Wall Street Reform and ConsumerProtection Act (the ‘‘Dodd-Frank’’ Act). The policy statement provides a proposed ‘‘roadmap’’ foradoption of final rules, but does not mandate specific registrant compliance deadlines. Management ismonitoring this and other accounting and regulatory rulemaking developments for their potential effecton the Company’s financial statements and internal controls over financial reporting.
77

GAAP to NON-GAAP Reconciliation and Footnotes
IBG, Inc. Consolidated
2010
(In thousands, except shares or per shareamounts)
Non-GAAPFinancial
Non-GAAP PerformanceAs Reported Adjustments Measures
Income Before Income Taxes:As reported . . . . . . . . . . . . . . . . . . . . . . . . . . . . . . . . . . . . $ 337,415
Non-GAAP Adjustments for non-operating activities—Payments in lieu of dividends on unvested shares of the
Company’s Class A Common Stock(a) . . . . . . . . . . . . . $ 9,456
$ 337,415 $ 9,456 $ 346,871
Pre-tax profit margin . . . . . . . . . . . . . . . . . . . . . . . . . . . . . . 37% 38%
Income Tax Expense:As reported . . . . . . . . . . . . . . . . . . . . . . . . . . . . . . . . . . . . $ 60,281
Non-GAAP Adjustments for non-operating activities—Income taxes on payments in lieu of dividends(a) . . . . . . . $ 678The Company’s share of taxes payable arising from the
payment of dividends by THE AG to IBG LLC(b) . . . . (46,112)U.S. foreign tax credits for Swiss taxes paid(c) . . . . . . . . . 16,608
$ 60,281 $(28,826) $ 31,455
Net Income (loss) attributable to common stockholders:As reported . . . . . . . . . . . . . . . . . . . . . . . . . . . . . . . . . . . . $ (9,550)
Non-GAAP Adjustments for non-operating activities—Payments in lieu of dividends on unvested shares of the
Company’s Class A Common Stock(a) . . . . . . . . . . . . . $ 1,010Income taxes on payments in lieu of dividends(a) . . . . . . . (368)The Company’s share of taxes payable arising from the
payment of dividends by THE AG to IBG LLC(b) . . . . 46,112U.S. foreign tax credits for Swiss taxes paid(c) . . . . . . . . . (16,608)
$ (9,550) $ 30,146 $ 20,596
Earnings per Share(d):Basic . . . . . . . . . . . . . . . . . . . . . . . . . . . . . . . . . . . . . . . . $ (0.23) $ 0.72 $ 0.49
Diluted . . . . . . . . . . . . . . . . . . . . . . . . . . . . . . . . . . . . . . . $ (0.23) $ 0.71 $ 0.48
Weighted Average Shares:Basic . . . . . . . . . . . . . . . . . . . . . . . . . . . . . . . . . . . . . . . . 41,870,926 41,870,926
Diluted . . . . . . . . . . . . . . . . . . . . . . . . . . . . . . . . . . . . . . . 42,498,705 42,498,705
(a) Holders of unvested Class A shares of the Company’s common stock were paid $1.79 per share inlieu of the cash dividend paid on outstanding shares on December 23, 2010. The Company’s shareof these payments was $1.0 million, on which it realized a tax benefit of $0.4 million.
78
(b) On December 21, 2010, Timber Hill Europe AG (‘‘THE AG’’) paid its sole shareholder, IBG LLC,a dividend of $990.3 million. THE AG’s pretax earnings had not previously been subject totaxation in the United States. U.S. federal income taxes on the Company’s share of this dividendwere $40.8 million. In addition, the Company incurred $5.3 million in non-refundable taxeswithheld by the Swiss government.
(c) The provision for income taxes is reported net of available foreign tax credits of $16.6 million.
(d) The non-GAAP diluted EPS for 2010 of $0.48 differs from the $0.72 by $0.24, which representedthe impact of currency translation now included in the GAAP Comprehensive Income. See Note 5to the consolidated financial statements in this section for further information regardingcomprehensive income.
ITEM 7A. QUANTITATIVE AND QUALITATIVE DISCLOSURES ABOUT MARKET RISK
We are exposed to various market risks. Our exposures to market risks arise from assumptionsbuilt into our pricing models, equity price risk, foreign currency exchange rate fluctuations related toour international operations, changes in interest rates which impact our variable-rate debt obligations,and risks relating to the extension of margin credit to our customers.
Pricing Model Exposure
Our strategy as a market maker is to calculate quotes a few seconds ahead of the market andexecute small trades at tiny but favorable differentials as a result. This is made possible by ourproprietary pricing model, which continuously evaluates and monitors the risks inherent in ourportfolio, assimilates market data and reevaluates the outstanding quotes in our entire portfolio eachsecond. Certain aspects of the model rely on historical prices of securities. If the behavior of pricemovements of individual securities diverges substantially from what their historical behavior wouldpredict, we might incur trading losses. We attempt to limit such risks by diversifying our portfolioacross many different options, futures and underlying securities and avoiding concentrations ofpositions based on the same underlying security. Historically, our losses from these events have beenimmaterial in comparison to our annual trading profits.
Foreign Currency Exposure
As a result of our international market making activities and accumulated earnings in our foreignsubsidiaries, our income and net worth is exposed to fluctuations in foreign exchange rates. OurEuropean operations and some of our Asian operations are conducted by our Swiss subsidiary, THE.THE is regulated by the Swiss Financial Market Supervisory Authority as a securities dealer and itsfinancial statements are presented in Swiss francs. Accordingly, THE is exposed to certain foreignexchange risks as described below:
• THE buys and sells futures contracts and securities denominated in various currencies andcarries bank balances and borrows and lends such currencies in its regular course of business. Atthe end of each accounting period THE’s assets and liabilities are translated into Swiss francsfor presentation in its financial statements. The resulting gains or losses are reported astranslation gain or loss in THE’s income statement. When we prepare our consolidated financialstatements, THE’s Swiss franc balances are translated into U.S. dollars for U.S. GAAP purposes.THE’s translation gains or losses appear as such on IBG, Inc.’s consolidated statement, ofcomprehensive income, included in trading gains.
• THE’s net worth is carried on THE’s books in Swiss francs in accordance with Swiss accountingstandards. At the end of each accounting period, THE’s net worth is translated at the thenprevailing exchange rate into U.S. dollars and the resulting gain or loss is reported as OCI in
79

our consolidated statement of financial condition and consolidated statement of comprehensiveincome. To a smaller extent, OCI is also produced by our other non-U.S. subsidiaries.
Historically, we have taken the approach of not hedging the above exposures, based on the notionthat the cost of constantly hedging over the years would amount to more than the random impact ofrate changes on our non-U.S. dollar balances. For instance, an increase in the value of the Swiss francwould be unfavorable to the earnings of THE but would be counterbalanced to some extent by the factthat the yearly translation gain or loss into U.S. dollars is likely to move in the opposite direction.
Since 2005, we have expanded our market making systems to incorporate cash forex and forexoptions to hedge our currency exposure at little or no cost and to hedge our currency exposurethroughout each day on a continuous basis. In connection with the development of our currencystrategy, we determined to base our net worth in GLOBALs, a basket of currencies. Periodically, were-evaluate the composition of the GLOBAL; in 2011 we expanded the composition of the GLOBALfrom six to 16 currencies. The table below shows a comparison of the U.S. dollar equivalent of theGLOBAL as December 31, 2011 and 2012.
As of 12/31/2011 As of 12/31/2012
GLOBAL in % of GLOBAL in % of CHANGE inCurrency Composition FX Rate USD Equiv. Comp. FX Rate USD Equiv. Comp. % of Comp.
USD . . . . . . . . . . . . . . . . 0.41 1.0000 0.410 37.1% 1.0000 0.410 37.3% 0.2%EUR . . . . . . . . . . . . . . . . 0.17 1.2942 0.220 19.9% 1.3194 0.224 20.4% 0.5%JPY . . . . . . . . . . . . . . . . 10.00 0.0130 0.130 11.8% 0.0115 0.115 10.5% �1.3%GBP . . . . . . . . . . . . . . . . 0.03 1.5535 0.047 4.2% 1.6253 0.049 4.4% 0.2%CAD . . . . . . . . . . . . . . . . 0.04 0.9816 0.039 3.6% 1.0079 0.040 3.7% 0.1%BRL . . . . . . . . . . . . . . . . 0.08 0.5367 0.043 3.9% 0.4882 0.039 3.6% �0.3%INR . . . . . . . . . . . . . . . . 2.00 0.0188 0.038 3.4% 0.0182 0.036 3.3% �0.1%CHF . . . . . . . . . . . . . . . . 0.03 1.0646 0.032 2.9% 1.0923 0.033 3.0% 0.1%HKD . . . . . . . . . . . . . . . 0.25 0.1288 0.032 2.9% 0.1290 0.032 2.9% 0.0%AUD . . . . . . . . . . . . . . . . 0.03 1.0228 0.031 2.8% 1.0394 0.031 2.8% 0.1%KRW . . . . . . . . . . . . . . . 28.00 0.0009 0.024 2.2% 0.0009 0.026 2.4% 0.2%MXN . . . . . . . . . . . . . . . 0.30 0.0717 0.021 1.9% 0.0777 0.023 2.1% 0.2%SEK . . . . . . . . . . . . . . . . 0.09 0.1453 0.013 1.2% 0.1538 0.014 1.3% 0.1%NOK . . . . . . . . . . . . . . . 0.06 0.1672 0.010 0.9% 0.1797 0.011 1.0% 0.1%SGD . . . . . . . . . . . . . . . . 0.01 0.7709 0.008 0.7% 0.8187 0.008 0.7% 0.0%DKK . . . . . . . . . . . . . . . 0.04 0.1741 0.007 0.6% 0.1769 0.007 0.6% 0.0%
$1.105 100.0% $1.100 100.0% 0.0%
Because we actively manage our global currency exposure by maintaining our equity in GLOBALs,we consider ourselves a global enterprise based in a diversified basket of currencies rather than a U.S.dollar based company. The U.S. dollar value of the GLOBAL decreased from $1.105 to $1.10, or 0.4%,in 2012. At December 31, 2012 approximately 63% of our equity was denominated in currencies otherthan U.S. dollars.
The effects of our currency strategy appear in two places in the financial statements: (1) as acomponent of trading gains in the condensed consolidated statement of comprehensive income and(2) as OCI in the condensed consolidated statement of financial condition. The full effect of theGLOBAL is captured in comprehensive income.
Reported results on a comprehensive basis reflect the U.S. GAAP convention adopted in 2011 thatrequires the reporting of currency translation results contained in OCI as part of reportable earnings.Previously, currency translation results were reported only as a component of changes in Total Equity inthe condensed consolidated statement of financial condition.
80

Interest Rate Risk
We had no variable-rate debt outstanding at December 31, 2012. Under our senior securedrevolving credit facility, we have the ability to choose borrowing tenors from overnight to twelvemonths, which permits us to minimize the risk of interest rate fluctuations.
We pay our electronic brokerage customers interest based on benchmark overnight interest rates invarious currencies. In a normal rate environment, we typically invest a portion of these funds in U.S.government treasury securities with maturities of up to three months. Under these circumstances, ifinterest rates were to increase rapidly and substantially, in increments that were not reflected in theyields on these treasury securities, our net interest income from customer deposits would decrease.Based upon investments outstanding at December 31, 2012, we had minimal exposure of this nature.
We also face the potential for reduced net interest income from customer deposits due to interestrate spread compression in a low rate environment. Due to a currently low rate environment, adecrease of U.S. benchmark interest rates by 0.05%, would reduce our net interest income byapproximately $10.1 million on an annualized basis.
We also face substantial interest rate risk due to positions carried in our market making businessto the extent that long or short stock positions may have been established for future or forward dateson options or futures contracts and the value of such positions are impacted by interest rates. Wehedge such risks by entering into interest rate futures contracts. To the extent that these futurespositions do not perfectly hedge this interest rate risk, our trading gains may be adversely affected. Theamount of such risk cannot be quantified.
Dividend Risk
We face dividend risk in our market making business as we derive significant revenues and incursignificant expenses in the form of dividend income and expense, respectively, from our substantialinventory of equity securities, and must make significant payments in lieu of dividends on shortpositions in securities in our portfolio. Projected future dividends are an important component ofpricing equity options and other derivatives, and incorrect projections may lead to trading losses. Theamount of these risks cannot be quantified.
Margin Credit
We extend margin credit to our customers, which is subject to various regulatory requirements.Margin credit is collateralized by cash and securities in the customers’ accounts. The risks associatedwith margin credit increase during periods of fast market movements or in cases where collateral isconcentrated and market movements occur. During such times, customers who utilize margin credit andwho have collateralized their obligations with securities may find that the securities have a rapidlydepreciating value and may not be sufficient to cover their obligations in the event of a liquidation. Weare also exposed to credit risk when our customers execute transactions, such as short sales of optionsand equities, that can expose them to risk beyond their invested capital.
We expect this kind of exposure to increase with growth in our overall business. Because weindemnify and hold harmless our clearing firms from certain liabilities or claims, the use of margincredit and short sales may expose us to significant off-balance-sheet risk in the event that collateralrequirements are not sufficient to fully cover losses that customers may incur and those customers failto satisfy their obligations. As of December 31, 2012, we had $9.85 billion in margin credit extended toour customers. The amount of risk to which we are exposed from the margin credit we extend to ourcustomers and from short sale transactions by our customers is unlimited and not quantifiable as therisk is dependent upon analysis of a potential significant and undeterminable rise or fall in stock prices.Our account level margin credit requirements meet or exceed those required by Regulation T of the
81

Board of Governors of the Federal Reserve. As a matter of practice, we enforce real-time margincompliance monitoring and liquidate customers’ positions if their equity falls below required marginrequirements.
We have a comprehensive policy implemented in accordance with regulatory standards to assessand monitor the suitability of investors to engage in various trading activities. To mitigate our risk, wealso continuously monitor customer accounts to detect excessive concentration, large orders orpositions, patterns of day trading and other activities that indicate increased risk to us.
Our credit exposure is to a great extent mitigated by our policy of automatically evaluating eachaccount throughout the trading day and closing out positions automatically for accounts that are foundto be under-margined. While this methodology is effective in most situations, it may not be effective insituations where no liquid market exists for the relevant securities or commodities or where, for anyreason, automatic liquidation for certain accounts has been disabled.
82
ITEM 8. FINANCIAL STATEMENTS AND SUPPLEMENTARY DATA
Index to Consolidated Financial Statements
Financial Statements Introductory Note . . . . . . . . . . . . . . . . . . . . . . . . . . . . . . . . . . . . . . . . . . 84Report of Independent Registered Public Accounting Firm . . . . . . . . . . . . . . . . . . . . . . . . . . . . 85Consolidated Statements of Financial Condition as of December 31, 2012 and 2011 . . . . . . . . . . 86Consolidated Statements of Comprehensive Income for the years ended December 31, 2012, 2011
and 2010 . . . . . . . . . . . . . . . . . . . . . . . . . . . . . . . . . . . . . . . . . . . . . . . . . . . . . . . . . . . . . . . 87Consolidated Statements of Cash Flows for the years ended December 2012, 2011 and 2010 . . . . 88Consolidated Statements of Changes in Equity for the years ended December 31, 2012, 2011 and
2010 . . . . . . . . . . . . . . . . . . . . . . . . . . . . . . . . . . . . . . . . . . . . . . . . . . . . . . . . . . . . . . . . . . 89Notes to Consolidated Financial Statements . . . . . . . . . . . . . . . . . . . . . . . . . . . . . . . . . . . . . . . 90Supplementary Data—Unaudited Quarterly Results . . . . . . . . . . . . . . . . . . . . . . . . . . . . . . . . . . 126
83
Financial Statements Introductory Note
Interactive Brokers Group, Inc. (‘‘IBG, Inc.’’ or the ‘‘Company’’) is a holding company whoseprimary asset is its ownership of approximately 11.9% of the membership interests of IBG LLC (the‘‘Group’’). See Notes 1 and 4 to the consolidated financial statements for further discussion of theCompany’s capital and ownership structure.
We are an automated global electronic broker and market maker specializing in routing orders andexecuting and processing trades in securities, futures, foreign exchange instruments, bonds and mutualfunds on more than 100 electronic exchanges and trading venues around the world. In the U.S., ourbusiness is conducted from our headquarters in Greenwich, Connecticut and from Chicago, Illinois andfrom Jersey City, New Jersey. Abroad, we conduct business through offices located in Canada, England,Switzerland, Hong Kong, India, Australia and Japan. At December 31, 2012 we had 891 employeesworldwide.
84
REPORT OF INDEPENDENT REGISTERED PUBLIC ACCOUNTING FIRM
To the Board of Directors and Stockholders ofInteractive Brokers Group, Inc.Greenwich, CT
We have audited the accompanying consolidated statements of financial condition of InteractiveBrokers Group, Inc. and subsidiaries (the ‘‘Company’’) as of December 31, 2012 and 2011, and therelated consolidated statements of comprehensive income, cash flows and changes in equity for each ofthe three years in the period ended December 31, 2012. These financial statements are theresponsibility of the Company’s management. Our responsibility is to express an opinion on thesefinancial statements based on our audits.
We conducted our audits in accordance with the standards of the Public Company AccountingOversight Board (United States). Those standards require that we plan and perform the audit to obtainreasonable assurance about whether the financial statements are free of material misstatement. Anaudit includes examining, on a test basis, evidence supporting the amounts and disclosures in thefinancial statements. An audit also includes assessing the accounting principles used and significantestimates made by management, as well as evaluating the overall financial statement presentation. Webelieve that our audits provide a reasonable basis for our opinion.
In our opinion, such consolidated financial statements present fairly, in all material respects, thefinancial position of Interactive Brokers Group, Inc. and subsidiaries at December 31, 2012 and 2011,and the results of their operations and their cash flows for each of the three years in the period endedDecember 31, 2012, in conformity with accounting principles generally accepted in the United States ofAmerica.
We have also audited, in accordance with the standards of the Public Company AccountingOversight Board (United States), the Company’s internal control over financial reporting as ofDecember 31, 2012, based on the criteria established in Internal Control—Integrated Framework issuedby the Committee of Sponsoring Organizations of the Treadway Commission and our report datedMarch 8, 2013 expressed an adverse opinion on the Company’s internal control over financial reportingbecause of a material weakness.
/s/ Deloitte & Touche LLPNew York, New YorkMarch 8, 2013
85
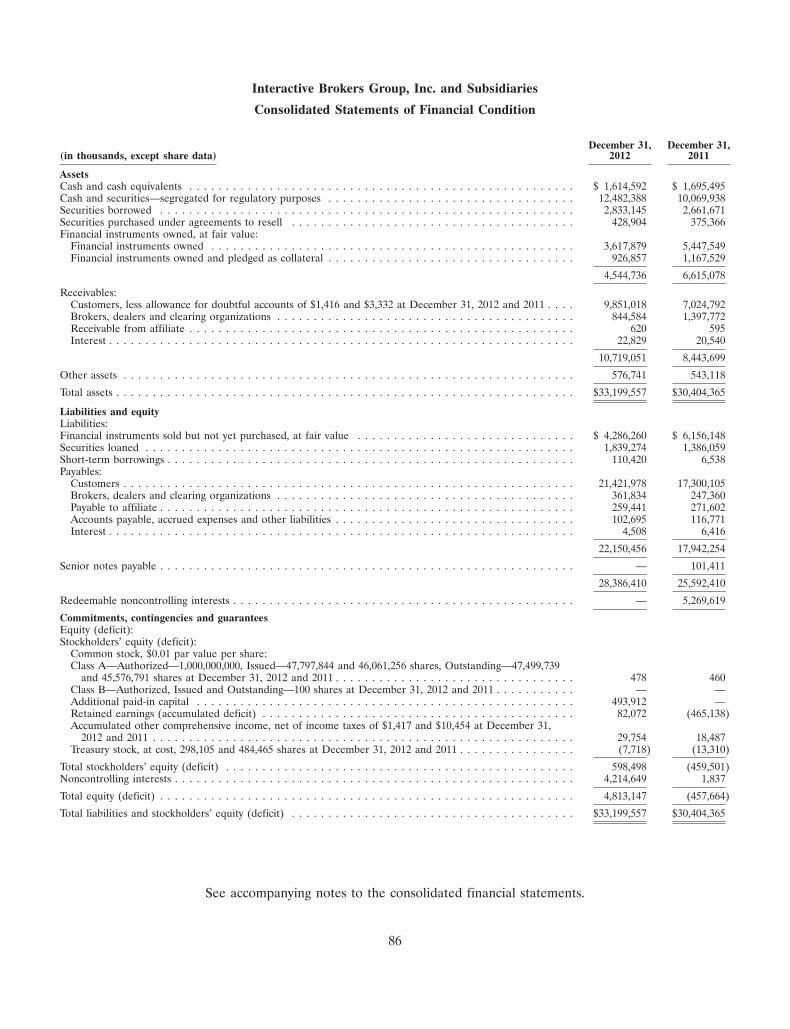
Interactive Brokers Group, Inc. and Subsidiaries
Consolidated Statements of Financial Condition
December 31, December 31,(in thousands, except share data) 2012 2011
AssetsCash and cash equivalents . . . . . . . . . . . . . . . . . . . . . . . . . . . . . . . . . . . . . . . . . . . . . . . . . . . . . $ 1,614,592 $ 1,695,495Cash and securities—segregated for regulatory purposes . . . . . . . . . . . . . . . . . . . . . . . . . . . . . . . . . . 12,482,388 10,069,938Securities borrowed . . . . . . . . . . . . . . . . . . . . . . . . . . . . . . . . . . . . . . . . . . . . . . . . . . . . . . . . . 2,833,145 2,661,671Securities purchased under agreements to resell . . . . . . . . . . . . . . . . . . . . . . . . . . . . . . . . . . . . . . . 428,904 375,366Financial instruments owned, at fair value:
Financial instruments owned . . . . . . . . . . . . . . . . . . . . . . . . . . . . . . . . . . . . . . . . . . . . . . . . . . 3,617,879 5,447,549Financial instruments owned and pledged as collateral . . . . . . . . . . . . . . . . . . . . . . . . . . . . . . . . . . 926,857 1,167,529
4,544,736 6,615,078
Receivables:Customers, less allowance for doubtful accounts of $1,416 and $3,332 at December 31, 2012 and 2011 . . . . 9,851,018 7,024,792Brokers, dealers and clearing organizations . . . . . . . . . . . . . . . . . . . . . . . . . . . . . . . . . . . . . . . . . 844,584 1,397,772Receivable from affiliate . . . . . . . . . . . . . . . . . . . . . . . . . . . . . . . . . . . . . . . . . . . . . . . . . . . . . 620 595Interest . . . . . . . . . . . . . . . . . . . . . . . . . . . . . . . . . . . . . . . . . . . . . . . . . . . . . . . . . . . . . . . . 22,829 20,540
10,719,051 8,443,699
Other assets . . . . . . . . . . . . . . . . . . . . . . . . . . . . . . . . . . . . . . . . . . . . . . . . . . . . . . . . . . . . . . 576,741 543,118
Total assets . . . . . . . . . . . . . . . . . . . . . . . . . . . . . . . . . . . . . . . . . . . . . . . . . . . . . . . . . . . . . . . $33,199,557 $30,404,365
Liabilities and equityLiabilities:Financial instruments sold but not yet purchased, at fair value . . . . . . . . . . . . . . . . . . . . . . . . . . . . . . $ 4,286,260 $ 6,156,148Securities loaned . . . . . . . . . . . . . . . . . . . . . . . . . . . . . . . . . . . . . . . . . . . . . . . . . . . . . . . . . . . 1,839,274 1,386,059Short-term borrowings . . . . . . . . . . . . . . . . . . . . . . . . . . . . . . . . . . . . . . . . . . . . . . . . . . . . . . . . 110,420 6,538Payables:
Customers . . . . . . . . . . . . . . . . . . . . . . . . . . . . . . . . . . . . . . . . . . . . . . . . . . . . . . . . . . . . . . 21,421,978 17,300,105Brokers, dealers and clearing organizations . . . . . . . . . . . . . . . . . . . . . . . . . . . . . . . . . . . . . . . . . 361,834 247,360Payable to affiliate . . . . . . . . . . . . . . . . . . . . . . . . . . . . . . . . . . . . . . . . . . . . . . . . . . . . . . . . . 259,441 271,602Accounts payable, accrued expenses and other liabilities . . . . . . . . . . . . . . . . . . . . . . . . . . . . . . . . . 102,695 116,771Interest . . . . . . . . . . . . . . . . . . . . . . . . . . . . . . . . . . . . . . . . . . . . . . . . . . . . . . . . . . . . . . . . 4,508 6,416
22,150,456 17,942,254
Senior notes payable . . . . . . . . . . . . . . . . . . . . . . . . . . . . . . . . . . . . . . . . . . . . . . . . . . . . . . . . . — 101,411
28,386,410 25,592,410
Redeemable noncontrolling interests . . . . . . . . . . . . . . . . . . . . . . . . . . . . . . . . . . . . . . . . . . . . . . . — 5,269,619
Commitments, contingencies and guaranteesEquity (deficit):Stockholders’ equity (deficit):
Common stock, $0.01 par value per share:Class A—Authorized—1,000,000,000, Issued—47,797,844 and 46,061,256 shares, Outstanding—47,499,739
and 45,576,791 shares at December 31, 2012 and 2011 . . . . . . . . . . . . . . . . . . . . . . . . . . . . . . . . . 478 460Class B—Authorized, Issued and Outstanding—100 shares at December 31, 2012 and 2011 . . . . . . . . . . . — —Additional paid-in capital . . . . . . . . . . . . . . . . . . . . . . . . . . . . . . . . . . . . . . . . . . . . . . . . . . . . 493,912 —Retained earnings (accumulated deficit) . . . . . . . . . . . . . . . . . . . . . . . . . . . . . . . . . . . . . . . . . . . 82,072 (465,138)Accumulated other comprehensive income, net of income taxes of $1,417 and $10,454 at December 31,
2012 and 2011 . . . . . . . . . . . . . . . . . . . . . . . . . . . . . . . . . . . . . . . . . . . . . . . . . . . . . . . . . . 29,754 18,487Treasury stock, at cost, 298,105 and 484,465 shares at December 31, 2012 and 2011 . . . . . . . . . . . . . . . . (7,718) (13,310)
Total stockholders’ equity (deficit) . . . . . . . . . . . . . . . . . . . . . . . . . . . . . . . . . . . . . . . . . . . . . . . . 598,498 (459,501)Noncontrolling interests . . . . . . . . . . . . . . . . . . . . . . . . . . . . . . . . . . . . . . . . . . . . . . . . . . . . . . . 4,214,649 1,837
Total equity (deficit) . . . . . . . . . . . . . . . . . . . . . . . . . . . . . . . . . . . . . . . . . . . . . . . . . . . . . . . . . 4,813,147 (457,664)
Total liabilities and stockholders’ equity (deficit) . . . . . . . . . . . . . . . . . . . . . . . . . . . . . . . . . . . . . . . $33,199,557 $30,404,365
See accompanying notes to the consolidated financial statements.
86
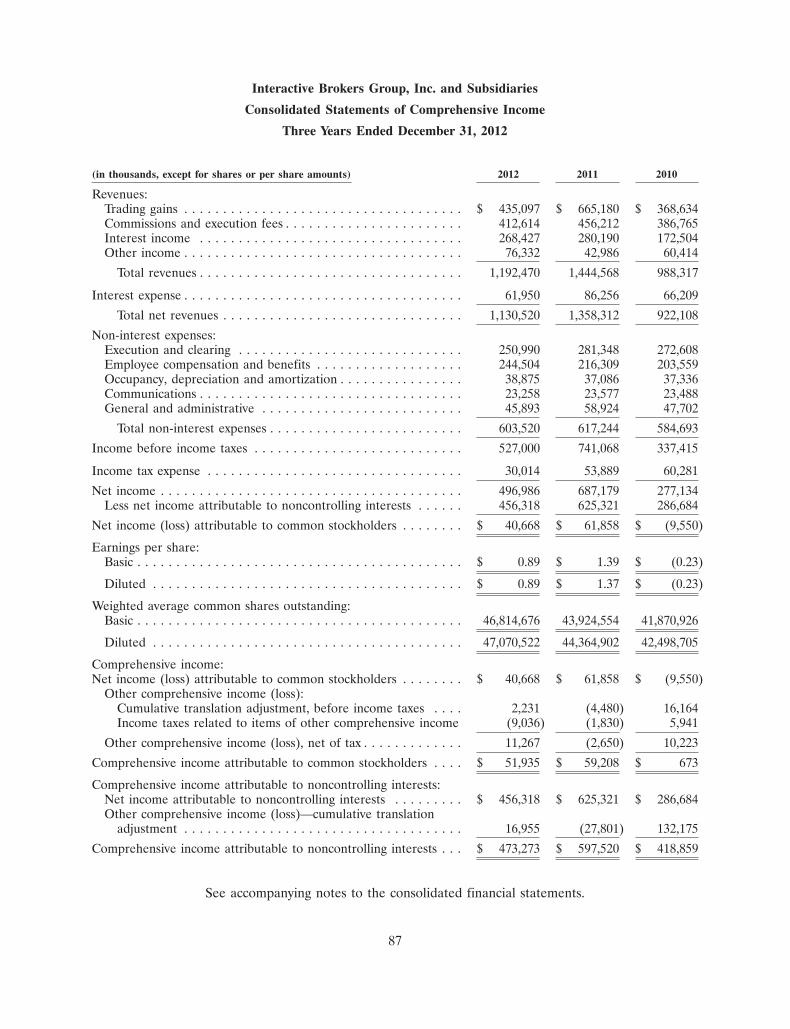
Interactive Brokers Group, Inc. and Subsidiaries
Consolidated Statements of Comprehensive Income
Three Years Ended December 31, 2012
(in thousands, except for shares or per share amounts) 2012 2011 2010
Revenues:Trading gains . . . . . . . . . . . . . . . . . . . . . . . . . . . . . . . . . . . . $ 435,097 $ 665,180 $ 368,634Commissions and execution fees . . . . . . . . . . . . . . . . . . . . . . . 412,614 456,212 386,765Interest income . . . . . . . . . . . . . . . . . . . . . . . . . . . . . . . . . . 268,427 280,190 172,504Other income . . . . . . . . . . . . . . . . . . . . . . . . . . . . . . . . . . . . 76,332 42,986 60,414
Total revenues . . . . . . . . . . . . . . . . . . . . . . . . . . . . . . . . . . 1,192,470 1,444,568 988,317
Interest expense . . . . . . . . . . . . . . . . . . . . . . . . . . . . . . . . . . . . 61,950 86,256 66,209
Total net revenues . . . . . . . . . . . . . . . . . . . . . . . . . . . . . . . 1,130,520 1,358,312 922,108
Non-interest expenses:Execution and clearing . . . . . . . . . . . . . . . . . . . . . . . . . . . . . 250,990 281,348 272,608Employee compensation and benefits . . . . . . . . . . . . . . . . . . . 244,504 216,309 203,559Occupancy, depreciation and amortization . . . . . . . . . . . . . . . . 38,875 37,086 37,336Communications . . . . . . . . . . . . . . . . . . . . . . . . . . . . . . . . . . 23,258 23,577 23,488General and administrative . . . . . . . . . . . . . . . . . . . . . . . . . . 45,893 58,924 47,702
Total non-interest expenses . . . . . . . . . . . . . . . . . . . . . . . . . 603,520 617,244 584,693
Income before income taxes . . . . . . . . . . . . . . . . . . . . . . . . . . . 527,000 741,068 337,415
Income tax expense . . . . . . . . . . . . . . . . . . . . . . . . . . . . . . . . . 30,014 53,889 60,281
Net income . . . . . . . . . . . . . . . . . . . . . . . . . . . . . . . . . . . . . . . 496,986 687,179 277,134Less net income attributable to noncontrolling interests . . . . . . 456,318 625,321 286,684
Net income (loss) attributable to common stockholders . . . . . . . . $ 40,668 $ 61,858 $ (9,550)
Earnings per share:Basic . . . . . . . . . . . . . . . . . . . . . . . . . . . . . . . . . . . . . . . . . . $ 0.89 $ 1.39 $ (0.23)
Diluted . . . . . . . . . . . . . . . . . . . . . . . . . . . . . . . . . . . . . . . . $ 0.89 $ 1.37 $ (0.23)
Weighted average common shares outstanding:Basic . . . . . . . . . . . . . . . . . . . . . . . . . . . . . . . . . . . . . . . . . . 46,814,676 43,924,554 41,870,926
Diluted . . . . . . . . . . . . . . . . . . . . . . . . . . . . . . . . . . . . . . . . 47,070,522 44,364,902 42,498,705
Comprehensive income:Net income (loss) attributable to common stockholders . . . . . . . . $ 40,668 $ 61,858 $ (9,550)
Other comprehensive income (loss):Cumulative translation adjustment, before income taxes . . . . 2,231 (4,480) 16,164Income taxes related to items of other comprehensive income (9,036) (1,830) 5,941
Other comprehensive income (loss), net of tax . . . . . . . . . . . . . 11,267 (2,650) 10,223
Comprehensive income attributable to common stockholders . . . . $ 51,935 $ 59,208 $ 673
Comprehensive income attributable to noncontrolling interests:Net income attributable to noncontrolling interests . . . . . . . . . $ 456,318 $ 625,321 $ 286,684Other comprehensive income (loss)—cumulative translation
adjustment . . . . . . . . . . . . . . . . . . . . . . . . . . . . . . . . . . . . 16,955 (27,801) 132,175
Comprehensive income attributable to noncontrolling interests . . . $ 473,273 $ 597,520 $ 418,859
See accompanying notes to the consolidated financial statements.
87
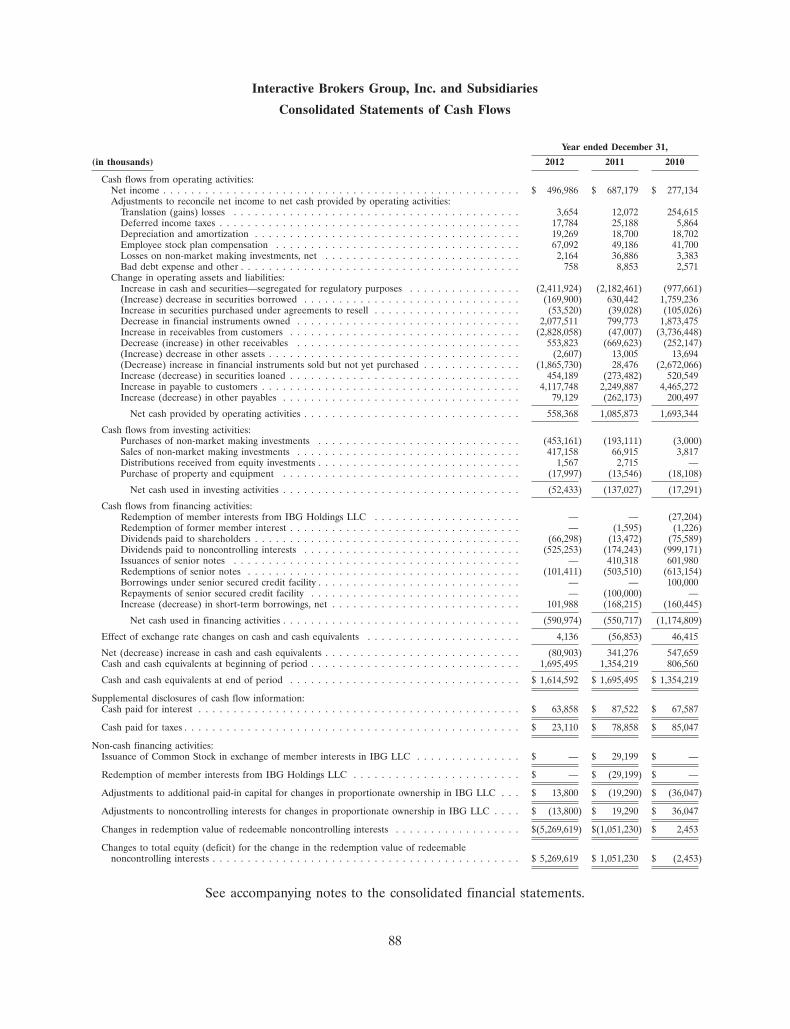
Interactive Brokers Group, Inc. and Subsidiaries
Consolidated Statements of Cash Flows
Year ended December 31,
(in thousands) 2012 2011 2010
Cash flows from operating activities:Net income . . . . . . . . . . . . . . . . . . . . . . . . . . . . . . . . . . . . . . . . . . . . . . . . . . . $ 496,986 $ 687,179 $ 277,134Adjustments to reconcile net income to net cash provided by operating activities:
Translation (gains) losses . . . . . . . . . . . . . . . . . . . . . . . . . . . . . . . . . . . . . . . . . 3,654 12,072 254,615Deferred income taxes . . . . . . . . . . . . . . . . . . . . . . . . . . . . . . . . . . . . . . . . . . . 17,784 25,188 5,864Depreciation and amortization . . . . . . . . . . . . . . . . . . . . . . . . . . . . . . . . . . . . . . 19,269 18,700 18,702Employee stock plan compensation . . . . . . . . . . . . . . . . . . . . . . . . . . . . . . . . . . . 67,092 49,186 41,700Losses on non-market making investments, net . . . . . . . . . . . . . . . . . . . . . . . . . . . . 2,164 36,886 3,383Bad debt expense and other . . . . . . . . . . . . . . . . . . . . . . . . . . . . . . . . . . . . . . . . 758 8,853 2,571
Change in operating assets and liabilities:Increase in cash and securities—segregated for regulatory purposes . . . . . . . . . . . . . . . . (2,411,924) (2,182,461) (977,661)(Increase) decrease in securities borrowed . . . . . . . . . . . . . . . . . . . . . . . . . . . . . . . (169,900) 630,442 1,759,236Increase in securities purchased under agreements to resell . . . . . . . . . . . . . . . . . . . . . (53,520) (39,028) (105,026)Decrease in financial instruments owned . . . . . . . . . . . . . . . . . . . . . . . . . . . . . . . . 2,077,511 799,773 1,873,475Increase in receivables from customers . . . . . . . . . . . . . . . . . . . . . . . . . . . . . . . . . (2,828,058) (47,007) (3,736,448)Decrease (increase) in other receivables . . . . . . . . . . . . . . . . . . . . . . . . . . . . . . . . 553,823 (669,623) (252,147)(Increase) decrease in other assets . . . . . . . . . . . . . . . . . . . . . . . . . . . . . . . . . . . . (2,607) 13,005 13,694(Decrease) increase in financial instruments sold but not yet purchased . . . . . . . . . . . . . . (1,865,730) 28,476 (2,672,066)Increase (decrease) in securities loaned . . . . . . . . . . . . . . . . . . . . . . . . . . . . . . . . . 454,189 (273,482) 520,549Increase in payable to customers . . . . . . . . . . . . . . . . . . . . . . . . . . . . . . . . . . . . . 4,117,748 2,249,887 4,465,272Increase (decrease) in other payables . . . . . . . . . . . . . . . . . . . . . . . . . . . . . . . . . . 79,129 (262,173) 200,497
Net cash provided by operating activities . . . . . . . . . . . . . . . . . . . . . . . . . . . . . . . 558,368 1,085,873 1,693,344
Cash flows from investing activities:Purchases of non-market making investments . . . . . . . . . . . . . . . . . . . . . . . . . . . . . (453,161) (193,111) (3,000)Sales of non-market making investments . . . . . . . . . . . . . . . . . . . . . . . . . . . . . . . . 417,158 66,915 3,817Distributions received from equity investments . . . . . . . . . . . . . . . . . . . . . . . . . . . . . 1,567 2,715 —Purchase of property and equipment . . . . . . . . . . . . . . . . . . . . . . . . . . . . . . . . . . (17,997) (13,546) (18,108)
Net cash used in investing activities . . . . . . . . . . . . . . . . . . . . . . . . . . . . . . . . . . (52,433) (137,027) (17,291)
Cash flows from financing activities:Redemption of member interests from IBG Holdings LLC . . . . . . . . . . . . . . . . . . . . . — — (27,204)Redemption of former member interest . . . . . . . . . . . . . . . . . . . . . . . . . . . . . . . . . — (1,595) (1,226)Dividends paid to shareholders . . . . . . . . . . . . . . . . . . . . . . . . . . . . . . . . . . . . . . (66,298) (13,472) (75,589)Dividends paid to noncontrolling interests . . . . . . . . . . . . . . . . . . . . . . . . . . . . . . . (525,253) (174,243) (999,171)Issuances of senior notes . . . . . . . . . . . . . . . . . . . . . . . . . . . . . . . . . . . . . . . . . — 410,318 601,980Redemptions of senior notes . . . . . . . . . . . . . . . . . . . . . . . . . . . . . . . . . . . . . . . (101,411) (503,510) (613,154)Borrowings under senior secured credit facility . . . . . . . . . . . . . . . . . . . . . . . . . . . . . — — 100,000Repayments of senior secured credit facility . . . . . . . . . . . . . . . . . . . . . . . . . . . . . . — (100,000) —Increase (decrease) in short-term borrowings, net . . . . . . . . . . . . . . . . . . . . . . . . . . . 101,988 (168,215) (160,445)
Net cash used in financing activities . . . . . . . . . . . . . . . . . . . . . . . . . . . . . . . . . . (590,974) (550,717) (1,174,809)
Effect of exchange rate changes on cash and cash equivalents . . . . . . . . . . . . . . . . . . . . . . 4,136 (56,853) 46,415
Net (decrease) increase in cash and cash equivalents . . . . . . . . . . . . . . . . . . . . . . . . . . . . (80,903) 341,276 547,659Cash and cash equivalents at beginning of period . . . . . . . . . . . . . . . . . . . . . . . . . . . . . . 1,695,495 1,354,219 806,560
Cash and cash equivalents at end of period . . . . . . . . . . . . . . . . . . . . . . . . . . . . . . . . . $ 1,614,592 $ 1,695,495 $ 1,354,219
Supplemental disclosures of cash flow information:Cash paid for interest . . . . . . . . . . . . . . . . . . . . . . . . . . . . . . . . . . . . . . . . . . . . . . $ 63,858 $ 87,522 $ 67,587
Cash paid for taxes . . . . . . . . . . . . . . . . . . . . . . . . . . . . . . . . . . . . . . . . . . . . . . . . $ 23,110 $ 78,858 $ 85,047
Non-cash financing activities:Issuance of Common Stock in exchange of member interests in IBG LLC . . . . . . . . . . . . . . . $ — $ 29,199 $ —
Redemption of member interests from IBG Holdings LLC . . . . . . . . . . . . . . . . . . . . . . . . $ — $ (29,199) $ —
Adjustments to additional paid-in capital for changes in proportionate ownership in IBG LLC . . . $ 13,800 $ (19,290) $ (36,047)
Adjustments to noncontrolling interests for changes in proportionate ownership in IBG LLC . . . . $ (13,800) $ 19,290 $ 36,047
Changes in redemption value of redeemable noncontrolling interests . . . . . . . . . . . . . . . . . . $(5,269,619) $(1,051,230) $ 2,453
Changes to total equity (deficit) for the change in the redemption value of redeemablenoncontrolling interests . . . . . . . . . . . . . . . . . . . . . . . . . . . . . . . . . . . . . . . . . . . . $ 5,269,619 $ 1,051,230 $ (2,453)
See accompanying notes to the consolidated financial statements.
88
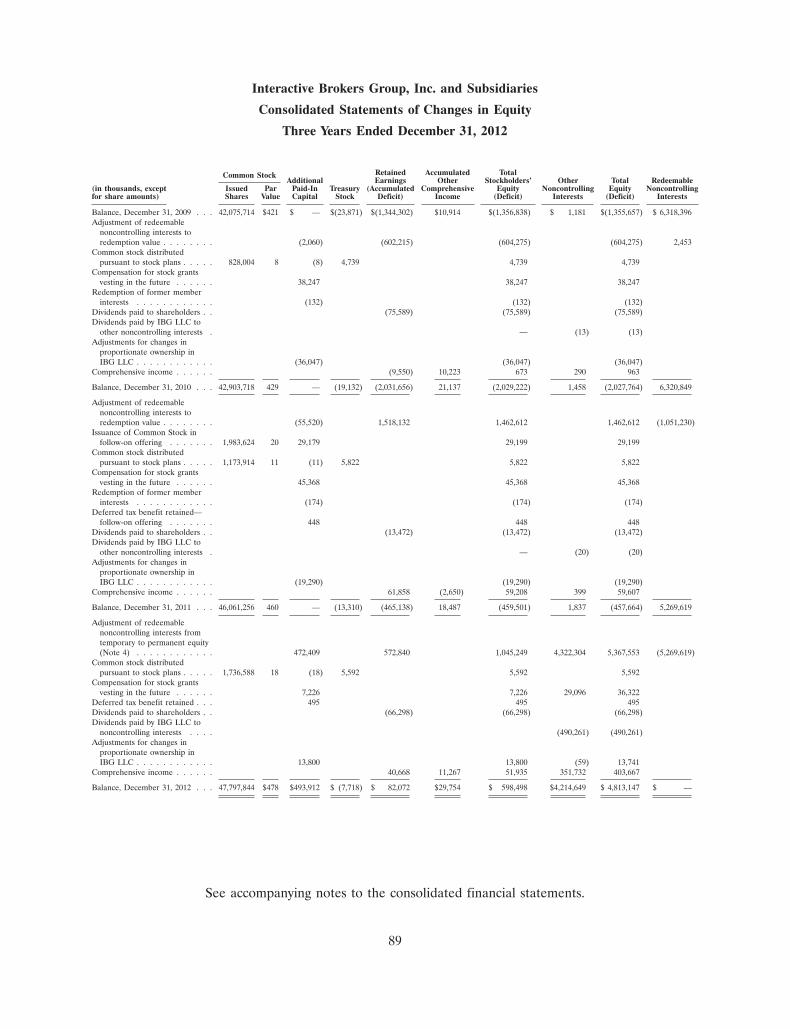
Interactive Brokers Group, Inc. and Subsidiaries
Consolidated Statements of Changes in Equity
Three Years Ended December 31, 2012
Retained Accumulated TotalCommon StockAdditional Earnings Other Stockholders’ Other Total Redeemable
(in thousands, except Issued Par Paid-In Treasury (Accumulated Comprehensive Equity Noncontrolling Equity Noncontrollingfor share amounts) Shares Value Capital Stock Deficit) Income (Deficit) Interests (Deficit) Interests
Balance, December 31, 2009 . . . 42,075,714 $421 $ — $(23,871) $(1,344,302) $10,914 $(1,356,838) $ 1,181 $(1,355,657) $ 6,318,396Adjustment of redeemable
noncontrolling interests toredemption value . . . . . . . . (2,060) (602,215) (604,275) (604,275) 2,453
Common stock distributedpursuant to stock plans . . . . . 828,004 8 (8) 4,739 4,739 4,739
Compensation for stock grantsvesting in the future . . . . . . 38,247 38,247 38,247
Redemption of former memberinterests . . . . . . . . . . . . (132) (132) (132)
Dividends paid to shareholders . . (75,589) (75,589) (75,589)Dividends paid by IBG LLC to
other noncontrolling interests . — (13) (13)Adjustments for changes in
proportionate ownership inIBG LLC . . . . . . . . . . . . (36,047) (36,047) (36,047)
Comprehensive income . . . . . . (9,550) 10,223 673 290 963
Balance, December 31, 2010 . . . 42,903,718 429 — (19,132) (2,031,656) 21,137 (2,029,222) 1,458 (2,027,764) 6,320,849
Adjustment of redeemablenoncontrolling interests toredemption value . . . . . . . . (55,520) 1,518,132 1,462,612 1,462,612 (1,051,230)
Issuance of Common Stock infollow-on offering . . . . . . . 1,983,624 20 29,179 29,199 29,199
Common stock distributedpursuant to stock plans . . . . . 1,173,914 11 (11) 5,822 5,822 5,822
Compensation for stock grantsvesting in the future . . . . . . 45,368 45,368 45,368
Redemption of former memberinterests . . . . . . . . . . . . (174) (174) (174)
Deferred tax benefit retained—follow-on offering . . . . . . . 448 448 448
Dividends paid to shareholders . . (13,472) (13,472) (13,472)Dividends paid by IBG LLC to
other noncontrolling interests . — (20) (20)Adjustments for changes in
proportionate ownership inIBG LLC . . . . . . . . . . . . (19,290) (19,290) (19,290)
Comprehensive income . . . . . . 61,858 (2,650) 59,208 399 59,607
Balance, December 31, 2011 . . . 46,061,256 460 — (13,310) (465,138) 18,487 (459,501) 1,837 (457,664) 5,269,619
Adjustment of redeemablenoncontrolling interests fromtemporary to permanent equity(Note 4) . . . . . . . . . . . . 472,409 572,840 1,045,249 4,322,304 5,367,553 (5,269,619)
Common stock distributedpursuant to stock plans . . . . . 1,736,588 18 (18) 5,592 5,592 5,592
Compensation for stock grantsvesting in the future . . . . . . 7,226 7,226 29,096 36,322
Deferred tax benefit retained . . . 495 495 495Dividends paid to shareholders . . (66,298) (66,298) (66,298)Dividends paid by IBG LLC to
noncontrolling interests . . . . (490,261) (490,261)Adjustments for changes in
proportionate ownership inIBG LLC . . . . . . . . . . . . 13,800 13,800 (59) 13,741
Comprehensive income . . . . . . 40,668 11,267 51,935 351,732 403,667
Balance, December 31, 2012 . . . 47,797,844 $478 $493,912 $ (7,718) $ 82,072 $29,754 $ 598,498 $4,214,649 $ 4,813,147 $ —
See accompanying notes to the consolidated financial statements.
89

Interactive Brokers Group, Inc. and Subsidiaries
Notes to Consolidated Financial Statements
(In U.S. dollars (thousands), except shares and per share amounts, unless otherwise noted)
1. Organization and Nature of Business
Interactive Brokers Group, Inc. (‘‘IBG, Inc.’’ or the ‘‘Company’’) is a Delaware holding companywhose primary asset is its ownership of approximately 11.9% of the membership interests of IBG LLC,which, in turn, owns operating subsidiaries (collectively, ‘‘IBG LLC’’ or the ‘‘Group’’). Theaccompanying consolidated financial statements of IBG, Inc. reflect the consolidation of IBG, Inc.’sinvestment in IBG LLC for all periods presented (Note 4). IBG LLC is an automated global electronicbroker and market maker specializing in routing orders and processing trades in securities, futures andforeign exchange instruments.
IBG LLC is a Connecticut limited liability company that conducts its business through its operatingsubsidiaries (collectively called the ‘‘Operating Companies’’): Timber Hill LLC (‘‘TH LLC’’), TimberHill Europe AG (‘‘THE’’), Timber Hill Securities Hong Kong Limited (‘‘THSHK’’), Timber HillAustralia Pty Limited (‘‘THA’’), Timber Hill Canada Company (‘‘THC’’), Interactive Brokers LLC(‘‘IB LLC’’) and subsidiary, Interactive Brokers Canada Inc. (‘‘IBC’’), Interactive Brokers (U.K.)Limited (‘‘IBUK’’), Interactive Brokers (India) Private Limited (‘‘IBI’’), Interactive Brokers FinancialProducts S.A. (‘‘IBFP’’), Interactive Brokers Hungary KFT (‘‘IBH’’), IB Exchange Corp. (‘‘IBEC’’),Interactive Brokers Securities Japan, Inc. (‘‘IBSJ’’), IB Brasil Participacoes Ltda (‘‘IBBH’’), InteractiveBrokers Software Services Estonia OU (‘‘IBEST’’) and Interactive Brokers Software Services Russia(‘‘IBRUS’’).
IBG, Inc. operates in two business segments, electronic brokerage and market making. IBG, Inc.conducts its electronic brokerage business through certain Interactive Brokers subsidiaries, whichprovide electronic execution and clearing services to customers worldwide. The Company conducts itsmarket making business principally through its Timber Hill subsidiaries on the world’s leadingexchanges and market centers, primarily in exchange-traded equities, equity options and equity-indexoptions and futures.
Certain of the Operating Companies are members of various securities and commodities exchangesin North America, Europe and the Asia/Pacific region and are subject to regulatory capital and otherrequirements (Note 17). IB LLC, IBUK, IBC, IBI and IBSJ carry securities accounts for customers orperform custodial functions relating to customer securities.
2. Significant Accounting Policies
Basis of Presentation
These consolidated financial statements are presented in U.S. dollars and have been preparedpursuant to the rules and regulations of the U.S. Securities and Exchange Commission (‘‘SEC’’)regarding financial reporting with respect to Form 10-K and accounting standards generally accepted inthe United States of America (‘‘U.S. GAAP’’) promulgated in the FASB Accounting StandardsCodification (‘‘ASC’’ or the ‘‘Codification’’).
Securities owned and pledged of $1,545.8 million, primarily stocks, previously reported atDecember 31, 2011 were overstated by $378.3 million, and financial instruments owned wereunderstated by the same amount, in error. This classification error did not affect total financialinstruments owned or total assets. Based on an analysis, the Company has concluded that this error wasqualitatively and quantitatively immaterial. The consolidated statement of financial condition andNote 6 — Fair Value have been corrected for comparative purposes.
90
Interactive Brokers Group, Inc. and Subsidiaries
Notes to Consolidated Financial Statements (Continued)
(In U.S. dollars (thousands), except shares and per share amounts, unless otherwise noted)
2. Significant Accounting Policies (Continued)
Principles of Consolidation, including Noncontrolling Interests
The consolidated financial statements include the accounts of IBG, Inc. and its majority and whollyowned subsidiaries. As sole managing member of IBG LLC, IBG, Inc. exerts control over the Group’soperations. In accordance with ASC 810, Consolidation, the Company consolidates the Group’sconsolidated financial statements and records as noncontrolling interest the interests in the Group thatIBG, Inc. does not own.
Prior to the June 6, 2012 amendment to the Exchange Agreement (Note 4), the Company wasrequired to report IBG Holdings LLC’s (‘‘Holdings’’) ownership as redeemable noncontrolling interests(i.e., temporary equity) pursuant to ASC 810-10-45, ASC 815-40-25 and ASC 480-10-S99-3A (formerlyFASB Emerging Issues Task Force Topic D-98), outside of total equity in the consolidated financialstatements. Redemption value of these redeemable noncontrolling interests was measured as thenumber of equivalent shares of member interests in IBG LLC owned by Holdings multiplied by thethen current market price per share of the Company’s common stock. The excess of the redemptionvalue over the book value of these interests, which did not affect net income attributable to commonstockholders or cash flows, was required to be accounted for as a reduction of the Company’sstockholders’ equity in the consolidated statement of financial condition.
The Company elected to recognize changes in redemption value in each reporting periodimmediately as they occurred as if the end of each reporting period was also the redemption date forthe entire redeemable noncontrolling interest under paragraph 15(b) of ASC 480-10-S99-3A,notwithstanding that the redeemable noncontrolling interests are redeemable over a period of timepursuant to a redemption schedule (Note 4).
The Company’s policy is to consolidate all entities of which it owns more than 50% unless it doesnot have control. All inter-company balances and transactions have been eliminated. IBG, Inc. wouldalso consolidate any Variable Interest Entities (‘‘VIEs’’) pursuant to ASC 860, Transfers and Servicingand ASC 810 of which it is the primary beneficiary. IBG, Inc. currently is not the primary beneficiaryof any such entities and therefore no VIEs are included in the consolidated financial statements.
For periods after the above referenced amendment, the noncontrolling interests in IBG LLCattributable to Holdings are reported as a component of equity.
Use of Estimates
The preparation of financial statements in conformity with U.S. GAAP requires management tomake estimates and assumptions that affect the reported amounts and disclosures in the consolidatedfinancial statements and accompanying notes. Estimates, by their nature, are based on judgment andavailable information. Therefore, actual results could differ materially from those estimates. Suchestimates include the estimated fair values of IBG LLC and the Company in connection withaccounting for redeemable noncontrolling interests, the estimated value of investments accounted forunder the equity method of accounting, the estimated useful lives of property and equipment, includingcapitalized internally developed software, the allowance for doubtful accounts, compensation accruals,current and deferred income taxes and estimated contingency reserves.
91

Interactive Brokers Group, Inc. and Subsidiaries
Notes to Consolidated Financial Statements (Continued)
(In U.S. dollars (thousands), except shares and per share amounts, unless otherwise noted)
2. Significant Accounting Policies (Continued)
Fair Value
At December 31, 2012 and 2011, substantially all of IBG, Inc.’s assets and liabilities, includingfinancial instruments, were carried at fair value based on published market prices and were marked tomarket, or were assets which are short-term in nature (such as U.S. government treasury bills or spotforeign exchange) and were carried at amounts that approximate fair value.
IBG, Inc. applies the fair value hierarchy of ASC 820, Fair Value Measurement, to prioritize theinputs to valuation techniques used to measure fair value. The hierarchy gives the highest priority tounadjusted quoted prices in active markets for identical assets and liabilities and the lowest priority tounobservable inputs. The three levels of the fair value hierarchy are:
Level 1 Unadjusted quoted prices in active markets that are accessible at themeasurement date for identical, unrestricted assets or liabilities;
Level 2 Quoted prices in markets that are not considered to be active or financialinstruments for which all significant inputs are observable, either directly orindirectly; and
Level 3 Prices or valuations that require inputs that are both significant to fairvalue measurement and unobservable
Financial instruments owned and financial instruments sold, but not yet purchased, except forwardcurrency contracts, over-the-counter (‘‘OTC’’) currency options and certain corporate and municipaldebt securities, which are classified as Level 2 financial instruments, are classified within Level 1 of thefair value hierarchy. The Company’s financial instruments are valued using quoted market prices aspublished by exchanges and clearing houses or otherwise broadly distributed in active markets, includeU.S. government and sovereign obligations, active listed securities, options, futures, options on futuresand corporate and municipal debt securities. IBG, Inc. does not adjust quoted prices for Level 1financial instruments, even in the event that the Company may hold a large position whereby apurchase or sale could reasonably impact quoted prices.
Currency forward contracts and OTC currency options are valued using broadly distributed bankand broker prices, and are classified as Level 2 financial instruments as such instruments are notexchange-traded. Corporate and municipal debt securities, including Federal Deposit InsuranceCorporation insured corporate bonds held as securities segregated for regulatory purposes, that are notactively traded are also classified in Level 2.
Investments in listed common stock and investments in other non-market making securities, whichinvestments are reported in other assets in the accompanying consolidated statement of financialcondition, are generally reported as Level 2 financial instruments, except for unrestricted listed equities,which are Level 1 financial instruments. Investments in other non-market making securities includecorporate, municipal and asset-backed debt securities, which are Level 2 financial instruments whosefair values are determined using broker and vendor prices that have been independently validated bythe Company.
Earnings Per Share
Earnings per share (‘‘EPS’’) are computed in accordance with ASC 260, Earnings per Share. Sharesof Class A and Class B common stock share proportionately in the earnings of IBG, Inc. Basic earnings
92

Interactive Brokers Group, Inc. and Subsidiaries
Notes to Consolidated Financial Statements (Continued)
(In U.S. dollars (thousands), except shares and per share amounts, unless otherwise noted)
2. Significant Accounting Policies (Continued)
per share are calculated utilizing net income available for common stockholders divided by theweighted average number of shares of Class A and Class B common stock outstanding for that period.Diluted earnings per share are calculated utilizing the Company’s basic net income available forcommon stockholders divided by diluted weighted average shares outstanding with no adjustments tonet income available to common stockholders for dilutive potential common shares.
The Company has determined to reflect Topic D-98 measurement adjustments for non-fair valueredemption rights through application of the two-class method of calculating earnings per share in lieuof recognizing the impact through the determination of net income attributable to commonshareholders. Furthermore, in accordance with footnote 17 of ASC 480-10-S99-3A, the Company haselected to treat only the portion of the periodic measurement adjustments that reflect a redemption inexcess of fair value as being akin to a dividend, reducing net income attributable to commonstockholders for purposes of applying the two-class method. Decreases in the carrying amount ofredeemable noncontrolling interests through Topic D-98 measurement adjustments are reflected in theapplication of the two-class method only to the extent they represent recoveries of amounts previouslyaccounted for by applying the two-class method.
Stock-Based Compensation
IBG, Inc. follows ASC 718, Compensation—Stock Compensation, to account for its stock-basedcompensation plans. ASC 718 requires all share-based payments to employees to be recognized in thefinancial statements using a fair value-based method. As a result, IBG, Inc. expenses the fair value ofstock granted to employees, generally 50% in the year of grant in recognition of plan forfeitureprovisions (described below) and the remaining 50% over the related vesting period utilizing the‘‘graded vesting’’ method permitted under ASC 718-10. In the case of ‘‘retirement eligible’’ employees(those employees older than 59), 100% of share awards are expensed when granted.
Shares granted under the stock-based compensation plans are subject to forfeiture in the event anemployee ceases employment with the Company. The plans provide that employees who discontinueemployment with the Company without cause and continue to meet the terms of the plans’post-employment provisions will forfeit 50% of unvested previously granted shares unless the employeeis over the age of 59, in which case the employee would be eligible to receive 100% of unvested sharespreviously granted.
Cash and Cash Equivalents
IBG, Inc. defines cash equivalents as short-term, highly liquid securities and cash deposits withoriginal maturities of three months or less, other than those used for trading purposes.
Cash and Securities—Segregated for Regulatory Purposes
As a result of customer activities, certain Operating Companies are obligated by rules mandated bytheir primary regulators to segregate or set aside cash or qualified securities to satisfy such regulations,which regulations have been promulgated to protect customer assets. In addition, substantially all of theOperating Companies are members of various clearing organizations at which cash or securities aredeposited as required to conduct day-to-day clearance activities. Securities segregated for regulatorypurposes consisted of Federal Deposit Insurance Corporation insured corporate bonds, which arerecorded as Level 2 financial assets, in the amount of $0 and $440.4 million at December 31, 2012 and
93
Interactive Brokers Group, Inc. and Subsidiaries
Notes to Consolidated Financial Statements (Continued)
(In U.S. dollars (thousands), except shares and per share amounts, unless otherwise noted)
2. Significant Accounting Policies (Continued)
2011, U.S. Treasury Bills of $2,297.0 million and $747.9 million at December 31, 2012 and 2011, whichare recorded as Level 1 financial assets and securities purchased under agreements to resell in theamount of $6.37 billion and $3.82 billion as of December 31, 2012 and 2011, respectively, whichamounts approximate fair value.
Securities Borrowed and Securities Loaned
Securities borrowed and securities loaned are recorded at the amount of collateral advanced orreceived. Securities borrowed transactions require IBG, Inc. to provide counterparties with collateral,which may be in the form of cash, letters of credit or other securities. With respect to securities loaned,IBG, Inc. receives collateral, which may be in the form of cash or other securities in an amountgenerally in excess of the fair value of the securities loaned.
IBG, Inc. monitors the market value of securities borrowed and loaned on a daily basis, withadditional collateral obtained or refunded as permitted contractually. Receivables and payables with thesame counterparty are not offset in the consolidated statements of financial condition. For thesetransactions, the fees received or paid by IBG, Inc. are recorded as interest income or interest expensein the consolidated statements of comprehensive income.
Securities Purchased Under Agreements to Resell
Securities purchased under agreements to resell are treated as collateralized financing transactionsand are recorded at contract value, plus accrued interest, which approximates fair value. TheCompany’s policy is to obtain possession of collateral with a fair value equal to or in excess of theprincipal amount loaned under resale agreements. To ensure that the fair value of the underlyingcollateral remains sufficient, this collateral is valued daily with additional collateral obtained or excesscollateral returned, as permitted under contractual provisions.
Financial Instruments Owned and Sold But Not Yet Purchased
Stocks, government, corporate and municipal bonds, futures and options transactions are reportedin the consolidated financial statements on a trade date basis. Financial instruments owned andfinancial instruments sold but not yet purchased are recorded at fair value based upon quoted marketprices. All firm-owned financial instruments pledged to counterparties where the counterparty has theright, by contract or custom, to sell or repledge the financial instruments are classified as financialinstruments owned and pledged as collateral in the consolidated statements of financial condition.
IBG, Inc. also enters into currency forward contracts. These transactions, which are also reportedon a trade date basis, are agreements to exchange a fixed amount of one currency for a specifiedamount of a second currency at completion of the currency forward contract term. Unrealizedmark-to-market gains and losses on currency forward contracts are reported as components of financialinstruments owned or financial instruments sold but not yet purchased in the consolidated statementsof financial condition. Net earnings or losses are reported as components of interest income in theconsolidated statements of comprehensive income.
Customer Receivables and Payables
Customer securities transactions are recorded on a settlement date basis and customercommodities transactions are recorded on a trade date basis. Receivables from and payables to
94

Interactive Brokers Group, Inc. and Subsidiaries
Notes to Consolidated Financial Statements (Continued)
(In U.S. dollars (thousands), except shares and per share amounts, unless otherwise noted)
2. Significant Accounting Policies (Continued)
customers include amounts due on cash and margin transactions, including futures contracts transactedon behalf of customers. Securities owned by customers, including those that collateralize margin loansor other similar transactions, are not reported in the consolidated statements of financial condition.Amounts receivable from customers that are determined by management to be uncollectible areexpensed as a component of general and administrative expense.
Receivables from and Payables to Brokers, Dealers and Clearing Organizations
Receivables and payables to brokers, dealers and clearing organizations include net receivables andpayables from unsettled trades as well as amounts related to futures contracts executed on behalf ofcustomers, amounts receivable for securities not delivered by IBG, Inc. to the purchaser by thesettlement date (‘‘fails to deliver’’) and margin deposits. Payables to brokers, dealers and clearingorganizations also include amounts payable for securities not received by IBG, Inc. from a seller by thesettlement date (‘‘fails to receive’’).
Investments
IBG, Inc. makes certain strategic investments related to financial services and accounts for theseinvestments under the cost method of accounting or under the equity method of accounting as requiredunder ASC 323, Investments—Equity Method and Joint Ventures. Investments are accounted for underthe equity method of accounting when IBG, Inc. has significant influence over the investee. Investmentsaccounted for under the equity method, including where the investee is a limited partnership or limitedliability company, are recorded at the fair value amount of IBG, Inc.’s initial investment and adjustedeach period for IBG, Inc.’s share of the investee’s income or loss. IBG, Inc.’s share of the income orlosses from equity investments is reported as a component of other income (Note 11) in theconsolidated statements of comprehensive income and the recorded amounts of IBG, Inc.’s equityinvestments, $34.7 million at December 31, 2012 ($25.3 million at December 31, 2011), which areincluded in other assets in the consolidated statements of financial condition, increase or decreaseaccordingly. Distributions received from equity investees are recorded as reductions to the respectiveinvestment balance.
A judgmental aspect of accounting for investments is evaluating whether an other-than-temporarydecline in the value of an investment has occurred. The evaluation of an other-than-temporaryimpairment is dependent on specific quantitative and qualitative factors and circumstances surroundingan investment, including recurring operating losses, credit defaults and subsequent rounds of financing.IBG, Inc.’s equity investments do not have readily determinable market values. All equity investmentsare reviewed for changes in circumstances or occurrence of events that suggest IBG, Inc.’s investmentmay not be recoverable. If an unrealized loss on any investment is considered to beother-than-temporary, the loss is recognized in the period the determination is made. IBG, Inc. alsoholds exchange memberships and investments in equity securities of certain exchanges as required toqualify as a clearing member, and strategic investments in corporate stock that do not qualify for equitymethod accounting. Such investments, $36.2 million at December 31, 2012 ($35.0 million atDecember 31, 2011), are recorded at cost or, if an other-than-temporary impairment in value hasoccurred, at a value that reflects management’s estimate of the impairment, and are included in otherassets in the consolidated statements of financial condition. Dividends are recognized as a componentof other income as such dividends are received.
The Company also makes non-market making investments (which are not considered core businessactivities) that are accounted for at fair value (Note 6), with gains and losses recorded as a componentof other income (Note 11).
95

Interactive Brokers Group, Inc. and Subsidiaries
Notes to Consolidated Financial Statements (Continued)
(In U.S. dollars (thousands), except shares and per share amounts, unless otherwise noted)
2. Significant Accounting Policies (Continued)
Property and Equipment
Property and equipment, which is a component of other assets, consist of purchased technologyhardware and software, internally developed software, leasehold improvements and office furniture andequipment. Property and equipment are recorded at historical cost, less accumulated depreciation andamortization. Additions and improvements that extend the lives of assets are capitalized, whileexpenditures for repairs and maintenance are expensed as incurred. Depreciation and amortization arecomputed using the straight-line method. Equipment is depreciated over the estimated useful lives ofthe assets, while leasehold improvements are amortized over the lesser of the estimated economicuseful life of the asset or the term of the lease. Computer equipment is depreciated over three to fiveyears and office furniture and equipment are depreciated over five to seven years. Qualifying costs forinternally developed software are capitalized and amortized over the expected useful life of thedeveloped software, not to exceed three years.
Comprehensive Income and Foreign Currency Translation
The Company’s operating results are reported in the consolidated statement of comprehensiveincome pursuant to Accounting Standards Update 2011-05, Comprehensive Income.
Comprehensive income consists of two components: net income and other comprehensive income(‘‘OCI’’). OCI is comprised of revenues, expenses, gains and losses that are reported in thecomprehensive income section of the statement of comprehensive income, but are excluded fromreported net income. IBG, Inc.’s OCI is comprised of foreign currency translation adjustments.
IBG, Inc.’s international Operating Companies have a functional currency that is other than theU.S. dollar. Such subsidiaries’ assets and liabilities are translated into U.S. dollars at period-endexchange rates, and revenues and expenses are translated at average exchange rates prevailing duringthe period. Adjustments that result from translating amounts from a subsidiary’s functional currency arereported as a component of accumulated OCI. In general, it is the practice and intention of theCompany to reinvest the earnings of its non-U.S. subsidiaries in those operations. Deferred incometaxes have not been provided for U.S. tax liabilities or for additional foreign taxes on unremittedearnings that have been indefinitely reinvested.
Revenue Recognition
—Trading Gains
Trading gains and losses are recorded on trade date and are reported on a net basis. Trading gainsare comprised of changes in the fair value of financial instruments owned and financial instrumentssold but not yet purchased (i.e., unrealized gains and losses) and realized gains and losses. Dividendsare integral to the valuation of stocks and interest is integral to the valuation of fixed incomeinstruments. Accordingly, both dividends and interest income and expense attributable to financialinstruments owned and financial instruments sold but not yet purchased are reported on a net basis asa component of trading gains in the accompanying consolidated statements of comprehensive income.
96
Interactive Brokers Group, Inc. and Subsidiaries
Notes to Consolidated Financial Statements (Continued)
(In U.S. dollars (thousands), except shares and per share amounts, unless otherwise noted)
2. Significant Accounting Policies (Continued)
—Commissions and Execution Fees
Commissions charged for executing and clearing customer transactions are recorded on a tradedate basis and are reported as commissions and execution fees in the consolidated statements ofcomprehensive income, and the related expenses are reported as execution and clearing expenses, alsoon a trade date basis.
—Interest Income and Expense
The Company earns interest income and incurs interest expense primarily in connection with itsElectronic Brokerage customer business and its securities lending activities. Such interest is recorded onthe accrual basis.
—Foreign Currency Transaction Gains and Losses
Foreign currency transaction gains and losses from market making and electronic brokerageactivities, respectively, are included in trading gains and in interest or other income in theaccompanying consolidated statements of comprehensive income.
Income Taxes
IBG, Inc. accounts for income taxes in accordance with ASC 740, Income Taxes. The Company’sincome tax expense, deferred tax assets and liabilities, and reserves for unrecognized tax benefits arebased on enacted tax laws (Note 13) and reflect management’s best assessment of estimated futuretaxes to be paid. We are subject to income taxes in both the United States and numerous foreignjurisdictions. Determining income tax expense requires significant judgments and estimates.
Deferred income tax assets and liabilities arise from temporary differences between the tax andfinancial statement recognition of the underlying assets and liabilities. In evaluating our ability torecover our deferred tax assets within the jurisdiction from which they arise, we consider all availablepositive and negative evidence, including scheduled reversals of deferred tax liabilities, projected futuretaxable income, tax-planning strategies, and results of recent operations. In projecting future taxableincome, we begin with historical results adjusted for the results of discontinued operations and changesin accounting policies and incorporate assumptions including the amount of future state, federal andforeign pretax operating income, the reversal of temporary differences, and the implementation offeasible and prudent tax-planning strategies. These assumptions require significant judgment about theforecasts of future taxable income and are consistent with the plans and estimates we are using tomanage the underlying businesses. In evaluating the objective evidence that historical results provide,we consider three years of cumulative operating income (loss). Deferred income taxes have not beenprovided for U.S. tax liabilities or for additional foreign taxes on the unremitted earnings of foreignsubsidiaries that have been indefinitely reinvested.
The calculation of our tax liabilities involves dealing with uncertainties in the application ofcomplex tax laws and regulations in a multitude of jurisdictions across our global operations. Changesin tax laws and rates could also affect recorded deferred tax assets and liabilities in the future.
97

Interactive Brokers Group, Inc. and Subsidiaries
Notes to Consolidated Financial Statements (Continued)
(In U.S. dollars (thousands), except shares and per share amounts, unless otherwise noted)
2. Significant Accounting Policies (Continued)
ASC 740 provides that a tax benefit from an uncertain tax position may be recognized when it ismore likely than not that the position will be sustained upon examination, including resolutions of anyrelated appeals or litigation processes, on the basis of the technical merits. ASC 740 also providesguidance on measurement, derecognition, classification, interest and penalties, accounting in interimperiods, disclosure, and transition.
The Company records tax liabilities in accordance with ASC 740 and adjusts these liabilities whenmanagement’s judgment changes as a result of the evaluation of new information not previouslyavailable. Because of the complexity of some of these uncertainties, the ultimate resolution may resultin a payment that is different from our current estimate of the tax liabilities. These differences will bereflected as increases or decreases to income tax expense in the period in which new information isavailable.
IBG, Inc. recognizes interest related to income tax matters as interest income or expense andpenalties related to income tax matters as income tax expense.
Recently Issued Accounting Pronouncements
Subsequent to the adoption of the ASC, the FASB will issue Accounting Standards Updates(‘‘ASUs’’) as the means to add to or delete from, or otherwise amend the ASC. In 2012 and 2013, priorto the issuance of the Company’s consolidated financial statements, ASUs 2012-01 through 2013-05have been issued. Following is a summary of recently issued ASUs that have affected or may affect theCompany’s consolidated financial statements:
Affects Status
ASU 2011-03 Transfers and Servicing (Topic 860): Fiscal years, and interim periodsReconsideration of Effective Control for within those fiscal years,Repurchase Agreements beginning after December 15,
2011.
ASU 2011-04 Fair Value Measurement (Topic 820): Amendments To be applied prospectively forto Achieve Common Fair Value Measurement and interim and annual periodsDisclosure Requirements in U.S. GAAP and IFRS beginning after December 15,
2011.
ASU 2011-11 Balance Sheet (Topic 210): Disclosures about Effective for fiscal periodsOffsetting Assets and Liabilities beginning on or after January 1,
2013. Retrospective disclosuresfor comparative periods presentedwill be required.
ASU 2012-03 Technical Amendments and Corrections to SEC Effective upon issuance in AugustSections—Amendments to SEC section of ASC 2012.pursuant to SEC Staff Bulletin 114, TechnicalAmendments Pursuant to SEC ReleaseNo. 33-9520 and Corrections Relating toAccounting Standards Update 2010-22.
98

Interactive Brokers Group, Inc. and Subsidiaries
Notes to Consolidated Financial Statements (Continued)
(In U.S. dollars (thousands), except shares and per share amounts, unless otherwise noted)
2. Significant Accounting Policies (Continued)
Affects Status
ASU 2012-04 Technical Corrections and Improvements— Effective upon issuance inAmendments to the ASC correcting for differences October 2012 or, in the case ofbetween source literature and the ASC, guidance amendments subject toclarification and reference corrections and transitional guidance, for fiscalrelocation of guidance to more appropriate years beginning afterlocations within the ASC, and Conforming December 15, 2012.Amendments Related to Fair Value (Topic 820).
ASU 2013-01 Balance Sheet (Topic 210): Clarifying the Scope of Effective for fiscal periodsDisclosures about Offsetting Assets and Liabilities beginning on or after January 1,
2013 (the same as the effectivedate of ASU 2011-11).
Adoption of those ASUs that became effective during 2012 and 2013, prior to the issuance of theCompany’s consolidated financial statements, did not have a material effect on those financialstatements. Management is assessing the potential impact on the Company’s financial statements ofadopting ASUs that will become effective in the future.
ASC/IFRS Convergence
In February 2010, the SEC issued Commission Statement in Support of Convergence and GlobalAccounting Standards, a formal statement updating the status of its November 2008 Roadmap for thePotential Use of Financial Statements Prepared in Accordance with International Financial ReportingStandards by U.S. Issuers (‘‘IFRS Roadmap’’). The statement supported convergence of accountingstandards and the development of a single set of global accounting standards. As directed in thisstatement, the SEC staff issued Work Plan for the Consideration of Incorporating International FinancialReporting Standards into the Financial Reporting System for U.S. Issuers (the ‘‘Work Plan’’) in May 2010,and issued a follow-up Staff Paper, subtitled Exploring a Possible Method of Incorporation in May 2011.The Work Plan outlines the steps to be taken to provide the SEC with information to be able toconclude whether IFRS should be adopted for U.S. registrants and the Staff Paper discusses alternativeapproaches (‘‘Convergence’’ and ‘‘Endorsement’’) to adoption that could be applied. Within the StaffPaper, the SEC Staff has issued a Request for Comment on these alternatives. The Comment periodended July 31, 2011 and the SEC Staff issued two Staff Papers, A Comparison of U.S. GAAP and IFRSand Analysis of IFRS in Practice on November 16, 2011.
In June 2012 the FASB and IASB issued a joint statement on their continuing deliberationsregarding changes to lease accounting. When issued, new lease accounting standards under the ASCand IFRS will require the reporting of lease assets and related liabilities on issuers’ statements offinancial condition under a mutually agreed upon two-method approach. Exposure Drafts detailingapplicability and implementation considerations are expected to be issued in 2013, and final standardsare expected to be issued in the future. Management will be assessing the potential effects of thischange in lease accounting as the standard setting process moves forward. Based on the scope ofexisting lease commitments (approximately 0.1% of total assets as of December 31, 2012—seeNote 15), the effect on the Company’s financial statements is not expected to be material.
99
Interactive Brokers Group, Inc. and Subsidiaries
Notes to Consolidated Financial Statements (Continued)
(In U.S. dollars (thousands), except shares and per share amounts, unless otherwise noted)
2. Significant Accounting Policies (Continued)
On July 13, 2012, the SEC’s Office of the Chief Accountant issued its Final Staff Report on theWork Plan. This report considered possible means of aligning IFRS with U.S. GAAP, and raisednumerous concerns about the possible effects of adoption on registrants and investors. The StaffReport did not reject some form of convergence between U.S. GAAP and IFRS, but also did notendorse adoption and did not commit to the extent or timing of adoption. While a formal commitmentregarding possible incorporation of IFRS into U.S. GAAP has not been determined, based oncontinuing joint efforts between the FASB and IASB, it is likely that convergence to some extent willoccur in the future. The Company applies versions of IFRS for the stand alone financial statements ofseveral of the Operating Companies, where required, and continues to assess the potential impact ofadopting IFRS on the Company’s consolidated financial statements.
SEC Derivatives Regulation Roadmap
In June 2012, the SEC issued for comment a policy statement on its proposed plan that wouldsequence the phasing in of final rules to be adopted by the Commission regulating security-based swapsin order to comply with the requirements of the 2010 Dodd-Frank Wall Street Reform and ConsumerProtection Act (the ‘‘Dodd-Frank’’ Act). The policy statement provides a proposed ‘‘roadmap’’ foradoption of final rules, but does not mandate specific registrant compliance deadlines. Management ismonitoring this and other accounting and regulatory rulemaking developments for their potential effecton the Company’s financial statements and internal controls over financial reporting.
3. Trading Activities and Related Risks
IBG, Inc.’s trading activities include providing securities market making and brokerage services.Trading activities expose IBG, Inc. to market and credit risks. These risks are managed in accordancewith established risk management policies and procedures. To accomplish this, management hasestablished a risk management process that includes:
• a regular review of the risk management process by executive management as part of itsoversight role;
• defined risk management policies and procedures supported by a rigorous analytic framework;and
• articulated risk tolerance levels as defined by executive management that are regularly reviewedto ensure that IBG, Inc.’s risk-taking is consistent with its business strategy, capital structure, andcurrent and anticipated market conditions.
Market Risk
IBG, Inc. is exposed to various market risks. Exposures to market risks arise from equity price risk,foreign currency exchange rate fluctuations and changes in interest rates. IBG, Inc. seeks to mitigatemarket risk associated with trading inventories by employing hedging strategies that correlate rate, priceand spread movements of trading inventories and related financing and hedging activities. IBG, Inc.
100

Interactive Brokers Group, Inc. and Subsidiaries
Notes to Consolidated Financial Statements (Continued)
(In U.S. dollars (thousands), except shares and per share amounts, unless otherwise noted)
3. Trading Activities and Related Risks (Continued)
uses a combination of cash instruments and exchange traded derivatives to hedge its market exposures.The following discussion describes the types of market risk faced:
Equity Price Risk
Equity price risk arises from the possibility that equity security prices will fluctuate, affecting thevalue of equity securities and other instruments that derive their value from a particular stock, adefined basket of stocks, or a stock index. IBG, Inc. is subject to equity price risk primarily infinancial instruments owned and sold but not yet purchased. IBG, Inc. attempts to limit such risksby continuously reevaluating prices and by diversifying its portfolio across many different options,futures and underlying securities and avoiding concentrations of positions based on the sameunderlying security.
Currency Risk
Currency risk arises from the possibility that fluctuations in foreign exchange rates will impact thevalue of financial instruments. Exchange rate contracts may include cross-currency swaps andcurrency futures contracts. Currency swaps are agreements to exchange future payments in onecurrency for payments in another currency. These agreements are used to effectively convert assetsor liabilities denominated in different currencies. Currency futures are contracts for delayeddelivery of currency at a specified future date. IBG, Inc. uses currency swaps to manage the levelsof its non-U.S. dollar currency balances and currency cash and futures to hedge its globalexposure.
Interest Rate Risk
Interest rate risk arises from the possibility that changes in interest rates will affect the value offinancial instruments. IBG, Inc. is exposed to interest rate risk on cash and margin balances,positions carried in equity securities, options, futures and on its debt obligations. These risks aremanaged through investment policies and by entering into interest rate futures contracts.
Credit Risk
IBG, Inc. is exposed to risk of loss if an individual, counterparty or issuer fails to perform itsobligations under contractual terms (‘‘default risk’’). Both cash instruments and derivatives exposeIBG, Inc. to default risk. IBG, Inc. has established policies and procedures for mitigating credit risk onprincipal transactions, including reviewing and establishing limits for credit exposure, maintainingcollateral, and continually assessing the creditworthiness of counterparties.
The Company’s credit risk is limited in that substantially all of the contracts entered into aresettled directly at securities and commodities clearing houses and a small portion is settled throughmember firms and banks with substantial financial and operational resources. IBG, Inc. seeks to controlthe risks associated with its customer margin activities by requiring customers to maintain collateral incompliance with regulatory and internal guidelines.
In the normal course of business, IBG, Inc. executes, settles, and finances various customersecurities transactions. Execution of these transactions includes the purchase and sale of securities by
101

Interactive Brokers Group, Inc. and Subsidiaries
Notes to Consolidated Financial Statements (Continued)
(In U.S. dollars (thousands), except shares and per share amounts, unless otherwise noted)
3. Trading Activities and Related Risks (Continued)
IBG, Inc. that exposes IBG, Inc. to default risk arising from the potential that customers orcounterparties may fail to satisfy their obligations. In these situations, IBG, Inc. may be required topurchase or sell financial instruments at unfavorable market prices to satisfy obligations to customers orcounterparties. Liabilities to other brokers and dealers related to unsettled transactions (i.e., securitiesfails to receive) are recorded at the amount for which the securities were purchased, and are paid uponreceipt of the securities from other brokers or dealers. In the case of aged securities fails to receive,IBG, Inc. may purchase the underlying security in the market and seek reimbursement for any lossesfrom the counterparty.
For cash management purposes, IBG, Inc. enters into short-term securities purchased underagreements to resell and securities sold under agreements to repurchase transactions (‘‘repos’’) inaddition to securities borrowing and lending arrangements, all of which may result in credit exposure inthe event the counterparty to a transaction is unable to fulfill its contractual obligations. In accordancewith industry practice, repos are collateralized by securities with a market value in excess of theobligation under the contract. Similarly, securities borrowed and loaned agreements are collateralizedby deposits of cash or securities. IBG, Inc. attempts to minimize credit risk associated with theseactivities by monitoring collateral values on a daily basis and requiring additional collateral to bedeposited with or returned to IBG, Inc. as permitted under contractual provisions.
Concentrations of Credit Risk
IBG, Inc.’s exposure to credit risk associated with its trading and other activities is measured on anindividual counterparty basis, as well as by groups of counterparties that share similar attributes.Concentrations of credit risk can be affected by changes in political, industry, or economic factors. Toreduce the potential for risk concentration, credit limits are established and exposure is monitored inlight of changing counterparty and market conditions. As of December 31, 2012, the Company did nothave any material concentrations of credit risk.
Off-Balance Sheet Risks
IBG, Inc. may be exposed to a risk of loss not reflected in the consolidated financial statementsfor futures products, which represent obligations of IBG, Inc. to settle at contracted prices, which mayrequire repurchase or sale in the market at prevailing prices. Accordingly, these transactions result inoff-balance sheet risk as IBG, Inc.’s cost to liquidate such futures contracts may exceed the amountsreported in IBG, Inc.’s consolidated statements of financial condition.
4. Equity and Earnings Per Share
In connection with its IPO in May 2007, IBG, Inc. purchased 10.0% of the membership interests inIBG LLC from Holdings, became the sole managing member of IBG LLC and began to consolidateIBG LLC’s financial results into its financial statements. Holdings wholly owns all Class B commonstock, which common stock has voting rights in proportion to its ownership interests in IBG LLC,approximately 88.1% as of December 31, 2012. The consolidated financial statements reflect the resultsof operations and financial position of IBG, Inc., including consolidation of its investment in IBG LLC.Prior to the June 6, 2012 amendment to the Exchange Agreement (described below), Holdings’ownership interests in IBG LLC were accounted for and reported in these consolidated financial
102

Interactive Brokers Group, Inc. and Subsidiaries
Notes to Consolidated Financial Statements (Continued)
(In U.S. dollars (thousands), except shares and per share amounts, unless otherwise noted)
4. Equity and Earnings Per Share (Continued)
statements as ‘‘redeemable noncontrolling interests’’ (temporary equity) pursuant to ASC 810-10-45,ASC 815-40-25 and ASC 480-10-S99-3A. For periods after the Amendment, beginning with the quarterended June 30, 2012, the noncontrolling interests in IBG LLC attributable to Holdings are reported asa component of total equity, as described below.
Recapitalization and Post-IPO Capital Structure
Immediately prior to and immediately following the consummation of the IPO, IBG, Inc.,Holdings, IBG LLC and the members of IBG LLC consummated a series of transactions collectivelyreferred to herein as the ‘‘Recapitalization.’’ In connection with the Recapitalization, IBG, Inc.,Holdings and the historical members of IBG LLC entered into an exchange agreement, dated as ofMay 3, 2007 (the ‘‘Exchange Agreement’’), pursuant to which the historical members of IBG LLCreceived membership interests in Holdings in exchange for their membership interests in IBG LLC.Additionally, IBG, Inc. became the sole managing member of IBG LLC.
In connection with the consummation of the IPO, Holdings used the net proceeds to redeem10.0% of members’ interests in Holdings in proportion to their interests. Immediately following theRecapitalization and IPO, Holdings owned approximately 90% of IBG LLC and 100% of IBG, Inc.’sClass B common stock, which has voting power in IBG, Inc. in proportion to Holdings’ ownership ofIBG LLC.
Since consummation of the IPO and Recapitalization, IBG, Inc.’s equity capital structure has beencomprised of Class A and Class B common stock. All shares of common stock have a par value of$0.01 per share and have identical rights to earnings and dividends and in liquidation. As describedpreviously in this Note 4, Class B common stock has voting power in IBG, Inc. proportionate to theextent of Holdings’ and IBG, Inc.’s respective ownership of IBG LLC. At December 31, 2012 and 2011,1,000,000,000 shares of Class A common stock were authorized, of which 47,797,844 and 46,061,256shares have been issued; and 47,499,739 and 45,576,791 shares were outstanding, respectively. Class Bcommon stock is comprised of 100 authorized shares, of which 100 shares were issued and outstandingas of December 31, 2012 and 2011, respectively. In addition, 10,000 shares of preferred stock have beenauthorized, of which no shares are issued or outstanding as of December 31, 2012 and 2011,respectively.
As a result of a federal income tax election made by IBG LLC applicable to the acquisition ofIBG LLC member interests by IBG, Inc., the income tax basis of the assets of IBG LLC acquired byIBG, Inc. have been adjusted based on the amount paid for such interests. Deferred tax assets wererecorded as of the IPO date and in connection with the 2011 redemption of Holdings member interestsin exchange for common stock, which deferred tax assets are a component of other assets in theconsolidated statement of financial condition and are being amortized as additional deferred incometax expense over 15 years from the IPO date and from the 2011 redemption date, respectively, asallowable under current tax law. As of December 31, 2012 and 2011, the unamortized balance of thesedeferred tax assets was $281,615 and $297,881, respectively.
IBG, Inc. also entered into an agreement (the ‘‘Tax Receivable Agreement’’) with Holdings to payHoldings (for the benefit of the former members of IBG LLC) 85% of the tax savings that IBG, Inc.
103

Interactive Brokers Group, Inc. and Subsidiaries
Notes to Consolidated Financial Statements (Continued)
(In U.S. dollars (thousands), except shares and per share amounts, unless otherwise noted)
4. Equity and Earnings Per Share (Continued)
actually realizes as the result of tax basis increases. These payables, net of payments made to Holdings,are reported as payable to affiliate in the consolidated statement of financial condition.
The remaining 15% is accounted for as a permanent increase to additional paid-in capital in theconsolidated statement of financial condition.
The deferred tax assets, payables to Holdings and credits to additional paid-in capital arising fromstock offerings from the date of the IPO through December 31, 2012 were:
Deferred Tax Payable Additional PaidAssets Holdings In Capital
$387,069 $329,009 $58,060
Amounts received and payable under the Tax Receivable Agreement are payable to Holdingsannually upon the filing of IBG, Inc.’s federal income tax return. The Company has paid Holdings atotal of $70.4 million through December 31, 2012 pursuant to the terms of the Tax ReceivableAgreement.
The Exchange Agreement provides for future redemptions of member interests and for thepurchase of member interests in IBG LLC by IBG, Inc. from Holdings, which could result in IBG, Inc.acquiring the remaining member interests in IBG LLC that it does not own. On an annual basis,holders of Holdings member interests are able to request redemption of such member interests over aminimum eight (8) year period following the IPO; 12.5% annually for seven (7) years and 2.5% in theeighth year.
At the time of the Company’s IPO in 2007, three hundred sixty (360) million shares of authorizedCommon Stock were reserved for future sales and redemptions. From 2008 through 2010, Holdingsredeemed 5,013,259 IBG LLC shares for a total of $114 million, which redemptions were funded usingcash on hand at IBG LLC. Upon cash redemption these IBG LLC shares were retired. In 2011, theCompany issued 1,983,624 shares of Common Stock directly to Holdings in exchange for an equivalentnumber of shares of member interests in IBG LLC.
As a consequence of these redemption transactions, and distribution of shares to employees(Note 12), IBG, Inc.’s interest in IBG LLC has increased to approximately 11.9%, with Holdingsowning the remaining 88.1% as of December 31, 2012. The redemptions also resulted in an increase inthe Holdings interest held by Thomas Peterffy and his affiliates from approximately 84.6% at the IPOto approximately 86.3% at December 31, 2012.
The Exchange Agreement, as amended June 6, 2012, provides that the Company may facilitate theredemption by Holdings of interests held by its members through the issuance of shares of commonstock through a public offering in exchange for the interests in IBG LLC being redeemed by Holdings.The June 6, 2012 amendment (the ‘‘Amendment’’) eliminated from the Exchange Agreement analternative funding method, which provided that upon approval by the board of directors and byagreement of the Company, IBG LLC and Holdings, redemptions could be made in cash.
Subsequent to the amendment to the Exchange Agreement on June 6, 2012, the Company recordedadjustments to report Holdings’ noncontrolling interests in IBG LLC as component of total equity, reducing
104

Interactive Brokers Group, Inc. and Subsidiaries
Notes to Consolidated Financial Statements (Continued)
(In U.S. dollars (thousands), except shares and per share amounts, unless otherwise noted)
4. Equity and Earnings Per Share (Continued)
redeemable noncontrolling interests to zero and reversing the cumulative effect of adjustments toredemption value previously recorded to additional paid-in capital. The effect of these adjustments, beforethe allocation of comprehensive income and other capital transactions to Holdings’ noncontrolling interestsin IBG LLC subsequent to June 6, 2012, and before the recording of capital transactions andcomprehensive income attributable to the Company and to other noncontrolling interests was:
Adjustmentsas of June 6,
(in thousands) 2012
Redeemable noncontrolling interests . . . . . . . . . . . . . . . . . . . . . . . . . . $(5,367,553)
Additional Paid in Capital . . . . . . . . . . . . . . . . . . . . . . . . . . . . . . . . . $ 472,409
Retained earnings . . . . . . . . . . . . . . . . . . . . . . . . . . . . . . . . . . . . . . . $ 572,840
Noncontrolling interests . . . . . . . . . . . . . . . . . . . . . . . . . . . . . . . . . . . $ 4,322,304
Stock Repurchase Program
In September 2008, the Company’s Board of Directors approved the repurchase of up to eight(8) million shares of its Class A common stock by IBG LLC. Shares may be purchased from time to timein the open market and in private transactions if the Company deems the price appropriate. InNovember 2008, 65,800 shares were repurchased at a cost of $866, and are being held as Treasury Stock.
Earnings per Share
The Company has determined to reflect measurement adjustments for non-fair value redemptionrights through application of the two-class method of calculating earnings per share in lieu ofrecognizing the impact through the determination of net income attributable to common stockholders.
Basic earnings (loss) per share are calculated utilizing net income available for commonstockholders divided by the weighted average number of shares of Class A and Class B common stockoutstanding for that period:
Year-ended December 31,
2012 2011 2010
Basic earnings per share:Net income attributable to common
stockholders . . . . . . . . . . . . . . . . . . . . . $ 40,668 $ 61,858 $ (9,550)Add (deduct) net income attributable to
non-fair value redemption rights . . . . . . 1,108 (878) (62)Net income available for common
stockholders . . . . . . . . . . . . . . . . . . . . . $ 41,776 $ 60,980 $ (9,612)
Weighted average shares of common stockoutstanding:Class A . . . . . . . . . . . . . . . . . . . . . . . . 46,814,576 43,924,454 41,870,826Class B . . . . . . . . . . . . . . . . . . . . . . . . 100 100 100
46,814,676 43,924,554 41,870,926
Basic earnings per share . . . . . . . . . . . . $ 0.89 $ 1.39 $ (0.23)
105

Interactive Brokers Group, Inc. and Subsidiaries
Notes to Consolidated Financial Statements (Continued)
(In U.S. dollars (thousands), except shares and per share amounts, unless otherwise noted)
4. Equity and Earnings Per Share (Continued)
Diluted earnings (loss) per share are calculated utilizing the Company’s basic net income availablefor common stockholders divided by diluted weighted average shares outstanding with no adjustmentsto net income available to common stockholders for potentially dilutive common shares:
Year-ended December 31,
2012 2011 2010
Diluted earnings per share:Net income available for common
stockholders . . . . . . . . . . . . . . . . . . . $ 41,776 $ 60,980 $ (9,612)
Weighted average shares of commonstock outstanding:
Class A:Issued and outstanding . . . . . . . . . . . 46,814,576 43,924,454 41,870,826Potentially dilutive common shares:
Issuable pursuant to 2007 ROI UnitStock Plan . . . . . . . . . . . . . . . . . 255,846 440,348 627,779
Class B . . . . . . . . . . . . . . . . . . . . . . . . 100 100 100
47,070,522 44,364,902 42,498,705
Diluted earnings per share . . . . . . . . . . $ 0.89 $ 1.37 $ (0.23)
In 2012 and 2011, there were no adjustments required to potentially dilutive shares. In 2010,potentially dilutive shares were excluded from the calculation of diluted loss per share because, in aloss year, such shares would have been anti-dilutive. Earnings per share were impacted by a tax benefitthat the Company recognized during preparation of the 2010 income tax returns. In connection withthe special dividend paid by our Swiss operating company in December 2010, we were able to captureadditional foreign tax credits, which resulted in an estimated $0.12 increase in diluted earnings pershare.
Member and Stockholder Dividends
In March, June, September and December 2012, IBG LLC paid dividends to its members totaling$596 million, of which IBG, Inc.’s proportionate share was $71 million. During 2012, the Company paidquarterly cash dividends of $0.10 per share of Common Stock, totaling $18.8 million, and in December2012 paid a special cash dividend of $1.00 per share of Common Stock, totaling $47.5 million.
On January 15, 2013, the Company declared a cash dividend of $0.10 per common share, payableon March 14, 2013 to shareholders of record as of March 1, 2013.
5. Comprehensive Income
Comprehensive income is comprised of Net Income and Other Comprehensive Income (‘‘OCI’’).The Company’s OCI is comprised of foreign currency translation adjustments, which arise from changesin the U.S. dollar value of the net worth of the Company’s international Operating Companies during
106

Interactive Brokers Group, Inc. and Subsidiaries
Notes to Consolidated Financial Statements (Continued)
(In U.S. dollars (thousands), except shares and per share amounts, unless otherwise noted)
5. Comprehensive Income (Continued)
respective reporting periods. The following table presents comprehensive income and earnings pershare (calculated using the two-class method) on comprehensive income:
Year-ended December 31,
2012 2011 2010
Net income attributable to commonstockholders . . . . . . . . . . . . . . . . . . . $ 40,668 $ 61,858 $ (9,550)
Add (deduct) net income attributable tonon-fair value redemption rights . . . . . 1,108 (878) (62)
Net income available for commonstockholders . . . . . . . . . . . . . . . . . . . 41,776 60,980 (9,612)
Other comprehensive income:Cumulative translation adjustment,
before income taxes . . . . . . . . . . . . 2,231 (4,480) 16,164Income taxes related to items of other
comprehensive income . . . . . . . . . . (9,036) (1,830) 5,941
Other comprehensive income (loss), netof tax . . . . . . . . . . . . . . . . . . . . . . . . 11,267 (2,650) 10,223
Comprehensive income available forcommon stockholders . . . . . . . . . . . . $ 53,043 $ 58,330 $ 611
Earnings per share on comprehensiveincome:
Basic . . . . . . . . . . . . . . . . . . . . . . . . $ 1.13 $ 1.33 $ 0.01
Diluted . . . . . . . . . . . . . . . . . . . . . . . $ 1.13 $ 1.31 $ 0.01
Weighted average common sharesoutstanding:Basic . . . . . . . . . . . . . . . . . . . . . . . . 46,814,676 43,924,554 41,870,926
Diluted . . . . . . . . . . . . . . . . . . . . . . . 47,070,522 44,364,902 42,498,705
In 2012, the Company determined that deferred income taxes had been provided for on OCI ofcertain foreign subsidiaries in error. Based on an analysis, the company has concluded that this errorwas qualitatively and quantitatively immaterial for all periods affected. Accordingly, deferred incometaxes of $9.2 million, previously provided on OCI generated by those subsidiaries in periods from 2007through 2011, were reversed, which increased the reported earnings per share on comprehensiveincome for 2012 by $0.20.
6. Fair Value
The following tables set forth, by level within the fair value hierarchy (Note 2), financial assets andliabilities, primarily financial instruments owned and financial instruments sold, but not yet purchasedat fair value as of December 31, 2012 and 2011. Financial instruments owned and pledged of
107

Interactive Brokers Group, Inc. and Subsidiaries
Notes to Consolidated Financial Statements (Continued)
(In U.S. dollars (thousands), except shares and per share amounts, unless otherwise noted)
6. Fair Value (Continued)
$1,545.8 million, primarily stocks, previously reported at December 31, 2011 were overstated by$378.3 million in error.
As required by ASC 820, assets and liabilities are classified in their entirety based on the lowestlevel of input that is significant to the fair value measurement.
Financial Assets At Fair Value as ofDecember 31, 2012
Level 1 Level 2 Level 3 Total
Securities segregated for regulatory purposes . . . . . . . . . . $2,297,024 $ — $— $2,297,024
Financial instruments owned:Stocks . . . . . . . . . . . . . . . . . . . . . . . . . . . . . . . . . . . . 887,031 — — 887,031Options . . . . . . . . . . . . . . . . . . . . . . . . . . . . . . . . . . . 2,388,173 — — 2,388,173U.S. and foreign government obligations . . . . . . . . . . . 30,087 — — 30,087Warrants . . . . . . . . . . . . . . . . . . . . . . . . . . . . . . . . . . 109,835 — — 109,835Corporate and municipal bonds . . . . . . . . . . . . . . . . . . 104,387 59,533 — 163,920Discount certificates . . . . . . . . . . . . . . . . . . . . . . . . . . 37,482 — — 37,482Currency forward contracts . . . . . . . . . . . . . . . . . . . . . — 1,351 — 1,351
Total Financial instruments owned . . . . . . . . . . . . . . . . . 3,556,995 60,884 — 3,617,879
Financial instruments owned and pledged as collateral:Stocks . . . . . . . . . . . . . . . . . . . . . . . . . . . . . . . . . . . . 775,222 — — 775,222Warrants . . . . . . . . . . . . . . . . . . . . . . . . . . . . . . . . . . 350 — — 350Corporate and municipal bonds . . . . . . . . . . . . . . . . . . 4,332 — — 4,332U.S. and foreign government obligations . . . . . . . . . . . 146,953 — — 146,953
Total Financial instruments owned and pledged ascollateral . . . . . . . . . . . . . . . . . . . . . . . . . . . . . . . . . . 926,857 — — 926,857
Subtotal . . . . . . . . . . . . . . . . . . . . . . . . . . . . . . . . . . . . 4,483,852 60,884 — 4,544,736
Other assets—investmentsInvestments in common stock . . . . . . . . . . . . . . . . . . . 17,707 3,549 — 21,256Other investments . . . . . . . . . . . . . . . . . . . . . . . . . . . 2,249 92,727 — 94,976
Total Financial Assets at Fair Value . . . . . . . . . . . . . . . . $6,800,832 $157,160 $— $6,957,992
108

Interactive Brokers Group, Inc. and Subsidiaries
Notes to Consolidated Financial Statements (Continued)
(In U.S. dollars (thousands), except shares and per share amounts, unless otherwise noted)
6. Fair Value (Continued)
Financial Liabilities At Fair Value as ofDecember 31, 2012
Level 1 Level 2 Level 3 Total
Financial instruments sold, not yet purchased:Stocks . . . . . . . . . . . . . . . . . . . . . . . . . . . . . . . . . . . . . $1,787,741 $ — $— $1,787,741Options . . . . . . . . . . . . . . . . . . . . . . . . . . . . . . . . . . . . 2,389,871 — — 2,389,871U.S. and foreign government obligations . . . . . . . . . . . . 451 — — 451Warrants . . . . . . . . . . . . . . . . . . . . . . . . . . . . . . . . . . . 2,104 — — 2,104Corporate bonds . . . . . . . . . . . . . . . . . . . . . . . . . . . . . 90,710 11,833 — 102,543Currency forward contracts . . . . . . . . . . . . . . . . . . . . . . — 3,550 — 3,550
Total Financial instruments sold, not yet purchased . . . . . . $4,270,877 $15,383 $— $4,286,260
Financial Assets At Fair Value as ofDecember 31, 2011
Level 1 Level 2 Level 3 Total
Securities segregated for regulatory purposes . . . . . . . . . . $ 747,857 $440,408 $— $1,188,265
Financial instruments owned:Stocks . . . . . . . . . . . . . . . . . . . . . . . . . . . . . . . . . . . . 1,046,755 — — 1,046,755Options . . . . . . . . . . . . . . . . . . . . . . . . . . . . . . . . . . . 4,113,539 — — 4,113,539U.S. and foreign government obligations . . . . . . . . . . . 10,908 — — 10,908Warrants . . . . . . . . . . . . . . . . . . . . . . . . . . . . . . . . . . 113,033 — — 113,033Corporate and municipal bonds . . . . . . . . . . . . . . . . . . 40,561 60,501 — 101,062Discount certificates . . . . . . . . . . . . . . . . . . . . . . . . . . 60,675 — — 60,675Currency forward contracts . . . . . . . . . . . . . . . . . . . . . — 1,577 — 1,577
Total Financial instruments owned . . . . . . . . . . . . . . . . . 5,385,471 62,078 — 5,447,549
Financial instruments owned and pledged as collateral:Stocks . . . . . . . . . . . . . . . . . . . . . . . . . . . . . . . . . . . . 999,116 — — 999,116Warrants . . . . . . . . . . . . . . . . . . . . . . . . . . . . . . . . . . 570 — — 570Corporate and municipal bonds . . . . . . . . . . . . . . . . . . 428 — — 428U.S. and foreign government obligations . . . . . . . . . . . 167,415 — — 167,415
Total Financial instruments owned and pledged ascollateral . . . . . . . . . . . . . . . . . . . . . . . . . . . . . . . . . . 1,167,529 — — 1,167,529
Subtotal . . . . . . . . . . . . . . . . . . . . . . . . . . . . . . . . . . . . 6,553,000 62,078 — 6,615,078
Other assets—investmentsInvestments in common stock . . . . . . . . . . . . . . . . . . . 3,782 — — 3,782Other investments . . . . . . . . . . . . . . . . . . . . . . . . . . . 1,260 89,472 — 90,732
Total Financial Assets at Fair Value . . . . . . . . . . . . . . . . $7,305,899 $591,958 $— $7,897,857
109

Interactive Brokers Group, Inc. and Subsidiaries
Notes to Consolidated Financial Statements (Continued)
(In U.S. dollars (thousands), except shares and per share amounts, unless otherwise noted)
6. Fair Value (Continued)
Financial Liabilities At Fair Value as ofDecember 31, 2011
Level 1 Level 2 Level 3 Total
Financial instruments sold, not yet purchased:Stocks . . . . . . . . . . . . . . . . . . . . . . . . . . . . . . . . . . . . . $1,796,160 $ — $— $1,796,160Options . . . . . . . . . . . . . . . . . . . . . . . . . . . . . . . . . . . . 4,233,533 — — 4,233,533Warrants . . . . . . . . . . . . . . . . . . . . . . . . . . . . . . . . . . . 240 — — 240Corporate bonds . . . . . . . . . . . . . . . . . . . . . . . . . . . . . 61,166 61,511 — 122,677Currency forward contracts . . . . . . . . . . . . . . . . . . . . . . — 3,538 — 3,538
Total Financial instruments sold, not yet purchased . . . . . . $6,091,099 $65,049 $— $6,156,148
There have been no transfers of fair value assets between Levels 1 and 2. The Company has noLevel 3 assets.
110

Interactive Brokers Group, Inc. and Subsidiaries
Notes to Consolidated Financial Statements (Continued)
(In U.S. dollars (thousands), except shares and per share amounts, unless otherwise noted)
7. Collateralized Transactions
The Company enters into securities borrowing and lending transactions and agreements torepurchase and resell securities to finance trading inventory, to obtain securities for settlement and toearn residual interest rate spreads. In addition, the Company’s customers pledge their securities ownedto collateralize margin loans. Under these transactions, the Company either receives or providescollateral, including equity, corporate debt and U.S. government securities. Under many agreements,the Company is permitted to sell or repledge securities received as collateral and use these securities tosecure repurchase agreements, enter into securities lending transactions or deliver these securities tocounterparties to cover short positions.
The Company also engages in securities financing transactions with and for customers throughmargin lending. Under these agreements and transactions, the Company either receives or providescollateral, including U.S. government securities, corporate debt and equity securities. Customerreceivables generated from margin lending activity are collateralized by customer-owned securities heldby the Company. Customers’ required margin levels and established credit limits are monitoredcontinuously by risk management staff using automated systems. Pursuant to Company policy and asenforced by such systems, customers are required to deposit additional collateral or reduce positions,when necessary to avoid automatic liquidation of positions.
Margin loans are extended on a demand basis and are not committed facilities. Factors consideredin the acceptance or rejection of margin loans are the amount of the loan, the degree of leverage beingemployed in the account and an overall evaluation of the portfolio to ensure proper diversification or,in the case of concentrated positions, appropriate liquidity of the underlying collateral. Additionally,transactions relating to concentrated or restricted positions are limited or prohibited by raising the levelof required margin collateral (to 100% in the extreme case). Underlying collateral for margin loans isevaluated with respect to the liquidity of the collateral positions, valuation of securities, volatilityanalysis and an evaluation of industry concentrations. Adherence to the Company’s collateral policiessignificantly limits the Company’s credit exposure to margin loans in the event of a customer’s default.Under margin lending agreements, the Company may request additional margin collateral fromcustomers and may sell securities that have not been paid for or purchase securities sold but notdelivered from customers, if necessary. At December 31, 2012 and 2011, approximately $9.85 billionand $7.02 billion of customer margin loans were outstanding.
Amounts relating to collateralized transactions at December 31, 2012 and 2011 are summarized asfollows (millions):
December 31, 2012 December 31, 2011
Permitted Sold or Permitted Sold orto Repledge Repledged to Repledge Repledged
Securities lending transactions . . . . . . . . . . . . . . . . . . . . $ 2,844 $ 2,828 $ 2,670 $2,657Agreements to resell(1) . . . . . . . . . . . . . . . . . . . . . . . . . 6,779 6,774 4,174 4,174Customer margin securities(2) . . . . . . . . . . . . . . . . . . . . 13,604 3,016 9,797 2,022
$23,227 $12,618 $16,641 $8,853
(1) At December 31, 2012, $6.4 billion, or 94% (at December 31, 2011, $3.8 billion, or 91%), ofsecurities acquired through agreements to resell that are shown as repledged have been deposited
111

Interactive Brokers Group, Inc. and Subsidiaries
Notes to Consolidated Financial Statements (Continued)
(In U.S. dollars (thousands), except shares and per share amounts, unless otherwise noted)
7. Collateralized Transactions (Continued)
in a separate bank account for the exclusive benefit of customers in accordance with SECRule 15c3-3.
(2) Sold or repledged customer margin securities of $853 previously reported at December 31, 2011erroneously excluded $1,169 used to satisfy short sale obligations.
In the normal course of business, the Company pledges qualified securities with clearingorganizations to satisfy daily margin and clearing fund requirements. At December 31, 2012 and 2011,substantially all government obligations owned were pledged to clearing organizations.
Financial instruments owned and pledged, including amounts pledged to affiliates, where thecounterparty has the right to repledge, at December 31, 2012 and 2011 consisted of the following(millions):
December 31, December 31,2012 2011
Stocks . . . . . . . . . . . . . . . . . . . . . . . . . . . . . . . . . . . . . . $775 $ 999Warrants . . . . . . . . . . . . . . . . . . . . . . . . . . . . . . . . . . . . 1 1Corporate and municipal bonds . . . . . . . . . . . . . . . . . . . . 4 —U.S. and foreign government obligations . . . . . . . . . . . . . 147 167
$927 $1,167
8. Short-Term Borrowings
Short-term borrowings consist primarily of collateralized borrowing facilities with clearing banks inmultiple currencies that bear interest at fluctuating overnight rates based on interbank funds ratesprevailing in the respective currencies. In addition, the Company has available secured and unsecuredovernight bank loan facilities. All short-term borrowings outstanding at December 31, 2012 and 2011were either repaid on the next business day or rolled forward and, accordingly, their carrying valuesapproximated their fair values.
As of December 31, 2012 and 2011, short-term borrowings consisted of:
2012 2011
Weighted WeightedAverage Average
Principal Rates Principal Rates
Overnight borrowing facilities . . . . . . . . $ 39,172 0.23% $6,538 1.26%Unsecured bank loans . . . . . . . . . . . . . 71,248 0.10% — n/a
$ 110,420 $6,538
Interest expense on short term borrowings for each of the three years ended December 31, 2012,2011 and 2010 was $579, $2,204 and $3,196, respectively.
112

Interactive Brokers Group, Inc. and Subsidiaries
Notes to Consolidated Financial Statements (Continued)
(In U.S. dollars (thousands), except shares and per share amounts, unless otherwise noted)
9. Senior Notes Payable
At December 31, 2011, IBG LLC had $101,411 of 3% senior notes outstanding. All senior noteshad either a 15-month or an 18-month original maturity. IBG LLC, solely at its option, could redeemthe senior notes at any time on or after a specified date in the third month or the sixth month,respectively, after the date on which the senior notes were issued and sold (the ‘‘Optional RedemptionDate’’), at a redemption price equal to 100% of the principal amount of the senior notes to beredeemed plus accrued interest.
In January 2012, the Company decided to discontinue the Senior Notes Program. It is theCompany’s intention that no new Senior Notes will be issued. All previously issued Senior Notes,$101,411 outstanding as of December 31, 2011, were redeemed prior to June 30, 2012.
10. Senior Secured Revolving Credit Facility
On May 17, 2012, IBG LLC entered into a $100 million three-year senior secured revolving creditfacility with Bank of America, N.A. as administrative agent and Citibank, N.A., as syndication agent.This credit facility replaced a similar two-year facility that expired on May 18, 2012.
IBG LLC is the sole borrower under this credit facility. The facility’s interest rate is indexed to theovernight federal funds rate or to the British Bankers Association LIBOR rate for the relevant term, atthe borrower’s option, and is secured by a first priority interest in all of the capital stock of each entityowned directly by IBG LLC (subject to customary limitations with respect to foreign subsidiaries). Thefacility may be used to finance working capital needs and general corporate purposes, includingdownstreaming funds to IBG LLC’s regulated broker-dealer subsidiaries as regulatory capital. Thisallows IBG LLC to take advantage of market opportunities when they arise, while maintainingsubstantial excess regulatory capital. The financial condition covenants contained in this credit facilityinclude the following:
• minimum consolidated shareholders’ equity, as defined, of $3.6 billion, with quarterly increasesequal to 25% of positive consolidated net income;
• maximum total debt to capitalization ratio of 30%;
• minimum liquidity ratio of 1.0 to 1.0; and
• maximum total debt to net regulatory capital ratio of 35%.
At December 31, 2012 and December 31, 2011, no borrowings were outstanding under this or thepredecessor credit facility and IBG LLC was in compliance with all of the covenants. At maturity,subject to meeting certain terms of the facility, the Company will have an option to convert the facilityto a one-year term loan.
113

Interactive Brokers Group, Inc. and Subsidiaries
Notes to Consolidated Financial Statements (Continued)
(In U.S. dollars (thousands), except shares and per share amounts, unless otherwise noted)
11. Other Income
The components of other income for the three years ended December 31, 2012, 2011 and 2010were:
2012 2011 2010
Payments for order flow . . . . . . . . . . . . . . . . . . . . . . $21,167 $ 23,597 $24,288Market data fees . . . . . . . . . . . . . . . . . . . . . . . . . . . 27,175 26,393 30,241Account activity fees . . . . . . . . . . . . . . . . . . . . . . . . . 13,404 11,088 —Exchange fee income . . . . . . . . . . . . . . . . . . . . . . . . 4,393 4,593 5,072Market maker incentives . . . . . . . . . . . . . . . . . . . . . . 988 1,002 2,471Non-market making gains (losses), net . . . . . . . . . . . . (458) (25,078) (6,325)Other, net . . . . . . . . . . . . . . . . . . . . . . . . . . . . . . . . 9,663 1,391 4,667
$76,332 $ 42,986 $60,414
Payments for order flow are earned from various options exchanges based upon options tradingvolume originated by the Operating Companies. Market data fees are charged to customers based uponmarket data services provided. This income is largely offset by the related cost to obtain the underlyingmarket data from third party vendors. Various exchanges pay the Company market maker incentives forits market making efforts on those exchanges. Gains and losses on non-market making securities aregenerated from investments in securities that are not held for the Group’s market making operations orfrom securities that are subject to restrictions.
12. Employee Incentive Plans
Return on Investment Dollar Units (‘‘ROI Dollar Units’’)
From 1998 through January 1, 2006, IBG LLC granted all non-member employees ROI DollarUnits, which are redeemable under the amended provisions of the plan, and in accordance withregulations issued by the Internal Revenue Service (Section 409A of the Internal Revenue Code). Uponredemption, the grantee is entitled to accumulated earnings on the face value of the certificate, but notthe actual face value. For grants made in 1998 and 1999, grantees may redeem the ROI Dollar Unitsafter vesting on the fifth anniversary of the date of their grant and prior to the tenth anniversary of thedate of their grant. For grants made between January 1, 2000 and January 1, 2005, grantees must electto redeem the ROI Dollar Units upon the fifth, seventh or tenth anniversary date. These ROI DollarUnits will vest upon the fifth anniversary of the date of their grant and will continue to accumulateearnings until the elected redemption date. For grants made on or after January 1, 2006, all ROIDollar Units shall vest on the fifth anniversary date of their grant and will be automatically redeemed.Subsequent to the IPO, no additional ROI Dollar Units have been or will be granted, and non-cashcompensation to employees will consist primarily of grants of shares of Common Stock as describedbelow under ‘‘2007 Stock Incentive Plan.’’
114

Interactive Brokers Group, Inc. and Subsidiaries
Notes to Consolidated Financial Statements (Continued)
(In U.S. dollars (thousands), except shares and per share amounts, unless otherwise noted)
12. Employee Incentive Plans (Continued)
As of December 31, 2012 and 2011, payables to employees for ROI Dollar Units were $7,624 and$10,088, respectively, all of which were vested. These amounts are included in accounts payable,accrued expenses and other liabilities in the consolidated statements of financial condition.Compensation expense for the ROI Dollar Unit plan, included in the consolidated statements ofcomprehensive income was $751, $1,499 and $1,573 for the years ended December 31, 2012, 2011 and2010 respectively.
2007 ROI Unit Stock Plan
In connection with the IPO, IBG, Inc. adopted the Interactive Brokers Group, Inc. 2007 ROI UnitStock Plan (the ‘‘ROI Unit Stock Plan’’). Under this plan, certain employees of the Group who heldROI Dollar Units, at the employee’s option, elected to invest their ROI Dollar Unit accumulatedearnings as of December 31, 2006 in shares of Common Stock. An aggregate of 1,271,009 shares ofCommon Stock (consisting of 1,250,000 shares issued under the ROI Unit Stock Plan and 21,009 sharesunder the 2007 Stock Incentive Plan, as described below), with a fair value at the date of grant of$38,143 were issued to IBG LLC and held as treasury stock, to be distributed to employees inaccordance with the following schedule and subject to the conditions below:
• 10% on the date of the IPO (or on the first anniversary of the IPO, in the case of U.S. ROIUnit holders who made the above-referenced elections after December 31, 2006); and
• an additional 15% on each of the first six anniversaries of the date of the IPO, assumingcontinued employment with IBG, Inc. and compliance with other applicable covenants.
Of the fair value at the date of grant, $17,806 represented the accumulated ROI Dollar Unit valueelected to be invested by employees in Common Stock and such amount was accrued for as ofDecember 31, 2006. The remainder is being ratably accrued as compensation expense by the Companyfrom the date of the IPO over the requisite service period represented by the aforementioneddistribution schedule. Compensation expense for the 2007 ROI Unit Stock Plan and related grantsunder the 2007 Stock Incentive Plan, net of the effect of forfeitures, included in the consolidatedstatements of comprehensive income for the years ended December 31, 2012, 2011 and 2010 was$3,555, $3,878 and $3,513, respectively. As of December 31, 2012, compensation costs for the ROI UnitStock Plan had been fully accrued.
2007 Stock Incentive Plan
Under the Interactive Brokers Group, Inc. 2007 Stock Incentive Plan (the ‘‘Stock Incentive Plan’’or ‘‘SIP’’), up to 20.0 million shares of common stock may be granted and issued to directors, officers,employees, contractors and consultants of IBG, Inc. and its subsidiaries. The purpose of the StockIncentive Plan is to promote IBG, Inc.’s long-term financial success by attracting, retaining andrewarding eligible participants.
The Stock Incentive Plan is administered by the Compensation Committee of IBG, Inc.’s Board ofDirectors. The Compensation Committee has discretionary authority to determine which employees areeligible to participate in the Stock Incentive Plan and establishes the terms and conditions of theawards, including the number of awards granted to each employee and all other terms and conditionsapplicable to such awards in individual grant agreements. Awards are expected to be made primarily
115

Interactive Brokers Group, Inc. and Subsidiaries
Notes to Consolidated Financial Statements (Continued)
(In U.S. dollars (thousands), except shares and per share amounts, unless otherwise noted)
12. Employee Incentive Plans (Continued)
through grants of Common Stock. Stock Incentive Plan awards are subject to issuance over time andmay be forfeited upon an employee’s termination of employment or violation of certain applicablecovenants prior to issuance, unless determined otherwise by the Compensation Committee.
The Stock Incentive Plan provides that, upon a change in control, the Compensation Committeemay, at its discretion, fully vest any granted but not yet earned awards under the Stock Incentive Plan,or provide that any such granted but not yet earned awards will be honored or assumed, or new rightssubstituted therefore by the new employer on a substantially similar basis and on terms and conditionssubstantially comparable to those of the Stock Incentive Plan.
IBG, Inc. granted awards under the Stock Incentive Plan in connection with the IPO and isexpected to continue to grant awards on or about December 31 of each year following the IPO, toeligible employees as part of an overall plan of equity compensation. Shares of common stock vest, andbecome distributable to employees in accordance with the following schedule:
• 10% on the first vesting date, which approximates the anniversary of the IPO; and
• an additional 15% on each of the following six anniversaries of the first vesting, assumingcontinued employment with IBG, Inc. and compliance with non-competition and otherapplicable covenants.
Awards granted to external directors vest, and are distributed, over a five-year period (20% peryear) commencing one year after the date of grant. 20,423 awards have been granted to the externaldirectors cumulatively since the IPO.
Stock Incentive Plan share grants (excluding 21,009 shares issued pursuant to the 2007 ROI UnitStock Plan above) and the related fair values at the date of grant were:
Fair Value atDate of Grant
Shares ($000’s)
In connection with IPO . . . . . . . . . . . . . . . . . . . . . . . . . . 927,943 $ 27,847July 31, 2007 . . . . . . . . . . . . . . . . . . . . . . . . . . . . . . . . . 16,665 404December 31, 2007 . . . . . . . . . . . . . . . . . . . . . . . . . . . . . 1,055,206 32,876December 31, 2008 . . . . . . . . . . . . . . . . . . . . . . . . . . . . . 2,065,432 35,600December 31, 2009 . . . . . . . . . . . . . . . . . . . . . . . . . . . . . 2,448,031 42,796December 31, 2010 . . . . . . . . . . . . . . . . . . . . . . . . . . . . . 2,513,738 43,255December 31, 2011 . . . . . . . . . . . . . . . . . . . . . . . . . . . . . 3,411,613 50,753January 6, 2012 . . . . . . . . . . . . . . . . . . . . . . . . . . . . . . . 1,215,866 18,411December 31, 2012 . . . . . . . . . . . . . . . . . . . . . . . . . . . . . 3,629,960 50,484
17,284,454 $302,426
116

Interactive Brokers Group, Inc. and Subsidiaries
Notes to Consolidated Financial Statements (Continued)
(In U.S. dollars (thousands), except shares and per share amounts, unless otherwise noted)
12. Employee Incentive Plans (Continued)
The following is a summary of Stock Plan activity for the period from January 1, 2010 throughDecember 31, 2012:
Shares
2007 Stock 2007 ROI UnitIncentive Plan Stock Plan
Shares Shares
Balance, December 31, 2009 . . . . . . . . . . . . . . . . . . . . . 5,641,054 733,562
Granted . . . . . . . . . . . . . . . . . . . . . . . . . . . . . . . . . . . 2,513,738 —Forfeited by employees . . . . . . . . . . . . . . . . . . . . . . . . (63,650) (2,179)Distributed to employees . . . . . . . . . . . . . . . . . . . . . . . (828,002) (186,770)
Balance, December 31, 2010 . . . . . . . . . . . . . . . . . . . . . 7,263,140 544,613
Granted . . . . . . . . . . . . . . . . . . . . . . . . . . . . . . . . . . . 3,411,613 —Forfeited by employees . . . . . . . . . . . . . . . . . . . . . . . . (91,843) (764)Distributed to employees . . . . . . . . . . . . . . . . . . . . . . . (1,173,916) (187,700)
Balance, December 31, 2011 . . . . . . . . . . . . . . . . . . . . . 9,408,994 356,149
Granted . . . . . . . . . . . . . . . . . . . . . . . . . . . . . . . . . . . 4,845,826 —Forfeited by employees . . . . . . . . . . . . . . . . . . . . . . . . (115,750) (500)Distributed to employees . . . . . . . . . . . . . . . . . . . . . . . (1,736,588) (186,360)
Balance, December 31, 2012 . . . . . . . . . . . . . . . . . . . . . 12,402,482 169,289
Estimated future grants under the Stock Incentive Plan are being accrued for ratably during eachyear under the ASC 718 ‘‘Graded Vesting’’ method. Compensation expense recognized in theconsolidated statements of comprehensive income for the years ended December 31, 2012, 2011 and2010, were $63,278, $45,308 and $38,187, respectively. Estimated future compensation costs forunvested awards at December 31, 2012 are $44.3 million.
Awards granted under the ROI Unit Stock Plan and the Stock Incentive Plan are subject toforfeiture in the event an employee ceases employment with the Company. The plans provide thatemployees who discontinue employment with the Company without cause and continue to meet theterms of the plans’ post-employment provisions will forfeit 50% of unvested previously granted awardsunless the employee is over the age of 59, in which case the employee would be eligible to receive100% of unvested awards previously granted. Distributions of remaining awards granted on or beforeJanuary 1, 2009 to former employees will occur within 90 days of the anniversary of the termination ofemployment date over a five (5) year vesting schedule, 12.5% in each of the first four years and 50% inthe fifth year. Distributions of remaining awards granted on or after January 1, 2010 to formeremployees will occur over the remaining vesting schedule applicable to each grant. ThroughDecember 31, 2012, a total of 44,546 shares have been distributed under these post-employmentprovisions. These distributions are included in the Stock Plans activity tables above.
117

Interactive Brokers Group, Inc. and Subsidiaries
Notes to Consolidated Financial Statements (Continued)
(In U.S. dollars (thousands), except shares and per share amounts, unless otherwise noted)
13. Income Taxes
Income tax expense for the three years ended December 31, 2012, 2011 and 2010 differs from theU.S. federal statutory rate due to the differing effective tax rates in foreign, state and local jurisdictionswhere certain operating companies are subject to corporate taxation. Deferred income taxes arise dueto the amortization of the deferred tax assets recognized in connection with the Common Stockofferings (Note 4), valuation of THE’s financial assets and liabilities and temporary differences arisingfrom the deductibility of compensation and depreciation expenses in different time periods for bookand tax return purposes.
For the three years ended December 31, 2012, 2011 and 2010, the provision for income taxesconsisted of:
2012 2011 2010
Current:Federal . . . . . . . . . . . . . . . . . . . . . . . . . . . . . . . . $ 1,379 $ 3,221 $ 20,604State and local . . . . . . . . . . . . . . . . . . . . . . . . . . . 167 675 161Foreign . . . . . . . . . . . . . . . . . . . . . . . . . . . . . . . . 10,684 24,805 33,652
Total current . . . . . . . . . . . . . . . . . . . . . . . . . . . 12,230 28,701 54,417
Deferred:Federal . . . . . . . . . . . . . . . . . . . . . . . . . . . . . . . . 16,765 17,678 18,915State and local . . . . . . . . . . . . . . . . . . . . . . . . . . . 27 (28) (25)Foreign . . . . . . . . . . . . . . . . . . . . . . . . . . . . . . . . 992 7,538 (13,026)
Total deferred . . . . . . . . . . . . . . . . . . . . . . . . . . 17,784 25,188 5,864
$30,014 $53,889 $ 60,281
A reconciliation of the statutory U.S. Federal income tax rate of 35% to the Company’s effectivetax rate is set forth below:
2012 2011 2010
U.S. Statutory Tax Rate . . . . . . . . . . . . . . . . . . . . . . . . 35.0% 35.0% 35.0%Less: rate attributable to noncontrolling interests . . . . . �30.3% �29.5% �29.8%State, local and foreign taxes, net of federal benefit . . . 1.0% 1.8% 12.5%
5.7% 7.3% 17.7%
118

Interactive Brokers Group, Inc. and Subsidiaries
Notes to Consolidated Financial Statements (Continued)
(In U.S. dollars (thousands), except shares and per share amounts, unless otherwise noted)
13. Income Taxes (Continued)
Significant components of the Company’s deferred tax assets (liabilities), which are respectivelyreported in other assets and in accounts payable, accrued expenses and other liabilities in theconsolidated statements of financial condition, as of December 31, 2012 and 2011 were as follows:
2012 2011 2010
Deferred tax assets:Deferred tax asset arising from acquisition of
interests in IBG LLC . . . . . . . . . . . . . . . . . . . $281,615 $297,881 $313,562Deferred compensation . . . . . . . . . . . . . . . . . . . 7,309 5,078 4,736Other . . . . . . . . . . . . . . . . . . . . . . . . . . . . . . . . 1,135 182 1,380
Total deferred tax assets . . . . . . . . . . . . . . . . . . . . $290,059 $303,141 $319,678
Deferred tax liabilities:Foreign, primarily THE . . . . . . . . . . . . . . . . . . . $ 14,022 $ 11,573 $ 7,937Other comprehensive income . . . . . . . . . . . . . . . 282 10,454 12,284Other . . . . . . . . . . . . . . . . . . . . . . . . . . . . . . . . — 4,100 54
Total deferred tax liabilities . . . . . . . . . . . . . . . . . . 14,304 26,127 20,275Net deferred tax assets . . . . . . . . . . . . . . . . . . . . . $275,755 $277,014 $299,403
At December 31, 2012, accumulated earnings held by non-U.S. subsidiaries totaled $969.8 million.Of this amount, approximately $380.6 million is attributable to earnings of our foreign subsidiaries thatare considered ‘‘pass-through’’ entities for U.S. income tax purposes. Since the Company accounts forU.S. income taxes on these earnings on a current basis, no additional U.S. tax consequences wouldresult from the repatriation of these earnings other than that which would be due arising from currencyfluctuations between the time the earnings are reported for U.S. tax purposes and when they areremitted. With respect to certain of these subsidiaries’ accumulated earnings (approximately $297.5 asof December 31, 2012), repatriation would result in additional foreign taxes in the form of dividendwithholding tax imposed on the recipient of the distribution or dividend distribution tax imposed on thepayor of the distribution. The Company has not provided for its proportionate share of these additionalforeign taxes as it does not intend to repatriate these earnings in the foreseeable future. For the samereason, the Company has not provided deferred U.S. tax on cumulative translation adjustmentsassociated with these earnings.
The remainder of the accumulated earnings are attributable to non-U.S. subsidiaries that are notconsidered ‘‘pass-through’’ entities for U.S. tax purposes. The Company’s U.S. tax basis in the stock ofmost of these entities exceeds its book basis. It is therefore not permitted to establish a deferred taxasset pursuant to ASC 740 as this difference will not reverse in the foreseeable future. In the instancesin which the Company’s book basis exceeds its U.S. tax basis, no deferred tax liability has beenestablished as the Company considers the earnings of those entities to be indefinitely reinvested.
In December 2010, THE declared a dividend of $990.3 million to IBG LLC (Note 4). TheCompany recognized income tax expense, net of available foreign tax credits, of $24.2 million on itsproportionate share of this dividend. When filing its 2010 U.S. Federal Income Tax Returns, theCompany captured additional foreign tax credits of $5.3 million.
119

Interactive Brokers Group, Inc. and Subsidiaries
Notes to Consolidated Financial Statements (Continued)
(In U.S. dollars (thousands), except shares and per share amounts, unless otherwise noted)
13. Income Taxes (Continued)
As of and for the years ended December 31, 2012 and 2011, the Company had no unrecognizedtax liabilities as defined under ASC 740, Income Taxes and no valuation allowances on deferred taxassets were required. The Company is subject to taxation in the United States and various states andforeign jurisdictions. As of December 31, 2012, the Company’s tax years for 2009 through 2012 aresubject to examination by the respective tax authorities. As of December 31, 2012, the Company is nolonger subject to U.S. Federal, state, local or foreign examinations by tax authorities for years before2008.
The Taxpayer Relief Act of 2012, signed into law on January 2, 2013, brought about significant taxchanges, including, but not limited to, the retroactive extension of several temporary tax incentives forbusinesses. The business tax incentives extended through 2013 include bonus depreciation, 15-yearstraight line cost recovery for qualified leasehold improvements, research and development tax creditand the exception for active financing income under Subpart F and look-through treatment ofpayments between related controlled foreign corporations. The effects of the change in tax law,currently estimated to be a benefit of $596, will be recognized in our first quarter 2013 results, thequarter that the law was enacted.
14. Property and Equipment
Property and equipment, which is included in other assets in the consolidated statements offinancial condition, is comprised of leasehold improvements, computer hardware, software developedfor the Company’s internal use and office furniture and equipment. At December 31, 2012 and 2011,property and equipment consisted of:
2012 2011
Leasehold improvements . . . . . . . . . . . . . . . . . . . . . . . . . . . . $ 23,114 $ 26,613Computer equipment . . . . . . . . . . . . . . . . . . . . . . . . . . . . . . . 10,867 11,691Internally developed software . . . . . . . . . . . . . . . . . . . . . . . . . 35,020 32,116Office furniture and equipment . . . . . . . . . . . . . . . . . . . . . . . 4,273 5,702
73,274 76,122Less—accumulated depreciation and amortization . . . . . . . . . . (38,607) (40,183)
Property and equipment , net . . . . . . . . . . . . . . . . . . . . . . . . . $ 34,667 $ 35,939
Depreciation and amortization of $19,269, $18,700 and $18,702 for the three years endedDecember 31, 2012, 2011 and 2010, respectively, is included in occupancy, depreciation andamortization expenses in the consolidated statements of comprehensive income.
15. Commitments, Contingencies and Guarantees
Litigation
The Company is subject to certain pending and threatened legal actions which arise out of thenormal course of business. Litigation is inherently unpredictable, particularly in proceedings whereclaimants seek substantial or indeterminate damages, or which are in their early stages. IBG, Inc. hasnot been able to quantify the actual loss or range of loss related to such legal proceedings, the manner
120

Interactive Brokers Group, Inc. and Subsidiaries
Notes to Consolidated Financial Statements (Continued)
(In U.S. dollars (thousands), except shares and per share amounts, unless otherwise noted)
15. Commitments, Contingencies and Guarantees (Continued)
in which they will be resolved, the timing of final resolution or the ultimate settlement. It is the opinionof management that the resolution of these actions will not have a material effect, if any, on ourbusiness or financial condition, but may have a material impact on the results of operations for a givenperiod.
On February 3, 2010, Trading Technologies International, Inc. (‘‘Trading Technologies’’) filed acomplaint in the United States District Court for the Northern District of Illinois, Eastern Division,against Interactive Brokers Group, Inc., IBG LLC, Holdings, and Interactive Brokers LLC. Thereafter,Trading Technologies dismissed Interactive Brokers Group, Inc. and Holdings from the case, leavingonly IBG LLC and Interactive Brokers LLC as defendants (‘‘Defendants’’). The operative complaint, asamended, alleges that the Defendants have infringed and continue to infringe twelve U.S. patents heldby Trading Technologies. Trading Technologies is seeking, among other things, unspecified damages andinjunctive relief. The case is in the early stages and discovery has yet to begin. While it is too early topredict the outcome of the matter, we believe we have meritorious defenses to the allegations made inthe complaint and intend to defend ourselves vigorously against them. However, litigation is inherentlyuncertain and there can be no guarantee that the Company will prevail or that the litigation can besettled on favorable terms.
IBG, Inc. accounts for potential losses related to litigation in accordance with ASC 450,Contingencies. As of December 31, 2012 and 2011, reserves provided for potential losses related tolitigation matters were not material.
Leases
Operating Companies have non-cancelable operating leases covering office space. All but one ofthe office space leases are subject to escalation clauses based on specified costs incurred by therespective landlords and contain renewal elections. Rent expense calculated on a straight-line basis forthe Group was $13,338, $12,751 and $12,006 for the three years ended December 31, 2012, 2011 and2010, respectively, and is reported in occupancy, depreciation and amortization expenses in theconsolidated statements of comprehensive income. As of December 31, 2012, the Company’s minimumannual lease commitments were as follows:
Year
2013 . . . . . . . . . . . . . . . . . . . . . . . . . . . . . . . . . . . . . . . . . . . . . . . . . . . . $12,6382014 . . . . . . . . . . . . . . . . . . . . . . . . . . . . . . . . . . . . . . . . . . . . . . . . . . . . 9,8732015 . . . . . . . . . . . . . . . . . . . . . . . . . . . . . . . . . . . . . . . . . . . . . . . . . . . . 8,8922016 . . . . . . . . . . . . . . . . . . . . . . . . . . . . . . . . . . . . . . . . . . . . . . . . . . . . 8,0932017 . . . . . . . . . . . . . . . . . . . . . . . . . . . . . . . . . . . . . . . . . . . . . . . . . . . . 7,068Thereafter . . . . . . . . . . . . . . . . . . . . . . . . . . . . . . . . . . . . . . . . . . . . . . . 7,748
$54,312
Guarantees
Certain of the Operating Companies provide guarantees to securities clearing houses andexchanges which meet the accounting definition of a guarantee under ASC 460, Guarantees. Under the
121
Interactive Brokers Group, Inc. and Subsidiaries
Notes to Consolidated Financial Statements (Continued)
(In U.S. dollars (thousands), except shares and per share amounts, unless otherwise noted)
15. Commitments, Contingencies and Guarantees (Continued)
standard membership agreement, members are required to guarantee collectively the performance ofother members. Under the agreements, if another member becomes unable to satisfy its obligations tothe clearinghouse, other members would be required to meet shortfalls. In the opinion of management,the Operating Companies’ liability under these arrangements is not quantifiable and could exceed thecash and securities they have posted as collateral. However, the potential for these OperatingCompanies to be required to make payments under these arrangements is remote. Accordingly, nocontingent liability is carried in the consolidated statements of financial condition for thesearrangements.
In connection with its retail brokerage business, IB LLC performs securities and commoditiesexecution, clearance and settlement on behalf of its customers for whom it commits to settle tradessubmitted by such customers with the respective clearing houses. If a customer fails to fulfill itsobligation, IB LLC must fulfill the customer’s obligation with the trade counterparty. No contingentliability is carried on the consolidated statements of financial condition for such customer obligations.
Other Commitments
Certain clearing houses and clearing banks and firms used by certain Operating Companies aregiven a security interest in certain assets of those Operating Companies held by those clearingorganizations. These assets may be applied to satisfy the obligations of those Operating Companies tothe respective clearing organizations.
16. Segment and Geographic Information
IBG, Inc. operates in two business segments, market making and electronic brokerage. TheCompany conducts its market making business principally through its Timber Hill subsidiaries on theworld’s leading exchanges and market centers, primarily in exchange-traded equities, equity options andequity-index options and futures. IBG, Inc. conducts its electronic brokerage business through itsInteractive Brokers subsidiaries, which provide electronic execution and clearing services to customersworldwide.
Significant transactions and balances between the Operating Companies occur, primarily as a resultof certain Operating Companies holding exchange or clearing organization memberships, which areutilized to provide execution and clearing services to affiliates. Charges for transactions betweensegments are designed to approximate full costs. Intra-segment and intra-region income and expensesand related balances have been eliminated in this segment and geographic information to accuratelyreflect the external business conducted in each segment or geographical region. Corporate itemsinclude non-allocated corporate income and expenses that are not attributed to segments forperformance measurement, corporate assets and eliminations.
122

Interactive Brokers Group, Inc. and Subsidiaries
Notes to Consolidated Financial Statements (Continued)
(In U.S. dollars (thousands), except shares and per share amounts, unless otherwise noted)
16. Segment and Geographic Information (Continued)
Management believes that the following information by business segment provides a reasonablerepresentation of each segment’s contribution to total net revenues and income before income taxes forthe three years ended December 31, 2012, and to total assets as of December 31, 2012, 2011 and 2010:
Year ended December 31,
2012 2011 2010
Net revenues:Electronic brokerage . . . . . . . . . . . . . . . . . . . . $ 670,407 $ 691,475 $547,272Market making . . . . . . . . . . . . . . . . . . . . . . . . 459,626 698,471 379,180Corporate and eliminations . . . . . . . . . . . . . . . 487 (31,634) (4,344)
Total net revenues . . . . . . . . . . . . . . . . . . . . . . $1,130,520 $1,358,312 $922,108
Income before income taxes:Electronic brokerage . . . . . . . . . . . . . . . . . . . . $ 341,704 $ 370,325 $273,996Market making . . . . . . . . . . . . . . . . . . . . . . . . 188,613 413,142 88,194Corporate and eliminations . . . . . . . . . . . . . . . (3,317) (42,399) (24,775)
Total income before income taxes . . . . . . . . . . . $ 527,000 $ 741,068 $337,415
December 31, December 31, December 31,2012 2011 2010
Segment assets:Electronic brokerage . . . . . . . . . . . . . . . . $25,741,495 $20,707,771 $17,356,632Market making . . . . . . . . . . . . . . . . . . . . 12,730,811 14,389,427 14,609,564Corporate and eliminations . . . . . . . . . . . . (5,272,749) (4,692,833) (3,466,157)
Total assets . . . . . . . . . . . . . . . . . . . . . . $33,199,557 $30,404,365 $28,500,039
The Company operates its automated global business in U.S. and international markets on morethan 100 exchanges and market centers. A significant portion of IBG, Inc.’s net revenues are generatedby subsidiaries operating outside the United States. International operations are comprised of marketmaking and electronic brokerage activities in 23 countries in Europe, Asia and North America (outside
123

Interactive Brokers Group, Inc. and Subsidiaries
Notes to Consolidated Financial Statements (Continued)
(In U.S. dollars (thousands), except shares and per share amounts, unless otherwise noted)
16. Segment and Geographic Information (Continued)
the United States). The following table presents total net revenues and income before income taxes bygeographic area for the three years ended December 31, 2012:
Year ended December 31,
2012 2011 2010
Net revenues:United States . . . . . . . . . . . . . . . . . . . . . . . . . $ 836,910 $ 980,146 $753,983International . . . . . . . . . . . . . . . . . . . . . . . . . . 294,519 418,024 176,854Corporate and eliminations . . . . . . . . . . . . . . . (909) (39,858) (8,729)
Total net revenues . . . . . . . . . . . . . . . . . . . . . . $1,130,520 $1,358,312 $922,108
Income before income taxes:United States . . . . . . . . . . . . . . . . . . . . . . . . . $ 443,016 $ 608,709 $407,481International . . . . . . . . . . . . . . . . . . . . . . . . . . 88,462 182,635 (41,197)Corporate and eliminations . . . . . . . . . . . . . . . (4,478) (50,276) (28,869)
Total income before income taxes . . . . . . . . . . . $ 527,000 $ 741,068 $337,415
17. Regulatory Requirements
At December 31, 2012, aggregate excess regulatory capital for all of the Operating Companies was$2.56 billion.
TH LLC and IB LLC are subject to the Uniform Net Capital Rule (Rule 15c3-1) under theExchange Act and the CFTC’s minimum financial requirements (Regulation 1.17), and THE is subjectto the Swiss Financial Market Supervisory Authority eligible equity requirement. Additionally, THSHKis subject to the Hong Kong Securities Futures Commission liquid capital requirement, THA is subjectto the Australian Stock Exchange liquid capital requirement, THC and IBC are subject to theInvestment Industry Regulatory Organization of Canada risk adjusted capital requirement, IBUK issubject to the U.K. Financial Services Authority financial resources requirement, IBI is subject to theNational Stock Exchange of India net capital requirements and IBSJ is subject to the JapaneseFinancial Supervisory Agency capital requirements. The following table summarizes capital, capitalrequirements and excess regulatory capital (millions):
Net Capital/Eligible Equity Requirement Excess
IB LLC . . . . . . . . . . . . . . . . . . . . . . . . . . . . . . $1,633 $219 $1,414TH LLC . . . . . . . . . . . . . . . . . . . . . . . . . . . . . 394 42 352THE . . . . . . . . . . . . . . . . . . . . . . . . . . . . . . . . 646 211 435Other regulated Operating Companies . . . . . . . . 379 24 355
$3,052 $496 $2,556
At December 31, 2012, all of the regulated Operating Companies were in compliance with theirrespective regulatory capital requirements.
124

Interactive Brokers Group, Inc. and Subsidiaries
Notes to Consolidated Financial Statements (Continued)
(In U.S. dollars (thousands), except shares and per share amounts, unless otherwise noted)
17. Regulatory Requirements (Continued)
Regulatory capital requirements could restrict the Operating Companies from expanding theirbusiness and declaring dividends if their net capital does not meet regulatory requirements. Also,certain entities within IBG, Inc. are subject to other regulatory restrictions and requirements.
18. Related Party Transactions
Receivable from affiliate represents amounts advanced to Holdings and payable to affiliaterepresents amounts payable to Holdings under the Tax Receivable Agreement (Note 4).
Included in receivable from and payable to customers in the accompanying consolidated statementsof financial condition as of December 31, 2012 and 2011 were accounts receivable from directors,officers and their affiliates of $1,139 and $1,291 and payables of $744,990 and $510,623, respectively.
19. Subsequent Events
As required by ASC 855-10-50, the Company has evaluated subsequent events for adjustment to ordisclosure in its consolidated financial statements through the date the consolidated financial statementswere issued.
No recordable or disclosable events, not otherwise reported in these financial statements or thenotes thereto, occurred.
*****
125
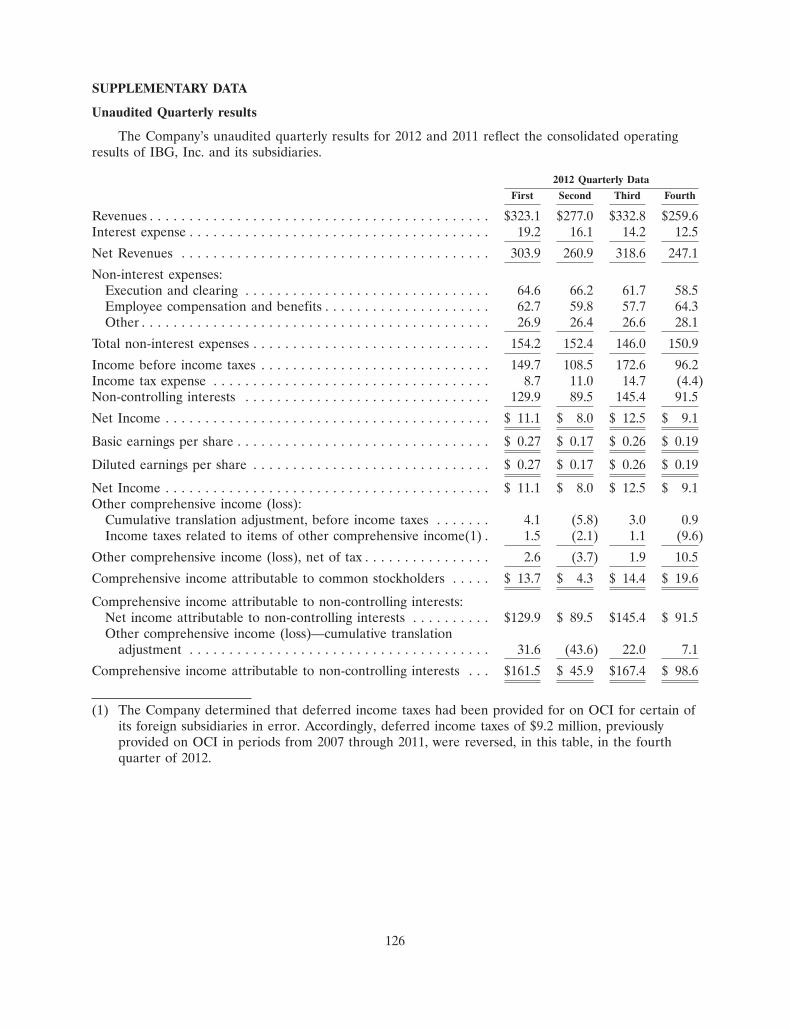
SUPPLEMENTARY DATA
Unaudited Quarterly results
The Company’s unaudited quarterly results for 2012 and 2011 reflect the consolidated operatingresults of IBG, Inc. and its subsidiaries.
2012 Quarterly Data
First Second Third Fourth
Revenues . . . . . . . . . . . . . . . . . . . . . . . . . . . . . . . . . . . . . . . . . . . $323.1 $277.0 $332.8 $259.6Interest expense . . . . . . . . . . . . . . . . . . . . . . . . . . . . . . . . . . . . . . 19.2 16.1 14.2 12.5
Net Revenues . . . . . . . . . . . . . . . . . . . . . . . . . . . . . . . . . . . . . . . 303.9 260.9 318.6 247.1
Non-interest expenses:Execution and clearing . . . . . . . . . . . . . . . . . . . . . . . . . . . . . . . 64.6 66.2 61.7 58.5Employee compensation and benefits . . . . . . . . . . . . . . . . . . . . . 62.7 59.8 57.7 64.3Other . . . . . . . . . . . . . . . . . . . . . . . . . . . . . . . . . . . . . . . . . . . . 26.9 26.4 26.6 28.1
Total non-interest expenses . . . . . . . . . . . . . . . . . . . . . . . . . . . . . . 154.2 152.4 146.0 150.9
Income before income taxes . . . . . . . . . . . . . . . . . . . . . . . . . . . . . 149.7 108.5 172.6 96.2Income tax expense . . . . . . . . . . . . . . . . . . . . . . . . . . . . . . . . . . . 8.7 11.0 14.7 (4.4)Non-controlling interests . . . . . . . . . . . . . . . . . . . . . . . . . . . . . . . 129.9 89.5 145.4 91.5
Net Income . . . . . . . . . . . . . . . . . . . . . . . . . . . . . . . . . . . . . . . . . $ 11.1 $ 8.0 $ 12.5 $ 9.1
Basic earnings per share . . . . . . . . . . . . . . . . . . . . . . . . . . . . . . . . $ 0.27 $ 0.17 $ 0.26 $ 0.19
Diluted earnings per share . . . . . . . . . . . . . . . . . . . . . . . . . . . . . . $ 0.27 $ 0.17 $ 0.26 $ 0.19
Net Income . . . . . . . . . . . . . . . . . . . . . . . . . . . . . . . . . . . . . . . . . $ 11.1 $ 8.0 $ 12.5 $ 9.1Other comprehensive income (loss):
Cumulative translation adjustment, before income taxes . . . . . . . 4.1 (5.8) 3.0 0.9Income taxes related to items of other comprehensive income(1) . 1.5 (2.1) 1.1 (9.6)
Other comprehensive income (loss), net of tax . . . . . . . . . . . . . . . . 2.6 (3.7) 1.9 10.5
Comprehensive income attributable to common stockholders . . . . . $ 13.7 $ 4.3 $ 14.4 $ 19.6
Comprehensive income attributable to non-controlling interests:Net income attributable to non-controlling interests . . . . . . . . . . $129.9 $ 89.5 $145.4 $ 91.5Other comprehensive income (loss)—cumulative translation
adjustment . . . . . . . . . . . . . . . . . . . . . . . . . . . . . . . . . . . . . . 31.6 (43.6) 22.0 7.1
Comprehensive income attributable to non-controlling interests . . . $161.5 $ 45.9 $167.4 $ 98.6
(1) The Company determined that deferred income taxes had been provided for on OCI for certain ofits foreign subsidiaries in error. Accordingly, deferred income taxes of $9.2 million, previouslyprovided on OCI in periods from 2007 through 2011, were reversed, in this table, in the fourthquarter of 2012.
126

2011 Quarterly Data
First Second Third Fourth
Revenues . . . . . . . . . . . . . . . . . . . . . . . . . . . . . . . . . . . . . . . . . . . $385.6 $321.4 $408.9 $328.7Interest expense . . . . . . . . . . . . . . . . . . . . . . . . . . . . . . . . . . . . . . 17.7 24.5 23.3 20.8
Net Revenues . . . . . . . . . . . . . . . . . . . . . . . . . . . . . . . . . . . . . . . 367.9 296.9 385.6 307.9
Non-interest expenses:Execution and clearing . . . . . . . . . . . . . . . . . . . . . . . . . . . . . . . 66.2 66.1 82.1 66.9Employee compensation and benefits . . . . . . . . . . . . . . . . . . . . . 52.4 52.6 56.2 55.1Other . . . . . . . . . . . . . . . . . . . . . . . . . . . . . . . . . . . . . . . . . . . . 27.3 29.1 29.5 33.7
Total non-interest expenses . . . . . . . . . . . . . . . . . . . . . . . . . . . . . . 145.9 147.8 167.8 155.7
Income before income taxes . . . . . . . . . . . . . . . . . . . . . . . . . . . . . 222.0 149.1 217.8 152.2Income tax expense . . . . . . . . . . . . . . . . . . . . . . . . . . . . . . . . . . . 18.7 12.5 15.3 7.4Non-controlling interests . . . . . . . . . . . . . . . . . . . . . . . . . . . . . . . 187.0 127.1 180.0 131.2
Net Income . . . . . . . . . . . . . . . . . . . . . . . . . . . . . . . . . . . . . . . . . $ 16.3 $ 9.5 $ 22.5 $ 13.6
Basic earnings per share . . . . . . . . . . . . . . . . . . . . . . . . . . . . . . . . $ 0.39 $ 0.22 $ 0.48 $ 0.29
Diluted earnings per share . . . . . . . . . . . . . . . . . . . . . . . . . . . . . . $ 0.39 $ 0.22 $ 0.48 $ 0.29
Net Income . . . . . . . . . . . . . . . . . . . . . . . . . . . . . . . . . . . . . . . . . $ 16.3 $ 9.5 $ 22.5 $ 13.6Other comprehensive income (loss):
Cumulative translation adjustment, before income taxes . . . . . . . 1.9 6.1 (10.1) (2.4)Income taxes related to items of other comprehensive income . . . 0.7 2.2 (3.7) (1.0)
Other comprehensive income (loss), net of tax . . . . . . . . . . . . . . . . 1.2 3.9 (6.4) (1.4)
Comprehensive income attributable to common stockholders . . . . . $ 17.5 $ 13.4 $ 16.1 $ 12.2
Comprehensive income attributable to non-controlling interests:Net income attributable to non-controlling interests . . . . . . . . . . $187.0 $127.1 $180.0 $131.2Other comprehensive income (loss)—cumulative translation
adjustment . . . . . . . . . . . . . . . . . . . . . . . . . . . . . . . . . . . . . . 16.6 50.1 (75.9) (18.6)
Comprehensive income attributable to non-controlling interests . . . $203.6 $177.2 $104.1 $112.6
127

ITEM 9. CHANGES IN AND DISAGREEMENTS WITH ACCOUNTANTS ON ACCOUNTING ANDFINANCIAL DISCLOSURE
None.
ITEM 9A. CONTROLS AND PROCEDURES
Restatement of Prior Period Financial Statements Filed
As reported in the Company’s Amended 2011 Annual Report on Form 10-K/A, filed on August 31,2012, on August 13, 2012, the Audit Committee of the Board of Directors of the Company andmanagement concluded that the consolidated financial statements for the three years endedDecember 31, 2011 included in the Company’s 2011 Annual Report on Form 10-K filed February 29,2012 (the ‘‘Original Filing.’’) should no longer be relied upon and should be restated.
This restatement was made as a result of the Company concluding that its interpretation ofaccounting guidance (contained in Financial Accounting Standards Board (‘‘FASB’’) AccountingStandards Codification (‘‘ASC or the ‘‘Codification’’) 480-10-S99, formerly FASB Emerging Issues TaskForce Topic D-98) pertaining to cash redemption provisions regarding redeemable noncontrollinginterests had been incorrect, resulting in an error in previously issued consolidated financial statements.This error had no effect on reported net income attributable to common stockholders or cash flows,but did affect the classification of redeemable noncontrolling interests in IBG LLC attributable toHoldings from the Company’s May 3, 2007 initial public offering through June 6, 2012, as described inNote 21 to the consolidated financial statements contained in Part II, Item 8 of the Company’sAmended 2011 Annual Report. As a result of this change in the classification of redeemablenoncontrolling interests, the calculation of earnings per share was affected.
In addition to the change in classification relating to the reporting of redeemable noncontrollinginterests attributable to Holdings described above, the Company corrected other errors that had beenpreviously identified that affected previously issued financial statements. These items included errors inrecording share issuances under stock compensation award plans, which was corrected in connectionwith the preparation of the Company’s Quarterly Report on Form 10-Q for the quarter endedMarch 31, 2012 and adjustments to record the timely recognition of the effect of equity award planforfeiture provisions, which error was corrected in the Company’s Original Filing. Both of thesecorrections were disclosed as immaterial restatements in the respective original filings.
Evaluation of Disclosure Controls and Procedures
The Company has evaluated, under the supervision and with the participation of management,including the Chief Executive Officer (‘‘CEO’’) and Chief Financial Officer (‘‘CFO’’), the effectivenessof its disclosure controls and procedures, as defined in Rules 13a-15(e) and 15d-15(e) of the ExchangeAct, as of December 31, 2012. Based on that evaluation, the CEO and CFO have concluded that theCompany’s disclosure controls and procedures were not effective as of December 31, 2012 due to amaterial weakness that exists within the Company’s internal control over financial reporting related tothe review and interpretation of complex accounting issues. A material weakness is a deficiency, or acombination of deficiencies, in internal control over financial reporting, such that there is a reasonablepossibility that a material misstatement of the Company’s annual or interim financial statements willnot be prevented or detected on a timely basis.
Notwithstanding the material weakness described above, the Company has performed additionaldetailed procedures and analysis and other post-closing procedures during the preparation of theCompany’s consolidated financial statements, and our management has concluded that the Company’sconsolidated financial statements contained in this Annual Report on Form 10-K present fairly the
128

Company’s financial condition, results of operations and cash flows as of December 31, 2012 and forthe year then ended in all material respects, in accordance with U.S. GAAP.
Management’s Assessment of Internal Control Over Financial Reporting
The Company’s management is responsible for establishing and maintaining adequate internalcontrol over financial reporting. The Company’s internal control over financial reporting is a processdesigned under the supervision of the Company’s CEO and CFO to provide reasonable assuranceregarding reliability of financial reporting and preparation of the Company’s consolidated financialstatements for external reporting purposes in accordance with U.S. GAAP.
Under the supervision and with the participation of the Company’s CEO and the CFO, andincluding consideration of the implementation of the Remediation Plan described in the followingsection, management has evaluated the effectiveness of the design and operation of the Company’sdisclosure controls and procedures pursuant to Exchange Act Rule 13a-15, as of December 31, 2012using the criteria set forth by the Committee of Sponsoring Organizations of the Treadway Commission(‘‘COSO’’) in Internal Control-Integrated Framework. Based on management’s assessment and giventhe insufficient amount of time to implement fully the remediation plan, management has concludedthat the Company’s internal control over financial reporting related to the review and interpretation ofcomplex accounting issues was not effective as of December 31, 2012.
The effectiveness of the Company’s internal control over financial reporting as of December 31,2012, has been audited by Deloitte & Touche LLP, an independent registered public accounting firm, asstated in their report which appears herein.
Remediation Plan
Management is actively addressing and has made significant progress toward remediating the abovematerial weakness, employing an approach that is aimed at creating a robust framework for the designand implementation of all relevant controls. The steps taken to improve the Company’s internal controlover financial reporting related to the review and interpretation of complex accounting issues includethe following:
Actions taken regarding restatement issues
• Implemented a comprehensive review of the Company’s accounting for noncontrolling interestsand stock compensation.
• Reviewed and amended the Exchange Agreement on June 6, 2012 eliminating the cashredemption option.
• Requested and received an interpretation of this accounting issue from the Office of the ChiefAccountant of the SEC to clarify the requirements under this accounting guidance.
Remediation plan
• Enhanced the existing policy requiring a quarterly review by the Chief Financial Officer(‘‘CFO’’) and Chief Accounting Officer (‘‘CAO’’) of significant transactions and officialaccounting guidance applied to the Company’s financial statements. The primary element of thisenhancement was the formation of a formal Accounting Policy Committee (the ‘‘APC’’) inSeptember 2012, comprised of nine (9) experienced subject matter experts from within theCompany’s accounting, tax and regulatory disciplines, and includes the CFO and CAO. The APCis responsible for assessing the possible effects of such transactions and accounting guidance onthe Company’s financial statements and to report the results of its assessments to managementand to the Audit Committee.
129

• The results of these assessments have been and will be reviewed quarterly with the Company’sAudit Committee and, where the assessments indicate that further research and evaluation arerequired, the CFO and the CAO will recommend to the Audit Committee whether they believethe Company has sufficient professional resources to address the issues internally or if externalprofessional resources are required.
• Established a policy requiring consideration of consultation with accounting policy or othersubject matter experts, not affiliated with the Company’s independent accountants, on futurecomplex accounting interpretations should they arise from the above assessments.
• When further research and evaluation of accounting policy issues is undertaken, whetherconducted internally or through external consultation with accounting policy or other experts,the results of such research and evaluation will be reported to the Company’s Audit Committee.
In addition, under the direction of the Audit Committee, management will continue to review andmake necessary changes to the overall design of the Company’s internal control environment, as well asto policies and procedures to improve the overall effectiveness of internal control over financialreporting.
Changes to Internal Control Over Financial Reporting
There have been no changes in our internal control over financial reporting other than thosedescribed above for the year ended December 31, 2012 that have materially affected, or are reasonablylikely to materially affect, our internal control over financial reporting.
130

REPORT OF INDEPENDENT REGISTERED PUBLIC ACCOUNTING FIRM
To the Board of Directors and Stockholders ofInteractive Brokers Group, Inc.Greenwich, CT
We have audited the internal control over financial reporting of Interactive Brokers Group, Inc.and subsidiaries (the ‘‘Company’’) as of December 31, 2012, based on criteria established in InternalControl—Integrated Framework issued by the Committee of Sponsoring Organizations of the TreadwayCommission. The Company’s management is responsible for maintaining effective internal control overfinancial reporting and for its assessment of the effectiveness of internal control over financialreporting, included in the accompanying Management’s Report on Internal Control over FinancialReporting. Our responsibility is to express an opinion on the Company’s internal control over financialreporting based on our audit.
We conducted our audit in accordance with the standards of the Public Company AccountingOversight Board (United States). Those standards require that we plan and perform the audit to obtainreasonable assurance about whether effective internal control over financial reporting was maintainedin all material respects. Our audit included obtaining an understanding of internal control overfinancial reporting, assessing the risk that a material weakness exists, testing and evaluating the designand operating effectiveness of internal control based on the assessed risk, and performing such otherprocedures as we considered necessary in the circumstances. We believe that our audit provides areasonable basis for our opinion.
A company’s internal control over financial reporting is a process designed by, or under thesupervision of, the company’s principal executive and principal financial officers, or persons performingsimilar functions, and effected by the company’s board of directors, management, and other personnelto provide reasonable assurance regarding the reliability of financial reporting and the preparation offinancial statements for external purposes in accordance with generally accepted accounting principles.A company’s internal control over financial reporting includes those policies and procedures that(1) pertain to the maintenance of records that, in reasonable detail, accurately and fairly reflect thetransactions and dispositions of the assets of the company; (2) provide reasonable assurance thattransactions are recorded as necessary to permit preparation of financial statements in accordance withgenerally accepted accounting principles, and that receipts and expenditures of the company are beingmade only in accordance with authorizations of management and directors of the company; and(3) provide reasonable assurance regarding prevention or timely detection of unauthorized acquisition,use, or disposition of the company’s assets that could have a material effect on the financial statements.
Because of the inherent limitations of internal control over financial reporting, including thepossibility of collusion or improper management override of controls, material misstatements due toerror or fraud may not be prevented or detected on a timely basis. Also, projections of any evaluationof the effectiveness of the internal control over financial reporting to future periods are subject to therisk that the controls may become inadequate because of changes in conditions, or that the degree ofcompliance with the policies or procedures may deteriorate.
A material weakness is a deficiency, or a combination of deficiencies, in internal control overfinancial reporting, such that there is a reasonable possibility that a material misstatement of thecompany’s annual or interim financial statements will not be prevented or detected on a timely basis.The following material weakness has been identified and included in management’s assessment: theCompany’s review and interpretation of complex accounting issues were not sufficiently designed toprevent or detect a material misstatement. This material weakness was considered in determining thenature, timing, and extent of audit tests applied in our audit of the consolidated financial statementsand financial statement schedule as of and for the year ended December 31, 2012, of the Company andthis report does not affect our report on such financial statements and financial statement schedule.
131
In our opinion, because of the effect of the material weakness identified above on the achievementof the objectives of the control criteria, the Company has not maintained effective internal control overfinancial reporting as of December 31, 2012, based on the criteria established in Internal Control—Integrated Framework issued by the Committee of Sponsoring Organizations of the TreadwayCommission.
We have also audited, in accordance with the standards of the Public Company AccountingOversight Board (United States), the consolidated statements of financial condition as of December 31,2012 and 2011, and the related consolidated statements of comprehensive income, cash flows andchanges in equity for each of the three years in the period ended December 31, 2012, of the Companyand our report dated March 8, 2013 expressed an unqualified opinion on those financial statements andfinancial statement schedule.
/s/ Deloitte & Touche LLPNew York, New YorkMarch 8, 2013
132

ITEM 9B. OTHER INFORMATION
Not applicable.
PART III
ITEM 10. DIRECTORS, EXECUTIVE OFFICERS AND CORPORATE GOVERNANCE
Information related to the Company’s directors and nominees under the following captions in theCompany’s Proxy Statement is incorporated by reference herein.
• ‘‘Item 1—Election of Directors’’
• ‘‘Item 1—Election of Directors—Board Meetings and Committees’’
Code of Ethics
IBG, Inc.’s Code of Ethics and Business Conduct applies to all directors, officers and employees,including its Chief Executive Officer, its Chief Financial Officer and its Controller. Information relatingto our Code of Business Conduct and Ethics is included in Part I, Item 1 of this Annual Report onForm 10-K. We will post any amendments to the Code of Ethics and Business Conduct, and anywaivers that are required to be disclosed by the rules of either the SEC or NASDAQ on the investorrelations section of our website located at www.interactivebrokers.com/ir.
ITEM 11. EXECUTIVE COMPENSATION
Information relating to director and executive officer compensation under the following captions inthe Company’s Proxy Statement is incorporated by reference herein.
• ‘‘Compensation of Directors’’
• ‘‘Executive Compensation’’
ITEM 12. SECURITY OWNERSHIP OF CERTAIN BENEFICIAL OWNERS AND MANAGEMENTAND RELATED STOCKHOLDER MATTERS
Other information relating to security ownership of certain beneficial owners and management isset forth under the caption ‘‘Beneficial Ownership of Directors, Executive Officers and Owners ofMore than Five Percent’’ in the Company’s Proxy Statement and such information is incorporated byreference herein
ITEM 13. TRANSACTIONS WITH RELATED PERSONS, PROMOTERS AND CERTAIN CONTROLPERSONS
Information regarding certain relationships and related transactions under the following caption inthe Company’s Proxy Statement and such information is incorporated by reference herein.
• ‘‘Certain Relationships and Related Transactions’’
ITEM 14. PRINCIPAL ACCOUNTANT FEES AND SERVICES
Information regarding principal accounting fees and under the following caption in the Company’sProxy Statement is incorporated by reference herein.
• ‘‘Item 2—Ratification of Appointment of Independent Registered Public Accounting Firm’’
133

PART IV
ITEM 15. EXHIBITS AND FINANCIAL STATEMENT SCHEDULES
Documents filed as part of this report
1. Consolidated Financial Statements
The consolidated financial statements required to be filed in the Annual Report on Form 10-K arelisted on page F-1 hereof and in Part II, Item 8 hereof.
2. Financial Statement Schedule
The financial statement schedule required in the Annual Report on Form 10-K is listed onpage F-1 hereof. The required schedule appears on pages F-1 through F-5 hereof.
3. Exhibits
ExhibitNumber Description
10.1 Amended and Restated Operating Agreement of IBG LLC (filed as Exhibit 10.1 to theQuarterly Report on Form 10-Q for the Quarterly Period Ended March 31, 2007 filed bythe Company on June 15, 2007).**
10.2 Form of Limited Liability Company Operating Agreement of IBG Holdings LLC (filed asExhibit 10.5 to Amendment No. 1 to the Registration Statement on Form S-1 filed by theCompany on February 12, 2007).**
10.3 Exchange Agreement by and among Interactive Brokers Group, Inc., IBG Holdings LLC,IBG LLC and the Members of IBG LLC (filed as Exhibit 10.3 to the Quarterly Report onForm 10-Q for the Quarterly Period Ended September 30, 2009 filed by the Company onNovember 11, 2009).**
10.4 Tax Receivable Agreement by and between Interactive Brokers Group, Inc. and IBGHoldings LLC (filed as Exhibit 10.3 to the Quarterly Report on Form 10-Q for theQuarterly Period Ended March 31, 2007 filed by the Company on June 15, 2007).**
10.5 Interactive Brokers Group, Inc. 2007 Stock Incentive Plan (filed as Exhibit 10.8 toAmendment No. 2 to the Registration Statement on Form S-1 filed by the Company onApril 4, 2007).**+
10.6 Interactive Brokers Group, Inc. 2007 ROI Unit Stock Plan. (filed as Exhibit 10.9 toAmendment No. 2 to the Registration Statement on Form S-1 filed by the Company onApril 4, 2007).**+
10.7 Interactive Brokers Group, Inc. Amendment to the Exchange Agreement . (filed asExhibit 10.1 to the Form 8-K filed by the Company on June 6, 2012).**+
11.1 Statement Re; Computation of Earnings per Common Share (the calculation of per shareearnings is disclosed in Part II, Item 8, Note 4 to the Consolidated Financial Statements‘‘Equity and Earnings per Share’’ and is omitted in accordance with Section (b)(11) ofRegulation S-K)
21.1 Subsidiaries of ther registrant.
23.1 Consent of Independent Registered Public Accounting Firm.
134

ExhibitNumber Description
31.1 Certification of Chief Executive Officer, pursuant to Section 302 of the Sarbanes-Oxley Actof 2002
31.2 Certification of Chief Financial Officer, pursuant to Section 302 of the Sarbanes-Oxley Actof 2002
32.1 Certification of Chief Executive Officer, pursuant to Section 906 of the Sarbanes-Oxley Actof 2002
32.2 Certification of Chief Financial Officer, pursuant to Section 906 of the Sarbanes-Oxley Actof 2002
101.INS XBRL Instance Document*
101.SCH XBRL Extension Schema*
101.CAL XBRL Extension Calculation Linkbase*
101.DEF XBRL Extension Definition Linkbase*
101.LAB XBRL Extension Label Linkbase*
101.PRE XBRL Extension Presentation Linkbase*
** Previously filed; incorporated herein by reference.
+ These exhibits relate to management contracts or compensatory plans or arrangements.
* Attached as Exhibit 101 to this Annual Report on Form 10-K for the annual period endedDecember 31, 2012, are the following materials formatted in XBRL (Extensible BusinessReporting Language) (i) the Consolidated Statements of Financial Condition, (ii) the ConsolidatedStatements of Comprehensive Income, (iii) the Consolidated Statements of Cash Flows, (iv) theConsolidated Statement of Changes in Stockholders’ Equity and (v) Notes to the ConsolidatedFinancial Statements tagged in detail levels 1-4.
135
ITEMS. 15 (a)(1) and 15 (a)(2) INDEX TO FINANCIAL STATEMENTS AND FINANCIALSTATEMENT SCHEDULE
Financial Statement Schedule
Schedule I—Condensed Financial Information of Registrant (Parent Company Only)Report of Independent Registered Public Accounting Firm . . . . . . . . . . . . . . . . . . . . . . . . . . . . F-1Condensed Statements of Financial Condition as of December 31, 2012 and 2011 . . . . . . . . . . . . F-2Condensed Statements of Comprehensive Income for the Years Ended December 31, 2012, 2011
and 2010 . . . . . . . . . . . . . . . . . . . . . . . . . . . . . . . . . . . . . . . . . . . . . . . . . . . . . . . . . . . . . . . F-3Condensed Statements of Cash Flows for the Years ended December 31, 2012, 2011 and 2010 . . . F-4Notes to Condensed Financial Statements . . . . . . . . . . . . . . . . . . . . . . . . . . . . . . . . . . . . . . . . . F-5
136
REPORT OF INDEPENDENT REGISTERED PUBLIC ACCOUNTING FIRM
To the Board of Directors and Stockholders ofInteractive Brokers Group, Inc.Greenwich, CT
We have audited the consolidated financial statements of Interactive Brokers Group, Inc. andsubsidiaries (the ‘‘Company’’) as of December 31, 2012 and 2011, and for each of the three years in theperiod ended December 31, 2012, and the Company’s internal control over financial reporting as ofDecember 31, 2012 (which report expresses an adverse opinion on the effectiveness of the Company’sinternal control over financial reporting because of a material weakness), and have issued our reportsthereon dated March 8, 2013; such reports are included elsewhere in this Form 10-K. Our audits alsoincluded the financial statement schedule of the Company listed in the accompanying index at Item 15.This financial statement schedule is the responsibility of the Company’s management. Our responsibilityis to express an opinion based on our audits. In our opinion, such financial statement schedule, whenconsidered in relation to the basic consolidated financial statements taken as a whole, presents fairly, inall material respects, the information set forth therein.
/s/ Deloitte & Touche LLPNew York, New YorkMarch 8, 2013
F-1
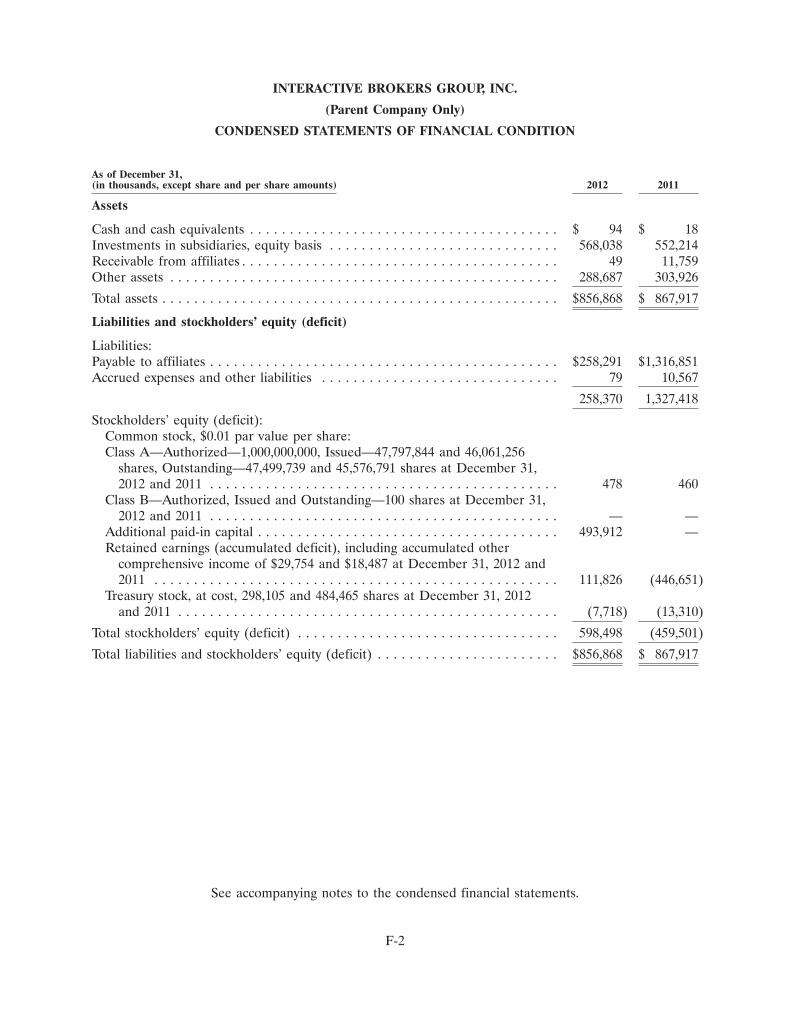
INTERACTIVE BROKERS GROUP, INC.
(Parent Company Only)
CONDENSED STATEMENTS OF FINANCIAL CONDITION
As of December 31,(in thousands, except share and per share amounts) 2012 2011
Assets
Cash and cash equivalents . . . . . . . . . . . . . . . . . . . . . . . . . . . . . . . . . . . . . . . $ 94 $ 18Investments in subsidiaries, equity basis . . . . . . . . . . . . . . . . . . . . . . . . . . . . . 568,038 552,214Receivable from affiliates . . . . . . . . . . . . . . . . . . . . . . . . . . . . . . . . . . . . . . . . 49 11,759Other assets . . . . . . . . . . . . . . . . . . . . . . . . . . . . . . . . . . . . . . . . . . . . . . . . . 288,687 303,926
Total assets . . . . . . . . . . . . . . . . . . . . . . . . . . . . . . . . . . . . . . . . . . . . . . . . . . $856,868 $ 867,917
Liabilities and stockholders’ equity (deficit)
Liabilities:Payable to affiliates . . . . . . . . . . . . . . . . . . . . . . . . . . . . . . . . . . . . . . . . . . . . $258,291 $1,316,851Accrued expenses and other liabilities . . . . . . . . . . . . . . . . . . . . . . . . . . . . . . 79 10,567
258,370 1,327,418
Stockholders’ equity (deficit):Common stock, $0.01 par value per share:Class A—Authorized—1,000,000,000, Issued—47,797,844 and 46,061,256
shares, Outstanding—47,499,739 and 45,576,791 shares at December 31,2012 and 2011 . . . . . . . . . . . . . . . . . . . . . . . . . . . . . . . . . . . . . . . . . . . . 478 460
Class B—Authorized, Issued and Outstanding—100 shares at December 31,2012 and 2011 . . . . . . . . . . . . . . . . . . . . . . . . . . . . . . . . . . . . . . . . . . . . — —
Additional paid-in capital . . . . . . . . . . . . . . . . . . . . . . . . . . . . . . . . . . . . . . 493,912 —Retained earnings (accumulated deficit), including accumulated other
comprehensive income of $29,754 and $18,487 at December 31, 2012 and2011 . . . . . . . . . . . . . . . . . . . . . . . . . . . . . . . . . . . . . . . . . . . . . . . . . . . 111,826 (446,651)
Treasury stock, at cost, 298,105 and 484,465 shares at December 31, 2012and 2011 . . . . . . . . . . . . . . . . . . . . . . . . . . . . . . . . . . . . . . . . . . . . . . . . (7,718) (13,310)
Total stockholders’ equity (deficit) . . . . . . . . . . . . . . . . . . . . . . . . . . . . . . . . . 598,498 (459,501)
Total liabilities and stockholders’ equity (deficit) . . . . . . . . . . . . . . . . . . . . . . . $856,868 $ 867,917
See accompanying notes to the condensed financial statements.
F-2

INTERACTIVE BROKERS GROUP, INC.(Parent Company Only)
CONDENSED STATEMENTS OF COMPREHENSIVE INCOME
Year ended December 31,(in thousands) 2012 2011 2010
Revenues—dividends, interest and other . . . . . . . . . . . . . . . . . . . . . . . . $ — $ 5,217 $ 1,056
Expenses:Interest expense . . . . . . . . . . . . . . . . . . . . . . . . . . . . . . . . . . . . . . . — — 2Other . . . . . . . . . . . . . . . . . . . . . . . . . . . . . . . . . . . . . . . . . . . . . . . — 6 5Delaware franchise taxes . . . . . . . . . . . . . . . . . . . . . . . . . . . . . . . . . 180 180 165
Total expenses . . . . . . . . . . . . . . . . . . . . . . . . . . . . . . . . . . . . . . . 180 186 172
Income (loss) before equity in income of subsidiary . . . . . . . . . . . . . . . (180) 5,031 884Equity in income (loss) of subsidiary, net of tax . . . . . . . . . . . . . . . . . . 40,848 56,827 (10,434)
Net income (loss) . . . . . . . . . . . . . . . . . . . . . . . . . . . . . . . . . . . . . . . . $40,668 $61,858 $ (9,550)
Net income (loss) attributable to common stockholders . . . . . . . . . . . . . $40,668 $61,858 $ (9,550)Cumulative translation adjustment, net of tax . . . . . . . . . . . . . . . . . . . . 11,267 (2,650) 10,223
Comprehensive income attributable to common stockholders . . . . . . . . . $51,935 $59,208 $ 673
See accompanying notes to the condensed financial statements.
F-3

INTERACTIVE BROKERS GROUP, INC.(Parent Company Only)
CONDENSED STATEMENTS OF CASH FLOWS
Year ended December 31,(in thousands) 2012 2011 2010
Cash flows from operating activities:Net income (loss) . . . . . . . . . . . . . . . . . . . . . . . . . . . . . . . . . . . . . $ 40,668 $ 61,858 $ (9,550)Adjustments to reconcile net income to net cash provided by (used
in) operating activities:Equity in income of subsidiary . . . . . . . . . . . . . . . . . . . . . . . . . . (40,848) (56,827) 10,434Deferred income taxes . . . . . . . . . . . . . . . . . . . . . . . . . . . . . . . . 17,283 17,768 18,890
Changes in operating assets and liabilities . . . . . . . . . . . . . . . . . . . . . (21,337) (33,207) (63,328)
Net cash used in operating activities . . . . . . . . . . . . . . . . . . . . (4,234) (10,408) (43,554)
Cash flows from investing activities . . . . . . . . . . . . . . . . . . . . . . . . . . 70,608 23,573 118,955
Cash flows from financing activities . . . . . . . . . . . . . . . . . . . . . . . . . . (66,298) (13,472) (75,589)
Net decrease in cash and cash equivalents . . . . . . . . . . . . . . . . . . . . . 76 (307) (188)Cash and cash equivalents at beginning of year . . . . . . . . . . . . . . . . . 18 325 513
Cash and cash equivalents at end of year . . . . . . . . . . . . . . . . . . . . . . $ 94 $ 18 $ 325
Supplemental disclosures of cash flow information:Interest paid . . . . . . . . . . . . . . . . . . . . . . . . . . . . . . . . . . . . . . . $ — $ — $ 2
Taxes paid . . . . . . . . . . . . . . . . . . . . . . . . . . . . . . . . . . . . . . . . . $ — $ 24,403 $ 5,311
See accompanying notes to the condensed financial statements.
F-4

INTERACTIVE BROKERS GROUP, INC.(Parent Company Only)
NOTES TO CONDENSED FINANCIAL STATEMENTS
1. Basis of Presentation
The accompanying condensed financial statements (the ‘‘Parent Company Financial Statements’’)of Interactive Brokers Group, Inc. (‘‘IBG, Inc.’’), a Delaware holding company, including the notesthereto, should be read in conjunction with the consolidated financial statements of Interactive BrokersGroup, Inc. and subsidiaries (the ‘‘Company’’) and the notes thereto. IBG, Inc.’s primary operatingasset is its ownership interest in IBG LLC, an automated global market maker and electronic brokerspecializing in routing orders and processing trades in securities, futures and foreign exchangeinstruments.
The preparation of the Parent Company Financial Statements in conformity with accountingprinciples generally accepted in the United States requires management to make estimates andassumptions that affect the reported amounts and disclosures in the condensed financial statements andaccompanying notes. Actual results could differ materially from those estimates.
Income Taxes
Refer to Note 2 to the consolidated financial statements.
2. Transactions with Affiliates
As of December 31, 2012 and 2011, receivables from IBG LLC of $49 and $11,700 related to thelending of excess funds at variable rates to IBG LLC for use in its operations. Interest earned for thethree years ended December 31, 2012, 2011 and 2010 was $0, $68 and $164, respectively. Dividendsreceived from IBG LLC for the three years ended December 31, 2012, 2011 and 2010 were $70,608,$23,573 and $118,955, respectively.
As of December 31, 2012 and 2011, respectively, payable to affiliates of $258,566 and $1,316,851consisted in part of amounts payable to Holdings under the Tax Receivable Agreement of $258,566 and$271,602, respectively. As of December 31, 2011 this payable amount also included the differencebetween the redemption value of noncontrolling interests in IBG LLC attributable to Holdings of$1,045,249 and their book value (refer to Note 4 to the consolidated financial statements).
3. Stockholders’ Equity
Refer to Note 4 to the consolidated financial statements.
4. Employee Stock Plans
Refer to Note 12 to the consolidated financial statements.
5. Commitments, Contingencies and Guarantees
Refer to Note 15 to the consolidated financial statements.
6. Subsequent Events
As required by ASC 855-10-50 the Company has evaluated subsequent events for adjustment to ordisclosure in its condensed financial statements through the date the financial statements were issued.No recordable or disclosable events, not otherwise reported in these condensed financial statements orthe notes thereto, occurred.
F-5

(This page has been left blank intentionally.)

SIGNATURES
Pursuant to the requirements of Section 13 or 15(d) the Securities Exchange Act of 1934, theregistrant has duly caused this report to be signed on its behalf by the undersigned thereunto dulyauthorized.
INTERACTIVE BROKERS GROUP, INC.
/s/ PAUL J. BRODY
Name: Paul J. BrodyTitle: Chief Financial Officer, Treasurer and
Secretary(Signing both in his capacity as a duly authorizedofficer and as principal financial officer of theregistrant)
Date: March 8, 2013
Pursuant to the requirements of the Securities Exchange Act of 1934, this report has been signedby the following persons on behalf of the registrant and in the capacities and on the dates indicated.
Signature Title Date
Chairman of the Board of Directors,/s/ THOMAS PETERFFYChief Executive Officer and President March 8, 2013
Thomas Peterffy (Principal Executive Officer)
Chief Financial Officer, Treasurer,/s/ PAUL J. BRODYSecretary and Director (Principal March 8, 2013
Paul J. Brody Financial Officer)
/s/ TIMOTHY E. ROGERS Controller (Principal Accounting March 8, 2013Officer)Timothy E. Rogers
/s/ LAWRENCE E. HARRISDirector March 8, 2013
Lawrence E. Harris
/s/ HANS R. STOLLDirector March 8, 2013
Hans R. Stoll
/s/ IVERS W. RILEYDirector March 8, 2013
Ivers W. Riley

EXHIBIT 21.1
SUBSIDIARIES OF THE COMPANY
Name Jurisdiction of Organization
IBG LLC . . . . . . . . . . . . . . . . . . . . . . . . . . . . . . . . . . . . . . . . . . . . . . . . . . Connecticut, U.S.A.
The following is a list of subsidiaries of IBG LLC:
Name Jurisdiction of Organization
Timber Hill LLC(1) . . . . . . . . . . . . . . . . . . . . . . . . . . . . . . . . . . . . . . . . . . . Connecticut, U.S.A.Interactive Brokers LLC(2) . . . . . . . . . . . . . . . . . . . . . . . . . . . . . . . . . . . . . Connecticut, U.S.A.Interactive Brokers Canada Inc. . . . . . . . . . . . . . . . . . . . . . . . . . . . . . . . . . . CanadaInteractive Brokers (U.K.) Limited . . . . . . . . . . . . . . . . . . . . . . . . . . . . . . . . United KingdomTimber Hill Europe AG . . . . . . . . . . . . . . . . . . . . . . . . . . . . . . . . . . . . . . . . SwitzerlandTimber Hill Securities Hong Kong Limited . . . . . . . . . . . . . . . . . . . . . . . . . . Hong KongTimber Hill Australia Pty Limited . . . . . . . . . . . . . . . . . . . . . . . . . . . . . . . . . AustraliaTimber Hill Canada Company . . . . . . . . . . . . . . . . . . . . . . . . . . . . . . . . . . . CanadaInteractive Brokers Hungary Kft . . . . . . . . . . . . . . . . . . . . . . . . . . . . . . . . . . HungaryIB Exchange Corp. . . . . . . . . . . . . . . . . . . . . . . . . . . . . . . . . . . . . . . . . . . . Delaware, U.S.A.Interactive Brokers (India) Private Limited(3) . . . . . . . . . . . . . . . . . . . . . . . . IndiaInteractive Brokers Financial Products S.A. . . . . . . . . . . . . . . . . . . . . . . . . . LuxembourgInteractive Brokers Securities Japan, Inc. . . . . . . . . . . . . . . . . . . . . . . . . . . . JapanInteractive Brokers Software Services Estonia . . . . . . . . . . . . . . . . . . . . . . . . EstoniaInteractive Brokers Software Services Russia . . . . . . . . . . . . . . . . . . . . . . . . . RussiaIB Brasil Participacoes Ltda . . . . . . . . . . . . . . . . . . . . . . . . . . . . . . . . . . . . . Brazil
(1) IBG LLC owns 99.99% and Thomas Peterffy owns 0.01%.
(2) IBG LLC owns 99.9% and Thomas Peterffy owns 0.1%.
(3) IB Exchange Corp. owns 0.01%
The following is a list of subsidiaries of Timber Hill Europe AG:
Name Jurisdiction of Organization
Timber Hill (U.K.) Limited . . . . . . . . . . . . . . . . . . . . . . . . . . . . . . . . . . . . . United KingdomTimber Hill (Mauritius) Limited . . . . . . . . . . . . . . . . . . . . . . . . . . . . . . . . . . Mauritius
The following is a list of subsidiaries of Interactive Brokers LLC:
Name Jurisdiction of Organization
Interactive Brokers Corp. . . . . . . . . . . . . . . . . . . . . . . . . . . . . . . . . . . . . . . Connecticut, U.S.A.

EXHIBIT 23.1
CONSENT OF INDEPENDENT REGISTERED PUBLIC ACCOUNTING FIRM
We consent to the incorporation by reference in Registration Statement No. 333-174913 onForm S-8 of our reports dated March 8, 2013, relating to the consolidated financial statements andfinancial statement schedule of Interactive Brokers Group, Inc. (the ‘‘Company’’), and our report datedMarch 8, 2013 relating to internal control over financial reporting (which report expresses an adverseopinion on the effectiveness of the Company’s internal control over financial reporting because of amaterial weakness) appearing in this Annual Report on Form 10-K of Interactive Brokers Group, Inc.for the year ended December 31, 2012.
/s/ Deloitte & Touche LLPNew York, New YorkMarch 8, 2013
EXHIBIT 31.1
CERTIFICATION
I, Thomas Peterffy, certify that:
1. I have reviewed this Annual Report on Form 10-K for the year ended December 31, 2012 ofInteractive Brokers Group, Inc.;
2. Based on my knowledge, this report does not contain any untrue statement of a material fact oromit to state a material fact necessary to make the statements made, in light of the circumstancesunder which such statements were made, not misleading with respect to the period covered by thisreport;
3. Based on my knowledge, the financial statements, and other financial information included in thisreport, fairly present in all material respects the financial condition, results of operations and cashflows of the registrant as of, and for, the periods presented in this report;
4. The registrant’s other certifying officer(s) and I are responsible for establishing and maintainingdisclosure controls and procedures (as defined in Exchange Act Rules 13a-15(e) and 15d-15(e))and internal control over financial reporting (as defined in Exchange Act Rules 13a-15(f) and15d-15(f)) and have:
(a) Designed such disclosure controls and procedures, or caused such disclosure controls andprocedures to be designed under our supervision, to ensure that material information relatingto the registrant, including its consolidated subsidiaries, is made known to us by others withinthose entities, particularly during the period in which this report is being prepared;
(b) Designed such internal control over financial reporting, or caused such internal control overfinancial reporting to be designed under our supervision, to provide reasonable assuranceregarding the reliability of financial reporting and the preparation of financial statements forexternal purposes in accordance with generally accepted accounting principles;
(c) Evaluated the effectiveness of the registrant’s disclosure controls and procedures andpresented in this report our conclusions about the effectiveness of the disclosure controls andprocedures, as of the end of the period covered by this report based on such evaluation; and
(d) Disclosed in this report any change in the registrant’s internal control over financial reportingthat occurred during the registrant’s most recent fiscal quarter (the registrant’s fourth fiscalquarter in the case of an annual report) that has materially affected, or is reasonably likely tomaterially affect, the registrant’s internal control over financial reporting; and
5. The registrant’s other certifying officer(s) and I have disclosed, based on our most recentevaluation of internal control over financial reporting, to the registrant’s auditors and the AuditCommittee of the registrant’s board of directors (or persons performing the equivalent functions):
(a) All significant deficiencies and material weaknesses in the design or operation of internalcontrol over financial reporting which are reasonably likely to adversely affect the registrant’sability to record, process, summarize and report financial information; and
(b) Any fraud, whether or not material, that involves management or other employees who have asignificant role in the registrant’s internal control over financial reporting.
By: /s/ THOMAS PETERFFY
Name: Thomas PeterffyTitle: Chairman, Chief Executive Officer and
President
Date: March 8, 2013

EXHIBIT 31.2
CERTIFICATION
I, Paul J. Brody, certify that:
1. I have reviewed this Annual Report on Form 10-K for the year ended December 31, 2012 ofInteractive Brokers Group, Inc.;
2. Based on my knowledge, this report does not contain any untrue statement of a material fact oromit to state a material fact necessary to make the statements made, in light of the circumstancesunder which such statements were made, not misleading with respect to the period covered by thisreport;
3. Based on my knowledge, the financial statements, and other financial information included in thisreport, fairly present in all material respects the financial condition, results of operations and cashflows of the registrant as of, and for, the periods presented in this report;
4. The registrant’s other certifying officer(s) and I are responsible for establishing and maintainingdisclosure controls and procedures (as defined in Exchange Act Rules 13a-15(e) and 15d-15(e))and internal control over financial reporting (as defined in Exchange Act Rules 13a-15(f) and15d-15(f)) and have:
(a) Designed such disclosure controls and procedures, or caused such disclosure controls andprocedures to be designed under our supervision, to ensure that material information relatingto the registrant, including its consolidated subsidiaries, is made known to us by others withinthose entities, particularly during the period in which this report is being prepared;
(b) Designed such internal control over financial reporting, or caused such internal control overfinancial reporting to be designed under our supervision, to provide reasonable assuranceregarding the reliability of financial reporting and the preparation of financial statements forexternal purposes in accordance with generally accepted accounting principles;
(c) Evaluated the effectiveness of the registrant’s disclosure controls and procedures andpresented in this report our conclusions about the effectiveness of the disclosure controls andprocedures, as of the end of the period covered by this report based on such evaluation; and
(d) Disclosed in this report any change in the registrant’s internal control over financial reportingthat occurred during the registrant’s most recent fiscal quarter (the registrant’s fourth fiscalquarter in the case of an annual report) that has materially affected, or is reasonably likely tomaterially affect, the registrant’s internal control over financial reporting; and
5. The registrant’s other certifying officer(s) and I have disclosed, based on our most recentevaluation of internal control over financial reporting, to the registrant’s auditors and the AuditCommittee of the registrant’s board of directors (or persons performing the equivalent functions):
(a) All significant deficiencies and material weaknesses in the design or operation of internalcontrol over financial reporting which are reasonably likely to adversely affect the registrant’sability to record, process, summarize and report financial information; and
(b) Any fraud, whether or not material, that involves management or other employees who have asignificant role in the registrant’s internal control over financial reporting.
By: /s/ PAUL J. BRODY
Name: Paul J. BrodyTitle: Chief Financial Officer, Treasurer and
Secretary
Date: March 8, 2013

EXHIBIT 32.1
CERTIFICATION
Pursuant to 18 U.S.C. § 1350, the undersigned officer of Interactive Brokers Group, Inc. (the‘‘Company’’) hereby certifies that the Company’s Annual Report on Form 10-K for the year endedDecember 31, 2012 (the ‘‘Report’’) fully complies with the requirements of Section 13(a) or 15(d), asapplicable, of the Securities Exchange Act of 1934 and that the information contained in the Reportfairly presents, in all material respects, the financial condition and results of operations of theCompany.
By: /s/ THOMAS PETERFFY
Name: Thomas PeterffyTitle: Chairman, Chief Executive Officer and
President
Date: March 8, 2013
The foregoing certification is being furnished solely pursuant to 18 U.S.C. § 1350 and is not beingfiled as part of the Report or as a separate disclosure document.
EXHIBIT 32.2
CERTIFICATION
Pursuant to 18 U.S.C. § 1350, the undersigned officer of Interactive Brokers Group, Inc. (the‘‘Company’’) hereby certifies that the Company’s Annual Report on Form 10-K for the year endedDecember 31, 2012 (the ‘‘Report’’) fully complies with the requirements of Section 13(a) or 15(d), asapplicable, of the Securities Exchange Act of 1934 and that the information contained in the Reportfairly presents, in all material respects, the financial condition and results of operations of theCompany.
By: /s/ PAUL J. BRODY
Name: Paul J. BrodyTitle: Chief Financial Officer, Treasurer and
Secretary
Date: March 8, 2013
The foregoing certification is being furnished solely pursuant to 18 U.S.C. § 1350 and is not beingfiled as part of the Report or as a separate disclosure document.

(This page has been left blank intentionally.)

Public StockholdersMembers of
IBG Holdings LLC
Interactive BrokersGroup, Inc. IBG Holdings LLC
IBG LLC
100% economic interest11.9% voting interest
88.1% voting interest
11.9% economic interest 88.1% economic interest
Operating Subsidiaries of IBG LLC
Officers and Directors
Thomas PeterffyChairman of the Board of Directors,
Chief Executive Officer
Earl H. NemserVice Chairman and Director
Paul J. BrodyChief Financial Officer, Treasurer,
Secretary and Director
Thomas A. FrankExecutive Vice President and
Chief Information Officer
Milan GalikSenior Vice President, Software Development
and Director
Lawrence E. HarrisDirector
Hans R. StollDirector
Ivers W. RileyDirector
Richard GatesDirector
Annual Meeting
The annual meeting will be held on April 25, 2013 at 9:30 a.m. EDT in Greenwich, CT.
Corporate HeadquartersOne Pickwick PlazaGreenwich, CT 06830(877) 442-2757
Transfer Agent and RegistrarComputershare Trust Company, N.A.(800) 662-7232
Independent Registered Public Accounting FirmDeloitte & Touche LLP
Common StockOur stock is listed on the NASDAQ Global Select Market under the symbol “IBKR”
Corporate Websitewww.interactivebrokers.com
Investor [email protected](203) 618-4070
[email protected](203) 913-1369
Corporate Information
Organizational Structure

Sales Office Locations
Greenwich, CT
Jersey City, NJ
Chicago, IL
San Francisco, CA
Montreal, Canada
Sydney, Australia
Hong Kong
Zug, Switzerland
London, United Kingdom
Mumbai, India
Tokyo, Japan