AXA Investment Managers Paris Annual Top ... - AXA IM France
press release
Investor Relations +33 1 40 75 46 85 Media Relations +33 1 40 75 71 81 Individual Shareholder Relations +33 1 40 75 48 43
Analyst Conference – Paris, 8.30 CET Press Conference – Paris, 10.15 CET Analyst Conference – London, 16.30 CET Follow the presentations on www.axa.com
Contents: Group key highlights………………...............2 Revenues………….……………………………….3 Earnings…………………………..…….………….9 Group EV, free cash flow & dividend….14 Balance sheet…………………………………..15 Notes & Other information……...............16 Appendices…………….………..…….............17
Full Year 2010 Earnings Proposed dividend per share up 25%
Solid set of results and robust balance sheet drive proposed dividend per share up 25%
Substantial increase in new business margins in mature markets and strong sales development in high growth markets
Strategic and organizational initiatives implemented in 2010 to improve AXA’s profile and positioning in the future
“In 2010, despite an environment which remained challenging throughout the year, AXA delivered a solid set of results with a strong improvement in new business profitability, a rebound in adjusted earnings and an increase in operating free cash flows. On this basis, AXA's Board of directors will propose a 25% increase in dividend to shareholders”, said Henri de Castries, Chairman and CEO of AXA.
“2010 was also characterised by significant strategic moves and organizational changes. I would emphasize in particular our decisive developments in high growth markets, the partial sale of our life operations in the UK, the ramp up of our new organization by business line and the changes in our senior management teams.”
“In 2011, AXA should benefit from an improving macro-economic outlook. In this context, our main business objectives will be to accelerate profitable growth and deliver productivity gains across business lines to support value creation and the improvement of group operating free cash flows, while successfully pursuing the reallocation of our capital towards growth oriented geographies or business segments.”
Key figures
In Euro million unless otherwise noted FY09 FY10 Change on a
reported basis Change on a
comparable basis
Total revenues 90,124 90,972 +1% -1%
NBV margin (%) 18.0% 22.3% +4.3 pts +2.8 pts
Underlying Earnings 3,854 3,880 +1% -3%
Adjusted Earnings 3,468 4,317 +24% +20%
Net income 3,606 2,749 -24% -26%
Group operating free cash flow (Euro billion) 3.1 3.7 +18%
Group Embedded Value per share (Euro) 13.4 14.9 +11%
Dividend per share (Euro) 0.55 0.69 +25%
Shareholders’ equity 46,229 49,698 +8%
Economic capital ratio 167% 175% +8 pts
February 17, 2011

Page 2/26
Revenues • Total Revenues were down 1% to Euro 90,972 million (+1% on a reported basis).
• Life & Savings revenues were down 3% to Euro 56,923 million. APE1 was down 2% to Euro 5,780 million, with lower sales mainly in France, Japan and the US, partly offset by strong performance in the UK (retained business only), SEA & China, Hong-Kong and CEE. High growth markets2 APE grew by 25%. Net inflows remained strong at Euro +8.4 billion with increases over FY09 mainly in Japan and CEE and decreases mainly in France and the US. High growth markets2 showed strong net inflows amounting to Euro +1.9 billion (up Euro 0.5 billion vs. FY09).
New Business Value (NBV3) was up 12% to Euro 1,290 million, primarily due to improved product mix mainly benefiting from product redesign in the US and Japan.
As a result, New Business margin significantly increased from 18.0% in FY09 to 22.3% in FY10.
• Property & Casualty revenues increased by 1.3% to Euro 27,413 million as the 3.9% growth in Personal lines (largely driven by a 3.8% average price increase) was partly offset by a 2.8% decrease in Commercial lines, where the 2.1% average price increase was more than offset notably by lower volumes from selective underwriting and reduced sum insured. Overall, the average price increase was 3.1%.
• Asset Management revenues were up 5% to Euro 3,328 million, mainly driven by higher average assets under management (up 3% vs. FY09). Assets Under Management of Euro 878 billion were up Euro 33 billion versus December 31, 2009, benefiting from positive market and forex impacts, partly offset by net outflows mainly from institutional clients.
Earnings • Underlying Earnings were down 3% to Euro 3,880 million. Life & Savings Underlying Earnings grew by 1%
driven by an improving investment margin and higher average unit-linked assets partly offset by a decrease in net technical margin mainly on Variable Annuity. Property & Casualty Underlying Earnings decreased 2% following a slight increase in combined ratio, up 0.2 pt to 99.1% (Current Year combined ratio improved by 2.0 pts more than offset by 2.2 pts lower positive prior year reserve developments). In Asset Management, Underlying Earnings fell by 26% mainly as a result of both a non-recurring 2009 tax benefit and a net provision in 2010 related to losses arising from AXA Rosenberg coding error, partly offset by higher average assets under management.
• Adjusted Earnings increased strongly by 20% to Euro 4,317 million, benefiting from both higher realized capital gains and lower impairment charges.
• Net Income was down 26% to Euro 2,749 million. Excluding the Euro 1,642 million exceptional loss related to the partial sale of the UK Life operations, net income was up 18% to Euro 4,391 million, mainly benefiting from higher Adjusted Earnings.
Group Embedded Value (EV), free cash-flow & Dividend • Group EV was up Euro 3.7 billion to Euro 34.2 billion, or up 11% to Euro 14.9 per share. • Group Operating Free Cash Flow4 was up from Euro 3.1 billion to Euro 3.7 billion. • A dividend of Euro 0.69 per share (up 25% vs. FY09) will be proposed at the Annual General Meeting that
will be held on April 27, 2011. The dividend is expected to be paid on May 4, 2011 with an ex-dividend date of April 29, 2011.
Balance sheet • Shareholders' equity was Euro 49.7 billion, up Euro 3.5 billion vs. December 31, 2009, benefiting from Euro
1.5 billion increase in net unrealized capital gains, a positive Euro 1.0 billion from forex movements net of hedging instruments and Euro 2.7 billion net income for the period, partly offset by Euro 1.3 billion 2009 dividend payment and by Euro 0.4 billion increase in pension deficits.
• Solvency I ratio was 182% post-dividend, up 11 points vs. December 31, 2009, notably benefiting from Underlying Earnings (+17 points) partly offset by proposed dividend (-7 points).
• Economic capital ratio increased from 167% as at December 31, 2009 to ca. 175% as at December 31, 2010.
• Debt gearing5 increased by 1 point to 28% mainly as a result of forex impact partly offset by earnings net of dividend.
FY10 KEY HIGHLIGHTS /
Non-GAAP measures such as Underlying Earnings and Adjusted Earnings are reconciled to Net Income on page 9 of this release. AXA’s 2010 financial statements have been examined by the Board of Directors on February 16, 2011 and are subject to completion of audit procedures by AXA’s independent auditors.
Notes are on page 16
All comments are on a comparable basis (constant Forex, scope and methodology for activity indicators and constant Forex for earnings).
2010 APE and NBV of the sold UK operations are excluded from reported figures.

Page 3/26
Revenues: Key figures
Change Euro million, except when otherwise noted FY09 FY10 Change on a
reported basis Comp.(a) basis Scope & Other
FX impact(b)
Life & Savings revenues
Net inflows (Euro billion)
APE1 (Group share) NBV3 (Group share) NBV to APE margin (Group share)
57,620
8.6
6,188(d)
1,113(d)
18.0%
56,923
8.4
5,780
1,290
22.3%
-1.2%
-6.6%
+15.9%
+4.3 pts
-2.5%
-2.4%
+11.8%
+2.8 pts
-1.5%
-7.6% -1.8%
-0.2 pt
+2.8%
+3.5% +5.9%
+1.7 pts
Property & Casualty revenues 26,174 27,413 +4.7% +1.3% +0.4% +3.0%
Asset Management revenues
Net inflows (Euro billion)
3,074
-71.3
3,328
-64.1
+8.2%
+5.0 %
+0.0%
+3.3%
International Insurance revenues 2,860 2,847 -0.4% -2.9% -0.2% +2.7%
Total revenues(c) 90,124 90,972 +0.9% -1.1% -0.9% +2.9% (a) Change on a comparable basis was calculated at constant FX and scope (mainly partial sale of UK Life operations). (b) Mainly due to the depreciation of the Euro against main currencies. (c) Include banking revenues up 16% to Euro 459 million in FY10 (vs. Euro 395 million in FY09). (d) Of which Euro 540 million APE and Euro 30 million NBV of sold UK business, excluded in 2010.
Life & Savings Life & Savings revenues were down 3% to Euro 56,923 million, with increases in MedLA and NORCEE more than offset by decreases in France, the US and Japan. Net inflows remained strong at Euro +8.4 billion with increases over FY09 mainly in Japan and CEE and decreases mainly in France and the US.
Net Inflows by country/region
Euro billion FY09 FY10
France +4.7 +2.8
NORCEE(a) +2.4 +3.3
United States +0.0 -1.1
United Kingdom(b) -1.0 -0.5
Asia Pacific(c) +0.5 +2.0
MedLA(d) +2.0 +1.9
Total L&S Net Inflows +8.6 +8.4
Of which high growth markets2 +1.3 +1.9
Of which mature markets +7.4 +6.5 (a) Northern Central and Eastern Europe: Germany, Belgium, Switzerland, Central & Eastern Europe and Luxembourg (b) UK Net Inflows, excluding with-profit funds, stood at Euro +0.3 billion at December 31, 2010. (c) Asia Pacific: Australia, New Zealand, Hong Kong, Japan and South East Asia & China (d) Mediterranean and Latin American Region: Italy, Spain, Portugal, Turkey, Mexico, Greece and Morocco.
High growth markets2 showed strong net inflows amounting to Euro +1.9 billion (up Euro 0.5 billion vs. FY09), representing 14% of high growth markets2 opening reserves.
Continued positive net inflows
(Euro +8.4 billion)
REVENUES /
Page 4/26
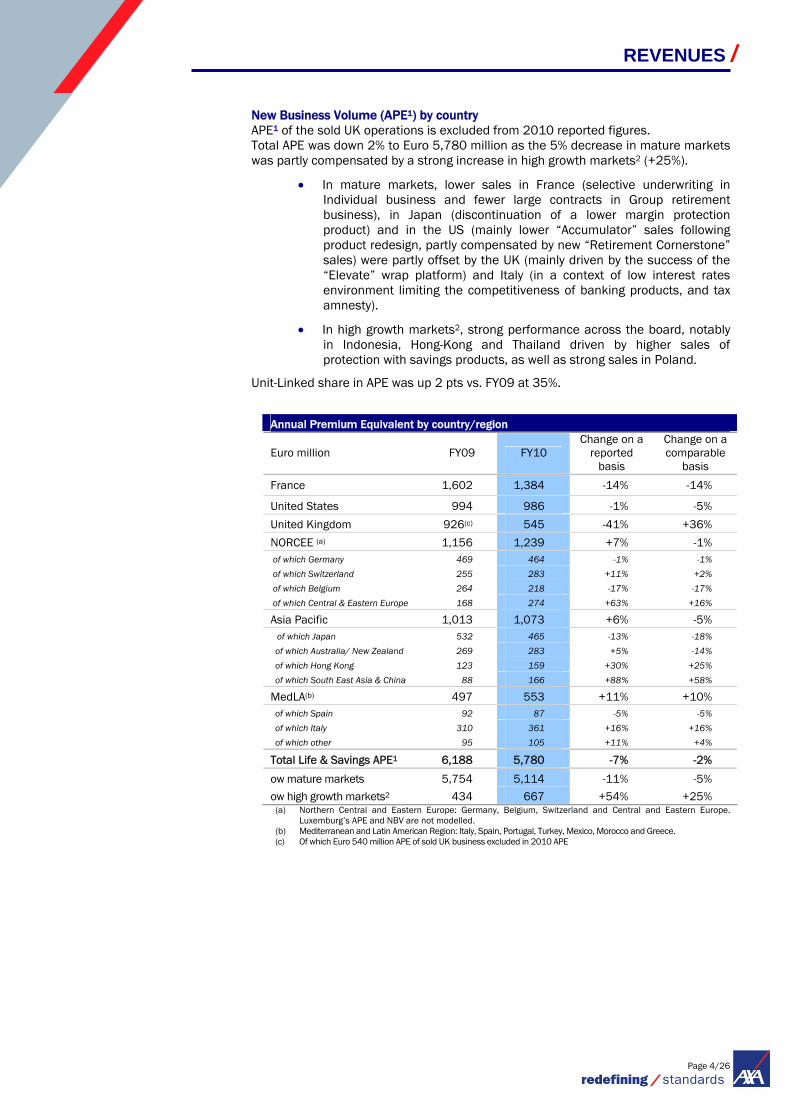
New Business Volume (APE1) by country APE1 of the sold UK operations is excluded from 2010 reported figures. Total APE was down 2% to Euro 5,780 million as the 5% decrease in mature markets was partly compensated by a strong increase in high growth markets2 (+25%).
• In mature markets, lower sales in France (selective underwriting in Individual business and fewer large contracts in Group retirement business), in Japan (discontinuation of a lower margin protection product) and in the US (mainly lower “Accumulator” sales following product redesign, partly compensated by new “Retirement Cornerstone” sales) were partly offset by the UK (mainly driven by the success of the “Elevate” wrap platform) and Italy (in a context of low interest rates environment limiting the competitiveness of banking products, and tax amnesty).
• In high growth markets2, strong performance across the board, notably in Indonesia, Hong-Kong and Thailand driven by higher sales of protection with savings products, as well as strong sales in Poland.
Unit-Linked share in APE was up 2 pts vs. FY09 at 35%.
Annual Premium Equivalent by country/region
Euro million FY09 FY10 Change on a
reported basis
Change on a comparable
basis
France 1,602 1,384 -14% -14%
United States 994 986 -1% -5%
United Kingdom 926(c) 545 -41% +36%
NORCEE (a) 1,156 1,239 +7% -1% of which Germany 469 464 -1% -1% of which Switzerland 255 283 +11% +2% of which Belgium 264 218 -17% -17% of which Central & Eastern Europe 168 274 +63% +16%
Asia Pacific 1,013 1,073 +6% -5% of which Japan 532 465 -13% -18%
of which Australia/ New Zealand 269 283 +5% -14% of which Hong Kong 123 159 +30% +25% of which South East Asia & China 88 166 +88% +58%
MedLA(b) 497 553 +11% +10% of which Spain 92 87 -5% -5% of which Italy 310 361 +16% +16% of which other 95 105 +11% +4%
Total Life & Savings APE1 6,188 5,780 -7% -2%
ow mature markets 5,754 5,114 -11% -5%
ow high growth markets2 434 667 +54% +25% (a) Northern Central and Eastern Europe: Germany, Belgium, Switzerland and Central and Eastern Europe.
Luxemburg’s APE and NBV are not modelled. (b) Mediterranean and Latin American Region: Italy, Spain, Portugal, Turkey, Mexico, Morocco and Greece. (c) Of which Euro 540 million APE of sold UK business excluded in 2010 APE
REVENUES /
Page 5/26
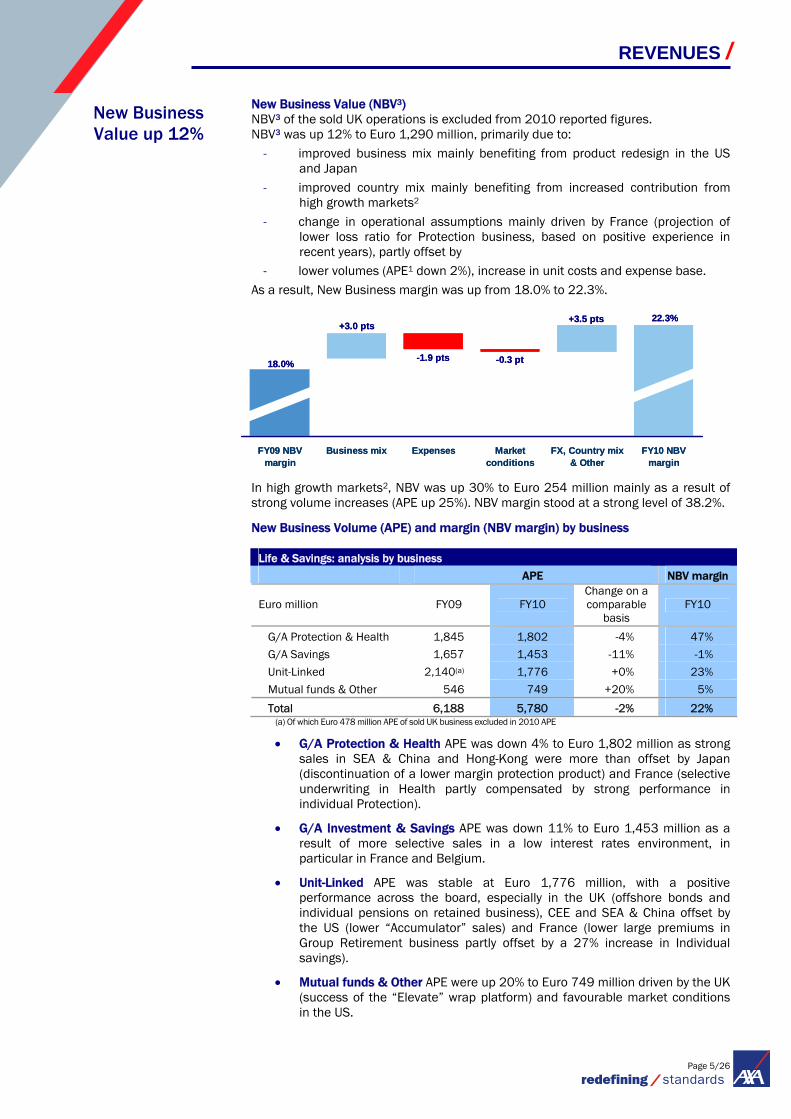
New Business Value (NBV3) NBV3 of the sold UK operations is excluded from 2010 reported figures. NBV3 was up 12% to Euro 1,290 million, primarily due to:
- improved business mix mainly benefiting from product redesign in the US and Japan
- improved country mix mainly benefiting from increased contribution from high growth markets2
- change in operational assumptions mainly driven by France (projection of lower loss ratio for Protection business, based on positive experience in recent years), partly offset by
- lower volumes (APE1 down 2%), increase in unit costs and expense base. As a result, New Business margin was up from 18.0% to 22.3%.
In high growth markets2, NBV was up 30% to Euro 254 million mainly as a result of strong volume increases (APE up 25%). NBV margin stood at a strong level of 38.2%.
New Business Volume (APE) and margin (NBV margin) by business
Life & Savings: analysis by business
APE NBV margin
Euro million FY09 FY10 Change on a comparable
basis FY10
G/A Protection & Health 1,845 1,802 -4% 47%
G/A Savings 1,657 1,453 -11% -1%
Unit-Linked 2,140(a) 1,776 +0% 23%
Mutual funds & Other 546 749 +20% 5%
Total 6,188 5,780 -2% 22% (a) Of which Euro 478 million APE of sold UK business excluded in 2010 APE
• G/A Protection & Health APE was down 4% to Euro 1,802 million as strong sales in SEA & China and Hong-Kong were more than offset by Japan (discontinuation of a lower margin protection product) and France (selective underwriting in Health partly compensated by strong performance in individual Protection).
• G/A Investment & Savings APE was down 11% to Euro 1,453 million as a result of more selective sales in a low interest rates environment, in particular in France and Belgium.
• Unit-Linked APE was stable at Euro 1,776 million, with a positive performance across the board, especially in the UK (offshore bonds and individual pensions on retained business), CEE and SEA & China offset by the US (lower “Accumulator” sales) and France (lower large premiums in Group Retirement business partly offset by a 27% increase in Individual savings).
• Mutual funds & Other APE were up 20% to Euro 749 million driven by the UK (success of the “Elevate” wrap platform) and favourable market conditions in the US.
New Business Value up 12%
REVENUES /
18.0%
22.3%
-1.9 pts
+3.0 pts+3.5 pts
-0.3 pt
FY09 NBVmargin
Business mix Expenses Marketconditions
FX, Country mix& Other
FY10 NBVmargin
18.0%
22.3%
-1.9 pts
+3.0 pts+3.5 pts
-0.3 pt
FY09 NBVmargin
Business mix Expenses Marketconditions
FX, Country mix& Other
FY10 NBVmargin
Page 6/26
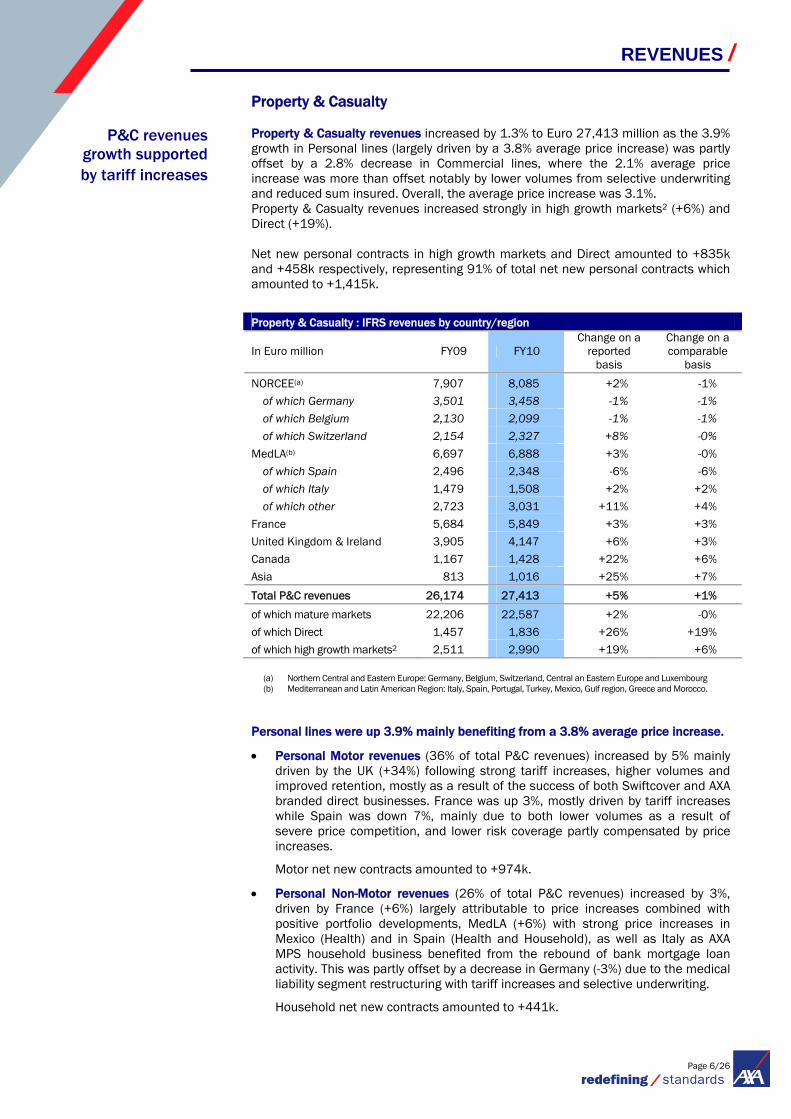
Property & Casualty Property & Casualty revenues increased by 1.3% to Euro 27,413 million as the 3.9% growth in Personal lines (largely driven by a 3.8% average price increase) was partly offset by a 2.8% decrease in Commercial lines, where the 2.1% average price increase was more than offset notably by lower volumes from selective underwriting and reduced sum insured. Overall, the average price increase was 3.1%. Property & Casualty revenues increased strongly in high growth markets2 (+6%) and Direct (+19%). Net new personal contracts in high growth markets and Direct amounted to +835k and +458k respectively, representing 91% of total net new personal contracts which amounted to +1,415k.
(a) Northern Central and Eastern Europe: Germany, Belgium, Switzerland, Central an Eastern Europe and Luxembourg (b) Mediterranean and Latin American Region: Italy, Spain, Portugal, Turkey, Mexico, Gulf region, Greece and Morocco.
Personal lines were up 3.9% mainly benefiting from a 3.8% average price increase.
• Personal Motor revenues (36% of total P&C revenues) increased by 5% mainly driven by the UK (+34%) following strong tariff increases, higher volumes and improved retention, mostly as a result of the success of both Swiftcover and AXA branded direct businesses. France was up 3%, mostly driven by tariff increases while Spain was down 7%, mainly due to both lower volumes as a result of severe price competition, and lower risk coverage partly compensated by price increases.
Motor net new contracts amounted to +974k.
• Personal Non-Motor revenues (26% of total P&C revenues) increased by 3%, driven by France (+6%) largely attributable to price increases combined with positive portfolio developments, MedLA (+6%) with strong price increases in Mexico (Health) and in Spain (Health and Household), as well as Italy as AXA MPS household business benefited from the rebound of bank mortgage loan activity. This was partly offset by a decrease in Germany (-3%) due to the medical liability segment restructuring with tariff increases and selective underwriting.
Household net new contracts amounted to +441k.
Property & Casualty : IFRS revenues by country/region
In Euro million FY09 FY10 Change on a
reported basis
Change on a comparable
basis
NORCEE(a) 7,907 8,085 +2% -1%
of which Germany 3,501 3,458 -1% -1% of which Belgium 2,130 2,099 -1% -1% of which Switzerland 2,154 2,327 +8% -0%
MedLA(b) 6,697 6,888 +3% -0%
of which Spain 2,496 2,348 -6% -6%
of which Italy 1,479 1,508 +2% +2%
of which other 2,723 3,031 +11% +4%
France 5,684 5,849 +3% +3%
United Kingdom & Ireland 3,905 4,147 +6% +3%
Canada 1,167 1,428 +22% +6%
Asia 813 1,016 +25% +7%
Total P&C revenues 26,174 27,413 +5% +1%
of which mature markets 22,206 22,587 +2% -0%
of which Direct 1,457 1,836 +26% +19%
of which high growth markets2 2,511 2,990 +19% +6%
P&C revenues growth supported by tariff increases
REVENUES /

Page 7/26
Commercial lines were down 2.8% as the 2.1% average price increase was more than offset notably by lower volumes from more selective underwriting and by reduced sum insured.
• Commercial Motor revenues (8% of total P&C revenues) were stable as increases, notably in the UK & Ireland (+10%), France (+2%) and Canada (+8%) were offset by Spain (-21%), reflecting tariff increase despite strong competition.
• Commercial non-Motor revenues (30% of total P&C revenues) decreased 3%, largely due to the UK (-11%) following AXA’s exit from certain property accounts in a very competitive environment, Belgium (-7%) as a consequence of selective underwriting in workers compensation, partly offset by the Gulf Region (+14%) with a strong new business in Health.
REVENUES /

Page 8/26
Asset Management • Asset Management revenues were up 5% to Euro 3,328 million, mainly driven by
higher average assets under management (up 3% vs. FY09) and higher average management fees, reflecting mainly product mix shift at AllianceBernstein.
• Assets Under Management were up Euro 33 billion versus December 31, 2009 to Euro 878 billion6 mainly as a result of:
Net outflows of Euro -64 billion due to:
Euro -44 billion at AllianceBernstein, primarily in institutional clients segment (Euro -37 billion) mainly on equity investments and in the Retail segment (Euro -6 billion),
Euro -20 billion at AXA IM, mainly driven by AXA Rosenberg (Euro -29 billion) while other expertises experienced net inflows of Euro +9 billion.
Market impact of Euro +53 billion due to market recovery
Forex impact of Euro +41 billion due to depreciation of the Euro versus other currencies.
Assets Under Management Roll-forward
In Euro billion Alliance Bernstein AXA IM Total
AUM at FY09 346 499 845
Net flows -44 -20 -64
Market appreciation +31 +22 +53
Scope & other impacts +6 -3 +3
Forex impact +24 +18 +41
AUM at FY10 362 516 878
Average AUM over the period 362 501 863
Change of average AUM on a reported basis +10% +4% +7%
Change of average AUM on a comparable basis +6% +2% +3%
International Insurance
International Insurance revenues were down 3% to Euro 2,847 million, mainly reflecting strict underwriting discipline and portfolio pruning at AXA Corporate Solutions Assurance.
International Insurance IFRS revenues
In Euro million FY09 FY10 Change on a
reported basis
Change on a comparable
basis
AXA Corporate Solutions Assurance 1,930 1,931 +0.0% -2.9%
AXA Assistance 765 772 +0.8% -2.0%
Other International activities 165 145 -12.1% -8.6%
Total International Insurance 2,860 2,847 -0.4% -2.9%
REVENUES /
Asset Management revenues supported
by higher average assets under management (+3%)
and higher average fees

Page 9/26
Earnings : Key figures
Change
In Euro million FY09 FY10 Reported
on a comparable
basis
Life & Savings 2,336 2,455 +5% +1%
Property & Casualty 1,670 1,692 +1% -2%
Asset Management 355 269 -24% -26%
International Insurance 286 290 +1% +0%
Banking (2) 9 na na
Holdings7 (793) (836) -5% -5%
Underlying Earnings8 3,854 3,880 +1% -3%
Realized capital gains 725 920
Impairments (1,028) (379)
Equity portfolio hedging (83) (104)
Adjusted Earnings8 3,468 4,317 +24% +20%
Change in fair value 612 185
Of which impact from credit spreads & interest rates 1,116 (42) Of which impact from equities & alternative assets (206) 224 Of which impact from ABS 63 131 Of which effects related to balance sheet protection items (361) (129) including interest rate derivatives (107) (89) including FX and related derivatives (excluding Forex on impairments) 149 (9) Including equity & real estate derivatives (403) (31) Exceptional and discontinued operations (202) (1,616)
Other (273) (138)
Net income 3,606 2,749 -24% -26%
Earnings per share
In Euro FY09 restated* FY10 Reported
Underlying EPS9 1.67 1.57 -6%
Adjusted EPS9 1.49 1.77 +18%
Net income per share** 1.56 1.08 -31%
Underlying Earnings, Adjusted Earnings, NBV and items of the analysis of change in fair value are non-GAAP measures and as such are not audited
* Following AXA’s rights issue in 4Q09, the average number of shares has been restated to take into account an adjustment factor of 1.023. In the average number of shares calculation, the adjustment factor has been applied on outstanding shares prior to the date of the capital increase leading to an adjustment on average number of shares of 48.4 million shares as of December 31, 2009. As of December 31, 2010, total net outstanding number of shares was 2,295 million and average fully diluted number of shares was 2,275 million.
** Revised net income per share takes into account interest payments related to perpetual debts classified in equity, excluding Forex impacts. Previously disclosed fully diluted net income per share included Forex adjustments and amounted to €1.51 in FY10.
EARNINGS /

Page 10/26
Underlying Earnings Underlying Earnings were down 3% to Euro 3,880 million. Life & Savings Underlying Earnings grew by 1% driven by an improving investment margin and higher average unit-linked assets partly offset by a decrease in net technical margin mainly on Variable Annuity. Property & Casualty Underlying Earnings decreased by 2% following a slight increase in combined ratio, up 0.2 pt to 99.1% (Current Year combined ratio improved by 2.0 pts more than offset by 2.2 pts lower positive prior year reserve developments). In Asset Management, Underlying Earnings fell by 26% mainly as a result of both a non-recurring 2009 tax benefit and a net provision in 2010 related to losses arising from AXA Rosenberg coding error, partly offset higher average assets under management. • Life & Savings Underlying Earnings were up 1% to Euro 2,455 million. Pre-tax
Underlying Earnings were up 6% to Euro 3,500 million
Underlying Earnings: margin analysis
Life & Savings Underlying Earnings : margin analysis
Change
In Euro million FY09 FY10 Reported
on a comparable
basis10
Margin on revenues 4,569 4,781 +5% -0%
Margin on assets 4,635 5,370 +16% +11% Of which Unit-Linked management fees 1,822 2,056 +13% +9% Of which General Account Investment margin 2, 179 2,536 +16% +14% Of which Other fees 633 778 +23% +8%
Technical margin 2,003 767 -62% -56% Of which mortality, morbidity & other 2,136 1,584 -26% -22% Of which variable annuity technical margin (133) (818) na na
Expenses, net of DAC/DOC (7,642) (7,190) -6% -8% Of which acquisition expenses (3,782) (3,153) -17% -14% Of which administrative expenses (3,860) (4,037) +5% -2%
VBI amortization (363) (250) -31% -35%
Tax and minority interests (865) (1,045) +21% +17%
Life & Savings Underlying Earnings 2,336 2,455 +5% +1%
- Margin on revenues was stable at Euro 4,781 million as the decrease in revenues (-3%) was offset by higher margins (+4%), mainly resulting from an improved business mix (increased contribution to revenues from Protection & Health business).
- Margin on assets was up 11% to Euro 5,370 million:
- Unit-Linked management fees were up 9% to Euro 2,056 million, benefiting from both higher average reserves (+5%) following equity market appreciation, and favourable country mix (+4%).
- General Account investment margin was up 14% to Euro 2,536 million mainly due to lower policyholders’ participation. Investment yield slightly decreased versus FY09 but remained above 4.0% benefiting from long asset duration.
- Other fees were up 8% to Euro 778 million mainly driven by favourable equity market evolution on Mutual funds businesses.
EARNINGS /
Increase in both investment margin
and fees partly offset by net technical
margin
Page 11/26
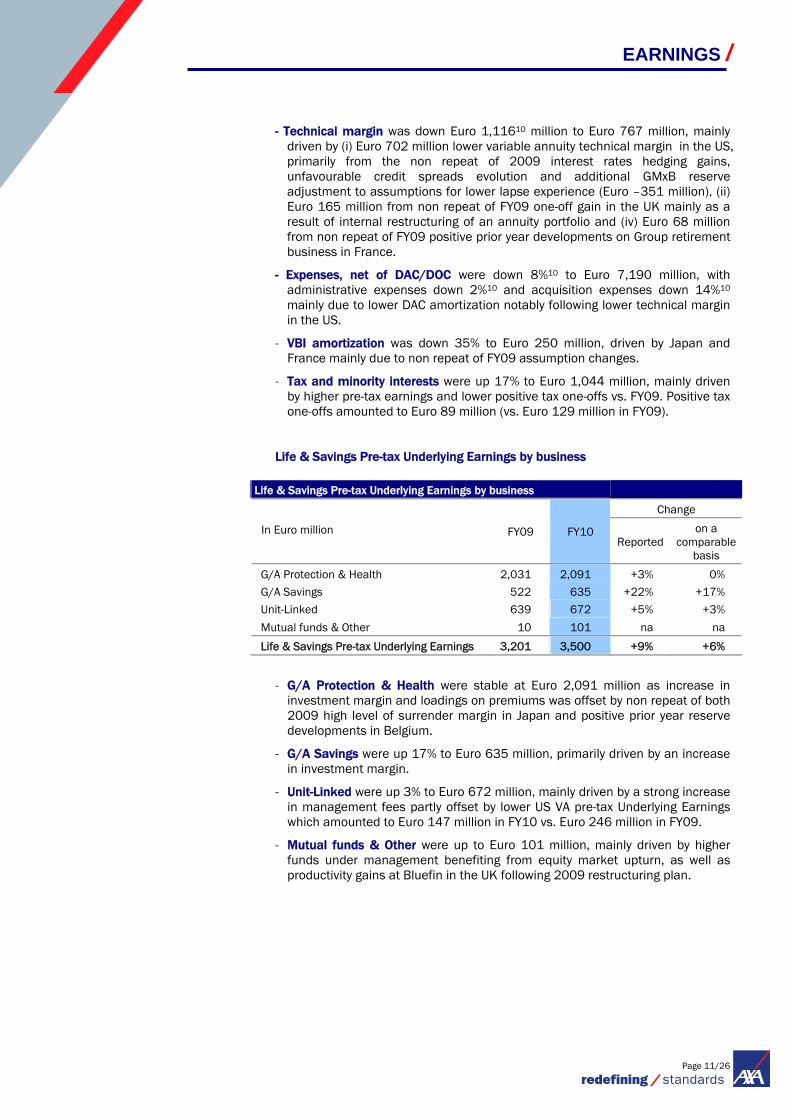
- Technical margin was down Euro 1,11610 million to Euro 767 million, mainly driven by (i) Euro 702 million lower variable annuity technical margin in the US, primarily from the non repeat of 2009 interest rates hedging gains, unfavourable credit spreads evolution and additional GMxB reserve adjustment to assumptions for lower lapse experience (Euro –351 million), (ii) Euro 165 million from non repeat of FY09 one-off gain in the UK mainly as a result of internal restructuring of an annuity portfolio and (iv) Euro 68 million from non repeat of FY09 positive prior year developments on Group retirement business in France.
- Expenses, net of DAC/DOC were down 8%10 to Euro 7,190 million, with administrative expenses down 2%10 and acquisition expenses down 14%10 mainly due to lower DAC amortization notably following lower technical margin in the US.
- VBI amortization was down 35% to Euro 250 million, driven by Japan and France mainly due to non repeat of FY09 assumption changes.
- Tax and minority interests were up 17% to Euro 1,044 million, mainly driven by higher pre-tax earnings and lower positive tax one-offs vs. FY09. Positive tax one-offs amounted to Euro 89 million (vs. Euro 129 million in FY09).
Life & Savings Pre-tax Underlying Earnings by business
Life & Savings Pre-tax Underlying Earnings by business
Change
In Euro million FY09 FY10 Reported
on a comparable
basis
G/A Protection & Health 2,031 2,091 +3% 0%
G/A Savings 522 635 +22% +17%
Unit-Linked 639 672 +5% +3%
Mutual funds & Other 10 101 na na
Life & Savings Pre-tax Underlying Earnings 3,201 3,500 +9% +6%
- G/A Protection & Health were stable at Euro 2,091 million as increase in investment margin and loadings on premiums was offset by non repeat of both 2009 high level of surrender margin in Japan and positive prior year reserve developments in Belgium.
- G/A Savings were up 17% to Euro 635 million, primarily driven by an increase in investment margin.
- Unit-Linked were up 3% to Euro 672 million, mainly driven by a strong increase in management fees partly offset by lower US VA pre-tax Underlying Earnings which amounted to Euro 147 million in FY10 vs. Euro 246 million in FY09.
- Mutual funds & Other were up to Euro 101 million, mainly driven by higher funds under management benefiting from equity market upturn, as well as productivity gains at Bluefin in the UK following 2009 restructuring plan.
EARNINGS /

Page 12/26
• Property & Casualty Underlying Earnings were down 2% to Euro 1,692 million with a combined ratio up 0.2 pt to 99.1% and a current year combined ratio down 2.0 points to 102.4%.
Property & Casualty : Combined ratio by country/region
In % FY09 FY10 Change on a comparable basis
NORCEE(a) 97.8 98.5 +0.9 pt
of which Belgium 99.8 98.5 -1.3 pts of which Switzerland 94.0 88.8 -5.1 pts of which Germany 98.7 104.6 +5.9 pts
France 99.1 99.1 +0.0 pt
MedLA(b) 99.0 97.7 -1.4 pts
UK & Ireland 102.2 103.9 +1.6 pts
Rest of the world 96.6 96.8 +0.3 pt
Total P&C 99.0 99.1 +0.2 pt (a) Northern Central and Eastern Europe: Germany, Belgium, Switzerland, Central and Eastern Europe, Luxembourg
and Ukraine (b) Mediterranean and Latin American Region: Italy, Spain, Portugal, Turkey, Mexico, Gulf region, Greece and Morocco.
Loss ratio increased by 0.3 point to 71.1% as a result of:
• -1.9 pts in current year loss ratio to 74.4% of which
- -0.2 pt from natural catastrophes (slightly lower than 2009 level driven by Xynthia storm in continental Europe, freezes in the UK and difficult winter conditions overall),
- -1.7 pts in current year loss ratio excluding natural catastrophes, mainly due to price increases (-2.0pts improvement on a net earned basis)
• +2.2 pts prior year reserve developments, with reserving ratio at 185%.
Expense ratio decreased by 0.1 point to 28.0% with acquisition expense ratio down 0.4 point (mainly thanks to the renegotiation of brokers’ commissions in the UK), while administrative expense ratio was up 0.3 point.
Investment income11 was fairly stable at Euro 2,115 million, with an investment yield at 4.0%.
Tax and minority interests were nearly flat at Euro 665 million as lower pre-tax earnings were offset by lower positive tax one-offs which amounted to Euro 13 million (vs. Euro 61 million in FY09)
P&C current year combined ratio down
2 points
EARNINGS /

Page 13/26
• Asset Management Underlying Earnings were down 26% to Euro 269 million
mainly as a result of both non-recurring 2009 tax benefit and a net provision related to losses arising from AXA Rosenberg coding error. Excluding these impacts, Underlying Earnings would have been up 12%.
AllianceBernstein Underlying Earnings were down 25% to Euro 143 million due to the non repeat of a Euro 62 million positive tax benefit in 2009. Excluding this impact, Underlying Earnings would have been up 12% benefiting from higher revenues mainly driven by higher average assets under management partly offset by higher expenses.
AXA Investment Managers Underlying Earnings were down 27% to Euro 125 million due to a Euro 66 million net provision related to losses arising from AXA Rosenberg coding error. Excluding this provision, Underlying Earnings would have been up 11% mainly due to higher revenues (mainly performance fees) and higher carried interests partly offset by higher expenses.
• International Insurance Underlying Earnings were flat at Euro 290 million, mainly as the strong performance of AXA Corporate Solution Assurance with 2.2 pts improvement in combined ratio (96.9% in FY10), was offset by lower favourable developments on run-off portfolios.
• Banking Underlying Earnings increased to Euro 9 million (vs. Euro -2 million in
FY09). • Holdings7 Underlying Earnings decreased by Euro 36 million on a comparable
basis to Euro -836 million.
Adjusted Earnings Adjusted Earnings increased strongly by 20% to Euro 4,317 million, benefiting from both higher realized capital gains and lower impairment charges.
FY10 realized capital gains amounted to Euro 92012 million vs. Euro 725 million in FY09. Impairments amounted to Euro 379 million (of which Euro 170 million on equities and Euro 166 million on fixed income assets) vs. Euro 1,028 million in FY09.
Net Income Net Income was down 26% to Euro 2,749 million. Excluding the Euro 1,642 million exceptional loss related to the partial sale of the UK Life operations, net income was up 18% to Euro 4,391 million, mainly benefiting from higher Adjusted Earnings. FY10 change in fair value amounted to Euro 185 million mainly as a result of:
(i) Euro -42 million impact from credit spreads and interest rates (ii) Euro +224 million mark to market of equity and alternative assets, mainly
Private Equity (iii) Euro +131 million impact from mark-to-market of ABS (iv) Euro -129 million impact from balance sheet derivatives
Other items amounted to Euro -1,616 million, of which Euro -1,642 million exceptional loss related to the partial sale of the UK Life operations.
Net income reduced by the partial sale of the
UK Life operations
Up 20% driven by higher realized gains and lower
impairments
Asset Management underlying earnings
impacted by one-offs
EARNINGS /

Page 14/26
Group Embedded Value Group EV was up Euro 3.7 billion from Euro 30.4 billion to Euro 34.2 billion, or up 11% to Euro 14.9 per share.
In Euro million 2009 In% of Group EV
2010 In% of Group EV
Opening Group EV 18,600 30,422
Opening adjustments 57 -106
Operating return 4,974 +27% 7,156 +24%
Investment experience 4,397 +24% -2,228 -7%
Total return on Group EV 9,371 +50% 4,928 +16%
Dividend paid -836 -1,259
Exchange rate movement impact 272 -193
Capital increases 2,434 385
Change in scope and other 522 -25
Closing Group EV 30,422 34,152
o/w VIF 18,456 20,087 o/w TNAV 11 967 14,065 In line with industry practices, AXA adjusted its market-consistent methodology in terms of liquidity premium (calibration and allowance by products) and yield curve extrapolation, resulting in an opening negative adjustment of Euro -0.3 billion. In 2010, the Group EV benefited from a Euro 1.7 billion impact from the use of a liquidity premium versus Euro 2.6 billion in 2009. Operating return amounted to Euro 7.2 billion. The increase vs. FY09 was mainly driven by higher inforce and new business contributions in Life & Savings as well as favourable operational assumption changes of Euro 1.8 billion mainly in France following the use of a lower projected loss ratio for Protection business based on positive experience in recent years. Investment experience amounted to Euro -2.2 billion mainly due to lower interest rates, higher interest rate volatilities and widening credit spreads.
Operating Free Cash Flow
Group Operating Free Cash Flow was up from Euro 3.1 billion to Euro 3.7 billion mainly benefiting from the increase in the Life & Savings Operating Free Cash Flow up from Euro 0.8 billion to Euro 1.4 billion.
Dividend
A dividend of Euro 0.69 per share (up 25% vs. FY09) will be proposed at the Annual General Meeting that will be held on April 27, 2011. The dividend is expected to be paid on May 4, 2011 with an ex-dividend date of April 29, 2011.
GROUP EV, FREE CASH FLOW & DIVIDEND /
Group EV up 11% to €14.9 per share
Page 15/26
Shareholders’ Equity & Solvency & Debt • Shareholders' equity was Euro 49.7 billion, up Euro 3.5 billion vs. December 31,
2009, benefiting from a Euro 1.5 billion increase in net unrealized gains, a positive Euro 1.0 billion forex impact net of hedging instruments and Euro 2.7 billion net income for the period, partly offset by Euro 1.3 billion 2009 dividend payment and by an increase of Euro 0.4 billion in pension deficits. Net unrealized gains on real estate & loans (not included in shareholders’ equity) increased by Euro 0.3 billion to Euro 2.913 billion as of December 31, 2010.
• Solvency I ratio was 182% post-dividend, up 11 points vs. December 31, 2009, notably benefiting from Underlying Earnings (+17 points) partly offset by proposed dividend (-7 points).
Indicative sensitivities to market movements are: -6 pts to -10% in equity markets, -6 pts to -10% in real estate markets, -2 pts to -10% in private equity market value. On fixed income assets, sensitivities to market movements are: -8 pts to 10 bps increase in interest rates, -3 pts to 10 bps increase in credit spreads, with the combination of both impacts capped at -28 pts of Solvency.
• Economic capital ratio increased from 167% as at December 31, 2009 to ca. 175% as at December 31, 2010.
• Financial structure. AXA’s net financial debt was up Euro 1.7 billion to Euro 15.2 billion, mainly from forex impact on nominal debt and related hedging instruments (Euro +3.1 billion), partly offset by the partial sale of the UK Life operations (Euro -1.7 billion).
Debt gearing was up 1 pt to 28% mainly as a result of forex impact partly offset by earnings net of dividend.
Interest coverage ratio increased to 8.5x from 7.9x in FY09. Invested assets
AXA’s invested assets amounted to Euro 618 billion including Euro 447 billion in the General Account, invested in a diversified portfolio mainly comprised of fixed income investments (83%), cash (5%), real estate (5%) and listed equities (4%).
General Account asset movements included:
(i) Net inflows: invested mainly in government bonds
(ii) Mark to market effect: fixed income assets benefiting from interest rate decreases
(iii) Forex effect: depreciation of the Euro mainly against USD, JPY and CHF
(iv) Scope effect: Euro -6 billion related to the partial sale of the UK Life operations.
Exposure to certain European government bonds: AXA’s exposure net of policyholders’ participation and tax was estimated at Euro 6.0bn for Italy, Euro 4.1bn for Spain, Euro 0.7bn for Portugal, Euro 0.3bn for Greece and Euro 0.3bn for Ireland.
Debt gearing up 1 pt to 28%
BALANCE SHEET /
Solvency I ratio up 11 points to 182%
Page 16/26
Notes
1 Annual Premium Equivalent (APE) represents 100% of new business regular premiums + 10% of new business single premiums. APE is Group
share. 2 Life & Savings high growth markets are: Hong-Kong, Central & Eastern Europe (Poland, Czech Republic, Slovakia and Hungary), South-East Asia
(Singapore, Indonesia, Philippine and Thailand), China, India, Morocco, Mexico and Turkey. Property & Casualty high growth markets are: Morocco, Mexico, Turkey, Gulf, Hong-Kong, Singapore, Malaysia, Russia, Ukraine and Poland (exc.
Direct) Direct markets are: AXA Global Direct (France, Belgium, Spain, Portugal, Italy, Poland, Korea and Japan), UK Direct operations. 3 New Business Value is Group share. 4 Operating Free Cash Flow corresponds to Underlying earnings of Property & Casualty, International, Asset Management and Banking activity in
addition to Life & Savings normalized expected cash flow from inforce net of new business investment (new business required capital + new business strain)
5 (net financing debt + perpetual subordinated debt) / (shareholders’ equity, excluding fair value recorded in shareholders’ equity + net financing debt).
6 The difference with Euro 1,104 billion of total assets under management corresponds to assets directly managed by AXA insurance companies. 7 And Other Companies
8 Underlying Earnings are Adjusted Earnings, excluding net capital gains attributable to shareholders. Adjusted Earnings represent Net income before the impact of exceptional operations, goodwill and related intangibles amortization/impairments, and profit or loss on financial assets (classified under the fair value option) and derivatives. Life & Savings NBV and APE, Adjusted and Underlying Earnings are non-GAAP measures and as such are not audited, may not be comparable to similarly titled measures reported by other companies, and should be read together with our GAAP measure. Management uses these non-GAAP measures as key indicators of performance in assessing AXA’s various businesses and believes that the presentation of these measures provide useful and important information to shareholders and investors as measures of AXA’s financial performance.
9 Net of interest charges on perpetual subordinated notes (TSDI) and perpetual deeply subordinated notes (TSS)
10 Changes are adjusted for the Forex and reclassifications between margins including the reclassification in France from technical margin to acquisition expenses of charges in the context of the renewal of some Group protection contracts in 2009. Full details are provided in the activity report.
11 Net of financial charges 12 Including Euro 190 million from release of the excess tax provision over exit tax on past realised capital gains on fixed maturity securities in French
insurance companies. 13 Excluding net unrealized gains on bank loans. Total off-balance sheet net unrealized gains, including net unrealized gains on bank loans,
amounted to Euro 3.3 billion in FY09 and Euro 3.5 billion in FY10 About AXA AXA Group is a worldwide leader in insurance and asset management, with 216,000 employees serving 93 million clients. In 2010, IFRS revenues amounted to Euro 91 billion and IFRS underlying earnings to Euro 3.9 billion. AXA had Euro 1,104 billion in assets under management as of December 31, 2010. The AXA ordinary share is listed on compartment A of Euronext Paris under the ticker symbol CS (ISN FR 0000120628 – Bloomberg: CS FP – Reuters: AXAF.PA). AXA’s American Depository Shares are also quoted on the OTC QX platform under the ticker symbol AXAHY. The Group is included in the main international SRI indexes, such as Dow Jones Sustainability Index (DJSI) and FTSE4GOOD.
This press release is available on the AXA Group website: www.axa.com
AXA Investor Relations: AXA Media Relations: Mattieu Rouot: +33.1.40.75.46.85 Emmanuel Touzeau: +33.1.40.75.46.74
Gilbert Chahine: +33.1.40.75.56.07 Brice Le Roux: +33.1.40.75.57.26
Sylvie Gleises: +33.1.40.75.49.05 Sara Gori: +33.1.40.75.58.06
Thomas Hude: +33.1.40.75.97.24 Guillaume Borie: +33.1.40.75.49.98
Solange Brossollet: +33.1.40.75.73.60 Hélène Caillet: +33.1.40.75.55.51
Florian Bezault: +33.1.40.75.59.17
Jennifer Lawn: +1.212.314.28.68
AXA Individual shareholders Relations: +33.1.40.75.48.43
IMPORTANT LEGAL INFORMATION AND CAUTIONARY STATEMENTS CONCERNING FORWARD-LOOKING STATEMENTS
Certain statements contained herein are forward-looking statements including, but not limited to, statements that are predictions of or indicate future events, trends, plans or objectives. Undue reliance should not be placed on such statements because, by their nature, they are subject to known and unknown risks and uncertainties. Please refer to the section “Cautionary statements” in page 2 of AXA’s Document de Référence for the year ended December 31, 2009, for a description of certain important factors, risks and uncertainties that may affect AXA’s business. AXA undertakes no obligation to publicly update or revise any of these forward-looking statements, whether to reflect new information, future events or circumstances or otherwise.
NOTES & OTHER INFORMATION /

Page 17/26
AXA Group IFRS revenues – contributions & growth by segment and country/region
FY09 FY10 IFRS revenues change In Euro million
IFRS IFRS Reported Comp. basis
United States 9,384 9,458 +0.8% -3.4%
France 16,340 14,624 -10.5% -10.5%
NORCEE 14,187 15,047 +6.1% +3.1%
of which Germany 6,694 6,867 +2.6% +2.6%
of which Switzerland 4,437 5,082 +14.5% +5.6%
of which Belgium 2,515 2,504 -0.4% -0.4%
of which Central & Eastern Europe 468 512 +9.4% +4.5%
United Kingdom 2,783 2,040 -26.7% -0.0%
Asia Pacific 8,337 8,676 +4.1% -3.5%
of which Japan 5,438 5,560 +2.3% -4.1%
of which Australia/New-Zealand 1,532 1,551 +1.3% -17.1%
of which Hong Kong 1,203 1,321 +9.8% +13.3%
of which South East Asia & China 164 244 +48.5% 30.3%
MedLA 6,473 6,944 +7.3% +7.0% of which Spain 754 724 -4.0% -4.0% of which Italy 4,994 5,483 +9.8% +9.8% of which other 725 738 +1.8% -0.7%
Canada 115 132 +14.1% -0.7%
Life & Savings 57,620 56,923 -1.2% -2.5%
of which Mature markets 55,402 54,439 -1.7% -3.0% of which high growth markets2 2,218 2,485 12.0% +10.8%
NORCEE 7,907 8,085 +2.2% -0.9%
of which Germany 3,501 3,458 -1.3% -1.3%
of which Belgium 2,130 2,099 -1.5% -1.5%
of which Switzerland 2,154 2,327 +8.1% -0.4%
France 5,684 5,849 +2.9% +2.9%
Mediterranean Region 6,697 6,888 +2.9% -0.0% of which Spain 2,496 2,348 -5.9% -5.9% of which Italy 1,479 1,508 +2.0% +2.0% of which other 2,723 3,031 +11.3% +4.2%
United Kingdom & Ireland 3,905 4,147 +6.2% +3.1%
Canada 1,167 1,428 +22.3% +6.4%
Asia 813 1,016 +24.9% +6.8%
Property & Casualty 26,174 27,413 +4.7% +1.3%
AXA Corporate Solutions Assurance 1,930 1,931 +0.0% -2.9%
Others 930 917 -1.5% -3.0%
International Insurance 2,860 2,847 -0.4% -2.9%
AllianceBernstein 1,887 2,109 +11.8% +7.2%
AXA Investment Managers 1,187 1,219 +2.6% +1.5%
Asset Management 3,074 3,328 +8.2% +5.0%
Banking 395 459 +16.3% +16.0%
Total 90,124 90,972 +0.9% -1.1%
APPENDIX 1: AXA Group IFRS revenues – FY10 vs. FY09 /

Page 18/26
Breakdown of APE – 12 main countries, regions and modelled businesses
FY10 APE % UL in APE (excl. mutual funds) Group share
in Euro million UL Non-UL Mutual
Funds FY09 FY10
UL change on comparable basis
France 153 1,231 12% 11% -18%
United States 438 210 338 74% 68% -23%
United Kingdom 402 30 114 88% 93% +22%
NORCEE
Germany 131 334 28% 28% -1%
Switzerland 28 254 0 12% 10% -13%
Belgium 19 200 5% 9% +40%
Central & Eastern Europe 201 28 45 78% 88% +33%
ASIA PACIFIC
Japan 119 346 20% 26% +3%
Australia/New-Zealand 31 43 209 43% 42% -31%
Hong Kong 63 96 0 36% 40% +39%
South East Asia & China 84 81 51% 51% +64%
MedLA 106 436 10 21% 20% +6%
Spain 13 66 8 14% 17% +15%
Italy 88 271 2 26% 24% +7%
Other (a) 5 100 7% 5% -21%
Total 1,776 3,290 715 38% 35% +0%
(a) Portugal, Greece, Turkey, Mexico and Morocco
APPENDIX 2: Life & Savings – Breakdown of APE between Unit-Linked non Unit-Linked and mutual funds /

Page 19/26
(In million local currency except Japan in billion) 1Q09 2Q09 3Q09 4Q09 1Q10 2Q10 3Q10 4Q10
Life & Savings
United States 4,197 3,257 2,670 2,962 3,084 3,174 3,138 3,249
France 4,012 4,012 3,623 4,694 3,824 3,502 3,500 3,799
NORCEE
of which Germany 1,516 1,540 1,829 1,810 1,696 1,786 1,628 1,757 of which Switzerland 4,188 922 749 838 4,325 899 868 978 of which Belgium 534 514 603 865 731 605 549 618 of which Central & Eastern Europe 115 113 116 124 119 118 123 151 United Kingdom 556 599 620 705 605 612 417 123
Asia Pacific
of which Japan 174 188 167 176 154 210 154 158 of which Australia/New-Zealand 918 607 586 606 559 646 544 513 of which Hong Kong 3,178 3,099 3,317 3,407 3,368 3,493 3,659 3,196
MedLA 1,417 1,532 1,471 2,053 2,355 1,879 1,464 1,245
Property & Casualty
NORCEE
of which Germany 1,619 587 699 596 1,584 593 692 588 of which Switzerland 2,686 260 162 144 2,645 256 182 154 of which Belgium 648 513 491 479 634 504 479 482
France 1,864 1,224 1,346 1,250 1,902 1,279 1,375 1,293
MedLA 1,725 1,678 1,403 1,891 1,745 1,693 1,469 1,982
United Kingdom & Ireland 881 952 891 757 872 978 902 821
Asia 212 205 206 191 243 258 279 236
Canada 385 530 484 452 404 560 528 478
International Insurance
AXA Corporate Solutions Assurance 900 355 343 332 933 338 326 334
Others 279 196 234 221 279 212 208 217
Asset Management
AllianceBernstein 610 624 667 731 701 712 685 722
AXA Investment Managers 295 284 284 325 302 303 263 350
Banking & Holdings 78 89 91 80 90 97 87 117
APPENDIX 3: AXA Group IFRS Revenues in local currency – Discrete quarters /

Page 20/26
Property & Casualty revenues – contribution & growth by business line
Personal Motor Personal Non-Motor Commercial Motor Commercial Non-Motor
in % % Gross revenues Change on comp.
basis % Gross revenues Change on comp. basis % Gross revenues Change on comp.
basis % Gross revenues Change on comp. basis
France 33% +3% 29% +6% 8% +2% 31% +0%
United Kingdom (a) 26% +34% 36% +1% 7% +10% 32% -11%
NORCEE 32% +1% 26% -1% 7% +1% 32% -3%
Of which Germany 28% -1% 36% -3% 6% +2% 22% -1% Of which Belgium 30% +2% 21% +3% 12% -1% 37% -7% Of which Switzerland 35% +1% 17% +2% 4% +0% 44% -2%
MedLA 43% +1% 21% +6% 10% -7% 26% -4%
Of which Spain 51% -7% 24% +4% 7% -21% 18% -8% Of which Italy 57% +2% 30% +5% 1% -37% 12% +1% Of which other (b) 31% +14% 13% +11% 17% +1% 39% -3%
Canada 37% +6% 20% +8% 7% +8% 37% +5%
Asia 73% +4% 8% +23% 5% +12% 16% +1%
Total 36% +5% 26% +3% 8% -0% 30% -3%
(a) Including Ireland. (b) Portugal, Greece, Turkey, Mexico, Gulf region and Morocco
APPENDIX 4: FY10 Property & Casualty revenues contribution & growth by business line /
Page 21/26
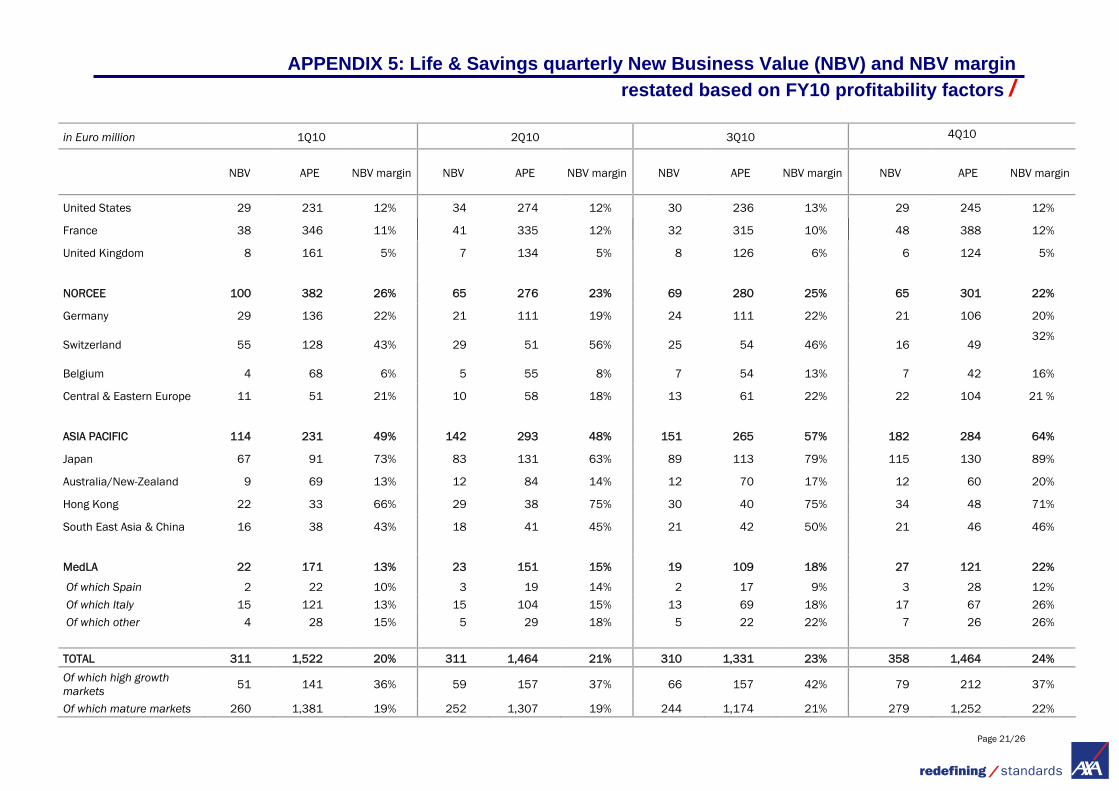
in Euro million 1Q10 2Q10 3Q10 4Q10
NBV APE NBV margin NBV APE NBV margin NBV APE NBV margin NBV APE NBV margin
United States 29 231 12% 34 274 12% 30 236 13% 29 245 12%
France 38 346 11% 41 335 12% 32 315 10% 48 388 12%
United Kingdom 8 161 5% 7 134 5% 8 126 6% 6 124 5%
NORCEE 100 382 26% 65 276 23% 69 280 25% 65 301 22%
Germany 29 136 22% 21 111 19% 24 111 22% 21 106 20%
Switzerland 55 128 43% 29 51 56% 25 54 46% 16 49 32%
Belgium 4 68 6% 5 55 8% 7 54 13% 7 42 16%
Central & Eastern Europe 11 51 21% 10 58 18% 13 61 22% 22 104 21 %
ASIA PACIFIC 114 231 49% 142 293 48% 151 265 57% 182 284 64%
Japan 67 91 73% 83 131 63% 89 113 79% 115 130 89%
Australia/New-Zealand 9 69 13% 12 84 14% 12 70 17% 12 60 20%
Hong Kong 22 33 66% 29 38 75% 30 40 75% 34 48 71%
South East Asia & China 16 38 43% 18 41 45% 21 42 50% 21 46 46%
MedLA 22 171 13% 23 151 15% 19 109 18% 27 121 22%
Of which Spain 2 22 10% 3 19 14% 2 17 9% 3 28 12%
Of which Italy 15 121 13% 15 104 15% 13 69 18% 17 67 26%
Of which other 4 28 15% 5 29 18% 5 22 22% 7 26 26%
TOTAL 311 1,522 20% 311 1,464 21% 310 1,331 23% 358 1,464 24%
Of which high growth markets 51 141 36% 59 157 37% 66 157 42% 79 212 37%
Of which mature markets 260 1,381 19% 252 1,307 19% 244 1,174 21% 279 1,252 22%
APPENDIX 5: Life & Savings quarterly New Business Value (NBV) and NBV margin restated based on FY10 profitability factors /
Page 22/26
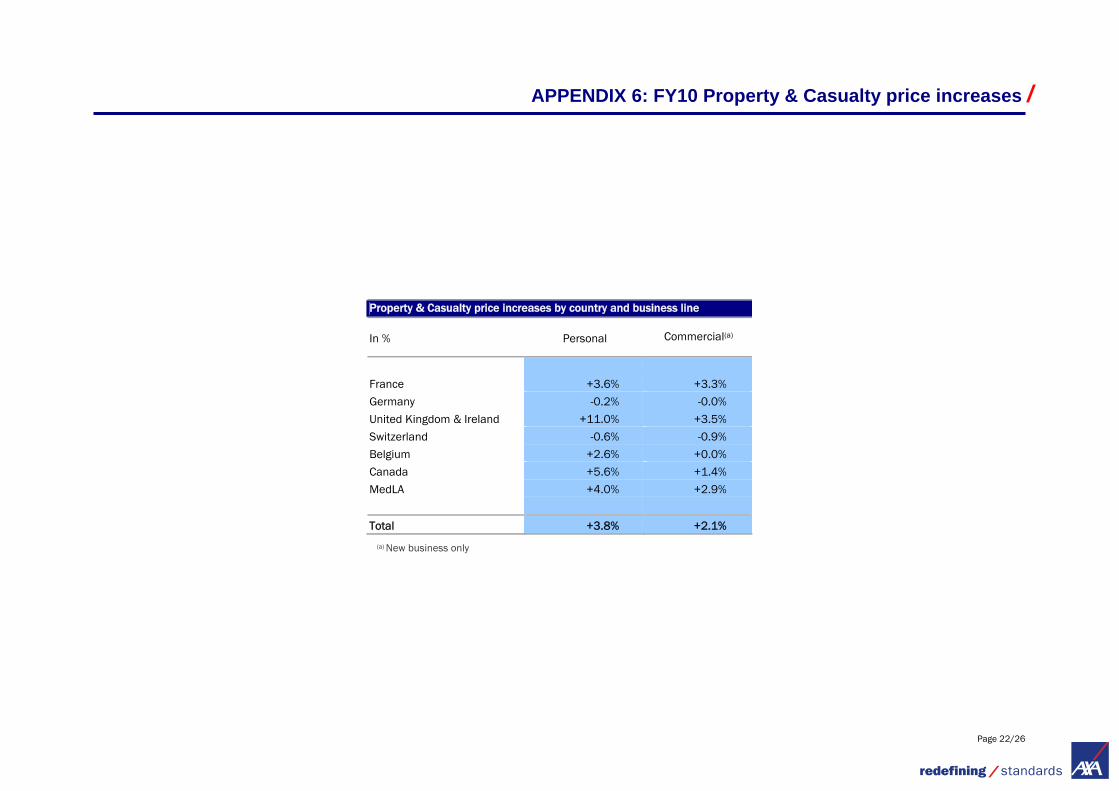
Property & Casualty price increases by country and business line
In % Personal Commercial(a)
France +3.6% +3.3%
Germany -0.2% -0.0%
United Kingdom & Ireland +11.0% +3.5%
Switzerland -0.6% -0.9%
Belgium +2.6% +0.0%
Canada +5.6% +1.4%
MedLA +4.0% +2.9%
Total +3.8% +2.1%
(a) New business only
APPENDIX 6: FY10 Property & Casualty price increases /

Page 23/26
in Euro million FY09
APE
FY10
APE Change on a
comparable basis FY09 NBV
FY10 NBV
Change on a comparable basis
FY10 NBV/APE margin
Change on a comparable basis
United States 994 986 - 4.9% 73 122 + 61.7% 12.4% + 5.1 pts
France 1,602 1,384 - 13.6% 145 159 + 10.2% 11.5% + 2.5 pts
United Kingdom 926 545 + 36.3% 97 29 - 57.9% 5.4% - 12.0 pts
NORCEE 1,156 1,239 -0.8% 223 299 + 21.7% 24.1% + 4.4 pts
Germany 469 464 - 1.1% 63 96 + 51.5% 20.6% + 7.2 pts
Switzerland 255 283 + 2.2 % 84 124 + 35.7% 43.9% + 10.8 pts
Belgium 264 218 - 17.2% 41 22 - 46.1% 10.2% - 5.5 pts
Central & Eastern Europe 168 274 + 15.6% 34 56 + 16.1% 20.6% + 0.1 pt
ASIA PACIFIC 1,013 1,073 - 5.1% 496 589 + 9.4% 54.9% + 7.5 pts
Japan 532 465 - 18.0% 330 354 + 0.7% 76.1% + 14.2 pts
Australia/New-Zealand 269 283 - 13.9% 38 44 - 4.0% 15.6% + 1.6 pts
Hong Kong 123 159 + 24.8% 78 114 + 39.9% 71.6% + 7.7 pts
South East Asia & China 88 166 + 58.0% 50 77 + 29.1% 46.2% - 10.3 pts
MedLA 497 553 + 9.9% 79 91 + 14.2% 16.5% + 0.6 pt
Spain 92 87 - 5.5% 9 10 + 7.3% 11.4% + 1.4 pts
Italy 310 361 + 16.2% 53 60 + 13.8% 16.7% - 0.3 pt
Other 95 105 + 3.9% 17 21 + 19.0% 20.2% + 2.6 pts
TOTAL 6,188 5,780 - 2.4% 1,113 1,290 + 11.8% 22.3% + 2.8 pts
Of which high growth markets 434 667 + 25.2% 168 254 + 30.1% 38.2% + 1.4 pts
Of which mature markets 5,754 5,114 -5.0% 944 1,035 + 8.2% 20.2% + 2.4 pts
APE, NBV & NBV margin - main countries, regions and modelled businesses
APPENDIX 7: Life & Savings New Business Volume (APE), Value (NBV) and NBV to APE margin /

Page 24/26
Net income Group Share
Integration costs
Goodwill and related
intangibles
Exceptional and discontinued operations
Profit or loss (including change)
on financial assets (under Fair
Value option) & derivatives
Adjusted Earnings
Net realized capital gains
attributable to shareholders
Underlying Earnings Underlying Earnings
Consolidated Earnings (in Euro million)
FY09 FY10 FY09 FY10 FY09 FY10 FY09 FY10 FY09 FY10 FY09 FY10 FY09 FY10 FY09 FY10 Change
Change at
constant FX
Life & Savings 2,075 1,396 (11) (16) (21) (23) (105) (1,646) (52) 347 2,263 2,734 (73) 279 2,336 2,455 +5% +1%
France 842 917 - - - - - - 281 63 561 854 91 247 470 607 +29% +29%
United States (28) 410 - (3) (1) (1) - - (555) 73 529 340 (16) (138) 545 478 -12% -16%
United Kingdom (33) (1,468) - (1) (13) (12) (3) (1,642) (165) 59 148 128 (38) (6) 186 134 -28% -30%
Japan 420 377 (2) (9) - - - - 191 46 231 340 20 5 211 335 +59% +49%
Germany (50) 214 (3) (0) - - (84) 1 25 29 12 185 (145) 11 157 174 +11% +11%
Switzerland 185 361 - - (5) (6) (16) 51 (19) 69 225 247 (1) 34 226 212 -6% -14%
Belgium 439 265 (4) (3) 0 - - (4) 188 33 256 239 24 69 231 170 -27% -27%
Mediterranean Region 139 127 (1) - (0) (0) 1 - 20 (24) 119 152 4 35 115 117 +2% +1%
Other countries 161 194 - (0) (2) (3) (3) (52) (17) (0) 183 250 (12) 22 195 228 +17% +5%
of which Australia/New Zealand
27 76 - - - - 10 (2) (12) 1 29 77 (17) (4) 46 82 +77% +46%
of which Hong Kong 132 162 - - - - - - (4) - 137 161 2 19 135 142 +6% +1%
Property & Casualty 1,516 1,750 (46) (22) (64) (64) 32 6 187 27 1,406 1,803 (264) 111 1,670 1,692 +1% -2%
France 445 462 - - - - - - 65 (6) 380 468 (26) 36 406 432 +6% +6%
United Kingdom & Ireland 44 32 - (10) (6) (5) - - 7 5 42 42 (58) (9) 100 50 -50% -49%
Germany 207 190 (21) (3) - (0) 26 - 23 7 179 185 (105) 8 283 177 -38% -38%
Belgium 186 151 (18) (9) (2) (2) - (2) 62 20 143 144 (25) (15) 168 159 -6% -6%
MedLA 277 368 (7) - (25) (24) 7 (1) 22 13 281 380 (44) 22 326 358 +10% +8%
Switzerland 227 370 - - (25) (26) (1) 9 5 (12) 247 400 (13) 40 260 359 +38% +27%
Other countries 130 177 - (0) (6) (7) - - 3 (1) 133 185 7 28 126 157 +24% +10%
International Insurance 326 378 - - (1) - 1 3 20 32 306 343 19 53 286 290 +1% +0%
AXA Corporate Solutions Assurance
160 192 - - - - - - 16 26 144 166 12 5 132 161 +22% +21%
Other 166 186 - - (1) - 1 3 5 6 161 177 7 48 154 129 -16% -18%
Asset Management 409 255 - (31) - - 5 2 49 21 355 264 - (5) 355 269 -24% -26%
AllianceBernstein 205 116 - (29) - - - 2 20 0 185 143 - 0 185 143 -22% -25%
AXA Investment Managers 204 139 - (2) - - 5 - 29 20 171 120 - (5) 171 125 -27% -27%
Banking (17) 9 (4) (6) - (0) - - (8) 9 (6) 7 (4) (3) (2) 9 +643% +758%
Holdings & other (703) (1,040) - (0) - - (135) 20 288 (226) (857) (834) (64) 2 (793) (836) -5% -5%
TOTAL 3,606 2,749 (60) (76) (85) (87) (202) (1,616) 485 210 3,468 4,317 (386) 437 3,854 3,880 +1% -3%
APPENDIX 8: Earnings summary after taxes and minority interests /

Page 25/26
AXA Group Assets AXA Group liabilities
In Euro billion FY09 FY10 (preliminary) In Euro billion FY09 FY10
(preliminary)
Goodwill 16.5 16.7 Shareholders’ Equity, Group share 46.2 49.7
VBI 3.6 3.1 Minority interests 3.7 4.2
DAC & equivalent 18.8 19.6 SH EQUITY & MINORITY INTERESTS 49.9 53.9
Other intangibles 3.1 3.6 Financing debt 10.2 10.5
Investments 590.0 594.7 Technical reserves 569.1 563.6
Other assets & receivables 56.6 71.9 Provisions for risks & charges 9.5 10.5
Cash & cash equivalents 19.6 22.1 Other payables & liabilities 69.5 93.5
TOTAL ASSETS 708.3 731.9
TOTAL LIABILITIES 708.3 731.9
APPENDIX 9: AXA Group simplified Balance Sheet /
Page 26/26
• 10/28/2010 – ICBC joined forces with AXA and Minmetals to expand in China insurance market together
• 10/28/2010 – 9M 2010 activity indicators
• 10/29/2010 – AXA announces the subscription prices for its 2010 employee share offering (Shareplan 2010)
• 11/02/2010 – AXA Global P&C announces the successful placement of €275 million catastrophe bonds
• 11/15/2010 – AXA and AMP make a joint proposal to AXA APH where AXA would dispose of its 54% stage in AXA APH to AMP and would acquire AXA APH Asian operations
• 11/16/2010 – AXA holds today its Autumn Investor Seminar
• 11/29/2010 – AXA, AMP and AXA APH have signed a transaction documents to implement proposal
• 12/03/2010 – Christopher “Kip” Condron to retire first of the year
• 12/06/2010 – Results of the AXA Group employee share offering in 2010
• 12/20/2010 - Jérôme Droesch is appointed CEO of AXA Gulf
• 12/30/2010 – AXA Central & Eastern Europe continues its expansion: acquisition of B&B Insurance in Belarus
• 02/01/2011 – AXA signs the European Road Safety Charter
• 02/03/2011 – No additional material impact expected from AXA Rosenberg settlement with the US SEC
Please refer to the following web site address for further details: http://www.axa.com/en/press/pr/
Shareholders’ Equity No significant operations. Debt No significant operations.
APPENDIX 10: 4Q10 AND 1Q11 Main Press Releases /
APPENDIX 11: 4Q10 operations on AXA shareholders’ equity and debt /