2011 Final City Budget Presentation
37
Public Hearing Presentation Proposed 2011 Budget for the City of Rochester December 6, 2010
Transcript of 2011 Final City Budget Presentation

Public Hearing Presentation
Proposed 2011 Budget
for the
City of Rochester
December 6, 2010

CITY OF ROCHESTER2011 PROPOSED BUDGET SUMMARY
December 6, 2010, 7:00 p.m., City Council Chambers• Initial Public Hearing on 2011 Proposed Budget
December 6, 2010, 2:00 p.m., Room 104, City Hall• Mayor/Council Review of Individual Department Budget Requests
December 7, 2010, 2:00 p.m., Room 104, City Hall• Mayor/Council Continued Review of Individual Department Budget
Requests
December 8, 2010, 2:00 p.m., Room 104, City Hall• Mayor/Council Continued Review of Individual Department Budget
Requests ( if needed)
December 20, 2010, 7:00 p.m., City Council Chambers• Adoption Public Hearing for 2011 Budget
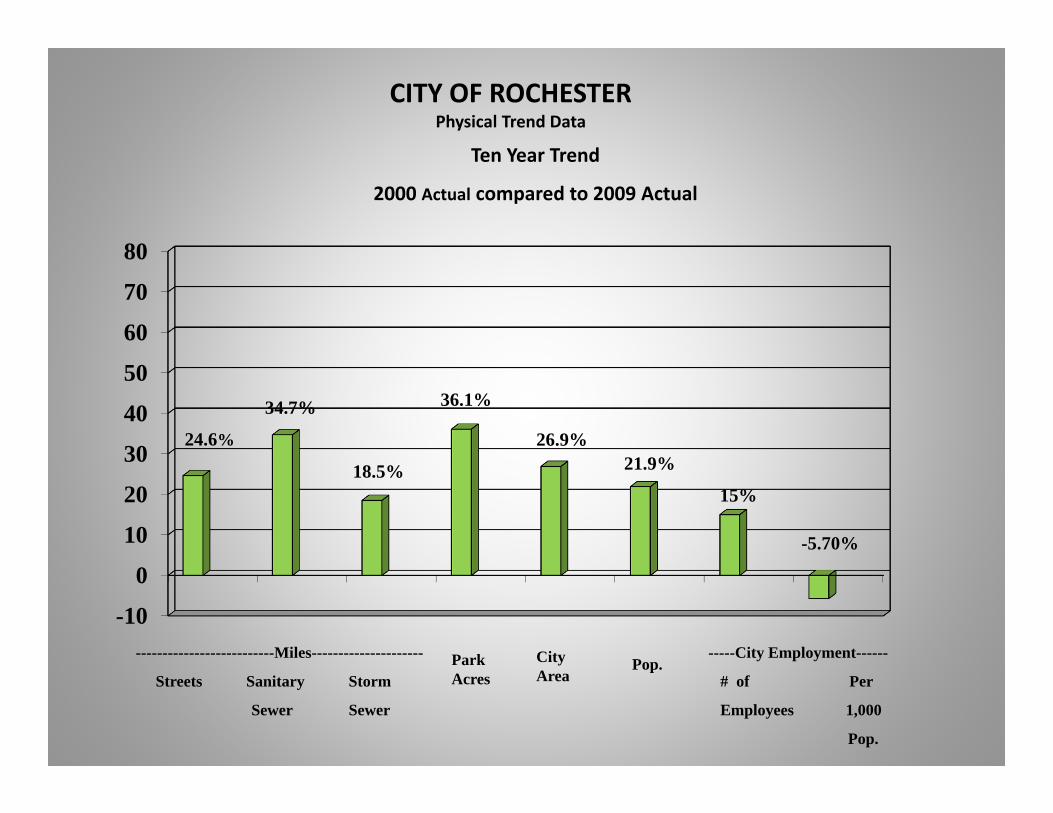
CITY OF ROCHESTERPhysical Trend Data
-10
0
10
20
30
40
50
60
70
80
Ten Year Trend
2000 Actual compared to 2009 Actual
--------------------------Miles---------------------
Streets Sanitary Storm
Sewer Sewer
Park Acres
CityArea
Pop.-----City Employment------
# of Per
Employees 1,000
Pop.
-5.70%
15%
21.9%26.9%
36.1%34.7%
24.6%
18.5%

APPLICATION BY CHARACTERTotal Budget
PROPOSED 2011
36.2%
29.2%1.5%
29.0%
4.1%
EMPLOYEE SERVICES
OTHER CURRENT
CAPITAL OUTLAY
CAPITAL IMPROVEMENT
DEBT SERVICE
EMPLOYEE SERVICES
OTHER CURRENT
CAPITAL OUTLAY
CAPITAL IMPROVEMENTS
DEBT SERVICE
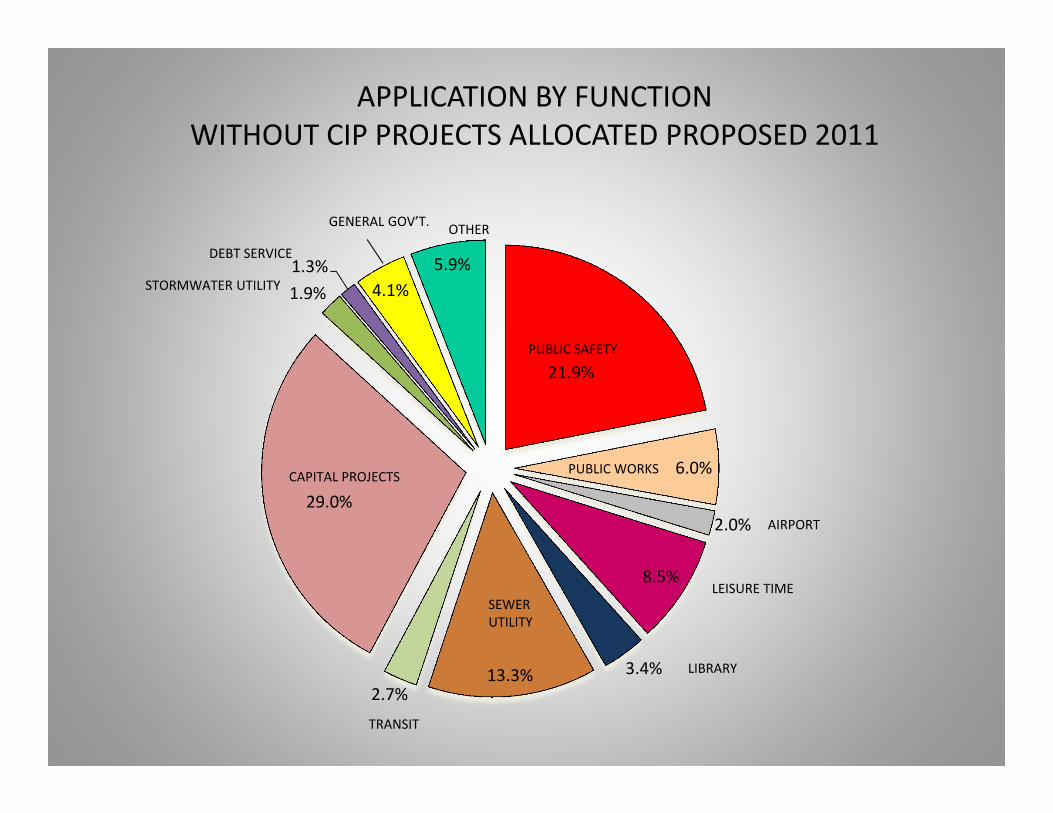
21.9%
6.0%
2.0%
8.5%
3.4%13.3%2.7%
29.0%
1.9%1.3%
4.1%5.9%
PUBLIC SAFETY
PUBLIC WORKS
AIRPORT
LEISURE TIME
LIBRARY
SEWER UTILITY
TRANSIT
CAPITAL PROJECTS
STORMWATER UTILITY
DEBT SERVICE
GENERAL GOV’T. OTHER
APPLICATION BY FUNCTIONWITHOUT CIP PROJECTS ALLOCATED PROPOSED 2011

REVENUE SOURCESPROPOSED 2011 TOTAL BUDGET
26.2%
2.7%
2.1%
10.2%
22.5%
36.3%
Property Taxes
Non Property Taxes
Licenses & FinesOther Govts
Charges for Services
Misc. / Prior Yr

2011 PROPOSED BUDGETANALYSIS OF MAJOR REVENUES
2011 Budget 2010 Budget Increase/(Decrease)
Tax Levy & TaxAbatements
45,967,888 44,272,624 1,695,264
Local Government Aid 5,101,571 5,101,571 -0-
Hotel/Motel Tax 3,500,000 3,250,000 250,000
Cable TV Franchise Fee 1,275,000 1,300,000 (25,000)
Inspection Permits 2,020,000 1,885,000 135,000
In Lieu of Tax 10,845,623 10,755,268 90,355
Sewer Utility Charge 17,261,577 15,820,000 1,441,577
Storm Water Utility Fee 5,014,143 4,432,372 581,771
Library Fund-City Share-County Share
4,893,321948,696
4,802,357894,168
90,96454,528
Municipal Recreation Fund-Fee Revenues-Non-Fee Revenues
7,376,7326,330,899
7,124,9955,787,986
251,737542,913
Parking Fund-Parking Fines-Parking Ramps-Street Meters-Parking Lots
531,6243,469,696
885,682394,323
525,0003,189,070
790,000342,019
6624280,626
95,68252,304
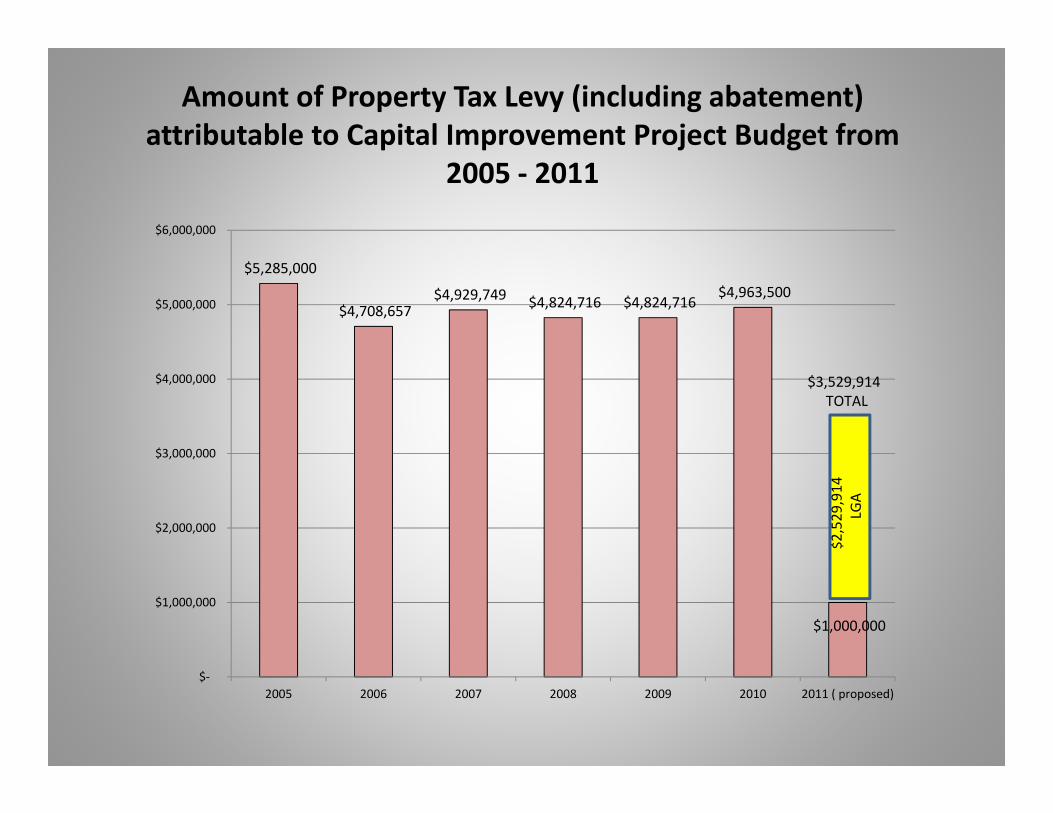
Amount of Property Tax Levy (including abatement) attributable to Capital Improvement Project Budget from
2005 ‐ 2011
$5,285,000
$4,708,657 $4,929,749 $4,824,716 $4,824,716
$4,963,500
$1,000,000
$‐
$1,000,000
$2,000,000
$3,000,000
$4,000,000
$5,000,000
$6,000,000
2005 2006 2007 2008 2009 2010 2011 ( proposed)
$2,529
,914
LGA
$3,529,914TOTAL
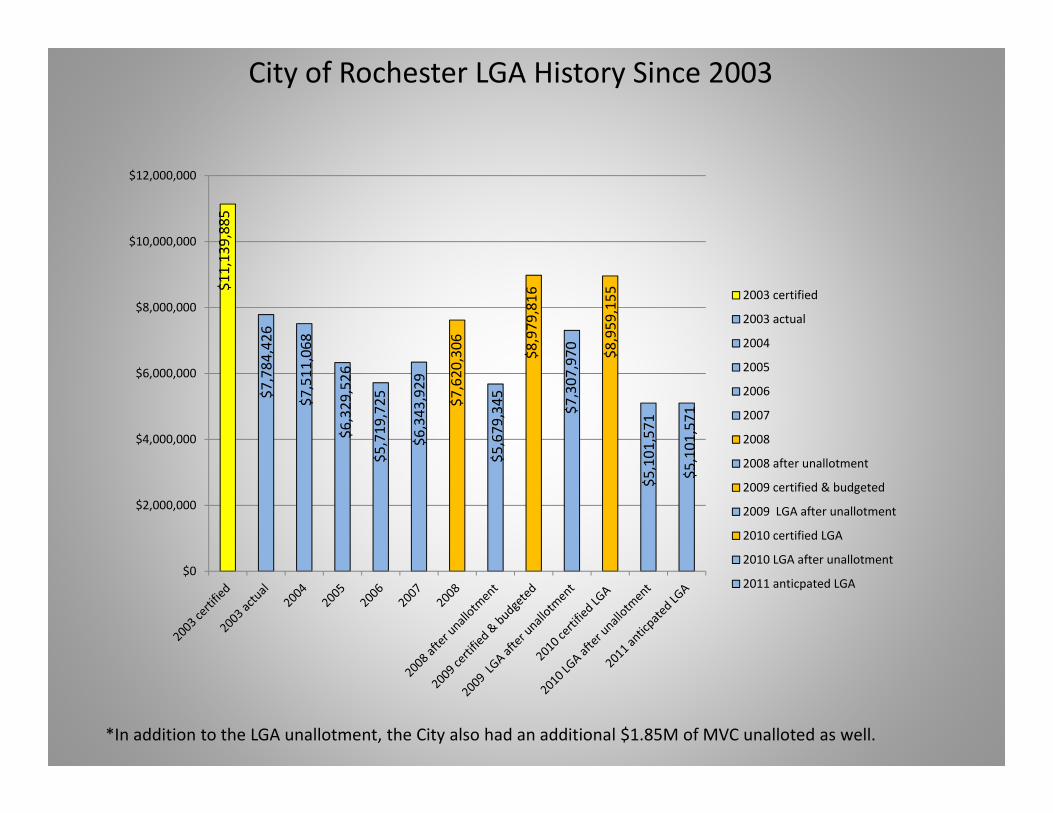
$11,139,885
$7,784,426
$7,511,068
$6,329,526
$5,719,725
$6,343,929
$7,620,306
$5,679,345
$8,979,816
$7,307,970 $8,959,155
$5,101,571
$5,101,571
$0
$2,000,000
$4,000,000
$6,000,000
$8,000,000
$10,000,000
$12,000,000
2003 certified
2003 actual
2004
2005
2006
2007
2008
2008 after unallotment
2009 certified & budgeted
2009 LGA after unallotment
2010 certified LGA
2010 LGA after unallotment
2011 anticpated LGA
City of Rochester LGA History Since 2003
*In addition to the LGA unallotment, the City also had an additional $1.85M of MVC unalloted as well.

$(3,355,459)
$(3,628,817)
$(4,810,359)
$(5,420,160)
$(4,795,926)
$(5,460,540)
$(3,831,915)
$(6,038,314)
$(1,825,158)
$(6,038,314)
$(45,204,962)
$(50,000,000)
$(45,000,000)
$(40,000,000)
$(35,000,000)
$(30,000,000)
$(25,000,000)
$(20,000,000)
$(15,000,000)
$(10,000,000)
$(5,000,000)
$‐
Annual LGA loss from 2003 proposed baseof $11,139,885
Cumulative LGA loss for City of Rochester since 2003, with actual and proposed LGA cuts through 2011

20.06%
13.18%
5.74%
0.00%
5.00%
10.00%
15.00%
20.00%
25.00%
LGA % of Total Gov't. Operating Budget
1990 2000 2011
LGA as a % of City Governmental Operating Budget
12
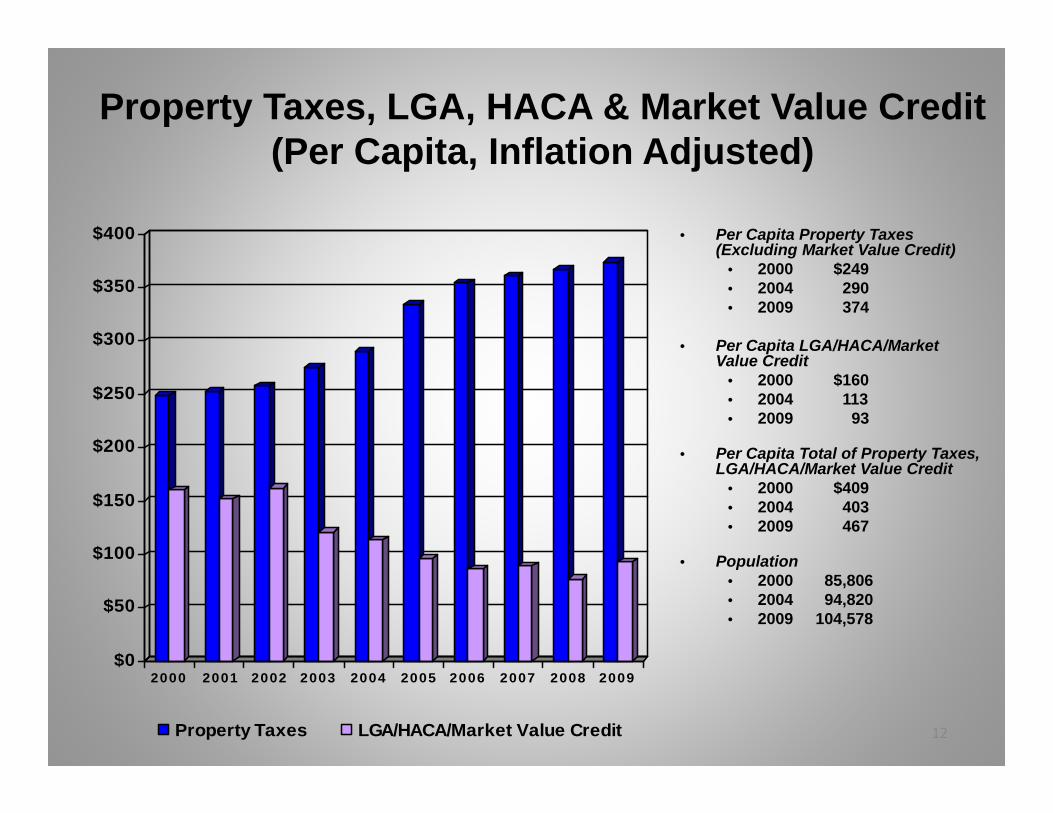
Property Taxes, LGA, HACA & Market Value Credit(Per Capita, Inflation Adjusted)
$0
$50
$100
$150
$200
$250
$300
$350
$400
2000 2001 2002 2003 2004 2005 2006 2007 2008 2009
Property Taxes LGA/HACA/Market Value Credit
• Per Capita Property Taxes (Excluding Market Value Credit)
• 2000 $249• 2004 290• 2009 374
• Per Capita LGA/HACA/Market Value Credit
• 2000 $160• 2004 113• 2009 93
• Per Capita Total of Property Taxes, LGA/HACA/Market Value Credit
• 2000 $409• 2004 403• 2009 467
• Population• 2000 85,806• 2004 94,820• 2009 104,578

City of Rochester Tax Capacity rates since 2002
YearCity of Rochester Tax Capacity
Rate2002 41.302003 40.832004 40.672005 41.442006 41.472007 41.512008 42.242009 40.762010 42.81
41.30
40.83
40.67
41.44
41.47
41.51
42.24
40.76
42.81
0.00
5.00
10.00
15.00
20.00
25.00
30.00
35.00
40.00
45.00
2002 2003 2004 2005 2006 2007 2008 2009 2010
Series1
Series2

City2009 City Property Tax Capacity
Rate Comparison2009 LGA / Capita
Comparison
Minneapolis 57.05 $ 205.70
St. Paul 32.38 $ 199.85
Duluth 25.40 $ 342.65
Winona 31.22 $ 349.10
Austin 33.64 $ 311.31
Moorhead 33.97 $ 202.75
Mankato 36.56 $ 189.63
St. Cloud 40.14 $ 170.41
Rochester 40.76 $ 71.34
Albert Lea 44.18 $ 281.57
Owatonna 44.77 $ 149.96
Comparison of 2009 City tax Rates and LGA / Capita between Rochester and other Minnesota cities

51.8%
26.2%
0.0%
10.0%
20.0%
30.0%
40.0%
50.0%
60.0%
% Property Tax of Gov't. Operating Budget % Property Tax of Total City Budget
Series1
2011 Property Tax as a % of City Gov’t Operating Budget and Total Budget (incl. CIP)
$45,967,888
$88,661,067
$175,284,450
$‐
$20,000,000
$40,000,000
$60,000,000
$80,000,000
$100,000,000
$120,000,000
$140,000,000
$160,000,000
$180,000,000
$200,000,000
2011 ProposedProperty Tax
2011 Gov't OperatingBudget
2011 Total City Budget( incl. CIP)
Series1

2011 City Property Tax Comparison to Public Safety Costs
*The 2011 City Public Safety costs include Police, Fire, Emergency Mgmt. & Building Safety and equate to 83.7% of the property tax levy amount
$45,967,888
$38,470,931
$34,000,000
$36,000,000
$38,000,000
$40,000,000
$42,000,000
$44,000,000
$46,000,000
$48,000,000
2011 Proposed Property Tax 2011 City Public Safety Costs
Series1

2011Recommended Property Tax Levy $45,967,888Minus property taxes allocated to Capital Improvements ‐$1,000,000
Property Taxes available to fund City service $44,967,888
Proposed expenditures for:
Police Department $20,625,482Fire Department $13,196,801Street Maintenance $5,366,684Traffic Management $1,215,877Street Lighting $1,346,600
$41,391,444
Proposed 2011 Budget Amounts for Essential Services
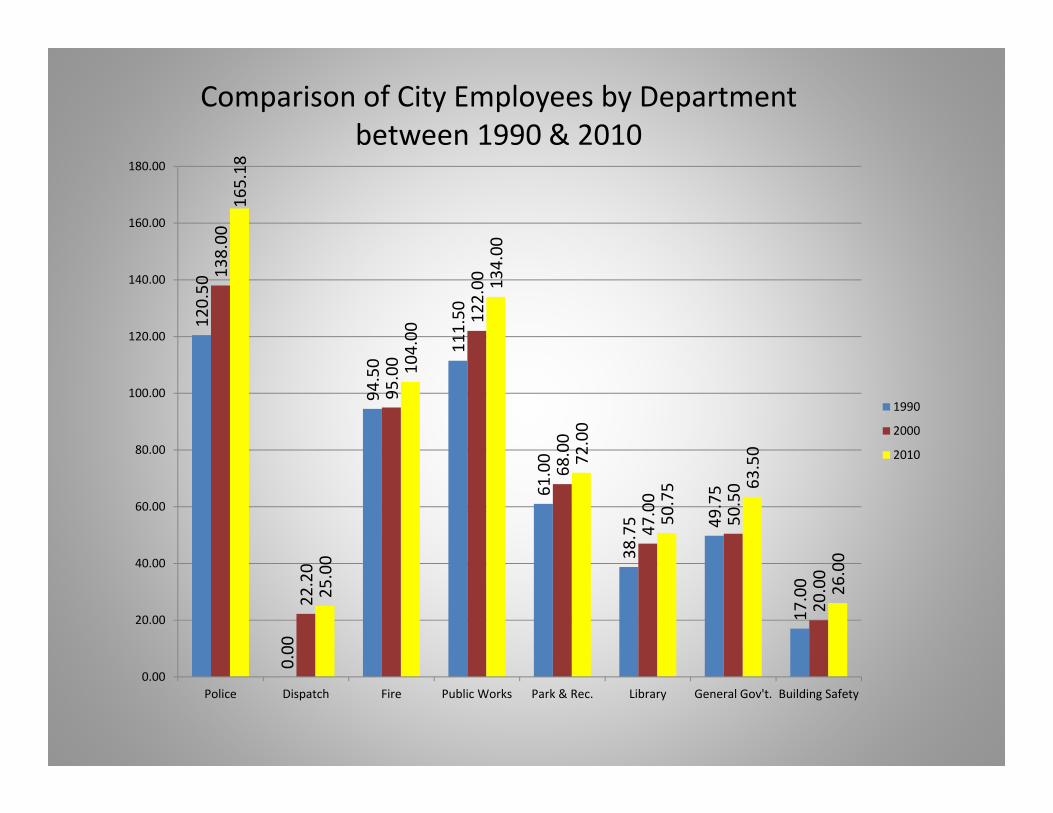
120.50
0.00
94.50
111.50
61.00
38.75 49.75
17.00
138.00
22.20
95.00
122.00
68.00
47.00
50.50
20.00
165.18
25.00
104.00
134.00
72.00
50.75 63
.50
26.00
0.00
20.00
40.00
60.00
80.00
100.00
120.00
140.00
160.00
180.00
Police Dispatch Fire Public Works Park & Rec. Library General Gov't. Building Safety
1990
2000
2010
Comparison of City Employees by Department between 1990 & 2010

YEAR NO. CITY EMPLOYEES CITY POPULATIONCITY EMPLOYEES / 1000
POPULATION
1980 450.25 57,890 7.77
1990 501 70,745 7.08
2000 570.70 85,806 6.64
2010 646.93 104,578 6.19
City Employee / Thousand Population Data Comparison

Percentage of Market Value
2011 TAX BASE BY PROPERTY CLASSCITY OF ROCHESTER

Percentage of Tax Capacity
2011 TAX BASE BY PROPERTY CLASSCITY OF ROCHESTER
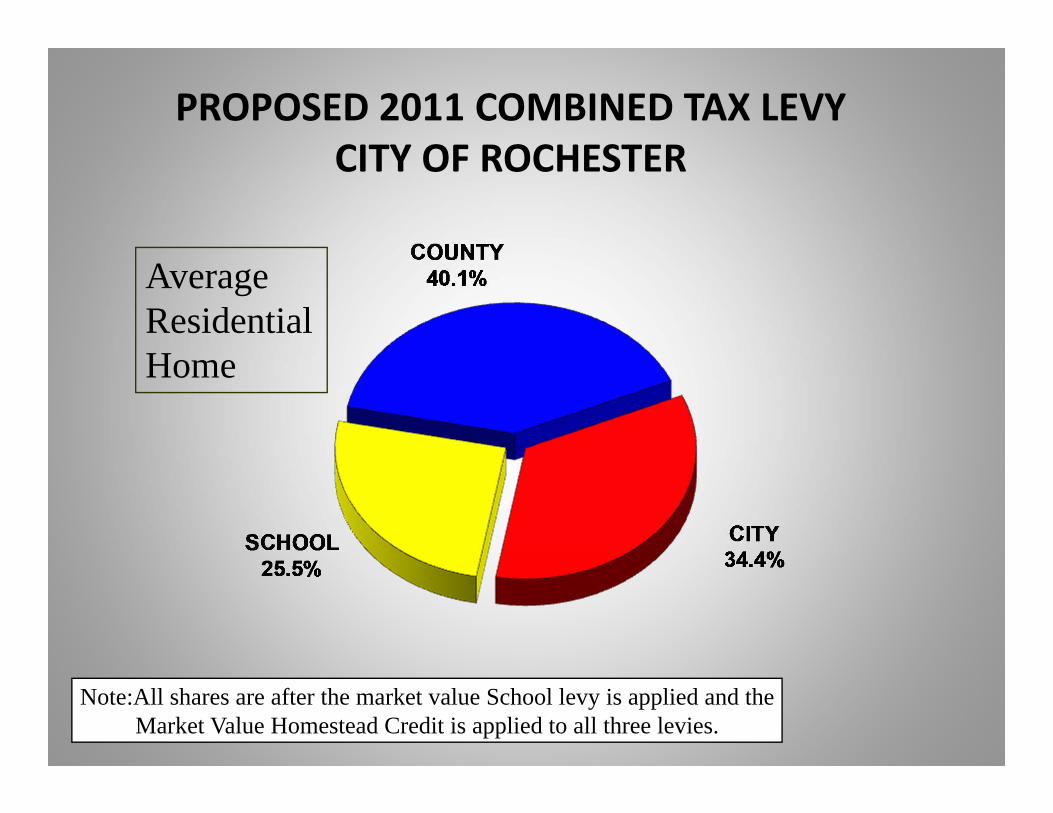
Note:All shares are after the market value School levy is applied and theMarket Value Homestead Credit is applied to all three levies.
Average Residential Home
PROPOSED 2011 COMBINED TAX LEVYCITY OF ROCHESTER

Note: Commercial & Industrial properties beganpaying a State property tax in 2002
Commercial/ Industrial
PROPOSED 2011 COMBINED TAX LEVYCITY OF ROCHESTER
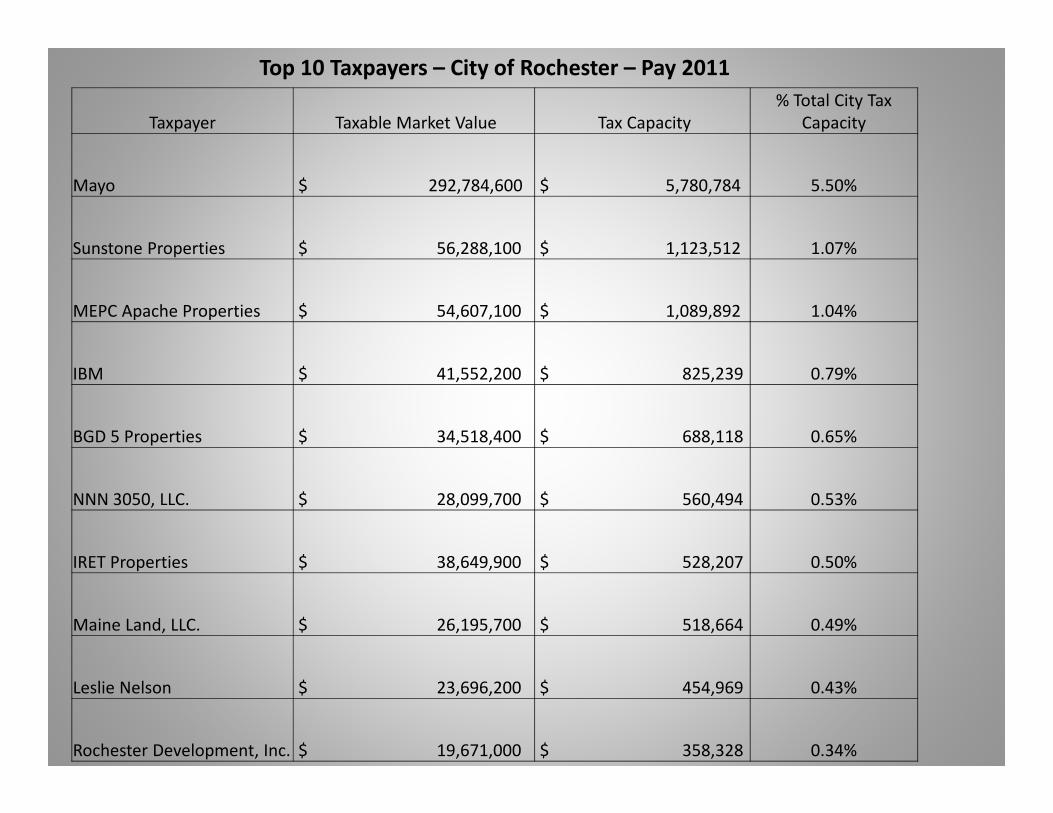
Taxpayer Taxable Market Value Tax Capacity % Total City Tax
Capacity
Mayo $ 292,784,600 $ 5,780,784 5.50%
Sunstone Properties $ 56,288,100 $ 1,123,512 1.07%
MEPC Apache Properties $ 54,607,100 $ 1,089,892 1.04%
IBM $ 41,552,200 $ 825,239 0.79%
BGD 5 Properties $ 34,518,400 $ 688,118 0.65%
NNN 3050, LLC. $ 28,099,700 $ 560,494 0.53%
IRET Properties $ 38,649,900 $ 528,207 0.50%
Maine Land, LLC. $ 26,195,700 $ 518,664 0.49%
Leslie Nelson $ 23,696,200 $ 454,969 0.43%
Rochester Development, Inc. $ 19,671,000 $ 358,328 0.34%
Top 10 Taxpayers – City of Rochester – Pay 2011

25
Estimated Market ValueReal and Personal Property
• Estimated Market Value for 2010 is $8.6 Billion, up $179 Million or 2.1%from 2009
$0
$1,000,000,000
$2,000,000,000
$3,000,000,000
$4,000,000,000
$5,000,000,000
$6,000,000,000
$7,000,000,000
$8,000,000,000
$9,000,000,000
1994 1996 1998 2000 2002 2004 2006 2008 2010
City of Rochester2011 Proposed Budget Hearing
December 6, 2010
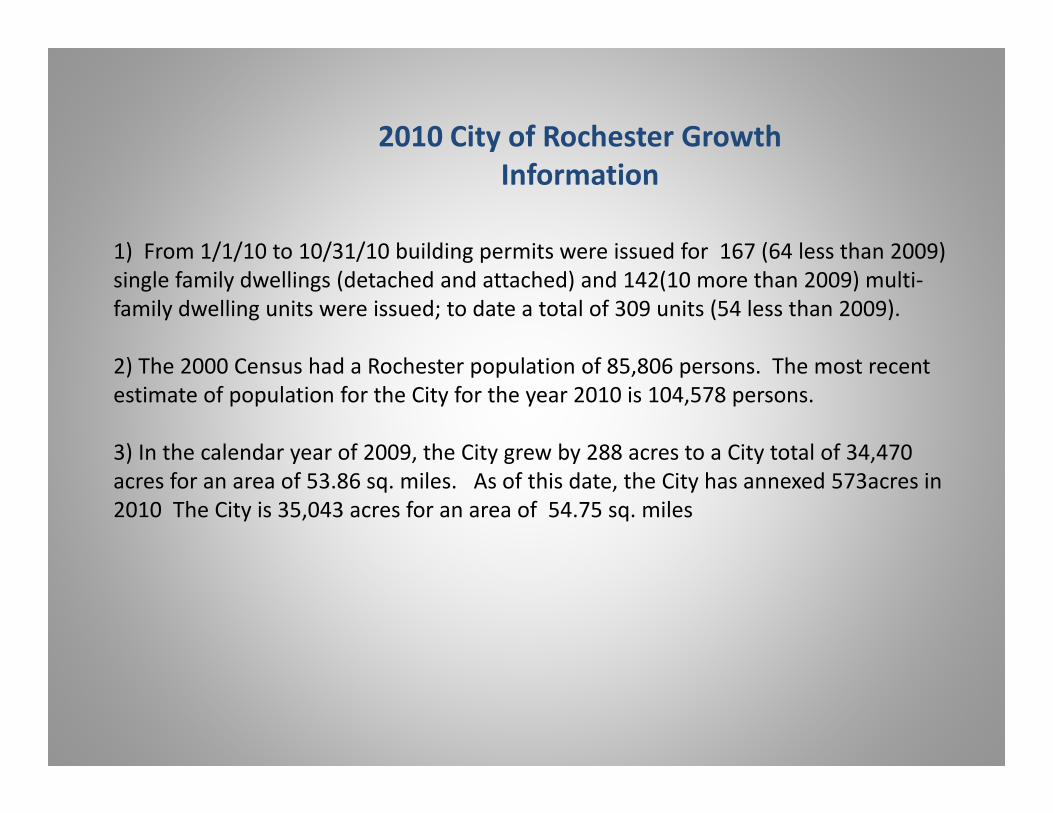
2010 City of Rochester Growth Information
1) From 1/1/10 to 10/31/10 building permits were issued for 167 (64 less than 2009) single family dwellings (detached and attached) and 142(10 more than 2009) multi‐family dwelling units were issued; to date a total of 309 units (54 less than 2009).
2) The 2000 Census had a Rochester population of 85,806 persons. The most recent estimate of population for the City for the year 2010 is 104,578 persons.
3) In the calendar year of 2009, the City grew by 288 acres to a City total of 34,470 acres for an area of 53.86 sq. miles. As of this date, the City has annexed 573acres in 2010 The City is 35,043 acres for an area of 54.75 sq. miles

Proposed 2010 Budget Amounts for Essential Services
Note that the Police, Fire and Street & Alley Services make up 96.8% of the 2010 Property Tax Levy not attributable to the CIP.
$19,500,825
$12,822,833
$5,272,615
$1,209,317 $1,226,031
Police
Fire
Street & Alley
Traffic
City LightingFIRE
STREET & ALLEY
TRAFFIC LIGHTING
POLICE
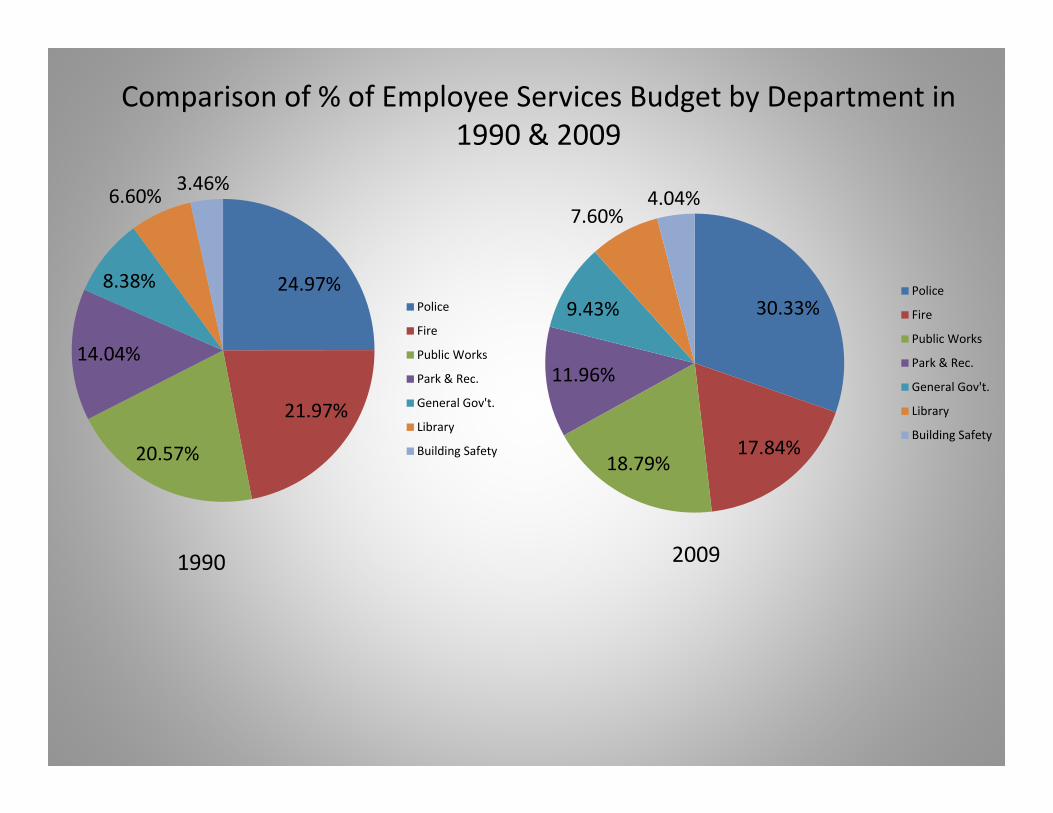
24.97%
21.97%
20.57%
14.04%
8.38%
6.60% 3.46%
Police
Fire
Public Works
Park & Rec.
General Gov't.
Library
Building Safety
30.33%
17.84%18.79%
11.96%
9.43%
7.60%4.04%
Police
Fire
Public Works
Park & Rec.
General Gov't.
Library
Building Safety
Comparison of % of Employee Services Budget by Department in 1990 & 2009
1990 2009

Rental Housing‐4+ Units Combined Tax Bill
$850,000 Market Value Example
2010 2011Amount Percent
Market Value 850,000 850,000 Change ChangeProperty Tax:
City 4,549 4,906 357 7.8%County 5,588 5,720 132 2.4%School 3,188 3,264 76 2.4%
Total 13,325 13,890 565 4.2%

Commercial / Industrial Combined Tax Bill
$750,000 Market Value Example
2010 2011Amount Percent
Market Value 750,000 750,000 Change ChangeProperty Tax:
City 6,101 6,580 479 7.9%County 7,495 7,672 177 2.4%School 3,820 3,949 129 3.4%State 6,538 7,125 587 9.0%
Total 23,954 25,326 1,372 5.7%

Residential Combined Tax Bill
$170,000 Market Value Example
2010 2011Amount Percent
Market Value 170,000 170,000 Change ChangeProperty Tax:
City 647 702 55 8.5%County 795 818 23 2.9%School 511 520 9 1.8%
Total 1,953 2,040 87 4.5%

24.4%
19.2%
22.6%
12.4%
7.9%
10.1%
3.4%
24.5%
3.9%
16.9%
21.7%
12.1%
8.4% 9.0%
3.6%
25.8%
3.9%
16.2%
20.9%
11.2%
7.9%
9.9%
4.1%
0.0%
5.0%
10.0%
15.0%
20.0%
25.0%
30.0%
Police Dispatch Fire Public Works Park & Rec. Library General Gov't. Building Safety
1990
2000
2010
Comparison of the Percentage of City Employees by Department between 1990 & 2010

% Increase in number of City Employees by Department between 1990 and 2010
In comparison, the City of Rochester population increased 32.3% in the timeframe from 1990‐2010.
37.1%
10.1%
20.2%18.0%
31.0%27.6%
52.9%
29.9%
0.0%
10.0%
20.0%
30.0%
40.0%
50.0%
60.0%
Police Dispatch Fire PublicWorks
Park &Rec.
Library GeneralGov't.
BuildingSafety
TOTAL
Series1

Amount of 2011 Property Tax Levy attributed to General Operating Budget and Capital Improvements Program
$44,252,845
$1,000,000
General Operating
Capital Improvements
General Operating – 96.3%
CIP‐2.2%
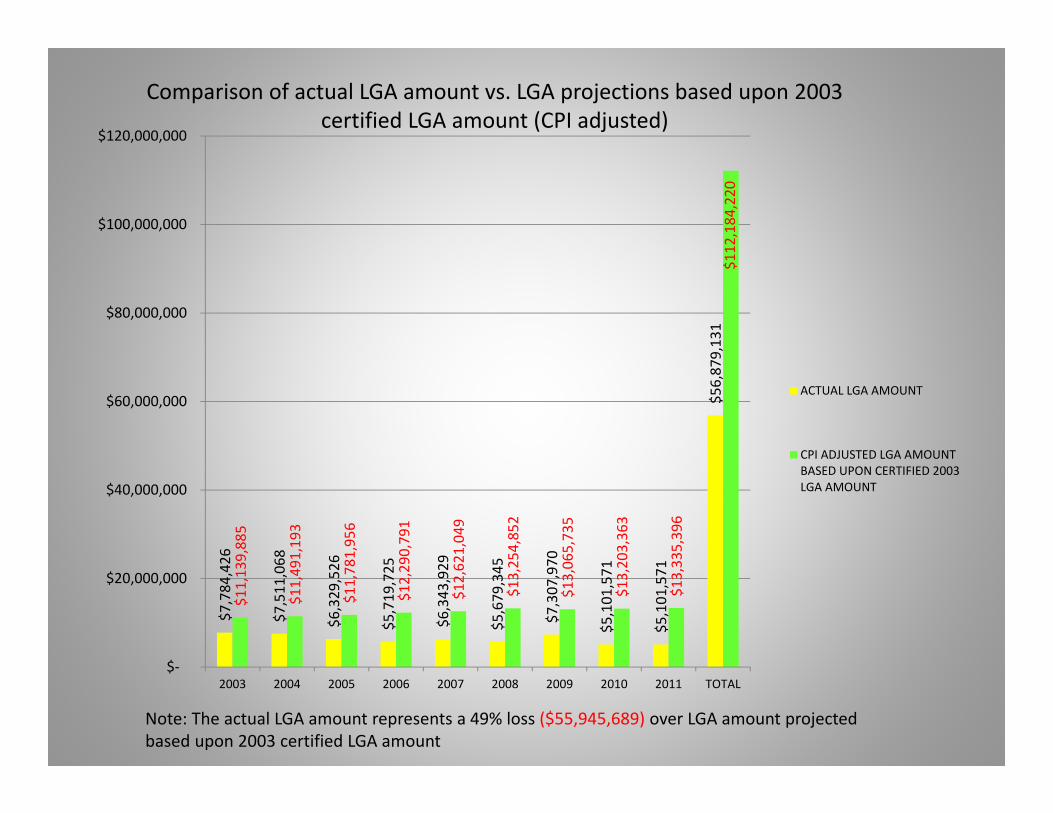
$7,784,426
$7,511,068
$6,329,526
$5,719,725
$6,343,929
$5,679,345
$7,307,970
$5,101,571
$5,101,571
$56,879,131
$11,139,885
$11,491,193
$11,781,956
$12,290,791
$12,621,049
$13,254,852
$13,065,735
$13,203,363
$13,335,396
$112,184,220
$‐
$20,000,000
$40,000,000
$60,000,000
$80,000,000
$100,000,000
$120,000,000
2003 2004 2005 2006 2007 2008 2009 2010 2011 TOTAL
ACTUAL LGA AMOUNT
CPI ADJUSTED LGA AMOUNTBASED UPON CERTIFIED 2003LGA AMOUNT
Note: The actual LGA amount represents a 49% loss ($55,945,689) over LGA amount projected based upon 2003 certified LGA amount
Comparison of actual LGA amount vs. LGA projections based upon 2003 certified LGA amount (CPI adjusted)

The City’s property tax levy increase over 2010 =$1,643,324 or 3.7% of the proposed tax levy.
In 2010, the City aid cuts =$5.7 million, which = 12.4% of the proposed tax levy. The State allowed for the aid cuts to be levied back.
The proposed levy increase only amounts to 30% of the aid cut amount.