2011 Fibozachi LLC · PDF file© 2011 Fibozachi LLC – . All Rights Reserved. 1 ......
23
Transcript of 2011 Fibozachi LLC · PDF file© 2011 Fibozachi LLC – . All Rights Reserved. 1 ......

© 2011 Fibozachi LLC – www.fibozachi.com. All Rights Reserved.
1
An Overview of Ultimate Pivot Points™ (UPP™): Page 2
- Advanced Support & Resistance Levels Page 2
- Ultimate Pivot Points™ Features Page 3
The Power of Pivot Points: How & Why Pivot Points Actually Work Page 4
- Market Makers Floor-Traders the “Herd” Page 4
Descriptions of the Various Pivot Point Methods Page 6
- Floor Trader’s Pivot Points Page 6
- Woodie’s Pivot Points Page 7
- Camarilla Pivot Points Page 8
- Demark Pivot Points Page 9
- Fibonacci Pivot Points Page 10
Customizing the UPP™ Indicator: Page 11
Expert Tips & Advice: Page 12
- Use Support & Resistance Levels to Manage Trades Page 12
- Use Support & Resistance Levels to Enter Trades Page 13
- Locate Clusters of Support & Resistance Page 15
UPP™ Scanner: Support & Resistance Command Center Page 16
- NinjaTrader Market Analyzer Page 18
- TradeStation RadarScreen Page 19
Risk Disclosure Statement: Page 21

© 2011 Fibozachi LLC – www.fibozachi.com. All Rights Reserved.
2
The Ultimate Pivot Points™ Indicator Package is the most advanced and
extensive “Pivot Points” indicator to date. Most traders are only familiar with the
default “Floor Trader’s Pivots” found in most trading platforms. However, there
are several other effective “Pivot Point” methods used for calculating support and
resistance levels. The Ultimate Pivot Points Indicators include each and every
one of these unique “Pivot Point” methods, making it one of the most
complete/thorough support/resistance indicators available to traders.
The indicators included within the UPP™ Indicator Package are:

© 2011 Fibozachi LLC – www.fibozachi.com. All Rights Reserved.
3
The Ultimate Pivot Points™ Indicator was initially created as an improvement
upon the extremely popular and effective “Floor Trader’s Pivots”, which uses the
previous day’s high, low and close to determine what the key intra-day support
and resistance levels are for any given symbol. Our goal was to develop a
complete and all-encompassing solution for pivot point trading and have therefore
added the following pivot point methods and advanced features:
Floor Trader’s Pivot Points (Advanced Version)
Woodie’s Pivot Points
Camarilla Pivot Points
Demark Pivot Points
Fibonacci Pivot Points
Additional Support/Resistance Levels of S4 and R4
Option to Display Half-Pivots (S/R 0.5, S/R 1.5, S/R 2.5, S/R 3.5)
Option to Display Yesterday’s: Open, High, Low, Close (OHLC)
Option to Display Current Day’s: Open, High, Low, Close (OHLC)
Text Labels are Plotted Adjacent to Each Level for Quick Identification
Visual and Audio Alerts for when Price Crosses any of the S/R Levels
Complete Customization Process Allows Users to Personalize UPP™

© 2011 Fibozachi LLC – www.fibozachi.com. All Rights Reserved.
4
A value that is known as the daily “Pivot Point” (PP) is obtained by averaging the
previous days high, low and close. By applying a set of formulas to the Pivot Point,
additional levels of both support and resistance are calculated. These levels are
commonly known amongst traders as R1, R2, R3 and S1, S2, S3.
The “Pivot Point” (PP) level is recognized as the intra-day point of equilibrium
between the bulls and bears, and is usually where the largest amount of trading
volume takes place. The reason is because the floor-traders and market-makers
for each specific market are using the PP as the “baseline” level of the day and
order and balance is usually maintained by keeping price between the Pivot Point
(PP) and the first levels of support (S1) and resistance (R1). Unless new
traders/investors come into the specific market, the floor-traders and market-
makers usually just play amongst themselves and price is contained within the
levels of R1 and S1.
When new traders/investors do come into the specific market, price will often
exceed the first levels of support (S1) and resistance (R1) and will move on to test
the second and third levels (S2, S3 & R2, R3).
When the market exceeds each level of support and resistance, it often has
profound implications for the rest of the trading day. The reason is that the floor-
traders and market-makers temporarily adjust their intra-day valuations of the
stock, which has a pronounced effect on when and where both rallies and
pullbacks will end.
© 2011 Fibozachi LLC – www.fibozachi.com. All Rights Reserved.
5
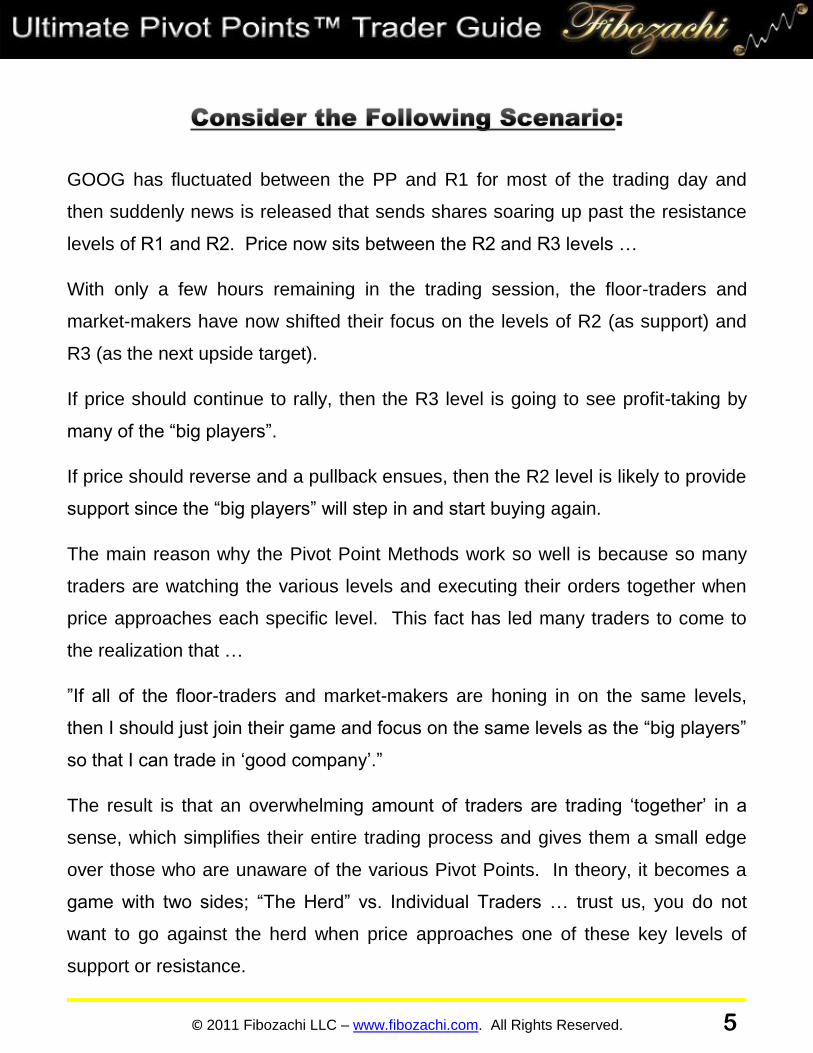
GOOG has fluctuated between the PP and R1 for most of the trading day and
then suddenly news is released that sends shares soaring up past the resistance
levels of R1 and R2. Price now sits between the R2 and R3 levels …
With only a few hours remaining in the trading session, the floor-traders and
market-makers have now shifted their focus on the levels of R2 (as support) and
R3 (as the next upside target).
If price should continue to rally, then the R3 level is going to see profit-taking by
many of the “big players”.
If price should reverse and a pullback ensues, then the R2 level is likely to provide
support since the “big players” will step in and start buying again.
The main reason why the Pivot Point Methods work so well is because so many
traders are watching the various levels and executing their orders together when
price approaches each specific level. This fact has led many traders to come to
the realization that …
”If all of the floor-traders and market-makers are honing in on the same levels,
then I should just join their game and focus on the same levels as the “big players”
so that I can trade in ‘good company’.”
The result is that an overwhelming amount of traders are trading ‘together’ in a
sense, which simplifies their entire trading process and gives them a small edge
over those who are unaware of the various Pivot Points. In theory, it becomes a
game with two sides; “The Herd” vs. Individual Traders … trust us, you do not
want to go against the herd when price approaches one of these key levels of
support or resistance.
© 2011 Fibozachi LLC – www.fibozachi.com. All Rights Reserved.
6
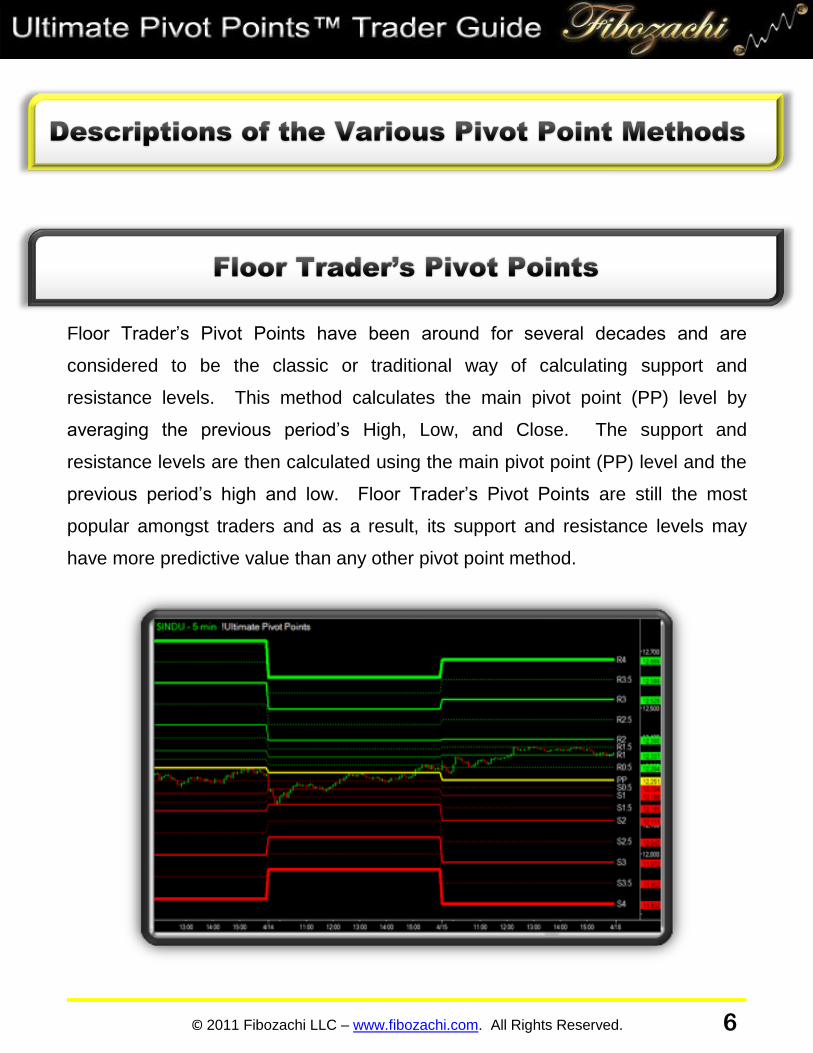
Floor Trader’s Pivot Points have been around for several decades and are
considered to be the classic or traditional way of calculating support and
resistance levels. This method calculates the main pivot point (PP) level by
averaging the previous period’s High, Low, and Close. The support and
resistance levels are then calculated using the main pivot point (PP) level and the
previous period’s high and low. Floor Trader’s Pivot Points are still the most
popular amongst traders and as a result, its support and resistance levels may
have more predictive value than any other pivot point method.

© 2011 Fibozachi LLC – www.fibozachi.com. All Rights Reserved.
7
Woodie’s Pivot Points differs from the other methods by using the current
session’s opening price to calculate the main pivot point (PP) level. The formula
ignores the closing price of the previous period and instead applies more weight to
the opening price of the current period. This gives the most recent price more
emphasis when calculating the main pivot point (PP) level. The support and
resistance levels are calculated the same as the Floor Trader’s Method, however
the levels differ since they are based on the main pivot point (PP) level.

© 2011 Fibozachi LLC – www.fibozachi.com. All Rights Reserved.
8
Camarilla Pivot Points were developed in 1989 by a successful bond trader known
as Nick Stott. While the pivot point (PP) level is calculated using the same
formula as the Floor Trader’s Pivots, the support and resistance levels are
calculated differently; using the closing price and the trading range of the previous
period.
Unlike other pivot point methods, the Camarilla Method puts more emphasis on
the 3rd and 4th levels of support and resistance (S3, S4, R3, R4). Typically, traders
will look for price to stay within the S3 - R3 range throughout the duration of the
session, while expecting price reversals to frequently occur at the S3 and R3
levels. The S4 and R4 levels are intended to provide strong support and
resistance, however if price moves beyond these levels it is often indicative of a
strong breakout and price may move significantly higher or lower.
© 2011 Fibozachi LLC – www.fibozachi.com. All Rights Reserved.
9
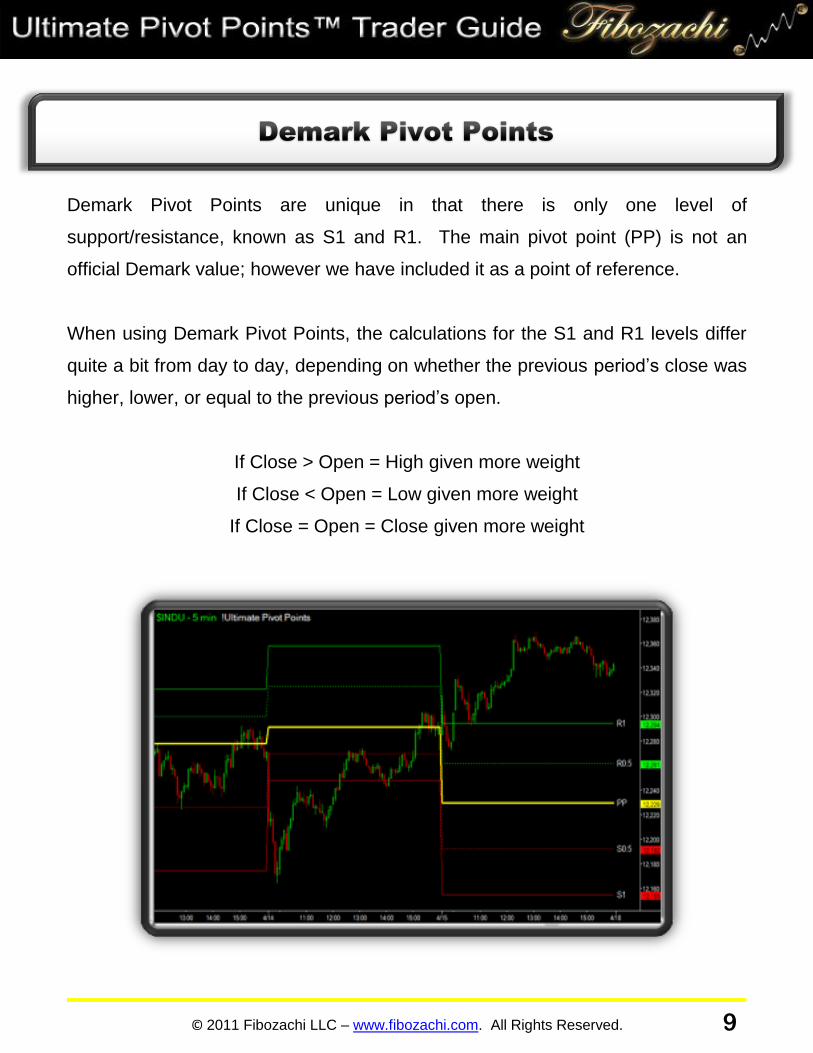
Demark Pivot Points are unique in that there is only one level of
support/resistance, known as S1 and R1. The main pivot point (PP) is not an
official Demark value; however we have included it as a point of reference.
When using Demark Pivot Points, the calculations for the S1 and R1 levels differ
quite a bit from day to day, depending on whether the previous period’s close was
higher, lower, or equal to the previous period’s open.
If Close > Open = High given more weight
If Close < Open = Low given more weight
If Close = Open = Close given more weight

© 2011 Fibozachi LLC – www.fibozachi.com. All Rights Reserved.
10
Fibonacci Pivot Points use the same formula as the Floor Trader’s Pivots to obtain
the Pivot Point (PP) level, however the various support and resistance levels are
calculated by using Fibonacci retracement and extension levels of the previous
session’s trading range.
It should come as no surprise, but we at Fibozachi prefer to trade using the
support and resistance levels of the Fibonacci Pivot Points. Since these levels are
based on Fibonacci retracements and extensions of the previous day’s range, we
believe that they have more predictive value than most of the other methods.

© 2011 Fibozachi LLC – www.fibozachi.com. All Rights Reserved.
11
The UPP Indicator’s various input settings allow you to personalize its appearance
and functionality to suit your own specific needs. You have full control over which
of the various support/resistance levels are plotted, the colors and plot style of
each of the levels, and the ability to activate or deactivate alerts for crossovers of
any of the levels. The following is an overview of the various input settings;
*** All plot colors and styles can be customized in the indicator’s properties window
Floor Traders Pivot Points: Set to “TRUE” to use Floor Trader’s Pivots
Woodie’s Pivot Points: Set to “TRUE” to use Woodie’s Pivots
Demark Pivot Points: Set to “TRUE” to use Demark Pivots
Camarilla Pivot Points: Set to “TRUE” to use Camarilla Pivots
Fibonacci Pivot Points: Set to “TRUE” to use Fibonacci Pivots
Show Full Pivots: Set to “TRUE” to display R1-R4 and S1-S4
Show Half Pivots: Set to “TRUE” to display R0.5-R3.5 and S0.5 – S3.5
Show Todays OHLC: Set to “TRUE” to display Today’s open, high, and low
Show Yesterdays OHLC: Set to “TRUE” to display Yesterday’s open, high, low, close
Use Full Pivot Alerts: Set to “TRUE” to activate alerts for full pivot crossovers
Use Half Pivot Alerts: Set to “TRUE” to activate alerts for half pivot crossovers
Use OHLC Pivot Alerts: Set to “TRUE” to activate alerts for OHLC crossovers

© 2011 Fibozachi LLC – www.fibozachi.com. All Rights Reserved.
12
► Use the levels as guidelines for determining where to set protective stops and
profit targets for your positions.
You may enter a trade using another indicator, but then decide to manage the
position using the various support and resistance levels.

© 2011 Fibozachi LLC – www.fibozachi.com. All Rights Reserved.
13
► Use the support and resistance levels as guidelines for determining precisely
when to enter a long or short position.
Long Trades: You may choose to enter a long trade once price either reaches a
certain support level, or once it breaks out above all the resistance levels.

© 2011 Fibozachi LLC – www.fibozachi.com. All Rights Reserved.
14
Short Trades: You may choose to enter a short trade once price either reaches a
certain resistance level, or once it breaks out below all the support levels.

© 2011 Fibozachi LLC – www.fibozachi.com. All Rights Reserved.
15
► Apply the UPP™ Indicator using each of the various pivot point methods and
make note of the different support and resistance levels and their respective
prices. Your goal is to find the specific price levels or zones where many support
or resistance levels are in very close proximity. These ‘clusters’ often prove to be
the strongest and most important levels of support and resistance, making them
the key levels to watch during the course of the trading session.

© 2011 Fibozachi LLC – www.fibozachi.com. All Rights Reserved.
16
Ultimate Pivot Points™ also includes the UPP™ Scanner, which is a specialized
indicator that is compatible with TradeStation’s RadarScreen and Scanner tools,
as well as NinjaTrader’s Market Analyzer tool. It provides a fully detailed overview
of all the support and resistance levels for any list of symbols; enabling traders to
properly manage their current positions, scan for symbols that are crossing above
or below any of the various support & resistance levels, or just scan for symbols
that are extremely oversold or overbought!
There are several ways in which you can employ the UPP™ Scanner into your
own trading routine. Consider the following methods that explain how to best
utilize the UPP™ Scanner;
The next few pages will explain how the UPP™ Scanner works and will provide
screenshots of it being used with both the TradeStation RadarScreen and the
NinjaTrader Market Analyzer tools.

© 2011 Fibozachi LLC – www.fibozachi.com. All Rights Reserved.
17
*** The following overview is for the TradeStation RadarScreen
If price is below a support level (S1, S2, S3, S4) or above a resistance level (R1, R2,
R3, R4), the background color of its cell is color-coded for easy identification. If price is
not above a certain support or resistance level, then the background color of its cell is
not color-coded (remains black or white). You will also notice that the exact price of
each support & resistance level is displayed in its corresponding cell.
If price IS ABOVE a resistance level, its corresponding cell is color-coded GREEN.
If price IS BELOW a support level, its corresponding cell is color-coded RED.
If price CROSSES ABOVE any support or resistance level, its cell is color-coded
CYAN. After the crossover, the cell will return to being color-coded RED, GREEN, or
blank.
If price CROSSES BELOW any support or resistance level, its cell is color-coded
MAGENTA. After the crossover, the cell will return to being color-coded RED,
GREEN, or blank.
*** It is important to note that all of the Pivot Point Methodologies use the prior day’s
trading range to calculate the various levels of support and resistance. This means
that the trading range from S4 to R4 will vary from day to day and may be twice as
large one day as it is the next.
*** Very rarely will stocks move past R3 or S3 without some kind of bullish or bearish
news or media exposure. If this does occur, it is wise to quickly check the symbol’s
headlines so that you are not trying to “fade” a stock that is rallying or crashing on
important news or an earnings report.

© 2011 Fibozachi LLC – www.fibozachi.com. All Rights Reserved.
18
© 2011 Fibozachi LLC – www.fibozachi.com. All Rights Reserved.
19
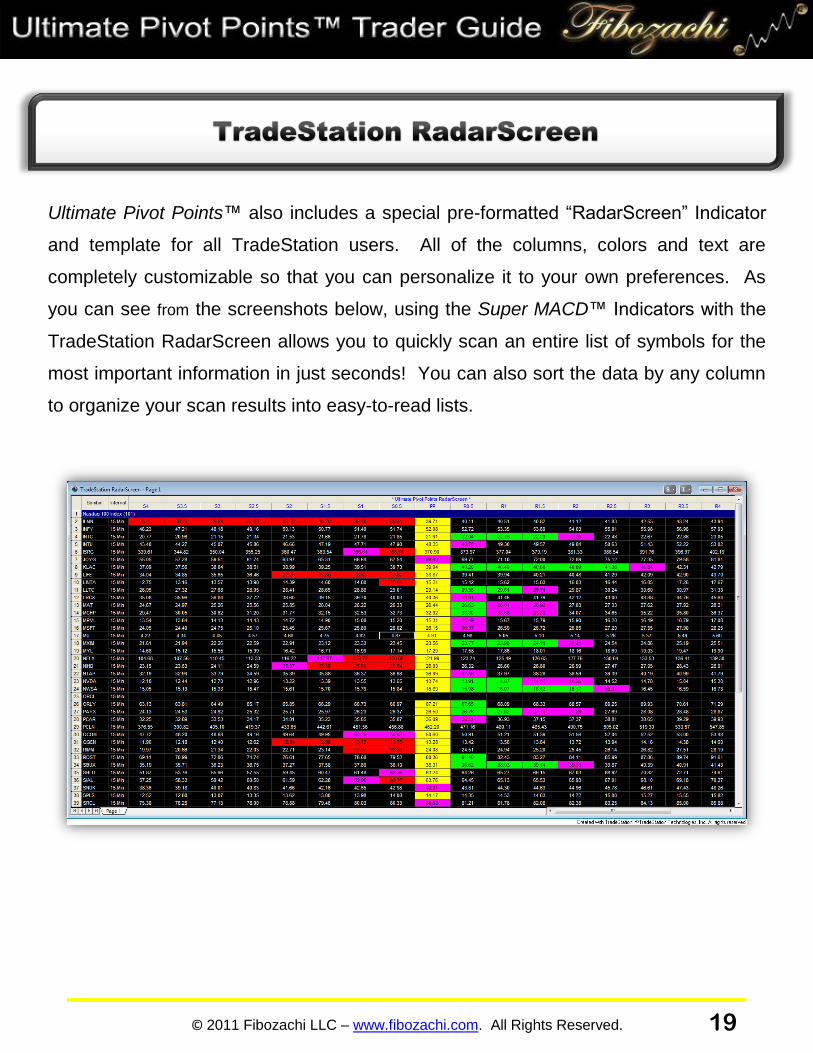
Ultimate Pivot Points™ also includes a special pre-formatted “RadarScreen” Indicator
and template for all TradeStation users. All of the columns, colors and text are
completely customizable so that you can personalize it to your own preferences. As
you can see from the screenshots below, using the Super MACD™ Indicators with the
TradeStation RadarScreen allows you to quickly scan an entire list of symbols for the
most important information in just seconds! You can also sort the data by any column
to organize your scan results into easy-to-read lists.

© 2011 Fibozachi LLC – www.fibozachi.com. All Rights Reserved.
20
Should you ever have a question about the Ultimate Pivot Point™ Indicator
Package, we are always just an email away at [email protected] to
answer any of your inquiries and provide additional customer support.

© 2011 Fibozachi LLC – www.fibozachi.com. All Rights Reserved.
21
The terms “Company”, “us” or “we” refer to Fibozachi.com, its parent company Fibozachi LLC, and all
subsidiaries, affiliates, officers or employees therein. The term “you” refers to the user or customer of
Fibozachi.com. The terms “Content” and “Information” refer to the indicators, tools, strategies,
techniques, systems, manuals, data, communications and any other associated products or material of
the Company.
License:
You are purchasing a single user license. You may not: copy, modify, publish, retransmit, participate in
the transfer or sale of, distribute, perform, display, or create derivative works from, any of the Content or
Information in any way.
Disclaimer:
All Content and Information provided is for educational purposes only. Fibozachi.com and Fibozachi LLC
(the “Company”) is not an investment advisory service, broker-dealer, commodity trading advisor, legal
advisor, tax advisor, or registered investment advisor, and does not purport to tell or suggest which
commodities, currencies or securities customers should buy or sell for themselves. The affiliates,
employees or officers of the Company may hold positions in the commodities, currencies or securities
discussed here.
You understand and acknowledge that there is a high degree of risk involved in trading commodities,
currencies or securities. You also understand and acknowledge that there is an extremely high degree
of risk involved in trading leveraged vehicles such as futures or options, where you can lose more than
the initial sum of your investment. The Company, its subsidiaries, affiliates, officers and employees
assume no responsibility or liability for your trading or investment results.
It should not be assumed that the indicators, tools, strategies, techniques, systems, manuals, data,
communications or any other associated products and material of the Company, collectively the
“Content” and “Information,” presented in its products or services will be profitable or that they will not
result in losses. Past results of any individual trader or trading system published by Company are not
indicative of future returns by that trader or system, and are not indicative of future returns, which may or
may not be realized by you. In addition, the articles, blogs, chat, columns, indicators, methods,
strategies, systems, techniques, tools, and all other features of Company's website (collectively, the
“Information”) are provided for educational purposes only and should not be construed as investment
advice. Any articles, blogs, chat, columns, comments, discussions, drawings, and examples, including
any other items intended to illustrate Information presented on Company's website, are for educational
purposes only; such are not solicitations of any order to buy or sell. Accordingly, you should not rely
solely on the Information in making any investment. Rather, you should use the Information only as a
starting point for doing additional independent research in order to allow you to form your own opinion
regarding any investment. You should always check with your licensed financial advisor and tax advisor
to determine the suitability of any investment.

© 2011 Fibozachi LLC – www.fibozachi.com. All Rights Reserved.
22
IN CONSIDERING WHETHER TO TRADE, YOU SHOULD BE AWARE OF THE FOLLOWING:
HYPOTHETICAL OR SIMULATED PERFORMANCE RESULTS HAVE CERTAIN INHERENT
LIMITATIONS. UNLIKE AN ACTUAL PERFORMANCE RECORD, SIMULATED RESULTS DO NOT
REPRESENT ACTUAL TRADING AND MAY NOT BE IMPACTED BY BROKERAGE AND OTHER
SLIPPAGE FEES. ALSO, SINCE THE TRADES HAVE NOT ACTUALLY BEEN EXECUTED, THE
RESULTS MAY HAVE UNDER- OR OVER-COMPENSATED FOR THE IMPACT, IF ANY, OF CERTAIN
MARKET FACTORS, SUCH AS LACK OF LIQUIDITY. SIMULATED TRADING PROGRAMS IN
GENERAL ARE ALSO SUBJECT TO THE FACT THAT THEY ARE DESIGNED WITH THE BENEFIT
OF HINDSIGHT. NO REPRESENTATION IS BEING MADE THAT ANY ACCOUNT WILL OR IS LIKELY
TO ACHIEVE PROFITS OR LOSSES SIMILAR TO THOSE SHOWN.
TRADING IS AN EXTREMELY DIFFICULT PROBABILISTIC ENDEAVOR THAT REQUIRES
TECHNICAL SKILL AND EMOTIONAL DISCIPLINE AT THE VERY MINIMUM. EVEN A GREAT
TRADER WITH EXCELLENT ANALYSIS, RESOURCES, TOOLS, TECHNIQUES, STRATEGIES,
PLANS, CONTINGENCIES, AND EXPLICITLY DEFINED RULES FOR MANAGING RISK EXPOSURE
IS OFTEN WRONG. THERE ALWAYS REMAIN REAL AND UNQUANTIFIABLE RISKS SUCH AS
GOVERNMENT INTERVENTION OF RULE / LAW CHANGES. RISK PREVENTION MEASURES SUCH
AS PROTECTIVE STOPS DO NOT PREVENT THE RISK OF GAP OPENINGS OR LOCK-LIMIT
MOVES.
YOU AGREE THAT NEITHER FIBOZACHI LLC, NOR ITS SUBSIDIARIES, AFFILIATES, OFFICERS
OR EMPLOYEES, SHALL BE LIABLE TO YOU OR ANY OTHER THIRD PARTY FOR ANY DIRECT,
INDIRECT, INCIDENTAL, SPECIAL, OR CONSEQUENTIAL DAMAGES. MEMBERS AND VISITORS
(“USERS”) AGREE TO INDEMNIFY AND HOLD FIBOZACHI LLC, AND ITS SUBSIDIARIES,
AFFILIATES, OFFICERS AND EMPLOYEES, HARMLESS FROM ANY CLAIM OR DEMAND,
INCLUDING REASONABLE ATTORNEYS’ FEES, MADE BY ANY THIRD PARTY DUE TO OR
ARISING OUT OF A USER’S USE OF FIBOZACHI LLC’S WEBSITE.
TradeStation Disclaimer:
“Neither TradeStation Technologies nor any of its affiliates has reviewed, certified, endorsed, approved,
disapproved or recommended, and neither does or will review, certify, endorse, approve, disapprove or
recommend, any trading software tool that is designed to be compatible with the TradeStation Open
Platform.”