2011 Citi Financial Services Conference
54
2011 Citi Financial Services Conference Donald F. Cole Chief Financial Officer March 10, 2011
Transcript of 2011 Citi Financial Services Conference
2011 Citi Financial Services Conference
Donald F. ColeChief Financial OfficerMarch 10, 2011
2011 Citi Financial Services Conference | March 10, 2011 | p. 2
Forward Looking Statements
This presentation contains "forward-looking statements" within the meaning of the Private Securities Litigation Reform Act of 1995, including certain plans, expectations, strategies, goals, and projections and including statements about growing ourbusiness and our assets, increased quarterly loan production levels, our expectations regarding our application to become a bank holding company and convert CapitalSource Bank’s charter to a commercial charter, expectations of being repaid on loans, managing our legacy portfolio; our expectations regarding sufficiency of earnings, future credit performance, charge-offs levels and sufficiency of our reserves; our portfolio's credit trends, expected ROA, projected operating expense, our net interest margin improving, provisions impact on our financial results; growth of our pre-provision earnings, as well as our charge-offs; projections about our profitability; our liquidity and financing plan, the timing of our ability to file a consolidated tax return; the maturities of our recourse debt, all which are subject to numerous assumptions, risks, and uncertainties. All statements contained in this presentation that are not clearly historical in nature are forward-looking, and the words "anticipate," "assume," "intend," "believe," "expect," "estimate," "plan," “position,” “project,” "will,“ “should,”“would,” “seek,” “continue,” “outlook,” "look forward," and similar expressions are generally intended to identify forward-looking statements. All forward-looking statements (including statements regarding preliminary and future financial and operating results and future transactions and their results) involve risks, uncertainties and contingencies, many of which are beyond our control which may cause actual results, performance, or achievements to differ materially from anticipated results, performance or achievements. Actual results could differ materially from those contained or implied by such statements for a variety of factors, including without limitation: changes in economic or market conditions or investment or lending opportunities; continued or worsening disruptions in credit and other markets; increase in interest rates and lending spreads; continued or worsening credit losses, charge-offs, reserves and delinquencies; our ability to successfully and cost effectively operate our business, including CapitalSource Bank; our ability to successfully grow CapitalSource Bank's deposits and commercial loan assets or deploy its capital in favorable lending transactions; competitive and other market pressures on product pricing and services; reduced demand for our services; significant decline in market interest rate spreads; success and timing of other business strategies; changes in tax laws or regulations affecting our business; our judgment employed in setting reserves could be based on erroneous assumptions; the nature, extent and timing of governmental actions and legislation; and other factors described in CapitalSource's 2010 Annual Report on Form 10-K and documents subsequently filed by CapitalSource with the Securities and Exchange Commission. All forward-looking statements included in this presentation are based on information available at the time of the presentation. We are under no obligation to (and expressly disclaim any such obligation to) update or alter our forward-looking statements, whether as a result of new information, future events or otherwise except as required by applicable law.
2011 Citi Financial Services Conference | March 10, 2011 | p. 3
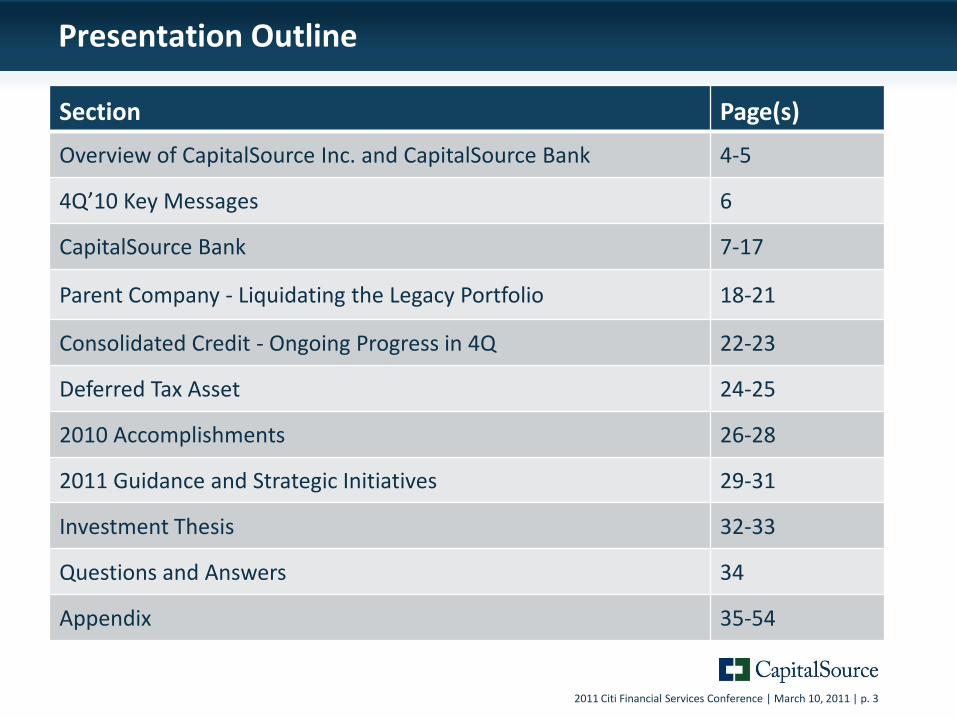
Presentation Outline
Section Page(s)
Overview of CapitalSource Inc. and CapitalSource Bank 4-5
4Q’10 Key Messages 6
CapitalSource Bank 7-17
Parent Company - Liquidating the Legacy Portfolio 18-21
Consolidated Credit - Ongoing Progress in 4Q 22-23
Deferred Tax Asset 24-25
2010 Accomplishments 26-28
2011 Guidance and Strategic Initiatives 29-31
Investment Thesis 32-33
Questions and Answers 34
Appendix 35-54
2011 Citi Financial Services Conference | March 10, 2011 | p. 4
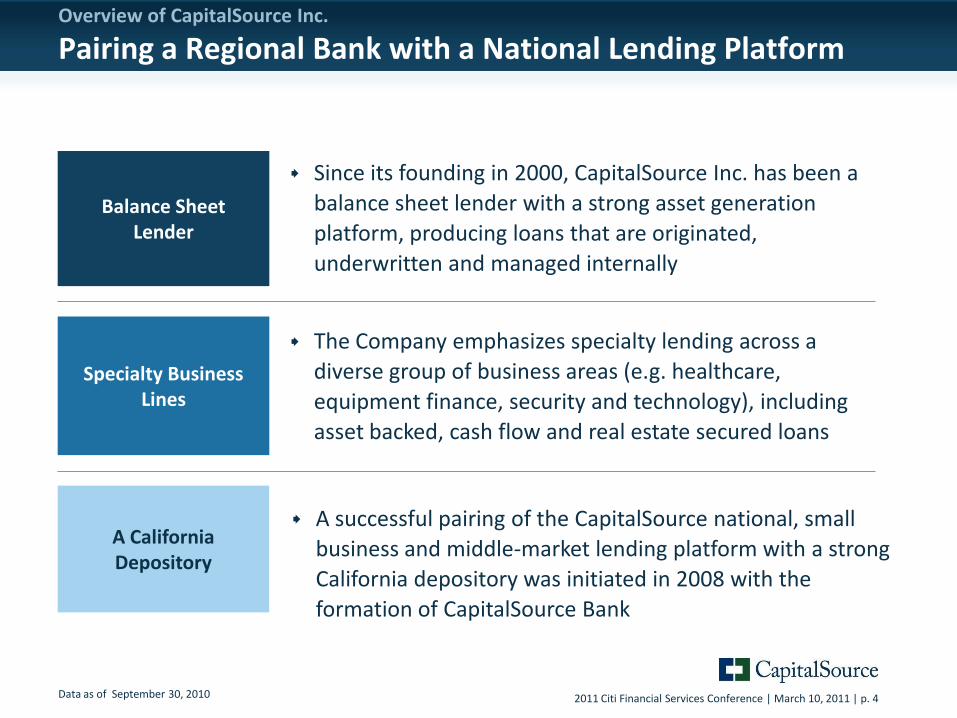
Since its founding in 2000, CapitalSource Inc. has been a
balance sheet lender with a strong asset generation
platform, producing loans that are originated,
underwritten and managed internally
A successful pairing of the CapitalSource national, small
business and middle-market lending platform with a strong
California depository was initiated in 2008 with the
formation of CapitalSource Bank
The Company emphasizes specialty lending across a
diverse group of business areas (e.g. healthcare,
equipment finance, security and technology), including
asset backed, cash flow and real estate secured loans
Specialty Business Lines
A California Depository
Data as of September 30, 2010
Balance Sheet Lender
Overview of CapitalSource Inc.
Pairing a Regional Bank with a National Lending Platform
2011 Citi Financial Services Conference | March 10, 2011 | p. 5
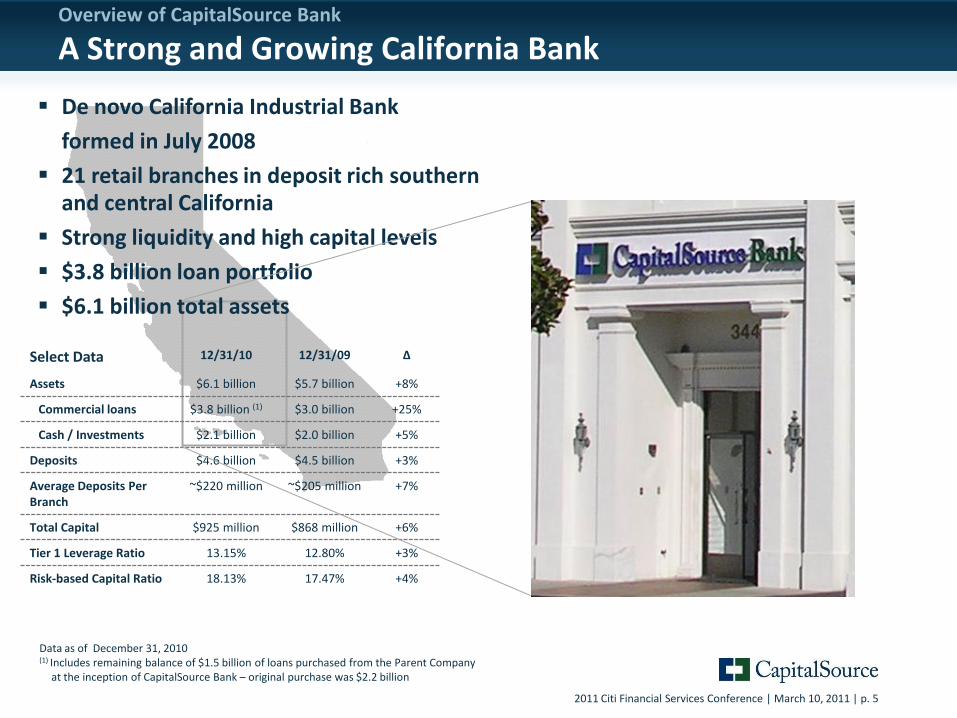
Overview of CapitalSource Bank
A Strong and Growing California Bank
Data as of December 31, 2010(1) Includes remaining balance of $1.5 billion of loans purchased from the Parent Company
at the inception of CapitalSource Bank – original purchase was $2.2 billion
De novo California Industrial Bank
formed in July 2008
21 retail branches in deposit rich southern and central California
Strong liquidity and high capital levels
$3.8 billion loan portfolio
$6.1 billion total assets
Select Data 12/31/10 12/31/09 ∆
Assets $6.1 billion $5.7 billion +8%
Commercial loans $3.8 billion (1) $3.0 billion +25%
Cash / Investments $2.1 billion $2.0 billion +5%
Deposits $4.6 billion $4.5 billion +3%
Average Deposits Per Branch
~$220 million ~$205 million +7%
Total Capital $925 million $868 million +6%
Tier 1 Leverage Ratio 13.15% 12.80% +3%
Risk-based Capital Ratio 18.13% 17.47% +4%
2011 Citi Financial Services Conference | March 10, 2011 | p. 6
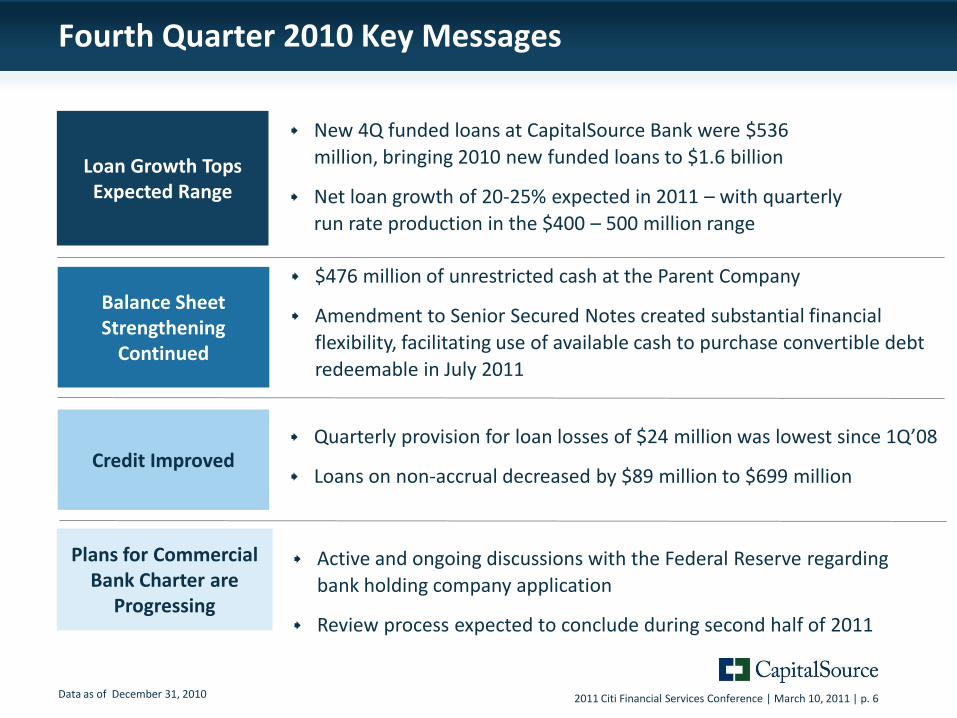
Fourth Quarter 2010 Key Messages
$476 million of unrestricted cash at the Parent Company
Amendment to Senior Secured Notes created substantial financial
flexibility, facilitating use of available cash to purchase convertible debt
redeemable in July 2011
New 4Q funded loans at CapitalSource Bank were $536
million, bringing 2010 new funded loans to $1.6 billion
Net loan growth of 20-25% expected in 2011 – with quarterly
run rate production in the $400 – 500 million range
Balance Sheet Strengthening
Continued
Data as of December 31, 2010
Plans for Commercial Bank Charter are
Progressing
Quarterly provision for loan losses of $24 million was lowest since 1Q’08
Loans on non-accrual decreased by $89 million to $699 millionCredit Improved
Loan Growth Tops Expected Range
Active and ongoing discussions with the Federal Reserve regarding
bank holding company application
Review process expected to conclude during second half of 2011
2011 Citi Financial Services Conference | March 10, 2011 | p. 7
CapitalSource BankA Solidly Profitable Quarter
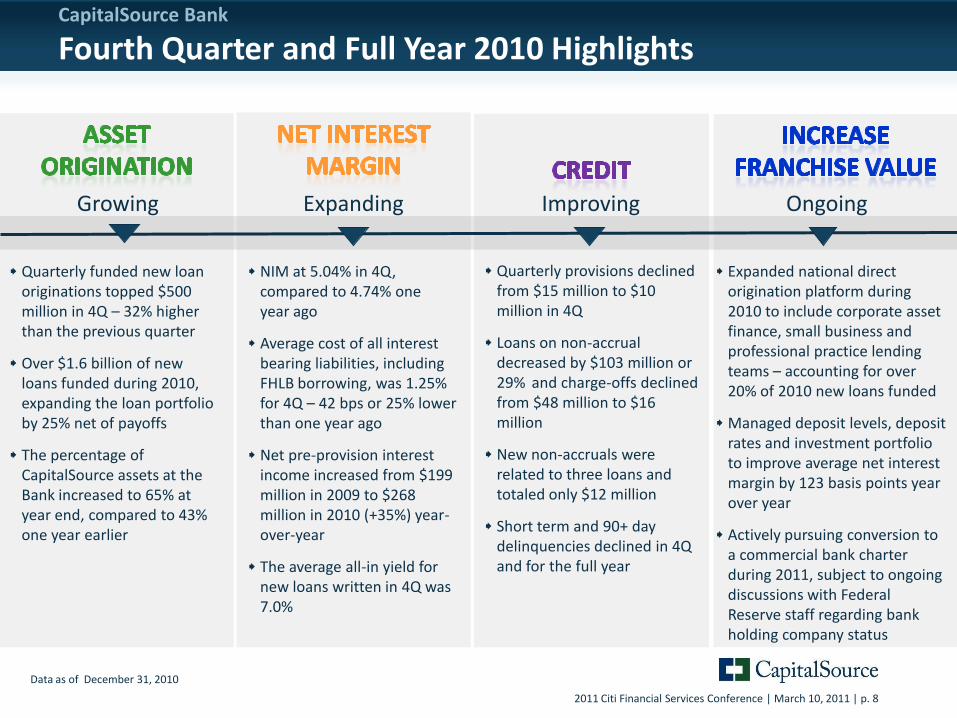
2011 Citi Financial Services Conference | March 10, 2011 | p. 8
CapitalSource Bank
Fourth Quarter and Full Year 2010 Highlights
Quarterly funded new loan originations topped $500 million in 4Q – 32% higher than the previous quarter
Over $1.6 billion of new loans funded during 2010, expanding the loan portfolio by 25% net of payoffs
The percentage of CapitalSource assets at the Bank increased to 65% at year end, compared to 43% one year earlier
NIM at 5.04% in 4Q, compared to 4.74% one year ago
Average cost of all interest bearing liabilities, including FHLB borrowing, was 1.25% for 4Q – 42 bps or 25% lower than one year ago
Net pre-provision interest income increased from $199 million in 2009 to $268 million in 2010 (+35%) year-over-year
The average all-in yield for new loans written in 4Q was 7.0%
Data as of December 31, 2010
ImprovingGrowing Expanding Ongoing
Expanded national direct origination platform during 2010 to include corporate asset finance, small business and professional practice lending teams – accounting for over 20% of 2010 new loans funded
Managed deposit levels, deposit rates and investment portfolio to improve average net interest margin by 123 basis points year over year
Actively pursuing conversion to a commercial bank charter during 2011, subject to ongoing discussions with Federal Reserve staff regarding bank holding company status
Quarterly provisions declined from $15 million to $10 million in 4Q
Loans on non-accrual decreased by $103 million or 29% and charge-offs declined from $48 million to $16 million
New non-accruals were related to three loans and totaled only $12 million
Short term and 90+ day delinquencies declined in 4Q and for the full year
2011 Citi Financial Services Conference | March 10, 2011 | p. 9
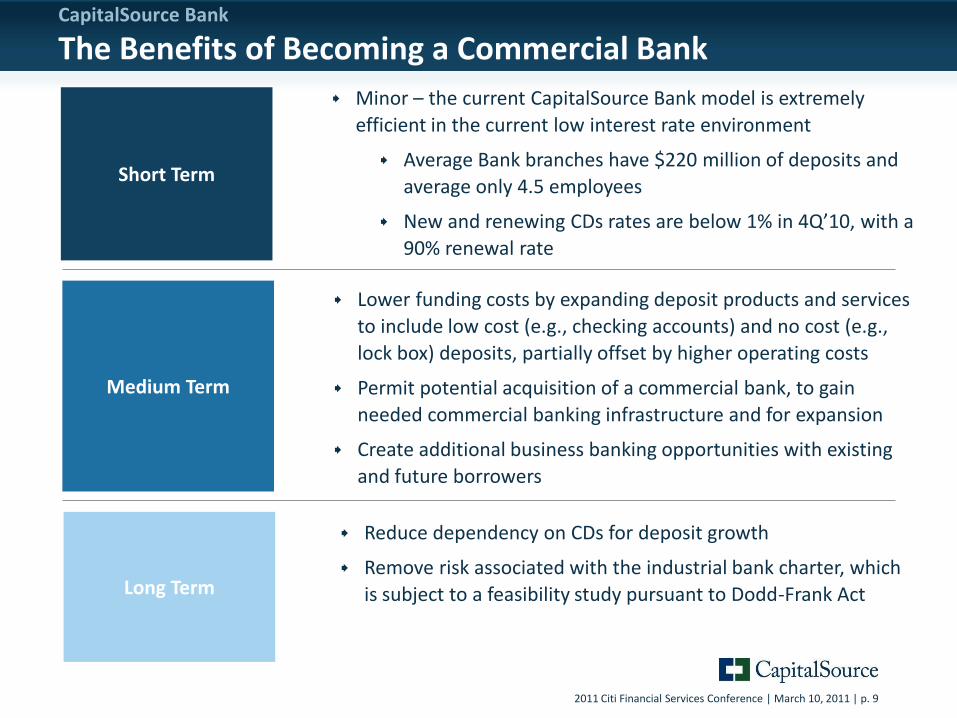
CapitalSource Bank
The Benefits of Becoming a Commercial Bank
Minor – the current CapitalSource Bank model is extremely
efficient in the current low interest rate environment
Average Bank branches have $220 million of deposits and
average only 4.5 employees
New and renewing CDs rates are below 1% in 4Q’10, with a
90% renewal rate
Medium Term
Lower funding costs by expanding deposit products and services
to include low cost (e.g., checking accounts) and no cost (e.g.,
lock box) deposits, partially offset by higher operating costs
Permit potential acquisition of a commercial bank, to gain
needed commercial banking infrastructure and for expansion
Create additional business banking opportunities with existing
and future borrowers
Short Term
Long Term
Reduce dependency on CDs for deposit growth
Remove risk associated with the industrial bank charter, which
is subject to a feasibility study pursuant to Dodd-Frank Act
2011 Citi Financial Services Conference | March 10, 2011 | p. 10
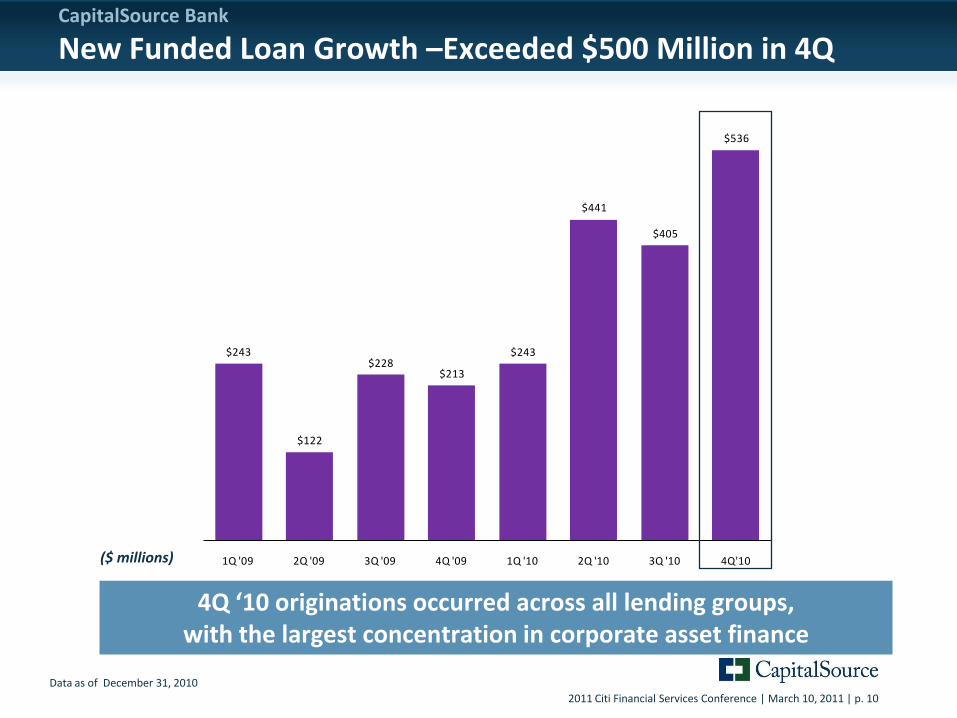
$243
$122
$228$213
$243
$441
$405
$536
1Q '09 2Q '09 3Q '09 4Q '09 1Q '10 2Q '10 3Q '10 4Q'10
CapitalSource Bank
New Funded Loan Growth –Exceeded $500 Million in 4Q
Data as of December 31, 2010
4Q ‘10 originations occurred across all lending groups, with the largest concentration in corporate asset finance
($ millions)
2011 Citi Financial Services Conference | March 10, 2011 | p. 11
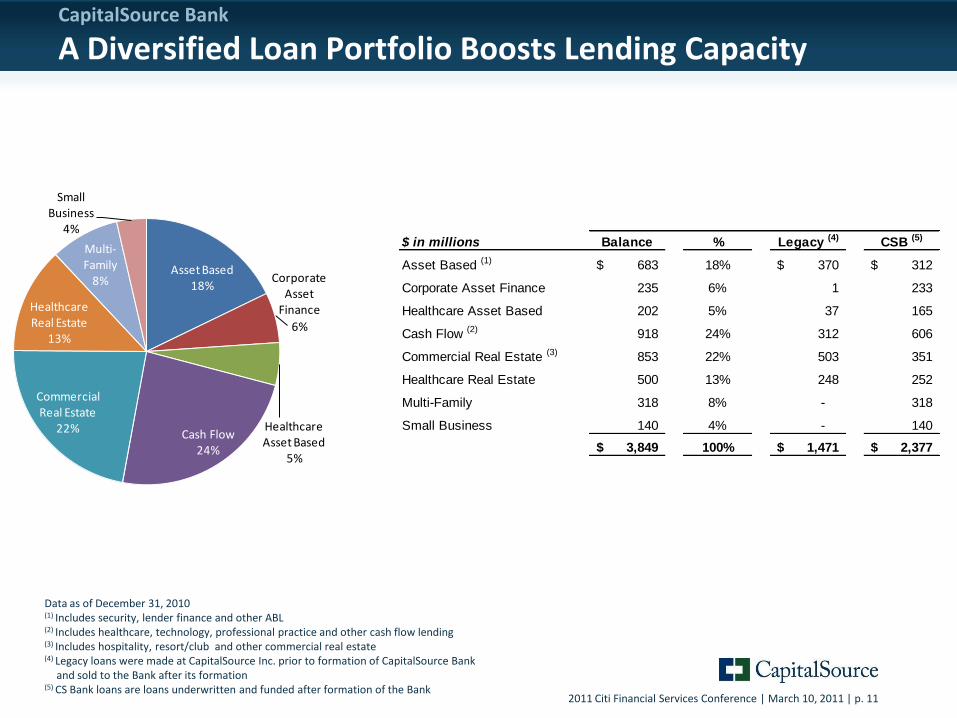
Data as of December 31, 2010(1) Includes security, lender finance and other ABL(2) Includes healthcare, technology, professional practice and other cash flow lending(3) Includes hospitality, resort/club and other commercial real estate(4) Legacy loans were made at CapitalSource Inc. prior to formation of CapitalSource Bank
and sold to the Bank after its formation (5) CS Bank loans are loans underwritten and funded after formation of the Bank
CapitalSource Bank
A Diversified Loan Portfolio Boosts Lending Capacity
Asset Based 18%
Corporate Asset
Finance
6%
Healthcare Asset Based
5%
Cash Flow24%
Commercial Real Estate
22%
Healthcare Real Estate
13%
Multi-Family
8%
Small Business
4%$ in millions Balance % Legacy (4) CSB (5)
Asset Based (1) 683$ 18% 370$ 312$
Corporate Asset Finance 235 6% 1 233
Healthcare Asset Based 202 5% 37 165
Cash Flow (2) 918 24% 312 606
Commercial Real Estate (3) 853 22% 503 351
Healthcare Real Estate 500 13% 248 252
Multi-Family 318 8% - 318
Small Business 140 4% - 140
3,849$ 100% 1,471$ 2,377$
2011 Citi Financial Services Conference | March 10, 2011 | p. 12
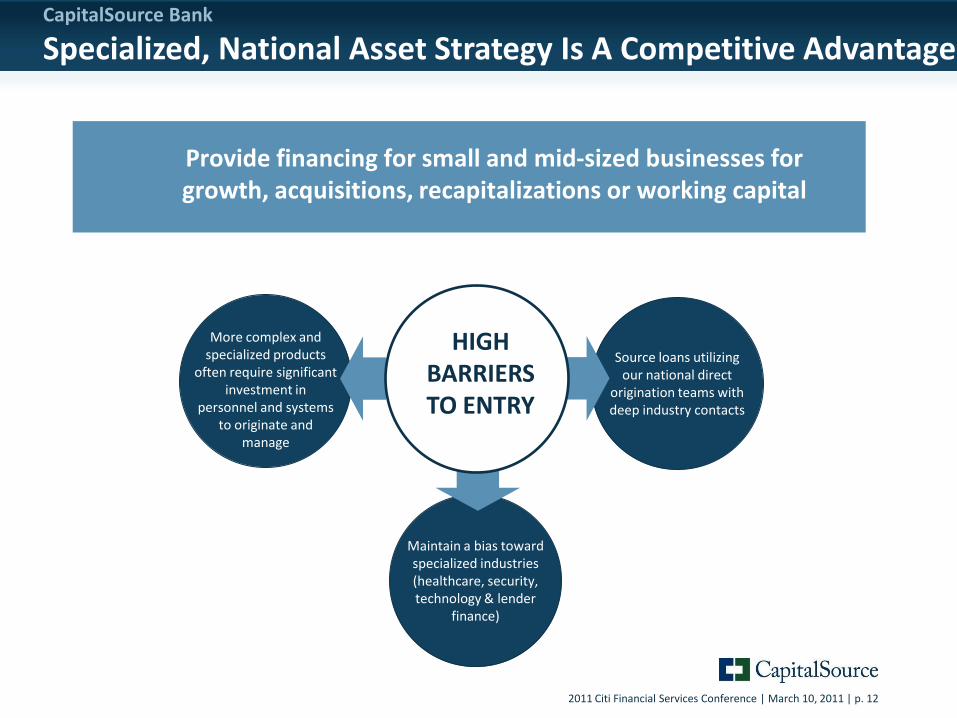
CapitalSource Bank
Specialized, National Asset Strategy Is A Competitive Advantage
Provide financing for small and mid-sized businesses for growth, acquisitions, recapitalizations or working capital
More complex and specialized products
often require significant investment in
personnel and systems to originate and
manage
Source loans utilizing our national direct
origination teams with deep industry contacts
Maintain a bias toward specialized industries (healthcare, security, technology & lender
finance)
HIGH BARRIERS TO ENTRY
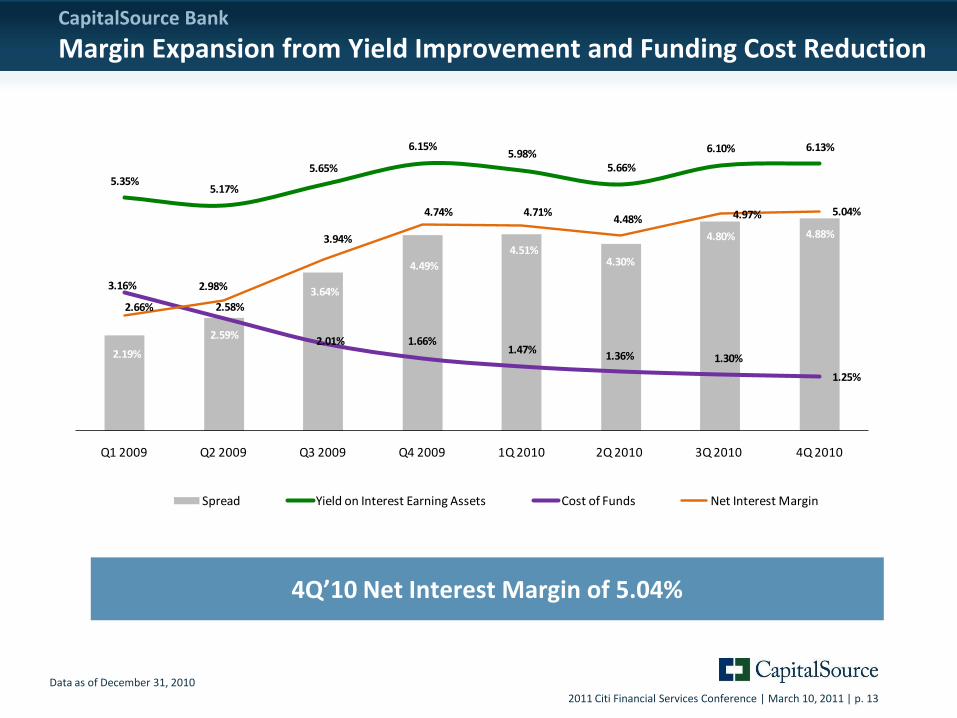
2011 Citi Financial Services Conference | March 10, 2011 | p. 13
2.19%
2.59%
3.64%
4.49%
4.51%4.30%
4.80% 4.88%
5.35%5.17%
5.65%
6.15%5.98%
5.66%
6.10% 6.13%
3.16%
2.58%
2.01% 1.66%1.47%
1.36% 1.30%
1.25%
2.66%
2.98%
3.94%
4.74% 4.71%4.48% 4.97% 5.04%
Q1 2009 Q2 2009 Q3 2009 Q4 2009 1Q 2010 2Q 2010 3Q 2010 4Q 2010
Spread Yield on Interest Earning Assets Cost of Funds Net Interest Margin
CapitalSource Bank
Margin Expansion from Yield Improvement and Funding Cost Reduction
Data as of December 31, 2010
4Q’10 Net Interest Margin of 5.04%
2011 Citi Financial Services Conference | March 10, 2011 | p. 14
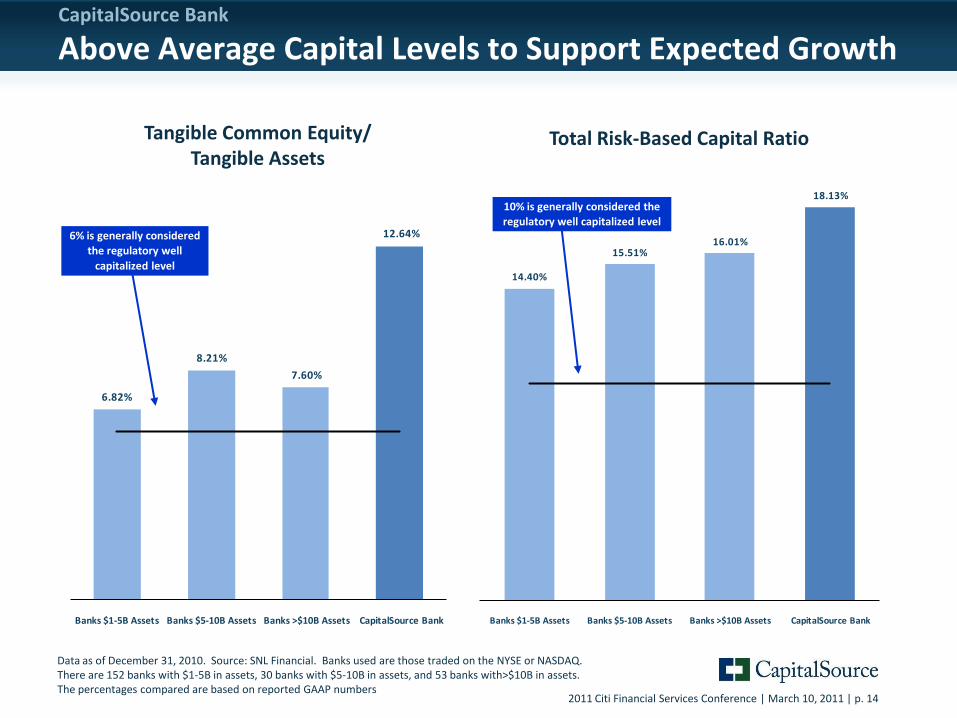
Data as of December 31, 2010. Source: SNL Financial. Banks used are those traded on the NYSE or NASDAQ. There are 152 banks with $1-5B in assets, 30 banks with $5-10B in assets, and 53 banks with>$10B in assets. The percentages compared are based on reported GAAP numbers
14.40%
15.51%16.01%
18.13%
Banks $1-5B Assets Banks $5-10B Assets Banks >$10B Assets CapitalSource Bank
6.82%
8.21%
7.60%
12.64%
Banks $1-5B Assets Banks $5-10B Assets Banks >$10B Assets CapitalSource Bank
10% is generally considered the
regulatory well capitalized level
Total Risk-Based Capital RatioTangible Common Equity/ Tangible Assets
6% is generally considered
the regulatory well
capitalized level
CapitalSource Bank
Above Average Capital Levels to Support Expected Growth

2011 Citi Financial Services Conference | March 10, 2011 | p. 15
48.9%
51.8%
40.5%
33.5% 33.7%
42.0%
37.0%
41.0%1.62%
1.83% 1.79% 1.77%
1.71% 2.04%1.94%
2.10%
Q1 2009 Q2 2009 Q3 2009 Q4 2009 Q1 2010 Q2 2010 Q3 2010 Q4 2010
Efficiency Ratio (1) Expense Ratio (2)
Data as of December 31, 2010(1) Efficiency Ratio is equal to Operating Expense divided by Total Revenue (net interest and non-interest income)(2) Expense Ratio is equal to Operating Expense divided by Average Total Assets
CapitalSource Bank
Low Cost Operating Model
2011 Citi Financial Services Conference | March 10, 2011 | p. 16
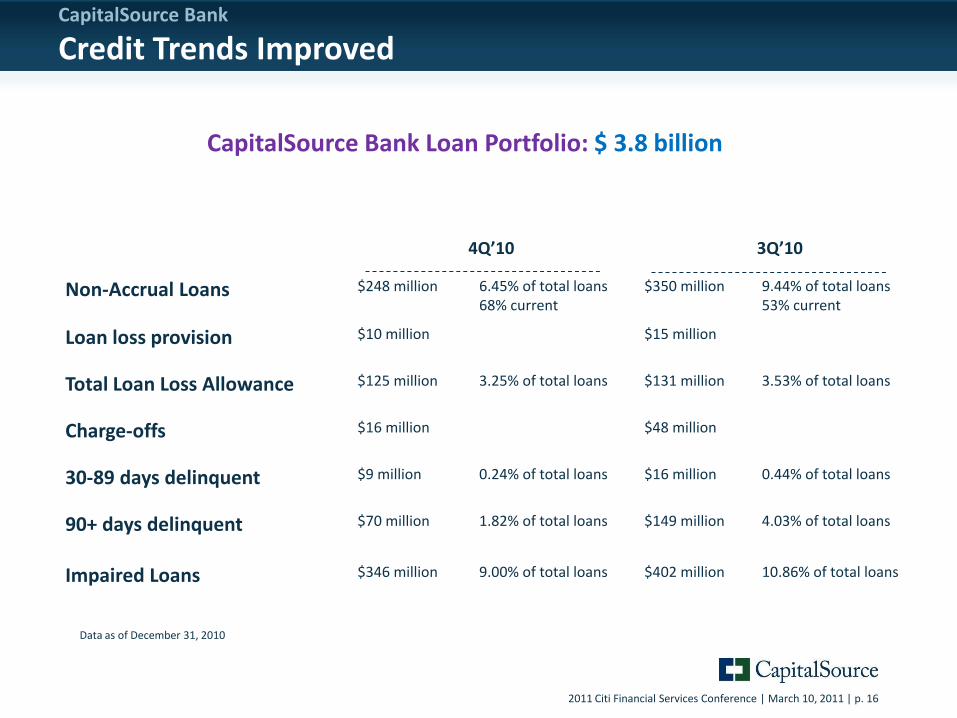
4Q’10 3Q’10
Non-Accrual Loans $248 million 6.45% of total loans68% current
$350 million 9.44% of total loans53% current
Loan loss provision $10 million $15 million
Total Loan Loss Allowance $125 million 3.25% of total loans $131 million 3.53% of total loans
Charge-offs $16 million $48 million
30-89 days delinquent $9 million 0.24% of total loans $16 million 0.44% of total loans
90+ days delinquent $70 million 1.82% of total loans $149 million 4.03% of total loans
Impaired Loans $346 million 9.00% of total loans $402 million 10.86% of total loans
Data as of December 31, 2010
CapitalSource Bank Loan Portfolio: $ 3.8 billion
CapitalSource Bank
Credit Trends Improved
2011 Citi Financial Services Conference | March 10, 2011 | p. 17
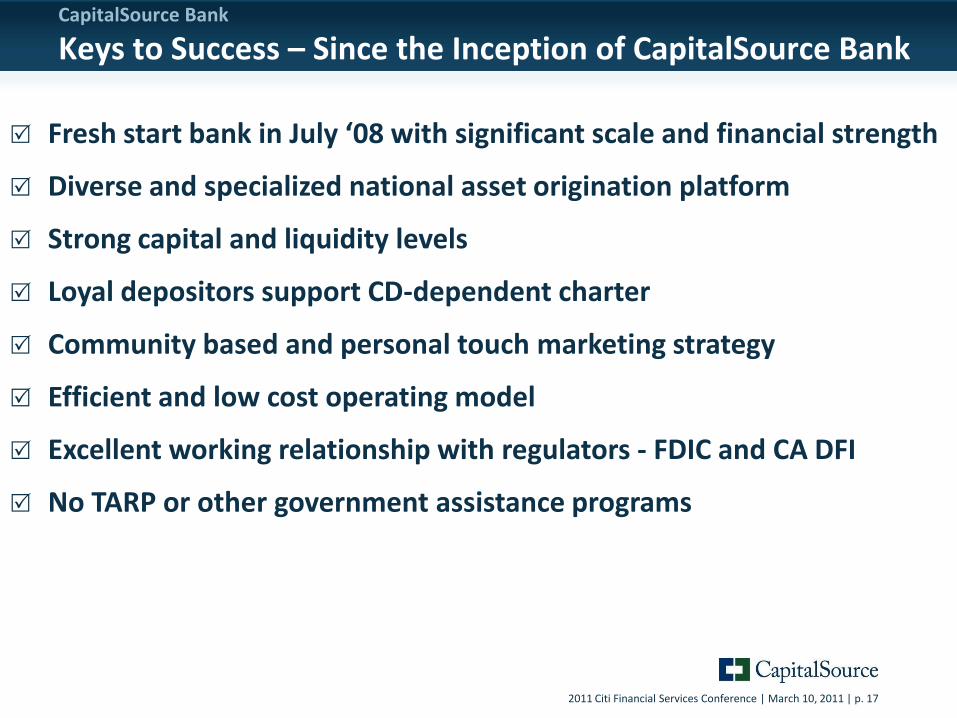
Fresh start bank in July ‘08 with significant scale and financial strength
Diverse and specialized national asset origination platform
Strong capital and liquidity levels
Loyal depositors support CD-dependent charter
Community based and personal touch marketing strategy
Efficient and low cost operating model
Excellent working relationship with regulators - FDIC and CA DFI
No TARP or other government assistance programs
CapitalSource Bank
Keys to Success – Since the Inception of CapitalSource Bank
2011 Citi Financial Services Conference | March 10, 2011 | p. 18
Parent Company: Liquidating the Legacy PortfolioDeleveraging and Balance Sheet Strengthening Continue
2011 Citi Financial Services Conference | March 10, 2011 | p. 19
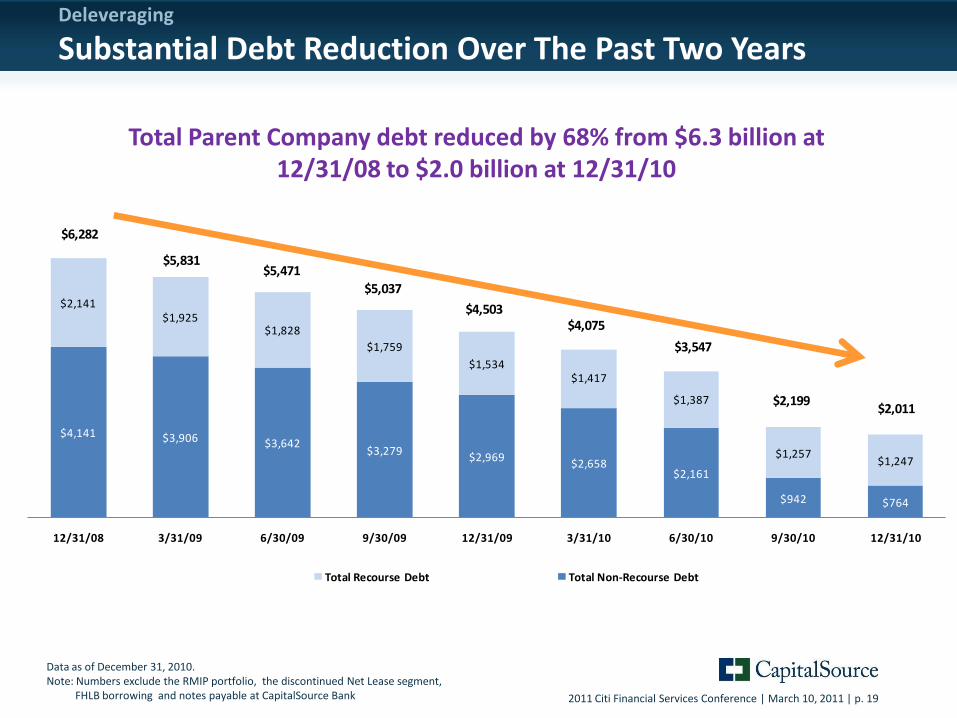
Total Parent Company debt reduced by 68% from $6.3 billion at 12/31/08 to $2.0 billion at 12/31/10
Data as of December 31, 2010.Note: Numbers exclude the RMIP portfolio, the discontinued Net Lease segment,
FHLB borrowing and notes payable at CapitalSource Bank
Deleveraging
Substantial Debt Reduction Over The Past Two Years
$4,141 $3,906 $3,642$3,279
$2,969$2,658
$2,161
$942 $764
$2,141$1,925
$1,828
$1,759
$1,534$1,417
$1,387
$1,257$1,247
12/31/08 3/31/09 6/30/09 9/30/09 12/31/09 3/31/10 6/30/10 9/30/10 12/31/10
Total Recourse Debt Total Non-Recourse Debt
$6,282
$5,831$5,471
$5,037
$4,503$4,075
$3,547
$2,199$2,011
2011 Citi Financial Services Conference | March 10, 2011 | p. 20
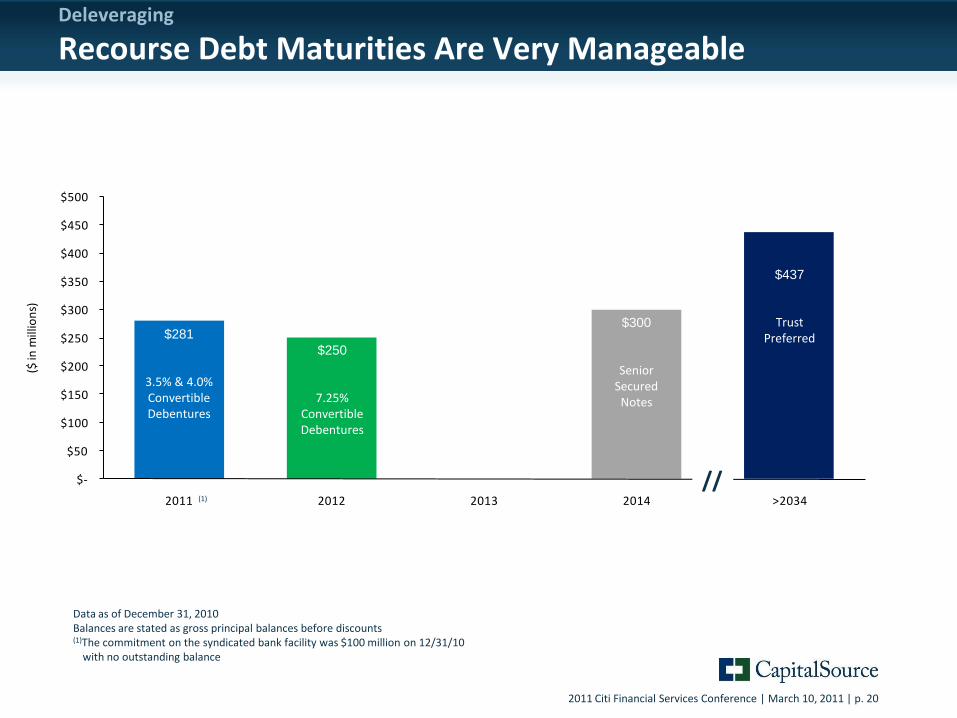
$-
$50
$100
$150
$200
$250
$300
$350
$400
$450
$500
2011 2012 2013 2014 >2034
($ in
mill
ion
s)Deleveraging
Recourse Debt Maturities Are Very Manageable
Data as of December 31, 2010Balances are stated as gross principal balances before discounts(1)The commitment on the syndicated bank facility was $100 million on 12/31/10
with no outstanding balance
//
$281
3.5% & 4.0% Convertible Debentures
$250
7.25% Convertible Debentures
$300
Senior Secured Notes
$437
Trust Preferred
(1)
2011 Citi Financial Services Conference | March 10, 2011 | p. 21
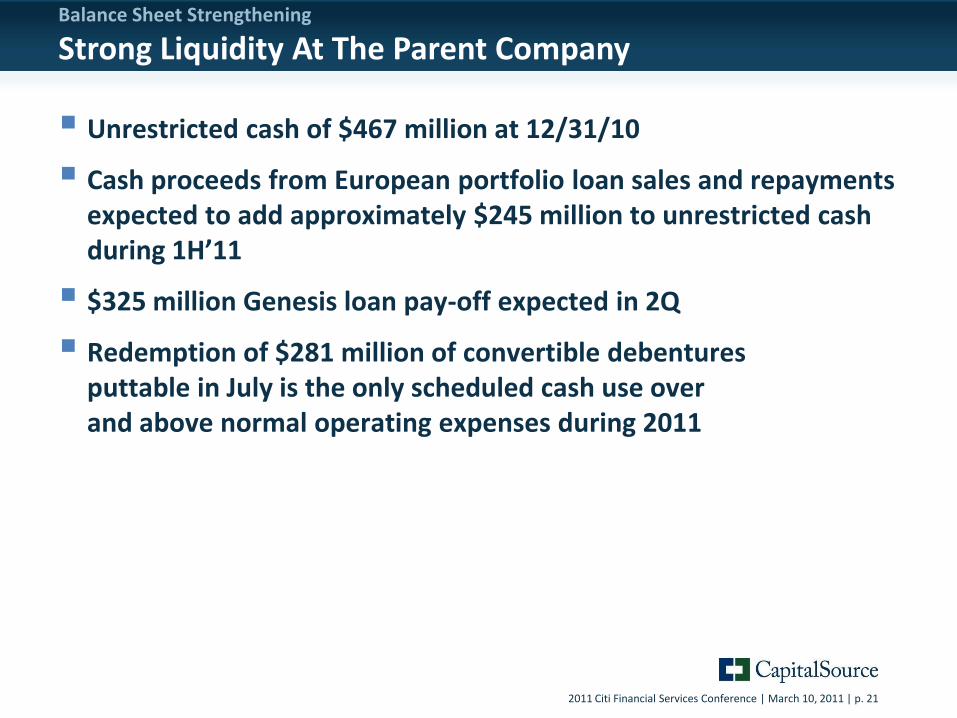
Unrestricted cash of $467 million at 12/31/10
Cash proceeds from European portfolio loan sales and repayments expected to add approximately $245 million to unrestricted cash during 1H’11
$325 million Genesis loan pay-off expected in 2Q
Redemption of $281 million of convertible debentures puttable in July is the only scheduled cash use over and above normal operating expenses during 2011
Balance Sheet Strengthening
Strong Liquidity At The Parent Company
2011 Citi Financial Services Conference | March 10, 2011 | p. 22
Consolidated CreditOngoing Progress in 4Q
2011 Citi Financial Services Conference | March 10, 2011 | p. 23
Consolidated Credit
Highlights of 4Q’10 – Improved Credit Performance
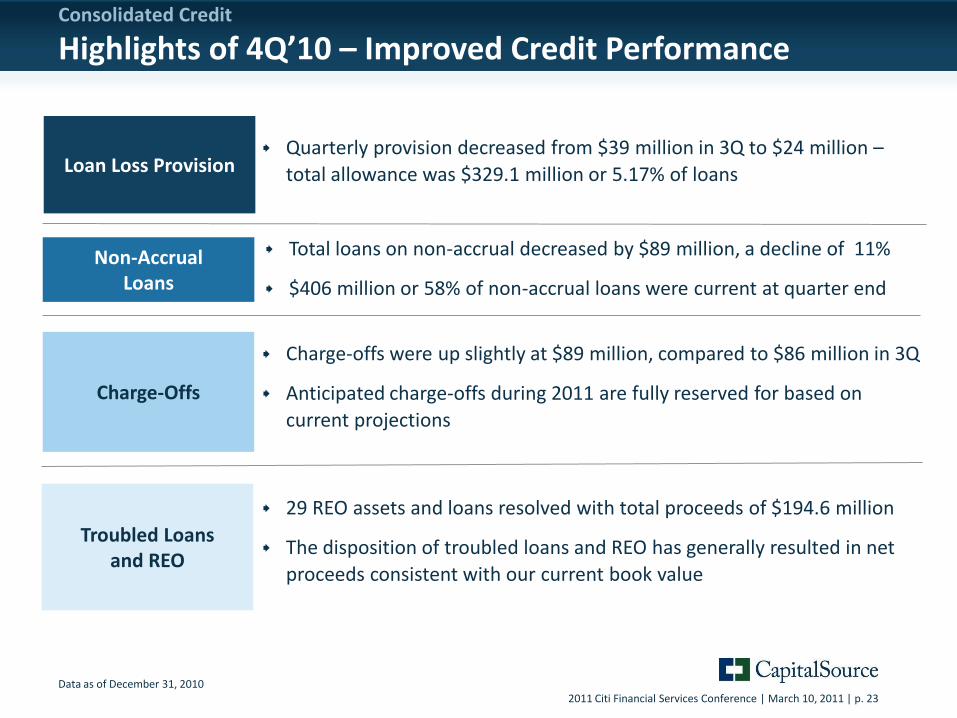
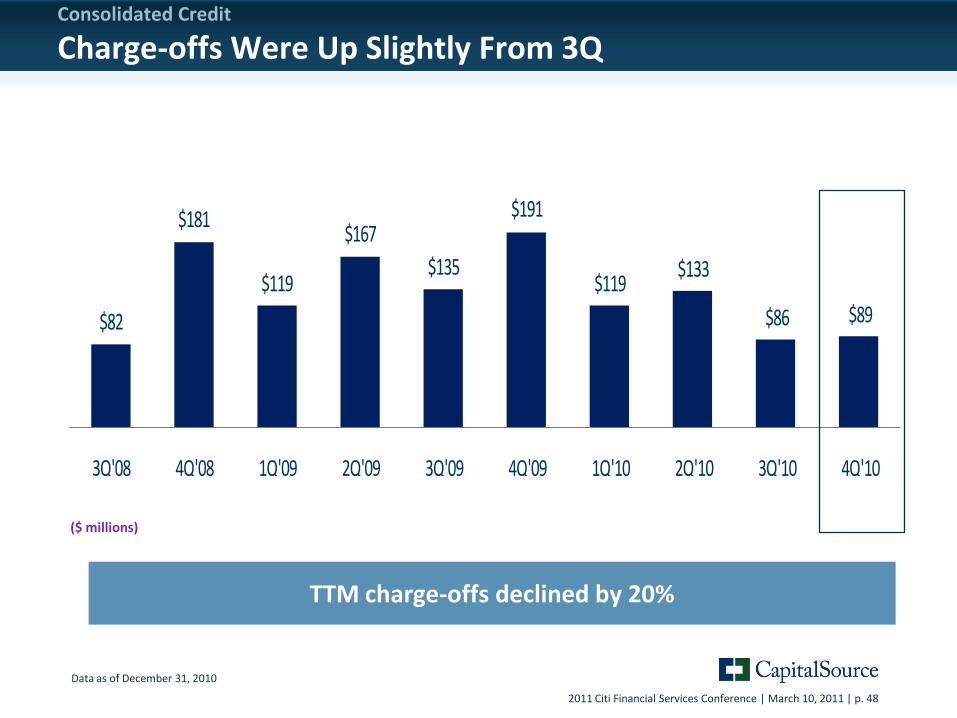
Quarterly provision decreased from $39 million in 3Q to $24 million –
total allowance was $329.1 million or 5.17% of loans
Charge-offs were up slightly at $89 million, compared to $86 million in 3Q
Anticipated charge-offs during 2011 are fully reserved for based on
current projections
Total loans on non-accrual decreased by $89 million, a decline of 11%
$406 million or 58% of non-accrual loans were current at quarter end
Non-Accrual Loans
Charge-Offs
Data as of December 31, 2010
Loan Loss Provision
Troubled Loans and REO
29 REO assets and loans resolved with total proceeds of $194.6 million
The disposition of troubled loans and REO has generally resulted in net
proceeds consistent with our current book value
2011 Citi Financial Services Conference | March 10, 2011 | p. 24
Deferred Tax Asset
2011 Citi Financial Services Conference | March 10, 2011 | p. 25
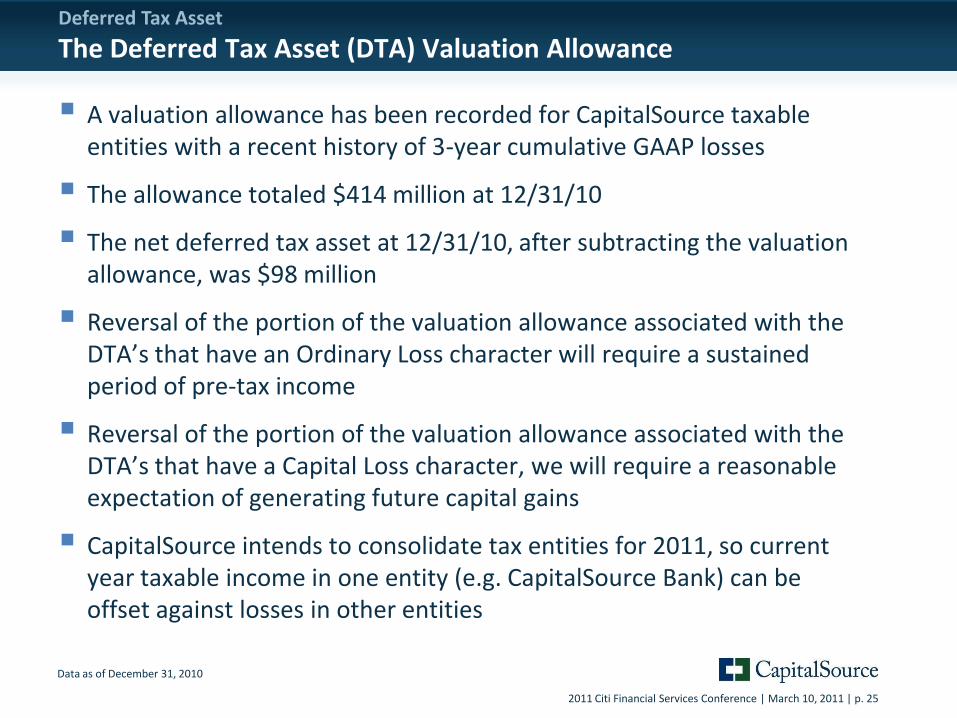
Deferred Tax Asset
The Deferred Tax Asset (DTA) Valuation Allowance
A valuation allowance has been recorded for CapitalSource taxable entities with a recent history of 3-year cumulative GAAP losses
The allowance totaled $414 million at 12/31/10
The net deferred tax asset at 12/31/10, after subtracting the valuation allowance, was $98 million
Reversal of the portion of the valuation allowance associated with the DTA’s that have an Ordinary Loss character will require a sustained period of pre-tax income
Reversal of the portion of the valuation allowance associated with the DTA’s that have a Capital Loss character, we will require a reasonable expectation of generating future capital gains
CapitalSource intends to consolidate tax entities for 2011, so current year taxable income in one entity (e.g. CapitalSource Bank) can be offset against losses in other entities
Data as of December 31, 2010

2011 Citi Financial Services Conference | March 10, 2011 | p. 26
2010 Accomplishments
2011 Citi Financial Services Conference | March 10, 2011 | p. 27
2010 Review
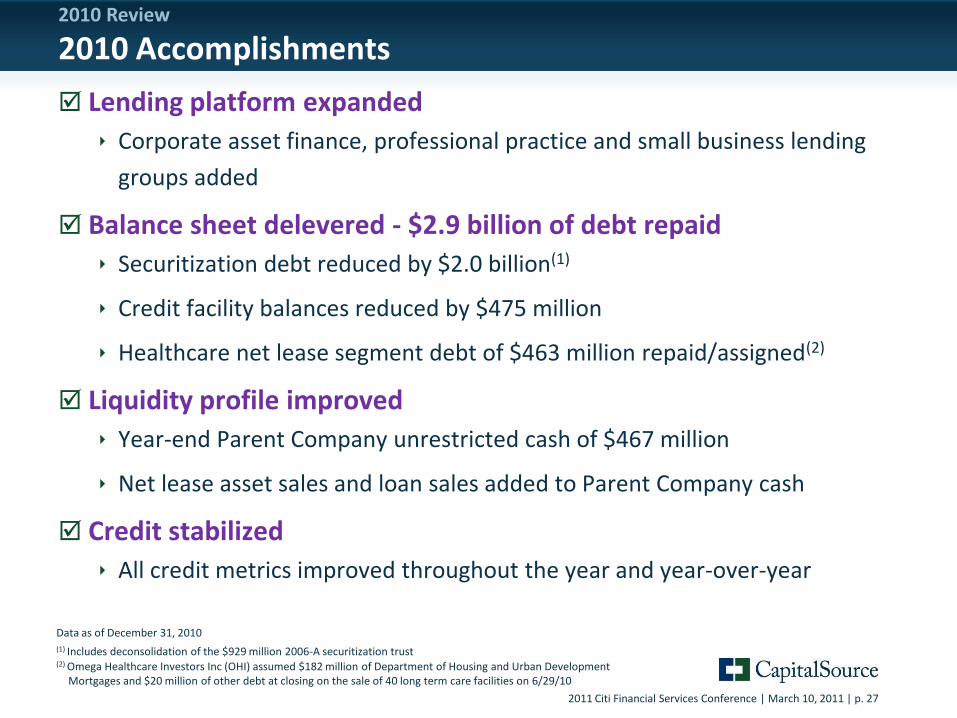
2010 Accomplishments
Lending platform expanded
Corporate asset finance, professional practice and small business lending
groups added
Balance sheet delevered - $2.9 billion of debt repaid
Securitization debt reduced by $2.0 billion(1)
Credit facility balances reduced by $475 million
Healthcare net lease segment debt of $463 million repaid/assigned(2)
Liquidity profile improved
Year-end Parent Company unrestricted cash of $467 million
Net lease asset sales and loan sales added to Parent Company cash
Credit stabilized
All credit metrics improved throughout the year and year-over-year
Data as of December 31, 2010
(1) Includes deconsolidation of the $929 million 2006-A securitization trust(2) Omega Healthcare Investors Inc (OHI) assumed $182 million of Department of Housing and Urban Development
Mortgages and $20 million of other debt at closing on the sale of 40 long term care facilities on 6/29/10
2011 Citi Financial Services Conference | March 10, 2011 | p. 28
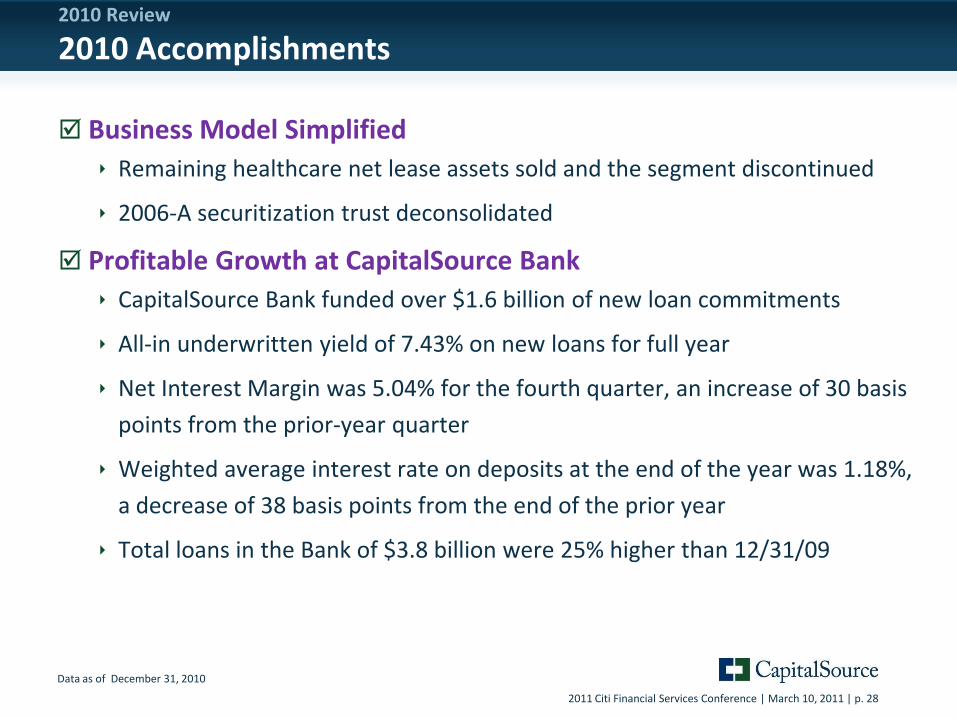
Business Model Simplified
Remaining healthcare net lease assets sold and the segment discontinued
2006-A securitization trust deconsolidated
Profitable Growth at CapitalSource Bank
CapitalSource Bank funded over $1.6 billion of new loan commitments
All-in underwritten yield of 7.43% on new loans for full year
Net Interest Margin was 5.04% for the fourth quarter, an increase of 30 basis
points from the prior-year quarter
Weighted average interest rate on deposits at the end of the year was 1.18%,
a decrease of 38 basis points from the end of the prior year
Total loans in the Bank of $3.8 billion were 25% higher than 12/31/09
Data as of December 31, 2010
2010 Review
2010 Accomplishments
2011 Citi Financial Services Conference | March 10, 2011 | p. 29
2011 Guidance and Strategic Initiatives
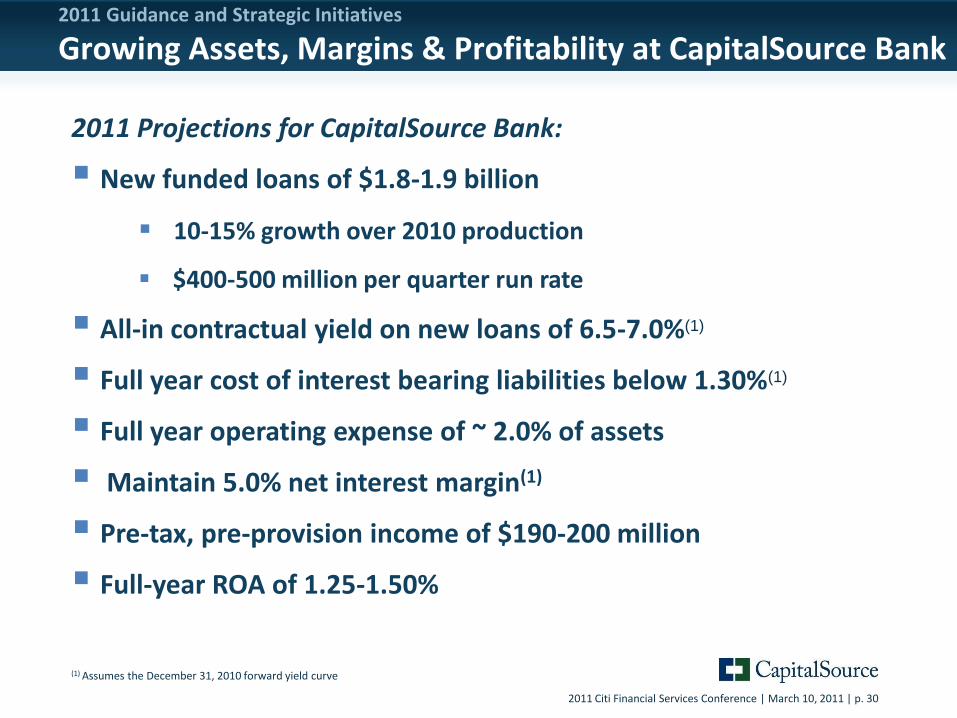
2011 Citi Financial Services Conference | March 10, 2011 | p. 30
2011 Guidance and Strategic Initiatives
Growing Assets, Margins & Profitability at CapitalSource Bank
2011 Projections for CapitalSource Bank:
New funded loans of $1.8-1.9 billion
10-15% growth over 2010 production
$400-500 million per quarter run rate
All-in contractual yield on new loans of 6.5-7.0%(1)
Full year cost of interest bearing liabilities below 1.30%(1)
Full year operating expense of ~ 2.0% of assets
Maintain 5.0% net interest margin(1)
Pre-tax, pre-provision income of $190-200 million
Full-year ROA of 1.25-1.50%
(1) Assumes the December 31, 2010 forward yield curve
2011 Citi Financial Services Conference | March 10, 2011 | p. 31
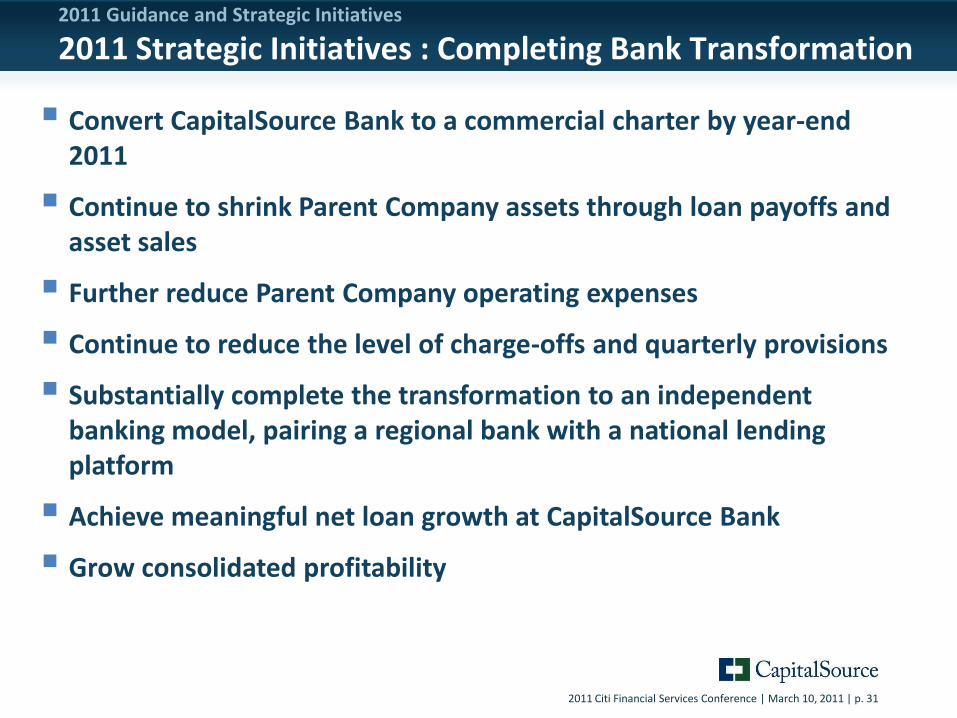
2011 Guidance and Strategic Initiatives
2011 Strategic Initiatives : Completing Bank Transformation
Convert CapitalSource Bank to a commercial charter by year-end 2011
Continue to shrink Parent Company assets through loan payoffs and asset sales
Further reduce Parent Company operating expenses
Continue to reduce the level of charge-offs and quarterly provisions
Substantially complete the transformation to an independent banking model, pairing a regional bank with a national lending platform
Achieve meaningful net loan growth at CapitalSource Bank
Grow consolidated profitability
2011 Citi Financial Services Conference | March 10, 2011 | p. 32
Investment ThesisThe Transformation will be Largely Completed in 2011
2011 Citi Financial Services Conference | March 10, 2011 | p. 33
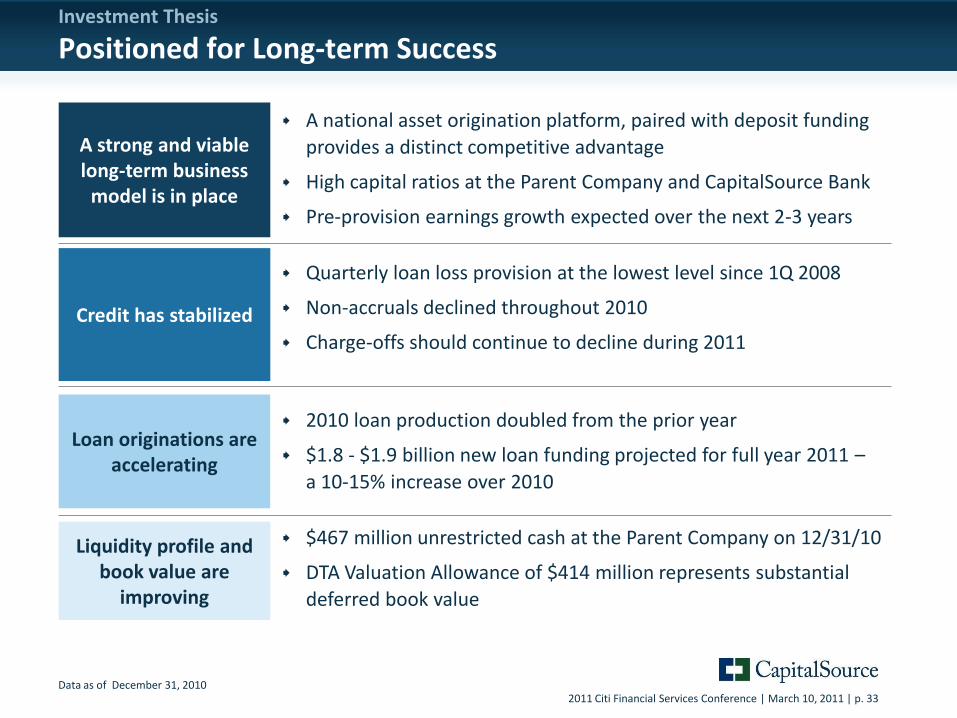
Investment Thesis
Positioned for Long-term Success
A national asset origination platform, paired with deposit funding
provides a distinct competitive advantage
High capital ratios at the Parent Company and CapitalSource Bank
Pre-provision earnings growth expected over the next 2-3 years
Credit has stabilized
Loan originations are accelerating
Data as of December 31, 2010
A strong and viable long-term business
model is in place
Liquidity profile and book value are
improving
Quarterly loan loss provision at the lowest level since 1Q 2008
Non-accruals declined throughout 2010
Charge-offs should continue to decline during 2011
2010 loan production doubled from the prior year
$1.8 - $1.9 billion new loan funding projected for full year 2011 –
a 10-15% increase over 2010
$467 million unrestricted cash at the Parent Company on 12/31/10
DTA Valuation Allowance of $414 million represents substantial
deferred book value

2011 Citi Financial Services Conference | March 10, 2011 | p. 34
Questions and Answers
2011 Citi Financial Services Conference | March 10, 2011 | p. 35
AppendixCapitalSource Bank Pages 35-39
Parent Company Funding and Liabilities Pages 40-43
Consolidated Credit Pages 44-53
2011 Citi Financial Services Conference | March 10, 2011 | p. 36
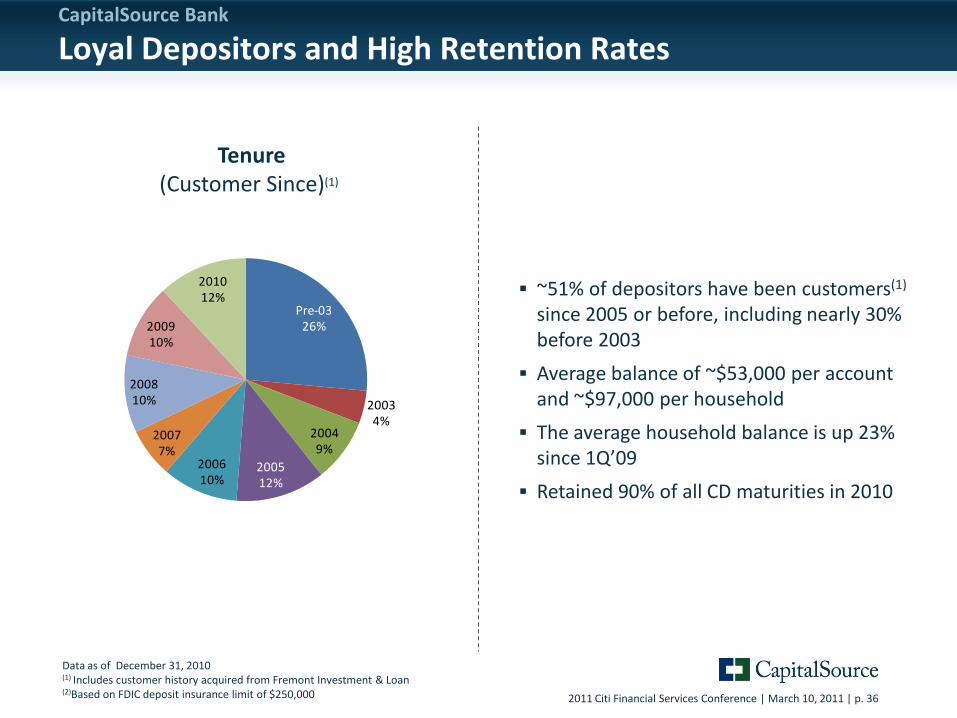
CapitalSource Bank
Loyal Depositors and High Retention Rates
~51% of depositors have been customers(1)
since 2005 or before, including nearly 30% before 2003
Average balance of ~$53,000 per account and ~$97,000 per household
The average household balance is up 23% since 1Q’09
Retained 90% of all CD maturities in 2010
Tenure(Customer Since)(1)
Data as of December 31, 2010(1) Includes customer history acquired from Fremont Investment & Loan(2)Based on FDIC deposit insurance limit of $250,000
Pre-0326%
20034%
20049%
200512%
200610%
20077%
200810%
200910%
201012%
2011 Citi Financial Services Conference | March 10, 2011 | p. 37
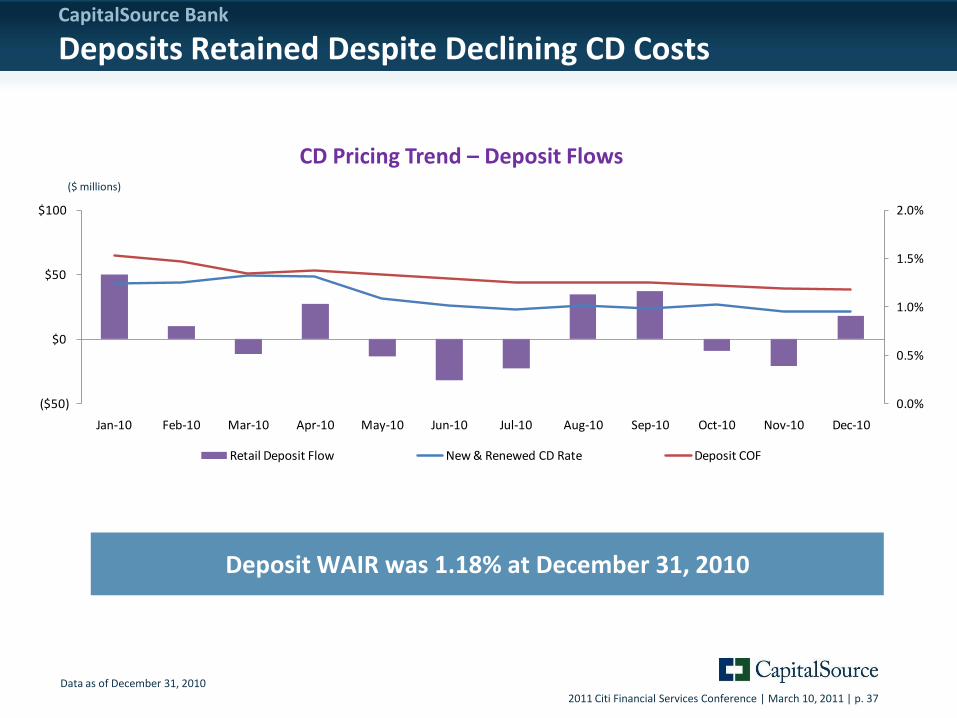
CapitalSource Bank
Deposits Retained Despite Declining CD Costs
Data as of December 31, 2010
CD Pricing Trend – Deposit Flows
CD
pri
cin
g an
d C
OF
($ millions)
Deposit WAIR was 1.18% at December 31, 2010
0.0%
0.5%
1.0%
1.5%
2.0%
($50)
$0
$50
$100
Jan-10 Feb-10 Mar-10 Apr-10 May-10 Jun-10 Jul-10 Aug-10 Sep-10 Oct-10 Nov-10 Dec-10
Retail Deposit Flow New & Renewed CD Rate Deposit COF
2011 Citi Financial Services Conference | March 10, 2011 | p. 38
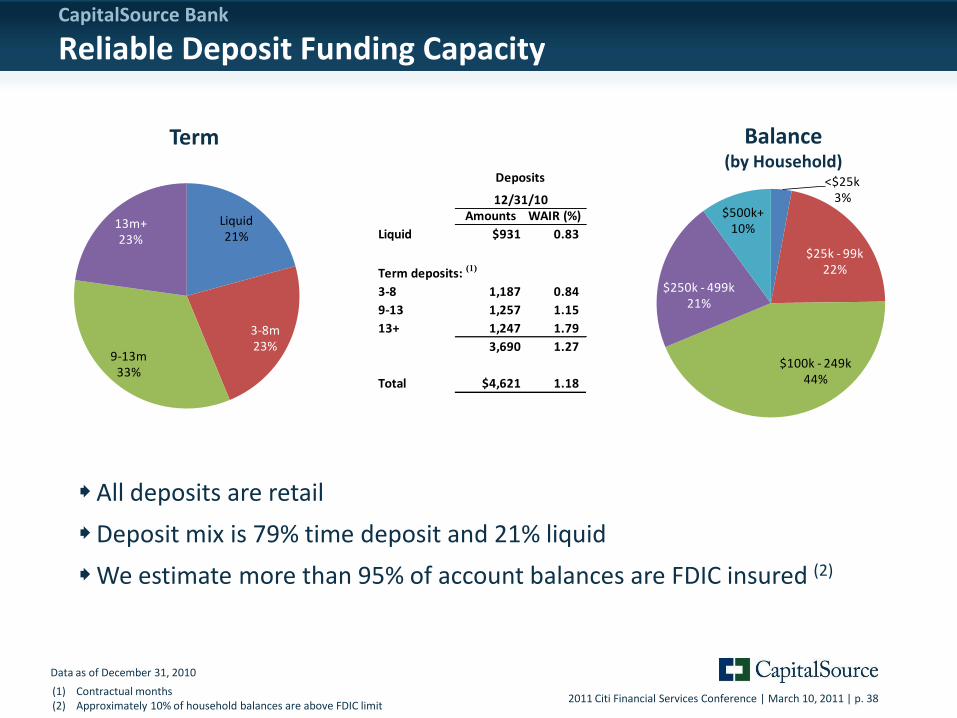
CapitalSource Bank
Reliable Deposit Funding Capacity
Balance (by Household)
All deposits are retail
Deposit mix is 79% time deposit and 21% liquid
We estimate more than 95% of account balances are FDIC insured (2)
Term
Data as of December 31, 2010
(1) Contractual months(2) Approximately 10% of household balances are above FDIC limit
<$25k3%
$25k - 99k22%
$100k - 249k44%
$250k - 499k21%
$500k+10%
Liquid21%
3-8m23%
9-13m33%
13m+23%
12/31/10 Amounts WAIR (%)
Liquid $931 0.83
Term deposits: (1)
3-8 1,187 0.84
9-13 1,257 1.15
13+ 1,247 1.79
3,690 1.27
Total $4,621 1.18
Deposits
2011 Citi Financial Services Conference | March 10, 2011 | p. 39
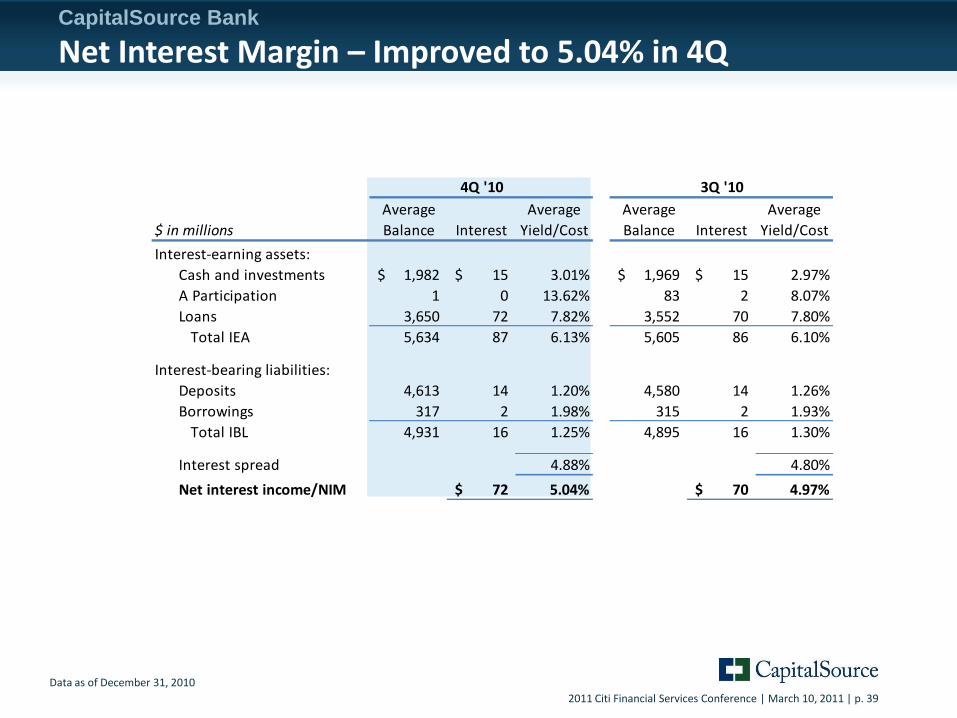
4Q '10 3Q '10
Average Average Average Average
$ in millions Balance Interest Yield/Cost Balance Interest Yield/Cost
Interest-earning assets:
Cash and investments 1,982$ 15$ 3.01% 1,969$ 15$ 2.97%
A Participation 1 0 13.62% 83 2 8.07%
Loans 3,650 72 7.82% 3,552 70 7.80%
Total IEA 5,634 87 6.13% 5,605 86 6.10%
Interest-bearing liabilities:
Deposits 4,613 14 1.20% 4,580 14 1.26%
Borrowings 317 2 1.98% 315 2 1.93%
Total IBL 4,931 16 1.25% 4,895 16 1.30%
Interest spread 4.88% 4.80%
Net interest income/NIM 72$ 5.04% 70$ 4.97%
CapitalSource Bank
Net Interest Margin – Improved to 5.04% in 4Q
Data as of December 31, 2010
2011 Citi Financial Services Conference | March 10, 2011 | p. 40
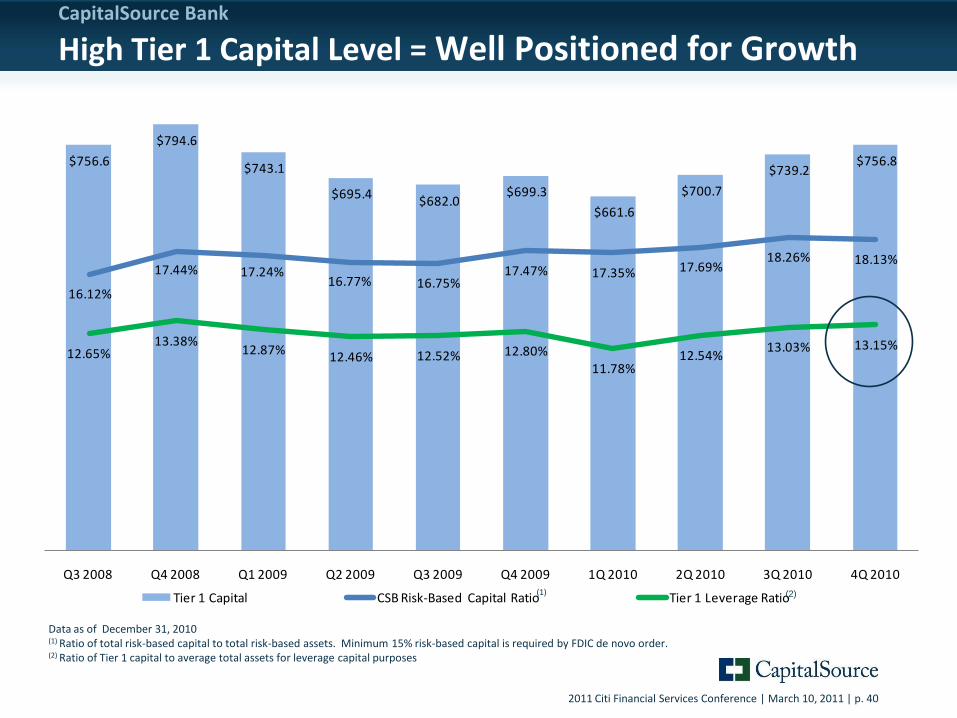
$756.6
$794.6
$743.1
$695.4 $682.0
$699.3
$661.6
$700.7
$739.2 $756.8
16.12%
17.44% 17.24%16.77% 16.75%
17.47% 17.35% 17.69%18.26% 18.13%
12.65%13.38%
12.87%12.46% 12.52% 12.80%
11.78%12.54%
13.03% 13.15%
Q3 2008 Q4 2008 Q1 2009 Q2 2009 Q3 2009 Q4 2009 1Q 2010 2Q 2010 3Q 2010 4Q 2010
Tier 1 Capital CSB Risk-Based Capital Ratio Tier 1 Leverage Ratio
CapitalSource Bank
High Tier 1 Capital Level = Well Positioned for Growth
Data as of December 31, 2010(1) Ratio of total risk-based capital to total risk-based assets. Minimum 15% risk-based capital is required by FDIC de novo order.(2) Ratio of Tier 1 capital to average total assets for leverage capital purposes
(1) (2)
2011 Citi Financial Services Conference | March 10, 2011 | p. 41
Funding & Liabilities
2011 Citi Financial Services Conference | March 10, 2011 | p. 42
Data as of December 31, 2010(1) December 2009 excludes the discontinued Healthcare Net Lease Segment mortgage debt(2) Commitment on SBF was $100 million, with no outstanding balance as of 12/31/2010. Balance excludes
$21 million and $29 million of outstanding Letters of Credit as of 12/31/2010 and 9/30/2010 respectively(3) Balance net of discounts
Funding & Liabilities
Total Debt Declined Rapidly During 2010
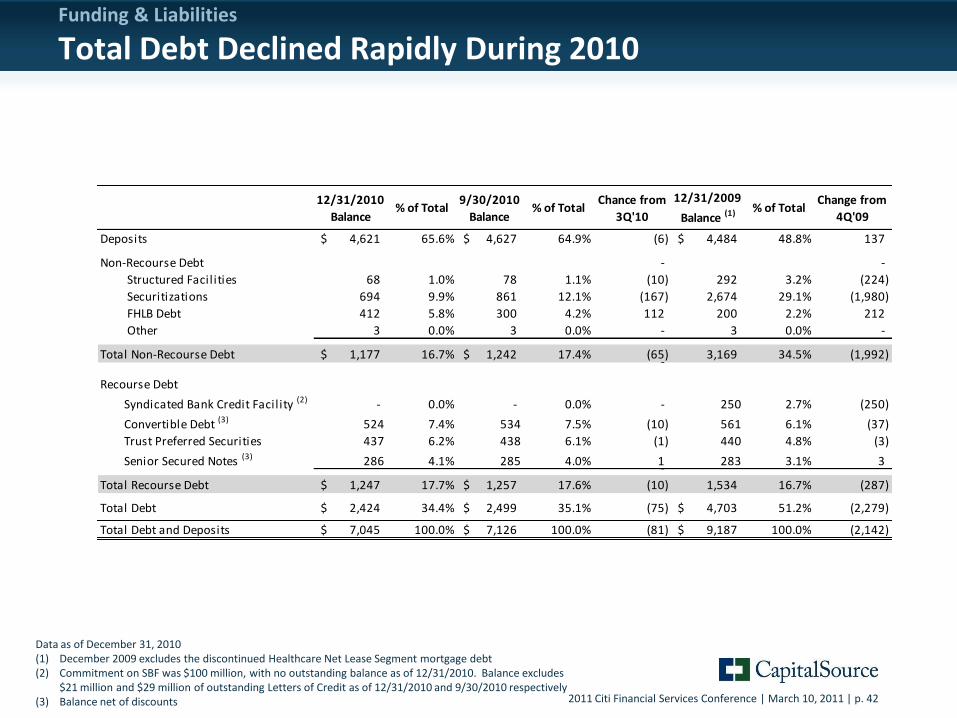
12/31/2010
Balance% of Total
9/30/2010
Balance% of Total
Chance from
3Q'10
12/31/2009
Balance (1) % of TotalChange from
4Q'09
Deposits 4,621$ 65.6% 4,627$ 64.9% (6) 4,484$ 48.8% 137 - -
Non-Recourse Debt - -
Structured Facilities 68 1.0% 78 1.1% (10) 292 3.2% (224)
Securitizations 694 9.9% 861 12.1% (167) 2,674 29.1% (1,980)
FHLB Debt 412 5.8% 300 4.2% 112 200 2.2% 212
Other 3 0.0% 3 0.0% - 3 0.0% - -
Total Non-Recourse Debt 1,177$ 16.7% 1,242$ 17.4% (65) 3,169 34.5% (1,992) - -
Recourse Debt
Syndicated Bank Credit Facility (2) - 0.0% - 0.0% - 250 2.7% (250)
Convertible Debt (3) 524 7.4% 534 7.5% (10) 561 6.1% (37)
Trust Preferred Securities 437 6.2% 438 6.1% (1) 440 4.8% (3)
Senior Secured Notes (3) 286 4.1% 285 4.0% 1 283 3.1% 3 -
Total Recourse Debt 1,247$ 17.7% 1,257$ 17.6% (10) 1,534 16.7% (287) -
Total Debt 2,424$ 34.4% 2,499$ 35.1% (75) 4,703$ 51.2% (2,279) - -
Total Debt and Deposits 7,045$ 100.0% 7,126$ 100.0% (81) 9,187$ 100.0% (2,142)
2011 Citi Financial Services Conference | March 10, 2011 | p. 43
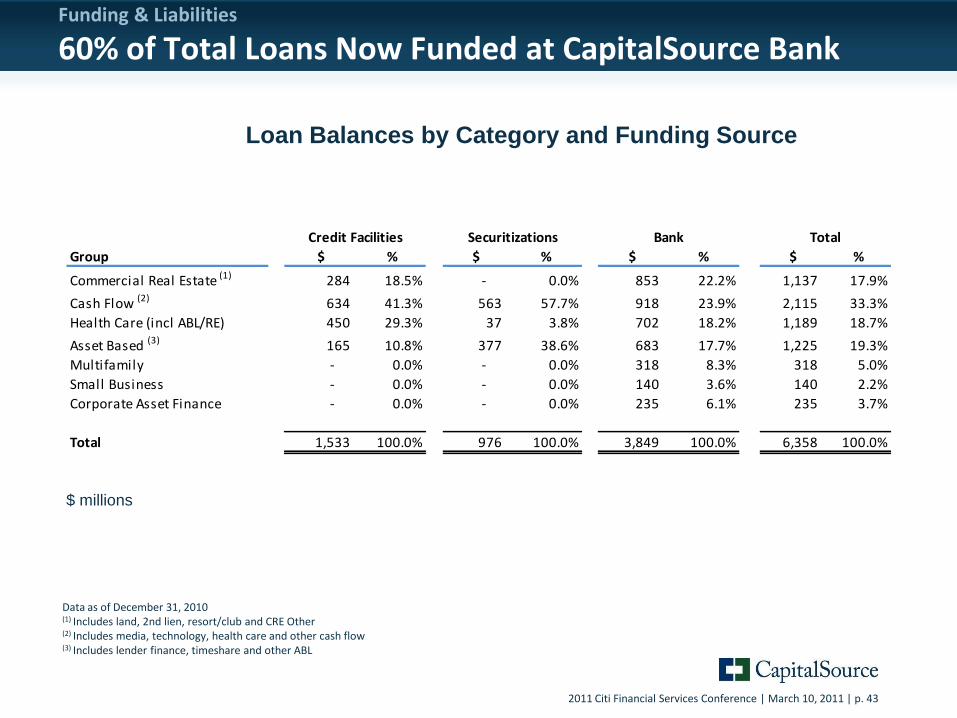
Group $ % $ % $ % $ %
Commercial Real Estate (1) 284 18.5% - 0.0% 853 22.2% 1,137 17.9%
Cash Flow (2) 634 41.3% 563 57.7% 918 23.9% 2,115 33.3%
Health Care (incl ABL/RE) 450 29.3% 37 3.8% 702 18.2% 1,189 18.7%
Asset Based (3) 165 10.8% 377 38.6% 683 17.7% 1,225 19.3%
Multifamily - 0.0% - 0.0% 318 8.3% 318 5.0%
Small Business - 0.0% - 0.0% 140 3.6% 140 2.2%
Corporate Asset Finance - 0.0% - 0.0% 235 6.1% 235 3.7%
Total 1,533 100.0% 976 100.0% 3,849 100.0% 6,358 100.0%
Credit Facilities Securitizations Bank Total
Funding & Liabilities
60% of Total Loans Now Funded at CapitalSource Bank
Data as of December 31, 2010(1) Includes land, 2nd lien, resort/club and CRE Other(2) Includes media, technology, health care and other cash flow(3) Includes lender finance, timeshare and other ABL
Loan Balances by Category and Funding Source
$ millions
2011 Citi Financial Services Conference | March 10, 2011 | p. 44
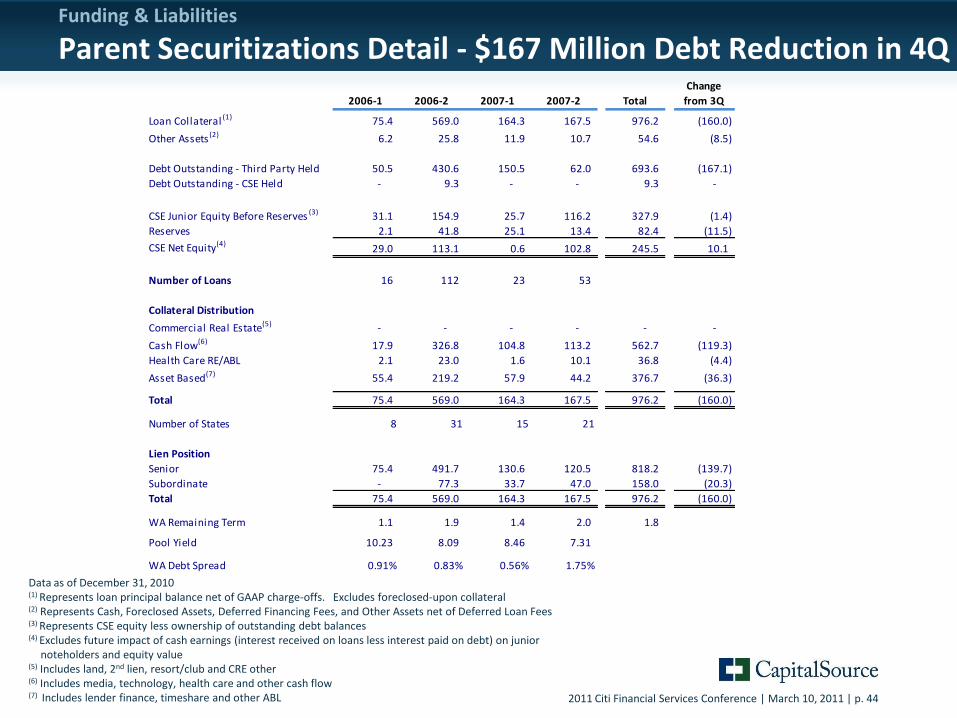
2006-1 2006-2 2007-1 2007-2 Total
Change
from 3Q
Loan Collateral (1) 75.4 569.0 164.3 167.5 976.2 (160.0)
Other Assets (2) 6.2 25.8 11.9 10.7 54.6 (8.5)
Debt Outstanding - Third Party Held 50.5 430.6 150.5 62.0 693.6 (167.1)
Debt Outstanding - CSE Held - 9.3 - - 9.3 -
CSE Junior Equity Before Reserves (3) 31.1 154.9 25.7 116.2 327.9 (1.4)
Reserves 2.1 41.8 25.1 13.4 82.4 (11.5)
CSE Net Equity(4)29.0 113.1 0.6 102.8 245.5 10.1
Number of Loans 16 112 23 53
Collateral Distribution
Commercial Real Estate(5) - - - - - -
Cash Flow(6) 17.9 326.8 104.8 113.2 562.7 (119.3)
Health Care RE/ABL 2.1 23.0 1.6 10.1 36.8 (4.4)
Asset Based(7) 55.4 219.2 57.9 44.2 376.7 (36.3)
Total 75.4 569.0 164.3 167.5 976.2 (160.0)
Number of States 8 31 15 21
Lien Position
Senior 75.4 491.7 130.6 120.5 818.2 (139.7)
Subordinate - 77.3 33.7 47.0 158.0 (20.3)
Total 75.4 569.0 164.3 167.5 976.2 (160.0)
WA Remaining Term 1.1 1.9 1.4 2.0 1.8
Pool Yield 10.23 8.09 8.46 7.31
WA Debt Spread 0.91% 0.83% 0.56% 1.75%
Data as of December 31, 2010(1) Represents loan principal balance net of GAAP charge-offs. Excludes foreclosed-upon collateral(2) Represents Cash, Foreclosed Assets, Deferred Financing Fees, and Other Assets net of Deferred Loan Fees(3) Represents CSE equity less ownership of outstanding debt balances(4) Excludes future impact of cash earnings (interest received on loans less interest paid on debt) on junior
noteholders and equity value(5) Includes land, 2nd lien, resort/club and CRE other(6) Includes media, technology, health care and other cash flow (7) Includes lender finance, timeshare and other ABL
Funding & Liabilities
Parent Securitizations Detail - $167 Million Debt Reduction in 4Q

2011 Citi Financial Services Conference | March 10, 2011 | p. 45
Consolidated Credit
2011 Citi Financial Services Conference | March 10, 2011 | p. 46
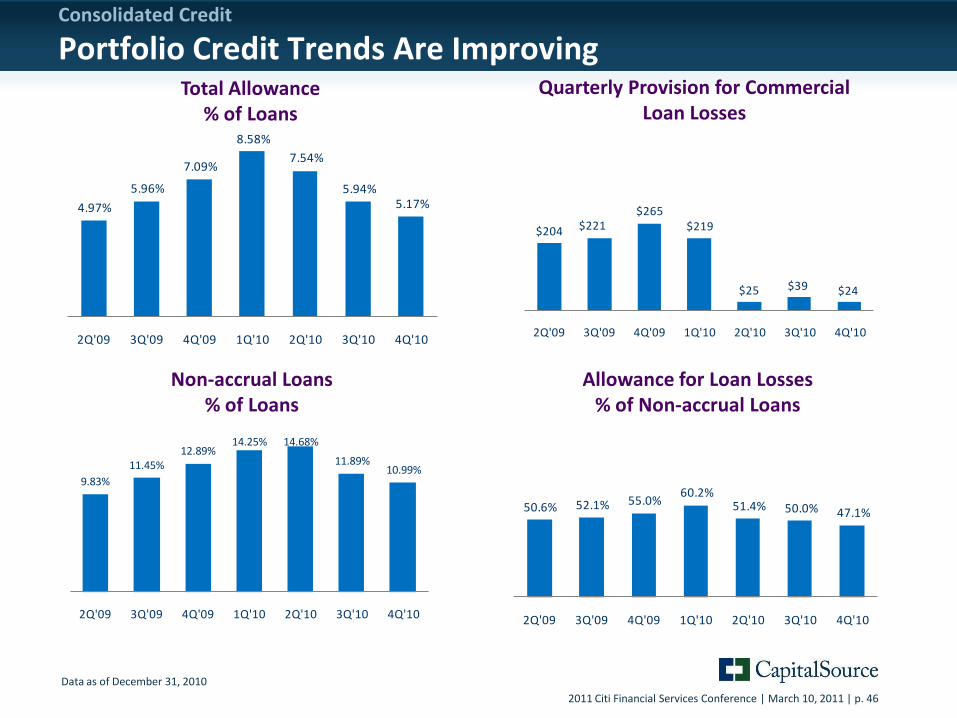
9.83%
11.45%12.89%
14.25% 14.68%
11.89%10.99%
2Q'09 3Q'09 4Q'09 1Q'10 2Q'10 3Q'10 4Q'10
4.97%
5.96%
7.09%
8.58%
7.54%
5.94%5.17%
2Q'09 3Q'09 4Q'09 1Q'10 2Q'10 3Q'10 4Q'10
Non-accrual Loans % of Loans
Quarterly Provision for Commercial Loan Losses
Total Allowance % of Loans
Allowance for Loan Losses % of Non-accrual Loans
Data as of December 31, 2010
50.6% 52.1% 55.0%60.2%
51.4% 50.0% 47.1%
2Q'09 3Q'09 4Q'09 1Q'10 2Q'10 3Q'10 4Q'10
$204 $221$265
$219
$25 $39 $24
2Q'09 3Q'09 4Q'09 1Q'10 2Q'10 3Q'10 4Q'10
Consolidated Credit
Portfolio Credit Trends Are Improving
2011 Citi Financial Services Conference | March 10, 2011 | p. 47
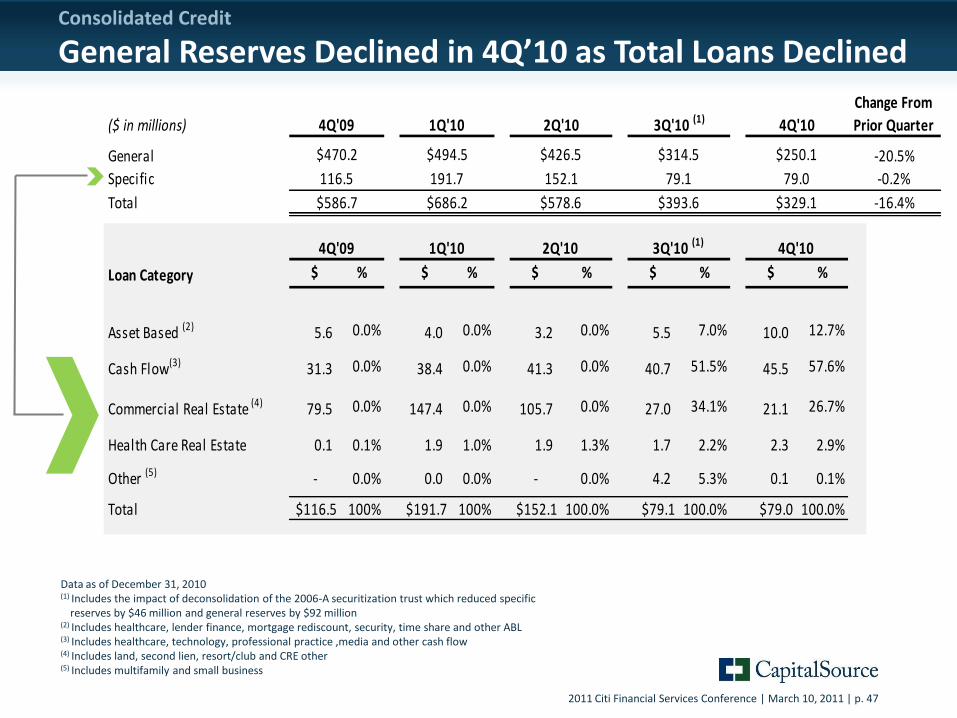
($ in millions)
Change From
Prior Quarter
General -20.5%
Specific -0.2%
Total -16.4%
Loan Category $ % $ % $ % $ % $ %
Asset Based (2) 5.6 0.0% 4.0 0.0% 3.2 0.0% 5.5 7.0% 10.0 12.7%
Cash Flow(3) 31.3 0.0% 38.4 0.0% 41.3 0.0% 40.7 51.5% 45.5 57.6%
Commercial Real Estate (4) 79.5 0.0% 147.4 0.0% 105.7 0.0% 27.0 34.1% 21.1 26.7%
Health Care Real Estate 0.1 0.1% 1.9 1.0% 1.9 1.3% 1.7 2.2% 2.3 2.9%
Other (5) - 0.0% 0.0 0.0% - 0.0% 4.2 5.3% 0.1 0.1%
Total $116.5 100% $191.7 100% $152.1 100.0% $79.1 100.0% $79.0 100.0%
$250.1
79.0
$329.1
$426.5
152.1
$578.6
$314.5
79.1
$393.6
116.5
$586.7
$494.5
191.7
$686.2
2Q'104Q'09 1Q'10 3Q'10 (1) 4Q'10
4Q'09 1Q'10 2Q'10 3Q'10 (1) 4Q'10
$470.2
Consolidated Credit
General Reserves Declined in 4Q’10 as Total Loans Declined
Data as of December 31, 2010(1) Includes the impact of deconsolidation of the 2006-A securitization trust which reduced specific
reserves by $46 million and general reserves by $92 million(2) Includes healthcare, lender finance, mortgage rediscount, security, time share and other ABL(3) Includes healthcare, technology, professional practice ,media and other cash flow(4) Includes land, second lien, resort/club and CRE other(5) Includes multifamily and small business
2011 Citi Financial Services Conference | March 10, 2011 | p. 48
$82
$181
$119
$167
$135
$191
$119 $133
$86 $89
3Q'08 4Q'08 1Q'09 2Q'09 3Q'09 4Q'09 1Q'10 2Q'10 3Q'10 4Q'10
Consolidated Credit
Charge-offs Were Up Slightly From 3Q
Data as of December 31, 2010
($ millions)
TTM charge-offs declined by 20%
2011 Citi Financial Services Conference | March 10, 2011 | p. 49
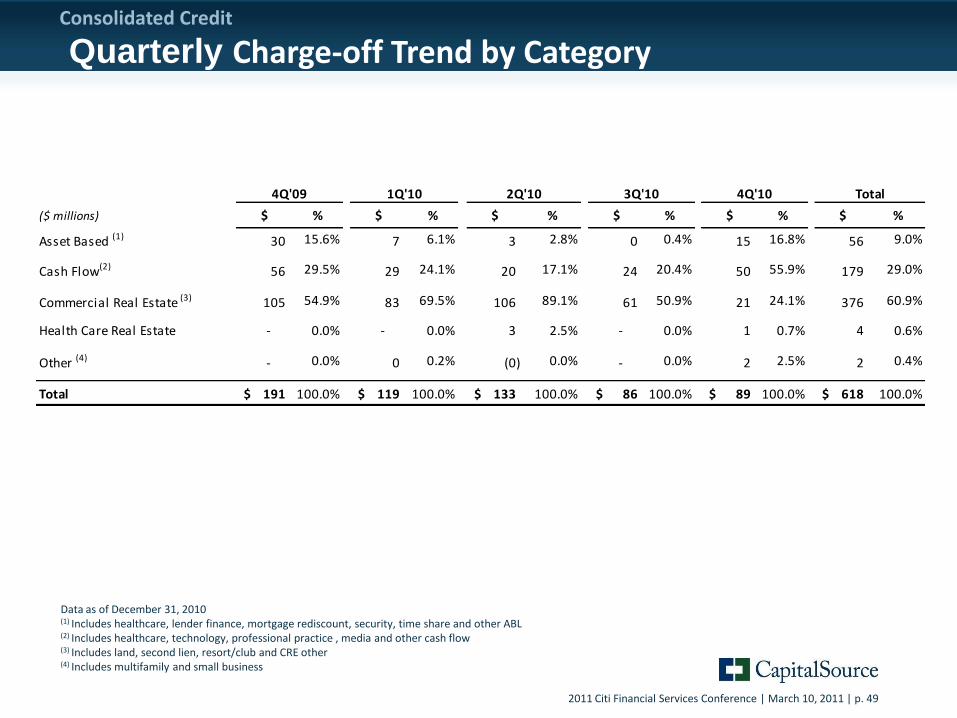
($ millions) $ % $ % $ % $ % $ % $ %
Asset Based (1) 30 15.6% 7 6.1% 3 2.8% 0 0.4% 15 16.8% 56 9.0%
Cash Flow(2) 56 29.5% 29 24.1% 20 17.1% 24 20.4% 50 55.9% 179 29.0%
Commercial Real Estate (3) 105 54.9% 83 69.5% 106 89.1% 61 50.9% 21 24.1% 376 60.9%
Health Care Real Estate - 0.0% - 0.0% 3 2.5% - 0.0% 1 0.7% 4 0.6%
Other (4) - 0.0% 0 0.2% (0) 0.0% - 0.0% 2 2.5% 2 0.4%
Total 191$ 100.0% 119$ 100.0% 133$ 100.0% 86$ 100.0% 89$ 100.0% 618$ 100.0%
Total4Q'09 1Q'10 3Q'102Q'10 4Q'10
Data as of December 31, 2010(1) Includes healthcare, lender finance, mortgage rediscount, security, time share and other ABL(2) Includes healthcare, technology, professional practice , media and other cash flow(3) Includes land, second lien, resort/club and CRE other (4) Includes multifamily and small business
Consolidated Credit
Quarterly Charge-off Trend by Category
2011 Citi Financial Services Conference | March 10, 2011 | p. 50
% of % of % of % of % of % of
($ in millions) Loans Balance Loans Balance Portfolio Loans Balance Portfolio Loans Balance Portfolio Specific General Total Portfolio Non-Acc. Delinquen. Amount Total
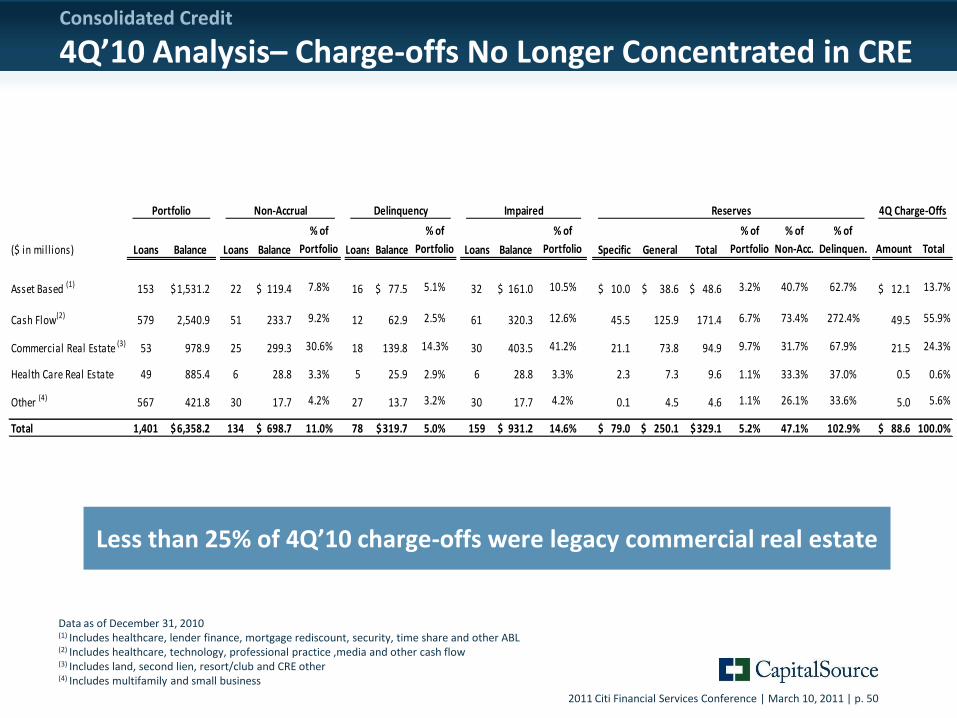
Asset Based (1) 153 1,531.2$ 22 119.4$ 7.8% 16 77.5$ 5.1% 32 161.0$ 10.5% 10.0$ 38.6$ 48.6$ 3.2% 40.7% 62.7% 12.1$ 13.7%
Cash Flow(2) 579 2,540.9 51 233.7 9.2% 12 62.9 2.5% 61 320.3 12.6% 45.5 125.9 171.4 6.7% 73.4% 272.4% 49.5 55.9%
Commercial Real Estate (3) 53 978.9 25 299.3 30.6% 18 139.8 14.3% 30 403.5 41.2% 21.1 73.8 94.9 9.7% 31.7% 67.9% 21.5 24.3%
Health Care Real Estate 49 885.4 6 28.8 3.3% 5 25.9 2.9% 6 28.8 3.3% 2.3 7.3 9.6 1.1% 33.3% 37.0% 0.5 0.6%
Other (4) 567 421.8 30 17.7 4.2% 27 13.7 3.2% 30 17.7 4.2% 0.1 4.5 4.6 1.1% 26.1% 33.6% 5.0 5.6%
Total 1,401 6,358.2$ 134 698.7$ 11.0% 78 319.7$ 5.0% 159 931.2$ 14.6% 79.0$ 250.1$ 329.1$ 5.2% 47.1% 102.9% 88.6$ 100.0%
4Q Charge-OffsPortfolio Non-Accrual Delinquency Impaired Reserves
Consolidated Credit
4Q’10 Analysis– Charge-offs No Longer Concentrated in CRE
Data as of December 31, 2010(1) Includes healthcare, lender finance, mortgage rediscount, security, time share and other ABL(2) Includes healthcare, technology, professional practice ,media and other cash flow(3) Includes land, second lien, resort/club and CRE other(4) Includes multifamily and small business
Less than 25% of 4Q’10 charge-offs were legacy commercial real estate
2011 Citi Financial Services Conference | March 10, 2011 | p. 51
Data as of December 31, 2010(1) Loans includes loans held for sale and loans held for investment(2) Includes the impact of deconsolidation of the 2006-A securitization trust which reduced 30-89 day delinquencies by
$59 million , 90+ day delinquencies by $173 million, non-accrual loans by $262 million, impaired loans by $389 million and total ending allowance by $138 million
(3) Includes the impact of deconsolidation of the 2006-A securitization trust which reduced loans by $887 million
(3)
Consolidated Credit
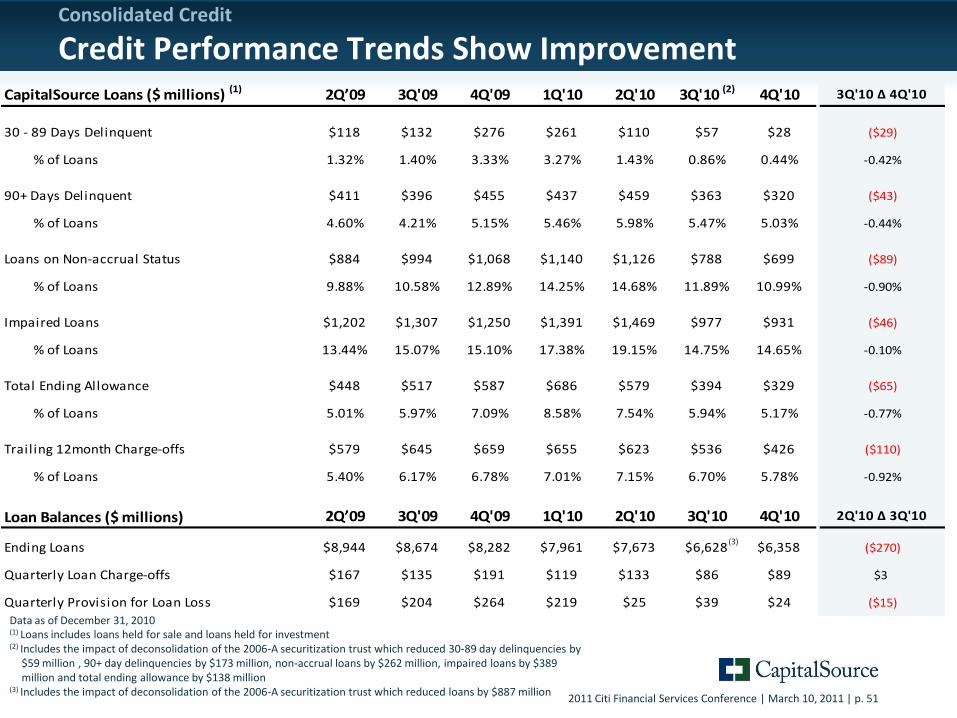
Credit Performance Trends Show ImprovementCapitalSource Loans ($ millions) (1) 2Q’09 3Q'09 4Q'09 1Q'10 2Q'10 3Q'10 (2) 4Q'10 3Q'10 ∆ 4Q'10
30 - 89 Days Delinquent $118 $132 $276 $261 $110 $57 $28 ($29)
% of Loans 1.32% 1.40% 3.33% 3.27% 1.43% 0.86% 0.44% -0.42%
90+ Days Delinquent $411 $396 $455 $437 $459 $363 $320 ($43)
% of Loans 4.60% 4.21% 5.15% 5.46% 5.98% 5.47% 5.03% -0.44%
Loans on Non-accrual Status $884 $994 $1,068 $1,140 $1,126 $788 $699 ($89)
% of Loans 9.88% 10.58% 12.89% 14.25% 14.68% 11.89% 10.99% -0.90%
Impaired Loans $1,202 $1,307 $1,250 $1,391 $1,469 $977 $931 ($46)
% of Loans 13.44% 15.07% 15.10% 17.38% 19.15% 14.75% 14.65% -0.10%
Total Ending Allowance $448 $517 $587 $686 $579 $394 $329 ($65)
% of Loans 5.01% 5.97% 7.09% 8.58% 7.54% 5.94% 5.17% -0.77%
Trailing 12month Charge-offs $579 $645 $659 $655 $623 $536 $426 ($110)
% of Loans 5.40% 6.17% 6.78% 7.01% 7.15% 6.70% 5.78% -0.92%
Loan Balances ($ millions) 2Q’09 3Q'09 4Q'09 1Q'10 2Q'10 3Q'10 4Q'10 2Q'10 ∆ 3Q'10
Ending Loans $8,944 $8,674 $8,282 $7,961 $7,673 $6,628 $6,358 ($270)
Quarterly Loan Charge-offs $167 $135 $191 $119 $133 $86 $89 $3
Quarterly Provision for Loan Loss $169 $204 $264 $219 $25 $39 $24 ($15)

2011 Citi Financial Services Conference | March 10, 2011 | p. 52
Consolidated Credit
Delinquent Loans Declined
Loans 30-89 Days Delinquent Loans 90+ Days Delinquent 15 loans - $27.8 million
51% decline from 3Q
5 loans are on non-accrual(1) and impaired ($22.4M)
$27.8M15 Loans
$56.8M13 Loans
30-59 Days
$18.6 M 12 Loans
30-59 Days
$21.0M2 Loans
60 -89 Days
$9.2 M3 Loans
60 -89 Days
$35.8M 11 Loans
3Q 2010 4Q 2010
90-179 Days$106.2M22 Loans
90-179 Days$148.9M29 Loans
180+ Days$213.5 M 56 Loans
180+ Days$213.7M53 Loans
3Q 2010 4Q 2010
$362.6M82 Loans
$319.7M78 Loans
78 loans - $319.7 million
12% decline from 3Q
73 loans are on non-accrual(1) ($270.5M)
77 loans are impaired
Data as of December 31, 2010(1) The delinquent loans for which we are still accruing interest are well secured, expected to be paid in full
and in the process of collection
2011 Citi Financial Services Conference | March 10, 2011 | p. 53
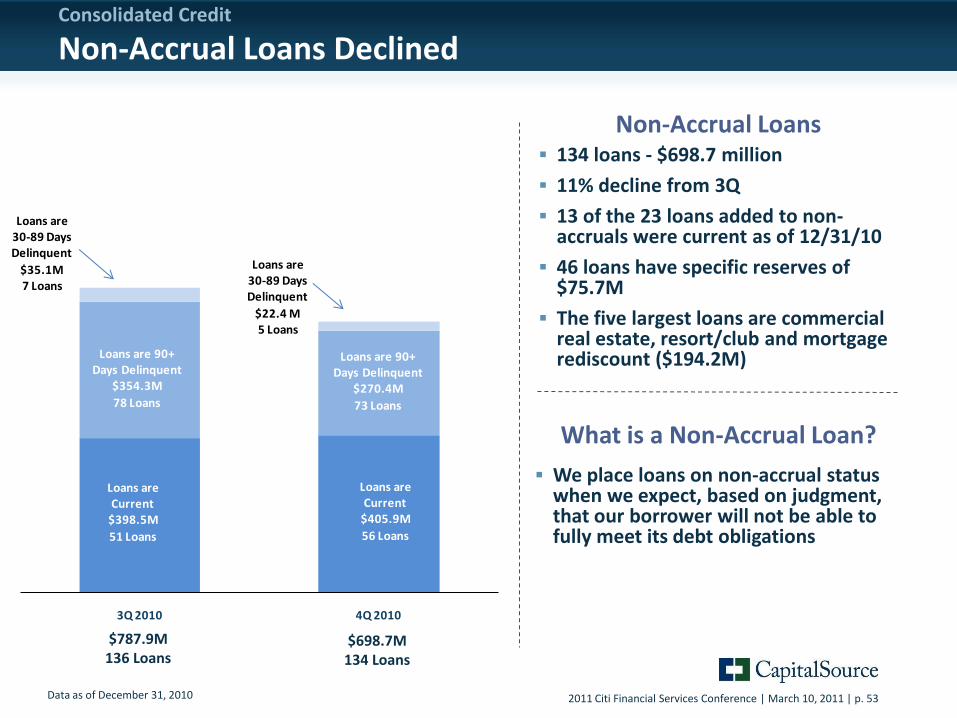
Loans are Current
$405.9M
56 Loans
Loans are Current
$398.5M
51 Loans
Loans are 90+ Days Delinquent
$270.4M
73 Loans
Loans are 90+ Days Delinquent
$354.3M
78 Loans
Loans are 30-89 Days Delinquent
$22.4 M 5 Loans
Loans are 30-89 Days Delinquent
$35.1M7 Loans
3Q 2010 4Q 2010
Consolidated Credit
Non-Accrual Loans Declined
134 loans - $698.7 million
11% decline from 3Q
13 of the 23 loans added to non-accruals were current as of 12/31/10
46 loans have specific reserves of $75.7M
The five largest loans are commercial real estate, resort/club and mortgage rediscount ($194.2M)
We place loans on non-accrual status when we expect, based on judgment, that our borrower will not be able to fully meet its debt obligations
Non-Accrual Loans
What is a Non-Accrual Loan?
Data as of December 31, 2010
$787.9M136 Loans
$698.7M134 Loans

2011 Citi Financial Services Conference | March 10, 2011 | p. 54