2011-01-01 published journal article hande yilmaz
22
Quality Function deployment (QFD) is a useful method for optimizing products which can be applied during the design process as well as in the postproduction process for further developments and revisions. This paper aims at examining the applicability of QFD and Analytic Hierarchy Process (AHP) to incorporate customer expectations and design quality into the product through a case study on a ceramic washbasin (1). In the first phase of the study customer needs and satisfaction are surveyed based on the current product design. This data is then merged with a Voice of Engineer (VOE) chart where technical attributes and features corresponding to the items in the Voice of Customer (VOC) are listed. By using the Analytic Hierarchy Process (AHP), the customer needs as well as technical attributes are quantified and prioritized. Quality characteristics are then obtained by the calculation of customer weights according to the level of importance, which were then transformed into measurable technical attributes in the House of Quality (HOQ). Interrelations among customer requirements, technical attributes and planning blocks were put in a matrix in order to get precise evaluations. The findings of this study demonstrate that the application of QFD at an earlier period in the design phase can help to efficiently implement design remediation. INTRODUCTION The ceramic production industry in Turkey has demonstrated considerable progress during the past two or three decades. In addition to the rapidly changing technology of the sector, rising customer expectations and competition among companies have created pressure to develop efficient means for product improvement and production. In order to remain competitive and meet customer expectations, optimizing design and production while containing costs is the only way a company can stabilize their market and establish itself as a brand. The role of the QFD method here gains significance by simplifying the production process and OPTIMIZATION OF PRODUCT DESIGN THROUGH QUALITY FUNCTION DEPLOYMENT AND ANALYTICAL HIERARCHY PROCESS: CASE STUDY OF A CERAMIC WASHBASIN Önder ERKARSLAN, Hande YILMAZ Received: 24.07.2009 Final Text: 19.12.2010 Keywords: Quality Function Deployment (QFD); Analytical Hierarchy Process (AHP); product optimization. 1. This paper is based on the findings of the master thesis (Yılmaz, 2009), completed in the Department of Industrial Design, Faculty of Architecture, IZTECH. The authors would like to thank to their colleagues Dr. Sabri Erdem, Jennifer Fraser and Lori Brown for their valuable criticism in the development of the paper. METU JFA 2011/1 (28:1) 1-22 DOI: 10.4305/METU.JFA.2011.1.1
-
Upload
hande-yilmaz -
Category
Documents
-
view
118 -
download
2
Transcript of 2011-01-01 published journal article hande yilmaz
OPTIMIZATION OF PRODUCT DESIGN METU JFA 2011/1 1
Quality Function deployment (QFD) is a useful method for optimizing products which can be applied during the design process as well as in the postproduction process for further developments and revisions. This paper aims at examining the applicability of QFD and Analytic Hierarchy Process (AHP) to incorporate customer expectations and design quality into the product through a case study on a ceramic washbasin (1). In the first phase of the study customer needs and satisfaction are surveyed based on the current product design. This data is then merged with a Voice of Engineer (VOE) chart where technical attributes and features corresponding to the items in the Voice of Customer (VOC) are listed. By using the Analytic Hierarchy Process (AHP), the customer needs as well as technical attributes are quantified and prioritized. Quality characteristics are then obtained by the calculation of customer weights according to the level of importance, which were then transformed into measurable technical attributes in the House of Quality (HOQ). Interrelations among customer requirements, technical attributes and planning blocks were put in a matrix in order to get precise evaluations. The findings of this study demonstrate that the application of QFD at an earlier period in the design phase can help to efficiently implement design remediation.
INTRODUCTION
The ceramic production industry in Turkey has demonstrated considerable progress during the past two or three decades. In addition to the rapidly changing technology of the sector, rising customer expectations and competition among companies have created pressure to develop efficient means for product improvement and production. In order to remain competitive and meet customer expectations, optimizing design and production while containing costs is the only way a company can stabilize their market and establish itself as a brand. The role of the QFD method here gains significance by simplifying the production process and
OPTIMIZATION OF PRODUCT DESIGN THROUGH QUALITY FUNCTION DEPLOYMENT AND ANALYTICAL HIERARCHY PROCESS: CASE STUDY OF A CERAMIC WASHBASIN
Önder ERKARSLAN, Hande YILMAZ
Received: 24.07.2009 Final Text: 19.12.2010
Keywords: Quality Function Deployment (QFD); Analytical Hierarchy Process (AHP); product optimization.
1. This paper is based on the findings of the master thesis (Yılmaz, 2009), completed in the Department of Industrial Design, Faculty of Architecture, IZTECH. The authors would like to thank to their colleagues Dr. Sabri Erdem, Jennifer Fraser and Lori Brown for their valuable criticism in the development of the paper.
METU JFA 2011/1(28:1) 1-22
DOI: 10.4305/METU.JFA.2011.1.1
ÖNDER ERKARSLAN ve HANDE YILMAZ 2 METU JFA 2011/1
increasing sales while optimizing the product design to satisfy customer demands. Improved design measures for the ceramic product we have selected not only include aesthetical properties such as shape, color and material but also the ergonomic, anthropometric, anti-bacterial and hygienic properties as determined by the QFD application.
QFD APPLICATIONS IN PRODUCT OPTIMIZATION LITERATURE REVIEW
QFD was originally developed and implemented in Japan at the Kobe Shipyards of Mitsubishi Heavy Industries in 1972. It was observed that Toyota was able to reduce start up pre-production costs by 60% from 1977 to 1984 and to decrease the time required for its development by one-third through the use of QFD (Hauser and Clausing, 1988; Ertay, 1998; Hsiao, 2002). Early users of QFD include Toyota, Ford Motor Company, Procter, 3M Corporation, Gamble, AT&T, Hewlett Packard, Digital Equipment Corporation, etc. (Cohen, 1995). The American Supplier Institute (ASI) in Dearborn, Michigan and GOAL/QPC (Growth Opportunity Alliance of Lawrence/Quality Productivity Center) in Methuen, Massachusetts, have been the primary organizations offering an overview and workshop-type training since QFD was introduced to the United States in the early 1980s (Prasad, 1998). QFD was originally proposed as a process for collecting and analyzing the voice of customer (VOC), to develop higher quality products that meet or surpass customer’s needs. Thus, the primary functions of QFD are product development, quality management, and customer need analysis. Later QFD use had been extended to fields such as design, planning, decision-making, engineering, management, teamwork, timing and costing (Chan and Wu, 2002). QFD is a useful tool for developing new product standards, and its benefits are well documented (Clausing and Cohen, 1994; Cohen, 1995; Hauser and Clausing, 1988; King, 1989).
Various definitions of QFD have been given, such as “an overall concept that provides a means of translating customer requirements into the appropriate technical requirements at each stage of product development and production (i.e. marketing, planning, product design, engineering prototype evaluation, production process development, and production sales)” (Sullivan, 1986) or “QFD is a customer-driven design process and its use is essential in product design” (Cohen, 1995; Akao, 1990).
There are numerous publications on QFD in the literature (Kim, 1997, Mrad, 1997, Persson et al, 2000, Gerling et al., 2002, Han et al., 2004, Yoram and Eyal, 2005, Chan and Wu, 2005, Bhattacharya et al., 2005, Dweiri and Kablan, 2005, Poel, 2007, Lai et al., 2007). Various applications within the literature can be grouped into three categories: QFD implementations before the design stage, QFD implementations during the design stage, and QFD implementations after the design stage (Dikmen et al, 2005). In dealing with customer requirements, Saaty (1980) recommended that designers apply analytic hierarchy process (AHP) to determine the value weightings of customer requirements. Kalargeros and Gao (1998) further proposed a fuzzy analytic hierarchy process (FAHP) to evaluate the importance weightings of customer attributes. Fung et al. (1998) combined the concepts of AHP and fuzzy logic to determine target values for product characteristics. Moreover, Dawson and Askin (1999) introduced a nonlinear mathematical program for determining optimal engineering characteristics under the concern of costs and life-cycle time constraints. Finally, Vanegas and Labib (2001) developed a fuzzy quality function deployment model
OPTIMIZATION OF PRODUCT DESIGN METU JFA 2011/1 3
to determine the target values of design characteristics (Lin et al., 2008). Analytic Hierarchy Process (AHP) method, with or without fuzzy logic, helps to define the degree of importance of the demanded quality (Myint, 2003) and also the correlations between the data in the matrixes (Partovi, 2001, 2006).
The AHP, developed by Saaty (1980), has been studied extensively and used in almost all the applications related with multiple criteria decision making (MCDM) in the last 20 years. Steuer and Na (2003) revealed that there were approximately 18 articles studying the AHP combined with finance alone, whereas Vaidya and Kumar (2006) found that there were 150 articles investigating the AHP combined with general applications. Besides applying to the finance sector (Steuer and Na, 2003), the AHP was adopted in education, engineering, government, industry, management, manufacturing, personal, political, social, and sports (Vaidya and Kumar, 2006). The wide applicability is due to its simplicity, ease of use, and great flexibility. It can be integrated with other techniques, for instance, mathematical programming in order to consider not only both qualitative and quantitative factors, but also some real-world resource limitations. This approach, regarded as the integrated AHP, can definitely make a more realistic and promising decision than the stand-alone AHP, but also aids the researchers and decision makers in applying the integrated AHPs effectively (Ho, 2008).
THE PRODUCT: VITRA “POTSINK”
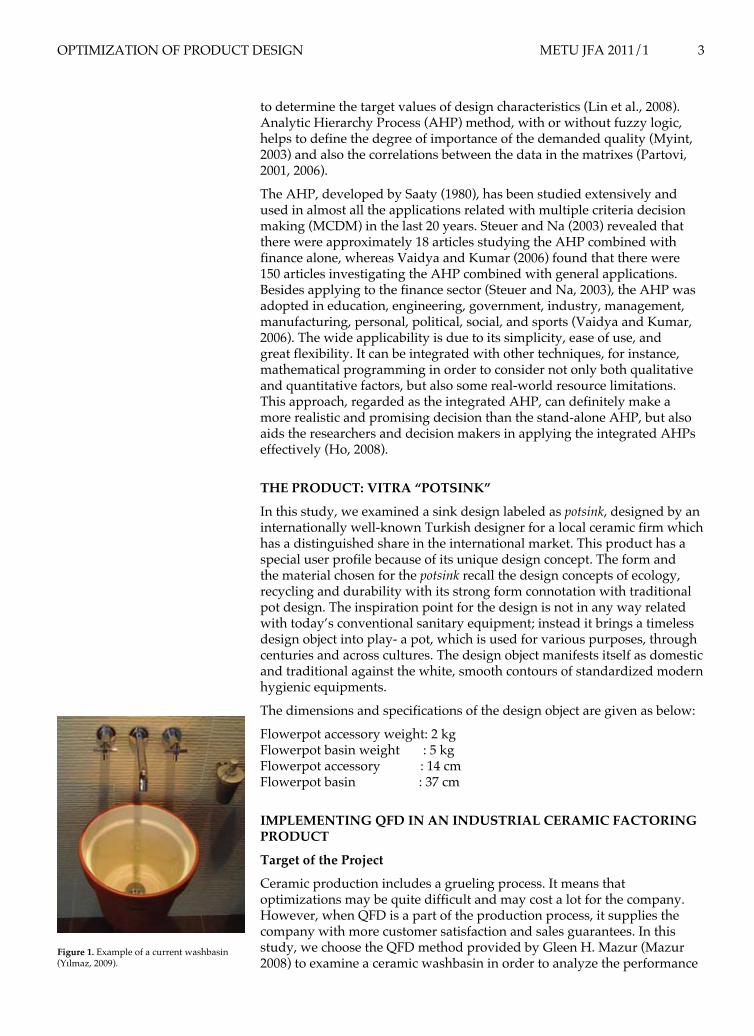
In this study, we examined a sink design labeled as potsink, designed by an internationally well-known Turkish designer for a local ceramic firm which has a distinguished share in the international market. This product has a special user profile because of its unique design concept. The form and the material chosen for the potsink recall the design concepts of ecology, recycling and durability with its strong form connotation with traditional pot design. The inspiration point for the design is not in any way related with today’s conventional sanitary equipment; instead it brings a timeless design object into play- a pot, which is used for various purposes, through centuries and across cultures. The design object manifests itself as domestic and traditional against the white, smooth contours of standardized modern hygienic equipments.
The dimensions and specifications of the design object are given as below:
Flowerpot accessory weight: 2 kgFlowerpot basin weight : 5 kg Flowerpot accessory : 14 cm Flowerpot basin : 37 cm
IMPLEMENTING QFD IN AN INDUSTRIAL CERAMIC FACTORING PRODUCT
Target of the Project
Ceramic production includes a grueling process. It means that optimizations may be quite difficult and may cost a lot for the company. However, when QFD is a part of the production process, it supplies the company with more customer satisfaction and sales guarantees. In this study, we choose the QFD method provided by Gleen H. Mazur (Mazur 2008) to examine a ceramic washbasin in order to analyze the performance
Figure 1. Example of a current washbasin (Yılmaz, 2009).
ÖNDER ERKARSLAN ve HANDE YILMAZ 4 METU JFA 2011/1
of QFD. By this we aim at proving the success of the method and how it works in the ceramic industry. We also intend to offer some solutions for optimizations.
Gemba: The Source of Customer Data
The Gemba is where the product or services becomes of value to the customer, that is, where the product actually gets used (Mazur, 1996). In Gemba, we determined who our customer actually is and what their problems and needs are regarding the product. Gemba is a Japanese term meaning “the place where the truth can be found”.Others may call it “the value proposition”.
Determining Key Customers
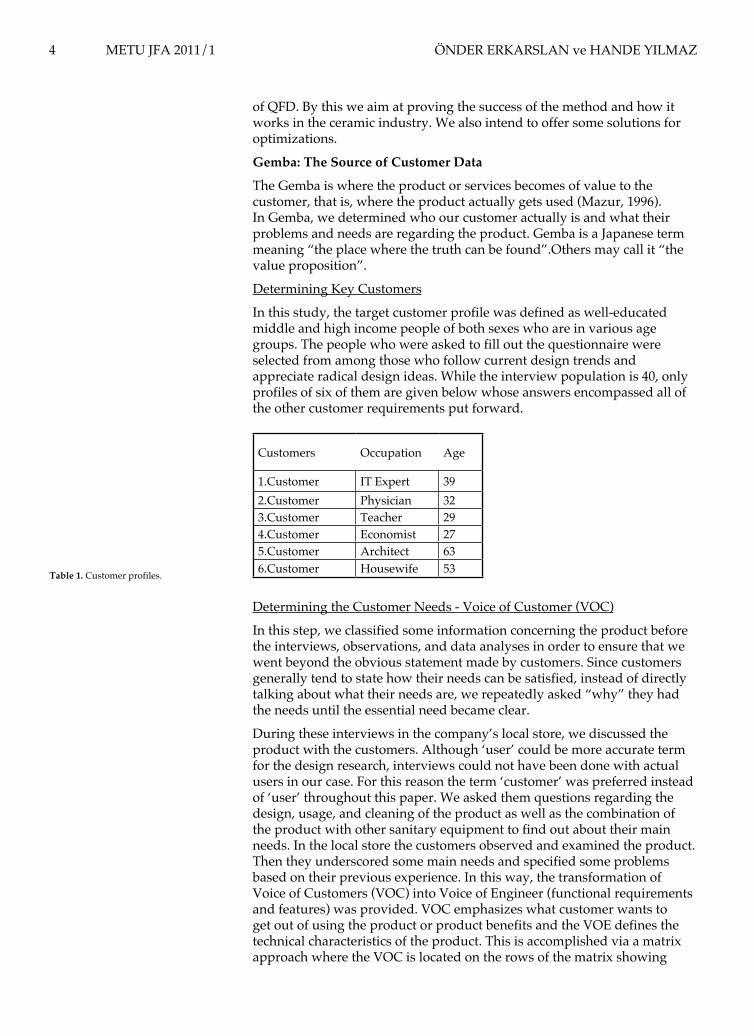
In this study, the target customer profile was defined as well-educated middle and high income people of both sexes who are in various age groups. The people who were asked to fill out the questionnaire were selected from among those who follow current design trends and appreciate radical design ideas. While the interview population is 40, only profiles of six of them are given below whose answers encompassed all of the other customer requirements put forward.
Customers Occupation Age
1.Customer IT Expert 392.Customer Physician 323.Customer Teacher 294.Customer Economist 275.Customer Architect 636.Customer Housewife 53
Determining the Customer Needs - Voice of Customer (VOC)
In this step, we classified some information concerning the product before the interviews, observations, and data analyses in order to ensure that we went beyond the obvious statement made by customers. Since customers generally tend to state how their needs can be satisfied, instead of directly talking about what their needs are, we repeatedly asked “why” they had the needs until the essential need became clear.
During these interviews in the company’s local store, we discussed the product with the customers. Although ‘user’ could be more accurate term for the design research, interviews could not have been done with actual users in our case. For this reason the term ‘customer’ was preferred instead of ‘user’ throughout this paper. We asked them questions regarding the design, usage, and cleaning of the product as well as the combination of the product with other sanitary equipment to find out about their main needs. In the local store the customers observed and examined the product. Then they underscored some main needs and specified some problems based on their previous experience. In this way, the transformation of Voice of Customers (VOC) into Voice of Engineer (functional requirements and features) was provided. VOC emphasizes what customer wants to get out of using the product or product benefits and the VOE defines the technical characteristics of the product. This is accomplished via a matrix approach where the VOC is located on the rows of the matrix showing
Table 1. Customer profiles.
OPTIMIZATION OF PRODUCT DESIGN METU JFA 2011/1 5
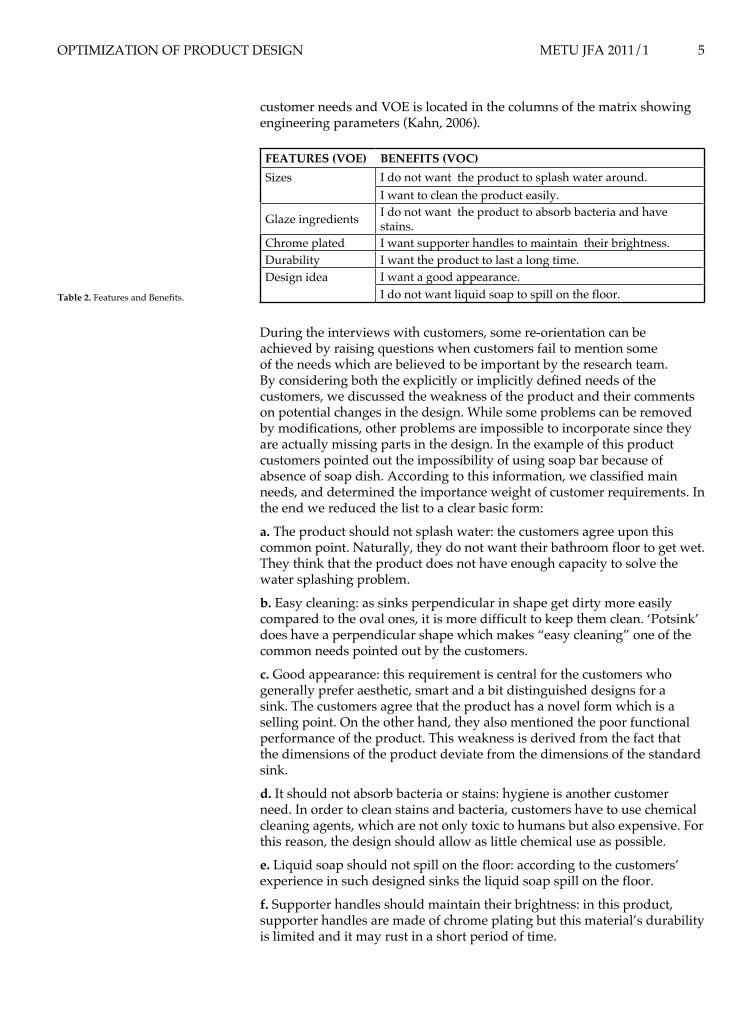
customer needs and VOE is located in the columns of the matrix showing engineering parameters (Kahn, 2006).
FEATURES (VOE) BENEFITS (VOC)Sizes I do not want the product to splash water around. I want to clean the product easily.
Glaze ingredients I do not want the product to absorb bacteria and have stains.
Chrome plated I want supporter handles to maintain their brightness.Durability I want the product to last a long time.Design idea I want a good appearance. I do not want liquid soap to spill on the floor.
During the interviews with customers, some re-orientation can be achieved by raising questions when customers fail to mention some of the needs which are believed to be important by the research team. By considering both the explicitly or implicitly defined needs of the customers, we discussed the weakness of the product and their comments on potential changes in the design. While some problems can be removed by modifications, other problems are impossible to incorporate since they are actually missing parts in the design. In the example of this product customers pointed out the impossibility of using soap bar because of absence of soap dish. According to this information, we classified main needs, and determined the importance weight of customer requirements. In the end we reduced the list to a clear basic form:
a. The product should not splash water: the customers agree upon this common point. Naturally, they do not want their bathroom floor to get wet. They think that the product does not have enough capacity to solve the water splashing problem.
b. Easy cleaning: as sinks perpendicular in shape get dirty more easily compared to the oval ones, it is more difficult to keep them clean. ‘Potsink’ does have a perpendicular shape which makes “easy cleaning” one of the common needs pointed out by the customers.
c. Good appearance: this requirement is central for the customers who generally prefer aesthetic, smart and a bit distinguished designs for a sink. The customers agree that the product has a novel form which is a selling point. On the other hand, they also mentioned the poor functional performance of the product. This weakness is derived from the fact that the dimensions of the product deviate from the dimensions of the standard sink.
d. It should not absorb bacteria or stains: hygiene is another customer need. In order to clean stains and bacteria, customers have to use chemical cleaning agents, which are not only toxic to humans but also expensive. For this reason, the design should allow as little chemical use as possible.
e. Liquid soap should not spill on the floor: according to the customers’ experience in such designed sinks the liquid soap spill on the floor.
f. Supporter handles should maintain their brightness: in this product, supporter handles are made of chrome plating but this material’s durability is limited and it may rust in a short period of time.
Table 2. Features and Benefits.
ÖNDER ERKARSLAN ve HANDE YILMAZ 6 METU JFA 2011/1
g. Long term using: durability in a sink is another customer need. Customers mostly prefer long term use for financial reasons. It is also not practical to replace a sink as it is a building material.
Priority Needs - Analytic Hierarchy Process (AHP)
The customer needs, by using the AHP is going to be quantified, and then prioritized by actual customers so we know which needs are important. For this purpose, we followed five steps.
Criteria
AHP can be structured according to the complexity of the problem. In our case, we have identified two phases in order to reach our goal. In the first one, the numbers of results that affect the decision nodes are established. In the second phase, the sub-criteria that also influence the main criteria are established. In order to make valid pair-wise comparisons, the main set of criteria are symbolized with ‘m’, whereas the sub criteria are symbolized with ‘n’ throughout this study.
Comparison Matrix
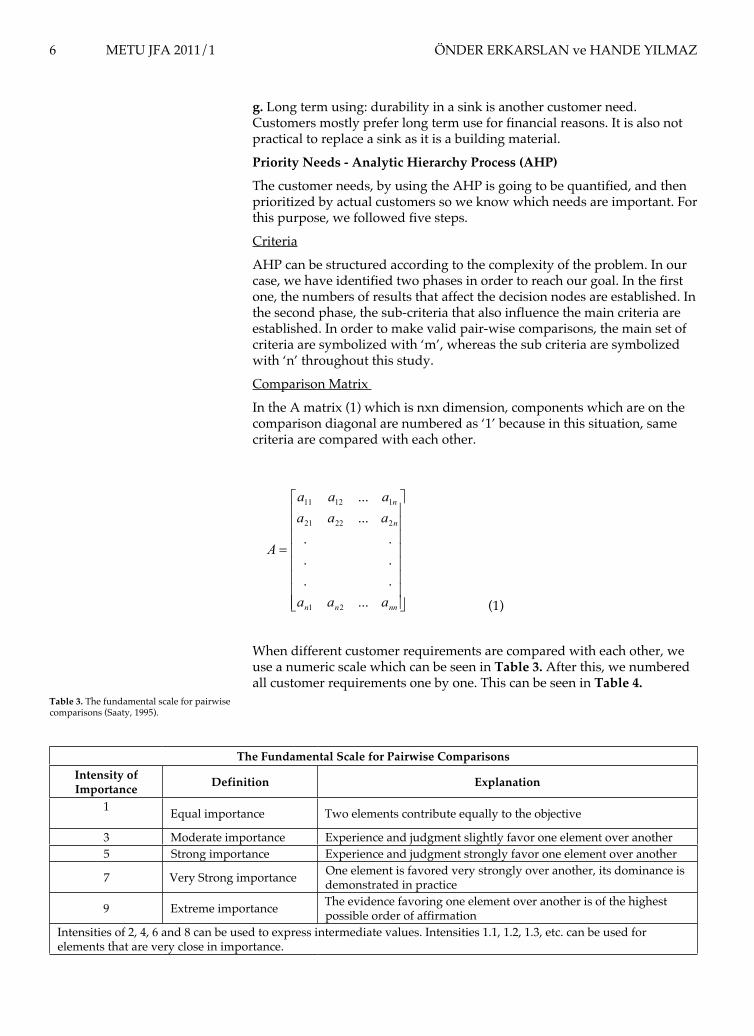
In the A matrix (1) which is nxn dimension, components which are on the comparison diagonal are numbered as ‘1’ because in this situation, same criteria are compared with each other.
When different customer requirements are compared with each other, we use a numeric scale which can be seen in Table 3. After this, we numbered all customer requirements one by one. This can be seen in Table 4.
5
d. It should not absorb bacteria or stains: hygiene is another customer need. In order to clean stains and bacteria, customers have to use chemical cleaning agents, which are not only toxic to humans but also expensive. For this reason, the design should allow as little chemical use as possible. e. Liquid soap should not spill on the floor: according to the customers’ experience in such designed sinks the liquid soap spill on the floor. f. Supporter handles should maintain their brightness: in this product, supporter handles are made of chrome plating but this material’s durability is limited and it may rust in a short period of time. g. Long term using: durability in a sink is another customer need. Customers mostly prefer long term use for financial reasons. It is also not practical to replace a sink as it is a building material.
Priority Needs - Analytic Hierarchy Process (AHP)
The customer needs, by using the AHP is going to be quantified, and then prioritized by actual customers so we know which needs are important. For this purpose, we followed five steps.
CriteriaAHP can be structured according to the complexity of the problem. In our case, we have identified two phases in order to reach our goal. In the first one, the numbers of results that affect the decision nodes are established. In the second phase, the sub-criteria that also influence the main criteria are established. In order to make valid pair-wise comparisons, the main set of criteria are symbolized with ‘m’, whereas the sub criteria are symbolized with ‘n’ throughout this study.
Comparison Matrix In the A matrix (1) which is nxn dimension, components which are on the comparison diagonal are numbered as ‘1’ because in this situation, same criteria are compared with each other.
⎥⎥⎥⎥⎥⎥⎥⎥
⎦
⎤
⎢⎢⎢⎢⎢⎢⎢⎢
⎣
⎡
=
nnnn
n
n
aaa
aaaaaa
A
.........
...
...
21
22221
11211
(1)
When different customer requirements are compared with each other, we use a numeric scale which can be seen in Table 3. After this, we numbered all customer requirements one by one. This can be seen in Table 4.
The Fundamental Scale for Pairwise Comparisons Intensity of Importance Definition Explanation
1 Equal importance Two elements contribute equally to the objective
3 Moderate importance Experience and judgment slightly favor one element over another
5 Strong importance Experience and judgment strongly favor one element over another
7 Very Strong importance One element is favored very strongly over another, its dominance is demonstrated in practice
9 Extreme importance The evidence favoring one element over another is of the highest possible order of affirmation
Intensities of 2, 4, 6 and 8 can be used to express intermediate values. Intensities 1.1, 1.2, 1.3, etc. can be used for elements that are very close in importance.
The Fundamental Scale for Pairwise ComparisonsIntensity of Importance Definition Explanation
1 Equal importance Two elements contribute equally to the objective
3 Moderate importance Experience and judgment slightly favor one element over another5 Strong importance Experience and judgment strongly favor one element over another
7 Very Strong importance One element is favored very strongly over another, its dominance is demonstrated in practice
9 Extreme importance The evidence favoring one element over another is of the highest possible order of affirmation
Intensities of 2, 4, 6 and 8 can be used to express intermediate values. Intensities 1.1, 1.2, 1.3, etc. can be used for elements that are very close in importance.
Table 3. The fundamental scale for pairwise comparisons (Saaty, 1995).
(1)
OPTIMIZATION OF PRODUCT DESIGN METU JFA 2011/1 7
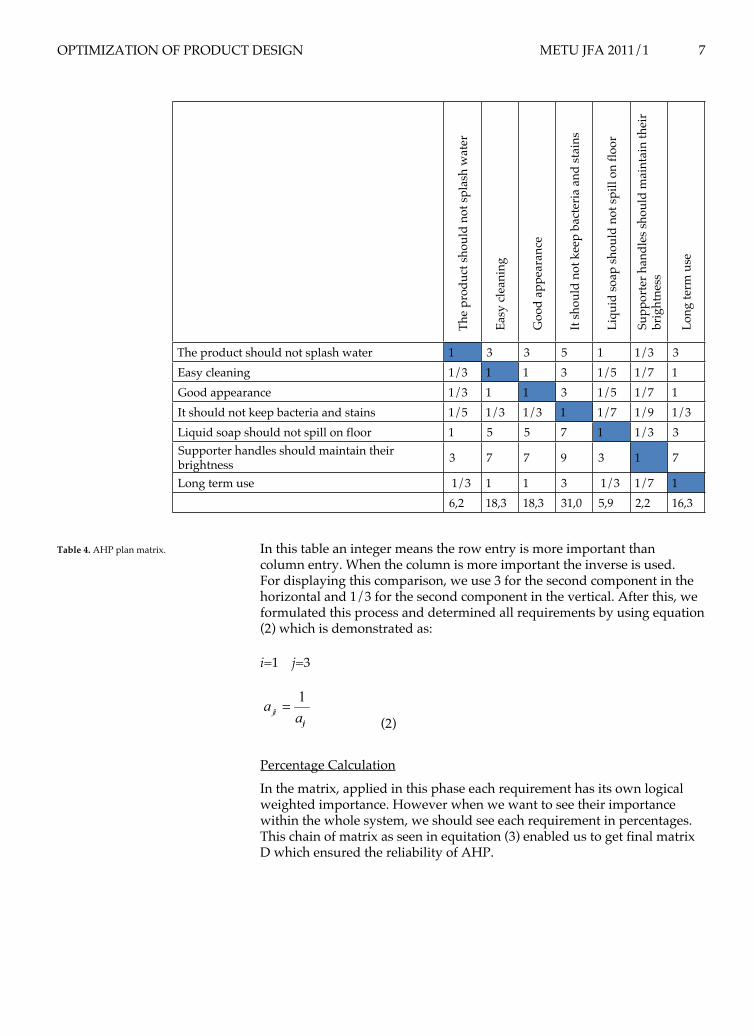
In this table an integer means the row entry is more important than column entry. When the column is more important the inverse is used. For displaying this comparison, we use 3 for the second component in the horizontal and 1/3 for the second component in the vertical. After this, we formulated this process and determined all requirements by using equation (2) which is demonstrated as:
i=1 j=3
Percentage Calculation
In the matrix, applied in this phase each requirement has its own logical weighted importance. However when we want to see their importance within the whole system, we should see each requirement in percentages. This chain of matrix as seen in equitation (3) enabled us to get final matrix D which ensured the reliability of AHP.
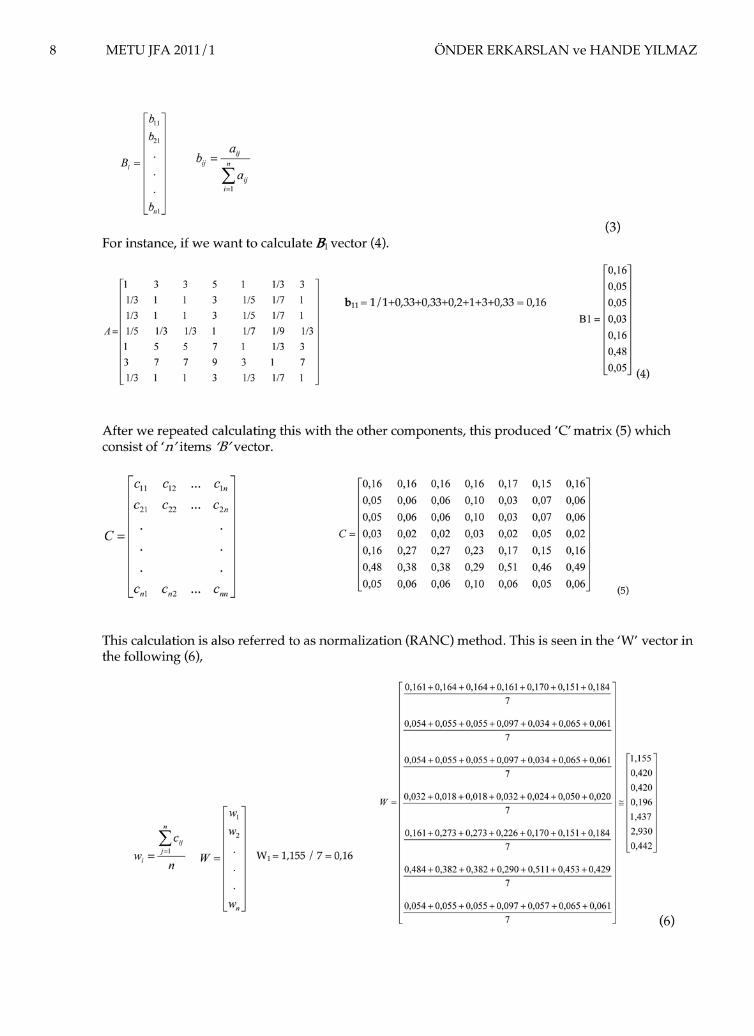
The
prod
uct s
houl
d no
t spl
ash
wat
er
Easy
clea
ning
Goo
d ap
pear
ance
It sh
ould
not
kee
p ba
cter
ia a
nd st
ains
Liqu
id so
ap sh
ould
not
spill
on
floor
Supp
orte
r han
dles
shou
ld m
aint
ain
thei
r br
ight
ness
Long
term
use
The product should not splash water 1 3 3 5 1 1/3 3 Easy cleaning 1/3 1 1 3 1/5 1/7 1 Good appearance 1/3 1 1 3 1/5 1/7 1 It should not keep bacteria and stains 1/5 1/3 1/3 1 1/7 1/9 1/3Liquid soap should not spill on floor 1 5 5 7 1 1/3 3 Supporter handles should maintain their brightness 3 7 7 9 3 1 7
Long term use 1/3 1 1 3 1/3 1/7 1 6,2 18,3 18,3 31,0 5,9 2,2 16,3
Table 4. AHP plan matrix.
ijji a
a 1=
(2)
ÖNDER ERKARSLAN ve HANDE YILMAZ 8 METU JFA 2011/1
OPTIMIZATION OF PRODUCT DESIGN METU JFA 2011/1 9
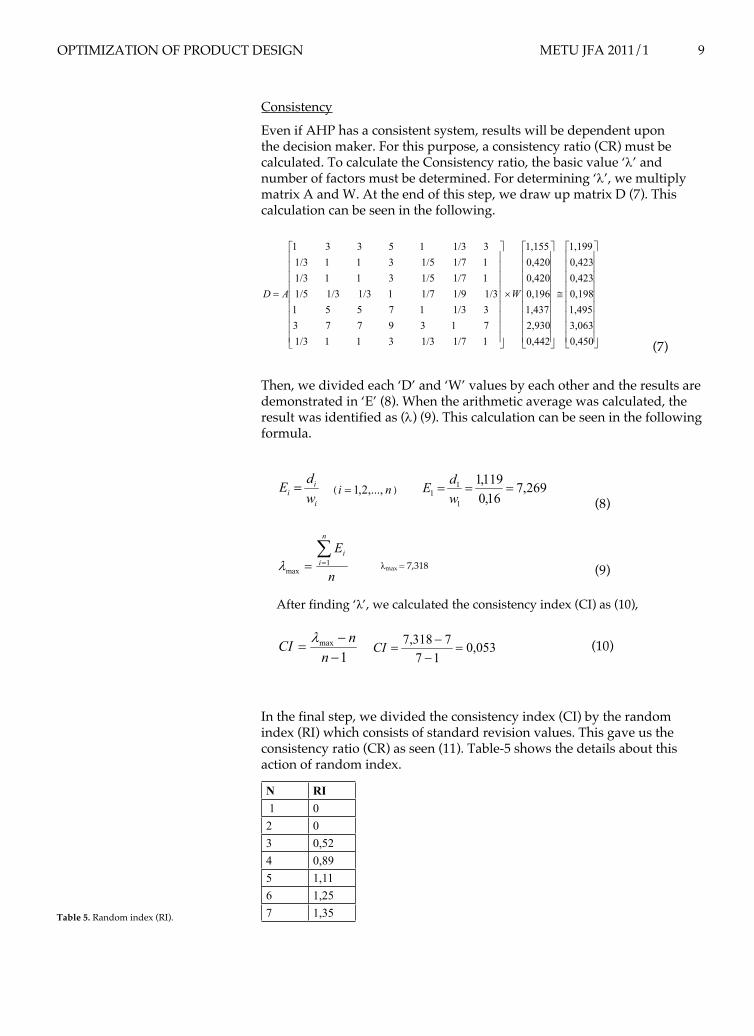
Consistency
Even if AHP has a consistent system, results will be dependent upon the decision maker. For this purpose, a consistency ratio (CR) must be calculated. To calculate the Consistency ratio, the basic value ‘λ’ and number of factors must be determined. For determining ‘λ’, we multiply matrix A and W. At the end of this step, we draw up matrix D (7). This calculation can be seen in the following.
(7)
Then, we divided each ‘D’ and ‘W’ values by each other and the results are demonstrated in ‘E’ (8). When the arithmetic average was calculated, the result was identified as (λ) (9). This calculation can be seen in the following formula.
(8)
(9)
(10)
In the final step, we divided the consistency index (CI) by the random index (RI) which consists of standard revision values. This gave us the consistency ratio (CR) as seen (11). Table-5 shows the details about this action of random index.
N RI 1 02 03 0,524 0,895 1,116 1,257 1,35
≅
×
=
0,4503,0631,4950,1980,4230,4231,199
0,4422,9301,4370,1960,4200,4201,155
11/7 1/3 3 1 11/3 7 1 3 9 7 7 3 31/3 1 7 5 5 1
1/3 1/9 1/7 11/3 1/3 1/5 11/7 1/5 3 1 11/3 11/7 1/5 3 1 11/3 31/3 1 5 3 3 1
WAD
8
Even if AHP has a consistent system, results will be dependent upon the decision maker. For this purpose, a consistency ratio (CR) must be calculated. To calculate the Consistency ratio, the basic value ‘λ’ and number of factors must be determined. For determining ‘λ’, we multiply matrix A and W. At the end of this step, we draw up matrix D (7). This calculation can be seen in the following.
⎥⎥⎥⎥⎥⎥⎥⎥⎥
⎦
⎤
⎢⎢⎢⎢⎢⎢⎢⎢⎢
⎣
⎡
≅
⎥⎥⎥⎥⎥⎥⎥⎥⎥
⎦
⎤
⎢⎢⎢⎢⎢⎢⎢⎢⎢
⎣
⎡
×
⎥⎥⎥⎥⎥⎥⎥⎥⎥
⎦
⎤
⎢⎢⎢⎢⎢⎢⎢⎢⎢
⎣
⎡
=
0,4503,0631,4950,1980,4230,4231,199
0,4422,9301,4370,1960,4200,4201,155
11/7 1/3 3 1 11/3 7 1 3 9 7 7 3 31/3 1 7 5 5 1
1/3 1/9 1/7 11/3 1/3 1/5 11/7 1/5 3 1 11/3 11/7 1/5 3 1 11/3 31/3 1 5 3 3 1
WAD (7)
Then, we divided each ‘D’ and ‘W’ values by each other and the results are demonstrated in ‘E’ (8). When the arithmetic average was calculated, the result was identified as (λ) (9). This calculation can be seen in the following formula.
i
ii w
dE = ( ni ,...,2,1= ) 269,716,0
119,1
1
11 ===
wdE
(8)
λmax = 7,318 (9)
After finding ‘λ’, we calculated the consistency index (CI) as (10),
1max
−−
=n
nCI λ
053,0
177318,7=
−−
=CI (10)
In the final step, we divided the consistency index (CI) by the random index (RI) which consists of standard revision values. This gave us the consistency ratio (CR) as seen (11). Table-5 shows the details about this action of random index. N RI
1 0
2 0
3 0,52
4 0,89
5 1,11
6 1,25
7 1,35
Table 5. Random index (RI).
RICICR =
039,0
35,1053,0
==CR (11)
n
En
ii∑
== 1maxλ
Table 5. Random index (RI).
8
Even if AHP has a consistent system, results will be dependent upon the decision maker. For this purpose, a consistency ratio (CR) must be calculated. To calculate the Consistency ratio, the basic value ‘λ’ and number of factors must be determined. For determining ‘λ’, we multiply matrix A and W. At the end of this step, we draw up matrix D (7). This calculation can be seen in the following.
⎥⎥⎥⎥⎥⎥⎥⎥⎥
⎦
⎤
⎢⎢⎢⎢⎢⎢⎢⎢⎢
⎣
⎡
≅
⎥⎥⎥⎥⎥⎥⎥⎥⎥
⎦
⎤
⎢⎢⎢⎢⎢⎢⎢⎢⎢
⎣
⎡
×
⎥⎥⎥⎥⎥⎥⎥⎥⎥
⎦
⎤
⎢⎢⎢⎢⎢⎢⎢⎢⎢
⎣
⎡
=
0,4503,0631,4950,1980,4230,4231,199
0,4422,9301,4370,1960,4200,4201,155
11/7 1/3 3 1 11/3 7 1 3 9 7 7 3 31/3 1 7 5 5 1
1/3 1/9 1/7 11/3 1/3 1/5 11/7 1/5 3 1 11/3 11/7 1/5 3 1 11/3 31/3 1 5 3 3 1
WAD (7)
Then, we divided each ‘D’ and ‘W’ values by each other and the results are demonstrated in ‘E’ (8). When the arithmetic average was calculated, the result was identified as (λ) (9). This calculation can be seen in the following formula.
i
ii w
dE = ( ni ,...,2,1= ) 269,716,0
119,1
1
11 ===
wdE
(8)
λmax = 7,318 (9)
After finding ‘λ’, we calculated the consistency index (CI) as (10),
1max
−−
=n
nCI λ
053,0
177318,7=
−−
=CI (10)
In the final step, we divided the consistency index (CI) by the random index (RI) which consists of standard revision values. This gave us the consistency ratio (CR) as seen (11). Table-5 shows the details about this action of random index. N RI
1 0
2 0
3 0,52
4 0,89
5 1,11
6 1,25
7 1,35
Table 5. Random index (RI).
RICICR =
039,0
35,1053,0
==CR (11)
n
En
ii∑
== 1maxλ
ÖNDER ERKARSLAN ve HANDE YILMAZ 10 METU JFA 2011/1
As a result of these calculations, if CR value is under 0.10, the AHP analysis is consistent. If this number is more than 0.10, it shows that there might be a calculation mistake or an inconsistency by the decision maker. In this situation, the whole process must be repeated.
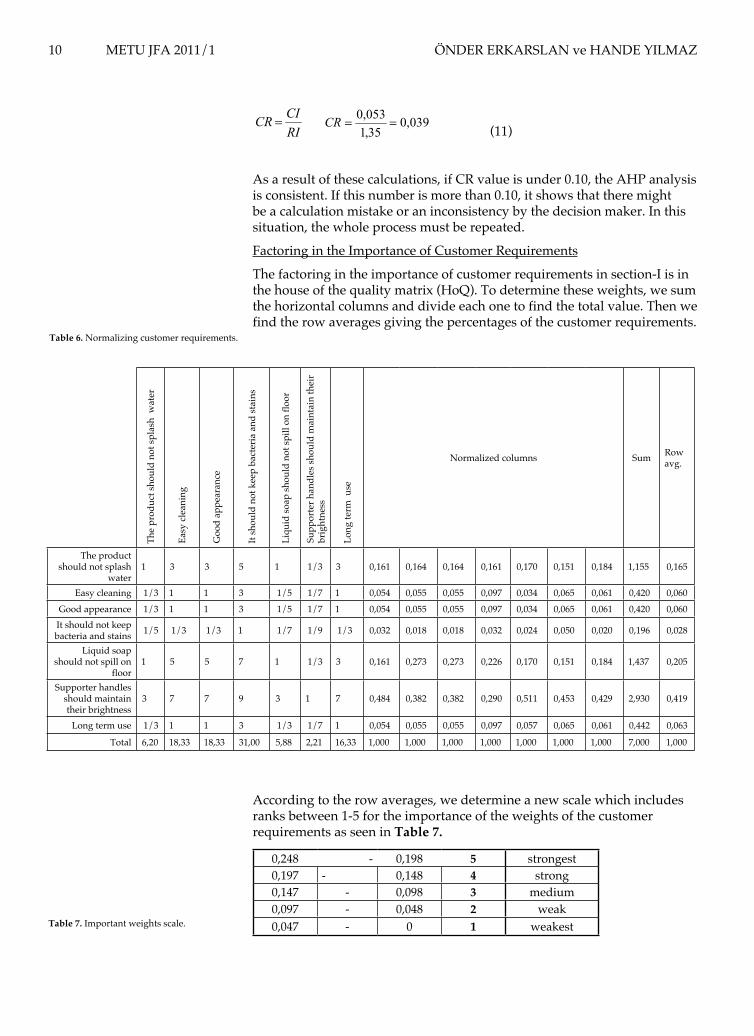
Factoring in the Importance of Customer Requirements
The factoring in the importance of customer requirements in section-I is in the house of the quality matrix (HoQ). To determine these weights, we sum the horizontal columns and divide each one to find the total value. Then we find the row averages giving the percentages of the customer requirements.
According to the row averages, we determine a new scale which includes ranks between 1-5 for the importance of the weights of the customer requirements as seen in Table 7.
0,248 - 0,198 5 strongest0,197 - 0,148 4 strong0,147 - 0,098 3 medium0,097 - 0,048 2 weak0,047 - 0 1 weakest
8
Even if AHP has a consistent system, results will be dependent upon the decision maker. For this purpose, a consistency ratio (CR) must be calculated. To calculate the Consistency ratio, the basic value ‘λ’ and number of factors must be determined. For determining ‘λ’, we multiply matrix A and W. At the end of this step, we draw up matrix D (7). This calculation can be seen in the following.
⎥⎥⎥⎥⎥⎥⎥⎥⎥
⎦
⎤
⎢⎢⎢⎢⎢⎢⎢⎢⎢
⎣
⎡
≅
⎥⎥⎥⎥⎥⎥⎥⎥⎥
⎦
⎤
⎢⎢⎢⎢⎢⎢⎢⎢⎢
⎣
⎡
×
⎥⎥⎥⎥⎥⎥⎥⎥⎥
⎦
⎤
⎢⎢⎢⎢⎢⎢⎢⎢⎢
⎣
⎡
=
0,4503,0631,4950,1980,4230,4231,199
0,4422,9301,4370,1960,4200,4201,155
11/7 1/3 3 1 11/3 7 1 3 9 7 7 3 31/3 1 7 5 5 1
1/3 1/9 1/7 11/3 1/3 1/5 11/7 1/5 3 1 11/3 11/7 1/5 3 1 11/3 31/3 1 5 3 3 1
WAD (7)
Then, we divided each ‘D’ and ‘W’ values by each other and the results are demonstrated in ‘E’ (8). When the arithmetic average was calculated, the result was identified as (λ) (9). This calculation can be seen in the following formula.
i
ii w
dE = ( ni ,...,2,1= ) 269,716,0
119,1
1
11 ===
wdE
(8)
λmax = 7,318 (9)
After finding ‘λ’, we calculated the consistency index (CI) as (10),
1max
−−
=n
nCI λ
053,0
177318,7=
−−
=CI (10)
In the final step, we divided the consistency index (CI) by the random index (RI) which consists of standard revision values. This gave us the consistency ratio (CR) as seen (11). Table-5 shows the details about this action of random index. N RI
1 0
2 0
3 0,52
4 0,89
5 1,11
6 1,25
7 1,35
Table 5. Random index (RI).
RICICR =
039,0
35,1053,0
==CR (11)
n
En
ii∑
== 1maxλ
(11)Th
e pr
oduc
t sho
uld
not s
plas
h w
ater
Easy
clea
ning
Goo
d ap
pear
ance
It sh
ould
not
kee
p ba
cter
ia a
nd st
ains
Liqu
id so
ap sh
ould
not
spill
on
floor
Supp
orte
r han
dles
shou
ld m
aint
ain
thei
r br
ight
ness
Long
term
use
Normalized columns Sum Row avg.
The product should not splash
water1 3 3 5 1 1/3 3 0,161 0,164 0,164 0,161 0,170 0,151 0,184 1,155 0,165
Easy cleaning 1/3 1 1 3 1/5 1/7 1 0,054 0,055 0,055 0,097 0,034 0,065 0,061 0,420 0,060
Good appearance 1/3 1 1 3 1/5 1/7 1 0,054 0,055 0,055 0,097 0,034 0,065 0,061 0,420 0,060It should not keep bacteria and stains 1/5 1/3 1/3 1 1/7 1/9 1/3 0,032 0,018 0,018 0,032 0,024 0,050 0,020 0,196 0,028
Liquid soap should not spill on
floor1 5 5 7 1 1/3 3 0,161 0,273 0,273 0,226 0,170 0,151 0,184 1,437 0,205
Supporter handles should maintain their brightness
3 7 7 9 3 1 7 0,484 0,382 0,382 0,290 0,511 0,453 0,429 2,930 0,419
Long term use 1/3 1 1 3 1/3 1/7 1 0,054 0,055 0,055 0,097 0,057 0,065 0,061 0,442 0,063
Total 6,20 18,33 18,33 31,00 5,88 2,21 16,33 1,000 1,000 1,000 1,000 1,000 1,000 1,000 7,000 1,000
Table 6. Normalizing customer requirements.
Table 7. Important weights scale.
OPTIMIZATION OF PRODUCT DESIGN METU JFA 2011/1 11
Afterwards their ranks are given to the customer requirements as seen in Table 8.
The product should not splash water 2Easy cleaning 1Good appearance 1It should not keep bacteria and stains 1Liquid soap should not spill on floor 3Supporter handles should maintain their brightness 5Long term use 1
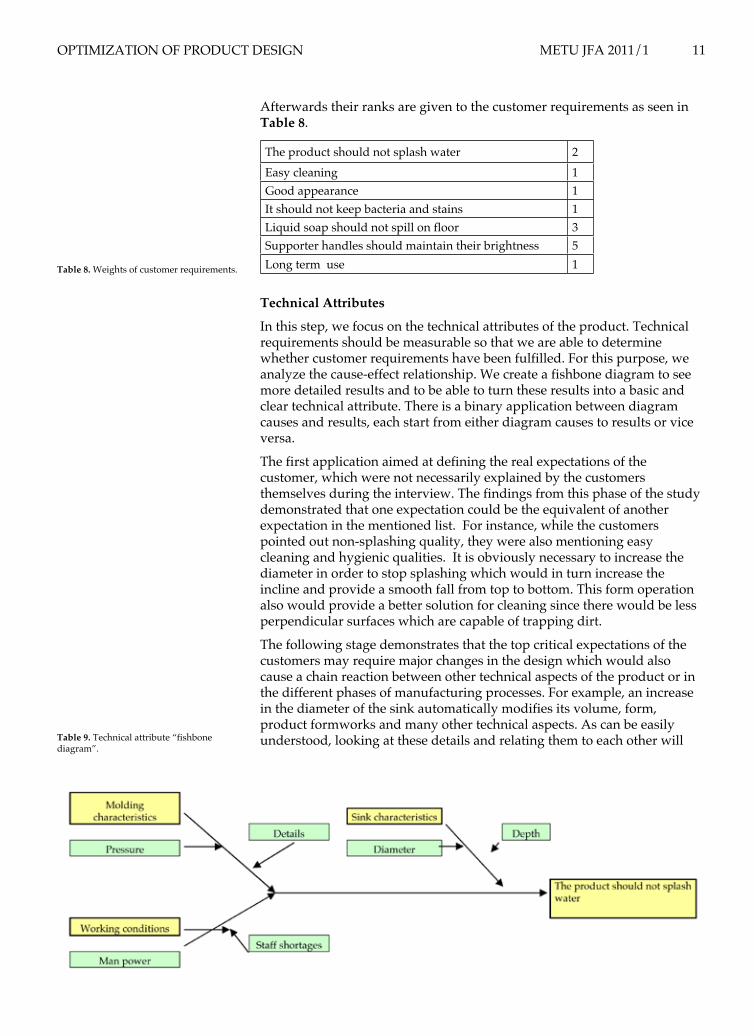
Technical Attributes
In this step, we focus on the technical attributes of the product. Technical requirements should be measurable so that we are able to determine whether customer requirements have been fulfilled. For this purpose, we analyze the cause-effect relationship. We create a fishbone diagram to see more detailed results and to be able to turn these results into a basic and clear technical attribute. There is a binary application between diagram causes and results, each start from either diagram causes to results or vice versa.
The first application aimed at defining the real expectations of the customer, which were not necessarily explained by the customers themselves during the interview. The findings from this phase of the study demonstrated that one expectation could be the equivalent of another expectation in the mentioned list. For instance, while the customers pointed out non-splashing quality, they were also mentioning easy cleaning and hygienic qualities. It is obviously necessary to increase the diameter in order to stop splashing which would in turn increase the incline and provide a smooth fall from top to bottom. This form operation also would provide a better solution for cleaning since there would be less perpendicular surfaces which are capable of trapping dirt.
The following stage demonstrates that the top critical expectations of the customers may require major changes in the design which would also cause a chain reaction between other technical aspects of the product or in the different phases of manufacturing processes. For example, an increase in the diameter of the sink automatically modifies its volume, form, product formworks and many other technical aspects. As can be easily understood, looking at these details and relating them to each other will
Table 8. Weights of customer requirements.
Table 9. Technical attribute “fishbone diagram”.
ÖNDER ERKARSLAN ve HANDE YILMAZ 12 METU JFA 2011/1
enable us to correspond to the other customer needs as well. Following is a sample diagram for this theory.
In our case fishbone diagram helped us to identify the root cause of the problem in a structured and uncomplicated manner. In the diagram, the yellow boxes include main causes and green boxes include details and parameters which refer to an effect such as: The product should not splash water. Additionally we determine basic technical attributes:
Diameter of the sink, Depth of the sink, Vitrahygiene, Vitraclean, Innerside glaze, Outer glaze: terracotta, Chrome supporter handles, Durability, Design idea.
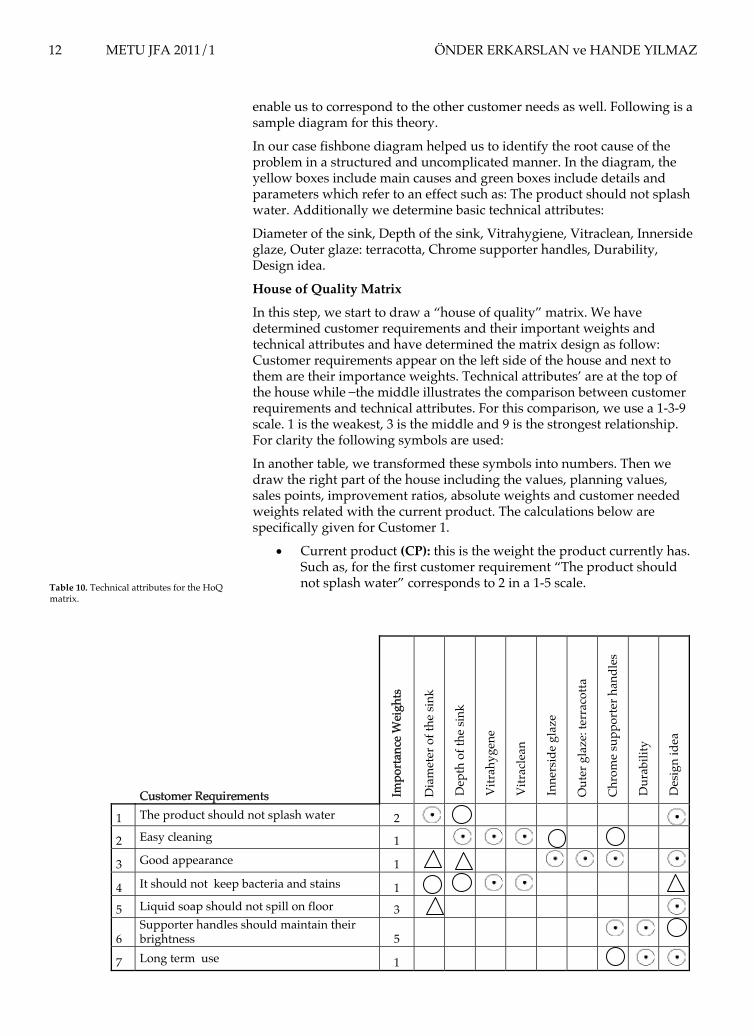
House of Quality Matrix
In this step, we start to draw a “house of quality” matrix. We have determined customer requirements and their important weights and technical attributes and have determined the matrix design as follow: Customer requirements appear on the left side of the house and next to them are their importance weights. Technical attributes’ are at the top of the house while the middle illustrates the comparison between customer requirements and technical attributes. For this comparison, we use a 1-3-9 scale. 1 is the weakest, 3 is the middle and 9 is the strongest relationship. For clarity the following symbols are used:
In another table, we transformed these symbols into numbers. Then we draw the right part of the house including the values, planning values, sales points, improvement ratios, absolute weights and customer needed weights related with the current product. The calculations below are specifically given for Customer 1.
Current product • (CP): this is the weight the product currently has. Such as, for the first customer requirement “The product should not splash water” corresponds to 2 in a 1-5 scale.
11
Diameter of the sink, Depth of the sink, Vitrahygiene, Vitraclean, Innerside glaze, Outer glaze: terracotta, Chrome supporter handles, Durability, Design idea. House of Quality Matrix In this step, we start to draw a “house of quality” matrix. We have determined customer requirements and their important weights and technical attributes and have determined the matrix design as follow: Customer requirements appear on the left side of the house and next to them are their importance weights. Technical attributes’ are at the top of the house while the middle illustrates the comparison between customer requirements and technical attributes. For this comparison, we use a 1-3-9 scale. 1 is the weakest, 3 is the middle and 9 is the strongest relationship. For clarity the following symbols are used:
Strong relationship O Middle relationship ∆ Weakest relationship
Customer Requirements Im
port
ance
Wei
ghts
Dia
met
er o
f the
sink
Dep
th o
f the
sink
Vitr
ahyg
ene
Vitr
acle
an
Inne
rsid
e gl
aze
Out
er g
laze
: ter
raco
tta
Chr
ome
supp
orte
r han
dles
Dur
abili
ty
Des
ign
idea
1 The product should not splash water 2
2 Easy cleaning 1
3 Good appearance 1
4 It should not keep bacteria and stains 1
5 Liquid soap should not spill on floor 3
6 Supporter handles should maintain their brightness 5
7 Long term use 1
Table 10. Technical attributes for the HoQ matrix.
In another table, we transformed these symbols into numbers. Then we draw the right part of the house including the values, planning values, sales points, improvement ratios, absolute weights and customer needed weights related with the current product. The calculations below are specifically given for Customer 1.
• Current product (CP): this is the weight the product currently has. Such as, for the first customer requirement “The product should not splash water” corresponds to 2 in a 1-5 scale. • Plan (P): this is the target weight which the company intends such as the 4 point for the first customer requirement. • Improvement ratio (IR): IR= P / CP IR = 4/2 =2 (12) • Sales point (SP): traditional QFD uses the original scale sales points of 1,5 for a strong sales point and 1,2 for a weak sales point. We discussed the sale points with the company’s sales department. • Absolute weight (AW): AW = IW x IR x SP AW = 2x2x1,5 = 6 (13) • Customer needs weight (CNW): CNW = AW (1.) / ∑ (AW) x 100 CNW = 6 / 46 X 100 =13 (14)
Table 10. Technical attributes for the HoQ matrix.
OPTIMIZATION OF PRODUCT DESIGN METU JFA 2011/1 13
Plan • (P): this is the target weight which the company intends such as the 4 point for the first customer requirement.
Improvement ratio • (IR): IR= P / CP IR = 4/2 =2 (12)
S• ales point (SP): traditional QFD uses the original scale sales points of 1,5 for a strong sales point and 1,2 for a weak sales point. We discussed the sale points with the company’s sales department.
Absolute weight • (AW): AW = IW x IR x SP AW = 2x2x1,5 = 6 (13)
Customer needs weight• (CNW): CNW = AW (1.) / ∑ (AW) x 100
CNW = 6 / 46 X 100 =13 (14)
In the next step, we multiply the customer needs weight by the relationship between the customer requirements and the technical attributes strength,
Technical Attributes
Customer Requirements Impo
rtan
ce W
eigh
ts
Dia
met
er o
f the
sink
Dep
th o
f the
sink
Vitr
ahyg
ene
Vitr
acle
an
Inne
rsid
e gl
aze
Out
er g
laze
: ter
raco
tta
Chr
ome
supp
orte
r han
dles
Dur
abili
ty
Des
ign
idea
Cur
rent
Pro
duct
Plan
Impr
ovem
ent R
atio
Sale
s Po
int
Abs
olut
e W
eigh
t
Cus
tom
er N
eed
Wei
ght
The product should not splash water 2 117 39 117 2 4 2 1,5 6 13
Easy cleaning 1 58 58 58 19 19 2 4 2 1,5 3 6,5
Good appearance 1 13 13 117 117 117 117 4 5 1,25 1,5 6 13It should not keep bacteria and
stains 1 39 39 117 117 13 5 5 1 1,2 6 13
Liquid soap should not spill on floor 3 6,5 58 1 3 3 1 3 6,5
Supporter handles should maintain their brightness 5 388 388 129 4 5 1,25 1 20 43
Long term use 1 16 47 47 2 4 2 1,2 2,4 5,2
Absolute Weight 175 149 175 175 136 117 540 435 481 46 100Technical Characteristic
Weight 7,4 6,2 7,4 7,4 5,7 4,9 23 18 20 100
Table 11. “House of quality matrix”.
ÖNDER ERKARSLAN ve HANDE YILMAZ 14 METU JFA 2011/1
sum products in each column to get an absolute weight, sum those and divide each by the sum to calculate a technical attributes’ weight.
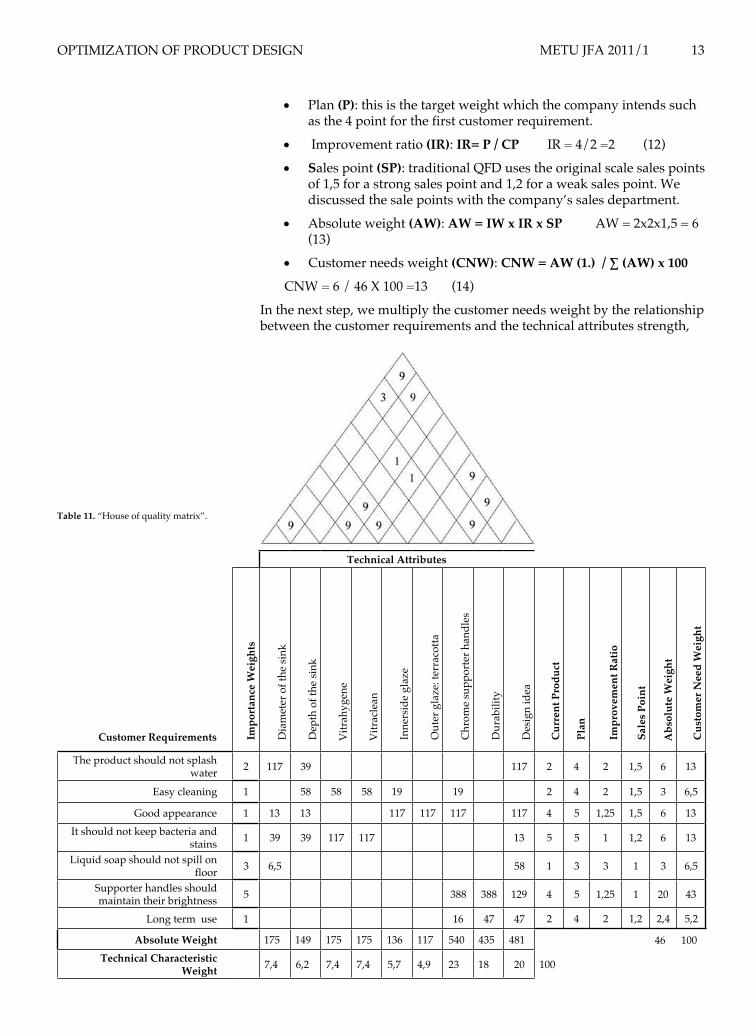
The last part of the house, the roof, includes relationships between each of the technical attributes. A 1-3-9 scale is used in this part. These rates provide opportunity technical optimizations. In the following Table 11, we draw the house quality matrix which includes all this information.
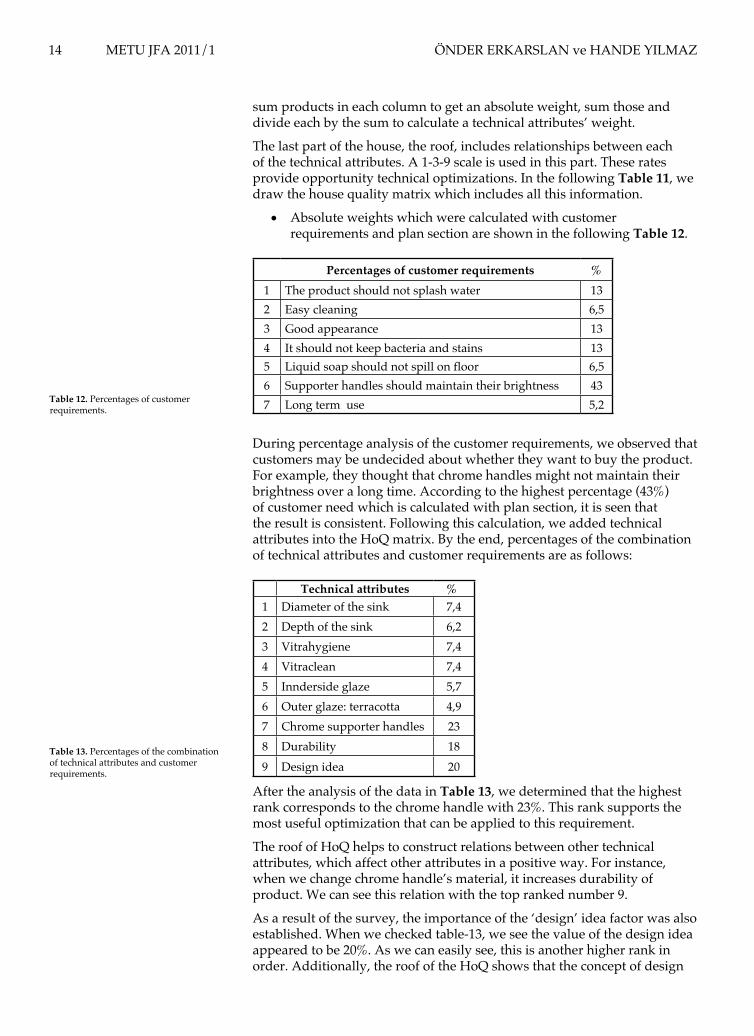
Absolute weights which were calculated with customer •requirements and plan section are shown in the following Table 12.
Percentages of customer requirements %1 The product should not splash water 132 Easy cleaning 6,53 Good appearance 134 It should not keep bacteria and stains 135 Liquid soap should not spill on floor 6,56 Supporter handles should maintain their brightness 437 Long term use 5,2
During percentage analysis of the customer requirements, we observed that customers may be undecided about whether they want to buy the product. For example, they thought that chrome handles might not maintain their brightness over a long time. According to the highest percentage (43%) of customer need which is calculated with plan section, it is seen that the result is consistent. Following this calculation, we added technical attributes into the HoQ matrix. By the end, percentages of the combination of technical attributes and customer requirements are as follows:
Technical attributes %1 Diameter of the sink 7,42 Depth of the sink 6,23 Vitrahygiene 7,44 Vitraclean 7,45 Innderside glaze 5,76 Outer glaze: terracotta 4,97 Chrome supporter handles 238 Durability 189 Design idea 20
After the analysis of the data in Table 13, we determined that the highest rank corresponds to the chrome handle with 23%. This rank supports the most useful optimization that can be applied to this requirement.
The roof of HoQ helps to construct relations between other technical attributes, which affect other attributes in a positive way. For instance, when we change chrome handle’s material, it increases durability of product. We can see this relation with the top ranked number 9.
As a result of the survey, the importance of the ‘design’ idea factor was also established. When we checked table-13, we see the value of the design idea appeared to be 20%. As we can easily see, this is another higher rank in order. Additionally, the roof of the HoQ shows that the concept of design
Table 12. Percentages of customer requirements.
Table 13. Percentages of the combination of technical attributes and customer requirements.
OPTIMIZATION OF PRODUCT DESIGN METU JFA 2011/1 15
is in strong relationship with the diameter and depth of the product, which means that any change in the design would also cause a change in these dimensions. In this situation, we check the table again and see that the importance of the diameter and depth of the sink have an importance that has 7,4%and 6,2%. If we apply an optimization process to the product, we should sum the ranks to determine absolute weight of the customer requirement. This calculation can be seen as (15):
Absolute Optimization Weight= % Diameter of the Sink+% Depth of the Sink+% Design Idea
AOW= %20+%7,4+%6,2 = %33,6 (15)
This rank shows that optimization of the design of the product would be more effective than the other optimization alternatives for both customers and the company. The HoQ matrix gives a consistent scale which two data can be associated with in the matrix.
FINDINGS OF THE STUDY
In this study, we determined the most important customer needs, considering the product from the customer’s perspective. According to the results, the major output of the analysis is the HOQ shown in table-11. The results introduced the most important technical measures which assist in success of the project: good appearance, depth and diameter of the sink and chrome supporter handles. As a result, we suggest that these technical characteristics have an important role in marketing. The company should incorporate these attributes to satisfy their customer needs. This is possible through some optimizations such as modifying the diameter and depth of the product as well as other minor design changes. These optimizations can increase market sales advantages.
Additionally, by considering the customers’ perspective, we may discover the most important customer requirements. By calculating these relationships, we can determine the customers’ highest priority concerns. In this study, it was clear that the customer doesn’t want the water to splash out of the sink, and easy cleaning is as important as appearance. The optimizations which we refer to earlier are dependent upon the technical attributes to be applied in process; preferential needs would help decision makers to decide what the most effective optimizations are.
LIMITATIONS OF THE CASE
The research was realized on the basis of a series of limitations due to special circumstances: the position of the company and the entrance of the product into the market.
The company was not included as a primary partner at the beginning of this research. For this reason, any information about the development process, such as market analysis, cost analysis, concept studies or prototype studies, was not incorporated into the scope of this research. On the other hand, the directors of the local sales office inevitably became a major consultant because they were asked to define the customer profile and current sales points needed in the QFD analysis. The directors also pointed out their own views on the advantages and disadvantages of the product and made an estimation of the future change in sales after a potential revision in the design.
ÖNDER ERKARSLAN ve HANDE YILMAZ 16 METU JFA 2011/1
The product entitled “potsink” was not put on the market when the research was started in 2007. It became available in local showrooms only after May 2008. The number of buyers who could evaluate the product based on experience was unfortunately insufficient for a QFD analysis since the potsink was literally ‘fresh’ on the market during this research. For this reason, the interviewed group was selected among the customers who visited the local store, instead of the users. Another limitation was that there were no bench markers in the analysis, because there were no other products in the same sales area in other companies.
Costs were also not included in this analysis. We worked on the project independent of costs in order to be able to receive customer’s primary needs and expectations. However QFD can also be renewable after the revisions in design or sales strategies. For this reason, the cost analysis can be added on to our results if the company would like to repeat QFD after any revisions. As a final limitation, sales strategies or advertisements which increase sales guaranties were not included in this research.
CONCLUSIONS
The biggest costs in the ceramic industry are constituted by labor and molding. Any changes in design after the postproduction process requires all the moldings at the production level to be altered which would bring additional labor costs as well as risk the quality of the products after the remediation. For this reason, the inclusion of the QFD in the production process will have a significant effect in decreasing the production process to a minimum, decreasing the costs reserved for remedies, and gaining a more advantageous position in sales by satisfying customer expectations. As a result of our research, we put forth that in the ceramic washbasin production industry, the inclusion of QFD in the product process will bring positive results to the design and production process as well as advantages in market development and sales. The results of our particular survey of customer satisfaction with the ‘Potsink’ product can be itemized as follows:
1. The dimensions of the product are insufficient to satisfy the needs of the customer. In order to fulfill customer expectation, the diameter of the sink has to be increased, which would in turn cause a need for a comprehensive revision of the overall dimensions in order to maintain its aesthetic proportion.
2. The product is difficult to clean, and thus it is not capable of matching the expectations of the customer. The product needs a revision in order to minimize the vertical surfaces. However such a revision is not compatible with the principal decisions of the design concept and thus it is impossible to be realized.
3. Despite the unconventional and innovative design concept of the product in terms of aesthetics, the problems derived from ergonomics and hygiene undermines this advantage. The customers frequently emphasized their worries about the problems in practical use of the product rather than talking about the innovative shape of the product.
According to the results of this analysis, potential optimizations can be itemized as follows:
1. Proportional Optimization: Although the original form of the pot has certain proportions that can hardly be changed, a dimensional redesign of the product is still possible by increasing the diameter at the upper
OPTIMIZATION OF PRODUCT DESIGN METU JFA 2011/1 17
periphery. While doing this, the diameter at the lower periphery should be kept fixed in order not to enlarge the overall dimension of the product.
2. Material Optimization: The chrome supporter handles cause a weakness in design from the point of easy maintenance. The chrome material can be interchanged with stainless steel accessories which may help increase the performance of the product.
3. Additional Accessories: Without exception, a soap bar is still one of the indispensables for the majority of Turkish customers. This disadvantage of the product also became apparent as the results of our QFD application. In addition to this, the present form of the product is inspired by the purity of traditional cleaning rituals. The design conveys purity by using a minimum number of additional accessories and terracotta material. For this reason, adding a separate soap dish may disturb the minimalist approach of the original design. However, the original design includes an optional accessory consisting of a smaller size pot which is intended to function as a real pot. This accessory can be optimized to contain a traditional soap dish.
The findings of this study prove that QFD can be efficient when applied at an earlier period of the design process. In order to quantify the design criteria and evaluate the priority vector for the design alternatives, the AHP method should be combined with QFD. There are a number of advantages of using this method as listed below:
It helps to reduce the design ambiguities.1.
The design process becomes clearer for the third parties.2.
The selection of the best design alternative can be made based on the 3. quantified results.
The role of the QFD is to guide the design team in deciding which engineering characteristics to focus on in order to design a product according to the ergonomic needs of the customer. AHP also involves in obtaining the value weightings of customer requirements. Although the use of QFD and AHP determine the problems in the design proposal, none of them can bring a concrete solution for how engineering characteristics should be changed in order to remove these problems. For instance in our case study, QFD and AHP put forth that the diameter of the sink should be increased in order to maintain its aesthetic proportion and traditional soap dish should be added in order to make the product more functional. However the findings do not ensure what shape of the sink should be like and how soap dish should be integrated. This is the basic flaw in AHP and QFD methods that we detected.
As common to all methodological approaches in design research, the results of QFD do not indicate how the final revisions of the design should be. Instead, this method helps the designer to notice the problems that were not felt during the design phase and provides the designer with a ‘fact’ rather than a ‘solution’. In our case study, although the results of QFD make it explicit that there is a need to change in the dimensions of the product and a soap dish should be integrated into the scheme, this may not be able to guarantee the satisfaction of the customers. The rehabilitation of the design is dependent on the interpretation as well as the talent of the designer.
Quality Function Deployment provides a structured methodology for bridging the gap between marketing, manufacturing and design strategies.
ÖNDER ERKARSLAN ve HANDE YILMAZ 18 METU JFA 2011/1
As the results of our case study demonstrate QFD requires an easy understanding of customer expectations. It is obvious that this information could have been more helpful and effective if QFD had been applied in the design phase rather than for product optimization. However the method is still helpful for the design team to transform the customer expectations into quantitative data in a rapid process. For this reason, QFD is a valid and reliable method for developing a product optimization with a better teamwork organization.
BIBLIOGRAPHY
AKAO, Y. (1990) Quality Function Deployment: Integrating Customer Requirements into Product Design, Productivity Press, Cambridge MA.
ASKIN, R.G., DAWSON, D.W. (2000) Maximizing Customer Satisfaction by Optimal Specification of Engineering Characteristics, IIE Transactions, 32 (1) 9-20.
BHATTACHARYA, A., SAKAR, B., MUKHERJEE, S.K. (2005) Integrating AHP with QFD for Robot Selection Under Requirement Perspective, International Journal of Product Research, 43 (17) 3671-85.
CHAN, L.K., WU, M.L. (2002) Quality Function Deployment: A Literature Review, European Journal of Operational Research, n: 143; 463-97.
CHAN, L.K., WU, M.L. (2005) A Systematic Approach to Quality Function Deployment with a Full Illustrative Example, OMEGA-International journal of management science, 33( 2) 119-39.
CHEN, L.H., WENG, M.C. (2003) A Fuzzy Model For Exploiting Quality Function Deployment, Mathematical and Computer Modeling, 38 (5-6) 559-70.
CHEN, Y., TANG, J., Fung, R.Y.K., REN, Z. (2004) Fuzzy Regression-Based Mathematical Programming Model For Quality Function Deployment, International Journal of Production Research, 42 (5) 1009-27.
CHEN, Y., FUNG, R.Y.K, YANG, J. (2005) Fuzzy Expected Value Modeling Approach for Determining Target Values of Engineering Characteristics in QFD, International Journal of Production Research, 43 (17) 3583-604.
CLAUSING, D. and COHEN, L. (1994) Recent Developments in QFD in the United States, Institution of Mechanical Engineering Conference, Coventry, UK.
COHEN, L. (1995) Quality Function Deployment: How to Make QFD Work for You, Addison-Wesley, Reading, MA.
DAWSON, D., ASKIN, R.G. (1999) Optimal New Product Design Using Quality Function Deployment with Empirical Value Functions, Quality and Reliability Engineering International, 15 (1) 17-32.
DIKMEN, I., BIRGONUL, M. T., KIZILTAS, S. (2005) Strategic Use of Quality Function Deployment (QFD) in the Construction Industry, Building and Environment (40) 245-55.
DWEIRI, F.T., KABLAN, M.M. (2005) An Integration of the Analytic Hierarchy Process into the Quality Function Deployment Process,
OPTIMIZATION OF PRODUCT DESIGN METU JFA 2011/1 19
International Journal of Industrial Engineering-Theory, Applications and Practice, 12 (2) 180-8.
FUNG, R.Y.K., POPPLEWELL, K., XIE, J. (1998) An Intelligent Hybrid System for Customer Requirements Analysis and Product Attribute Targets Determination, International Journal of Production Research, 36 (1) 13-34.
FUNG, R.Y.K., CHEN, Y.Z., TANG, J.F. (2006) Estimating the Functional Relationships for Quality Function Deployment Under Uncertainties, Fuzzy Sets and Systems, 157 (1) 98-120.
GERLING, W.H., PREUSSGER, A.F., WULFERT, W. (2002) Reliability Qualification of Semiconductor Devices Based on Physics-of-Failure and Risk and Opportunity Assessment, Quality and Reliability Engineering International, 18 (2) 81-98.
HAN, C.H., KIM, J.K., CHOI, S.H. (2004) Prioritizing Engineering Characteristics in Quality Function Deployment with Incomplete Information: A Linear Partial Ordering Approach, International Journal of Production Research, 91 (3) 235-49.
HARI, A., KASSER, J.E., WEISS, M. (2007) How Lessons Learned from Using QFD Led to the Evolution of a Process for Creating Quality Requirements for Complex Systems, Willey Interscience, 10 (1) 45-63.
HAUSER, J.R., CLAUSING, D. (1988) The House of Quality, Harvard Business Review, 66 (3) 63-73.
HO, W. (2008) Integrated Analytic Hierarchy Process and its Applications - A Literature Review, European Journal of Operational Research, n: 186; 211-28.
KAHN, K.B. (2006) New Product Forecasting: An Applied Approach, Armonk, NY.
KAHRAMAN, C., ERTAY, T., BUYUKOSMAN, G. (2006) A Fuzzy Optimization Model for QFD Planning Process Using Analytic Network Approach, European Journal of Operational Research (171) 390-411.
KALARGEROS, N., GAO, J.X. (1998) QFD: Focusing on its Simplification and Easy Computerization Using Fuzzy Logic Principles, International Journal of Vehicle Design (19) 315-25.
KING, B. (1989) Better Designs in Half the Time. Goal/QPC, Methuen, MA.
KARSAK, E.E., SÖZER, S., ALPTEKIN, S.E. (2003) Product Planning in Quality Function Deployment Using A Combined Analytic Network Process and Goal Programming Approach, Computers and Industrial Engineering, 44 (1) 171-90.
KARSAK, E.E. (2004) Fuzzy Multiple Objective Decision Making Approach to Prioritize Design Requirements in Quality Function Deployment, International Journal of Production Research, 42 (18) 3957-74.
KIM, K. (1997) Determining Optimal Design Characteristic Levels in QFD, Quality Engineering, 10 (2) 295-307.
KIM, K., MOSKOWITZ, H., DHINGRA, A., EVANS, G. (2000) Fuzzy Multicriteria Models for Quality Function Deployment, European Journal of Operational Research, 121 (3)504-18.
ÖNDER ERKARSLAN ve HANDE YILMAZ 20 METU JFA 2011/1
LAI, X., XIE, M., TAN, K.C. (2004) Optimizing Product Design Using the Kano Model and QFD, IEEE International Engineering Management Conference. IEEE EMS Singapore; 1085-9.
LAI, X., TAN, K.C., XIE, M. (2007) Optimizing Product Design Using Quantitative Quality Function Deployment: A Case Study, Quality and Reliability Engineering International, n: 23; 45-57.
LIN, M.C., WANG, C.C., CHEN, M.S., CHANG, C.A. (2008) Using AHP and Topsis Approaches in Customer-Driven Product Design Process, Computers in Industry, n: 59; 17-31.
LIU, S.T. (2005) Rating Design Requirements in Fuzzy Quality Function Deployment via Mathematical Programming Approach, International Journal of Production Research, 43 (17) 497-513.
LU, M., MADU, C.N., KUEI, C., WINOKUR, D. (1994) Integrating QFD, AHP and Benchmarking in Strategic Marketing, Journal of Business and Industrial Marketing, 9 (1) 41-50.
MAZUR, G. (1997) Voice of Customer Analysis: A Modern System of Front-End QFD Tools, with Case Studies, AQC Milwakuee American Society of Quality Control, Orlando.
MAZUR, G. (2008) Modern QFD Introduction, 2nd National Symposium on Quality Function Deployment, Dokuz Eylül University, İzmir.
MOSKOWITZ, H., KIM, K. (1997) QFD Optimizer: A Novice Friendly Quality Function Deployment Decision Support System for Optimizing Product/Service Designs, Computers and Industrial Engineering, 32 (3) 641-55.
MRAD, F. (1997) An Industrial Workstation Characterization and Selection Using Quality Function Deployment, Quality Reliability Engineering International, 13 (5) 261-8.
PARK, T., KIM, K.J. (1998) Determination of An Optimal Set of Design Requirements Using House of Quality, Journal of Operations Management (16) 569-81.
POEL, I. (2007) Methodological Problem in QFD and Directions for Future Development, Research Engineering Design (18) 21-36.
PRASAD, B. (1998a) Review of QFD and Related Deployment Techniques, Journal of Manufacturing Systems, 17 (3) 221-34.
PRASAD, B. (1998b) Synthesis of Market Research Data through A Combined Effort of QFD, Value Engineering, and Value Graph Techniques, Qualitative Market Research: An International Journal, 1 (3) 156-72.
PRESSON, P., KAMMERLIND, P., BERGMAN, B., ANDERSON, J. (2000) A Methodology for Multi-Characteristic Systems Improvement with Active Expert Involvement, Quality and Reliability Engineering International, 16 (5) 405-16.
SAATY, T.L. (1980) Analytic Hierarchy Process, McGraw-Hill, Newyork.
SHEN, X.X., TAN, K.C. (1998) Customer Satisfaction Benchmarking in QFD: Avoiding Pitfalls, 2nd International and 5th National Research Conference on Quality Management, Monash University: Victoria, Australia; 196-203.
OPTIMIZATION OF PRODUCT DESIGN METU JFA 2011/1 21
STEUER, R.E., NA, P. (2003) Multiple Criteria Decision Making Combined with Finance: A Categorized Bibliographic Study, European Journal of Operational Research, 150(3) 496-515.
SULLIVAN, L.P. (1986) Quality Function Deployment. Quality Progress, 19 (6) 39-50.
VAIDYA, O.S., KUMAR, S. (2006) Analytic Hierarchy Process: An Overview of Applications, European Journal of Operational Research, 169(1) 1-29.
VANEGAS, L.V., LABIB, A.W. (2001) A Fuzzy Quality Function Deployment (FQFD) Model for Deriving Optimum Targets, International Journal of Production Research, 39 (1) 99-120.
YILMAZ, H. (2009) Optimization of the Product Design Through Quality Function Deployment (QFD) and Analytical Hierarchy Process (AHP): A Case Study of A Ceramic Washbasin, Yayınlanmamış Yüksek Lisans Tezi, Endüstri Ürünleri Tasarımı Bölümü, İYTE, İzmir.
YORAM, R., EYAL, L. (2005) Managing Product Design Quality Under Resource Constraints, International Journal of Production Research, 42 (13) 2555-72.
KALİTE FONKSİYON GÖÇERİMİ VE ANALİTİK HİYERARŞİ SÜRECİ ARACILIĞIYLA ÜRÜN TASARIMININ OPTİMİZASYONU: BİR SERAMİK LAVABO TASARIMI
Kalite Fonksiyon Göçerimi (KFG), ürünlerde yapılacak ileri iyileştirme ve geliştirmeler için üretim sonrasında olduğu kadar tasarım süreci boyunca da uygulanabilen yararlı bir yöntemdir. Bu çalışma, müşteri beklentilerini ve tasarım kalitesini ürüne aktarabilmek için KFG ve Analitik Hiyerarşi Süreci (AHS)’nin ürün tasarımında uygulanabilirliğini ölçmeyi amaçlar ve bir seramik lavabo tasarımı vaka çalışması özelinde konuyu ele alır.
Çalışmanın ilk bölümünde, ele alınan ürünle ilgili müşteri gereksinimleri ve beklentileri araştırılmıştır. Bu veriler öncelikle Müşteri Sesi adı verilen tablolara aktarılmış, oradan da teknik özelliklere karşılık gelecek biçimde dönüştürülerek Mühendisin Sesi adı verilen tablolar oluşturulmuştur. Analitik Hiyerarşi Sürecinin bu vakaya uygulanması ile müşteri beklentileri ve teknik özellikler bir ölçü sistemi içerisinde sayısal değerlere dönüştürülmüştür. Kalite özellikleri önem seviyelerine göre müşteri ağırlıklarının hesaplanmasıyla elde edilerek daha sonra Kalite Evi adı ile anılan ve ölçülebilen teknik değerler içeren tablolara aktarılmıştır. Daha kesin sonuçlar elde etmek amacı ile birbirleriyle ilişkileri olan müşteri beklentileri, teknik özellikler ve planlanlama engelleri bir matrise yerleştirilmiştir. Bu çalışmanın bulguları, KFG yönteminin tasarım sürecinin ilk aşamalarında kullanıldığında, ürün iyileştirme konusunda daha etkin olabileceğini kanıtlamaktadır.
Alındı: 24.07.2009, Son Metin: 19.12.2010
Anahtar Sözcükler: Kalite Fonksiyon Göçerimi (KFG); Analitik Hiyerarşi Süreci (AHS); ürün optimizasyonu

ÖNDER ERKARSLAN ve HANDE YILMAZ 22 METU JFA 2011/1
ÖNDER ERKARSLAN; B.A., M.A., Ph.D.Associate Professor and chair of the Department of Industrial Design, İzmir Institute of Technology. Research and teaching interests are design semiotics, design communication, design education, QFD applications on industrial products. Has numerous articles in scientific journals and presentations in conferences. [email protected]
HANDE YILMAZ; BA, M.Sc.Received B.A. in Ceramic and Glass Design at DEU (2003). Employed for Kaleseramik Çanakkale Kalebodur Seramik Sanayi, Kalevit Roca Saniter Seramik Sanayi, Kaledekor Yapı Malzemeleri Sanayi and Ege Vitrifiye Sağlık Gereçleri Sanayi. [email protected]