2010 Preliminary Results - imiplc.com/media/Files/I/IMI/results-archive/2011/Prelims... · 4....
42
1 2010 Preliminary Results 3 March 2011
Transcript of 2010 Preliminary Results - imiplc.com/media/Files/I/IMI/results-archive/2011/Prelims... · 4....

1
2010 Preliminary Results
3 March 2011
2
Martin Lamb

Key Priorities
1. Strategic convergence
2. Growth acceleration
3. Margin improvement
4. Balance sheet utilisation
3

4
Agenda
• Results overview Douglas Hurt
• Zimmermann & Jansen Ian Whiting
• Key priorities Martin Lamb
• Closing remarks Norman Askew
• Questions and answers

5
Results Overview
Douglas Hurt
6
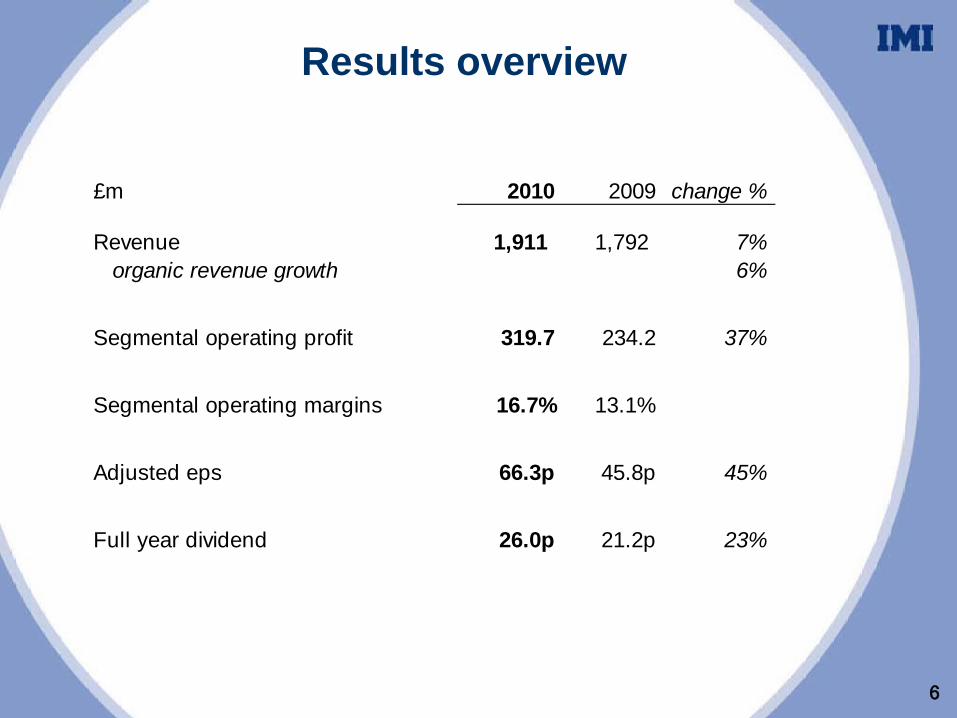
Results overview
£m 2010 2009 change %
1,911 1,792 7% organic revenue growth 6%
319.7 234.2 37%
Segmental operating margins 16.7% 13.1%
Adjusted eps 66.3p 45.8p 45%
Full year dividend 26.0p 21.2p 23%
Revenue
Segmental operating profit
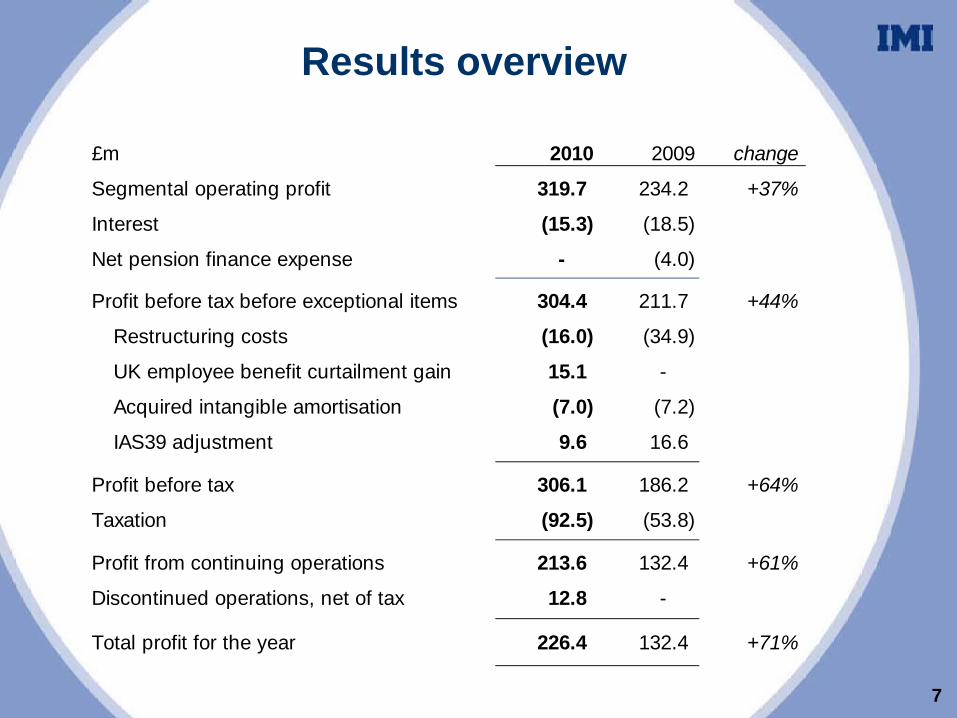
£m 2010 2009 change
Segmental operating profit 319.7 234.2 +37%
Interest (15.3) (18.5)
Net pension finance expense - (4.0)
Profit before tax before exceptional items 304.4 211.7 +44%
Restructuring costs (16.0) (34.9)
UK employee benefit curtailment gain 15.1 -
Acquired intangible amortisation (7.0) (7.2)
IAS39 adjustment 9.6 16.6
Profit before tax 306.1 186.2 +64%
Taxation (92.5) (53.8)
Profit from continuing operations 213.6 132.4 +61%
Discontinued operations, net of tax 12.8 -
Total profit for the year 226.4 132.4 +71%
7
Results overview
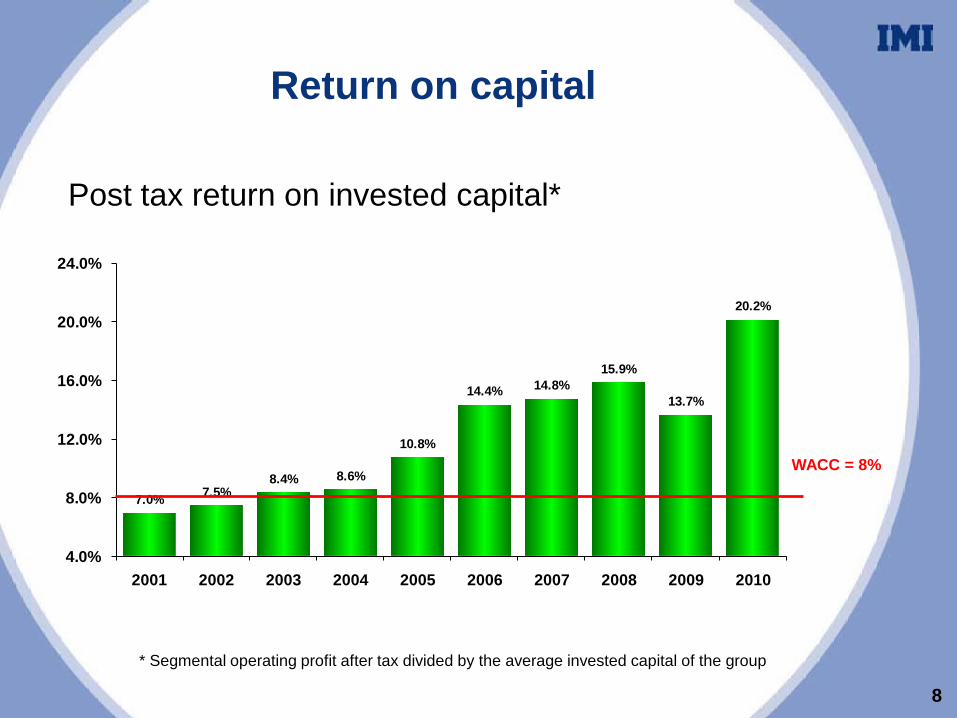
7.0% 7.5%8.4% 8.6%
10.8%
14.4% 14.8%15.9%
13.7%
20.2%
4.0%
8.0%
12.0%
16.0%
20.0%
24.0%
2001 2002 2003 2004 2005 2006 2007 2008 2009 2010
Return on capital
WACC = 8%
Post tax return on invested capital*
8
* Segmental operating profit after tax divided by the average invested capital of the group
9
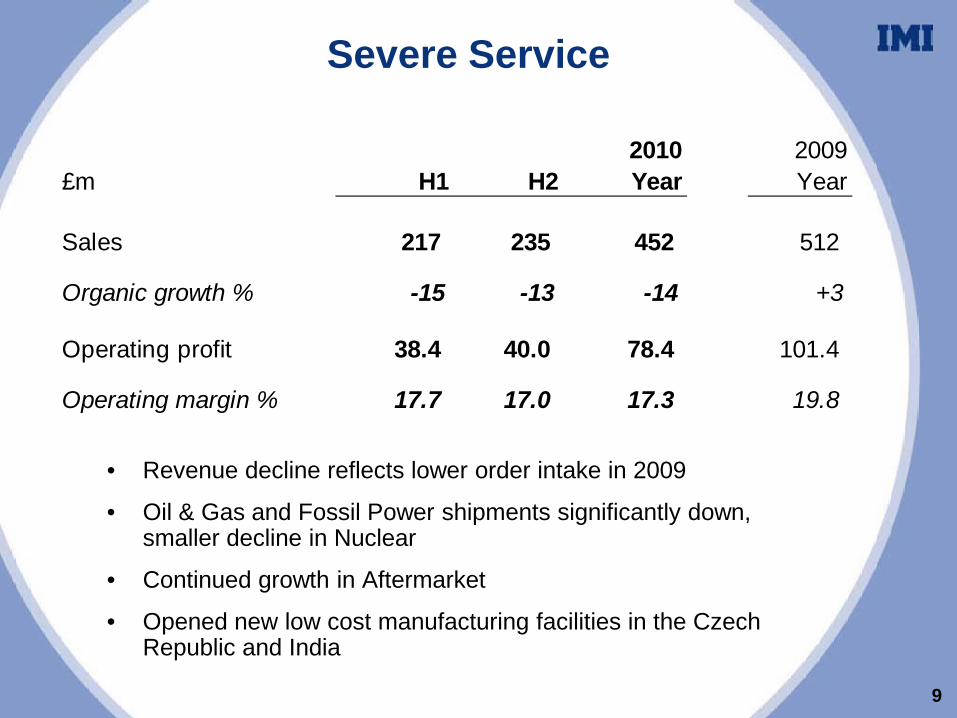
Severe Service
• Revenue decline reflects lower order intake in 2009
• Oil & Gas and Fossil Power shipments significantly down, smaller decline in Nuclear
• Continued growth in Aftermarket
• Opened new low cost manufacturing facilities in the Czech Republic and India
2010 2009£m H1 H2 Year Year
Sales 217 235 452 512
Organic growth % -15 -13 -14 +3
Operating profit 38.4 40.0 78.4 101.4
Operating margin % 17.7 17.0 17.3 19.8
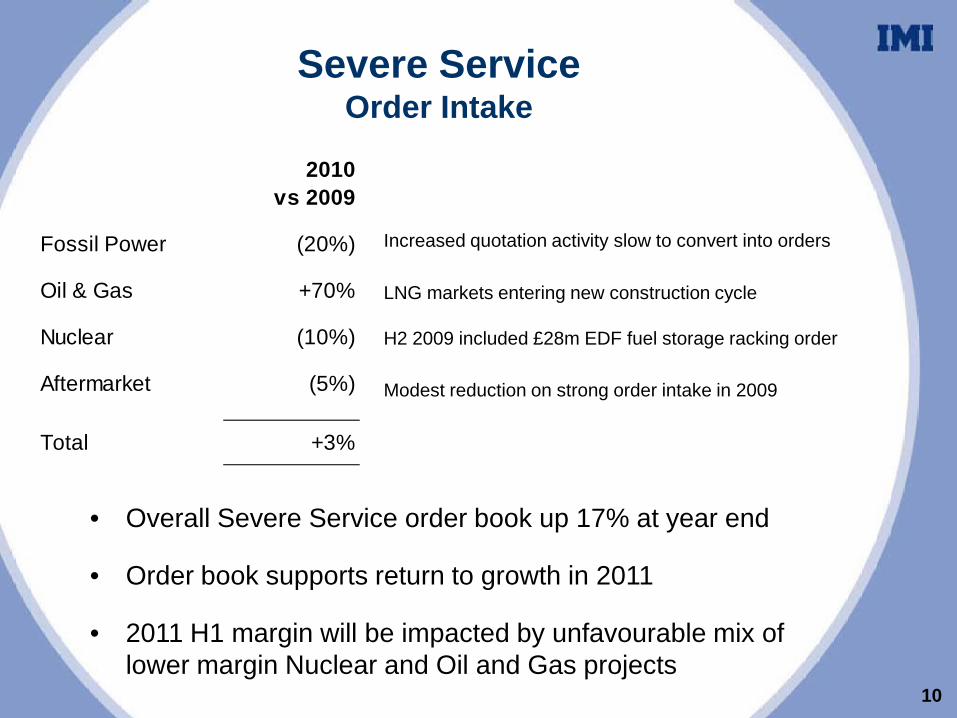
Severe ServiceOrder Intake
• Overall Severe Service order book up 17% at year end
• Order book supports return to growth in 2011
• 2011 H1 margin will be impacted by unfavourable mix of lower margin Nuclear and Oil and Gas projects
Increased quotation activity slow to convert into orders
LNG markets entering new construction cycle
H2 2009 included £28m EDF fuel storage racking order
Modest reduction on strong order intake in 2009
2010 vs 2009
Fossil Power (20%)
Oil & Gas +70%
Nuclear (10%)
Aftermarket (5%)
Total +3%
10
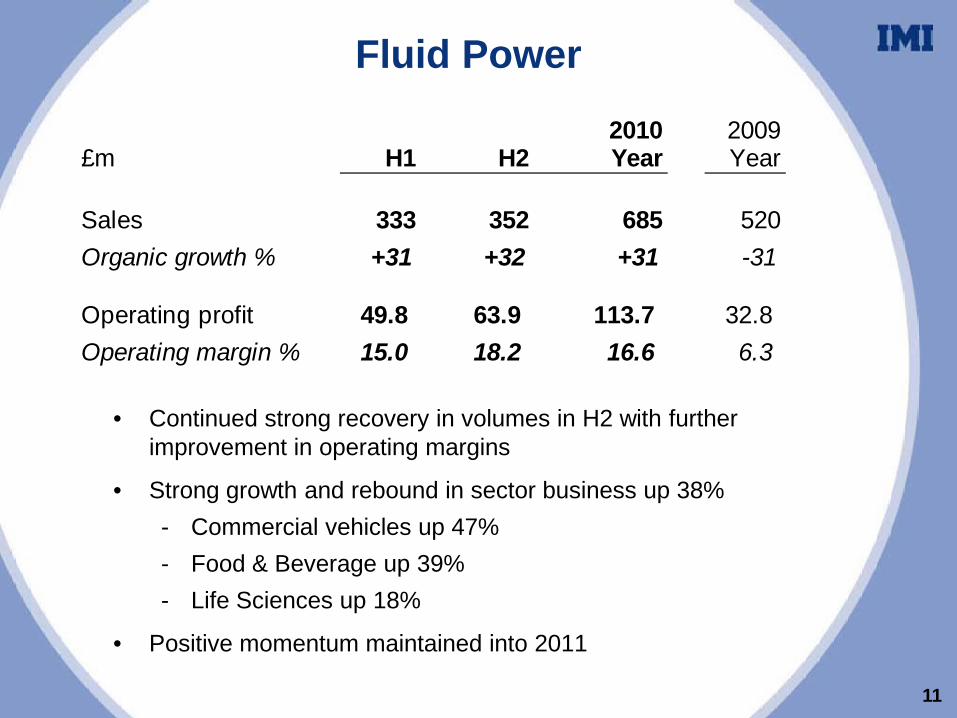
Fluid Power
• Continued strong recovery in volumes in H2 with further improvement in operating margins
• Strong growth and rebound in sector business up 38%- Commercial vehicles up 47%- Food & Beverage up 39%- Life Sciences up 18%
• Positive momentum maintained into 2011
2010 2009£m H1 H2 Year Year
Sales 333 352 685 520Organic growth % +31 +32 +31 -31
Operating profit 49.8 63.9 113.7 32.8 Operating margin % 15.0 18.2 16.6 6.3
11
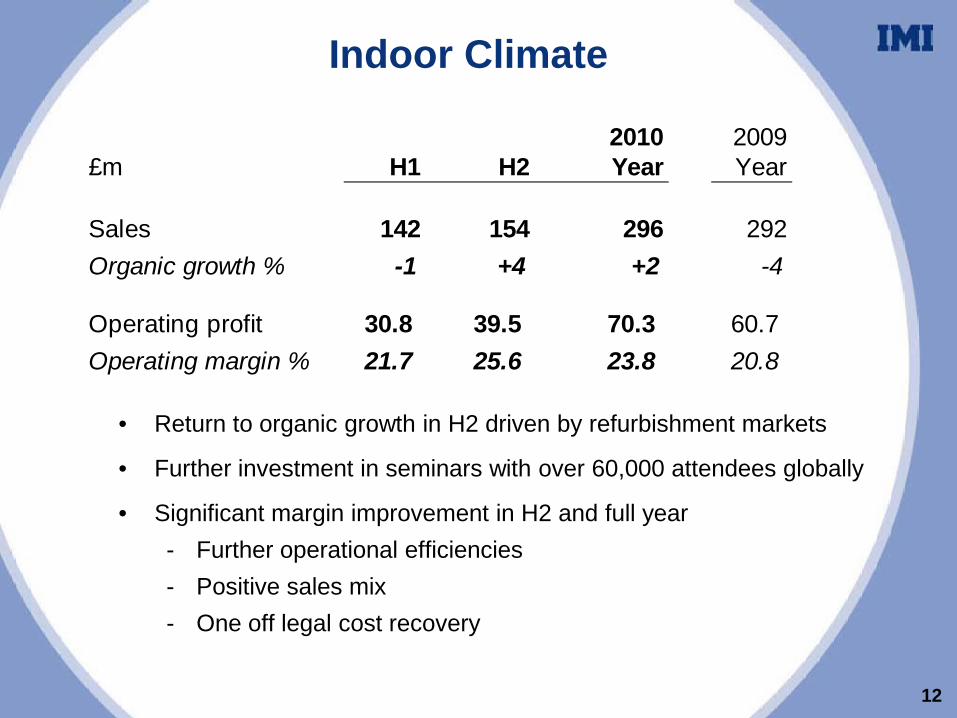
Indoor Climate
• Return to organic growth in H2 driven by refurbishment markets
• Further investment in seminars with over 60,000 attendees globally
• Significant margin improvement in H2 and full year- Further operational efficiencies- Positive sales mix- One off legal cost recovery
2010 2009£m H1 H2 Year Year
Sales 142 154 296 292Organic growth % -1 +4 +2 -4
Operating profit 30.8 39.5 70.3 60.7 Operating margin % 21.7 25.6 23.8 20.8
12
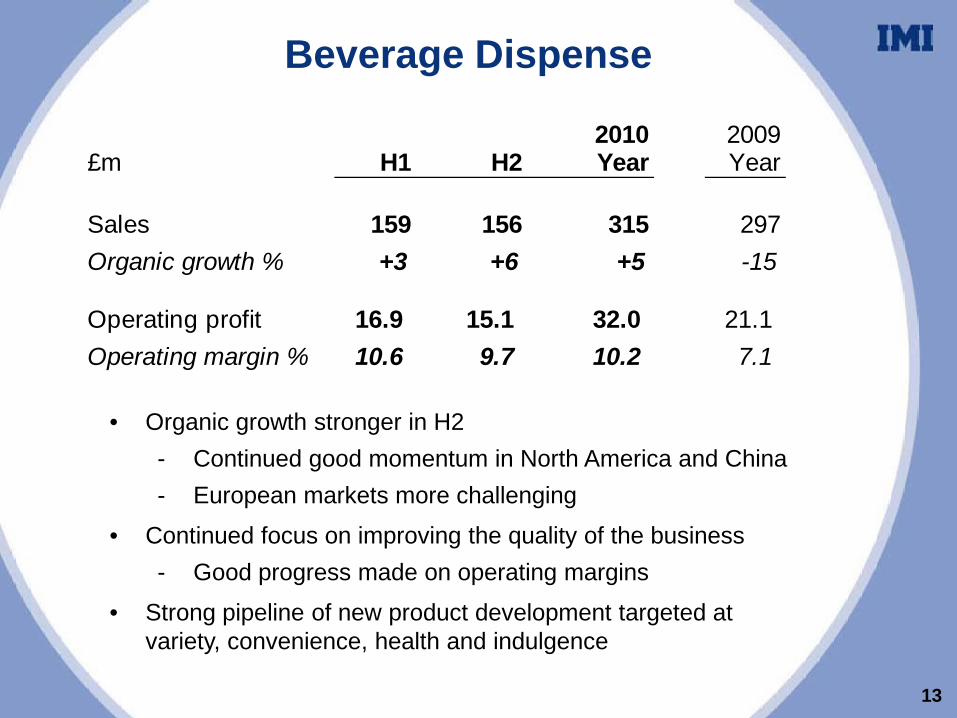
Beverage Dispense
• Organic growth stronger in H2- Continued good momentum in North America and China- European markets more challenging
• Continued focus on improving the quality of the business- Good progress made on operating margins
• Strong pipeline of new product development targeted at variety, convenience, health and indulgence
2010 2009£m H1 H2 Year Year
Sales 159 156 315 297Organic growth % +3 +6 +5 -15
Operating profit 16.9 15.1 32.0 21.1 Operating margin % 10.6 9.7 10.2 7.1
13

Merchandising
• Good recovery in H2 activity levels, benefiting from project wins in automotive sector- Cosmetics sector more challenging
• Significant uplift in H2 operating margins
• Continued prioritisation of higher margin, differentiated project opportunities
• Opening “In-Vision” customer experience centre in US
2010 2009£m H1 H2 Year Year
Sales 76 93 169 164Organic growth % -12 +16 +2 -29
Operating profit 9.7 15.6 25.3 18.2 Operating margin % 12.8 16.8 15.0 11.1
14
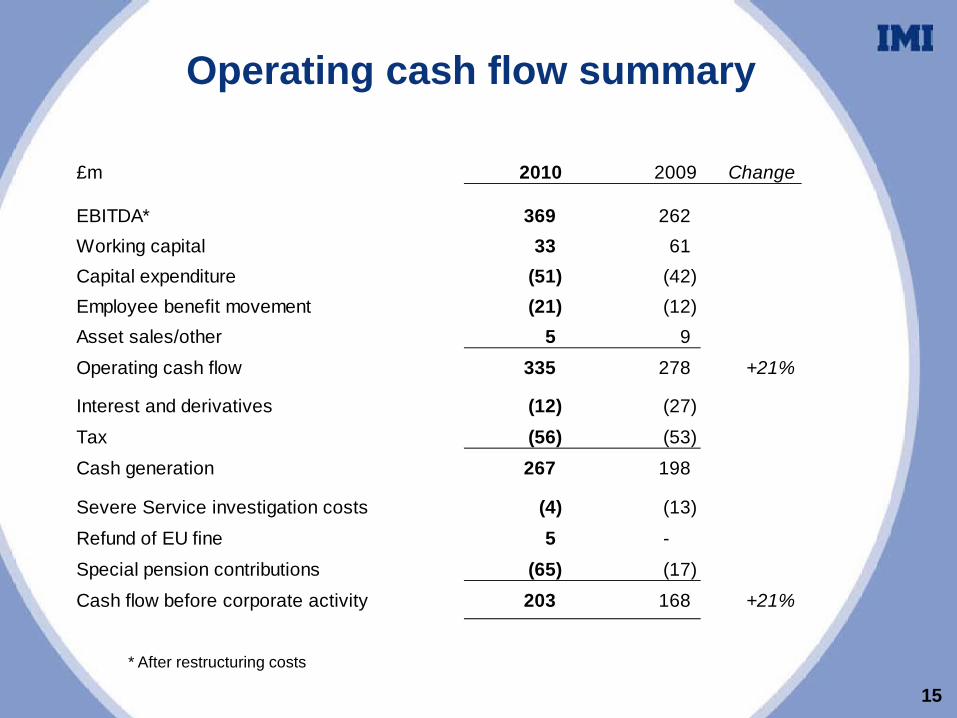
Operating cash flow summary
£m 2010 2009 Change
EBITDA* 369 262 Working capital 33 61 Capital expenditure (51) (42) Employee benefit movement (21) (12) Asset sales/other 5 9
Operating cash flow 335 278 +21%
Interest and derivatives (12) (27)
Tax (56) (53)
Cash generation 267 198
Severe Service investigation costs (4) (13)
Refund of EU fine 5 -
Special pension contributions (65) (17)
Cash flow before corporate activity 203 168 +21%
15
* After restructuring costs

Net cash flow summary
£m 2010 2009 Change
Cash flow before corporate activity 203 168 +21%
Corporate activity:Acquisitions (130) (19) Polypipe earnout recovery 8 - Dividend to minority / others (1) (2) Investment by pension fund 49 - Shareholder activity: Dividends (71) (66) Employee share trust purchases (28) 1
Net cash flow 30 82 -63%Opening net (borrowings) (172) (299)
Foreign exchange revaluation (3) 45
Closing net (borrowings) (145) (172) -16%
16
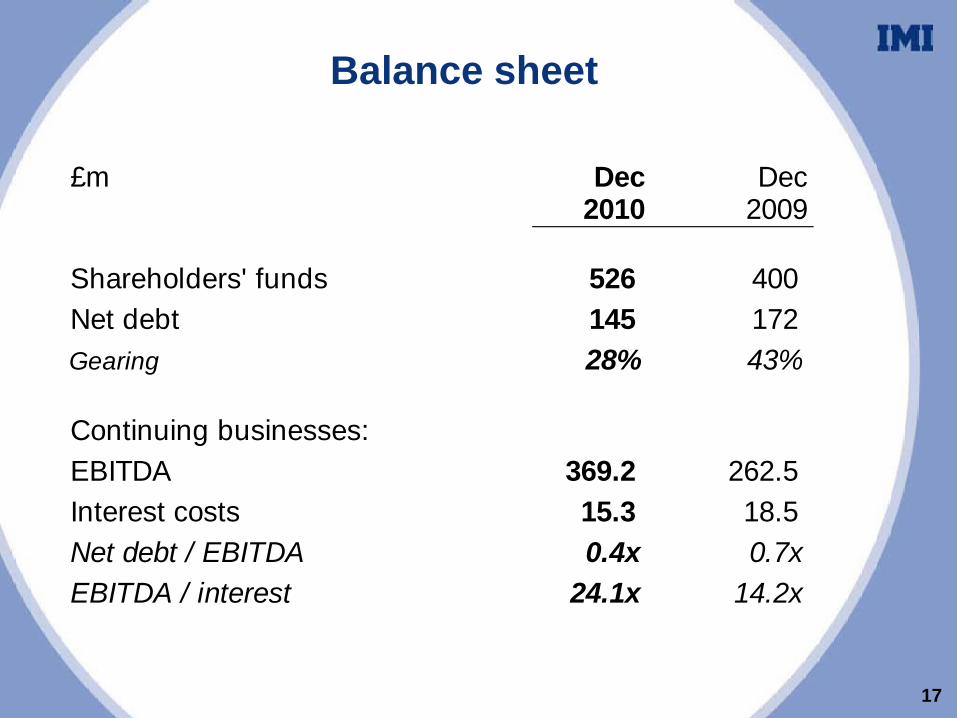
Balance sheet
£m Dec Dec2010 2009
Shareholders' funds 526 400 Net debt 145 172 Gearing 28% 43%
Continuing businesses:EBITDA 369.2 262.5 Interest costs 15.3 18.5 Net debt / EBITDA 0.4x 0.7xEBITDA / interest 24.1x 14.2x
17
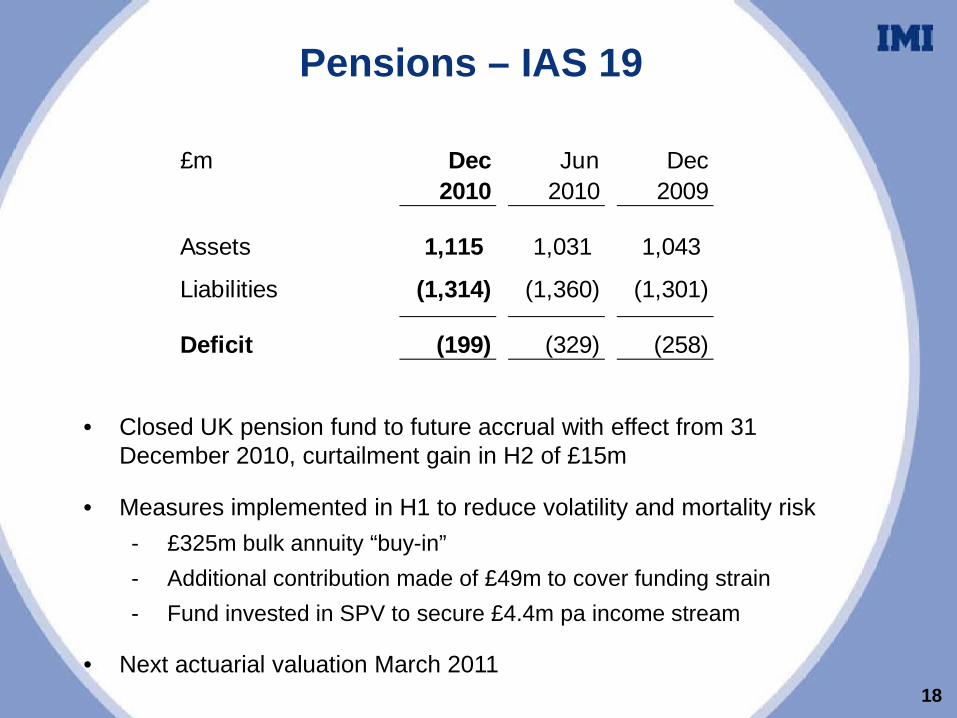
Pensions – IAS 19
• Closed UK pension fund to future accrual with effect from 31 December 2010, curtailment gain in H2 of £15m
• Measures implemented in H1 to reduce volatility and mortality risk- £325m bulk annuity “buy-in”- Additional contribution made of £49m to cover funding strain- Fund invested in SPV to secure £4.4m pa income stream
• Next actuarial valuation March 2011
£m Dec Jun Dec2010 2010 2009
Assets 1,115 1,031 1,043
Liabilities (1,314) (1,360) (1,301)
Deficit (199) (329) (258)
18
19
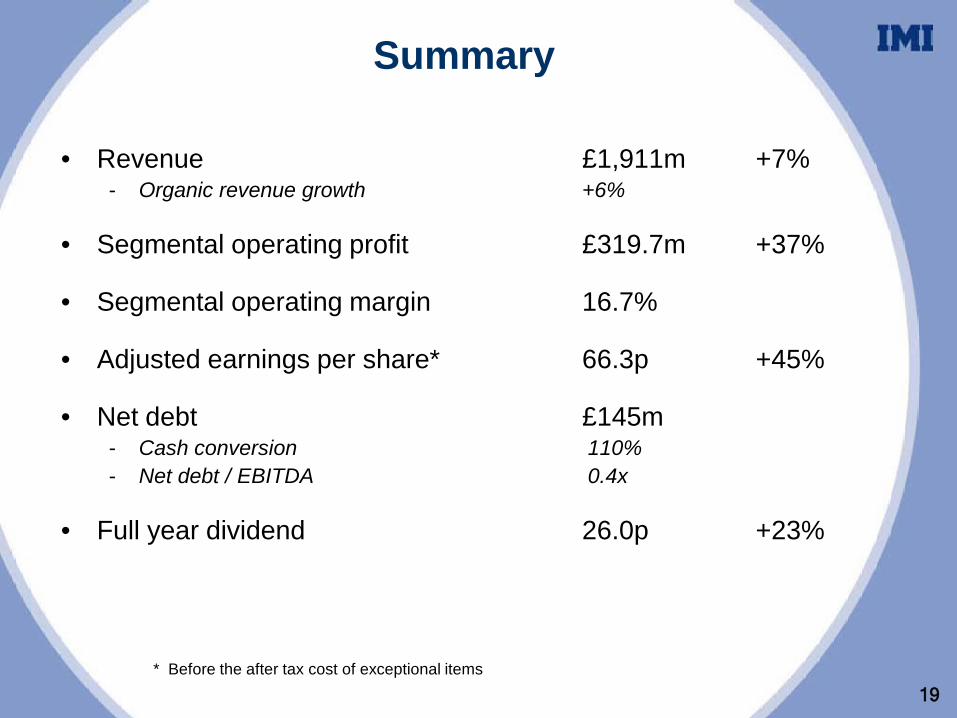
Summary
• Revenue £1,911m +7%- Organic revenue growth +6%
• Segmental operating profit £319.7m +37%
• Segmental operating margin 16.7%
• Adjusted earnings per share* 66.3p +45%
• Net debt £145m - Cash conversion 110%- Net debt / EBITDA 0.4x
• Full year dividend 26.0p +23%
* Before the after tax cost of exceptional items
20
Zimmermann & Jansen
Ian Whiting
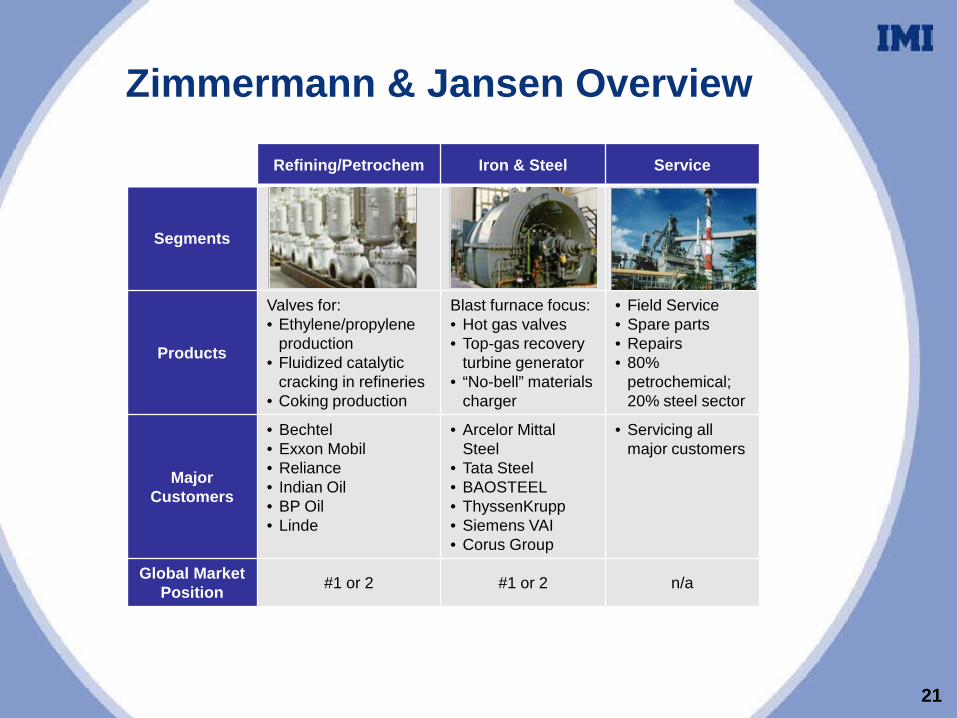
Zimmermann & Jansen Overview
21
Refining/Petrochem Iron & Steel Service
Segments
Products
Valves for:• Ethylene/propylene
production• Fluidized catalytic
cracking in refineries• Coking production
Blast furnace focus:• Hot gas valves• Top-gas recovery
turbine generator• “No-bell” materials
charger
• Field Service• Spare parts• Repairs• 80%
petrochemical; 20% steel sector
Major Customers
• Bechtel• Exxon Mobil• Reliance• Indian Oil• BP Oil• Linde
• Arcelor Mittal Steel
• Tata Steel• BAOSTEEL• ThyssenKrupp• Siemens VAI• Corus Group
• Servicing all major customers
Global Market Position #1 or 2 #1 or 2 n/a
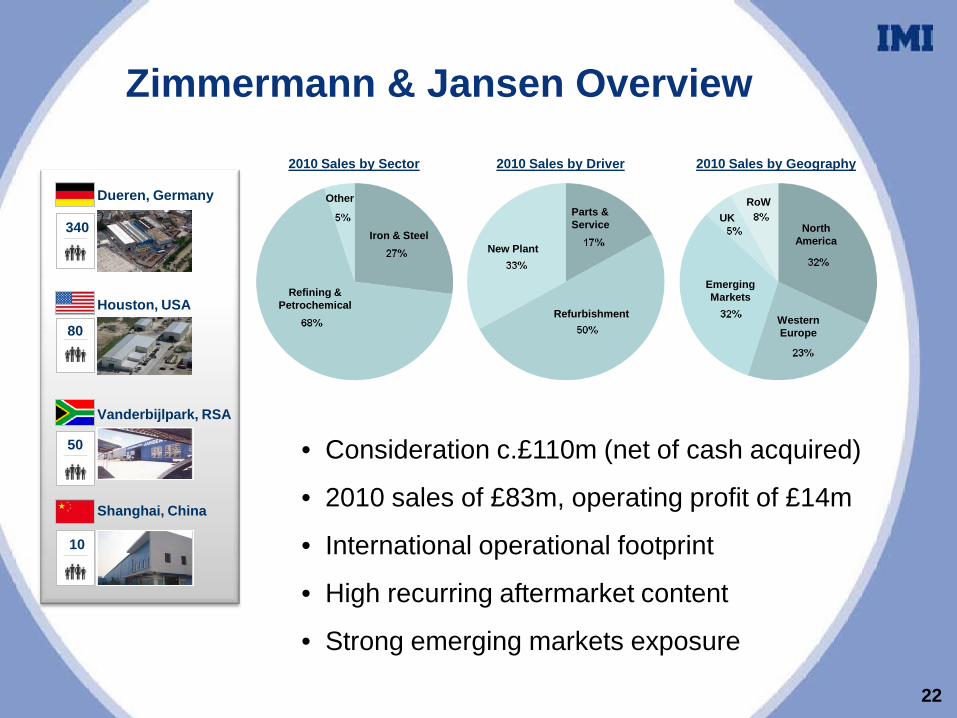
Other
Iron & Steel
Refining & Petrochemical
2010 Sales by Sector
22
340
80
Houston, USA
Dueren, Germany
Vanderbijlpark, RSA
50
Shanghai, China
10
• Consideration c.£110m (net of cash acquired)
• 2010 sales of £83m, operating profit of £14m
• International operational footprint
• High recurring aftermarket content
• Strong emerging markets exposure
Zimmermann & Jansen Overview
UK
Emerging Markets
Western Europe
2010 Sales by Geography2010 Sales by Driver
New Plant
Parts & Service
Refurbishment
RoW
North America
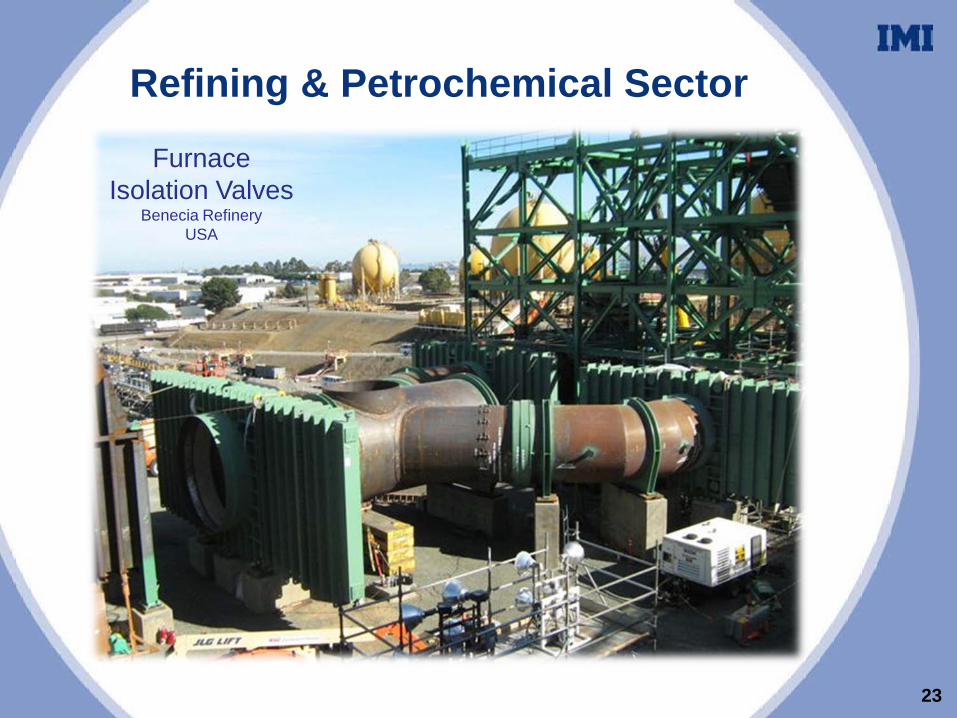
Refining & Petrochemical Sector
23
Furnace Isolation Valves
Benecia RefineryUSA
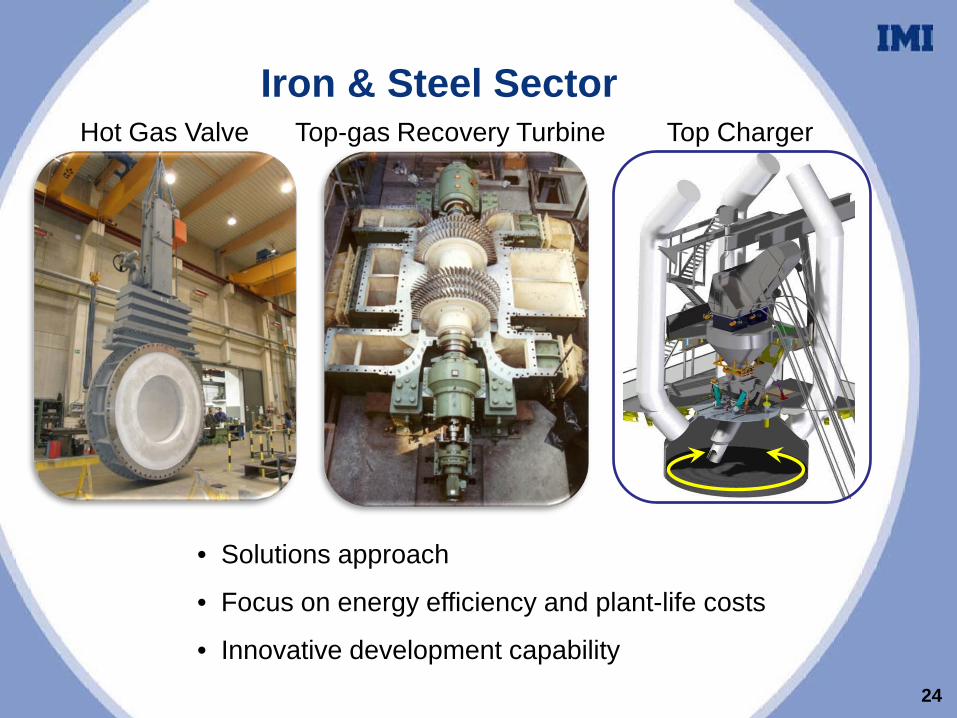
Iron & Steel Sector
24
Hot Gas Valve Top-gas Recovery Turbine Top Charger
• Solutions approach
• Focus on energy efficiency and plant-life costs
• Innovative development capability
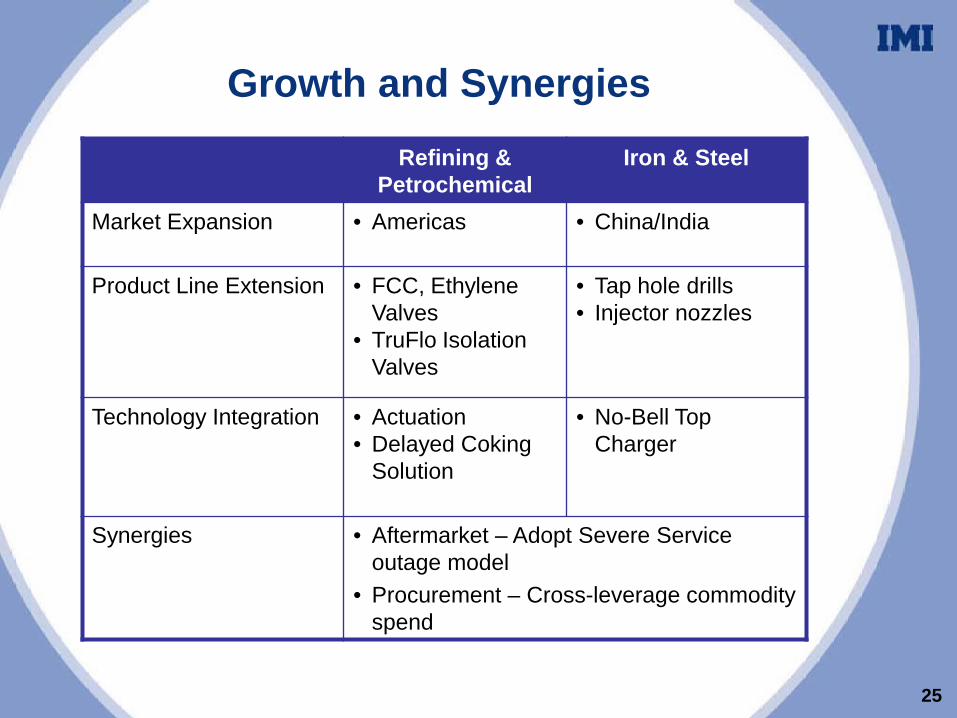
Growth and SynergiesRefining &
PetrochemicalIron & Steel
Market Expansion • Americas • China/India
Product Line Extension • FCC, Ethylene Valves
• TruFlo Isolation Valves
• Tap hole drills• Injector nozzles
Technology Integration • Actuation• Delayed Coking
Solution
• No-Bell Top Charger
Synergies • Aftermarket – Adopt Severe Service outage model
• Procurement – Cross-leverage commodity spend
25
Z&J Summary• Strong fit with IMI Severe Service:
- Global niche markets – Petrochemicals/Iron & Steel
- Strong key account customer relationships- Attractive aftermarket- Strong emerging markets exposure- Industry-leading, custom-engineered solutions- Good new product development pipeline
• Opportunity for IMI to accelerate growth and invest in bolt-on acquisitions
26

27
Martin Lamb
Key Priorities
1. Strategic convergence
2. Growth acceleration
3. Margin improvement
4. Balance sheet utilisation
28

1. Strategic convergence
Fluid TechnologiesMarket Characteristics& core competencies
Growth DriversClimate Change
clean energy/energy efficiency/environmental controlResource Scarcity
process efficiency/labour automationUrbanisation
buildings efficiency/mass transit infrastructureAgeing Population
quality & longevity of life/lifestyle & diet
• Market leadership in Global niches• Blue chip clients supported by
World Class Key Account Mgmt• Customised solutions delivered through
Engineering Advantage• Extensive aftermarket
Precision flow control in critical applications• Valves• Actuators• Controllers & Positioners
29
2. Growth acceleration
• Double sales and engineering resource in selected markets to significantly accelerate emerging markets revenues
• Existing front end resources (sales and engineering) to be targeted at high growth markets
• New product development to be accelerated- targeting 20% of revenues to be generated from new
products less than 3 years old by 2013
30
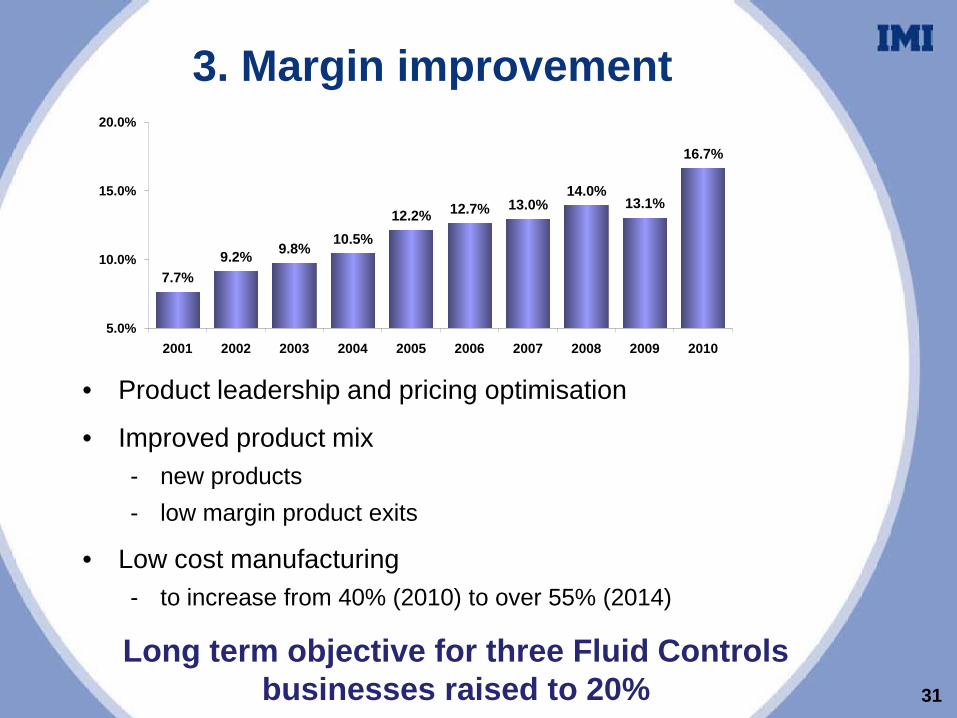
3. Margin improvement
• Product leadership and pricing optimisation
• Improved product mix- new products- low margin product exits
• Low cost manufacturing- to increase from 40% (2010) to over 55% (2014)
31
7.7%9.2% 9.8% 10.5%
12.2% 12.7% 13.0%14.0%
13.1%
16.7%
5.0%
10.0%
15.0%
20.0%
2001 2002 2003 2004 2005 2006 2007 2008 2009 2010
Long term objective for three Fluid Controls businesses raised to 20%
4. Balance sheet utilisation
• Balance sheet capacity- Cash conversion > 90%
- Debt capacity up to 2.5 x EBITDA
• Accelerate acquisitions activity- Increased resource
- Focused on Fluid Controls
- Growth orientation with high exposure to key global trends
- EVA positive after 3 years
32
Investments
• 300 new Key Account Managers over 3 years (200 in emerging markets)
• Smart pricing academy to be established
• 350 new engineers (250 in emerging markets)
• Capex investment to average 1.2x depreciation
• £30m restructuring investment over 2 years to support low cost manufacturing
• Resources focused on acquisitions agenda to double
33
Summary and trading outlook
• Business emerged from last 2 years in excellent shape
• Ready for next stage of development
• Clear plan to:- drive greater strategic convergence- invest for accelerated revenue growth- accelerate acquisitions activity- continue margin improvement
• Group will continue to make good progress in 2011
34
35
Norman Askew
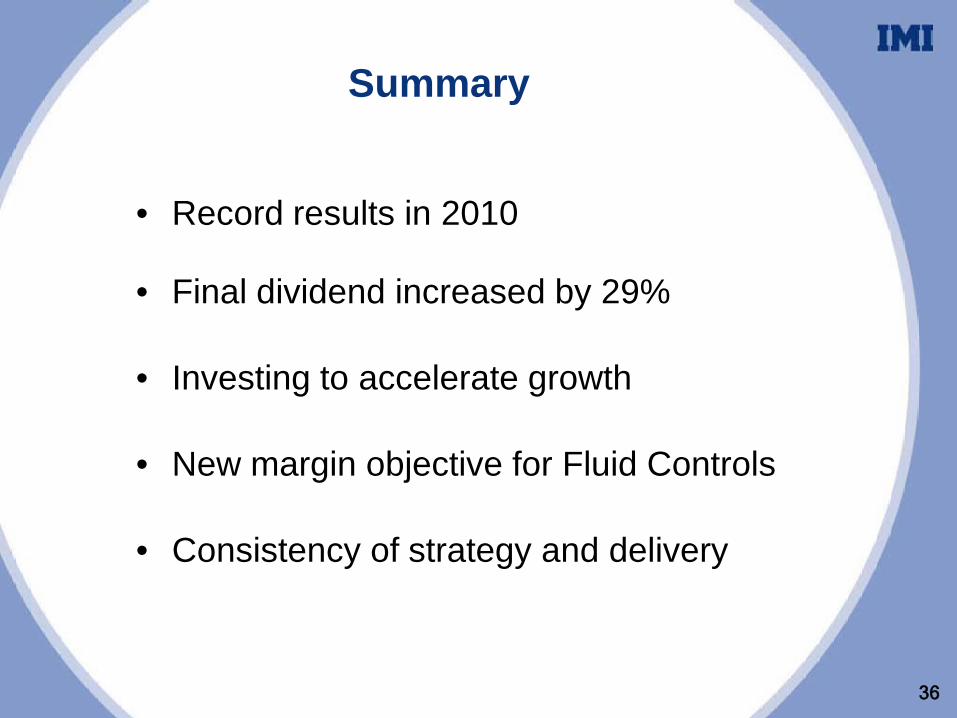
Summary
• Record results in 2010
• Final dividend increased by 29%
• Investing to accelerate growth
• New margin objective for Fluid Controls
• Consistency of strategy and delivery
36

Additional information
37
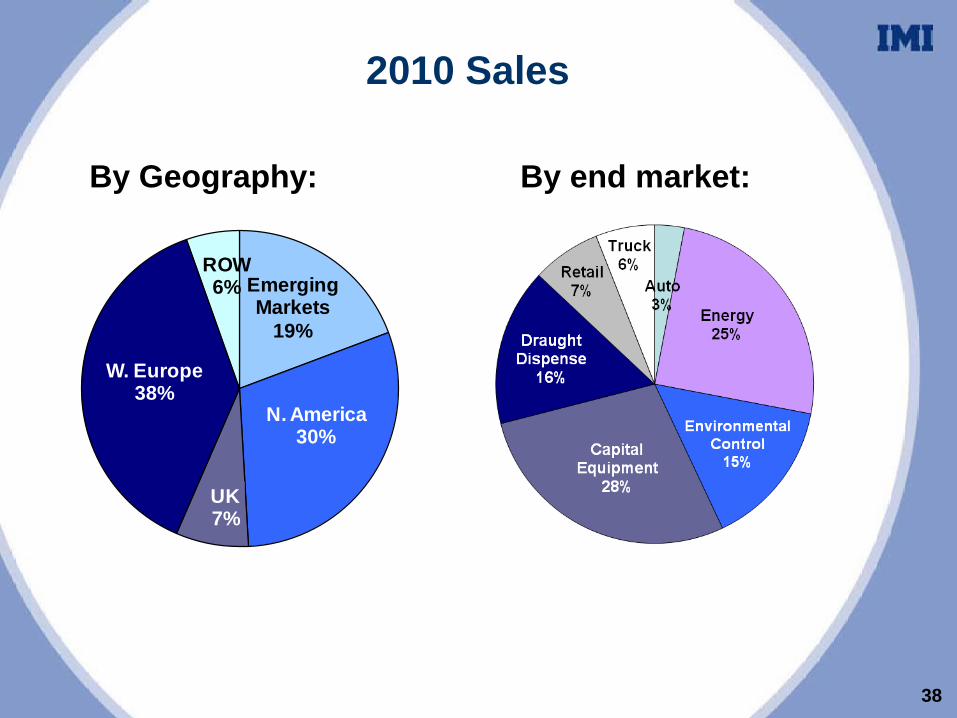
2010 Sales
By Geography: By end market:
38
Emerging Markets
19%
N. America30%
UK7%
W. Europe38%
ROW6%
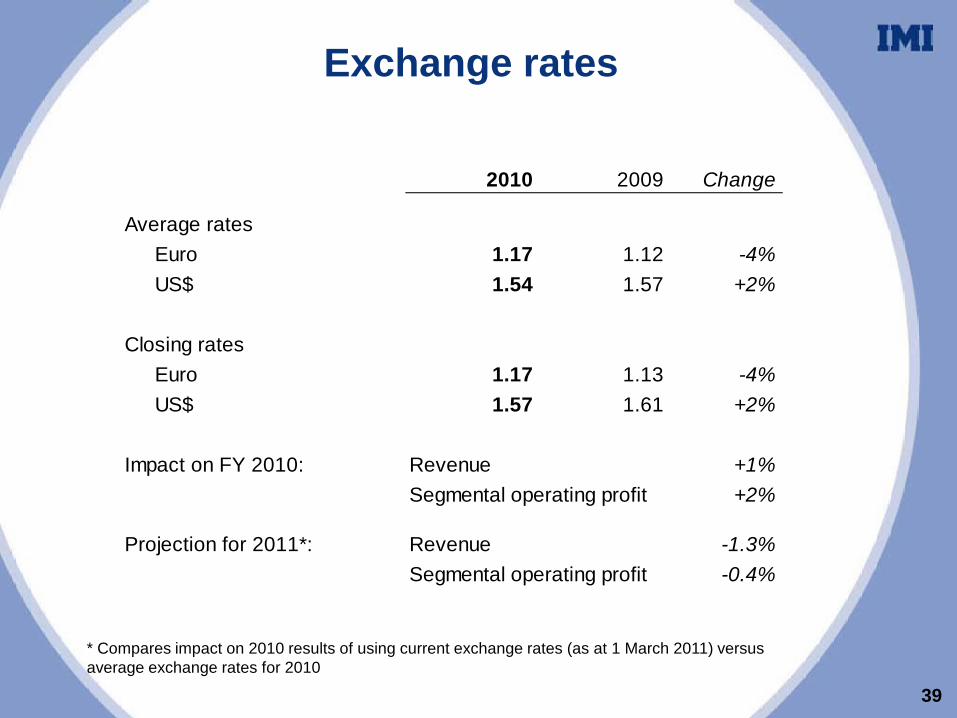
Exchange rates
2010 2009 Change
Average ratesEuro 1.17 1.12 -4%US$ 1.54 1.57 +2%
Closing ratesEuro 1.17 1.13 -4%US$ 1.57 1.61 +2%
Impact on FY 2010: Revenue +1%Segmental operating profit +2%
Projection for 2011*: Revenue -1.3%Segmental operating profit -0.4%
* Compares impact on 2010 results of using current exchange rates (as at 1 March 2011) versus average exchange rates for 2010
39
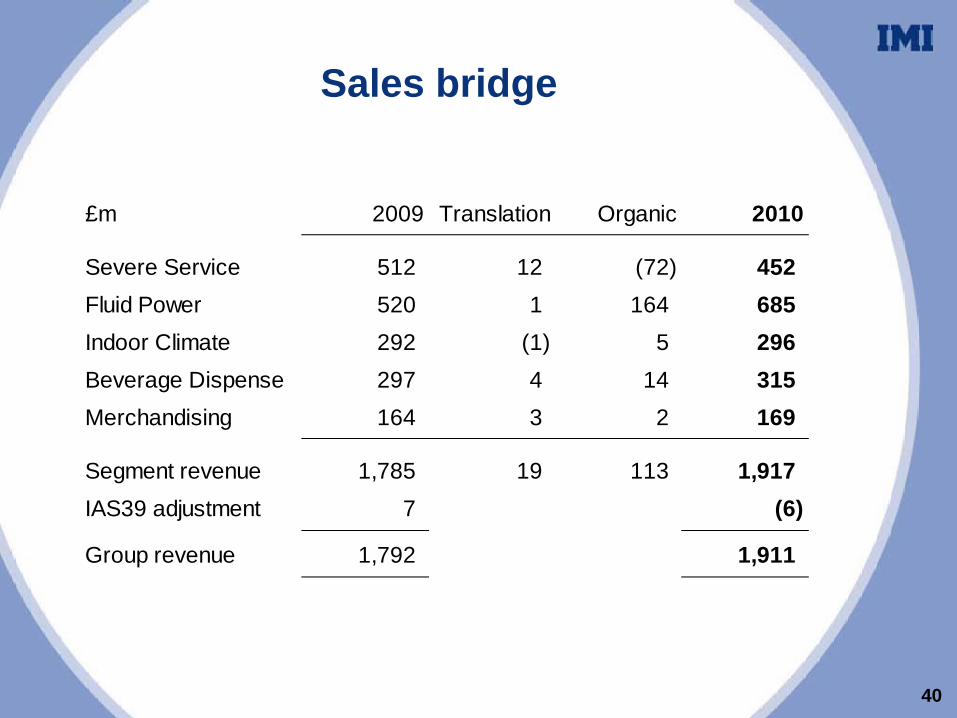
Sales bridge
£m 2009 Translation Organic 2010
Severe Service 512 12 (72) 452 Fluid Power 520 1 164 685 Indoor Climate 292 (1) 5 296 Beverage Dispense 297 4 14 315 Merchandising 164 3 2 169
Segment revenue 1,785 19 113 1,917 IAS39 adjustment 7 (6)
Group revenue 1,792 1,911
40
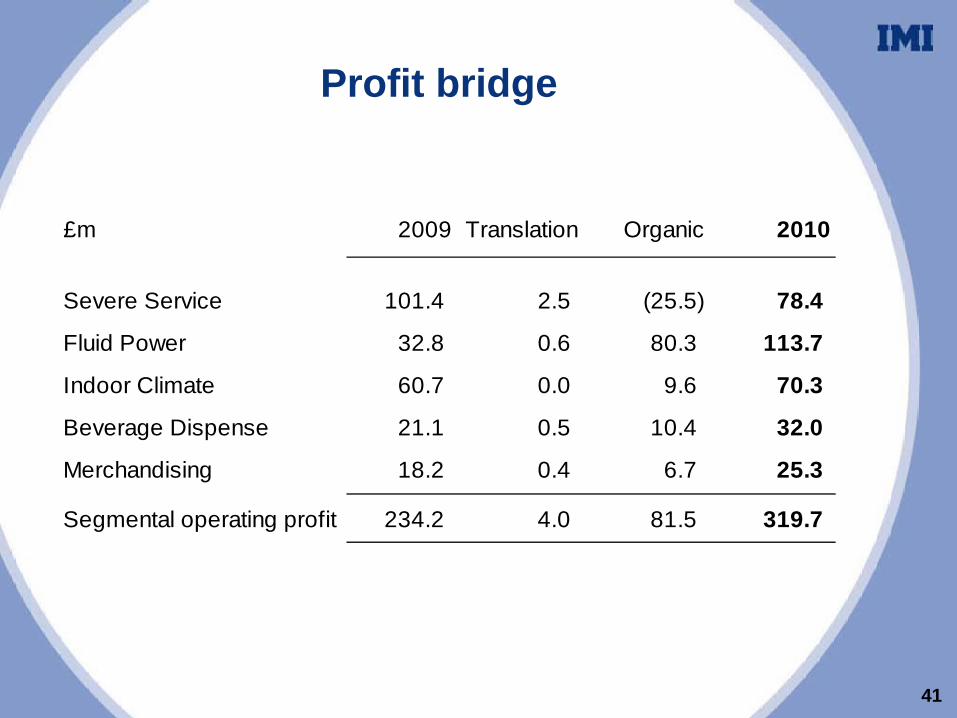
Profit bridge
£m 2009 Translation Organic 2010
Severe Service 101.4 2.5 (25.5) 78.4
Fluid Power 32.8 0.6 80.3 113.7
Indoor Climate 60.7 0.0 9.6 70.3
Beverage Dispense 21.1 0.5 10.4 32.0
Merchandising 18.2 0.4 6.7 25.3
Segmental operating profit 234.2 4.0 81.5 319.7
41
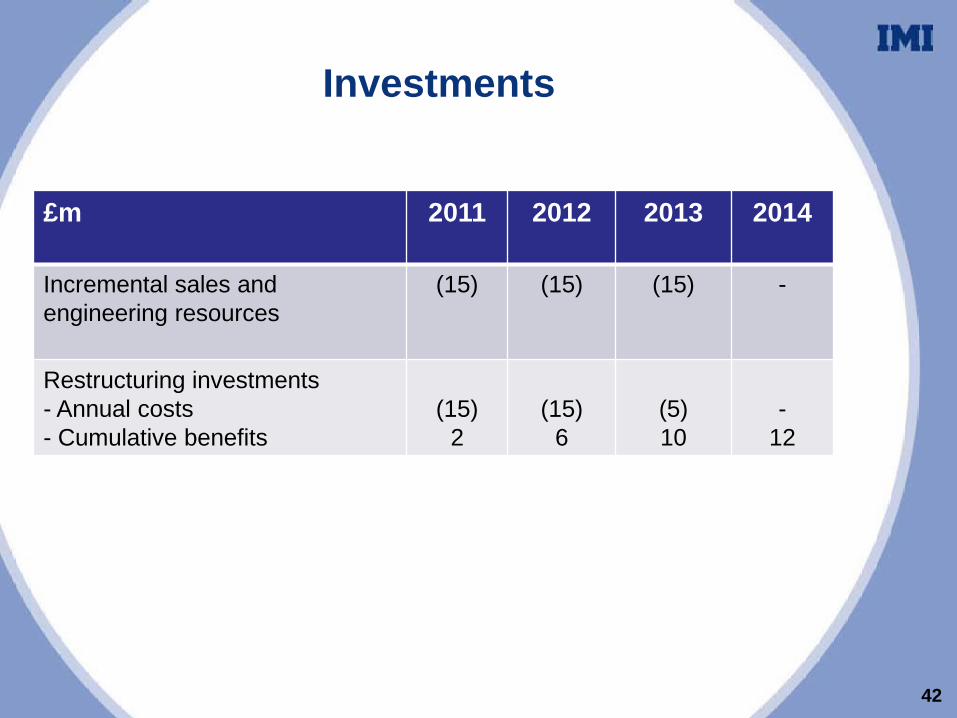
Investments
£m 2011 2012 2013 2014
Incremental sales and engineering resources
(15) (15) (15) -
Restructuring investments - Annual costs- Cumulative benefits
(15)2
(15)6
(5)10
-12
42