2010 Full-Year Results 9 March 2011 - YOOXcdn3.yoox.biz/.../YOOX_Group_2010_Full_Year_Results... ·...
34
2010 Full-Year Results 9 March 2011
Transcript of 2010 Full-Year Results 9 March 2011 - YOOXcdn3.yoox.biz/.../YOOX_Group_2010_Full_Year_Results... ·...

2010 Full-Year Results
9 March 2011
The information contained in this document is confidential and proprietary to YOOX Group
SLIDE 2
DISCLAIMER
This presentation has been prepared by YOOX S.p.A. for information purposes only and for use in presentations of the Group’s results and
strategies.
For further details on the YOOX Group, reference should be made to publicly available information.
Statements contained in this presentation, particularly the ones regarding any possible or assumed future performance of the Group, are or may
be forward looking statements, and in this respect, may involve some risks and uncertainties.
Any reference to past performance of the YOOX Group shall not be taken as an indication of future performance.
This document does not constitute an offer or invitation to purchase or subscribe for any shares and no part of it shall form the basis of or be
relied upon in connection with any contract or commitment whatsoever.
By attending the presentation you agree to be bound by the foregoing terms.

The information contained in this document is confidential and proprietary to YOOX Group
SLIDE 3
TABLE OF CONTENTS
BUSINESS DEVELOPMENTS AND RESULTS HIGHLIGHTS
FY 2010 FINANCIAL ANALYSIS
STRATEGIC GUIDELINES
APPENDIX

The information contained in this document is confidential and proprietary to YOOX Group
SLIDE 4
UPDATE ON BUSINESS DEVELOPMENTS
Multi-brand
yoox.com - launched localised version in Russia in September 2010
thecorner.com - forged an alliance with VOGUE during the Milan Fashion Week
Mono-brand
Launched 7 Online Stores in 2010, bringing to 23 the total number of Online Stores as of Dec. 2010 (vs. 16 OS as of Dec. 2009)
Extended Emporio Armani Online Store to China in November 2010
Extended Diesel Online Store to Japan in February 2011
Extended Marni Online Store to China in March 2011
Signed contract with Adidas for the launch of y-3store.com in Europe, US and Japan by 1Q2011
Signed contract with Bally for the extension of the Online Store to China by 1H2011
Signed contract with Brunello Cucinelli for the launch of brunellocucinelli.com in Europe, US and Japan by 1Q2011
Added Armani Jeans line to emporioarmani.com in February 2010 and C’N’C to costumenational.com in September 2010
Added Jil Sander Navy line to jilsander.com in January 2011 and Just Cavalli to robertocavalli.com in February 2011
Technology Innovations
Launched yoox.com release 9.0 (improved navigation features, CRM and product presentation), yoox.com for iPad, yoox.com for
Japanese mobile platform and Facebook application
Launched thecorner.com release 3.0 (improved navigation features, product presentation and introduced fast checkout)
Added pre-order and 360-degree photo functionality options to Mono-brand business line
International Expansion
Successfully landed in China in November 2010
Operations
Commenced major project to fully automate our central global operations and distribution platform to service future global growth

The information contained in this document is confidential and proprietary to YOOX Group
SLIDE 5
OUR MONO-BRAND PARTNERS
marni.com
emporioarmani.com
diesel.com
cpcompany.com
stoneisland.com
valentino.com
misssixty.com
costumenational.com
energie.it
moschino.com
emiliopucci.com
bally.com
dolcegabbana.com
dsquared2.com
jilsander.com
robertocavalli.com
giuseppezanottidesign.com
napapijri.com
albertaferretti.com
zegna.com
coccinelle.com
zeishouse.com
maisonmartinmargiela.com
y-3store.com
2006
2007
2008
2009
2010
2011
…
BRANDS’ LINES
BRANDS’ LINES
brunellocucinelli.com

The information contained in this document is confidential and proprietary to YOOX Group
SLIDE 6
2010 RESULTS HIGHLIGHTS
Key Performance Indicators
8.6m monthly unique visitors (vs. 6.4m in 2009)
1,523 thousand orders (vs. 1,148 thousand in 2009)
Average Order Value of €179 (vs. €170 in 2009)
612 thousand active customers (vs. 478 thousand in 2009)
Key Financials
Net Revenues at €214.3m, +40.8% (vs. €152.2m in 2009)
Increased contribution from Mono-brand, which showed strong growth, both from existing and from new stores, and now
accounts for 23.6% of Net Revenues (vs. 18.4% in 2009)
Increased contribution from international markets, which now account for 75.1%1 of Net Revenues (vs. 72.2%1 in 2009)
EBITDA Excluding Incentive Plan Costs at €22.5m, +35.1% (vs. €16.6m in 2009)
EBIT at €15.0m, +69.8% (vs.€8.8m in 2009)
Net Income at €9.1m, +122.5% (vs. €4.1m in 2009)
Net Cash at €22.8m (vs. €34.0m of Net Cash at Dec. 2009)
1. Excludes Not Country Related
The information contained in this document is confidential and proprietary to YOOX Group
SLIDE 7
TABLE OF CONTENTS
BUSINESS DEVELOPMENTS AND RESULTS HIGHLIGHTS
FY 2010 FINANCIAL ANALYSIS
STRATEGIC GUIDELINES
APPENDIX
The information contained in this document is confidential and proprietary to YOOX Group
SLIDE 8
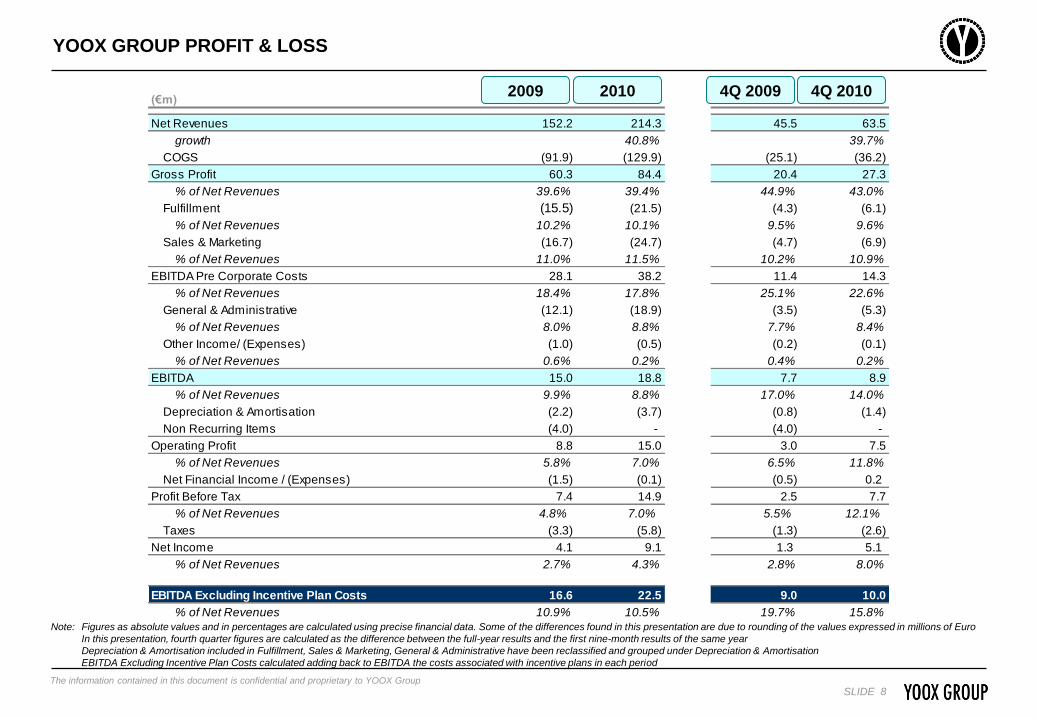
YOOX GROUP PROFIT & LOSS
Note: Figures as absolute values and in percentages are calculated using precise financial data. Some of the differences found in this presentation are due to rounding of the values expressed in millions of Euro
In this presentation, fourth quarter figures are calculated as the difference between the full-year results and the first nine-month results of the same year
Depreciation & Amortisation included in Fulfillment, Sales & Marketing, General & Administrative have been reclassified and grouped under Depreciation & Amortisation
EBITDA Excluding Incentive Plan Costs calculated adding back to EBITDA the costs associated with incentive plans in each period
4Q 20092009 2010 4Q 2010(€m)
Net Revenues 152.2 214.3 45.5 63.5
growth 50.0% 40.8% 52.9% 39.7%
COGS (91.9) (129.9) (25.1) (36.2)
Gross Profit 60.3 84.4 20.4 27.3
% of Net Revenues 39.6% 39.4% 44.9% 43.0%
Fulfillment (15.5) (21.5) (4.3) (6.1)
% of Net Revenues 10.2% 10.1% 9.5% 9.6%
Sales & Marketing (16.7) (24.7) (4.7) (6.9)
% of Net Revenues 11.0% 11.5% 10.2% 10.9%
EBITDA Pre Corporate Costs 28.1 38.2 11.4 14.3
% of Net Revenues 18.4% 17.8% 25.1% 22.6%
General & Administrative (12.1) (18.9) (3.5) (5.3)
% of Net Revenues 8.0% 8.8% 7.7% 8.4%
Other Income/ (Expenses) (1.0) (0.5) (0.2) (0.1)
% of Net Revenues 0.6% 0.2% 0.4% 0.2%
EBITDA 15.0 18.8 7.7 8.9
% of Net Revenues 9.9% 8.8% 17.0% 14.0%
Depreciation & Amortisation (2.2) (3.7) (0.8) (1.4)
Non Recurring Items (4.0) - (4.0) -
Operating Profit 8.8 15.0 3.0 7.5
% of Net Revenues 5.8% 7.0% 6.5% 11.8%
Net Financial Income / (Expenses) (1.5) (0.1) (0.5) 0.2
Profit Before Tax 7.4 14.9 2.5 7.7
% of Net Revenues 4.8% 7.0% 5.5% 12.1%
Taxes (3.3) (5.8) (1.3) (2.6)
Net Income 4.1 9.1 1.3 5.1
% of Net Revenues 2.7% 4.3% 2.8% 8.0%
EBITDA Excluding Incentive Plan Costs 16.6 22.5 9.0 10.0
% of Net Revenues 10.9% 10.5% 19.7% 15.8%

The information contained in this document is confidential and proprietary to YOOX Group
SLIDE 9
170
179
2009 2010
4.05.0
2.4
3.6
2009 2010
478
612
2009 2010
KEY PERFORMANCE INDICATORS
1,148
1,523
2009 2010
Monthly Unique Visitors (m)¹
Active Customers2 (‘000) – Group3
# Orders (‘000) - Group
Average Order Value (€) - Group
1. Source: HBX 1/1/09-19/03/09 and SiteCatalyst since19/03/09 for yoox.com; Google Analytics for thecorner.com and the Online Stores
2. Active Customer is defined as a customer who placed at least one order in the 12 preceding months
3. Include Active Customers of Online Stores
2009 2010
6.4
8.6
2009 2010
2009 2010 2009 2010
Multi-brand Mono-brand
The information contained in this document is confidential and proprietary to YOOX Group
SLIDE 10
4Q09 4Q10
2009 2010
76.4%
23.6%
81.6%
18.4% 22.2%
77.8%
25.0%
75.0%
34.6%
57.7%
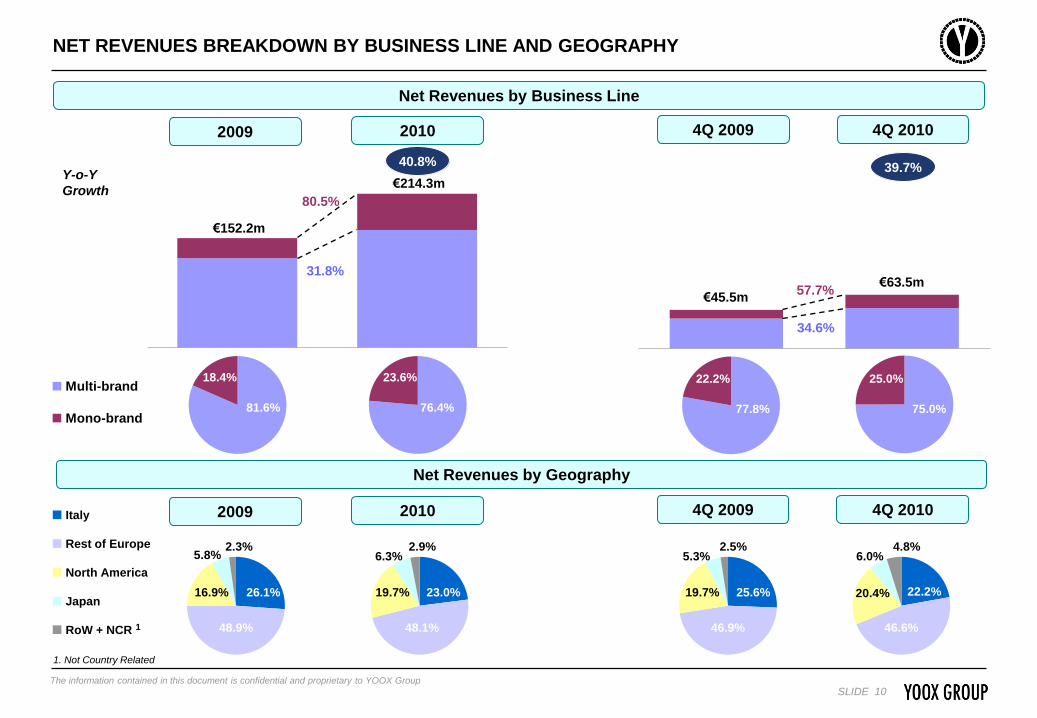
NET REVENUES BREAKDOWN BY BUSINESS LINE AND GEOGRAPHY
Net Revenues by Business Line
2009 2010
40.8%
4Q 2009 4Q 2010
39.7%
Net Revenues by Geography
Y-o-Y
Growth
31.8%
80.5%
€45.5m€63.5m
4Q 2009 4Q 20102009 2010
1. Not Country Related
48.1%
19.7% 23.0%
6.3%2.9%
46.9%
19.7% 25.6%
5.3%2.5%
46.6%
20.4% 22.2%
6.0%4.8%
48.9%
16.9% 26.1%
5.8%2.3%
€152.2m
€214.3m
Italy
Rest of Europe
North America
Japan
RoW + NCR 1
Multi-brand
Mono-brand
The information contained in this document is confidential and proprietary to YOOX Group
SLIDE 11
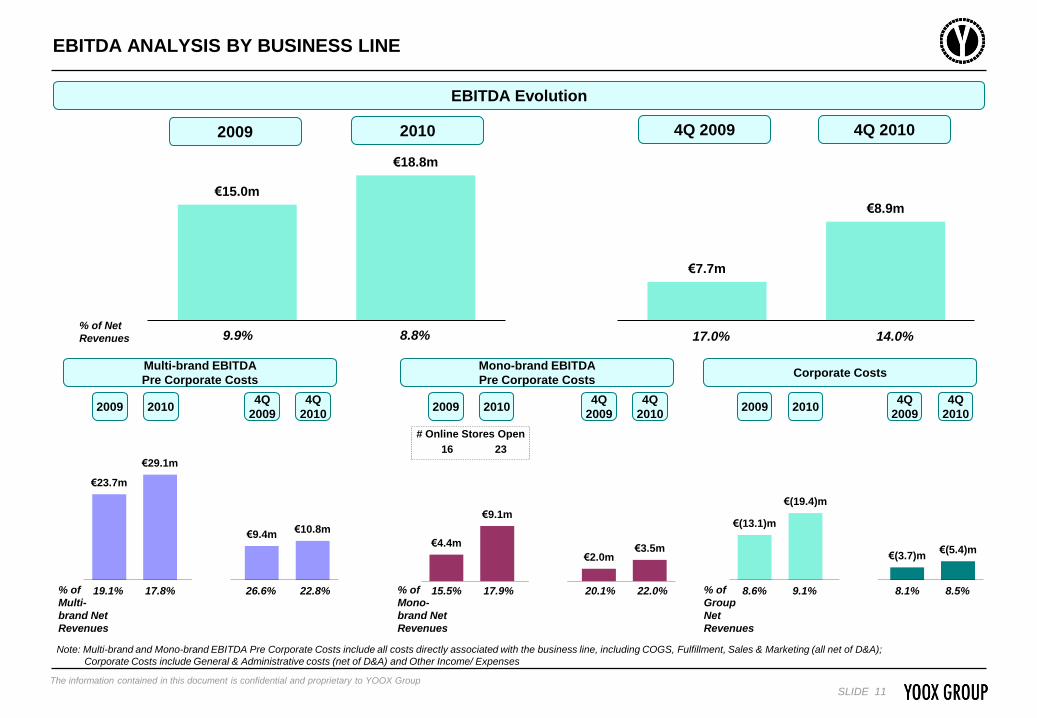
€(13.1)m
€(19.4)m
€(3.7)m€(5.4)m
2009 2010 GAP 4Q2009 4Q2010
€4.4m
€9.1m
€2.0m€3.5m
2009 2010 GAP 4Q2009 4Q2010
€23.7m
€29.1m
€9.4m€10.8m
2009 2010 GAP 4Q2009 4Q2010
EBITDA ANALYSIS BY BUSINESS LINE
# Online Stores Open
16 23
Note: Multi-brand and Mono-brand EBITDA Pre Corporate Costs include all costs directly associated with the business line, including COGS, Fulfillment, Sales & Marketing (all net of D&A);
Corporate Costs include General & Administrative costs (net of D&A) and Other Income/ Expenses
% of Net
Revenues
Multi-brand EBITDA
Pre Corporate CostsCorporate Costs
Mono-brand EBITDA
Pre Corporate Costs
% of
Multi-
brand Net
Revenues
22.8%19.1% 17.8% 26.6%
9.9% 8.8% 17.0% 14.0%
% of
Mono-
brand Net
Revenues
% of
Group
Net
Revenues
2009 2010
22.0%15.5% 17.9% 20.1% 8.5%8.6% 9.1% 8.1%
2009 2010 2009 20104Q
2009
4Q
2010
4Q
2009
4Q
2010
4Q
2009
4Q
2010
€15.0m
€18.8m
2009 2010
EBITDA Evolution
2009 2010
€7.7m
€8.9m
4Q2009 4Q2010
4Q 2009 4Q 2010

The information contained in this document is confidential and proprietary to YOOX Group
SLIDE 12
YOOX GROUP SUMMARY BALANCE SHEET
20102009
(€m)
Net Working Capital 9.8 24.8
Non Current Assets 10.9 21.5
Non Current Liabilities (excl. financial liabilities) (0.6) (0.4)
Total 20.1 45.9
Net Financial Debt / (Net Cash) (34.0) (22.8)
Shareholders' Equity 54.1 68.7
Total 20.1 45.9

The information contained in this document is confidential and proprietary to YOOX Group
SLIDE 13
(€m)
Inventories 38.7 47.1 76.3
Trade Receivables 3.9 6.7 9.4
Trade Payables (17.3) (27.3) (48.9)
Other Receivables / (Payables) (2.7) (16.8) (12.0)
Net Working Capital 22.6 9.8 24.8
as % of Net Revenues 22.3% 6.4% 11.6%
NET WORKING CAPITAL EVOLUTION
2010
Inventory Level Evolution
20092008
Net Working Capital
1. FY2009 Net Working Capital impacted by extraordinary items related to IPO and stock option exercise: adjusted Net Working Capital amounts to €16.9m, corresponding to 11.1% of Net Revenues
44.9%
37.9%
46.6%
38.1%
30.9%35.6%
2008 2009 2010
Inventories as % of Multi-brand Net Revenues Inventories as % of Group Net Revenues
Increase in Inventories mainly related to increase in
stock needed to support future growth of Multi-brand line
and to earlier deliveries of 2011 Spring/Summer
collection at the Group’s logistics centres. 84.3% of
stock is related to merchandise either available online as
of Dec. 2010 or related to following collections (vs.
82.7% as of Dec. 2009)
1
Increase in Trade Payables - mainly related to extension
of payment terms with suppliers and to earlier deliveries
of 2011 S/S - partly offsets increase in Inventories

The information contained in this document is confidential and proprietary to YOOX Group
SLIDE 14
FY09 Net Cash FY09 Corporate Taxes
FY10 Prepaid Income Taxes
Taxes related to Stock Options Ex.
IPO Costs Restated Cash Flow
from Operations
Capex Stock Option Proceeds
Others FY10 Net Cash
YOOX GROUP NET FINANCIAL POSITION EVOLUTION
Net Financial Position Evolution
1. Excludes FY09 Corporate Taxes, FY10 Prepaid Income Taxes, Taxes related to Stock Option exercise and IPO Costs
2. Stock options exercised and cashed in during FY2010
3. Share buy back
1
2
3
2009 2010(€m)
Cash and Cash Equivalents (35.0) (24.2)
Other Current Financial Assets (0.0) (5.1)
Current Financial Assets (35.0) (29.3)
Current Financial Liabilities 0.3 5.6
Long Term Financial Liabilities 0.7 0.8
Net Financial Debt / (Net Cash) (34.0) (22.8)
€12.2m €2.0m
€(34.0)m €(3.3)m
€(2.8)m€(3.1)m
€(3.5)m
€(12.3)m
€(0.4)m €(22.8)m
Non comparable with previous year
Extraordinary items
Net Financial Position

The information contained in this document is confidential and proprietary to YOOX Group
SLIDE 15
€3.4m
€12.3m
€1.1m
€6.7m
YOOX GROUP CASH FLOW STATEMENT
2009 20104Q 2009 4Q 2010
Capital Expenditure
2009 2010
Include payments of: €3.5m related
to IPO costs, tax liabilities of €3.1m
related to stock option exercise by
people for which YOOX acted as
withholding agent, €3.3m related to
FY09 corporate tax liabilities and
€2.8m related to FY10 income taxes
% of Net Revenues 2.2% 5.8% 2.5% 10.6%
Cash Flow Statement
4Q 2009 4Q 2010
4Q10 capital expenditure includes
€3.5m related to automation of global
operations and distribution platform
(€m)
Cash and Cash Equivalents at Beginning of Period 10.9 11.1 9.0 35.0
Cash Flow from Operations 14.1 8.5 18.4 (0.5)
Cash Flow from Investment Activities (1.0) (6.4) (2.1) (11.5)
Sub Total 13.1 2.1 16.4 (12.0)
Cash Flow from Financing Activities 11.0 11.0 9.7 1.2
Cash Flow 24.1 13.1 26.0 (10.8)
Cash and Cash Equivalents at End of Period 35.0 24.2 35.0 24.2

The information contained in this document is confidential and proprietary to YOOX Group
SLIDE 16
TABLE OF CONTENTS
BUSINESS DEVELOPMENTS AND RESULTS HIGHLIGHTS
FY 2010 FINANCIAL ANALYSIS
STRATEGIC GUIDELINES
APPENDIX
The information contained in this document is confidential and proprietary to YOOX Group
SLIDE 17
OUR VISION
The Global Internet Retailing Partner for Leading
Fashion & Design Brands

The information contained in this document is confidential and proprietary to YOOX Group
SLIDE 18
Translate strong growth into increased profitability and cash flow generation
Continue to develop state-of-the-art logistics and technology platforms
Further expand globally, with strong focus on China to leverage the first-mover advantage
Grow to 50 online stores by 2015, powering the world’s leading fashion and design players
OUR 2011-2015 TARGETS
Increase the proportion of in-season offering within the product assortment mix
Nearly half of the Group’s Net Revenues from in-season by 2015
Higher Average Order Value (AOV)

The information contained in this document is confidential and proprietary to YOOX Group
SLIDE 19
GROW TO 50 ONLINE STORES BY 2015, POWERING THE WORLD’S LEADING FASHION AND
DESIGN PLAYERS
By 2015 YOOX Group will manage 50 online stores, including...
Multi-brand Mono-brand
What the Growth Strategy will rely on…
Increasing the proportion of in-season offering within
the product assortment mix
Increasing the assortment depth of a few selected
existing categories
New categories within fashion and design
Strengthening and expanding relationships with
existing commercial partners
New commercial partnerships, by leveraging the
Group’s global platform
Maintaining a strong pipeline of new openings
approx. 5-6 new brands per year
Focus on China with approx. 3-4 launches per year
(either as extensions of existing partnerships or as
new partnerships)
Growth of the existing Online Stores (by further
increasing the brands’ portion of e-commerce sales)
Implementation of a selective approach in the
identification and development of new strategic
partnerships and in the renewal of existing ones
The information contained in this document is confidential and proprietary to YOOX Group
SLIDE 20
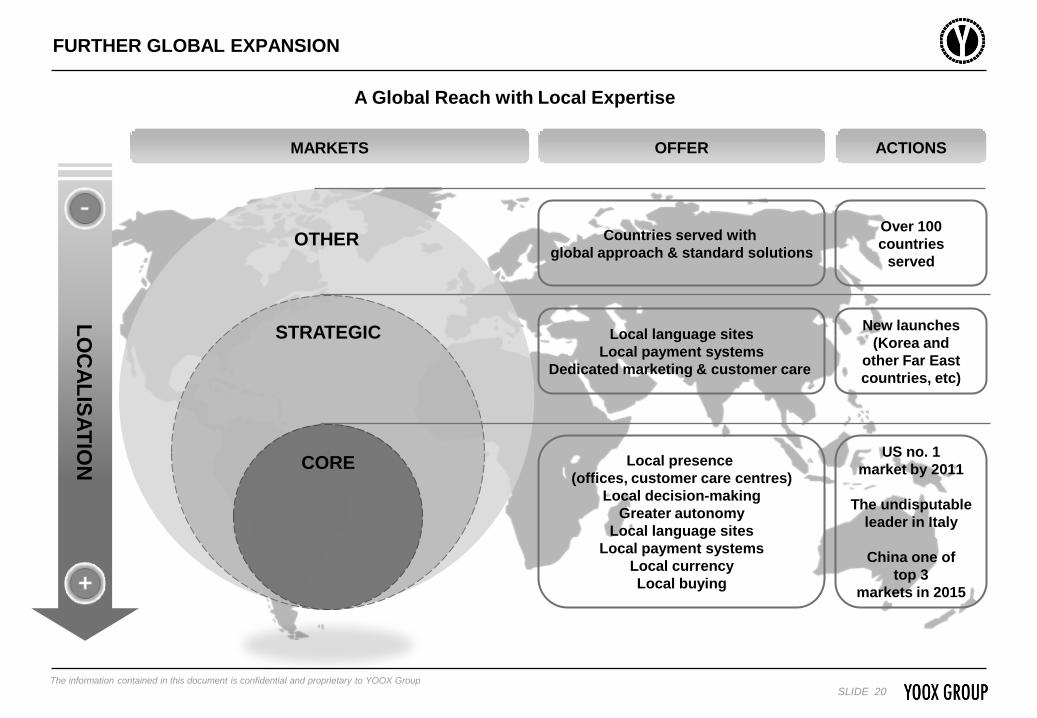
FURTHER GLOBAL EXPANSION
ACTIONSMARKETS
Countries served with
global approach & standard solutions
Local language sites
Local payment systems
Dedicated marketing & customer care
Local presence
(offices, customer care centres)
Local decision-making
Greater autonomy
Local language sites
Local payment systems
Local currency
Local buying
Over 100
countries
served
New launches
(Korea and
other Far East
countries, etc)
US no. 1
market by 2011
The undisputable
leader in Italy
China one of
top 3
markets in 2015
OTHER
STRATEGIC
CORE
OFFER
A Global Reach with Local Expertise
LO
CA
LIS
AT
ION

The information contained in this document is confidential and proprietary to YOOX Group
SLIDE 21
FURTHER GLOBAL EXPANSION - CHINA
ALREADY THE WORLD’S BIGGEST
ONLINE POPULATION
( 300 M INTERNET USERS IN 20101)
ALREADY THE WORLD’S
SECOND LARGEST MARKET3
THE WORLD’S
YOUNGEST MARKET
WITH 80% OF CONSUMERS
UNDER 454
1. 296m internet users in China in 2010. Source: “Online Retail Forecast, 2010 to 2015, Asia Pacific”, Forrester Research Inc., 15 October 2010
2. 278m internet buyers in China in 2015 and 310m of US citizens in 2010. Source: “Online Retail Forecast, 2010 to 2015, Asia Pacific”, Forrester Research Inc., 15 October 2010 and “Online Retail Forecast,
2010 to 2015, US”, Forrester Research Inc., 18 January 2011
3. Source: Li & Fung Research Centre, China Distribution & Trading, Issue 66, June 2010, based on World Luxury Association (WLA)
4. Source: “The Coming of Age, China’s new class of wealthy consumers”, Insights China by Mckinsey&Company
POSITIONED FOR
LONG-TERM GROWTH
AT THE CONVERGENCE
OF TWO MEGA TRENDS
NO. OF ONLINE BUYERS
EXPECTED TO ALMOST REACH
TOTAL CURRENT US POPULATION
IN 2015 ( 300 M)1,2
First Mover in the World’s Fastest Growing Market

The information contained in this document is confidential and proprietary to YOOX Group
SLIDE 22
FURTHER GLOBAL EXPANSION - CHINA, THE STRATEGIC PLAN
Provides our mono-brand
partners with a double
shopping-window to show and
sell the same products
available on their Online Stores
and in our local warehouse
In addition to the Online Stores’
brands, hosts an accurate
selection of cutting-edge
designers appealing to Chinese
customers
Helps our partners minimise risk
of local end-of-season inventory
through a reliable channel that
doesn’t dilute their brands’
image
MISSION: The official Internet retailing partner in China for leading fashion brands
POSITIONING: Start with in-season offering, excellent customer service and a superior shopping experience
OBJECTIVE: Support the Group’s long-term growth
2H2011…
2012…
emporioarmani.cn (Nov. 10) marni.cn in 1Q11 & bally.cn by 1H11…
Extend existing partnerships
and develop new agreements
with leading fashion houses by
powering their Online Stores in
a market with high growth
potential
Strong pipeline of new
openings
The information contained in this document is confidential and proprietary to YOOX Group
SLIDE 23
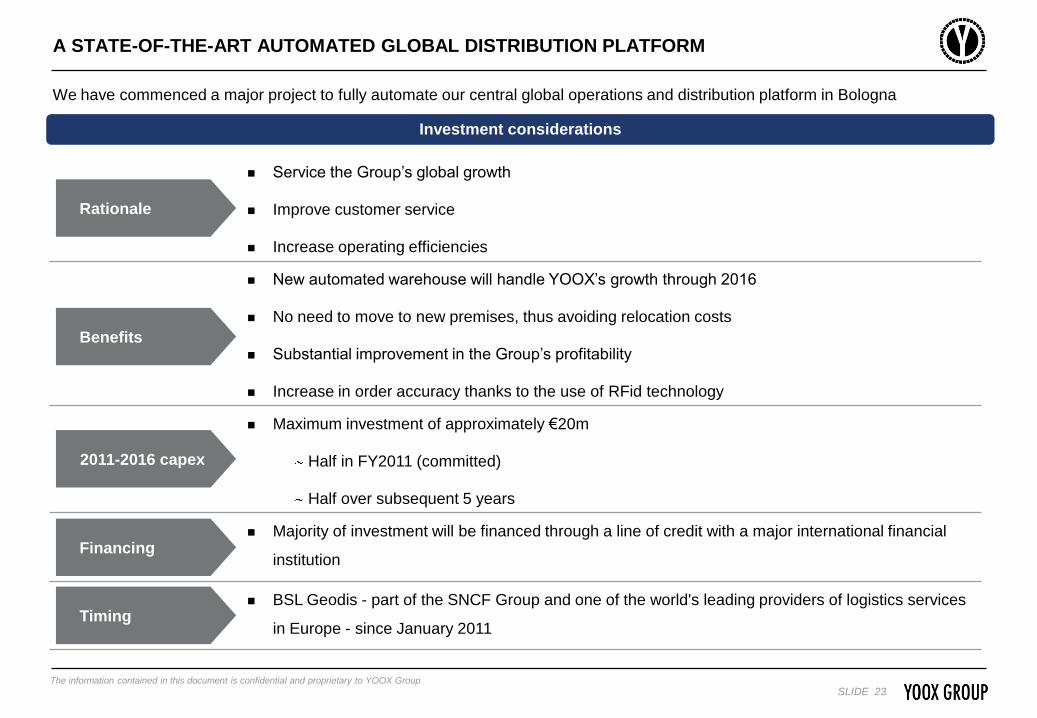
A STATE-OF-THE-ART AUTOMATED GLOBAL DISTRIBUTION PLATFORM
We have commenced a major project to fully automate our central global operations and distribution platform in Bologna
Service the Group’s global growth
Improve customer service
Increase operating efficiencies
New automated warehouse will handle YOOX’s growth through 2016
No need to move to new premises, thus avoiding relocation costs
Substantial improvement in the Group’s profitability
Increase in order accuracy thanks to the use of RFid technology
Maximum investment of approximately €20m
Half in FY2011 (committed)
Half over subsequent 5 years
Majority of investment will be financed through a line of credit with a major international financial
institution
BSL Geodis - part of the SNCF Group and one of the world's leading providers of logistics services
in Europe - since January 2011
Rationale
Benefits
2011-2016 capex
Financing
Timing
Investment considerations

The information contained in this document is confidential and proprietary to YOOX Group
SLIDE 24
GLOBAL OPERATIONS
Headquarters in Italy
1. Refers to Multi-brand business line
2. Full set-up of digital production facilities by first half of 2011
4 Digital Production FacilitiesItaly, US, Japan, China2
4 Logistics Centres strategically located, guaranteeing best-in-class service to all major fashion marketsItaly, US, Japan, China
9 languages
5 currencies
6 Local OfficesItaly, US, Japan, France, Spain, China
8 Customer Care Centres
1 order processed every 21 seconds
99% of deliveries on time1

The information contained in this document is confidential and proprietary to YOOX Group
SLIDE 25
A PROVEN PROPRIETARY TECHNOLOGY PLATFORM TAILORED TO ONLINE FASHION
TE
CH
NO
LO
GY
PL
AT
FO
RM
Scalable
&
Reliable
Flexible
with
Depth & Speed
Multi-Market
Multi-tenant platform capable of accommodating well over 50 online stores by 2015
Service-oriented architecture
Cloud Technology (initially for multi-channel and digital asset management)
Capable of accommodating Multi-brand and Mono-brand formats
Integration with best-of-breed technology solutions
End-to-end tools and solutions fully integrated to support logistics and customer care processes
Easy to localise & Far East ready (language, payments & logistics)
Consolidated expertise, technology and solutions to enable fast entry into new geographical markets
Innovation
& Ability to Capture
New Opportunities
Multi-channel enabled - desktop, mobile devices (iPhone, Android, Keitai, Blackberry, etc) and tablets (iPad)
Leverage product presentation solutions, such as videos, to increase customer engagement and conversion
Internal research and scouting of early-stage technology solutions to enable fast innovation
Customer-
Oriented
Investment in CRM solutions to increase retention, customer engagement and cross-selling opportunities
Leverage a vast amount of data and Business Intelligence to improve interaction with our customers

The information contained in this document is confidential and proprietary to YOOX Group
SLIDE 26
TRANSLATE GROWTH INTO INCREASED PROFITABILITY AND CASH FLOW GENERATION
Increase in Operating Cash Flow Generation
Leverage economies of scale thanks to increasing critical mass, supported by a scalable business model
Exploit synergies between Mono-brand and Multi-brand business lines
Improve operational efficiencies
Manage working capital effectively, leveraging on
Increasing contribution from in-season offering (mainly on consignment)
Reduction in production lead times

The information contained in this document is confidential and proprietary to YOOX Group
SLIDE 27
HOW CAN WE REACH OUR GOALS?
By Continuing to Invest in …
DREAM TEAM
Fostering culture of innovation and quality
Promoting growth of young talents and “YOOX School”
Strengthening top management team
Focusing on strategic objectives and results
(incentive plans)
THE CUSTOMER Best & innovative shopping experience (excellent customer service &
high quality product presentation)
Customer proximity through multiple channels & geographic localization
Strengthening retention rate with increased focus on existing customers (CRM)
Forging strategic alliances with top fashion & design publishers to target
dedicated followers of fashion
New creative marketing ideas in sync with evolving scenarios (social networks)
GLOBAL TECH. & LOGISTICS PLATFORM
Logistics
State-of-the-art, highly-automated distribution centre
with global capabilities
Technology
Scalable, flexible, customer-oriented

The information contained in this document is confidential and proprietary to YOOX Group
SLIDE 28
TABLE OF CONTENTS
BUSINESS DEVELOPMENTS AND RESULTS HIGHLIGHTS
FY 2010 FINANCIAL ANALYSIS
STRATEGIC GUIDELINES
APPENDIX

The information contained in this document is confidential and proprietary to YOOX Group
SLIDE 29
YOOX GROUP PROFIT & LOSS EXCLUDING INCENTIVE PLAN COSTS
Note: Figures as absolute values and in percentages are calculated using precise financial data. Some of the differences found in this presentation are due to rounding of the values expressed in millions of Euro
In this presentation, fourth quarter figures are calculated as the difference between the full-year results and the first nine-month results of the same year
Depreciation & Amortisation included in Fulfillment, Sales & Marketing, General & Administrative have been reclassified and grouped under Depreciation & Amortisation
4Q 20092009 2010 4Q 2010
(€m)
Net Revenues 152.2 214.3 45.5 63.5
growth 50.0% 40.8% 39.7%
COGS (91.9) (129.9) (25.1) (36.2)
Gross Profit 60.3 84.4 20.4 27.3
% of Net Revenues 39.6% 39.4% 44.9% 43.0%
Fulfillment Excl. Incentive Plan Costs (15.1) (21.4) (4.0) (6.0)
% of Net Revenues 9.9% 10.0% 8.8% 9.5%
Sales & Marketing Excl. Incentive Plan Costs (16.4) (23.5) (4.4) (6.5)
% of Net Revenues 10.8% 11.0% 9.7% 10.2%
EBITDA Pre Corporate Costs 28.8 39.5 12.0 14.8
% of Net Revenues 18.9% 18.4% 26.4% 23.3%
General & Administrative Excl. Incentive Plan Costs (11.2) (16.5) (2.9) (4.7)
% of Net Revenues 7.4% 7.7% 6.3% 7.4%
Other Income/(Expenses) (1.0) (0.5) (0.2) (0.1)
% of Net Revenues 0.6% 0.2% 0.4% 0.2%
EBITDA Excluding Incentive Plan Costs 16.6 22.5 9.0 10.0
% of Net Revenues 10.9% 10.5% 19.7% 15.8%

The information contained in this document is confidential and proprietary to YOOX Group
SLIDE 30
€4.2m
€4.0m
€4.3m
€10.0m €22.5m
1Q10 2Q10 3Q10 4Q10 FY2010
2010 NET REVENUES AND EBITDA QUARTERLY CONTRIBUTION
€50.3m
€46.3m
€54.2m
€63.5m €214.3m
1Q10 2Q10 3Q10 4Q10 FY2010
Net Revenues
EBITDA Excluding Incentive Plan Costs
23% 22% 25% 30%% of
Total
Year
% of
Total
Year
1Q 2010 3Q 2010 4Q 2010 FY 20102Q 2010
1Q 2010 3Q 2010 4Q 2010 FY 20102Q 2010
19% 18% 19% 44%
8.0% 15.8% 10.5%8.6%8.3%
% of Net
Revenues
The information contained in this document is confidential and proprietary to YOOX Group
SLIDE 31
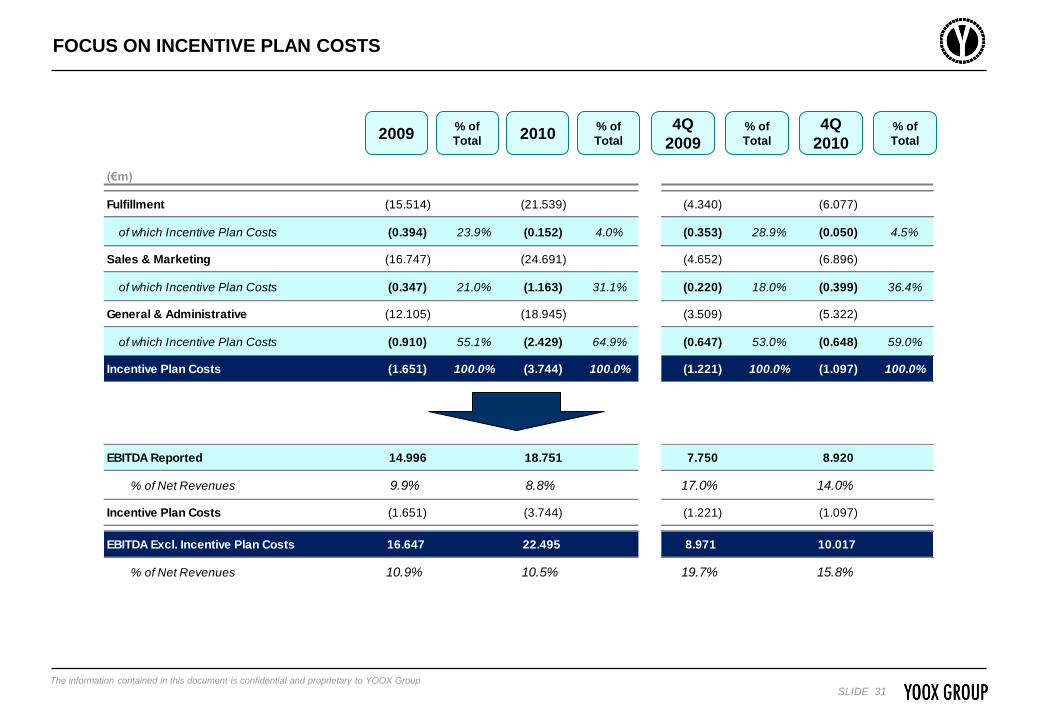
FOCUS ON INCENTIVE PLAN COSTS
% of
Total
% of
Total
% of
Total
% of
Total2009 2010
4Q
2009
4Q
2010
(€m)
Fulfillment (15.514) (21.539) (4.340) (6.077)
of which Incentive Plan Costs (0.394) 23.9% (0.152) 4.0% (0.353) 28.9% (0.050) 4.5%
Sales & Marketing (16.747) (24.691) (4.652) (6.896)
of which Incentive Plan Costs (0.347) 21.0% (1.163) 31.1% (0.220) 18.0% (0.399) 36.4%
General & Administrative (12.105) (18.945) (3.509) (5.322)
of which Incentive Plan Costs (0.910) 55.1% (2.429) 64.9% (0.647) 53.0% (0.648) 59.0%
Incentive Plan Costs (1.651) 100.0% (3.744) 100.0% (1.221) 100.0% (1.097) 100.0%
EBITDA Reported 14.996 18.751 7.750 8.920
% of Net Revenues 9.9% 8.8% 17.0% 14.0%
Incentive Plan Costs (1.651) (3.744) (1.221) (1.097)
EBITDA Excl. Incentive Plan Costs 16.647 22.495 8.971 10.017
% of Net Revenues 10.9% 10.5% 19.7% 15.8%

The information contained in this document is confidential and proprietary to YOOX Group
SLIDE 32
Management team and other stock option holders 6,443,996 10.1%
Federico Marchetti 7,090,501 11.1% 2,411,853 4.6%
Sub-total 13,534,497 21.3% 2,411,853 4.6%
Balderton Capital 5,870,280 9.2% 5,870,280 11.2%
Red Circle 3,178,291 5.0% 3,178,291 6.1%
Federated 2,575,979 4.1% 2,575,979 4.9%
Essegi Srl 2,476,656 3.9% 2,476,656 4.7%
JP Morgan Asset Management 2,467,490 3.9% 2,467,490 4.7%
Pictet Funds (Europe) 1,322,168 2.1% 1,322,168 2.5%
Henderson Global Investors 1,160,598 1.8% 1,160,598 2.2%
Wasatch Advisors 1,158,675 1.8% 1,158,675 2.2%
Aviva Investors Global Services 1,087,972 1.7% 1,087,972 2.1%
Market 28,770,310 45.2% 28,770,310 54.8%
Total 63,602,916 100.0% 52,480,272 100.0%
SHAREHOLDER STRUCTURE
Shareholder CurrentFully Diluted 1
2
Updated as of March 9, 2011
1. The fully diluted column shows the effect on the Company’s shareholder structure calculated assuming that all the stock options granted under the Company’s stock option plans are exercised. It does not
include 125,788 ordinary shares granted under the 2009-2014 Incentive Plan
2. Excludes Federico Marchetti
3. Includes 62,000 proprietary shares
3

The information contained in this document is confidential and proprietary to YOOX Group
SLIDE 33
ONLINE STORES PARTNERSHIP
YOOX GroupStrategic Partner
Fashion Responsibilities
Definition of Online Store look&feel
Product assortment definition
Pricing definition
Marketing activities
YOOX Group
additional
services:
Yagency
Key
Responsibilities
E-commerce Responsibilities
Set-up and management of the Online Store
Logistics
Digital production
Handling and shipping
Invoicing
Fraud check and credit collection
Customer care
Support and advisory to the Strategic Partner
in all key decisions
Digital experience (Web Design)
Content Production
Media Partnership
Web Marketing
Digital PR and Social Activities

The information contained in this document is confidential and proprietary to YOOX Group
SLIDE 34
CONTACTS
Investor Relations
www.yooxgroup.com
BOLOGNA - MILANO - NEW YORK - MADRID - PARIS - TOKYO - SHANGHAI