2010 10 Year Transportation and Financial Plan
154
For the purpose of the South Coast British Columbia Transportation Authority Act, the following two documents together form the 2010 10-Year Transportation and Financial Plan for the 2010 to 2019 period. This documen t is TransLink’s Strategic Plan, as defined by the SCBCTA Act. Part One, “Drastic Cuts”, is the 2010 10-Year Transportation and Financial Base Plan approved by the Board of Directors of TransLink on July 31, 2009. Part Two, “Funding Sta bilization” is the 2010 10-Year Transportation and Financial Supplemental Plan approved by the Board of Directors of TransLink on July 31, 2009 and by the Mayors’ Council on Regional Transportation on October 23, 2009. As an approved su pplemental plan, Funding Stabilization is incremental to the Base Plan and identifies additional revenues on the order of $130 million per year that will be accessed and the expenditures that will be enabled by these revenues.
-
Upload
andrew-curran -
Category
Documents
-
view
221 -
download
0
Transcript of 2010 10 Year Transportation and Financial Plan

8/7/2019 2010 10 Year Transportation and Financial Plan
http://slidepdf.com/reader/full/2010-10-year-transportation-and-financial-plan 1/154
For the purpose of the South Coast British Columbia Transportation Authority Act, the following
two documents together form the 2010 10-Year Transportation and Financial Plan for the 2010to 2019 period. This document is TransLink’s Strategic Plan, as defined by the SCBCTA Act. Part
One, “Drastic Cuts”, is the 2010 10-Year Transportation and Financial Base Plan approved by the
Board of Directors of TransLink on July 31, 2009. Part Two, “Funding Stabilization” is the 2010
10-Year Transportation and Financial Supplemental Plan approved by the Board of Directors of
TransLink on July 31, 2009 and by the Mayors’ Council on Regional Transportation on October
23, 2009. As an approved supplemental plan, Funding Stabilization is incremental to the Base
Plan and identifies additional revenues on the order of $130 million per year that will be
accessed and the expenditures that will be enabled by these revenues.

8/7/2019 2010 10 Year Transportation and Financial Plan
http://slidepdf.com/reader/full/2010-10-year-transportation-and-financial-plan 2/154

8/7/2019 2010 10 Year Transportation and Financial Plan
http://slidepdf.com/reader/full/2010-10-year-transportation-and-financial-plan 3/154
201010-Year Transportationand Financial Base Plan
Drastic Cuts
For the purpose of the BC South Coast British Columbia Transportation Authority Act , this2010 10-Year Transportation and Financial Base Plan constitutes the Base Plan prepared in 2009 forthe 2010 to 2019 period. This Plan will serve as TransLink’s Strategic Plan if no Supplemental Planis approved by the Mayors’ Council on Regional Transportation and the Regional Transportation Commissioner.
July 31, 2009Approved for submission to theMayors’ Council on Regional Transportationand the Regional Transportation Commission

8/7/2019 2010 10 Year Transportation and Financial Plan
http://slidepdf.com/reader/full/2010-10-year-transportation-and-financial-plan 4/154

8/7/2019 2010 10 Year Transportation and Financial Plan
http://slidepdf.com/reader/full/2010-10-year-transportation-and-financial-plan 5/154
Contents
Executive Summary 1
1 Background and Context 6
1.1 Introduction 7
Purpose 7
Legislation 8
Annual 10-Year Plans 8
Governance 9
TransLink Structure 11
1.2 2010 Plan Context 12
Achievements, Challenges and Opportunities 12
Planning Framework 17
Plan Development 22
2 Transportation and Financial Plan (Base) 26
2.1 Overview 27
Defining the Investment Level 27
Principles for Prioritizing Services 27
Coordinating with Land Use 28
2.2 Transportation Reductions and Investments 30
Transit Services 30
Cycling Program 40
Roads and Bridges 41
Goods Movement 44
Demand-Side Management 44
Strategic Initiatives 46Customer Service 48
Summary 51
2.3 Financial Strategy 54
Context 54
Financial Plan Development Guiding Principles 55
2010-2019 Revenues and Expenditure Projections 55
Balance Sheet and Cash Flow Statement 61
Assumptions and Risks 61
2010 10-Year Base Plan Inclusions and Exclusions 64
3 Outcomes 66

8/7/2019 2010 10 Year Transportation and Financial Plan
http://slidepdf.com/reader/full/2010-10-year-transportation-and-financial-plan 6/154
ii
Figures
Figure 1 – TransLink Governance Structure 10
Figure 2 – TransLink Family of Companies 11Figure 3 – Coast Mountain Bus Company (CMBC) International Comparison of Bus
System Cost Effectiveness1 14
Figure 4 – West Coast Express Operating Cost Trends, 2000–2008 14
Figure 5 – Projected Population Growth by Subregion, 2006–20402 16
Figure 6 – Transportation Planning Framework 18
Figure 7 – Frequent Transit Network in 2009 29
Figure 8 – Transit Ridership Projections 34
Figure 9 – Annual Bus Service Hours 2002-2019 (Base service levels as of January 1) 38
Figure 10 – Major Roads, Highways and Gateways 42
Figure 11 – Summary of Base Plan 52
Figure 12 – Operating Expenditure by Mode 52
Figure 13 – Capital Summary for Base Plan 53
Figure 14 – Transit Supply Comparison, 2009 vs. 2019 67Figure 15 – Transit Mode Share Effects by 2019 68
Tables
Table 1 – Transit Service Level Summary for 2010 10-Year Base Plan 30
Table 2 – Current Area Transit Plans 33
Table 3 – Consolidated Statement of Operations for 2010, 2015 and 2019 57
Table 4 – Key Assumptions for the 2010 10-Year Base Plan 62
Table 5 – TransLink Base Plan Capital Program by Category 65
8/7/2019 2010 10 Year Transportation and Financial Plan
http://slidepdf.com/reader/full/2010-10-year-transportation-and-financial-plan 7/154

8/7/2019 2010 10 Year Transportation and Financial Plan
http://slidepdf.com/reader/full/2010-10-year-transportation-and-financial-plan 8/154
ExecutiveSummary

8/7/2019 2010 10 Year Transportation and Financial Plan
http://slidepdf.com/reader/full/2010-10-year-transportation-and-financial-plan 9/154
1
Overview
This document is the 2010 10-YearTransportation and Financial Base Plan,
known as a Base Plan, under the South Coast
British Columbia Transportation Authority
Act (the SCBCTA Act). The SCBCTA Act
requires TransLink to annually prepare a
Base Plan that uses only established funding
resources within the current borrowing
limit.
If the Mayors’ Council does not approve a
Supplemental Plan the Base Plan becomes
TransLink’s Strategic Plan and will be
implemented, beginning immediately,requiring substantial cuts in services,
programs and investments.
This 10-Year Base Plan:
• Identifies what would be required to be
on track to the goals of Transport 2040;
• Identifies that there is a funding gap to
sustain existing investments and services,
well short of achieving the Goals;
• Identifies reductions in investments and
substantial cuts in transit service that are
required to fulfil TransLink’s statutory
obligation to operate within existing
resources.
Transportation
ProgramThe Base Plan outlines the actions TransLink
will take to reduce investments and cut
services in order to match expenditures with
revenues. Notwithstanding TransLink’s
commitment to maintain existing services,
TransLink also has the responsibility to
ensure that its assets are kept in a state of
good repair. This plan maintains existing
assets but services would need to be
substantially cut in order for revenues and
accumulated surpluses to match
expenditures, as required by the SCBCTAAct . TransLink will be required to eliminate
approximately 40 per cent of bus service in
the region and will dispose of assets that are
not required. While TransLink would
immediately begin implementing the Base
Plan, it would also undertake efforts to
establish new funding to support
appropriate investments in capital and
service and would bring forward
supplemental plans in the future.
Basic components of the Base Plan are
summarized in Figure A1.

8/7/2019 2010 10 Year Transportation and Financial Plan
http://slidepdf.com/reader/full/2010-10-year-transportation-and-financial-plan 10/154
2
Figure A1 – Summary of Base Plan

8/7/2019 2010 10 Year Transportation and Financial Plan
http://slidepdf.com/reader/full/2010-10-year-transportation-and-financial-plan 11/154
3
In addition to the initiatives summarized
above, TransLink would also continue to
pursue its other responsibilities. TransLink
will continue to collaborate with its partnersto improve the movement of goods and
freight and will pursue development of a
regional goods movement strategy.
Although this Base Plan does not have the
necessary supply-side initiatives to
complement demand-side management
measures, TransLink will investigate and
seek the demand-side tools that are
necessary to implement broad and effective
measures in support of the region's long-
term goals.
Inclusions and ExclusionsThe 2010 10-Year Base Plan provides for
costs of state-of-good-repair projects and
costs of some upgrade projects, while
eliminating or extensively cutting a number
of programs and services.
The 2010 10-Year Base Plan includes:
• Bus fleet replacement.
• SkyTrain fleet refurbishment.
• SeaBus replacement.
• Transit infrastructure maintained in good
order.
• Cycling Program funding of $1 million
per year.
• New Pattullo Bridge funding to take the
project to the procurement stage.
• Smartcards and gating systems.
• Major road projects already committed
(Fraser Highway Widening, Coast
Meridian Overpass and Roberts Bank Rail
Corridor Grade Separation).
• SkyTrain fleet expansion (48 vehicles
previously ordered) to address system
overcrowding and passenger safety
issues, and an expanded operations and
maintenance centre to accommodate
fleet growth.
• SkyTrain stations maintained in a state of
good repair.
The 2010 10-Year Base Plan excludes:
• Detailed design and construction of the
rapid transit lines identified in the
Provincial Transit Plan (Evergreen Line,
Surrey Extension and Broadway West).
• Pattullo Bridge design and construction,
as it is assumed these costs will be
recovered through tolls.
• Addition of seven West Coast Express bi-
level cars.
• Bus fleet expansion and related facilities.
• SkyTrain fleet expansion.
• Major Road Network Minor Capital
Program annual allocation of $20 million
per year.
• Major Road Network Major Capital
Program annual allocation of $35 million
per year.
• Major road projects (Main Street
Widening and Murray-Clark Connector)
Funding Sources SummaryThe funding sources and proposed rate
increases for the Base Plan are summarized
below:
• Fuel tax revenues at existing rates.
• Property tax revenues inflated by
3 per cent annually.
• Fare revenues with short-term (cash and
FareSaver ticket) fare rates inflated by
2 per cent annually and potentialincreases in long-term fares.
• Replacement tax revenues at a maximum
of $18 million.

8/7/2019 2010 10 Year Transportation and Financial Plan
http://slidepdf.com/reader/full/2010-10-year-transportation-and-financial-plan 12/154
4
• Parking sales tax at the current 7 per cent
rate.
• Other estimated revenues, including
advertising, real estate and non-shortterm fares.
• Federal and provincial capital
contributions which may be at risk due to
lack of matching local funds.
The Base Plan has been developed using
revenue projections that reflect inflation
and natural growth, and account for risk
factors including fuel tax revenue, ridership,
economic and other factors. While these are
relatively predictable over the short term,
the ability to predict outcomes over tenyears is limited. During the Plan period
TransLink will retain annual minimal
operating reserve managed from year to
year.
Plan Developmentand Consultation
The annual 10-year base and supplemental
plans are the key mechanisms for achieving
the goals and implementing the strategies
of Transport 2040, the long-term strategy
for the regional transportation system,
adopted in 2008 and based on the principles
of sustainability.
Development of the 2010 10-year plans
involved research on funding sources,
development of a new financial model, and
comprehensive analysis of existing and
required transportation services and
investments.
Development of the 2010 10-year plans
involved research on funding sources,
development of a new financial model, and
comprehensive analysis of existing andrequired transportation services and
investments.
Extensive consultation was conducted
through various in-person and on-line
methods as part of the development of the
2010 10-year plans and in compliance with
the SCBCTA Act . This included:
• The public in the transportation service
region;
• The Mayors’ Council on Regional
Transportation;
• Metro Vancouver;
• Any municipality, stakeholder or other
organization considered to be affected.
Overall, the public and stakeholders were
supportive of a 10-Year Plan which would
strive toward the goals of Transport 2040, a
path that requires an additional $450 million
of funding annually. This Base Plan would
be unable to achieve the expressed
objectives of the region and would reversethe gains made toward these goals.
TransLink’s plans are developed in context
with the Regional Growth Strategy
(Metro Vancouver) and the Provincial Transit
Plan. There is a strong link between land use
and transportation but under this Base Plan
TransLink is unable make the necessary
investments or provide the required services
to advance the objectives of the Regional
Growth Strategy.

8/7/2019 2010 10 Year Transportation and Financial Plan
http://slidepdf.com/reader/full/2010-10-year-transportation-and-financial-plan 13/154
5
Outcomes under the
Base PlanAlthough the most productive services will
be prioritized, the Frequent Transit Network
(FTN) corridors will experience substantial
service cuts. The long-term impact of
reducing the coverage and service levels of
the FTN may have the largest impact. The
land use shaping function of the FTN would
be largely lost as the length and scope of
the service remain at a reduced level. Under
the 2010 10-Year Base Plan, the proportion
of people living within walking distance to
the FTN would decrease by 15 per cent by2019 from current levels. With lower service
levels, there will be fewer incentives and
opportunities for land use development
within FTN designated and conceptual
corridors, diminishing future real estate
opportunities.
Under this plan, transit’s share of total trips
is expected to drop by 18 per cent from the
2009 level of 11 per cent to under 9 per cent
by 2019. This plan will also accomplish little
in terms of reducing GHG emissions, though
advances in vehicle technologies and fuels
will result in minor reductions in GHGs fromvehicles. The safety and security of the users
of the transportation system will also decline
as much needed maintenance and upgrades
to the infrastructure are deferred
indefinitely.
In summary, under the 2010 10-Year Base
Plan, the regional transportation system will
regress, falling further behind the regional
aspirations for achieving a sustainable
region. The curve to get back On Track to a
Sustainable Region will be much steeper and
the necessary land use changes are less likelyto occur in this environment. In response to
inadequate funding in all areas of the
transportation system, travel in the region
will remain auto-dependant; congestion will
increase and continue to impact the region’s
ability to move people and goods efficiently
and hinder its ability to compete in the
global economy. Furthermore, the condition
of the Major Road Network can be expected
to decline, resulting in impacts to safety,
operational efficiency and the economy.

8/7/2019 2010 10 Year Transportation and Financial Plan
http://slidepdf.com/reader/full/2010-10-year-transportation-and-financial-plan 14/154
1. Backgroundand Context
8/7/2019 2010 10 Year Transportation and Financial Plan
http://slidepdf.com/reader/full/2010-10-year-transportation-and-financial-plan 15/154
7
1.1 Introduction
Purpose
This document is TransLink’s 2010 10-Year
Transportation and Financial Base Plan
(2010 10-Year Base Plan) as required under
the provisions of the South Coast British
Columbia Transportation Authority Act
(SCBCTA Act). This base plan fits within
established funding resources and, if
implemented, will result in significantreductions in transportation investments,
services and programs.
The SCBCTA Act requires TransLink to
annually prepare a base plan for a period of
10 years. The base plan identifies the
transportation services to be provided, the
transportation demand measures being
undertaken, major capital projects planned
and estimated funding requirements. The
expenditures must not exceed projected
revenues and only established funding
resources may be used. TransLink’s currentannual expenditures exceed annual
revenues and the accumulated surplus is
being drawn down and will be depleted
by 2011.
This document is the Base Plan for the 2010
– 2019 horizon. Chapter 3 outlines the
actions TransLink would take to ensure that
expenditures align with the projected
revenues. This Plan includes only the
investments, services and programs
TransLink is able to commit to without
expanded revenues beyond the increasesallowed for under the legislation. The
implications are that TransLink will be
investing in no new capital projects, except
where necessary to maintain a basic state of
good repair or for projects where
commitments to proceed are already in
place. In addition, all TransLink programs
and services will be reviewed for reduction
or elimination to meet available funding,
which means all areas of TransLink’s business
will be affected.
Transport 2040: A Transportation Strategy
for Metro Vancouver (Transport 2040) is the
long-term strategy for the regional
transportation system. The 10-Year Plan is
meant to set the short-term and mid-term
direction for the region as TransLink strives
to meet the long-term goals. The Transport
2040 goals are intended to meet the
region’s aspiration to be sustainable, livable
and resilient in an uncertain future. Rather
than putting the region On Track to
sustainability and the goals of Transport
2040, the 2010 10-Year Base Plan will result
in drastic cuts that reverse the gains
TransLink has made in recent years.
A plan entitled On Track to a SustainableRegion, which contains a supplemental plan,
has been prepared for submission to the
Mayors’ Council for approval. This document
includes an Expansion Program, as well as a
Maintenance and Upgrade Program that,
together, would advance the region towards
the Transport 2040 goals over the next
10 years.
On Track to a Sustainable Region identifies
expanded revenue sources to enable
TransLink to, at least, maintain current
services and programs, and, at best, fund theinvestments needed to support the vision of
Transport 2040. However, if the
Supplemental Plan contained in On Track to
a Sustainable Region is not approved, this
Base Plan will become TransLink’s strategic

8/7/2019 2010 10 Year Transportation and Financial Plan
http://slidepdf.com/reader/full/2010-10-year-transportation-and-financial-plan 16/154
8
plan and will be implemented, beginning
immediately. TransLink would then begin
preparation of a supplemental plan to bring
forward in the future to renew progresstoward Transport 2040.
This document provides an overview of the
planning context for the 2010 10-Year Base
Plan, including background and recent
trends, TransLink governance, planning
framework and the plan development
process. It also summarizes the studies and
policy development that will be undertaken
in preparation for future 10-year plans.
LegislationThe South Coast British Columbia
Transportation Authority (also known as
TransLink) is governed by the provisions of
the SCBCTA Act . Under the SCBCTA Act ,
TransLink is:
• Required to prepare a long-term strategy
that identifies goals and directions for
the transportation system, key initiatives
and a statement of underlying principles;
update to this strategy is required every
5 years (s. 194).
• Required to prepare, each year, a 10-year
base plan that identifies the
transportation services to be provided,
major capital projects planned and key
transportation demand management
initiatives for each year during the
following 10-year period. Base plans are
to utilize only existing borrowing limits
and established funding resources as
defined in the SCBCTA Act (s. 193).
• Permitted to prepare, in any year, a10-year supplemental plan that identifies
for each year of the 10-year period:
• Additions, enhancements or other
changes to transportation services
and major capital projects from the
base plan.
• Increased expenditures, funding
sources, anticipated revenues andborrowing limits, as applicable.
The 10-year base plan and any supplemental
plan(s) must be submitted by TransLink to
the Mayors’ Council on Regional
Transportation (the Mayors’ Council) and
the Regional Transportation Commissioner
(the Commissioner) by August 1 of each
year. Mayors’ Council approval is required
for any supplemental plan(s), and the
Commissioner’s approval is required for
certain fare increases proposed in any
supplemental plan(s).
In any particular year, TransLink’s strategic
plan will be the base plan, as amended by
any supplemental plan(s) approved by the
Mayors’ Council on Regional Transportation
(s. 206). TransLink and its subsidiaries must
ensure that all their service, capital and
operational plans and policies are consistent
with the strategic plan.
Annual 10-YearPlans
The rolling 10-year plans provide investment
and planning guidance based upon current
context and assumptions. The annual
adoption of a new plan allows these
assumptions and conditions to be
continually monitored, reviewed and
updated. This process is especially relevant
for the revenue and expenditure forecasts,
which are more prone to volatility in later
years of the plan due to fluctuations infactors such as variable inflation, energy
costs and ridership trends. As the 10-year
plans are monitored and updated, revenue
and expenditure forecasts can be adjusted,
and emerging needs addressed.

8/7/2019 2010 10 Year Transportation and Financial Plan
http://slidepdf.com/reader/full/2010-10-year-transportation-and-financial-plan 17/154
9
The 2009 10-Year Plan, which was the Base
Plan covering the 2009 to 2018 period, was
approved by the TransLink Board by July 31,
2008, as required by the SCBCTA Act . It wasunderstood at the time that significant
additional revenues were needed to sustain
the transportation system.
The 2009 10-Year Plan continued the path of
expansion made in the 2005-2007
Three-Year Plan and Ten-Year Outlook and
preserved the foundation for future
expansion. It stated that while there were
sufficient revenues and reserve funds to
continue expansion in the first two years of
the plan, reserve funds would be depleted
by 2012, and there would not be sufficientrevenue to maintain transit service hours.
This strategy was appropriate for the 2009
10-Year Plan because it was anticipated that
a supplemental plan would be proposed for
the 2010-2019 period that expanded
revenues to avoid service reductions and to
fund upgrades and expansion of the
transportation system.
As TransLink is now one year closer to the
complete depletion of its accumulated
surplus, it is not prudent for the base plan to
support continued expansion of
transportation services and networks.
Governance
In November 2007, the provincial
government amended the Greater
Vancouver Transportation Authority Act ,
renamed it the South Coast British Columbia
Transportation Authority Act and changed
TransLink’s legal name from the Greater
Vancouver Transportation Authority to theSouth Coast British Columbia Transportation
Authority.
TransLink’s governance structure is shown in
Figure 1. The TransLink Board of Directors is
appointed by the Mayors’ Council, based on
a candidate list produced by the screening
panel. The Mayors’ Council has 22 members
—the Mayors from all 21 municipalities in
Metro Vancouver and a representative from
Tsawwassen First Nation. The Mayors’
Council is responsible for appointing the
TransLink Board, the Commissioner and anyDeputy Commissioners that may be
required. It is also responsible for approving
supplemental plans under the SCBCTA Act .
The Commissioner was appointed in June
2008 by the Mayors’ Council. The
Commissioner acts independently from the
Mayors’ Council, TransLink Board of
Directors and TransLink management. The
Commissioner advises TransLink and the
Mayors’ Council on the reasonableness of
the parameters and assumptions in base and
supplemental plans (s. 203) and the specific
determinations and opinions required for
supplemental plans containing fuel tax
increases and must approve any increases to
short-term fares.

8/7/2019 2010 10 Year Transportation and Financial Plan
http://slidepdf.com/reader/full/2010-10-year-transportation-and-financial-plan 18/154
10
Figure 1 – TransLink Governance Structure

8/7/2019 2010 10 Year Transportation and Financial Plan
http://slidepdf.com/reader/full/2010-10-year-transportation-and-financial-plan 19/154
1
TransLink Structure
TransLink was formed in 1999 to plan,finance, build and manage a regional
transportation system that supports the
efficient movement of people and goods.
There are two key things that set TransLink
apart. First, TransLink is an integrated
transportation authority that plans, finances
and delivers public transit, roadways,
bridges and cycling facilities and programs
in support of Metro Vancouver’s growth
management strategy and the regional
economy. TransLink works in partnership
with local municipalities to manage the
Major Road Network (MRN), coordinate
transit planning and service delivery and
develop a regional cycling network.
TransLink is also responsible forTransportation Demand Management,
commuting options and AirCare programs.
The TransLink family of companies,
including subsidiaries, is shown in Figure 2.
The operation, maintenance and inspection
of road-related structures owned by
TransLink is undertaken by contractors
through annual or multi-year contracts.
Municipalities are responsible for delivering
MRN operation, maintenance and
rehabilitation and for minor capital works.
Figure 2 – TransLink Family of Companies

8/7/2019 2010 10 Year Transportation and Financial Plan
http://slidepdf.com/reader/full/2010-10-year-transportation-and-financial-plan 20/154
12
1.2 2010 Plan Context
Achievements,Challenges andOpportunities
AchievementsApril 1, 2009 marked TransLink’s 10-year
anniversary as an organization. Over the
past decade, TransLink has substantiallyimproved the efficiency and sustainability of
Metro Vancouver’s transportation network
through investments in transportation
services and infrastructure and proactive
planning and implementation.
Transit
Over the past 10 years, TransLink has
provided transportation choices to an
increasing share of the region’s population
through its many investments in transit
infrastructure, services and innovative
programs to attract and retain customers,such as U-Pass and Employer Pass. Bus service
has increased by over 40 per cent during this
period and there have been major upgrades
to bus service on 45 routes. Two new B-Line
routes (high-capacity express routes) were
implemented and by the end of 2009 there
will be 36 Frequent Transit Network (FTN)
routes, where transit services are provided at
frequencies of 15 minutes or better
throughout the day and into the evening,
seven days a week.
Transit ridership has increased over50 per cent since 1999. The increased transit
ridership is the equivalent of 175,000 transit
trips per weekday and approximately
110,000 extra vehicle trips kept off the road
each day. To enhance the quality and
efficiency of transit service, TransLink has
invested $25 million in transit priority
measures and passenger facilities. The
opening of the Canada Line in 2009 will
further improve TransLink’s capacity to
move people across the region.
The security of the transit system has been
enhanced by the implementation of the
dedicated Transit Police Service in 2005.
TransLink has also helped make cycling a
viable travel choice by investing $25 million
in cycling infrastructure. By providing bicycle
racks on all buses, TransLink facilitates
linking cycling and transit, making cycling
possible for more trips.
Goods Movement and Road Network
Investment
TransLink provided direct and indirect
support to a number of projects to facilitate
the movement of goods in the region,
including the Roberts Bank Rail Corridor.TransLink funded major road improvements
that benefit overall traffic flow and goods
movement, such as the 204th Avenue
Overpass, David Avenue Connector,
Dollarton Bridge, Coast Meridian Overpass,
North Shore Trade Area Corridor and border
infrastructure projects. TransLink also built
the Golden Ears Bridge (opened on
June 16, 2009) and has identified
replacement of the Pattullo Bridge as a
regional priority.
Greenhouse Gas Emissions and AirQuality
TransLink has significantly contributed to
reducing greenhouse gas (GHG) emissions
and improving air quality through the
administration of the AirCare program,

8/7/2019 2010 10 Year Transportation and Financial Plan
http://slidepdf.com/reader/full/2010-10-year-transportation-and-financial-plan 21/154
13
expansion and improvement of the transit
fleet and support for other alternatives to
single-occupant vehicle travel. Since its
inception, AirCare has contributed to thereduction of exhaust emissions from light-
duty vehicles in the region by 31 per cent. In
addition, TransLink’s commitment to buying
environmentally-friendly transit vehicles,
such as the electric trolley-bus fleet, clean
diesel and hybrid buses, helps to reduce
transit-related emissions.
Operational Efficiencies
TransLink has made gains in the efficiency of
the transit system. TransLink constantly
monitors and reviews the performance of
both the organization and transportationsystem in order to maximize the region’s
investments in transportation assets and
services. Independent studies have
determined that, compared to other transit
systems in Canada, TransLink is average or
above average on most indicators, including
vehicle utilization, labour effectiveness and
administration cost ratio.
One of TransLink’s earliest efficiency
measures involved the implementation of
Community Shuttle mini-bus services,
allowing transit services to be efficiently
expanded into new areas and existing areas
where ridership is lower at operating costs
that are over 40 per cent lower per service
hour than for conventional ‘big’ buses.
Community Shuttles now account for over
10 per cent of TransLink’s total bus service.
This has the added benefit of freeing up
large buses to increase service levels on
major routes.
In an international comparison of bus
systems, Coast Mountain Bus Company
ranked fourth in terms of cost per kilometre
of providing service, which is a measure of
financial performance. The results are
presented in Figure 3. On overall
performance, Coast Mountain Bus Company
ranked third when a variety of factors,
including safety, customer service and
administrative cost were taken into account.
On a customer service and administrative
cost basis, Coast Mountain Bus Companyplaced second compared to the entire
group.
TransLink’s SkyTrain system has also drawn
international attention because of its
capacity, its flexibility in terms of adjusting
capacity to match demand and its operating
efficiencies. SkyTrain is expensive to build
but is one of the few systems anywhere
which recovers its operating costs at the fare
box.
West Coast Express has also shown successfu
increases in efficiency. Between 2000 and
2008, operating costs per passenger
kilometre decreased by 90 per cent due to
ridership increases and cost reductions
(Figure 4).

8/7/2019 2010 10 Year Transportation and Financial Plan
http://slidepdf.com/reader/full/2010-10-year-transportation-and-financial-plan 22/154
14
Figure 3 – Coast Mountain Bus Company (CMBC) International Comparison
of Bus System Cost Effectiveness1
Figure 4 – West Coast Express Operating Cost Trends, 2000–2008

8/7/2019 2010 10 Year Transportation and Financial Plan
http://slidepdf.com/reader/full/2010-10-year-transportation-and-financial-plan 23/154
15
Going forward, improvements in
operational efficiency and effectiveness will
continue to be a priority. An organizational
review is underway and will be complete byDecember 2009. Resources will be realigned,
as necessary, to enable TransLink to more
effectively execute its mandate. Key
performance indicators will continue to be
used to monitor performance, identify
improvement opportunities and allow for
benchmarking.
Challenges and Opportunities
The region faces many challenges over the
coming decades:
• TransLink needs stable and sufficientrevenue sources to maintain and invest in
the regional transportation network
• TransLink serves a large geographic area
with a service area more than twice the
size of the area served by comparable
Canadian transit providers such as the
Toronto Transit Commission and the
Societe de Transport de Montreal. The
population of Metro Vancouver is
unevenly distributed across the region
and, in many places, separated by large
tracks of farmed, forested and park landthat do not generate transit ridership.
• By 2040, the population of
Metro Vancouver is projected to grow by
over one million people.
• The number of people aged 65+, who
become increasingly reliant on the public
transportation system as they age, is
projected to triple.
• The highest rates of population and
employment growth are expected in the
southern and eastern communities of the
region (Figure 5), where the transitnetwork is less mature and
transportation choices are not as strong
as in other areas of the region.
• If current trends continue, travel
patterns will continue to diversify and
scatter, there will be 600,000 more cars
in the region and congestion will
worsen. Vehicles account for 35 per cent
of all GHG emissions in
Metro Vancouver, and provincial and
regional emissions targets will not be
achieved without a reduction in the
dependence on automobiles.
• The region’s industrial land base is at
risk due to conversion to other uses. This
threatens efficient goods movement
and the economic vitality of the region.
As a result of the investments over the past
decade, Metro Vancouver has seen a large
increase in transit ridership and even slight
increases in transit and cycling mode share,
while many North American cities have
experienced declining transit and cyclingmode share.
While mode shares in some communities are
approaching Transport 2040 levels, at a
regional scale, transit, cycling and walking
mode shares remain well below Transport
2040 targets. There are a number of factors
that have inhibited progress towards a more
sustainable transportation system, including:

8/7/2019 2010 10 Year Transportation and Financial Plan
http://slidepdf.com/reader/full/2010-10-year-transportation-and-financial-plan 24/154
16
• Dispersion of employment centres:
Between 1990 and 2006, nearly half
(49 per cent) of new office space in
Metro Vancouver was built on siteslocated outside of the Metro Core or
regional city centres, where they can be
readily served by transit. Statistics
Canada found that in 2006 over
90 per cent of business park employees
commuted to their jobs as an automobile
driver or passenger, a trend likely to
worsen if office space continues to be
dispersed.
• More trips per capita: More trips are
being made per capita to more
destinations throughout the region,
presenting challenges to how TransLinkdelivers transit service and the level of
service needed to meet this emerging
pattern.
Figure 5 – Projected Population Growth by Subregion, 2006–2040 2

8/7/2019 2010 10 Year Transportation and Financial Plan
http://slidepdf.com/reader/full/2010-10-year-transportation-and-financial-plan 25/154
17
• Inconsistent development of land on the
rapid transit network: The rapid transit
network is intended to both serve
existing development and help shape atransit-oriented region where higher
densities and mixed uses are located in
transit corridors and station areas.
Transit-oriented development sufficient
to support rapid transit investment has
been achieved in many locations on the
existing rapid transit network, but not in
all cases. Continued development of
existing rapid transit corridors to
densities that support ridership
objectives is essential, as is the need to
establish land use plans and zoning in
future rapid transit corridors in order tosupport that level of transit investment.
Metro Vancouver has frequently been
ranked as one of the most livable cities in
the world. The region has made a
commitment to maintaining the quality of
life for which it is renowned. People are
aware, engaged and generally supportive of
the principles of reducing GHG emissions,
preserving air quality and protecting the
environment. There is also a common
understanding of the role that a sustainable
transportation system would play in
pursuing these objectives. TransLink mustcontinue to build on the region’s many
strengths and address these challenges to
preserve the livability of the region and
move toward greater sustainability.
Planning Framework
TransLink’s transportation planning
framework is illustrated in Figure 6 and
further described in this section.
Transport 2040Transport 2040 is the long-term strategy for
the regional transportation system. Adopted
in 2008, Transport 2040 lays out the
challenges facing the region over the next
30 years, identifies key goals and sets out
strategies to reach those goals. The annual
10-year plan is the key mechanism for laying
out the actions TransLink will take toward
achieving the goals and implementing the
strategies of Transport 2040.

8/7/2019 2010 10 Year Transportation and Financial Plan
http://slidepdf.com/reader/full/2010-10-year-transportation-and-financial-plan 26/154
18
Figure 6 – Transportation Planning Framework

8/7/2019 2010 10 Year Transportation and Financial Plan
http://slidepdf.com/reader/full/2010-10-year-transportation-and-financial-plan 27/154
19

8/7/2019 2010 10 Year Transportation and Financial Plan
http://slidepdf.com/reader/full/2010-10-year-transportation-and-financial-plan 28/154
20
SustainabilityTransLink is deeply committed to developing
and maintaining a sustainable
transportation system that meets the needsof people, organizations and businesses, and
fosters the ecological, economic and social
well-being of the Metro Vancouver region
and beyond. This is
reflected in the vision,
goals and strategies laid
out in Transport 2040.
TransLink’s commitment
to sustainability is
further supported by the
formal adoption of a Sustainability Policy,
which articulates TransLink’s commitment to
making sustainability a key factor in allstrategies, business plans, decisions and
operations. The policy, adopted in 2009, will
guide TransLink towards becoming a leader
in sustainable transportation. The policy is
included in the technical appendices of this
document.
Greenhouse Gas ReductionsThere is broad agreement that climate
change is underway, and that the burning of
fossil fuels is a major contributor. Canadians
are one of the world's highest per capita
generators of GHG emissions, and
Metro Vancouver must do its part to
respond to the climate change challenge.
In 2007, the British Columbia Government
set targets to reduce the 2007 GHG
emissions in the province by 33 per cent by
2020 and by 80 per cent by 2050.
Metro Vancouver adopted the same targets
for the region. Light and heavy-duty vehicles
accounted for 35 per cent of GHG emissions
in Metro Vancouver in 2005. With over half
of the province’s registered vehicles andpopulation in Metro Vancouver,
transportation in this region will clearly
need to lead the way in reducing provincial
emissions.
TransLink can be part of the solution by
helping people make smart transportation
choices. There are three key ways to reduce
GHGs from transportation:
• Lower the total vehicle kilometres
travelled by developing more compact
and complete communities that
encourage walking, cycling or transit
use.
• Use new and emerging energy-efficient
and clean vehicle technologies.
• Use lower carbon fuels.
Cleaner engines and fuels will help reduce
GHG emissions in the region but are notsufficient on their own to meet provincial
targets. Reducing both the number of
vehicle trips and the length of trips through
the coordination of transport and land use
plans, policies and actions will be key to the
success of transportation-based climate
change solutions.
Regional Growth StrategyUnder the SCBCTA Act , TransLink must
provide a regional transportation system
that supports the Regional Growth Strategy.
The significant reductions, particularly in
transit and cycling, are not supportive of
sustainable transportation choices and,
therefore, this plan does not advance the
Regional Growth Strategy. TransLink will
support the Regional Growth Strategy to the
extent possible within the context of
funding constraints. For example, TransLink
will prioritize transit service on key corridors
and connections to major centres and will
continue to pursue funding sources to
renew progress toward Transport 2040
goals.
The existing Regional Growth Strategy for
Metro Vancouver, the Livable Region
Strategic Plan, was adopted by the
Metro Vancouver Board in 1996.
Metro Vancouver is currently preparing a
8/7/2019 2010 10 Year Transportation and Financial Plan
http://slidepdf.com/reader/full/2010-10-year-transportation-and-financial-plan 29/154
2
new Regional Growth Strategy for the
region, and the TransLink Board is one of
the approving bodies for the new regional
growth strategy. The SCBCTA Act requiresTransLink to review the Regional Growth
Strategy and advise Metro Vancouver, the
municipalities and the provincial
government regarding the implications to
the regional transportation system. The
SCBCTA Act also requires the 10-Year Plan to
set out the relationship between the major
actions planned by TransLink and the
Regional Growth Strategy.
Land use is a key determinant of travel
behaviour, mode choice and the efficiency
of the associated networks. Transportationsystems influence land use by providing
linkages between and within developed
areas. TransLink will be working closely with
Metro Vancouver and its partners to finalize
the growth management vision for
Metro Vancouver, and to help ensure the
region pursues a coordinated approach to
land use and transportation planning.
Provincial Transit PlanIn January 2008, the provincial government
released the Provincial Transit Plan,
outlining approximately $11 billion in new
transit expansion in Metro Vancouver. The
Provincial Transit Plan anticipates
$2.8 billion of this capital funding will come
from TransLink. This is a substantial
investment in infrastructure that would help
lay the foundation for achieving the goals of
Transport 2040. However, the Provincial
Transit Plan does not include funding for the
cost of operating the transit system or
elements to support transit operations, such
as bus operating facilities. Operating and
maintenance costs are the largestcomponent of the cost of bus system
expansion. On a life-cycle basis, they
comprise 90 per cent of total costs, with
capital costs making up the balance.
Some TransLink projects that support the
Provincial Transit Plan will be implemented
in 2009, including:
• The Canada Line (rapid transit line)
opening in September 2009 to connect
Richmond and Vancouver International
Airport to Downtown Vancouver.
• A replacement SeaBus arriving in fall
2009.
• Moderate increases in bus service levels.
• Upgrades to the Expo Line SkyTrain
stations, the purchase of new SkyTrain
cars and a modest expansion of the bus
fleet.
The Provincial Transit Plan also calls for
significant expansion of rapid transit in
Metro Vancouver, including rail and/or bus
rapid transit lines on corridors throughout
the region. TransLink’s 2010 10-Year
Base Plan does not provide for sufficient
revenues to fund any of TransLink’s
identified share of these capital projects nor
fund the operating costs that would be
incurred. In contrast to the intention of the
Provincial Transit Plan, transit in
Metro Vancouver would be reduced, notexpanded under the 2010 10-Year Base Plan.
The Provincial Transit Plan seeks a transit
market share of 17 per cent in
Metro Vancouver by 2020, laying the
foundation to attract 22 per cent by 2030.
Approaching or achieving these targets is
possible with the On Track to a Sustainable
Region investment laid out in Appendix 12
of this document. However, under the 2010
10-Year Base Plan progress will not be made
toward these targets and the region will
lose ground from where it is today.Achieving these targets will require
additional revenues through a future
Supplemental Plan.

8/7/2019 2010 10 Year Transportation and Financial Plan
http://slidepdf.com/reader/full/2010-10-year-transportation-and-financial-plan 30/154
22
Working with Partner AgenciesThe TransLink planning process includes
regular and ongoing consultation and
collaboration with municipalities,Metro Vancouver, the BC Ministry of
Transportation and Infrastructure, Transport
Canada and other partner agencies.
Individual municipalities, the Mayors’
Council and Metro Vancouver are consulted
on a number of specific issues, as required
by the SCBCTA Act . TransLink also consults
with these agencies and other stakeholders
(e.g., Vancouver Airport Authority, Port
Metro Vancouver, Insurance Corporation of
BC [ICBC]) through standing regional
committees, project-specific committees and
task forces and other formal and informalmechanisms. For example, TransLink works
closely with municipalities on the
development of Area Transit Plans, which
identify transit services and priorities on a
sub-regional basis.
TransLink works closely with senior
government agencies in the pursuit of
regional, provincial and national objectives.
Ongoing financial support from these
partners has helped build and maintain the
region’s transportation infrastructure.
TransLink provides input to the
development and review of Official
Community Plans, at the request of
municipalities. This input helps to inform
local planning processes on regional
transportation issues and opportunities, and
helps to align the respective planning
objectives. TransLink will work with
municipalities to develop a more structured
and consistent process for providing such
input, consistent with applicable provisions
of the SCBCTA Act .
The alignment of local and regional
objectives will be further enhanced through
Municipal Framework Agreements, which
will be developed between TransLink and
individual municipalities to define the
shared goals and joint actions for
coordinated planning in and around transit
stations and corridors, consistent with the
Regional Growth Strategy. New andenhanced transportation infrastructure
works more efficiently when combined with
higher-density development, and this is to
the benefit of TransLink, the municipalities
and the region. The Municipal Framework
Agreements are a mechanism by which
TransLink and the municipalities agree to
work collaboratively to integrate
transportation and land use planning
initiatives to provide a financial return on
public transportation investment, create
opportunities for community amenities and,
where possible and appropriate, share thecosts of these initiatives. Under this Base
Plan, TransLink does not have funding to
make these kinds of investments.
Plan Development
Getting on Track to a SustainableRegionDevelopment of the 2010 10-Year Base and
Supplemental Plans involved research on
funding sources, development of a new
financial model and extensive analysis of the
transportation services and investments that
are required to meet current needs and
support the growth of the region. This
analysis included early involvement of
TransLink’s divisions and subsidiaries, as well
as the input of stakeholders and the public.
The results of this process are entitled On
Track to a Sustainable Region, which
represents the initiatives, and investments in
services and capital that would set the
region on the path to achieving Transport2040s goals over the next 10 years. The On
Track to a Sustainable Region vision is
attached as Appendix 12.

8/7/2019 2010 10 Year Transportation and Financial Plan
http://slidepdf.com/reader/full/2010-10-year-transportation-and-financial-plan 31/154

8/7/2019 2010 10 Year Transportation and Financial Plan
http://slidepdf.com/reader/full/2010-10-year-transportation-and-financial-plan 32/154
24
Public and Stakeholder EngagementExtensive consultation was conducted as
part of the development of the 10-Year
Plan. The SCBCTA Act has specified publicconsultation requirements for TransLink,
including consultation with:
• The public in the transportation service
region.
• The Mayors’ Council on Regional
Transportation.
• Metro Vancouver.
• Any municipality or other organization
considered to be affected.
Starting in September 2008, a
comprehensive consultation program was
developed to engage the region in a
dialogue. The consultation initiative was
divided into three phases:
• In Phase 1 (September to
December 2008), the challenges the
region faces were defined.
• In Phase 2 (January to April 2009), input
from the stakeholders about possible
solutions to the challenges was collected.
• In Phase 3 (May and June 2009), the
following options were developed based
on input collected during the first two
phases and presented to the region:
• Drastic Cuts – no new funding.
• Maintaining What We Have – new
revenues to close the $260-million
funding gap.
• On Track to Sustainability – new
revenues to close the $450-million
funding gap.
Consultation Activities
A range of methods were employed to
engage the region in a dialogue about the
issues facing the region, the need fortransportation investment and the challenge
of how to fund transportation. The
consultation activities are briefly described
below, and the results of the consultation
process are summarized in a companion
report.
A number of events were organized to
engage the region and stakeholders in the
public consultation process, including:
• Stakeholder roundtable and focus groups
• Greater Vancouver Livability Forum
• Front-room forums
• Community consultation workshops
• TransLink and family employee
consultation
An interactive exercise, entitled It’s Your
Move, was created. This exercise was used at
the community workshops, front-room
forums and the Greater Vancouver Livability
Forum to allow participants to provide clear
input on the type and level of services andprograms they support. The participants
were also asked to define what funding
sources should be used to pay for new
services, programs and expansion.
A custom website (bepartoftheplan.ca) was
developed. This site was designed to enable
the public to interact with TransLink
through a forum, which initiated the
consultation process by engaging in various
discussion topics aligned around the
Transport 2040 goals and the challenges
facing the region. In the last phase of theconsultation, this site was revised to focus
primarily on the funding options available
to TransLink through an interactive online
game intended to educate the public.

8/7/2019 2010 10 Year Transportation and Financial Plan
http://slidepdf.com/reader/full/2010-10-year-transportation-and-financial-plan 33/154
25
A public communications program was
developed to help build understanding of
the challenges facing the region and
TransLink’s role in addressing thesechallenges, as well as to raise awareness
about Transport 2040 and the development
of the 2010 10-Year Base and Supplemental
Plans. Communications material was
provided for the following purposes:
• To share facts from Transport 2040 about
the projected growth of the
Metro Vancouver region and the need to
invest in TransLink’s infrastructure to
maintain the region’s livability and
economic well-being.
• To describe TransLink’s recent
accomplishments and its broad role in
the region.
• To demonstrate TransLink as a
responsible and trustworthy organization
planning for today and the future.
• To clarify TransLink’s mandate and its
role in supporting the livability of this
region.
• To inform the public about the
options/choices under consideration.
• To invite the public to participate in
shaping the 2010 10-Year Plan by
attending a public event, learning and
providing input through
bepartoftheplan.ca and/or contacting
TransLink directly.
The communications media included print
ads in newspapers and TransLink’s ad
reserve, social media (e.g., site blogs,
forums, Twitter), television, radio and online
messages and digital screen messages at
SkyTrain stations.
Qualitative and quantitative market
research was also conducted as a method to
assess public opinion on the options and
reach a different group than those whoparticipated in the other consultation
processes.
Consultation Outcomes
Overall, the public and stakeholders were
supportive of a 10-Year Plan which would
implement the goals of Transport 2040, as
reflected in On Track to Transport 2040, a
path that requires an additional $450 million
of funding. Strong support was expressed
for substantial investment in more transit
services and an expanded rapid transit
network. There was also strong support forTransLink continuing in its role as a multi-
modal transportation authority, one which
either maintains or expands its role in
regional roadways, bridges and goods
movement, and invests in and delivers
regional cycling infrastructure and
programs.
Consultation input provided a variety of
perspectives about how to fund the new
10-Year Plan. There was recognition that
TransLink needed a diversified funding base
to be sustainable in the long term. Therewas understanding that increases to existing
funding sources allowed for under the
legislation would have to play a part in the
funding strategy. There was strong support
for introducing a Transportation
Improvement Fee, especially one that used a
variable fee structure that reflected vehicle
emissions. Filling in the remaining funding
gap required to achieve On Track to
Transport 2040 generated a variety of
opinions, but consistent messages included
support for new funding sources that wouldhave an impact on transportation use and
more substantial and stable funding from
senior government.

8/7/2019 2010 10 Year Transportation and Financial Plan
http://slidepdf.com/reader/full/2010-10-year-transportation-and-financial-plan 34/154
2. Transportationand FinancialPlan

8/7/2019 2010 10 Year Transportation and Financial Plan
http://slidepdf.com/reader/full/2010-10-year-transportation-and-financial-plan 35/154
27
2.1 Overview
Defining theInvestment Level
This chapter details the 2010 10-Year Base
Plan and is based upon no new revenues
beyond the inflationary-based increases
allowed by the Act . This plan is based on the
Drastic Cuts option presented during
consultation, which includes only theinvestments, services and programs that
TransLink is able to commit to with the
existing revenues provided for under the
legislation. The implications are that
TransLink will be investing in no new capital
beyond basic state-of-good-repair and all
programs and services will be evaluated for
possible reduction or elimination, as deemed
necessary under the financial constraints.
The plan development process recognized
the full magnitude of investments TransLink
believes would be needed to progresstowards the goals of Transport 2040. To
successfully implement On Track to a
Sustainable Region, supplemental revenues
in the order of $450 million a year for the
next 10 years are required.
This chapter describes the services that
TransLink will provide, the infrastructure
investments that are available to maintain
infrastructure, the operating costs necessary
to efficiently run the services and a summary
of the total cost and funding sources under
the 2010 10-Year Base Plan.
Principles forPrioritizing Services
A sequence of priorities has been
established to guide the allocation of
available funding to the transportation
needs of the region. TransLink’s principles
for establishing these priorities are as
follows:
• Ensure compliance with the SCBCTA Act .
• Seek further efficiencies in existing
services.
• Maintain TransLink involvement in multi-
modal activities.
• Expand and upgrade only on
contractually-committed projects
• Maintain state-of-good-repair on
TransLink assets.
• Maximize revenue generation within
parameters of a base plan.
• Strive to minimize impacts.
TransLink has the responsibility to ensure
that its assets are kept in a state of good
repair so that public and private
transportation can continue to operate. On
its own, the cost of replacing the transit
fleet as it wears out is over $500 million
during the 10 years from 2010 to 2019. This
Base Plan strives to balance the necessity of
maintenance with the goal of providing thegreatest possible level of existing services
within the funding available.

8/7/2019 2010 10 Year Transportation and Financial Plan
http://slidepdf.com/reader/full/2010-10-year-transportation-and-financial-plan 36/154
28
Coordinating with
Land UseWhile Transport 2040 aims to double the
share of walking, cycling and transit in the
region by 2040, the investments in the
transit, cycling and road networks provided
for in this Base Plan will roll back the
infrastructure and services that the public
could use to travel within the region
without relying on the automobile.
TransLink will continue to take an active role
to attempt to ensure that the density and
design of land uses around transportationassets, particularly rapid transit stations, is
transit-oriented and supports walking,
cycling and transit usage. TransLink is
working with municipalities to achieve these
objectives through the Station Upgrade
Program, the Station Area Infrastructure
Program and TransLink’s Real Estate
Program by establishing Municipal
Framework Agreements to guide
collaborative planning and investments.
However, with no funding for rapid transit
upgrades or expansion, TransLink would not
be making supportive real estate
acquisitions.
Frequent Transit Network – GuidingConceptIn the 2010 10-Year Base Plan, the Frequent
Transit Network (FTN) will be dramatically
reduced and will not be an effective tool for
serving and shaping sustainable travel
behaviour in Metro Vancouver. This is at
odds with the objectives of the RegionalGrowth Strategy.
TransLink’s implementation of the FTN
concept in 2007 was a major step towards
making the land use and transportation
connection. TransLink’s FTN is defined as an
interconnected network of corridors where
transit service is provided every 15 minutes
or better from early morning and into the
evenings, every day of the week. The FTN
aims to coordinate decisions and actions by
various stakeholders related to transit
service provision, land use and developmentpolicy and infrastructure design. The
objective is to match the provision of a very
high level of transit service to transit-
supportive corridors and town centres.
The FTN includes rail rapid transit, bus rapid
transit and bus and trolley routes in the
region. As shown in Figure 7, the FTN will
include a network corridor length of
463 kilometres by the end of 2009,
consisting of:
• 66 km of rapid transit on three SkyTrain
lines
• 27 km of limited-stop B-Line bus service
• 370 km of frequent bus service

8/7/2019 2010 10 Year Transportation and Financial Plan
http://slidepdf.com/reader/full/2010-10-year-transportation-and-financial-plan 37/154
29
Figure 7 – Frequent Transit Network in 2009

8/7/2019 2010 10 Year Transportation and Financial Plan
http://slidepdf.com/reader/full/2010-10-year-transportation-and-financial-plan 38/154
30
2.2 TransportationReductions andInvestments
Transit Services
The service implications of the 2010 10-
Year Base Plan on TransLink’s transit
services are unprecedented (Table 1). The
following pages outline TransLink’s
strategy for striving to minimize the
impacts of the necessary transit service
reductions. The following priorities will
guide the allocation of transit service
resources:
• Well-established and growing markets
over building new markets.
• Maintaining fare revenue.
• High productivity routes.
• Core services on key corridors.
• Regional connectivity.
• Connections to rapid transit corridors.
• Efficient use of existing infrastructure.
Table 1 – Transit Service Level Summary for 2010 10-Year Base Plan

8/7/2019 2010 10 Year Transportation and Financial Plan
http://slidepdf.com/reader/full/2010-10-year-transportation-and-financial-plan 39/154
3
Transit Services in 2009TransLink provides an integrated network
of transit services across a variety of
modes, including bus, light rail, commuterrail and marine. With an integrated fare
structure, customers can easily transfer
across modes and often have multiple
options to get to their destinations.
TransLink will provide 6.62 million hours
of annual transit service in 2009.
Rapid Transit
Rapid Transit consists of high-capacity
services provided with buses or trains in
dedicated rights-of-way and as part of the
Frequent Transit Network. As of
September 2009, the TransLink system hasthree rail rapid transit lines:
1. Expo Line – 29 kilometres long with
20 stations between Waterfront
(downtown Vancouver) and King
George (Surrey).
2. Millennium Line – 20 kilometres long
with 13 stations between VCC-Clark
(Vancouver) and Columbia (New
Westminster). Millennium Line trains
continue along the Expo Line from
Columbia to Waterfront.
3. Canada Line – 19.5 kilometres long
with 16 stations between Waterfront,
Vancouver Airport and Richmond
Centre
Bus
TransLink operates over 200 bus routes
throughout the region with over
1,600 conventional bus and community
shuttles providing a variety of services to
meet customer needs. This includes a
network of buses on arterial roads, ofwhich 36 routes are currently on the FTN,
12 routes provide NightBus service,
64 community shuttle routes that serve
local neighbourhoods and two high-
frequency, limited stop B-Line services
(97 and 99 B-Lines) on major corridors. The
98 B-Line will be discontinued with the
launch of the Canada Line scheduled in
2009.
TransLink uses a variety of vehicles to
match the geography and ridership
demands of the service. The entire fleet is
accessible and capable of carrying bikes
and includes diesel buses, electric trolley-
buses and community shuttles. TransLink
also utilizes buses fuelled by Compressed
Natural Gas (CNG) and new diesel-electric
hybrid buses.
Bus service currently carries the majority
of transit passengers, accounting for
73 per cent of boardings, or 221 millionboarded passengers per year.
SeaBus
A key link between the North Shore and
the rest of the transportation services, the
SeaBus passenger ferry service operates
two vessels between Waterfront Station in
Downtown Vancouver and Lonsdale Quay
in North Vancouver. Each vessel is capable
of carrying 400 passengers and service
operates every 15 minutes during the day
and every 30 minutes in the early
mornings and evenings. SeaBus ridership isincreasing; 5.5 million passengers were
served in 2008, an increase of 2.5 per cent
over 2007.
West Coast Express
TransLink’s Regional Connector Services,
the West Coast Express (WCE), provides
commuter services between Mission and
Downtown Vancouver via Maple Ridge,
Pitt Meadows, Port Coquitlam, Coquitlam
and Port Moody. WCE operates five rail
trips in the westbound direction fromMission to Waterfront Station during the
morning peak hours and five return trips
during the evening peak hours. Rail
service operates on track owned by
Canadian Pacific Railway through a
negotiated agreement. WCE TrainBus

8/7/2019 2010 10 Year Transportation and Financial Plan
http://slidepdf.com/reader/full/2010-10-year-transportation-and-financial-plan 40/154
32
operates limited services on the corridor
during off-peak periods and weekends.
Ridership has increased by almost
40 per cent during the last five years, with2.4 million passengers served in 2008.
Custom Transit
Custom transit services and the
supplementary TaxiSaver Program provide
transportation for those customers who
are not able to use conventional accessible
transit vehicles. Custom transit, operated
as HandyDART, is a shared ride, pre-
booked, door-to-door service that uses
specialized lift-equipped vehicles for
registered customers. Custom transit
provided 1.36 million passenger trips in2008.
Key Approaches to PlanningTransit ServicesUnder the 2010 10-Year Base Plan,
TransLink will continue to plan for the
region’s transportation long-term needs in
the event that increased funding is made
available in subsequent years. If additional
funds are not identified and secured
within several years, then most of these
planning and guiding functions would be
curtailed or halted until the financial
situation changes.
An integrated transit system requires an
integrated approach to planning across all
modes. The system must also have a
robust and accessible network that feeds
rapid transit corridors. To achieve these
objectives, TransLink strives to optimize
existing services to improve efficiency and
effectiveness, provide resources to
maintain service standards for reliabilityand quality and, in the longer-term, invest
in proactive transit services to attract new
riders into the system. These initiatives are
determined, in part, through the Area
Transit Plan process and through
individual transit initiatives, such as the
Frequent Transit Network.
Area Transit Plans
TransLink does not have the resources in
the 2010 10-Year Base Plan to implement
Area Transit Plans but will continue
planning efforts in the near-term inanticipation of future needs and funding.
Area Transit Plans describe current and
future transit services on a sub-regional
and more local basis and are developed in
partnership with the affected
municipalities. The current Area Transit
Plans are summarized in Table 2. The Area
Transit Plans identify a longer-term vision,
as well as a ranking of shorter-term
priorities for improvements to each area’s
transit system. These improvements
address transit service, transit priority
measures and, transit facilities, as well as
the amenities and accessibility of those
facilities. The Area Transit Plans prioritized
ranking guides the implementation timing
for local transit improvements, a process
which takes place on an annual basis
through the 10-year plans.

8/7/2019 2010 10 Year Transportation and Financial Plan
http://slidepdf.com/reader/full/2010-10-year-transportation-and-financial-plan 41/154
33
Table 2 – Current Area Transit Plans
Station Upgrades and Station Area
Plans
The 2010 10-Year Base Plan does not
include funding to upgrade stations or
implement station area plans. However,
planning for station upgrades and station
area plans would continue in the
near-term in anticipation of future needs
and resources being allocated. TransLink
has historically invested in stations and the
surrounding areas to provide passenger
facilities that meet access and capacityneeds and create the passenger
experience needed to keep existing
customers and attract new ridership.
The Station Upgrade Program provides
the framework for prioritizing, planning
and funding a range of station upgrade
needs relating to capacity, station
access/accessibility, passenger environment
and amenity, security and neighbourhood
integration for the stations and the
surrounding areas. The aim is to maximize
the benefit of existing transitinfrastructure by improving the
connection between transit facilities and
services, adjacent developments and the
neighbourhoods in which they reside.
Passenger environments which are safe,
secure and accessible and offer high levels
of passenger amenities can foster
increased use of transit cycling and
walking; a poor station environment can
be a significant barrier to using transit. In
partnership with municipalities, station
area planning addresses the nature of the
land use, as well as the quality of
pedestrian and cycling connections in the
immediate station area.
Optimizing Existing Services
Resource Allocation
TransLink monitors transit usage and
optimizes service levels and quality
without increasing the volume of service
provided or number of buses required by
allocating vehicles with the appropriate
capacity. For example, by using larger
articulated buses on heavily used transit
routes, TransLink has the ability to
accommodate customer demand that
exceeds the capacity of a standard 40-foot
bus. Likewise, in emerging areas and/orareas of marginal ridership, TransLink can
provide transit service with community
shuttles, which are more appropriately
scaled to meet lower ridership demands.

8/7/2019 2010 10 Year Transportation and Financial Plan
http://slidepdf.com/reader/full/2010-10-year-transportation-and-financial-plan 42/154
34
Maintaining Service Standards and Service
Quality
Maintaining transit service reliability and
quality is a high priority. TransLink hashistorically made investments on an
ongoing basis to maintain service
reliability and quality. TransLink will not
have resources in the 2010 10-Year Base
Plan to maintain those standards but will
seek to minimize the negative impacts
resulting from service cuts.
TransLink’s Transit Service Guidelines will
be used to guide potential service cuts and
revisions so that evaluation is done in a
fair and consistent manner.
Transit and Pedestrian Priority Corridors
TransLink works with municipalities to
take an integrated approach to street and
urban design improvements that will
improve transit efficiency and the
pedestrian experience. Transit and
pedestrian priority measures improve
transit speed and reliability, whilemitigating the negative impacts of
vehicular traffic, helping to maintain a
livable environment for residents and
providing an enjoyable place for visitors.
Planning will continue in the near-term,
however, resources for implementation
are not included in the 2010 10-Year Base
Plan.
2010 – 2019 InvestmentsThe investments in rapid transit, bus,
SeaBus, regional connector services and
custom transit for the 2010 10-Year BasePlan are described in this section. The
service cuts laid out in this Plan will result
in fewer people using transit. Ridership
forecasts are included in Figure 8.
Figure 8 – Transit Ridership Projections
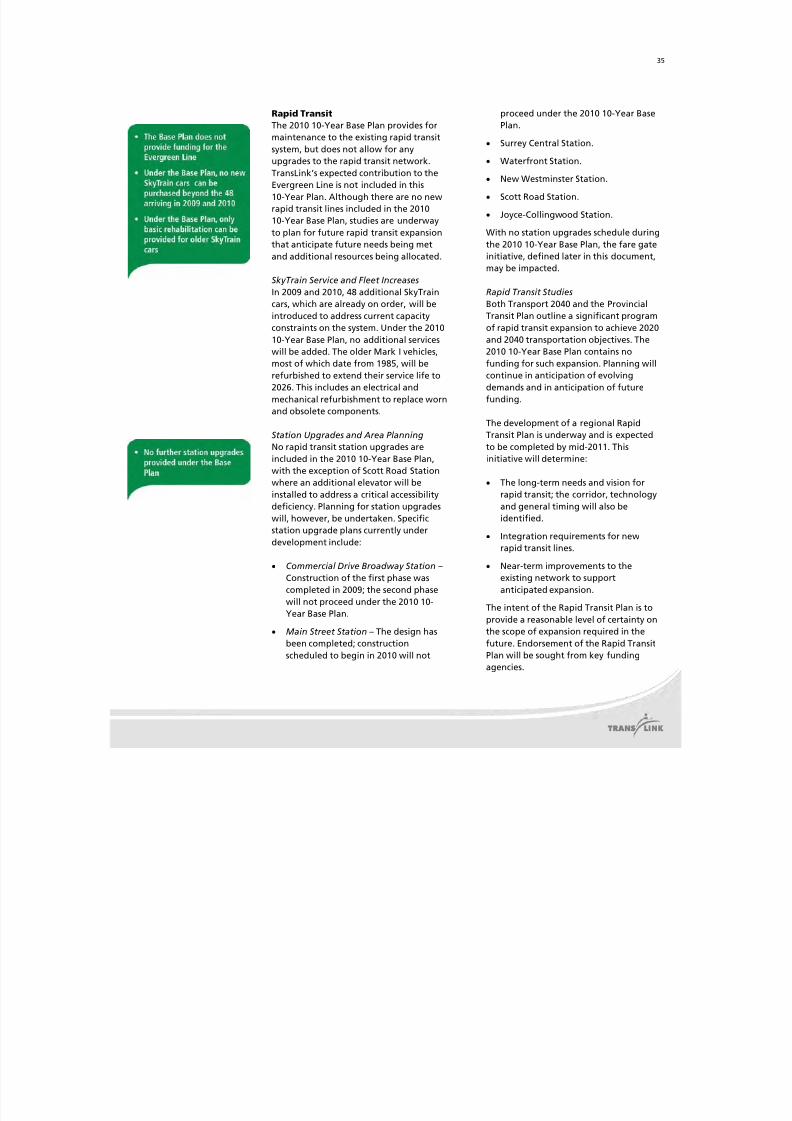
8/7/2019 2010 10 Year Transportation and Financial Plan
http://slidepdf.com/reader/full/2010-10-year-transportation-and-financial-plan 43/154
35
Rapid Transit
The 2010 10-Year Base Plan provides for
maintenance to the existing rapid transit
system, but does not allow for anyupgrades to the rapid transit network.
TransLink’s expected contribution to the
Evergreen Line is not included in this
10-Year Plan. Although there are no new
rapid transit lines included in the 2010
10-Year Base Plan, studies are underway
to plan for future rapid transit expansion
that anticipate future needs being met
and additional resources being allocated.
SkyTrain Service and Fleet Increases
In 2009 and 2010, 48 additional SkyTrain
cars, which are already on order, will beintroduced to address current capacity
constraints on the system. Under the 2010
10-Year Base Plan, no additional services
will be added. The older Mark I vehicles,
most of which date from 1985, will be
refurbished to extend their service life to
2026. This includes an electrical and
mechanical refurbishment to replace worn
and obsolete components.
Station Upgrades and Area Planning
No rapid transit station upgrades are
included in the 2010 10-Year Base Plan,
with the exception of Scott Road Station
where an additional elevator will be
installed to address a critical accessibility
deficiency. Planning for station upgrades
will, however, be undertaken. Specific
station upgrade plans currently under
development include:
• Commercial Drive Broadway Station –
Construction of the first phase was
completed in 2009; the second phase
will not proceed under the 2010 10-Year Base Plan.
• Main Street Station – The design has
been completed; construction
scheduled to begin in 2010 will not
proceed under the 2010 10-Year Base
Plan.
• Surrey Central Station.
• Waterfront Station.
• New Westminster Station.
• Scott Road Station.
• Joyce-Collingwood Station.
With no station upgrades schedule during
the 2010 10-Year Base Plan, the fare gate
initiative, defined later in this document,
may be impacted.
Rapid Transit Studies
Both Transport 2040 and the ProvincialTransit Plan outline a significant program
of rapid transit expansion to achieve 2020
and 2040 transportation objectives. The
2010 10-Year Base Plan contains no
funding for such expansion. Planning will
continue in anticipation of evolving
demands and in anticipation of future
funding.
The development of a regional Rapid
Transit Plan is underway and is expected
to be completed by mid-2011. This
initiative will determine:
• The long-term needs and vision for
rapid transit; the corridor, technology
and general timing will also be
identified.
• Integration requirements for new
rapid transit lines.
• Near-term improvements to the
existing network to support
anticipated expansion.
The intent of the Rapid Transit Plan is toprovide a reasonable level of certainty on
the scope of expansion required in the
future. Endorsement of the Rapid Transit
Plan will be sought from key funding
agencies.
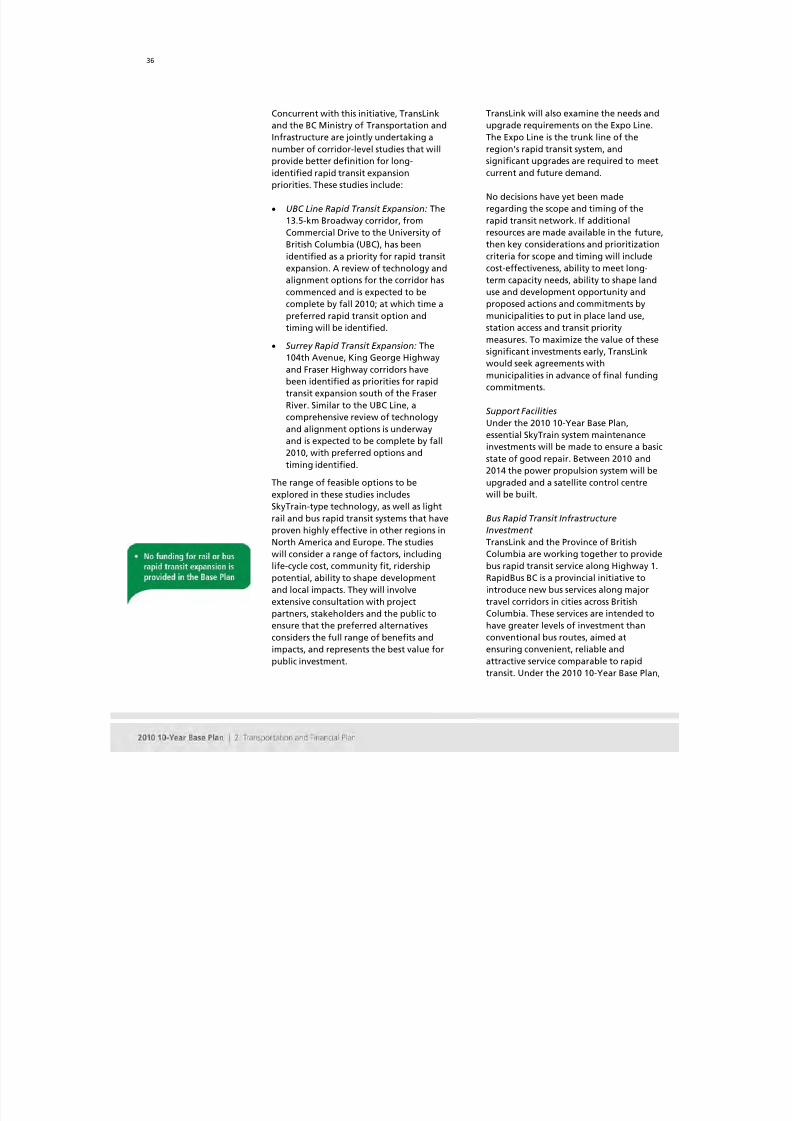
8/7/2019 2010 10 Year Transportation and Financial Plan
http://slidepdf.com/reader/full/2010-10-year-transportation-and-financial-plan 44/154
36
Concurrent with this initiative, TransLink
and the BC Ministry of Transportation and
Infrastructure are jointly undertaking a
number of corridor-level studies that willprovide better definition for long-
identified rapid transit expansion
priorities. These studies include:
• UBC Line Rapid Transit Expansion: The
13.5-km Broadway corridor, from
Commercial Drive to the University of
British Columbia (UBC), has been
identified as a priority for rapid transit
expansion. A review of technology and
alignment options for the corridor has
commenced and is expected to be
complete by fall 2010; at which time apreferred rapid transit option and
timing will be identified.
• Surrey Rapid Transit Expansion: The
104th Avenue, King George Highway
and Fraser Highway corridors have
been identified as priorities for rapid
transit expansion south of the Fraser
River. Similar to the UBC Line, a
comprehensive review of technology
and alignment options is underway
and is expected to be complete by fall
2010, with preferred options andtiming identified.
The range of feasible options to be
explored in these studies includes
SkyTrain-type technology, as well as light
rail and bus rapid transit systems that have
proven highly effective in other regions in
North America and Europe. The studies
will consider a range of factors, including
life-cycle cost, community fit, ridership
potential, ability to shape development
and local impacts. They will involve
extensive consultation with projectpartners, stakeholders and the public to
ensure that the preferred alternatives
considers the full range of benefits and
impacts, and represents the best value for
public investment.
TransLink will also examine the needs and
upgrade requirements on the Expo Line.
The Expo Line is the trunk line of the
region’s rapid transit system, andsignificant upgrades are required to meet
current and future demand.
No decisions have yet been made
regarding the scope and timing of the
rapid transit network. If additional
resources are made available in the future
then key considerations and prioritization
criteria for scope and timing will include
cost-effectiveness, ability to meet long-
term capacity needs, ability to shape land
use and development opportunity and
proposed actions and commitments bymunicipalities to put in place land use,
station access and transit priority
measures. To maximize the value of these
significant investments early, TransLink
would seek agreements with
municipalities in advance of final funding
commitments.
Support Facilities
Under the 2010 10-Year Base Plan,
essential SkyTrain system maintenance
investments will be made to ensure a basic
state of good repair. Between 2010 and2014 the power propulsion system will be
upgraded and a satellite control centre
will be built.
Bus Rapid Transit Infrastructure
Investment
TransLink and the Province of British
Columbia are working together to provide
bus rapid transit service along Highway 1.
RapidBus BC is a provincial initiative to
introduce new bus services along major
travel corridors in cities across BritishColumbia. These services are intended to
have greater levels of investment than
conventional bus routes, aimed at
ensuring convenient, reliable and
attractive service comparable to rapid
transit. Under the 2010 10-Year Base Plan,

8/7/2019 2010 10 Year Transportation and Financial Plan
http://slidepdf.com/reader/full/2010-10-year-transportation-and-financial-plan 45/154
37
TransLink has no funding to launch the
service but would support the
infrastructure development in anticipation
of future needs and further operationsfunding.
Bus Services
Due to the funding shortfall, dramatic
reductions in bus services are required
under the 2010 10-Year Base Plan. Bus
service is the largest element of
TransLink’s operating budget. In
developing the 2010 10-Year Base Plan
TransLink looked for all possible
reductions before reducing bus services,
but as bus service requires such a large
component of TransLink’s operating costs,large service reductions would be
unavoidable.
Bus service levels are measured in units of
annual service hours. As a reference point,
one bus in service for 12 hours is 12 service
hours and 10 buses in service for 12 hours
is 120 service hours. TransLink will provide
almost 5 million annual bus service hours
in the Metro Vancouver area in 2009.
TransLink will need to cut annual bus
service by approximately 2 million service
hours to meet the expenditure reduction
requirements of the 2010 10-Year Base
Plan (Figure 9). This represents a bus
service reduction of approximately
40 per cent. These reductions apply to
both conventional bus and Community
Shuttle services.
A 40 per cent reduction in bus service will
have an enormous impact on the public
transit system. In making cuts of this
magnitude to bus service, many issues will
be carefully considered, and the overallefficiency and effectiveness of services will
be examined. Criteria and guiding
principles for making service cuts will be
developed. Some of these guiding
principles will include, but not be limited
to, the following:
• Retaining high-cost recovery routes.• Prioritizing peak-period service.
• Minimizing overlapping services.
• Eliminating recent proactive transit
service expansion that serves new areas
or areas of low density.
The impact of service cuts on residents,
who will no longer have any access to
public transit, will be examined.
Productivity will be the primary criteria for
determining where and at what timesservice cuts will be implemented. Route
productivity is generally linked to time of
day and day of the week; TransLink will
make every effort to retain service on the
most productive routes, at the most
productive times of day and the most
productive days of the week. Based on
preliminary analyses, some examples of
where service reductions are likely to
occur and high-level estimates on the
magnitude of those cuts include:
• Peak periods, Monday to Friday – one-quarter of services cut.
• Mid-day, Monday to Friday – one-third
of services cut.
• Evenings, Monday to Friday – over one
third of services cut.
• Late Evenings, Monday to Friday – two
thirds of services cut.
• Saturdays – over one-third of services
cut.
• Sundays/Holidays – one-half of servicescut.
TransLink will work with the operating
subsidiaries on implementing these service
reductions by the end of 2011.

8/7/2019 2010 10 Year Transportation and Financial Plan
http://slidepdf.com/reader/full/2010-10-year-transportation-and-financial-plan 46/154
38
Figure 9 – Annual Bus Service Hours 2002-2019 (Base service levels as of January 1)
Bus Fleet Replacement
Under the 2010 10-Year Base Plan,
TransLink will only purchase replacement
buses for the current fleet as each bus
reaches the end of its service life. The bus
fleet will not grow with populationgrowth; therefore, the number of buses
per capita will decline. TransLink replaces
buses on a regular cycle using replacement
criteria that include age, mileage,
maintenance costs and emissions. On
average, replacement occurs at
approximately 17 years for diesel and
hybrid buses, 20 years for trolley buses,
seven years for Community Shuttles and
six to eight years for HandyDART vehicles.
TransLink’s emissions policy is used to
guide the replacement purchases.
To replace the fleet as vehicles reach the
end of their useful lives, a total of 1,377
buses over the 10-year period will be
purchased, including:
• 505 40-foot buses
• 99 60-foot articulated trolley buses
• 291 Community Shuttles
• 482 HandyDART vehicles
SeaBus
Both existing SeaBus vessels will be
replaced. One new vessel has been
purchased and will arrive in the fall of
2009. Decommissioning of one of the
existing vessels will be delayed until after
the 2010 Olympic and Paralympic Winter
Games (the Games) to enable operation of
three vessels and provision of 10-minute
frequencies during the Games. Following
the Games, one of the older vessels will be
retired and the service will revert back to
two vessels.
TransLink’s Emissions Policy,
adopted in 2007, reflects its
commitment to reducing
emissions through the
following initiatives:
• Surpass regulations by
purchasing buses that
exceed emissions standards,
where available.
• Retrofit older diesel buses
with new emission control technologies, including
diesel particulate filters and
diesel oxidization catalysts.
• Deploy alternative
technology vehicles, such as
diesel-electric hybrids, on
routes where the benefits
will be maximized.
• Move toward cleaner fuels,
such as 20 per cent
biodiesel use for the entire
fleet.• Increase fuel efficiency
through the use of fuel-
efficient buses and reduced
idling.

8/7/2019 2010 10 Year Transportation and Financial Plan
http://slidepdf.com/reader/full/2010-10-year-transportation-and-financial-plan 47/154
39
West Coast Express
Under the 2010 10-Year Base Plan,
TransLink will continue operating five
West Coast Express trains in the morningand the evening on weekdays. However,
the seven additional cars that are
currently on order and expected to arrive
in late summer/early fall 2010 will be sold.
In addition, TrainBus service hours will be
reduced. Infrastructure requirements may
force TransLink to re-evaluate this service.
Custom Transit
Twenty-five new vehicles were added to
the HandyDART fleet in 2009, increasing
the fleet by approximately 7 per cent. For
2010, no additional vehicles are plannedand 28 vehicles will be replaced. Based on
the Access Transit Strategy, the goal is to
increase the availability of service for
short-notice trips (24 hours or less
booking) to match the level of mobility
offered by the rest of the transportation
system. In the 2010 10-Year Base Plan,
service hours for 2010 will be reduced by
approximately 10 per cent over 2009 levels
and the TaxiSaver supplement will be
capped at the 2009 amount of
$2.1 million.
Transit Facilities and Environments
Transit and Pedestrian Priority Corridors
Planning for transit and pedestrian
priority measures along Fraser Street and
Victoria Drive began in 2009 and will
continue through 2010 and 2011. These
two streets, while important arterial
roadways, also serve as important
commercial streets for several
neighbourhoods in the City of Vancouver.
Funding for implementation of these
projects is not included in the 2010 10-Year Base Plan.
Transit Exchange Upgrade Program
The purpose of the Transit Exchange
Upgrade Program is to improve passenger
facilities and support the Frequent Transit
Network, as well as address capacity and
access issues in key locations. The
identified upgrade projects are not
included in the 2010 10-Year Base Plan.
Transit Passenger Facility Design
Guidelines
As Metro Vancouver's transit system has
grown, each new component has been
designed to a different set of standards.
As a result, capacity, accessibility, security,
ease of transfer and passenger comfort
and convenience vary widely across
facilities. Design guidelines will provide
consistency and immediate direction for
the design work required for each new
project. These guidelines are expected tobe completed in 2010 and will inform
future upgrades of aging facilities when,
and if, additional revenues are made
available.
Electronic Fare Card and Faregates
The Electronic Fare Card (smartcard) and
Faregate Project involves the introduction
of an electronic fare card ticketing
technology into TransLink’s public
transportation system, together with the
introduction of controlled access on the
SkyTrain system. This initiative willimprove core business management of the
transit system.
Smartcard
The implementation of a smartcard for
fare payment is a key initiative to increase
customer convenience, improve transit
service quality, increase revenue and
provide improved data relating to the use
of the system and needs of customers.
A smartcard is the size of a credit card andcontains an embedded microchip that can
store prepaid fares on the card. The card
then interacts with a smartcard reader on
a transit vehicle, rail platform or other
location to pay the appropriate fare and
record the transaction.

8/7/2019 2010 10 Year Transportation and Financial Plan
http://slidepdf.com/reader/full/2010-10-year-transportation-and-financial-plan 48/154
40
The use of the smartcard allows a more
flexible fare structure, including distance
based fares and discounts for off-peak
travel, while simplifying payment for thecustomer. It will also provide better
information on customer travel patterns
and vehicle loadings to enable service
improvements and operational
efficiencies.
The smartcard technology will be fully
implemented across the TransLink
transportation system, including bus,
HandyDART, rapid transit, SeaBus and
West Coast Express commuter rail.
Controlled Access (Faregates)Controlled access refers to the installation
of entry and exit barriers, or faregates, at
SkyTrain stations. Customers enter and
typically exit through a mechanical
turnstile or gate that opens when a valid
fare media is checked by an electronic
reader.
The installation of gates at rapid transit
stations was identified as a priority in the
2008 Provincial Transit Plan as a means to
increase security, enhance customer
safety, reduce fare evasion and increase
the benefits that could be realized from
the introduction of smartcards. The
provincial and federal governments are
providing financial support to implement
this project.
The current plan for the Faregate Project
is based on the assumption of a phased
implementation. While the intention is to
fully gate the rapid transit system, some
stations have priority due to their level of
ridership or strategic location, whileothers are relatively easy and inexpensive
to gate.
These stations will be targeted for the first
phase of implementation. Stations that
require more significant upgrades or
rebuilding will be gated when the stationupgrades are completed, but no funding
for this is included in the 2010 10-Year
Base Plan.
Cycling Program
Over the past 10 years, TransLink has
worked in partnership with municipalities
and invested in cycling facilities and
initiatives, spending approximately
$34 million during that period. Recent
investments include the Canada Line BikeBridge and the Central Valley Greenway.
TransLink has provided support to
programs covering the “five Es” of bicycle
planning to attract interested but
concerned individuals to cycling.
1. Engineer solutions to improve the
cycling network, end-of-trip facilities,
bicycle-transit integration and access
to bicycles.
2. Educational programs to providecyclists and motorists with training to
increase road user awareness and
compliance with safe practices.
3. Encouragement initiatives,
including marketing and incentive
programs, to increase awareness and
change behaviour.
4. Enforcement and legislation
initiatives to improve traffic safety
and reduce bicycle theft.
5. Evaluation processes to help ensurethat the goals and targets of the
Regional Cycling Strategy are being
met.

8/7/2019 2010 10 Year Transportation and Financial Plan
http://slidepdf.com/reader/full/2010-10-year-transportation-and-financial-plan 49/154
4
Under the 2010 10-Year Base Plan, the
annual cycling program would be reduced
by 80 per cent. The cycling budget will be
reduced to $1 million a year from thecurrent funding level of $6 million. At this
reduced level, TransLink will only be able
to fund cycling improvements that provide
direct benefit to connecting transit and
cycling and contribute funding to
regionally-significant projects on a much
reduced basis.
TransLink is preparing a Regional Cycling
Strategy that will provide direction to
implementing new infrastructure, services
and programs to increase cycling when
funding is available. Cycling facility designand maintenance guidelines will be
developed. TransLink will work with police
forces and other partners to implement
strategies to reduce bicycle theft.
Under the 2010 10-Year Base Plan,
TransLink will not be able to cost-share
projects that are initiated by the
municipalities and/or the provincial
government. While TransLink may be able
to fund minor upgrades to sections of the
BC Parkway and the Central Valley
Greenway, there would be no expansion
of the regional cycling network.
Roads and Bridges
TransLink provides planning, funding and
coordination for more than 2,300 lane-
kilometres of regionally-significant
roadways, referred to as the Major Road
Network (MRN), as shown in Figure 10.
The SCBCTA Act empowers TransLink to
establish guidelines to identify whichroads become part of the MRN; establish
standards for management, operation,
construction and maintenance; as well as
review and approve all proposed changes
to the MRN that could result in a
reduction of people-moving capacity orprohibit truck movement. The Act also
requires TransLink to fund municipalities
for maintenance and construction if the
standards are being met, and to designate
routes and times for dangerous goods
movement.
TransLink also owns a number of major
structures, such as the Pattullo Bridge,
Knight Street Bridge, Westham Island
Bridge and the recently completed Golden
Ears Bridge, connecting Langley and
Surrey on the south side of the FraserRiver with Maple Ridge and Pitt Meadows
on the north side.
A Major Road Network Strategy is
currently being developed and will include
a review of current funding criteria with
the objective of aligning MRN capital
funding with the MRN goals. These goals
are:
• To establish a MRN that facilitates
intra-regional transportation of people
and goods, and provides links to
provincial highways and other inter-
regional transportation modes.
• To establish a MRN that connects
designated regional town centres and
major trip generators.
• To optimize the capacity of the MRN
for efficient movement of people and
goods.
• To provide travel on the MRN that is
safe and reliable.

8/7/2019 2010 10 Year Transportation and Financial Plan
http://slidepdf.com/reader/full/2010-10-year-transportation-and-financial-plan 50/154
42
Figure 10 – Major Roads, Highways and Gateways

8/7/2019 2010 10 Year Transportation and Financial Plan
http://slidepdf.com/reader/full/2010-10-year-transportation-and-financial-plan 51/154
43
The 2010 10-Year Base plan allocates
funding to allow TransLink to complete
the following current projects with
previously-approved contractualcommitments:
• Fraser Highway Widening in Surrey –
Fraser Highway from East Whalley Ring
Road to 196th Street is being widened
to an interim four-lane arterial
standard. Construction started in 2004
and is to be completed by 2010.
TransLink has approved $45 million of
major capital funding, with additional
funding provided by the City of Surrey
and the Canada/British Columbia
Infrastructure Program.
• Coast Meridian Overpass – TransLink
has committed to providing up to
$60 million of major capital funding,
with the City of Port Coquitlam
funding all costs over that amount, to
provide a new north-south link for
motor vehicles, transit, pedestrians and
cyclists over the Canadian Pacific
Railway yard. Construction will be
completed in 2010.
• Roberts Bank Rail Corridor – In 2007,
TransLink signed an agreement-in-
principle with 12 other funding
partners, including Transport Canada,
the Province of British Columbia, Port
Metro Vancouver and various railways
and municipalities, to collectively
contribute $307 million to the Roberts
Bank Rail Corridor Program. This
program will result in the construction
of a number of grade-separated
railway crossings to reduce the impact
of train traffic heading to and from
the Port at Roberts Bank on theregional road system. TransLink’s
contribution is to administer the
completion of these projects as part of
its $50 million commitment.
• Pattullo Bridge – In 2008, TransLink
committed to replace the aging bridge
structure with a new bridge crossing to
be financed through tolls. This majorcapital project has been initiated in
2009 with a functional design study
that will include definition of the
alignment and connections, a
preliminary traffic and revenue study,
business plan preparation and public
consultation and outreach. TransLink
anticipates that the planning phase of
this project will occur over the next
two years and that bridge construction
will follow. Under the 2010 10-Year
Base Plan, the Pattullo Bridge would
be replaced under a cost recoverymodel; the bridge will be tolled.
Under the 2010 10-Year Base Plan,
TransLink’s funding and involvement in
the following programs and projects will
be suspended:
• The MRN Minor Transit Capital
Program (Funded at $20 million
annually since 2003).
• The MRN Major Capital Program,
including the following projects:
• North Fraser Perimeter Road
• Low-level Road (North Vancouver)
• Murray-Clarke Connector
Operation, Maintenance andRehabilitationAs part of its MRN commitments,
TransLink has provided operations,
maintenance and rehabilitation (OMR)
funding for the MRN to the municipalities
Recent analysis has determined that
approximately $19,100 per lane-kilometrein 2009 is required to fund adequate
maintenance. Under the 2010 10-Year
Base Plan, OMR funding would be at only
25 per cent of this level, corresponding to
approximately $4,970 per lane-kilometre.
Cost of Congestion
In 2008, Transport Canada
released studies that estimated
the costs of recurring
congestion (caused by daily
traffic volume) in
Metro Vancouver at over
$500 million annually. In
addition, the costs of
congestion from non-recurring
events, such as construction
and accidents, impose an
additional $400-million burden
on the region. Neither figure
includes the costs incurred due
to delay on goods movement.

8/7/2019 2010 10 Year Transportation and Financial Plan
http://slidepdf.com/reader/full/2010-10-year-transportation-and-financial-plan 52/154
44
Under the 2010 10-Year Base Plan,
TransLink will continue to fund the basic
state-of-good-repair maintenance on the
Pattullo Bridge (until replaced), KnightStreet Bridge and Westham Island Bridge.
Maintenance and operations of the
Golden Ears Bridge is funded through the
tolls on that facility.
Goods Movement
Goods movement is an important part of
the local, provincial and national
economy. The need to support goods
movement and the regional economy is a
fundamental consideration in TransLink’sstrategic investments and planning
programs. In managing the major roads
and bridges in the region, TransLink
collaborates with stakeholders and other
levels of government to support the
preservation of industrial lands and the
efficient movement of goods and freight
within and through the region.
It is clear that the region needs an
integrated approach to supporting goods
movement, and that a shared
commitment to this approach is required
by all stakeholders, including
municipalities, shippers, the trucking
industry, gateway agencies and senior
government. To this end, TransLink will
pursue development of a regional goods
movement strategy with its partners to
guide public policy, priority-setting and
investment decisions going forward.
TransLink will also partner with Transport
Canada and the BC Ministry of
Transportation and Infrastructure in aresearch initiative to establish a better
understanding of freight transportation
and logistics flow in the Lower Mainland
and to identify options for addressing
impediments in the flow of goods.
TransLink will work closely with the
partners to define, fund and manage this
project. It is anticipated that the initial
focus will be primarily on data collection,technical tool development and technical
analyses. In addition, a planned review of
the MRN will include trucking issues
within its scope. Ongoing TransLink
support for, and involvement in, the
Pacific Gateway Strategy will further
enhance the movement of goods as well
as Metro Vancouver’s and Canada’s trade
position in the global marketplace.
Demand-Side
ManagementSuccess in achieving the region’s
sustainability and livability goals will
require both demand-side management
measures and supply-side initiatives in
order to achieve the substantial changes
in travel behaviour that are needed.
The need for demand-side management
was recognized in Transport 2021: Long-
Range Transportation Plan for Greater
Vancouver , written in 1993. It was
explicitly recommended that transport
demand management tools such as road-
pricing, parking management and fuel
taxes were necessary to change travel
behaviour. Since that time, the demand
management strategies that have been
implemented have not been sufficient in
scale and breadth to effectively impact the
region’s dependence on personal vehicle
travel. The fuel tax increases that have
occurred fall well below what was
envisioned in Transport 2021. TransLinkstill lacks the demand-side tools that are
necessary to implement broad and
effective measures in support of the
region’s long term goals.
TransLink’s opening of the
Golden Ears Bridge in 2009
represents a major
accomplishment for
accommodating efficient goods
movement in the region. One
of the key benefits of
the billion-dollar project is the
cost savings that the trucking
sector will receive. These
benefits result from time
savings that are estimated at
20-30 minutes for each crossing
and reduced fuel costs due to
an average 12 km reduction in
trip distance.

8/7/2019 2010 10 Year Transportation and Financial Plan
http://slidepdf.com/reader/full/2010-10-year-transportation-and-financial-plan 53/154
45
Price signals are the most effective form of
demand-side management. The following
sections describe TransLink’s upcoming
analysis – initiatives that will examine howboth the road network and transit system
are priced as well as the role that
TransLink’s TravelSmart program will play
in pursuing the Transport 2040 goals.
Fare Policy ReviewTransit fare is an important source of
revenue for TransLink; it also serves as in
important tool for managing and shaping
transit demand. TransLink’s fare system
will undergo a transformative phase over
the coming years due to anticipated
ridership growth, expansion of the transitnetwork, the trend of increasing use of
pre-paid fare types, the introduction of
the smartcard fare payment and other
factors. It is essential that the overall fare
structure and related policies are reviewed
on a timely basis to ensure consistency
with objectives and responsiveness to
evolving passenger needs. In particular,
review of the following fare policies are of
key interest.
U-Pass: The Vancity U-Pass Program is a
partnership between TransLink, publicly-
funded post-secondary institutions (PSIs)
and student societies that provides
students with a pre-paid, mandatory
transit pass at a reduced rate. At this time,
the Program includes the University of
British Columbia, Simon Fraser University,
Langara College and, most recently,
Capilano University. Strong demand exists
for further expansion of U-Pass to other
PSIs, which currently only have access to
the Fast Trax Program. A review of the
U-Pass Program will be undertaken toexamine overall Program direction, the
effectiveness of the current program
structure and administrative
considerations. Under the 2010 10-Year
Base Plan there can be no further
expansion of the U-Pass Program.
Data and Analytical Tools: A new
smartcard fare payment system is
scheduled to be in place in 2013. One of
the major benefits of having such a systemis that it collects valuable planning data
about transit usage patterns which can, in
turn, be used to both develop a better
understanding of user characteristics and
provide input to develop and support
better analytical processes related to
monitoring and projecting ridership and
revenue. Concurrent with the smartcard
implementation process, a review will be
undertaken to determine and coordinate
longer-term planning data, marketing
research, tool development and other
analytical needs to support fare planningand policy activities.
Road PricingRoad pricing is a broad concept in which
motorists pay directly for using a road,
bridge or tunnel, or for driving in a
defined part of a city. Depending on the
method, road pricing is used to generate
transportation revenue, reduce congestion
and vehicle trips, encourage alternative
travel modes and/or reduce emissions. The
scale and method of road pricing schemes
currently employed in North America and
abroad vary widely, and include project-
and facility-specific tolls/charges,
congestion pricing (which varies by time
of day, vehicle type and/or real-time
congestion levels) and area or cordon
charges.
Road pricing is not a new concept for
Metro Vancouver. Tolls were charged for
the Lions Gate Bridge, the Pattullo Bridge
and the Iron Workers Memorial Bridge
and were removed during the 1950s and1960s. Tolls will be in place for the Golden
Ears Bridge and the new Port Mann Bridge
proposed by the Province of British
Columbia, and are anticipated for the
Pattullo Bridge replacement.

8/7/2019 2010 10 Year Transportation and Financial Plan
http://slidepdf.com/reader/full/2010-10-year-transportation-and-financial-plan 54/154
46
While a regional road pricing mechanism
is not included as a funding source in the
2010 10-Year Base Plan, it is recognized
that road pricing could offer potentialbenefits in terms of a more efficiently
utilized transportation system and
additional revenue for improving the
transportation system in the longer term.
Therefore, the 2010 10-Year Base Plan
includes resources to initiate some
planning research and technical studies
and, depending upon the results, a small-
scale road pricing pilot project to build
awareness and understanding of this
important policy and funding tool.
TravelSmart ProgramTransLink’s TravelSmart program
identifies, designs, promotes and assists in
implementing smart travel choices to help
manage transportation demand. The goal
of this Program is to help reduce overall
single-occupant vehicle trips within
Metro Vancouver.
The TravelSmart Program will focus on
business outreach and individualized
transportation information targeted
directly at households, organizations or
local areas that have expressed an interest
in reducing their reliance on the
automobile. In 2010, TransLink will target
businesses and employers in the
Downtown Core with an Olympic message
of background traffic reduction, as well as
provide outreach to employers along the
Canada Line opening in September 2009.
TransLink provides a wide range of
demand-side management programs
under the TravelSmart identity, supported
by partnerships with employers and otherpublic and private agencies, including:
• Employer Pass Program – This
program provides an approximate
15 per cent fare discount on annual
transit passes to qualifying
organizations. In 2009, TransLink
restructured the program to reduce
administrative requirements, as well
as the minimum size for enrolment(the current threshold requires a
minimum 25 employees per
organization). Under the 2010 10-
Year Base Plan this Program may be
re-evaluated as demand patterns
change and the ability to supply
scarce resources declines.
• Ridesharing (carpooling and
vanpooling) – TransLink provides
funding to Jack Bell Rideshare to
cover the administrative cost of
running two rideshare programs: one
where subscribers are provided with a
vehicle with all expenses covered; and
the second, which provides a free,
online ride-matching service for all
residents in Metro Vancouver.
Demand for ridesharing my increase
substantially under the 2010 10-Year
Base Plan.
• Other TravelSmart Initiatives – These
include telework programs, parking
management strategies,
transportation management
associations, active transportation
programs (walking and cycling) and
Guaranteed Ride Home.
Strategic Initiatives
2010 Olympic and ParalympicWinter GamesIn preparation for hosting visitors from
around the world in February and March
of 2010, TransLink is now working closely
with all involved partner organizations toensure an extraordinary transportation
experience in the Metro Vancouver
region. To achieve this, TransLink’s focus is
on the following key roles:
TransLink has been involved in
planning for the 2010 Olympic
and Paralympic Winter Games
since the bid stage in 2002.

8/7/2019 2010 10 Year Transportation and Financial Plan
http://slidepdf.com/reader/full/2010-10-year-transportation-and-financial-plan 55/154
47
• Providing public transit in
Metro Vancouver for spectators and
workforce to city venues and
celebrations, while continuing toprovide service for existing and new
transit customers.
• Leading regional Transportation
Demand Management (TDM)
strategies and initiatives.
• Co-leading (with the Vancouver
Organizing Committee for the 2010
Olympic and Paralympic Winter
Games) the Transportation
Management Centre that will operate
during the Games period.
An integrated transportation plan for the
Games is being finalized, including
initiatives to reduce background trips into
downtown Vancouver by 30 per cent,
increase transit capacity, enhance
customer support and develop unique
transit passes to encourage ridership. The
Transit Police Service is implementing a
comprehensive transit policing plan for
the Games period. Planning for the Games
is based on a “net cost neutral” principle,
with any incremental costs, except for
legacies, to be borne by the Vancouver
Organizing Committee.
Park and RideCurrently there are almost 6,000 parking
stalls at Park and Ride locations across the
region that enable residents to access
transit and carpool services. TransLink and
its partners need to collaborate to
formulate appropriate strategies and
policies for allocating resources to meet
and manage new and existing demand for
Park and Ride facilities. A regional park-and-ride strategy will be developed that
balances residents’ transportation needs
with municipal and Metro Vancouver land
use objectives, as well as the region’s
broader transportation goals.
Real Estate ProgramUnder the 2010 10-Year Base Plan,
TransLink’s Real Estate Program will
consist of the disposal of a limited numberof existing surplus real estate assets. The
number of properties that will be
surplused will be very restricted due to the
lack of new and more efficient facilities.
TransLink will not be able to undertake
transit integrated real estate development
projects with the funding provided for in
this Base Plan.
WayfindingWayfinding refers to the various types of
information people rely on to plan,
confirm and complete a journey.TransLink’s ability to secure a higher
transit mode share of all trips in the
region requires that wayfinding be
integral to how TransLink plans and
delivers the transportation system.
Effective wayfinding must be clear,
consistent, predictable, self-explanatory
and unified as users move between modes
and across jurisdictions.
In cooperation with municipalities, other
transportation agencies and stakeholders,
TransLink has developed a regional, multi-
modal wayfinding vision and strategy that
lays the groundwork for an integrated
system across the region. Under the 2010
10-Year Base Plan, implementation of this
strategy will not occur.
Legislative RefinementsThe SCBCTA Act has been in place since
2007. The Act provides the overall
governance framework for TransLink, and
lays out the process and requirements for
the development of 10-year plans andlong-term strategies. Preparation of two
10-year plans under this new legislation
has identified issues with the funding
mechanisms available to TransLink, as well
as procedural challenges in developing,
consulting on and adopting 10-year plans

8/7/2019 2010 10 Year Transportation and Financial Plan
http://slidepdf.com/reader/full/2010-10-year-transportation-and-financial-plan 56/154
48
on an annual basis. TransLink will pursue a
dialogue with the provincial government
on potential refinements to the legislation
that reinforces TransLink’s ability toachieve the intent of the Act .
Customer Service
TransLink and its subsidiaries are
committed to responding effectively to
rising customer service expectations, while
balancing service delivery and cost.
TransLink’s customer environment is
growing, diverse, complex and changing.
TransLink will continuously examine ways
of reinforcing a customer-focused andservice-excellence culture. However, under
the 2010 10-Year Base Plan, TransLink will
have limited resources with which to
address many of these issues. Effectiveness
in all of TransLink’s operations will be
measured and reported on annually as
part of the statutory reporting
requirements.
Safety and SecurityTransLink is developing a comprehensive,
integrated risk management system for
safety and security, which includes
emergency management plans to protect
employees, customers, the public, sensitive
information and the infrastructure. This
system applies the all-hazards approach so
that TransLink mitigates threats, hazards,
risks and vulnerabilities to which it could
be susceptible.
TransLink is working with internal and
external partners to manage safety and
security through federal, provincial,
regional and local programs that addressthe needs of all stakeholders. Examples of
the significant work being done in safety
and security include:
• Establishing a Safety Management
System that provides assurances to all
stakeholders that TransLink is
managing the safety of thetransportation system and is
continuously improving on its safety
through best practices.
• Establishing a Security Management
System that manages security across
TransLink, including information/
Information Technology (IT), physical,
criminal and terrorism, and focuses on
communications, coordination and
cooperation with all levels of
government and law enforcement
agencies to prevent and prepare for
threats.
• Establishing an Emergency
Management System that will
manage threats, hazards and risks
that TransLink could be vulnerable to
and may have to respond to/recover
from in a resilient manner.
• Engaging stakeholders through
awareness and education to mitigate
and manage the risks we face
individually and corporately, both
internally and externally.
Transit Police ServiceThe Transit Police Service is committed to
providing a safe and secure transportation
environment for transit passengers and
employees and the broader community.
The Transit Police Service preserves and
maintains the public peace, prevents crime
and offences against the law, aids in the
administration of justice and enforces the
laws in British Columbia. The Transit Police
Service accomplishes its safety and security
mandate through a six-pillar approach:enforcement, investigation, intelligence,
protection, education and prevention.
TransLink’s commitment to
communications, coordination
and cooperation is evident in
the many agencies and authorities it works with,
including Public Safety Canada,
Transport Canada, Royal
Canadian Mounted Police,
municipal police agencies,
Canadian Security Intelligence
Service, BC Ministry of
Transportation and
Infrastructure, BC Public Safety
and Solicitor General,
Emergency Management BC,
regional emergency planning
committees, local municipalities
and first responders.

8/7/2019 2010 10 Year Transportation and Financial Plan
http://slidepdf.com/reader/full/2010-10-year-transportation-and-financial-plan 57/154
49
The Transit Police Service works closely
with its law enforcement partners towards
the provision of seamless policing in
Metro Vancouver.
All of the costs associated with the Transit
Police Service are borne solely by
TransLink. There are few other transit
agencies in North America that have a
dedicated transit police service. Though
these agencies do not receive the
associated benefits, they are also not
solely responsible for the costs.
The Transit Police Service is governed by a
provincially-appointed Police Board and
the Police Board is instrumental indetermining the Transit Police Service’s
short- and long-term priorities and plans.
In the short- to medium-term, The Transit
Police Service plans include the following:
• Comprehensive Policing – The Transit
Police Service is a relatively young
police agency; as such, it continues to
explore deployment models to best
address crime prevention,
enforcement and calls for service.
There will be a focus on core duties
and the 2009 “taking back the rails,
buses and streets” approach (from
broken windows to open doors).
Starting in 2010, a Metro Bus Safety
and Enforcement Strategy will be
implemented.
• Neighbourhood and Reassurance
Policing – The Station Targeted Area
Response (STAR) Team is a new
initiative being launched in the fall of
2009 in Richmond. STAR Teams will be
highly visible and provide quickresponse to hot spots and issues
related to the transit system. The
Transit Police Service will also pursue
increased joint bike patrol
deployment with other jurisdictional
police departments to keep
neighbourhoods around transit
stations and bus loops safe and to
reduce criminal activity. Outreach andcommunity engagement, particularly
with youth, is a key strategy.
• Canada Line – The Transit Police
Service will be implementing a
dedicated Canada Line policing
section.
• Transit System Security and Protection
– The Transit Police Service has been
exploring inclusion of explosive
detection capability as part of its
preparations for the Games, as well as
towards the provision of long-termtransit system security and critical
infrastructure protection.
• Intelligence-driven Policing – Building
enhanced crime analysis and
intelligence capacity has commenced
and will be strengthened in the next
few years.
• Capacity Enhancement – The Transit
Police Service will address capacity
enhancement through recruitment,
retention, health and wellness,
communications and informationtechnology.
In the longer-term planning, the Transit
Police Service will look at the following:
• Fare-enforcement Models – The
Transit Police Service plans to launch
an initiative to determine the most
efficient and effective fare
enforcement model for the transit
system, taking into account new fare
payment technology.

8/7/2019 2010 10 Year Transportation and Financial Plan
http://slidepdf.com/reader/full/2010-10-year-transportation-and-financial-plan 58/154
50
• Critical Infrastructure Protection – The
Transit Police Service will continue to
enhance its expertise and planning
relative to the security and protectionof the transit network critical
infrastructure.
TechnologyIntelligent Transportation Systems
Intelligent Transportation Systems (ITSs)
involves the application of computer,
telecommunications, traffic control and
information processing technologies in an
integrated approach to enhance
transportation services, maximize the
efficient use of the transportation
infrastructure and support seamlessoperation between modes and systems.
The development and implementation of
ITS applications in the Metro Vancouver
area is coordinated through the ITS
Strategy Board, a group chaired by
TransLink and comprised of
representatives from the major
transportation agencies in the region. An
ITS Vision and Strategic Plan developed in
2001 included several initiatives, many of
which have been implemented in the
region. This ITS plan will be updated in
2009 and will include:
• The Integrated Regional Signal
System, which coordinates signal
networks across jurisdictional
boundaries. The current project
operates along 200th Street and Fraser
Highway in Langley.
• The Rail Advanced Warning System,
which detects trains in advance of
their arrival at at-grade crossings,
advising approaching motorists viaelectronic signage so they can divert
to a grade-separated corridor. The
first implementation is planned for
the Roberts Bank Rail Corridor.
• The Smart Corridors Strategy
examined high-priority goods
movement corridors in the region and
developed a long-term plan forimplementation of related ITS
applications. The first phase will be a
pilot project to integrate the port
reservation system at Deltaport with
the incoming truck arrivals traveller
information for Highway 99/91 and
the Knight Street Bridge corridor for
commercial vehicles.
• The Regional Detectorization Strategy
will guide the development of
infrastructure for capturing traffic
data to support planning, operations
and traveller information. The Knight
Street Bridge and Pattullo Bridge ITS
Corridor Plans will examine the use of
cameras, detectors and electronic
signage to maximize the efficiency
and safety of the Bridges and
associated road network.
• Involvement in the design and
implementation of the Regional
Transportation Management Centre,
which will coordinate and integrate
transportation operations across
modal agencies in support of
important regional traffic functions.
Customer Information
Customer information is a core function of
TransLink’s business. People who are well
informed about options and current
conditions will be able to make more
efficient and timely travel choices.
TransLink is investing in electronic
communication initiatives, including:

8/7/2019 2010 10 Year Transportation and Financial Plan
http://slidepdf.com/reader/full/2010-10-year-transportation-and-financial-plan 59/154
5
• Next Bus – A new suite of tools,
including services such as a website
for mobile devices and an application
on Facebook, which allows users toview next bus information on their
profile. Real-time transit arrival
information, to be launched in late
2009, will also be available through
these channels.
• Partnership with Google – In 2007,
TransLink became Canada’s first
transportation agency to offer transit
information through Google Maps.
This partnership will continue as
TransLink works with Google to
expand the information made
available through other services.
• Enhanced TransLink Website – In
2009, the TransLink website will be
further enhanced to better meet
changing customer expectations,
including more options for accessing
service information and new tools to
help improve dialogue.
• Real-time Traffic Information – Based
on information available from road
sensors and location tracking of
mobile devices, such as GlobalPositioning System (GPS) units and cel
phones, TransLink is working to
collect and transmit real-time traffic
information to road users.
• Dynamic Information – Information
such as service alerts is provided to
customers online and through
dynamic signs and text messaging to
their mobile devices. These media also
provide advertising opportunities that
can assist in recovering the costs
associated with the new services.
Summary
SummaryThe 2010 10-Year Base Plan represents a
major step backwards for the region’s
transportation system. Figures 11, 12 and
13 summarize the outputs and operating
and capital expenditures that will result
from this Base Plan.
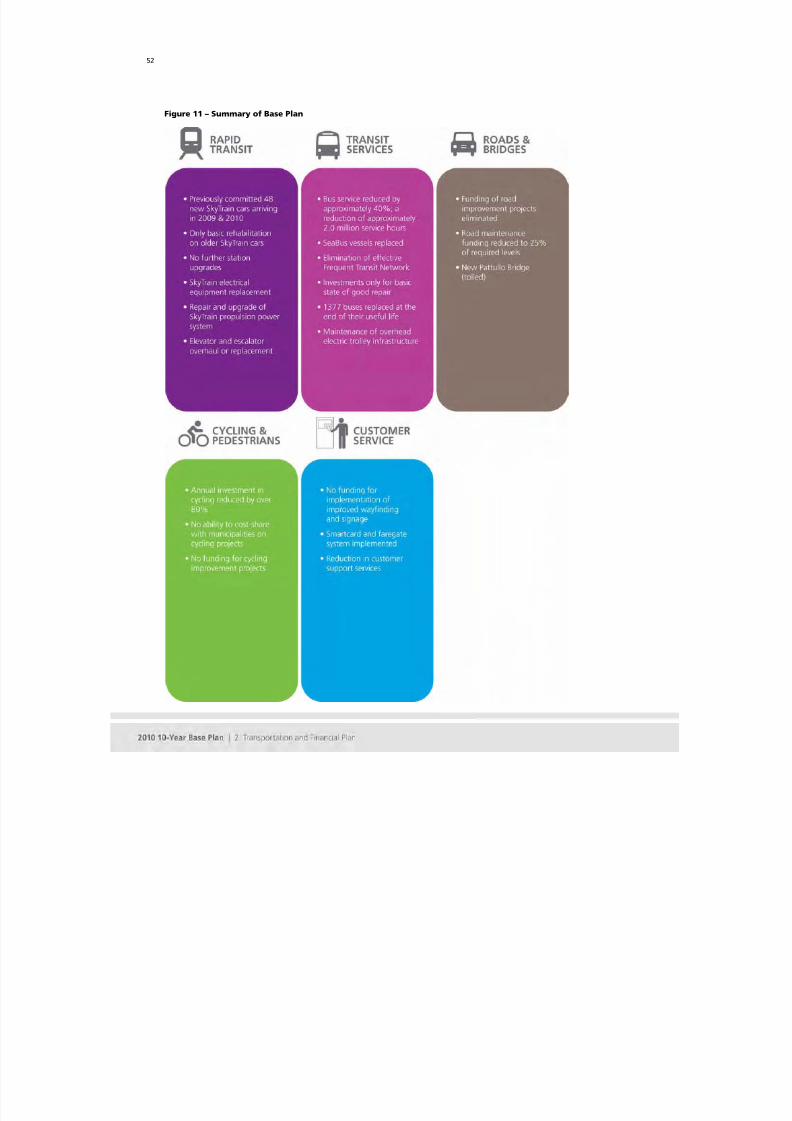
8/7/2019 2010 10 Year Transportation and Financial Plan
http://slidepdf.com/reader/full/2010-10-year-transportation-and-financial-plan 60/154
52
Figure 11 – Summary of Base Plan
Figure 12 – Operating Expenditure by Mode

8/7/2019 2010 10 Year Transportation and Financial Plan
http://slidepdf.com/reader/full/2010-10-year-transportation-and-financial-plan 61/154
53
Figure 12 – Operating Expenditures by Category
Figure 13 – Capital Summary for Base Plan

8/7/2019 2010 10 Year Transportation and Financial Plan
http://slidepdf.com/reader/full/2010-10-year-transportation-and-financial-plan 62/154
54
2.3 Financial Strategy
Context
FinancialThe need for significant additional
revenues to sustain the transportation
system has been known since the time
that TransLink’s Ten Year Outlook to 2013
was prepared in 2004. Projections to 2013
provided in the 2008 Plan indicated that
without new, sustained revenue sources,TransLink would incur annual deficits and
consume its cumulative surplus by 2012.
Incremental revenues of $450 million per
year would provide the resources to allow
the region to make significant steps to
achieving On Track to a Sustainable
Region. Without a Supplemental Plan,
legislation requires TransLink to operate
under established funding sources in the
Base Plan.
The continuation of current service levelsplaces TransLink in a deficit position as
expenditures exceed revenue and the
cumulative surplus is eliminated by 2011.
Under legislation, TransLink cannot have a
cumulative funded deficit. To operate
within its means, significant cuts to
services in transit, cycling, roads and
bridges will be necessary.
The 2010 10-Year Base Plan utilizes the
funding sources currently in place, and the
projected revenue from these sources will
require drastic cuts in services andprogram levels.
The summary Statement of Operations
included in this section indicates total
revenues and expenditures (Table 3).
Appendices 1 to 3 provide the full set of
financial statements that support the 2010
10-Year Base Plan.
Funding Source SummaryEstablished funding resources include:
• Fuel tax revenues at existing rates.
• Property tax revenues inflated by
3 per cent annually.
• Fare revenues with short-term
(shorter than 3 days) fare rates
inflated by 2 per cent annually and
potential increases in long-term fares.
• Replacement tax revenues at a
maximum of $18 million.
• Parking sales tax at the current
7 per cent rate.
• Other estimated revenues, including
advertising, real estate and non-short-
term fares.
• Federal and provincial capital
contributions and interest earnings on
contributions and sinking funds,
which have restricted usage and
cannot be used for operations.
Utilizing these established funding sources
at the levels stated will result in livability
declines due to the inability to sustain
existing service levels.
Relationship to 2009 10-Year Base
PlanThe 2009 10-Year Transportation and
Financial Plan clearly stated the funding
gap identified in previous plans. As a base
plan, the 2009 10-Year Plan used only
established funding resources and

8/7/2019 2010 10 Year Transportation and Financial Plan
http://slidepdf.com/reader/full/2010-10-year-transportation-and-financial-plan 63/154
55
projected borrowings within the current
borrowing limit. The 2009 10-Year Base
Plan introduced cuts to existing programs
and projected cuts to existing servicesstarting in 2011. The 2010 10-Year Base
Plan, again constrained by the existing
revenues, clearly identifies the programs
and services that will be cut starting in
2010.
Financial PlanDevelopmentGuiding Principles
The following principles guided the
development of this 2010 Financial Base
Plan:
• Provide for existing programs,
projects and commitments anticipated
in the 2009 2010 budget.
• Grow short-term fares at 2 per cent
per year and property tax revenues at
3 per cent per year, as allowed in the
legislation.
• Use accumulated surplus to fund
annual deficits in the first three years
of the Plan.
• Make strategic reductions in the
provision of funds to maintain the
system in a state of good repair (i.e.,
replace assets as required).
• Implement reductions on capital
spending that refer to expansion or
upgrade of the system.
• Implement reductions to bus services.
• Implement reductions to capital and
operating expenditures on the major
road network, while not completely
eliminating funds.
• Implement reductions to TransLink’s
corporate costs.
2010-2019Revenues andExpenditureProjections
Table 3 provides a summary Statement of
Operations that indicates revenues,
expenditures and other items resulting in
the projected surplus or deficit. Under
legislation TransLink cannot have acumulative funded deficit. For ease of
reference, the years representing the
starting year (2010), midpoint (2015) and
the 10th year (2019) are shown in this
table, with a detailed breakdown by year
provided in Appendix 2.
RevenuesRevenue projections reflect inflation and
natural growth. The revenues grow from
$1.22 billion in 2009 to a projected
$1.37 billion in 2019.
Motor Fuel Tax
TransLink has developed a model for
forecasting fuel tax revenues. The model is
multi-variable, predicting fuel sales
volumes based on factors such as fuel
price, overall regional trips and transit
mode share, GDP, cross-boundary leakage,
fuel efficiency and fuel-type taxable
status. The latter variable is of critical
importance. Based on the Province of
British Columbia’s stated position that
they will follow the California Low CarbonFuel Standard, an estimated 20 per cent of
the fuel sold in the region by 2019 will be
a tax-exempt, clean, alternative fuel.
Transit Cuts Challenge
For every $1 reduction in
expenditures on bus services,
TransLink loses 50 cents in
revenue due to lost ridership.
As fare revenue declines,
TransLink has fewer resources
available to fund transit
operations and, therefore, has
to further reduce transit
service.
Under the 2010 10-Year Base
Plan, the level of transit
reductions required means
that, in addition to the lowest
utilized routes, routes with
moderately high productivity
will also be subject to
reduction; thereby having a
greater impact on net
revenues.

8/7/2019 2010 10 Year Transportation and Financial Plan
http://slidepdf.com/reader/full/2010-10-year-transportation-and-financial-plan 64/154
56
This is the most significant factor to the
model’s projection of a 22 per cent decline
in fuel tax revenue over the 2010 10-Year
Plan period.
The magnitude of the projected decline is
significant. Pursuant to agreements with
the Province of British Columbia,
TransLink will be initiating discussions to
implement revenue measures that will
compensate for the impact of the change
in policy. The financial projections assume
that TransLink will be held whole for the
impact of exemptions on clean alternative
fuel.
Under the 2010 10-Year Base Plan, thefuel tax will not increase to the allowable
legislation limit of 15 cents per litre and
will remain at 12 cents per litre. Over the
2010-2019 period, motor fuel tax revenue
is forecast to rise from $265 million in
2009 to $299 million in 2019. The
increased fuel consumption is driven by
higher travel demand, which grows with
population growth and with the increase
in real disposable income in the longer-
term. Projected cuts to transit service in
the 2010 10-Year Base Plan will see more
trips shift from transit to cars, further
increasing fuel consumption. Offsetting
factors to fuel consumption increases, such
as fuel efficiency, density and cost of fuel,
will be outpaced by the growth in travel
demand that is coupled by the decrease in
sustainable alternatives. The 2010 10-Year
Base Plan is estimated to shift an average
of 16 million trips per year to vehicles
based on service cuts. The total travel
demand is forecast to be 1.7 to 2.2 billion
trips per year over the 10-year period.
Property Tax
Property tax revenue will increase by
3 per cent per year, which complies with
annual increases allowed underlegislation. The 3 per cent increase
represents a 2 per cent increase and
1 per cent growth from property
development and improvements. The
rates necessary to generate the targeted
increases will be determined through
annual budget processes.
Other Taxes
Parking Sales Tax
TransLink currently collects a 7 per cent
parking sales tax which is applied to the
purchase price of paid off-street parkingwithin TransLink’s service region. The
parking sales tax is charged directly to the
owners of parking facilities; it is their
responsibility to determine if and how this
fee is passed on to the consumer.
This tax raised an estimated $15.1 million
in 2009 and is projected to grow at the
2 per cent general inflation rate.
Replacement Tax, Hydro Levy and Mission
Subsidy
The Replacement Tax forecast remains atits legislated maximum of $18 million per
year for the 10-year period. It is
anticipated that the tax will be collected
from all allowable classes. Hydro Levy is
presently at a rate of $1.90 per month
with no increases other than general
population growth, which impacts the
revenue over the Plan period. Mission
subsidy is per the current contract with a
general inflation growth rate of 2 per cent
per year.
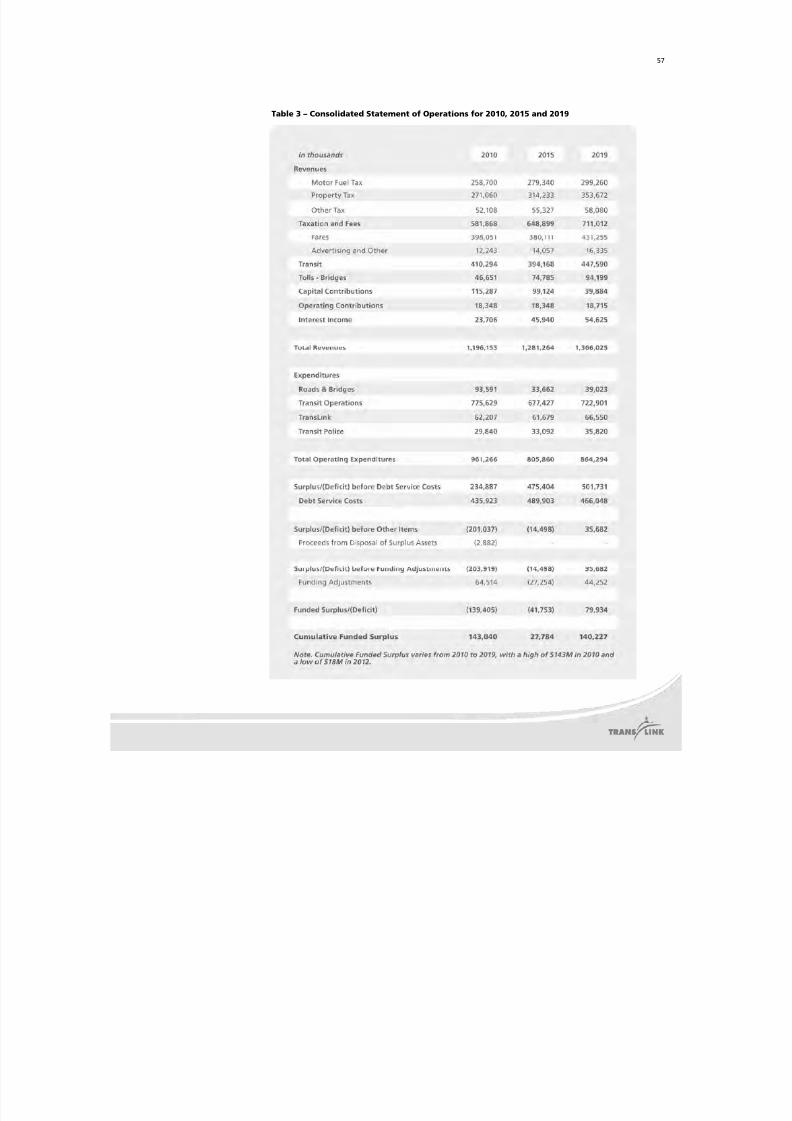
8/7/2019 2010 10 Year Transportation and Financial Plan
http://slidepdf.com/reader/full/2010-10-year-transportation-and-financial-plan 65/154
57
Table 3 – Consolidated Statement of Operations for 2010, 2015 and 2019

8/7/2019 2010 10 Year Transportation and Financial Plan
http://slidepdf.com/reader/full/2010-10-year-transportation-and-financial-plan 66/154
58
Transit Fares
Transit revenues will total $394 million in
2009, with transit fares generating
$383 million and advertising revenuegenerating a further $11 million. By 2019,
fare revenue is expected to rise to
$431 million, primarily reflecting the
increased revenue from the Canada Line.
The Canada Line revenue is based on
revenue projections from current business
case forecasts for this project, excluding
any assumed additional charge for
passengers using the Richmond-Vancouver
Airport portion of the line.
Fare revenue grows by the 2 per cent
annual increase factor provided bylegislation and the impact of changes in
ridership based on capacity and
background growth. Fare increases
projected in 2010 (4.04 per cent), 2013
(6.12 per cent), 2016 (6.12 per cent) and
2019 (6.12 per cent) represent the
compounded impact of the 2 per cent
annual increase factor. Increases to long-
term fares may be higher.
As a result of the bus service cuts in the
2010 10-Year Base Plan, transit fare
revenue (other than Canada Line revenue)
is projected to drop by $76 million, from
$373 million in 2010 to $297 million in
2011. This 20 per cent, one-year decline is
significant, and it is projected that it will
take up to eight years (by 2019) for
revenues to return to the 2010 level.
Tolls
TransLink will be receiving toll revenues
from the new Golden Ears Bridge, which
opened to traffic on June 16, 2009 and
will be free from tolls for the first month.The toll revenues will be used to pay for
the project over the next 32 years. These
revenues have been projected using the
traffic estimates and rates of $2.75 for a
car, $5.55 for a light truck and $8.30 for a
heavy truck, and will grow with inflation.
These rate assumptions are based on
usage with a transponder and, therefore,
are slightly conservative.
Senior Government Contributions
(Capital and Operating Contributions)
The federal and provincial governments
contribute to TransLink’s capital projects
through sources such as the Building
Canada Fund, the Strategic Priorities (Gas
Tax) Fund and the Provincial Transit Plan.
Senior government funding is applied to
projects meeting the funding program’s
criteria up to the allowable limit. These
funds are restricted in nature and cannot
be used for TransLink’s day-to-day
business operations.
As the 2010 10-Year Base Plan requires
significant program or service cuts,
TransLink will not be able to take
advantage of the full level of available
senior government funding. Federal Gas
Tax funding of $124 million per year will
not be fully utilized. In fact, even the
reduced level of gas tax funding is at risk,
as replacement of assets, which forms the
majority of the Base Capital Plan, will not
provide the outcomes anticipated by the
Federal Gas Tax program. As the Base Planassumes no further rapid transit
expansion, other cost-sharing
opportunities (for example, the recent
announcement of federal and provincial
funding for a potential purchase of
24 SkyTrain vehicles) will be lost.
Operating contributions are the deferred
provincial contribution for the Canada
Line. Provincial funding for 2009 includes
$7 million towards this repayment and
increases to $18 million per year over the10-year period. These payments are
subject to the concessionaire meeting
performance standards for which they are
at risk.
8/7/2019 2010 10 Year Transportation and Financial Plan
http://slidepdf.com/reader/full/2010-10-year-transportation-and-financial-plan 67/154
59
Interest Income
Interest income is interest earned on
sinking funds, capital contributions, debt
reserve funds and cash balances. Interestearned is restricted and cannot be used to
fund operations with the exception of
interest from cash balances.
ExpendituresExpenditure projections reflect cost
escalation in operating roads, bridges and
the transit network, as well as corporate
and policing costs. Total operating
expenditures decline from $981 million in
2009 to a projected $864 million in 2019 as
a result of the major cuts needed to
maintain a positive cumulative surplusover the 2010 10-Year Base Plan period.
Roads and Bridges
TransLink’s expenditures in roads and
bridges will total $115 million in 2009 and
decrease to $39 million in 2019.
Expenditures are comprised primarily of
the operations, maintenance and
rehabilitation (OMR) of the 2,300 lane-
kilometres of regionally-significant
roadways, known as the Major Road
Network (MRN), capital funding to
municipalities and operating expenditures
of TransLink-owned structures, including
the Golden Ears Bridge. TransLink’s
current 2009 contribution to
municipalities for the operations,
maintenance and rehabilitation of the
MRN is approximately 69 per cent of
estimated total costs. This contribution
will be reduced to 25 per cent over the
2010 10-Year Base Plan period. This cost is
projected to escalate by 4 per cent per
year based on historical escalation trends.
OMR contribution for 2009 is $33 millionand declines to below $20 million per year
over the 2010 10-Year Base Plan period.
Capital funding to municipalities includes
funding to the cycling program, transit
priority programs and other MRN capital
projects. Other than projects that arecommitted or underway, such as Roberts
Bank, the Coast Meridian Overpass or the
Fraser Highway, the only funding
provided for under the 2010 10-Year Base
Plan will be $1 million per year to the
cycling program. Expenditures related to
capital funding to municipalities decreases
from $68 million in 2009 to $1 million in
2015, keeping constant thereafter.
Transit Operations
Transit operations are represented
primarily by bus, Access Transit and railoperations (more than 95 per cent of
transit operations altogether). Other
expenditures, such as property tax, rentals
fare media and insurance, contribute to
less than 5 per cent of total transit
operations. Transit operation expenditures
decrease from $775 million in 2009 to
$637 million in 2011, then gradually
increase to $723 million in 2019.
A major factor for the decrease in
expenditures is driven by an approximate
40 per cent cut in bus service hours in 2011starting with the least productive service
routes. This cut would reduce service from
4.9 million annual hours in 2009 to
2.9 million annual hours in 2010.
Expenditures in the bus division decline
from $610 million in 2009 to under
$460 million from 2011 to 2019 as a result
of service cuts.
Rail expenditures include the Expo and
Millennium Lines, the Canada Line and the
West Coast Express. These expendituresincrease from $131 million in 2009 to
$235 million in 2019. Factors contributing
to these increases include Canada Line
expenditures, as well as the addition of 48
SkyTrain cars that were previously ordered
for the Expo and Millennium Lines.

8/7/2019 2010 10 Year Transportation and Financial Plan
http://slidepdf.com/reader/full/2010-10-year-transportation-and-financial-plan 68/154

8/7/2019 2010 10 Year Transportation and Financial Plan
http://slidepdf.com/reader/full/2010-10-year-transportation-and-financial-plan 69/154
6
The difference between accumulated
surplus and deficits using generally
accepted accounting principles and
TransLink’s fund balance are accountedfor by funding adjustments. A combined
negative funding adjustment means
further funding is required, while a
combined positive funding adjustment
means less funding is required.
Appendix 5 provides a detailed break-out
of the various funding adjustment
components.
Balance Sheet and
Cash FlowStatement
Total assets will decrease by $0.4 billion
over the 2010 10-Year Plan period. Capital
assets will decrease by $1.2 billion, as
amortization of capital assets will exceed
additions. This decrease is partially offset
by the $0.6 billion increase in sinking and
debt reserve funds and the $0.2 billion
increase in cash and short-term
investments.
Total liabilities will decrease by
$0.1 billion. Long-term (direct) debt
decreases by $0.1 billion, and public-
private partnership (P3) debt (Canada Line
and Golden Ears Bridge) decreases by a
similar amount. The fund balance
decreases by $0.2 billion.
The existing debt limit of $2.8 billion is
adequate to meet the 2010 10-Year Base
Plan requirements.
Cash FlowBase Plan projections indicate a cash
positive situation with the exception of
the 2011-2012 period, where the
projections indicate zero surplus cash.
TransLink actively manages its cash
situation and will access its short-term
borrowing facility.
Capital purchases over the period amount
to $2.5 billion. An additional $0.2 billion
in major road expenditures, which are
expensed in compliance with generally
accepted accounting principles, pushes the
total capital expenditures to $2.7 billion.
Federal and provincial funding finances
$1.1 billion and other funding of
$0.3 billion (mostly concessionaire
contribution from P3 projects – Canada
Line and Golden Ears Bridge) leaves a
shortfall of $1.3 billion, which is financedwith direct borrowings (bonds issued).
Cash from operation over this period
amounts to $3.2 billion, so the following
adjustments need to be recognized:
• Reduction of $1.1 billion in federal
and provincial contributions, which is
restricted to funding capital
expenditures.
• Adding back the $0.2 billion in major
road expenditure, which is financedwith debt.
• Making a further $0.4 billion
reduction for sinking fund interest
(non-cash).
This leaves true operating cash inflows of
$1.9 billion. Almost all of this cash is used
to repay debt.

8/7/2019 2010 10 Year Transportation and Financial Plan
http://slidepdf.com/reader/full/2010-10-year-transportation-and-financial-plan 70/154
62
Assumptions and
RisksThe key inputs to the projections are the
initiatives and activities documented in
the preceding sections, underlying
economic assumptions and assumptions
driven by TransLink.
Economic assumptions have been
developed through research from a
variety of sources. A primary source has
been the Province of British Columbia’sThree-Year Plan estimates, which reflect
consensus opinion of a blue-ribbon panel
of economic advisors. Fuel volumes reflect
the output from the multi-variable
forecasting tool described earlier.
Table 4 indicates the key assumptions and
the impact of a 1 per cent increase to
those assumptions.
Table 4 – Key Assumptions for the 2010 10-Year Base Plan

8/7/2019 2010 10 Year Transportation and Financial Plan
http://slidepdf.com/reader/full/2010-10-year-transportation-and-financial-plan 71/154
63
Other Major Assumptions Drivenby TransLink
Other key assumptions driven by TransLink
include:
• Due to cuts to the least productive
routes, ridership productivity for
buses increases from 46.5 boardings
per hour in 2010 to approximately
56 boardings per hour in 2013.
• Operation, maintenance and
rehabilitation funding for roads is
maintained, but at a far reduced rate
from current funding. The rate is
reduced in 2010 to 25 per cent of the
$20,000 per lane kilometre that is
required to provide full funding to
the municipalities, and then increases
by 4 per cent per year.
• Continuation of the federal gas tax
funding program at the 2009-2010
level of $124 million per year, with all
of the funds directed to TransLink. As
noted earlier, this full level of funding
cannot be utilized due to the limited
nature of the Base Plan capital
program.
• Senior government funding forannounced and underway projects,
such as SkyTrain vehicle purchases,
new SeaBus and SkyTrain station
upgrades.
• The incremental cost of providing
additional transit service during the
Games period will be fully recovered
through additional fare and
advertising revenues and
reimbursement from Vancouver
Organizing Committee.
Risk FactorsRisk factors include:
• Fuel Tax Revenue – This major risk
factor is the impact of changes in fuel
tax revenue assumptions. Assumptions
for fuel tax revenue are based on the
cost of fuel, vehicle kilometres
travelled (VKT) and the increase of
average fuel efficiencies. As theprojected fuel consumption for
gasoline vehicles increases by
1 per cent, the impact on the
cumulative surplus would be
$28 million. Fuel price assumptions
also have a significant impact on the
cumulative surplus, as price increases
will alter travel behaviour, resulting in
lower revenue, as well as higher fleet
operating expenditures.
• Ridership – Fares are one of the
largest revenue sources, contributing
to more than 30 per cent of
TransLink’s total revenues. Inherent in
fare revenue projections are ridership
assumptions. As the 40 per cent cuts
to bus service are unprecedented,
ridership impacts based on these cuts
are best estimates at present. A
1 per cent increase or decrease in
ridership would result in a $4 million
per year fluctuation in revenues.
• Economic Factors – Projections and
forecasts beyond a three-year horizon
are subject to greater uncertainty.
Future interest rates, inflation and
general economic growth are notable
risk factors. As the economy emerges
from the present downturn, general
inflation may exceed the annual rate
increases allowed under SCBCTA Act .
Relief may be required from
legislation to offset any potentially
higher than anticipated inflation
impacts. A 1 per cent increase in
general inflation would have a
$45 million impact over the 2010-2019Plan period.

8/7/2019 2010 10 Year Transportation and Financial Plan
http://slidepdf.com/reader/full/2010-10-year-transportation-and-financial-plan 72/154
64
• Senior Government Contribution –
The continuation of federal and
provincial contributions are essential
for TransLink’s 2010 10-Year BasePlan. These contributions amount to
$1.1 billion from 2009 to 2019.
• Compensating Revenue for Tax
Exempt Alternative Fuel – Current
financial projections assume that the
Province will make TransLink whole
from the impact of exemptions on
alternative fuels. The ability to receive
compensating revenue is significant to
overall revenue projections since fuel
tax is a major revenue source for
TransLink.
2010 10-Year BasePlan Inclusions andExclusions
The 2010 10-Year Base Plan provides for
costs of state–of-good-repair projects and
costs of some upgrade projects, while
eliminating or extensively cutting a
number of programs and services.
The 2010 10-Year Base Plan includes:
• Bus fleet replacement.
• SkyTrain fleet refurbishment.
• Second SeaBus replacement.
• Transit infrastructure maintained in
good order.
• Cycling Program funding of $1 million
per year.
• New Pattullo Bridge funding to take
the project to the procurement stage.
• Smartcards and faregate systems.
• Major road projects already
committed (Fraser Highway Widening
Coast Meridian Overpass and Roberts
Bank Rail Corridor Grade Separation).• SkyTrain fleet expansion (48 vehicles
previously ordered) to address system
overcrowding and passenger safety
issues, and an expanded operations
and maintenance centre to
accommodate fleet growth.
• SkyTrain stations maintained in a
state of good repair.
The 2010 10-Year Base Plan excludes:
• Detailed design and construction ofthe rapid transit lines identified in the
Provincial Transit Plan (Evergreen
Line, Surrey Extension and Broadway
West).
• Pattullo Bridge design and
construction, as it is assumed these
costs will be recovered through tolls.
• Addition of seven West Coast Express
bi-level cars.
• Bus fleet expansion and related
facilities.
• SkyTrain fleet expansion.
• Major Road Network Minor Capital
Program annual allocation of
$20 million per year.
• Major Road Network Major Capital
Program annual allocation of
$35 million per year.
• Major road projects (Main Street
Widening and Murray-Clark
Connector).
Capital ProgramTable 5 shows the gross cost, net cost and
contributions to each category of the
capital program over the 2009-2019 Plan
period.

8/7/2019 2010 10 Year Transportation and Financial Plan
http://slidepdf.com/reader/full/2010-10-year-transportation-and-financial-plan 73/154
65
Table 5 – TransLink Base Plan Capital Program by Category

8/7/2019 2010 10 Year Transportation and Financial Plan
http://slidepdf.com/reader/full/2010-10-year-transportation-and-financial-plan 74/154
3. Outcomes

8/7/2019 2010 10 Year Transportation and Financial Plan
http://slidepdf.com/reader/full/2010-10-year-transportation-and-financial-plan 75/154

8/7/2019 2010 10 Year Transportation and Financial Plan
http://slidepdf.com/reader/full/2010-10-year-transportation-and-financial-plan 76/154
68
Figure 15 – Transit Mode Share Effects by 2019
In summary, under the 2010 10-Year Base
Plan, the regional transportation system
will regress, falling further behind the
regional aspirations for achieving a
sustainable region. The curve to get back
On Track to a Sustainable Region will be
much steeper and the necessary land use
changes are less likely to occur in this
environment.
In response to inadequate funding in all
areas of the transportation system, travel
in the region will remain auto-dependant;
congestion will increase and continue to
impact the region’s ability to move people
and goods efficiently and hinder its ability
to compete in the global economy.
Furthermore, the condition of the Major
Road Network can be expected to decline,
resulting in impacts to safety, operationalefficiency and the economy.
8/7/2019 2010 10 Year Transportation and Financial Plan
http://slidepdf.com/reader/full/2010-10-year-transportation-and-financial-plan 77/154
4. Appendices

8/7/2019 2010 10 Year Transportation and Financial Plan
http://slidepdf.com/reader/full/2010-10-year-transportation-and-financial-plan 78/154

8/7/2019 2010 10 Year Transportation and Financial Plan
http://slidepdf.com/reader/full/2010-10-year-transportation-and-financial-plan 79/154

8/7/2019 2010 10 Year Transportation and Financial Plan
http://slidepdf.com/reader/full/2010-10-year-transportation-and-financial-plan 80/154

8/7/2019 2010 10 Year Transportation and Financial Plan
http://slidepdf.com/reader/full/2010-10-year-transportation-and-financial-plan 81/154

8/7/2019 2010 10 Year Transportation and Financial Plan
http://slidepdf.com/reader/full/2010-10-year-transportation-and-financial-plan 82/154

8/7/2019 2010 10 Year Transportation and Financial Plan
http://slidepdf.com/reader/full/2010-10-year-transportation-and-financial-plan 83/154
Appendix 5 - Funding Adjustments
$ Thousands2010 2011 2012 2013 2014 2015
Surplus/(Deficit) before Funding Adjustments (203,919) (140,186) (89,779) 98,329 (36,338) (14,498)
Reverse: Depreciation & other non cash expenditures 266,882 269,920 267,012 267,336 267,806 270,244
Reverse: Restricted capital contributions (116,041) (69,988) (85,284) (97,578) (81,275) (100,097)Reverse: Captial payments to municipalities for MRN 66,715 40,368 44,154 12,170 1,000 1,000
Add: Payments to Sinking Fund and to P3 partners for debt (153,042) (175,143) (185,919) (187,201) (192,909) (198,402)Funding Adjustments 64,514 65,158 39,962 (5,273) (5,378) (27,254)
Funded Surplus/(Deficit) (139,405) (75,028) (49,816) 93,056 (41,716) (41,753)
Note. Refer to Funding Adjustments section under the Financial Strategies chapter for further discussion.

8/7/2019 2010 10 Year Transportation and Financial Plan
http://slidepdf.com/reader/full/2010-10-year-transportation-and-financial-plan 84/154

8/7/2019 2010 10 Year Transportation and Financial Plan
http://slidepdf.com/reader/full/2010-10-year-transportation-and-financial-plan 85/154
Appendix 7 - 2009 - 2019 Service Hours (thousands)
2009 2010 2011 2012 2013 2014 2015 20
Conventional Bus 4,355 4,011 2,673 2,673 2,673 2,673 2,673 2,67
Community Shuttle 552 493 233 233 233 233 233 23
Total Bus 4,908 4,504 2,906 2,906 2,906 2,906 2,906 2,90
SkyTrain E&M 969 1,149 1,156 1,156 1,156 1,156 1,156 1,15
Canada Line 61 184 184 184 184 184 184 18
Total Rapid Transit 1,030 1,332 1,340 1,340 1,340 1,340 1,340 1,34
SeaBus 11 11 11 11 11 11 11 1
West Coast Express 39 33 30 30 30 30 30 3
Custom 632 613 581 581 581 453 453 45
Total Service Hours 6,620 6,493 4,867 4,867 4,867 4,739 4,739 4,73

8/7/2019 2010 10 Year Transportation and Financial Plan
http://slidepdf.com/reader/full/2010-10-year-transportation-and-financial-plan 86/154
Appendix 8 - 2009-2019 Projected Short Term Fares by Year
2009 2010 2011 2012 2013 2014 2015 2016
Transit FaresShort Term 156,461 162,803 134,261 142,977 153,945 154,651 155,465 164,705
Other 226,085 235,248 194,005 206,600 222,449 223,469 224,646 237,997
Total 382,546 398,051 328,266 349,576 376,395 378,120 380,111 402,701
Note. Based on 2009 Budget split between short term (cash and ticket) fares and other fares. Short Term fares are 40.9% of Conventional fares.
Projected revenues to 2019 are based on this percentage, which will likely change with the implementation of SmartCard.

8/7/2019 2010 10 Year Transportation and Financial Plan
http://slidepdf.com/reader/full/2010-10-year-transportation-and-financial-plan 87/154

8/7/2019 2010 10 Year Transportation and Financial Plan
http://slidepdf.com/reader/full/2010-10-year-transportation-and-financial-plan 88/154

8/7/2019 2010 10 Year Transportation and Financial Plan
http://slidepdf.com/reader/full/2010-10-year-transportation-and-financial-plan 89/154

8/7/2019 2010 10 Year Transportation and Financial Plan
http://slidepdf.com/reader/full/2010-10-year-transportation-and-financial-plan 90/154
Appendix 92010 - 2019 Base Plan Projected Fare Rates by Type and Year
Year 2009
April
1st,
2010 2011 2012 2013 2014 2015 2016 2017 2018
Fare Increases
Concession - In Mission, Central Fraser Valleyfare receipt or monthly pass and U-pass $1.50 $1.50 $1.50 $1.50 $1.59 $1.59 $1.59 $1.69 $1.69 $1.69
Multi-Pass (for conventions)Per Pass - Purchase 500-5,000 passes perday $5.25 $5.64 $5.64 $5.64 $5.98 $5.98 $5.98 $6.35 $6.35 $6.35 Per Pass - Purchase more than 5,000 passesper day $4.25 $4.56 $4.56 $4.56 $4.84 $4.84 $4.84 $5.14 $5.14 $5.14 FastTrax DecalFastTrax Student - All Zones $2.25 $2.42 $2.42 $2.42 $2.56 $2.56 $2.56 $2.72 $2.72 $2.72 OtherStored Value Card/Xpress Card Deposi $10.00 $10.74 $10.74 $10.74 $11.40 $11.40 $11.40 $12.09 $12.09 $12.09
Passes and Other Product and Services

8/7/2019 2010 10 Year Transportation and Financial Plan
http://slidepdf.com/reader/full/2010-10-year-transportation-and-financial-plan 91/154
Appendix 102010 - 2019 Base Plan
Projected Rates and Revenue of Hydro Levy, Parking Sales Tax, Motor Fuel Tax and Tolls*
Current
2009 2010 2011 2012 2013 2014 2015 2016
Hydro Levy Rate (per month) 1.90 1.90 1.90 1.90 1.90 1.90 1.90 1.90
Hydro Levy Revenue (000's) 18,100 18,411 18,725 19,035 19,348 19,669 19,996 20,328
Parking Sales Tax Rate 7% 7% 7% 7% 7% 7% 7% 7%
Parking Sales Tax Revenue (000's) 15,120 15,422 15,731 16,045 16,366 16,694 17,028 17,368
Motor Fuel Tax 0.12 0.12 0.12 0.12 0.12 0.12 0.12 0.12
Motor Fuel Tax Revenue (000's) 264,800 258,700 262,180 263,500 267,580 272,620 279,340 282,940
GEB Toll Rates and Revenue
(based on business case rates)
Rates
Car 2.80 2.85 2.95 3.00 3.05 3.10 3.15 3.25
Light Truck 4.20 4.30 4.40 4.50 4.55 4.65 4.75 4.85
Heavy Truck 5.64 5.75 5.85 6.00 6.10 6.20 6.35 6.45
Revenue 13,430 46,651 59,557 63,434 67,098 70,994 74,785 79,764
* To be specified by vehicle type
Forecast

8/7/2019 2010 10 Year Transportation and Financial Plan
http://slidepdf.com/reader/full/2010-10-year-transportation-and-financial-plan 92/154

8/7/2019 2010 10 Year Transportation and Financial Plan
http://slidepdf.com/reader/full/2010-10-year-transportation-and-financial-plan 93/154
2010 10-Year Plan
Appendix 11
TransLink’s Sustainability Policy: Creating a More Sustainable Future
This policy articulates TransLink’s commitment to making sustainability a
key factor in all our strategies, plans, business practices, decisions, and
operations. This policy applies to all employees and activities of TransLink,
its subsidiaries, and service contractors and is supported by specific social,
economic, and environmental strategies and policies.
TransLink is deeply committed to developing and maintaining a
sustainable transportation system that meets the needs of people,
organizations and businesses, and fosters the ecological, economic and
social well‐being of the Metro Vancouver region and beyond. TransLink is committed to being a recognized world leader in transportation sustainability. We advance sustainability by:
• Providing and promoting sustainable transportation choices in the
region – enabling more people to choose walking, cycling or transit
for more of their trips
• Managing and operating our business in an environmentally,
socially, and economically responsible manner
• Using our business leverage to advance sustainability
• Promoting land use and transportation infrastructure decisions
that are supportive of sustainable transportation
TransLink will integrate and advance sustainability through its various roles.
As a transportation provider, we will: • Provide a diversity of transportation services and pursue operation
and design innovations that maximize the benefits to society, the
economy, and the environment while minimizing adverse impacts,
locally and globally
• Develop a resilient transportation system that can adapt to the
region’s changing needs and foster our capacity to respond in
challenging or exceptional situations
TransLink Corporate Vision To be a recognized leader in creat
a sustainable region through
transportation excellence.
Definition of a Sustainable Transport System A sustainable transport system is onthat:
• allows the basic access and
development needs of individuals
companies and societies to be me
safely and in a manner consistent
with human and ecosystem healt
and promotes equity within and
between successive generations;
• is affordable, operates efficiently,
offers choice of transport mode, a
supports a competitive economy,
well as balanced regional
development; and,
• limits emissions and waste within
planet’s ability to absorb them, us
renewable resources at or below
their rates of generation, and use
non‐renewable resources at or be
the rates of development of
renewable substitutes when
minimizing the impact on the use
land and the generation of noise.
Definition developed by the Centre fo
Sustainable Trans ortation.

8/7/2019 2010 10 Year Transportation and Financial Plan
http://slidepdf.com/reader/full/2010-10-year-transportation-and-financial-plan 94/154
2010 10-Year Plan
Appendix 11
As an organization, we will: • Set economic, environmental and social targets appropriate to our vision and mandate
• Develop
and
implement
a
corporate
sustainability
strategy
• Incorporate sustainability commitments into our business processes and practices
• Make decisions that consider economic, social, and environmental objectives and reflect our
commitment to sustainability and leadership, ensuring the best value for transportation investments
• Operate in an open, transparent, responsible and accountable manner
• Aim for continual innovation and improvement in all aspects of our business to reach our goal of
becoming sustainable transportation leaders
As an employer, we will: • Cultivate a diverse, inclusive and respectful workplace and provide a safe and healthy work
environment
• Encourage employees to innovate and play an active leadership role in the pursuit of our sustainability
goals
• Empower staff with the resources they need to make responsible decisions regarding sustainability in
the workplace and encourage them to expand this into their personal lives
As a member of the community, we will: • Work with our community partners to enhance the livability, sustainability and resilience of our region
and provide leadership for transport systems around the world
• Conduct transparent, inclusive and respectful consultations with our stakeholders and the public to
obtain meaningful input into TransLink activities
• Encourage and recognize the efforts of employees, subsidiaries, service contractors and partners for
their sustainability practices and innovations
To determine how we are doing, to meet our vision and targets, and to prepare for future challenges, we will:
• Measure and track our progress towards achieving our sustainability targets
• Regularly document our progress in publicly available reports
• Evaluate our progress and adjust implementation where needed
• Monitor emerging economic, social and environmental trends to identify and manage anticipated
challenges and opportunities
Sustainability is a collective pursuit – we all have the power to take positive actions that, together, will create a sustainable future for our communities, our region and our world.
8/7/2019 2010 10 Year Transportation and Financial Plan
http://slidepdf.com/reader/full/2010-10-year-transportation-and-financial-plan 95/154
2010 10-Year Plan
Appendix 12
On Track to a Sustainable Region Transport 2040 is the long‐term strategy for transportation in Metro Vancouver. Adopted in 2008, Transport
2040 commits to six bold goals and lays out four key strategies to reach those goals by balancing the needs of a
healthy economy with environmental protection and social equity and support. TransLink’s 10‐year plans are
the means through which these strategies are pursued and implemented. The 2010 10 Year Plan is the first
supplemental plan to be created since adoption of Transport 2040.
TransLink conducted an extensive planning and consultation process to identify the investments, services and
initiatives that are needed to put the region on the path to achieving the goals and vision of Transport 2040.
This 2010 10‐Year Plan, entitled On Track to a Sustainable Region, sets out the steps that are necessary to make substantial progress over the next decade toward achieving the long‐range goals established in
Transport 2040. This chapter describes what is required to get On Track to a Sustainable Region. Transport 2040 Strategies The four key strategies of Transport 2040 provide the framework for describing how the region could work
towards meeting the long‐term land use, transportation and environmental goals. While On Track to a Sustainable Region is TransLink’s vision for substantial expansion of the transport network, successful
implementation of the strategies and achievement of the Transport 2040 goals requires collaboration; regional
partners must share in the necessary planning, policy coordination and funding.
#1: Make early investments that encourage development of communities designed for transit, cycling and walking. The region has long recognized the importance of using transit to both serve and shape land use. There is an
increasingly urgent need to be more proactive in linking transit to land use. Prioritizing the implementation of
the Frequent Transit Network is a framework for forging this link. The concept for the Frequent Transit
Network, including bus and rail rapid transit and frequent bus service was illustrated in Transport 2040 and is
shown in Figure 1.
Achieving the first 10 years of Transport 2040’s vision requires aggressive investment in rapid transit. This
includes expansion of rail or bus rapid transit on corridors region‐wide, including in Vancouver, in the
northeast sector, and in Surrey. Substantial upgrades to the capacity of existing lines are also required.
Rapid transit expansion supports the Transport 2040 goal of making early investments that encourage
development of communities designed for transit, cycling and walking. Expanding and enhancing the region’s
rapid transit corridors would provide the certainty and opportunity that municipalities need to adapt their
community plans and attract appropriate development. This would also allow TransLink to serve existing
demand in medium‐ and high‐density areas, as well as shape transit‐supportive land use patterns in developing
areas.

8/7/2019 2010 10 Year Transportation and Financial Plan
http://slidepdf.com/reader/full/2010-10-year-transportation-and-financial-plan 96/154
2010 10-Year Plan
Appendix 12
Figure 1 – Concept of Potential 2040 Frequent Transit Network
Upgrades and expansion of the Frequent Transit Network are required to create a transit‐oriented region,
serve growth corridors with relatively high levels of commercial and residential activity and leverage
investments in rapid transit by providing strong feeder services.
A 25 per cent increase in bus service hours, enabled by an expanded bus fleet (including 460 new buses and
250 buses reallocated when new rapid transit lines replace existing bus routes), is needed to grow capacity in
high demand corridors, serve existing demand, and shape demand in new and under‐served areas.
There is great potential to significantly increase cycling in the region if growth is focused in mixed use, high
density town centres. Over half of all current trips are less than 5 km in length, and market research has shown
that a majority of Metro Vancouver residents are interested in cycling for transportation, but are concerned
about riding in motor‐vehicle traffic. To reach out to this target market investments and programs are needed
to improve safety, change cultural norms and accelerate the construction of traffic‐protected cycling routes in
areas of high cycling potential.

8/7/2019 2010 10 Year Transportation and Financial Plan
http://slidepdf.com/reader/full/2010-10-year-transportation-and-financial-plan 97/154
2010 10-Year Plan
Appendix 12
As the region grows, major roadway projects will continue to be required to efficiently accommodate all
modes of transportation and improve the movement of goods. An approximately one‐third increase in road
improvement funding is needed to allow for the safe movement of all modes and to implement important
regional projects, such as North Fraser Perimeter Road.
#2: Optimize the use of the region’s transportation assets and keep them in good repair. Making the best use of what the region already has is the most cost‐effective investment available. Much of
TransLink’s transportation system is currently working at capacity, and in too many places, demand already
outstrips supply, reducing service quality and reliability and causing transit pass‐ups. A key priority is to make
the best use of existing infrastructure by first ensuring that long‐term capacity needs are being met on existing
rapid transit lines. The Expo Line, the trunk line of the rapid transit network, requires significant capacity
upgrades to the fleet and supporting infrastructure to serve existing demand and attract new ridership.
Transit ridership is increased by improving the accessibility, walkability and appeal (amenities) of stations.
Investments and developments are needed at, around and above SkyTrain stations, bus exchanges and their
surrounding areas to provide passenger facilities that meet access and capacity needs and create a positive
passenger experience to keep existing passengers and attract new ridership. Partnering with municipalities to
support transit‐oriented development and integrate stations and exchanges into the surrounding community
will help support transit, as well as cycling and walking.
In delivering transit service to the Metro Vancouver area, TransLink utilizes a variety of vehicle types to
respond to different levels of ridership demand by allocating vehicles with the appropriate capacity. By
expanding the bus fleet and adding three new regional depots to accommodate this fleet, TransLink could
cost‐effectively scale supply to demand and more effectively optimize its operations and maintenance. In
addition to an expanded bus fleet, a third SeaBus and additional West Coast Express service is needed to meet
growing demand on these services.
Traffic congestion and overdue infrastructure improvements are making transit less reliable and more
expensive to operate. An expanded transit prioritization program is needed to help cut operating costs, better
utilize the road and transit assets, improve the service quality for existing riders and attract new riders to the
system. TransLink has developed a Transit Priority Plan and Implementation Strategy that has identified road
engineering and technology solutions for over 600 lane‐kilometres or 100 transit corridors.
In addition to supply‐side approaches, such as investing in the Frequent Transit Network, demand‐side
programs, such as the TravelSmart Program, help manage transportation demand more effectively and reduce
pressure on trucks, buses and emergency vehicles.
The need to support goods movement and the regional economy is a fundamental consideration in TransLink’s
strategic investments and planning programs. A regional goods movement strategy, developed in collaboration
with regional partners and stakeholders, would provide an integrated approach to help guide TransLink’s new
infrastructure investments, as well as strategic roadway and bridge upgrades.

8/7/2019 2010 10 Year Transportation and Financial Plan
http://slidepdf.com/reader/full/2010-10-year-transportation-and-financial-plan 98/154
2010 10-Year Plan
Appendix 12
Funding for operations, maintenance and rehabilitation of TransLink’s bridges and Major Road Network is
required. The Pattullo Bridge needs to be replaced and other crossings require upgrades. Strategic investments
in infrastructure and policy development are also required to support a robust goods movement network.
#3: Build and operate a safe, secure and accessible transportation system It is vital that people feel safe and secure, regardless of the transportation mode they use, and no matter when
and where they travel. Maintenance and upgrades to roadways, bridges, the cycling network and transit
vehicles, stations and exchanges is a key part of ensuring safety. Increased funding for both maintenance and
capital investments in the Major Road Network (MRN) and bridges are needed to improve the condition of the
system. A four‐fold growth in the cycling program and an annual $10 million transit corridor development
program is needed to improve the safety for all modes in and around transit corridors and the regional cycling
network.
Improvements to transit security include efforts that both mitigate threats to the resiliency of the
transportation network, as well as reduce the incidences of aggression towards persons and property. The
continuing development of the Transit Police Service and upgrades to SkyTrain stations and transit exchanges
would increase levels of personal security for all transit riders.
Full implementation of TransLink’s landmark Access Transit Policy through station, corridor and vehicle
upgrades is necessary so that all residents have safe access to the integrated transportation system. Improving
accessibility also requires customer service innovations and provision of convenient and affordable mobility
options. Increasing the transit supply by 25 per cent per capita would allow TransLink to improve the
frequency and coverage of the transit system.
#4: Diversify revenue sources and pursue new and innovative ways to fund transportation TransLink’s existing funding streams do not provide sufficient resources to implement On Track to a Sustainable Region and cannot be increased to the levels required to meet anticipated needs. New and stable
revenue sources must be developed that reflect the value created for residents, businesses and transportation
system users. TransLink requires a broad‐based funding system that includes user fees and mechanisms that
provide price signals which encourage more sustainable travel behaviours. These funding sources fall into
three categories:
1. Existing Funding – Projected revenues from sources currently utilized and the allowable increases under a
Base Plan.
2. Legislatively Possible Funding – Projected revenues from sources currently utilized, feasible increases
allowable under a Supplemental Plan and the introduction of legislatively‐ allowable revenue sources not
currently implemented.
3. Beyond Existing Funding – Increases to existing sources beyond what is allowable by legislation and new
sources requiring legislative amendments.
Currently, TransLink generates the majority of its operating revenues from three sources: transit fares,
property taxes and fuel revenue.

8/7/2019 2010 10 Year Transportation and Financial Plan
http://slidepdf.com/reader/full/2010-10-year-transportation-and-financial-plan 99/154
2010 10-Year Plan
Appendix 12
Transit fares have traditionally generated the largest portion of revenues, and TransLink has one of the highest
fare‐box recovery rates in North America, even though fares are comparable to other Canadian transit
agencies. Increases to transit fares are a possible source of additional revenues but could affect ridership
demand and discourage potential new riders who are price sensitive.
Drawing revenues from property taxes reflects the fact that the region as a whole benefits from an effective
transportation system. However, municipalities rely heavily upon property taxes to provide for increasing
levels of other services to their residents, leaving limited room for additional increases for TransLink. By not
implementing the vehicle levy in 2001, the region was forced to continue raising property taxes to help pay for
the transportation system. TransLink’s 2040 long term revenue strategy is to diversify to more transportation‐
related sources that influence demand patterns.
Fuel taxes are a form of user‐fees for the road system. TransLink has been granted increased rates over the last
decade. There is concern that raising the rates too dramatically would place an immediate burden on residents
of the region who do not yet have attractive transportation alternatives. A substantial increase in fuel prices
could
also
distort
the
market
by
stimulating
increased
sales
in
the
districts
bordering
Metro
Vancouver.
The SCBCTA Act provides TransLink with the authority to collect a levy on vehicles in the region (referred to as Transportation Improvement Fee or a vehicle registration fee). Such a fee could provide a portion of the new
funding required and would increase the proportion of costs that are directly paid by users, further
encouraging alternatives to personal vehicle travel. Introducing a vehicle registration charge will diversify
TransLink’s revenue, and once implemented, TransLink will be accessing all legislative sources that are
supportive of the Transport 2040 goals.
New funding sources are required to meet the revenue requirements and to provide price signals that would
allow the region to meet its transportation goals. New revenue sources that are not part of the SCBCTA Act but could be considered include road pricing, carbon pricing, goods movement fees or other allocated sources.
Road pricing is a broad concept in which motorists pay directly for using a road, bridge or tunnel, for driving in
a defined part of a city or for the distance driven. Road pricing can vary by location, time of day, type of vehicle
and other factors. Road pricing could generate transportation revenue, reduce congestion, encourage
alternative travel modes and reduce emissions. The introduction of a significant new revenue source will
enable TransLink to examine the mix and weighting of its revenues.
Financial Challenge Full implementation of the On Track to a Sustainable Region plan would accelerate the region’s recent transit
expansion, substantially increase investment in cycling and provide the needed levels of funding to maintain
the region’s roads and bridges and allow for strategic investments to facilitate goods movement. The services
described above would complement and build upon the capital investment scenario contained in the
Provincial Transit Plan. However, capital investments in transportation are only part of the means to achieving
livable and sustainable communities. Livable communities require ongoing transportation services with
operating costs that typically dwarf the capital cost over the life of an asset.
Figure 2 demonstrates the financial trajectory associated with On Track to a Sustainable Region. Financial modelling of this plan and the projected revenue from current sources reveals a funding gap in the order of

8/7/2019 2010 10 Year Transportation and Financial Plan
http://slidepdf.com/reader/full/2010-10-year-transportation-and-financial-plan 100/154
2010 10-Year Plan
Appendix 12
$450 million per year. While existing revenues are projected to grow under this option due to inflationary
increases, expanded ridership and contributions from senior government, this would not be sufficient to fund
the full cost of the additional operating and capital requirements under this option.
Revenues beyond what TransLink can access from its existing and legislated revenue sources are needed to
fully fund TransLink’s share of a $12 billion capital program and $13 billion in transportation services and
operating costs, excluding debt services.
Figure 2 – On Track to a Sustainable Region : Funding Gap

8/7/2019 2010 10 Year Transportation and Financial Plan
http://slidepdf.com/reader/full/2010-10-year-transportation-and-financial-plan 101/154

8/7/2019 2010 10 Year Transportation and Financial Plan
http://slidepdf.com/reader/full/2010-10-year-transportation-and-financial-plan 102/154
This document was printed on 100% recycled paper.

8/7/2019 2010 10 Year Transportation and Financial Plan
http://slidepdf.com/reader/full/2010-10-year-transportation-and-financial-plan 103/154
201010-Year Transportationand Financial Supplemental Plan
Funding Stabilization
For the purpose of the BC South Coast British Columbia Transportation Authority Act , this2010 10-Year Transportation and Financial Supplemental Plan constitutes a Supplemental Planprepared in 2009 for the 2010 to 2019 period. If approvals are received from the Mayors’ Councilon Regional Transportation and the Regional Transportation Commissioner, this Plan, togetherwith the 2010 10-Year Transportation and Financial Base Plan, will serve as TransLink’s Strategic Plan.
July 31, 2009Approved for submission to theMayors’ Council on Regional Transportationand the Regional Transportation Commission

8/7/2019 2010 10 Year Transportation and Financial Plan
http://slidepdf.com/reader/full/2010-10-year-transportation-and-financial-plan 104/154

8/7/2019 2010 10 Year Transportation and Financial Plan
http://slidepdf.com/reader/full/2010-10-year-transportation-and-financial-plan 105/154
Contents
1 Introduction 0
Relationship to Base Plan 1
Purpose 1
Summary of Expenditures 1
Summary of Funding Sources 2
2 Transportation Investments and Services 4
Transit Services 5
Bus Services 6
Cycling 6
Roads and Bridges 7
3
Financial Strategy 82010-2019 Revenues and Expenditures 9
Balance Sheet and Cash Flow Statement 14
Inclusions and Exclusions 17
4 Summary and Outcomes 20
Summary 21
Outcomes 22
Figures
Figure 1 – TransLink Pass Discount Rates in Major Canadian Regions 12
Figure 2 – Investment Summary 21
Figure 3 – Transit Supply comparison, 2009 versus 2019 22
Figure 4 – Comparison of Transit Mode Share Impacts by 2019 24
Tables
Table 1 – Annual Transit Service Hour Projections 5
Table 2 – Transit Ridership Forecasts: Funding Stabilization Supplemental 7
Table 3 – Statement of Operations for Year 2010, 2015, and 2019 10
Table 4 – Statement of Operations for Year 2010, 2015, and 2019 – Incremental
Change between Base Plan and Funding Stabilization Program 11
Table 5 – Key Assumptions for the 2010 Funding Stabilization Plan 15
Table 6 – Capital Program for Funding Stabilization Program 18Table 7 – Capital Program – Incremental Change between Base Plan and Funding
Stabilization Program 19

8/7/2019 2010 10 Year Transportation and Financial Plan
http://slidepdf.com/reader/full/2010-10-year-transportation-and-financial-plan 106/154
ii
Appendices
Appendix 1 Consolidated Statement of Financial Position
Appendix 2 Consolidated Statement of Operations
Appendix 2A Consolidated Statement of Operations – Incremental Changes Between
Base Plan and Funding Stabilization Plan
Appendix 3 Consolidated Statement of Cash Flows
Appendix 4 Projected Borrowing Compared to Borrowing Limit and Select Financial
Ratios
Appendix 5 Funding Adjustments
Appendix 6 Capital Cash Flows – Projects Approved and Proposed
Appendix 6A Capital Cash Flows – Projects Approved and Proposed – Incremental
Changes Between Base Plan and Funding Stabilization Plan
Appendix 7 Service Hours
Appendix 7A Service Hours – Incremental Changes Between Base Plan and Funding
Stabilization Plan
Appendix 8 Projected Short-Term Fares by Year
Appendix 9 Projected Fare Rates by Type and Year
Appendix 10 Projected Rates and Revenue for Parking Sales Tax, Hydro Levy,
Transportation Improvement Fee, Motor Fuel Tax Tools

8/7/2019 2010 10 Year Transportation and Financial Plan
http://slidepdf.com/reader/full/2010-10-year-transportation-and-financial-plan 107/154

8/7/2019 2010 10 Year Transportation and Financial Plan
http://slidepdf.com/reader/full/2010-10-year-transportation-and-financial-plan 108/154
1. Introduction

8/7/2019 2010 10 Year Transportation and Financial Plan
http://slidepdf.com/reader/full/2010-10-year-transportation-and-financial-plan 109/154
1
Relationship to Base
PlanThis Supplemental Plan, known as the
Funding Stabilization Plan, is incremental to
the Base Plan and identifies additional
revenues that will be accessed and the
expenditures that will be enabled by these
revenues.
This document is a Supplemental Plan to the
2010-10 Year Transportation and Financial
Base Plan (Base Plan). While the South Coast
British Columbia Transportation Authority
Act (the SCBCTA Act ) requires TransLink toannually prepare a Base Plan that uses only
established funding resources within the
current borrowing limit, the legislation also
allows for a Supplemental Plan if TransLink
proposes expenditures beyond the Base
Plan.
If approved by the Mayors’ Council, this
Supplemental Plan, together with the Base
Plan, will become TransLink’s Strategic Plan.
If the Mayors’ Council does not approve a
Supplemental Plan, the Base Plan becomes
TransLink’s Strategic Plan and will be
implemented, beginning immediately,
requiring substantial cuts in services,
programs and investments.
Purpose
A plan entitled 2010-10 Year Transportation
and Financial Plan (with Supplement) On
Track to a Sustainable Region has been
prepared for submission to the Mayors’
Council for approval. On Track to aSustainable Region includes an Expansion
Program, as well as a Maintenance and
Upgrade Program that, together, would
advance the region towards the Transport
2040 goals over the next 10 years.
Supplementary revenues proposed in On
Track to a Sustainable Region include rate
increases to existing sources as defined by
the SCBCTA Act and a new motor vehicle
charge (Transportation Improvement Fee) asallowed under Section 29(3).
This Supplemental Plan, the Funding
Stabilization Plan, proposes increases to
parking sales tax, transit fares, and fuel tax,
beyond what is permissible under a Base
Plan. Other revenue sources are as in the
Base Plan and the Transportation
Improvement Fee is not introduced.
The purpose of the Funding Stabilization
Plan is to increase revenues from existing
sources to enable TransLink to minimizereductions to services and programs as much
as possible while TransLink continues to
pursue sufficient funding and prepares
future supplemental plans that will renew
progress toward the Transport 2040 goals.
Summary ofExpenditures
The Funding Stabilization Plan enables
TransLink to restore the majority of the
reductions in transit service that are
necessitated under the Base Plan and lowers
the reductions to the road and cycling
programs. Under this Plan, TransLink
remains active in all program areas although
all areas of TransLink’s business will be
impacted.
While the Funding Stabilization Plan
provides sufficient funding to keep
TransLink largely whole in the near term,
this plan falls well below TransLink’sobjective to help build a sustainable region
and be on track to the goals of Transport
2040. In addition, this Plan does not enable
TransLink to keep pace with the population
and employment growth in the region.

8/7/2019 2010 10 Year Transportation and Financial Plan
http://slidepdf.com/reader/full/2010-10-year-transportation-and-financial-plan 110/154
2
Summary of Funding
SourcesThe need for significant additional revenues
to sustain the transportation system has
been known since the time that TransLink’s
Ten Year Outlook to 2013 was prepared in
2004. Projections to 2013, provided in the
2008 Plan, indicated that without new
sustained revenue sources, TransLink would
incur annual deficits and consume its
cumulative surplus by 2012.
Current projections indicate that
incremental revenues in the order of$450 million per year are required to fully
implement On Track to a Sustainable
Region. TransLink has not confirmed
supplemental revenues at this level.
This Funding Stabilization Plan identifies
approximately $130 million per year in
additional revenues through accessing rate
increases from revenue sources currently in
place as allowed by the SCBCTA Act . The
projected revenue from these sources will
fund the expenditures required to maintain
assets in good repair and reduce the severity
of cuts to programs and services that wouldbe required under the Base Plan. The
revenue projections under the Funding
Stabilization Plan are not sufficient to
maintain programs and services at current
levels for the duration of the Plan nor are
they sufficient to undertake upgrades to
existing infrastructure and services or
expansion.
The following increases to funding sources
are proposed under the Funding
Stabilization Plan:
• Fuel tax revenues – increase rate by
3 cents/litre effective January 1, 2010.
• Fare revenues – increase of 7 per cent,
with rate increases in 2010 and 2013,
over what is legislatively permitted unde
a base plan.
• Parking sales tax – increase from
7 per cent to 21 per cent in January 2010.

8/7/2019 2010 10 Year Transportation and Financial Plan
http://slidepdf.com/reader/full/2010-10-year-transportation-and-financial-plan 111/154
8/7/2019 2010 10 Year Transportation and Financial Plan
http://slidepdf.com/reader/full/2010-10-year-transportation-and-financial-plan 112/154
2. TransportationInvestmentsand Services

8/7/2019 2010 10 Year Transportation and Financial Plan
http://slidepdf.com/reader/full/2010-10-year-transportation-and-financial-plan 113/154
5
The transportation program under the
Funding Stabilization Plan is as described
under Section 2.2 of the Base Plan, except in
the areas of transit services, cycling, androads & bridges. The following section
describes the services and investments under
this Funding Stabilization Plan that are in
addition to the Base Plan.
Transit Services
Annual transit service hours are 47 per centhigher, from 2011 onwards, under the
Funding Stabilization Plan, as compared to
the Base Plan (Table 1). Most of this
difference results from conventional bus and
community shuttle services remaining at
2009 levels as opposed to the drastic cuts
that occur under the Base Plan. This Plan
assumes the same level of rapid transit
service hours as the Base Plan.
Table 1 – Annual Transit Service Hour Projections

8/7/2019 2010 10 Year Transportation and Financial Plan
http://slidepdf.com/reader/full/2010-10-year-transportation-and-financial-plan 114/154
6
Bus Services
The Base Plan eliminates 2 million annualhours of bus service, which equates to
approximately 40 per cent of the 2009 levels.
The additional resources that are made
available in this Funding Stabilization Plan
enable TransLink to avoid making the cuts
contained in the Base Plan and instead allow
for bus service levels to be held at the 2009
levels of 4.91 million annual hours through
2019. TransLink will temporarily increase the
capacity of the system as part of the Olympic
strategic initiative. The 5 per cent increase in
bus hours associated with this initiative was
intended to be a permanent expansion tobetter serve demand; however, the funding
constraints necessitate that these increases
be only temporary and all additional services
introduced for the Olympics will be
removed.
TransLink will conduct a strategic bus
network review in 2010 to identify how to
most effectively address existing and future
regional demand with a static level of
resources. The goal of the review will be to
identify where current resources can be
reallocated from lower productivity
corridors and services to higher productivity
areas. TransLink estimates that a
redistribution of bus services in the order of
4 per cent to 5 per cent of the current
annual hours will be required, starting in
2011, in order to meet the funding
constraints of this plan. Under this Plan,
ridership is projected to be 240 million (total
passenger revenue trips) by 2019, which is
higher than the Base Plan by 62 million trips
(Table 2).
Principles for Network EfficiencyReviewThe review of the regional bus system, and
the subsequent plans for reallocation ofresources that will result, will be informed
by key transit policies and programs and by
regional objectives. These include the Transit
Service Guidelines, Area Transit Plans, the
frequent transit network policy and the
Regional Growth Strategy.
Regional Connector ServicesUnder the Base Plan, the seven additional
West Coast Express commuter rail cars that
are currently on order are sold. In the
Funding Stabilization Plan, sufficient
revenues are in place to retain these carsand put them into service sometime after
their expected arrival in summer/fall of 2010
These cars have been purchased to relieve
current capacity constraints. In addition to
this change, the TrainBus service hours that
are reduced in the Base Plan are restored to
current levels under this plan.
Custom Transit (HandyDART)This plan will maintain the HandyDART
services at the December 2009 level of
645,000 annual hours. This figure is
43 per cent higher than the levels in the
Base Plan from 2013 onwards.
Cycling
Under the Base Plan, funding for cycling
improvements is reduced to $1 million a year
from $6 million. This Funding Stabilization
Plan maintains the funding levels at the
current $6 million level for 2010. In 2011 the
annual program funding is cut to $3 million,
and held at that level throughout theduration of this plan.

8/7/2019 2010 10 Year Transportation and Financial Plan
http://slidepdf.com/reader/full/2010-10-year-transportation-and-financial-plan 115/154
7
Table 2 – Transit Ridership Forecasts: Funding Stabilization Supplemental
Roads and Bridges
Operation, Maintenance andRehabilitation of Major RoadNetworkThe Base Plan includes a cut in the
Operation, Maintenance and Rehabilitation
(OMR) funding level to $4,970 per lane-
kilometre (25 per cent of the 2009 optimal
level of $19,100 per lane-kilometre) of theMajor Road Network (MRN). Under this
Funding Stabilization Plan, TransLink will
maintain its operations, maintenance and
rehabilitation (OMR) funding for the MRN
to the municipalities at the 2010 levels of
$13,800 per lane-kilometre on the current
network and committed projects. This
funding level will include an annual
2 per cent inflation factor.
Road Capital ProgramsThe Base Plan eliminates all Minor Road
Capital starting in 2010. In this Funding
Stabilization Plan sufficient funding is
available to restore the MRN Minor Capital
Program to its current level of $20 millionfor 2010. However from 2011 through 2019
this program will be reduced to an annual
level of $10 million.

8/7/2019 2010 10 Year Transportation and Financial Plan
http://slidepdf.com/reader/full/2010-10-year-transportation-and-financial-plan 116/154
3. FinancialStrategy

8/7/2019 2010 10 Year Transportation and Financial Plan
http://slidepdf.com/reader/full/2010-10-year-transportation-and-financial-plan 117/154
9
2010-2019
Revenues andExpenditures
The rate increases to fuel tax, parking sales
tax, and transit fares included in the
Funding Stabilization Plan will generate
additional revenues in the order of
$130 million in 2010. Under this Plan total
revenues will be $1.67 billion by 2019
(Table 3). This is $300 million higher than is
projected for 2019 under the Base Plan
(Table 4). Approximately half of this
$300 million difference is due to thesupplemental rate increases and the balance
is from higher ridership. These incremental
revenues provide funding for the additional
expenditures described above in the
Transportation Investments and Services
section of this document. Expenditures are
also summarized below, following the
description of revenues.
The full set of financial statements that
support this Funding Stabilization Plan are
included as appendices to this document.
Table 3 below summarizes the Statement of
Operations for total revenues and
expenditures under the Funding
Stabilization Plan (i.e. including Base Plan
revenues and expenditures). Table 4
summarizes the changes between the Base
Plan and Funding Stabilization Plan
Statement of Operations. For ease of
reference, the years representing the
starting year (2010), midpoint (2015) and the
10th year (2019) are shown in these tables,
with a detailed breakdown by year provided
in Appendices 2 and 2-A.
Table 4. Statement of Operations for
Year 2010, 2015, and 2019 – Incremental
Change between Base Plan and Funding
Stabilization Program
Motor Fuel Tax Revenue
Under the Funding Stabilization Plan the
fuel tax is increased in 2010 by an additional
3 cents per litre, as allowable under the
SCBCTA Act, to 15 cents per litre. This
increase will generate additional revenue
that averages $67 million per year. The
increases to other revenue sources (parking
sales tax and transit fares) as well as
revenues from the Golden Ears Bridge will
ensure that TransLink maintains compliance
with Section 27.1 of the SCBCTA Act whichrequires that incremental outcome revenues
are at least twice as much as the tenth year
of additional fuel tax revenue.
Motor fuel tax revenue is forecast to be
$265 million in 2009. With 3 cents/litre in
additional fuel tax, motor fuel tax revenues
are projected to be $65 million higher in
2010, for a total of $323 million. By 2019,
the 3 cents/litre rate increase will generate
an additional $73 million, for total motor
fuel tax revenues is of $374 million in 2019.
The increase between 2010 and 2019 reflects
increased fuel consumption. Fuel
consumption growth is driven by higher
travel demand, which grows with
population growth and with the increase in
real disposable income in the longer term.
Factors such as fuel efficiency, density, cost
of fuel and transit investments offset this
increased rate of fuel consumption, albeit at
a slower pace.

8/7/2019 2010 10 Year Transportation and Financial Plan
http://slidepdf.com/reader/full/2010-10-year-transportation-and-financial-plan 118/154
10
Table 3 – Statement of Operations for Year 2010, 2015, and 2019

8/7/2019 2010 10 Year Transportation and Financial Plan
http://slidepdf.com/reader/full/2010-10-year-transportation-and-financial-plan 119/154
1
Table 4 – Statement of Operations for Year 2010, 2015, and 2019 – Incremental Change
between Base Plan and Funding Stabilization Program

8/7/2019 2010 10 Year Transportation and Financial Plan
http://slidepdf.com/reader/full/2010-10-year-transportation-and-financial-plan 120/154

8/7/2019 2010 10 Year Transportation and Financial Plan
http://slidepdf.com/reader/full/2010-10-year-transportation-and-financial-plan 121/154
13
Incremental Canada Line revenue is included
in total fare revenue and is based on
business case forecasts for this project.
Forecasts include the impact of theadditional fare to be charged for passengers
using the Richmond-YVR leg of the line, to
go into effect in January 2010.
Revenue projections also reflect the impact
of the efficiency reallocation of 4.5 per cent
of service hours in 2011. Reallocating service
hours from low productivity services to
higher productivity services will increase the
overall average boardings per service hour.
Other Revenues
Property tax, Hydro Levy, Replacement Tax,Mission Subsidy, tolls and senior government
contributions are unchanged and are as
described in the Base Plan. Interest income
changes by less than $1 million by 2019.
Transit Operations ExpendituresUnder the Funding Stabilization Plan transit
operating expenditures are $775 million in
2009 and increase to $974 million by 2019.
Expenditures by 2019 are $251 million
higher than the Base Plan. Bus Division
expenditures account for $249 million of the
increase, as service hours are held at 2009
levels and are not reduced as under the Base
Plan. The balance of the increase over the
Base Plan reflects the operating cost impact
of the seven additional West Coast Express
cars, which will be placed in service rather
than sold as contemplated in the Base Plan.
Improvements in operational efficiency and
effectiveness will continue to be a priority.
An organizational review is underway and
will be complete by December 2009.
Resources will be realigned, as necessary, toenable TransLink and its subsidiaries to more
effectively execute TransLink’s mandate. Key
performance indicators will continue to be
used to monitor performance, identify
improvement opportunities and allow for
benchmarking.
Roads and Bridges ExpendituresIncremental expenditure in roads and
bridges is between $33 and $45 million over
the Base Plan, depending on the year.Increases in expenditures are attributable to
the renewal of funding (albeit at a lower
amount) to the Minor Road and Bike Capital
Programs and continuing funding for roads
operations, maintenance, and rehabilitation
(OMR). As discussed above, TransLink would
provide OMR funding for the Major Road
Network to municipalities at a rate of
$13,800 per lane kilometre in 2010, and
increasing annually by 2 per cent.
TransLink and Transit Police
ExpendituresUnder the Funding Stabilization Plan,
TransLink expenditures are on average
$8.5 million per year higher than under the
Base Plan. This reflects the significant
difference between the Base plan and
Funding Stabilization Plan assumptions on
cost reductions. The Base Plan includes a
20 per cent reduction to TransLink divisions
and the near elimination of special project
funding. Under the Funding Stabilization
Plan efficiency gains will reduce the
TransLink cost structure by 2 per cent in
2011 and further 0.5 per cent reductions
each year to 2016. The compounding impact
of the escalating efficiency gains will equate
to a 5 per cent savings by 2016.
These targeted savings will be achieved
through an on-going focus on efficiency and
effectiveness. An organizational review is
underway and will be complete by
December 2009. Resources will be realigned
as necessary to enable TransLink to more
effectively execute its mandate.
Debt ServiceInterest Expense
Interest expenses increases by $79 million
between 2009 and 2019, $8 million more
than the Base Plan. The higher interest cost

8/7/2019 2010 10 Year Transportation and Financial Plan
http://slidepdf.com/reader/full/2010-10-year-transportation-and-financial-plan 122/154
14
compared to the Base Plan reflects the
additional $139 million in net capital
expenditures proposed in the Funding
Stabilization Plan
Depreciation Expense
Depreciation expense increases by
$110 million between 2009 and 2019. The
$1 million increase compared to the Base
Plan reflects the larger capital program
described above and detailed in Appendices
6 and 6-A.
Proceeds From Disposal of SurplusAssets
As the implementation of TransLink’s RealEstate Program is contingent on the
development of the full rapid transit
network, current surplus properties will be
disposed of rather than retained. The
proceeds from the sale of five surplus
properties are estimated at $200 million,
which is consistent with the Base Plan.
However, as the sale of the seven WCE cars
anticipated in the Base Plan is not proposed
in the Funding Stabilization Plan, the
projected $2.9 million loss on sale will not
occur.
Funding AdjustmentsTransLink is required by the SCBCTA Act to
generate sufficient funds to pay for its
expenditures and cannot budget for a
funding deficit. Accumulated funding may
be used to balance the budget.
The difference between accumulated surplus
and deficits, using generally accepted
accounting principles (GAAP), and the fund
balance are accounted for by funding
adjustments. A combined negative fundingadjustment means further funding is
required, while a combined positive funding
adjustment means less funding is required.
Appendix A-5 provides a detailed break-out
of the various funding adjustment
components.
Funding adjustments vary marginally from
the Base Plan, averaging $8 million per year
higher.
Balance Sheet andCash FlowStatement
Balance SheetTotal assets will increase by $47.5 million
between 2009 and 2019 over the Base Plan,
bringing the net total assets to $5.2 billion
by the end of 2019. The increase in capital
assets over the Base Plan of $19.5 millionrepresents additions of $29.6 million less
$10.1 million in amortization of capital
assets during the 10-year period. The
balance of the increase in total assets is a
$36.8 million increase in sinking and debt
reserve funds and the $8.8 million decrease
in cash and short-term investments.
By 2019, total liabilities are $144 million
higher than in the base plan, with the
increase in long-term (direct) debt
representing most of this increase.
The Funding Stabilization Plan stays within
the existing debt limit of $2.8 billion,
reaching a peak in 2011 at slightly under
$2 billion.
Cash Flow StatementCash decreases by $8.8 million between 2009
and 2019 compared to the Base Plan. The
Funding Stabilization Plan is cash positive
throughout, with the exception of 2012,
where the projections indicate zero surplus
cash. TransLink actively manages its cashsituation and will access its short-term
borrowing facility.
The incremental changes to the capital
program are $7 million. However, an

8/7/2019 2010 10 Year Transportation and Financial Plan
http://slidepdf.com/reader/full/2010-10-year-transportation-and-financial-plan 123/154
15
additional $133 million in major road
expenditures, which are expensed in
compliance with GAAP, pushes the total
capital expenditures to $2.9 billion. Federaland provincial funding finances $1.2 billion
and other—mostly concessionaire—provides
funding of $0.3 billion.
Cash from operations over this period is
$8.8 million lower than in the base plan
leaving a $281 million cash surplus in 2019.
Assumptions and RisksThe key inputs to the projections are the
initiatives and activities documented in the
preceding sections, underlying economic
assumptions and assumptions driven byTransLink.
Economic assumptions have been developed
through research from a variety of sources.
A primary source has been the Province of
British Columbia’s Three-Year Planestimates, which reflect consensus opinion
of a blue-ribbon panel of economic advisors.
Fuel volumes reflect the output from the
multi-variable forecasting tool described in
the Base Plan.
Table 5 indicates the key assumptions and
the impact of a 1 per cent increase to those
assumptions.
Table 5 – Key Assumptions for the 2010 Funding Stabilization Plan
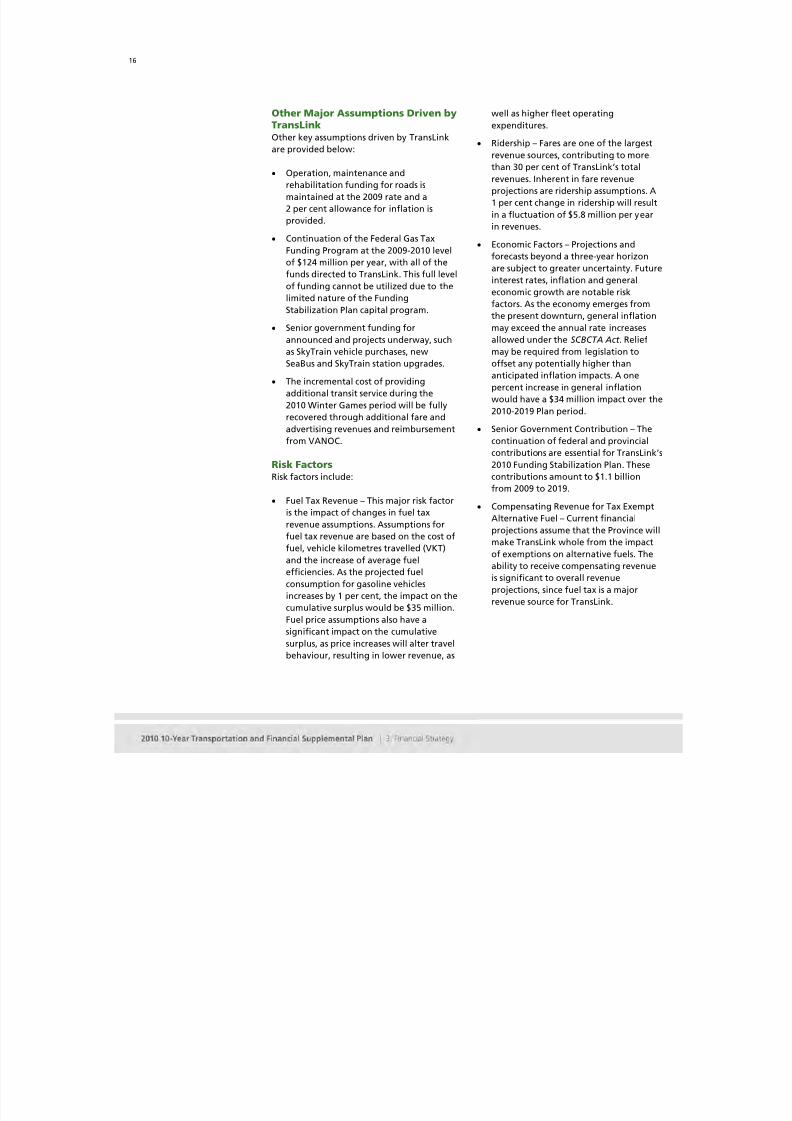
8/7/2019 2010 10 Year Transportation and Financial Plan
http://slidepdf.com/reader/full/2010-10-year-transportation-and-financial-plan 124/154
16
Other Major Assumptions Driven byTransLinkOther key assumptions driven by TransLink
are provided below:
• Operation, maintenance and
rehabilitation funding for roads is
maintained at the 2009 rate and a
2 per cent allowance for inflation is
provided.
• Continuation of the Federal Gas Tax
Funding Program at the 2009-2010 level
of $124 million per year, with all of the
funds directed to TransLink. This full level
of funding cannot be utilized due to the
limited nature of the Funding
Stabilization Plan capital program.
• Senior government funding for
announced and projects underway, such
as SkyTrain vehicle purchases, new
SeaBus and SkyTrain station upgrades.
• The incremental cost of providing
additional transit service during the
2010 Winter Games period will be fully
recovered through additional fare and
advertising revenues and reimbursement
from VANOC.
Risk FactorsRisk factors include:
• Fuel Tax Revenue – This major risk factor
is the impact of changes in fuel tax
revenue assumptions. Assumptions for
fuel tax revenue are based on the cost of
fuel, vehicle kilometres travelled (VKT)
and the increase of average fuel
efficiencies. As the projected fuel
consumption for gasoline vehicles
increases by 1 per cent, the impact on the
cumulative surplus would be $35 million.Fuel price assumptions also have a
significant impact on the cumulative
surplus, as price increases will alter travel
behaviour, resulting in lower revenue, as
well as higher fleet operating
expenditures.
• Ridership – Fares are one of the largest
revenue sources, contributing to morethan 30 per cent of TransLink’s total
revenues. Inherent in fare revenue
projections are ridership assumptions. A
1 per cent change in ridership will result
in a fluctuation of $5.8 million per year
in revenues.
• Economic Factors – Projections and
forecasts beyond a three-year horizon
are subject to greater uncertainty. Future
interest rates, inflation and general
economic growth are notable risk
factors. As the economy emerges fromthe present downturn, general inflation
may exceed the annual rate increases
allowed under the SCBCTA Act . Relief
may be required from legislation to
offset any potentially higher than
anticipated inflation impacts. A one
percent increase in general inflation
would have a $34 million impact over the
2010-2019 Plan period.
• Senior Government Contribution – The
continuation of federal and provincial
contributions are essential for TransLink’s2010 Funding Stabilization Plan. These
contributions amount to $1.1 billion
from 2009 to 2019.
• Compensating Revenue for Tax Exempt
Alternative Fuel – Current financial
projections assume that the Province will
make TransLink whole from the impact
of exemptions on alternative fuels. The
ability to receive compensating revenue
is significant to overall revenue
projections, since fuel tax is a major
revenue source for TransLink.

8/7/2019 2010 10 Year Transportation and Financial Plan
http://slidepdf.com/reader/full/2010-10-year-transportation-and-financial-plan 125/154
17
Inclusions and
ExclusionsThe Funding Stabilization Plan includes:
• Bus fleet replacement.
• SkyTrain fleet refurbishment.
• Second SeaBus replacement.
• Transit infrastructure maintained in good
order.
• Cycling Program funding of $6 million
per year in 2010, declining to $3 million
per year for the 2011-2019 period.
• MRN minor roads capital at $20 million in
2010, declining to $10 million per year
for the 2011-2019 period
• New Pattullo Bridge funding to take the
project to the procurement stage.
• Smartcards and gating systems.
• Major road projects already committed
(Fraser Highway Widening, Coast
Meridian Overpass and Roberts Bank Rail
Corridor Grade Separation).
• SkyTrain fleet expansion (48 vehicles
previously ordered) to address system
overcrowding and passenger safety
issues, and an expanded operations and
maintenance centre to accommodate
fleet growth.
• SkyTrain stations maintained in a state of
good repair.
The Funding Stabilization Plan excludes:
• Detailed design and construction of the
rapid transit lines identified in the
Provincial Transit Plan.
• Pattullo Bridge design and construction,
as it is assumed these costs will be
recovered through tolls.
• Bus fleet expansion and related facilities.
• SkyTrain fleet expansion, other than cars
currently on-order.
• Major Road Network Major CapitalProgram annual allocation of $35 million
per year.
• Major road projects (Main Street
Widening and Murray-Clark Connector).
Capital ProgramTable 6 summarizes the gross cost, net cost
to TransLink and contributions to each
category of the capital program over the
2009 – 2019 period if this Funding
Stabilization Plan is adopted. Table 7
summarizes the incremental changes to thecapital program between the Funding
Stabilization Plan and the Base Plan.

8/7/2019 2010 10 Year Transportation and Financial Plan
http://slidepdf.com/reader/full/2010-10-year-transportation-and-financial-plan 126/154
18
Table 6 – Capital Program for Funding Stabilization Program
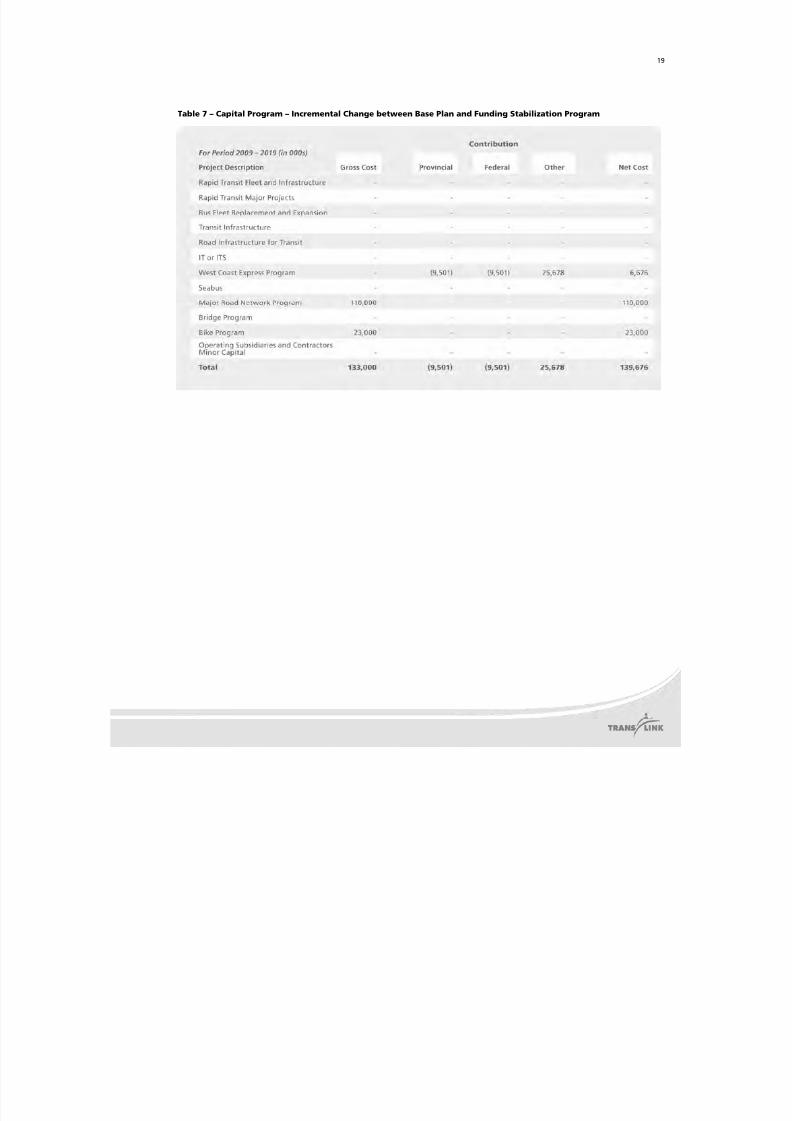
8/7/2019 2010 10 Year Transportation and Financial Plan
http://slidepdf.com/reader/full/2010-10-year-transportation-and-financial-plan 127/154
19
Table 7 – Capital Program – Incremental Change between Base Plan and Funding Stabilization Program

8/7/2019 2010 10 Year Transportation and Financial Plan
http://slidepdf.com/reader/full/2010-10-year-transportation-and-financial-plan 128/154
4. Summary andOutcomes

8/7/2019 2010 10 Year Transportation and Financial Plan
http://slidepdf.com/reader/full/2010-10-year-transportation-and-financial-plan 129/154
2
Summary
This Funding Stabilization Plan represents amajor step backwards for the region’s
transportation system. Figure 2 summarizes
the incremental outputs that this Funding
Stabilization Plan will deliver relative to the
2010 10-Year Base Plan.
Figure 2 – Investment Summary

8/7/2019 2010 10 Year Transportation and Financial Plan
http://slidepdf.com/reader/full/2010-10-year-transportation-and-financial-plan 130/154
22
Outcomes
To assess what this Funding StabilizationPlan would mean to the region, the
performance of this Funding Stabilization
Plan was evaluated against the goals
identified in Transport 2040, for which a
path for the first 10 years is encapsulated in
On Track to a Sustainable Region. These
goals include Greenhouse Gas (GHG)
reduction; most trips by non-auto modes;
majority of jobs and housing along the
Frequent Transit Network; safe, secure and
accessible travel; economic growth and
efficient goods movement; and stable,
sufficient and appropriate funding.
This Funding Stabilization Plan gradually
erodes the progress that TransLink and the
region have made in recent years as the
population grows and the region lacks thefinancial resources to effectively respond.
The total amount of transit service available
to the region’s residents is a reflection of the
transportation choices that will be available.
These levels will decrease by over
10 per cent to approximately 2.3 hours per
capita in 2019, from a peak of 2.6 hours per
capita in 2009. The impacts are in sharp
contrast to what the region would
experience under the Base Plan (Figure 3),
but still represents a step backwards at a
juncture when the regional objectives call
for expansion.
Figure 3 – Transit Supply comparison, 2009 versus 2019

8/7/2019 2010 10 Year Transportation and Financial Plan
http://slidepdf.com/reader/full/2010-10-year-transportation-and-financial-plan 131/154
23
The long-term impact of virtually
eliminating TransLink’s ability to expand the
Frequent Transit Network may have the
largest impact. The land use shapingfunction of the Frequent Transit Network
would be largely lost as there will be no
resources to invest new rapid transit or
frequent bus services into developing areas
of the region. As a result, under this 2010
10-Year Plan, the proportion of people
living within walking distance of the
Frequent Transit Network would remain
relatively constant. While a portion of the
growth is forecasted to occur within walking
distance of the existing Frequent Transit
Network, these gains will be offset by
continued population and job dispersioninto areas that are less conducive for transit
service. With lower service levels, there will
be fewer incentives and opportunities for
land use development within Frequent
Transit Network-designated and conceptual
corridors, and little ability to partner with
municipalities on supportive land use,
diminishing future transit opportunities.
Under this 2010 10-Year Base Plan, transit’s
share of total trips is expected to rise during
the early years of the plan as past
investments in Canada Line and bus service
deliver more passengers. Similarly, a review
of the bus network and reallocation of
resources to higher productivity routes will
produce higher ridership numbers but will
reduce the coverage and accessibility of the
system. In the later years of the plan themode share gains are largely lost due to
population growth. The 2019 transit mode
share forecasts for this Funding Stabilization
Plan, the Base Plan and On Track to a
Sustainable Region are compared in
Figure 4.
This Plan will also accomplish little in terms
of reducing GHG emissions, though
advances in vehicle technologies and fuels
will result in minor reductions in GHGs from
vehicles. Without a significant expansion of
the Frequent Transit Network andinvestments in rapid transit, TransLink will
be unable to fully support the Regional
Growth Strategy and its objectives for
compact and complete communities. These
types of land use changes would reduce
distances traveled and the demand for
personal vehicle travel, which are essential
in meeting the regional GHG reduction
targets. Opportunities to improve the safety
and security of the transportation system are
greatly reduced as capital funding is not
available for improvements to stations and
exchanges, and significantly cut for MRNcapital projects and cycling improvements.

8/7/2019 2010 10 Year Transportation and Financial Plan
http://slidepdf.com/reader/full/2010-10-year-transportation-and-financial-plan 132/154
24
Figure 4 – Comparison of Transit Mode Share Impacts by 2019
In summary, under this Funding Stabilization
Plan, the regional transportation system will
fail to meet the conditions required to fulfill
the long-term aspirations for a sustainableregion. The curve to get back On Track to a
Sustainable Region will be much steeper,
and the necessary land use changes will
happen more slowly or not at all. Without
substantial strategic investments in the
transportation system, travel in the region
will remain auto-dependant; congestion will
increase and continue to impact the region’s
ability to move people and goods efficiently
and hinder its ability to compete in the
global economy.

8/7/2019 2010 10 Year Transportation and Financial Plan
http://slidepdf.com/reader/full/2010-10-year-transportation-and-financial-plan 133/154
5. Appendices

8/7/2019 2010 10 Year Transportation and Financial Plan
http://slidepdf.com/reader/full/2010-10-year-transportation-and-financial-plan 134/154

8/7/2019 2010 10 Year Transportation and Financial Plan
http://slidepdf.com/reader/full/2010-10-year-transportation-and-financial-plan 135/154

8/7/2019 2010 10 Year Transportation and Financial Plan
http://slidepdf.com/reader/full/2010-10-year-transportation-and-financial-plan 136/154

8/7/2019 2010 10 Year Transportation and Financial Plan
http://slidepdf.com/reader/full/2010-10-year-transportation-and-financial-plan 137/154
APPENDIX 2 CONSOLIDATED STATEMENT OF OPERATIOSCBCTA FUNDING STABILIZATION PLAN
for the years thousands 2009 2010 2011 2012 2013 2014 2015
Surplus/(Deficit) before Interest & Depreciation 235,260 283,118 285,545 312,490 415,350 432,200 463,266
LT Debt interest 111,596 129,701 139,789 146,550 150,441 150,810 150,640
ST Debt interest 505 512 944 2,376 1,105 984 926
IDC (21,695) (2,099) (366) (366) (191) (191) (191)
Real Estate property float interest 0 0 0 0 0 0 0
GEB interest charge on contractor liability balance 31,554 65,457 67,338 68,399 69,319 70,141 70,353
Int erest Expense 121,960 193,571 207,706 216,960 220,674 221,745 221,728
Capital Prgm >5 yrs 145,924 221,707 228,348 229,883 233,720 237,764 242,817 Capital Prgm <=5 yrs - no other funding 13,419 15,941 18,128 19,899 20,083 19,733 19,729 Subsidiaries and Contractors 5,055 6,139 8,080 8,906 10,032 11,110 11,498
Depreciation Expense 164,397 243,787 254,556 258,689 263,835 268,607 274,044
Surplus/(Deficit) before Other Items (51,097) (154,240) (176,717) (163,158) (69,159) (58,152) (32,506)
Proceeds from Disposal of Surplus Assets 0 0 15,000 35,000 150,000 0 0
Surplus/(Deficit) before Funding Adjustments (51,097) (154,240) (161,717) (128,158) 80,841 (58,152) (32,506)
Funding Adjustments (45,841) 70,276 76,433 50,673 4,851 4,135 (18,376)
Funded Surplus/(Deficit) (96,937) (83,964) (85,284) (77,485) 85,692 (54,017) (50,882)
Cumulative Funded Surplus 281,770 197,806 112,521 35,036 120,728 66,711 15,829

8/7/2019 2010 10 Year Transportation and Financial Plan
http://slidepdf.com/reader/full/2010-10-year-transportation-and-financial-plan 138/154

8/7/2019 2010 10 Year Transportation and Financial Plan
http://slidepdf.com/reader/full/2010-10-year-transportation-and-financial-plan 139/154
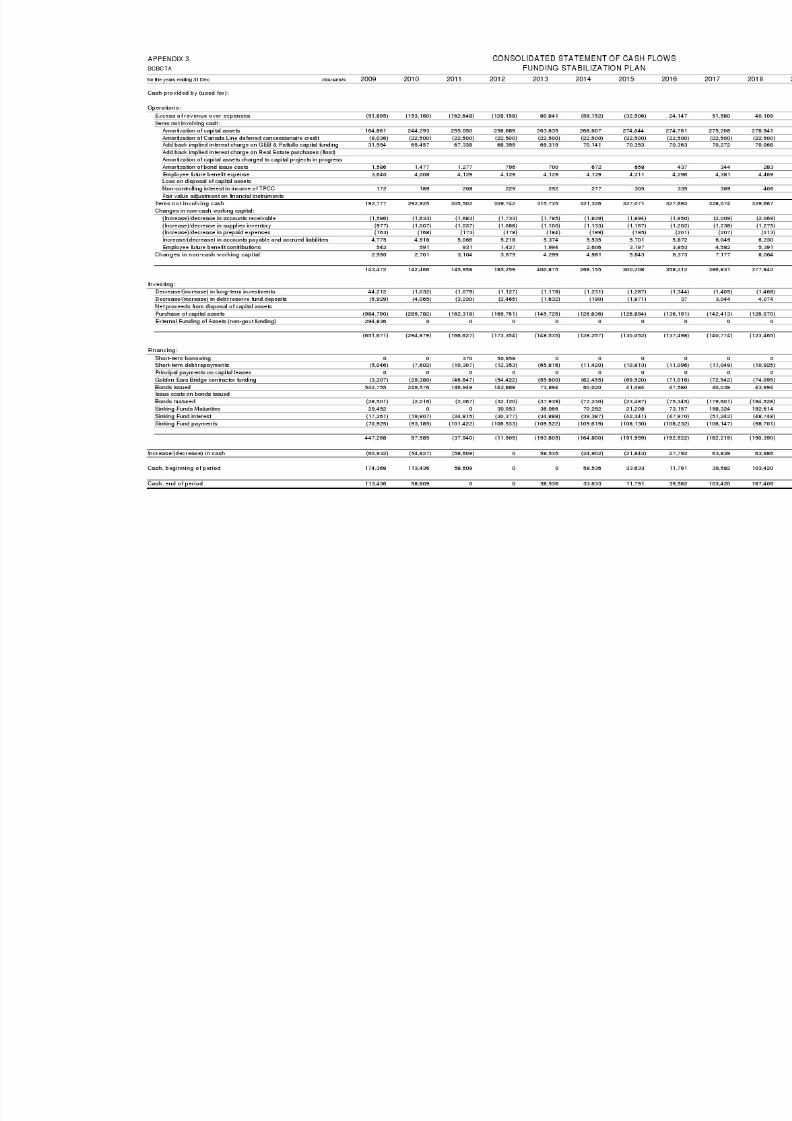
8/7/2019 2010 10 Year Transportation and Financial Plan
http://slidepdf.com/reader/full/2010-10-year-transportation-and-financial-plan 140/154
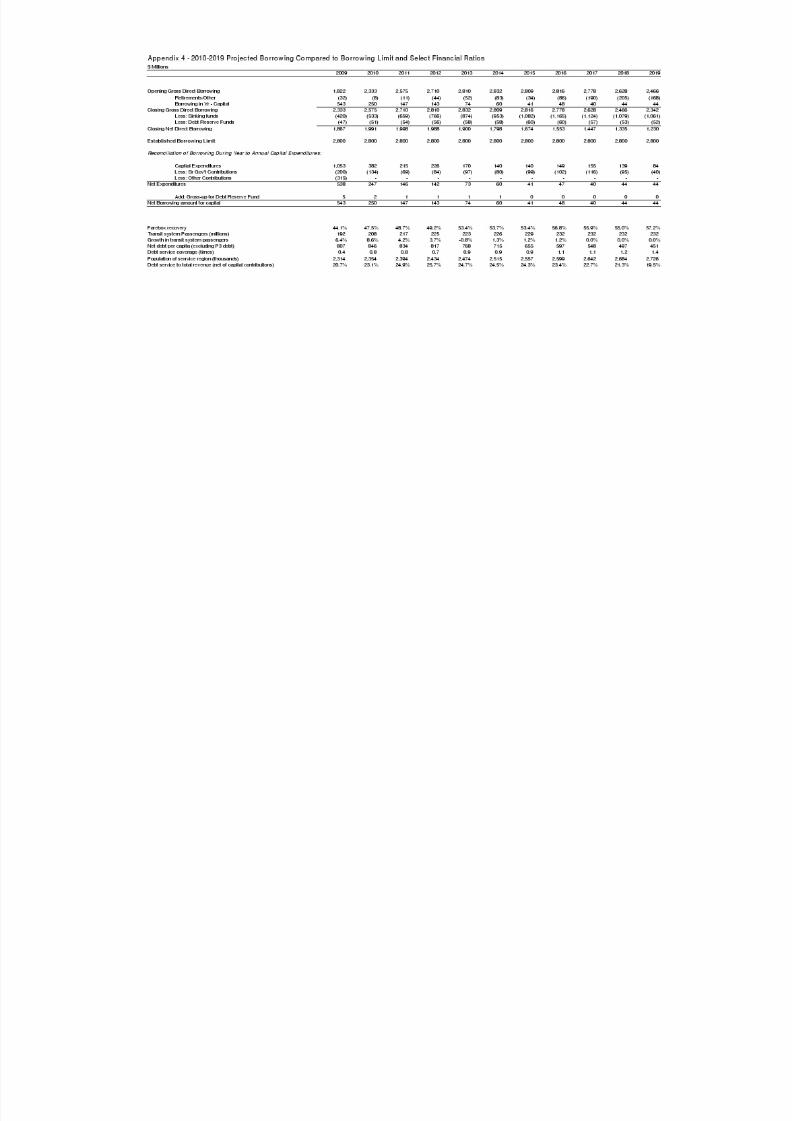
8/7/2019 2010 10 Year Transportation and Financial Plan
http://slidepdf.com/reader/full/2010-10-year-transportation-and-financial-plan 141/154

8/7/2019 2010 10 Year Transportation and Financial Plan
http://slidepdf.com/reader/full/2010-10-year-transportation-and-financial-plan 142/154
Appendix 5 - Funding Adjustments$ Thousands
2010 2011 2012 2013 2014 2015 2016 2017 2018 2019
Surplus/(Deficit ) before Funding Adjust ments (154,240) (161,717) (128,158) 80,841 (58,152) (32,506) 24,147 51,580 40,109 31,649
Reverse: Depreciat ion & other non cash expenditures 267,358 270,871 267,906 268,150 268,518 270,829 265,937 263,755 267,320 266,668 Reverse: Restricted capital contributions (135,043) (69,988) (85,284) (97,578) (81,275) (100,097) (102,925) (116,677) (96,433) (40,917) Re verse : Ca pt ia l p aymen ts to municipa li ti es for MRN 9 1,715 52,368 56,154 24,170 13,000 13,000 13,000 13,000 13,000 13,000 Add: Payments to Sinking Fund and to P3 partners for debt (153,753) (176,819) (188,103) (189,892) (196,107) (202,108) (204,422) (203,490) (197,047) (188,425)
Funding Adjustments 70,276 76,433 50,673 4,851 4,135 (18,376) (28,410) (43,412) (13,160) 50,327
Funded Surplus/(Deficit) (83,964) (85,284) (77,485) 85,692 (54,017) (50,882) (4,263) 8,168 26,949 81,976

8/7/2019 2010 10 Year Transportation and Financial Plan
http://slidepdf.com/reader/full/2010-10-year-transportation-and-financial-plan 143/154

8/7/2019 2010 10 Year Transportation and Financial Plan
http://slidepdf.com/reader/full/2010-10-year-transportation-and-financial-plan 144/154

8/7/2019 2010 10 Year Transportation and Financial Plan
http://slidepdf.com/reader/full/2010-10-year-transportation-and-financial-plan 145/154
Appendix 7 - 2009 - 2019 Service Hours (thousands)
2009 2010 2011 2012 2013 2014 2015 2016 2017 2018 2019
Conventional Bus 4,355 4,497 4,331 4,331 4,331 4,331 4,331 4,331 4,331 4,331 4,331Community Shuttle 552 580 580 580 580 580 580 580 580 580 580Total Bus 4,908 5,077 4,911 4,911 4,911 4,911 4,911 4,911 4,911 4,911 4,911
SkyTrain E&M 969 1,149 1,156 1,156 1,156 1,156 1,156 1,156 1,156 1,156 1,156Canada Line 61 184 184 184 184 184 184 184 184 184 184Total Rapid Transit 1,030 1,332 1,340 1,340 1,340 1,340 1,340 1,340 1,340 1,340 1,340
SeaBus 11 11 11 11 11 11 11 11 11 11 11West Coast Express 39 38 41 41 41 41 41 41 41 41 41Custom 632 645 645 645 645 645 645 645 645 645 645Total Service Hours 6,620 7,102 6,947 6,947 6,947 6,947 6,947 6,947 6,947 6,947 6,947

8/7/2019 2010 10 Year Transportation and Financial Plan
http://slidepdf.com/reader/full/2010-10-year-transportation-and-financial-plan 146/154
Appendix 7A - 2009 - 2019 Service Hours (thousandsIncremental Changes Between Base Plan and Funding Stabilization Plan
2009 2010 2011 2012 2013 2014 2015 2016 2017 2018 2019
Conventional Bus - 486 1,658 1,658 1,658 1,658 1,658 1,658 1,658 1,658 1,658 Community Shuttle - 87 347 347 347 347 347 347 347 347 347 Total Bus - 573 2,005 2,005 2,005 2,005 2,005 2,005 2,005 2,005 2,005
SkyTrain E&M - - - - - - - - - - - Canada Line - - - - - - - - - - - Total Rapid Transit - - - - - - - - - - -
SeaBus - - - - - - - - - - - West Coast Express - 5 11 11 11 11 11 11 11 11 11
Custom - 32 64 64 64 192 192 192 192 192 192 Total Service Hours - 609 2,080 2,080 2,080 2,208 2,208 2,208 2,208 2,208 2,208

8/7/2019 2010 10 Year Transportation and Financial Plan
http://slidepdf.com/reader/full/2010-10-year-transportation-and-financial-plan 147/154
Append ix 8 - 2009-2019 Projected Shor t Term Fares by Year
2009 2010 2011 2012 2013 2014 2015 2016 2017 2018 2019Transit Fares
Short Term 156,461 181,085 188,984 194,608 214,446 218,042 221,583 237,713 238,611 239,547 254,029Other 226,085 261,666 273,079 281,206 309,872 315,068 320,185 343,492 344,790 346,143 367,068
Total 382,546 442,751 462,063 475,814 524,318 533,109 541,769 581,205 583,402 585,690 621,097
Note. Based on 2009 Budget split between short term (cash and ticket) fares and other fares. Short Term fares are 40.9% of Conventional fares.Projected revenues to 2019 are based on this percentage, which will likely change with the implementation of SmartCard.

8/7/2019 2010 10 Year Transportation and Financial Plan
http://slidepdf.com/reader/full/2010-10-year-transportation-and-financial-plan 148/154

8/7/2019 2010 10 Year Transportation and Financial Plan
http://slidepdf.com/reader/full/2010-10-year-transportation-and-financial-plan 149/154

8/7/2019 2010 10 Year Transportation and Financial Plan
http://slidepdf.com/reader/full/2010-10-year-transportation-and-financial-plan 150/154
Year 2009
April
1st,
2010 2011 2012 2013 2014 2015 2016 2017 2018 2019
April
1st,
2010 2013 2016 2019
Fare Increases Proposed New Fares
Concession - In the transportation serviceregion SCBCTA Proof of Payment $1.75 $1.75 $1.75 $1.75 $1.97 $1.97 $1.97 $2.09 $2.09 $2.09 $2.22 $1.75 $2.00 $2.00 $2.25Adult - In Mission, Central Fraser Valleyfare receipt or monthly pass and U-pass $1.75 $1.75 $1.75 $1.75 $1.97 $1.97 $1.97 $2.09 $2.09 $2.09 $2.22 $1.75 $2.00 $2.00 $2.25Concession - In Mission, Central FraserValley fare receipt or monthly pass and U-pass $1.50 $1.50 $1.50 $1.50 $1.69 $1.69 $1.69 $1.79 $1.79 $1.79 $1.90 $1.50 $1.75 $1.75 $2.00
Multi-Pass (for conventions)
Per Pass - Purchase 500-5,000 passesper day $5.25 $5.83 $5.83 $5.83 $6.55 $6.55 $6.55 $6.96 $6.96 $6.96 $7.38 $5.75 $6.50 $7.00 $7.25Per Pass - Purchase more than 5,000passes per day $4.25 $4.72 $4.72 $4.72 $5.31 $5.31 $5.31 $5.63 $5.63 $5.63 $5.98 $4.75 $5.25 $5.50 $6.00FastTrax DecalFastTrax Student - All Zones $2.25 $2.50 $2.50 $2.50 $2.81 $2.81 $2.81 $2.98 $2.98 $2.98 $3.16 $2.50 $2.75 $3.00 $3.25OtherStored Value Card/Xpress Card Deposi $10. 00 $11. 10 $11.10 $11.10 $12.48 $12.48 $12.48 $13.25 $13. 25 $13.25 $14.06 $11.00 $12.50 $13.25 $14.00
*Canada Line Add Fare is effective January 1, 2010
Round to Nearest $.25
Passes and Other Product and ServicesRound to Nearest $.25
Round to Nearest $.25
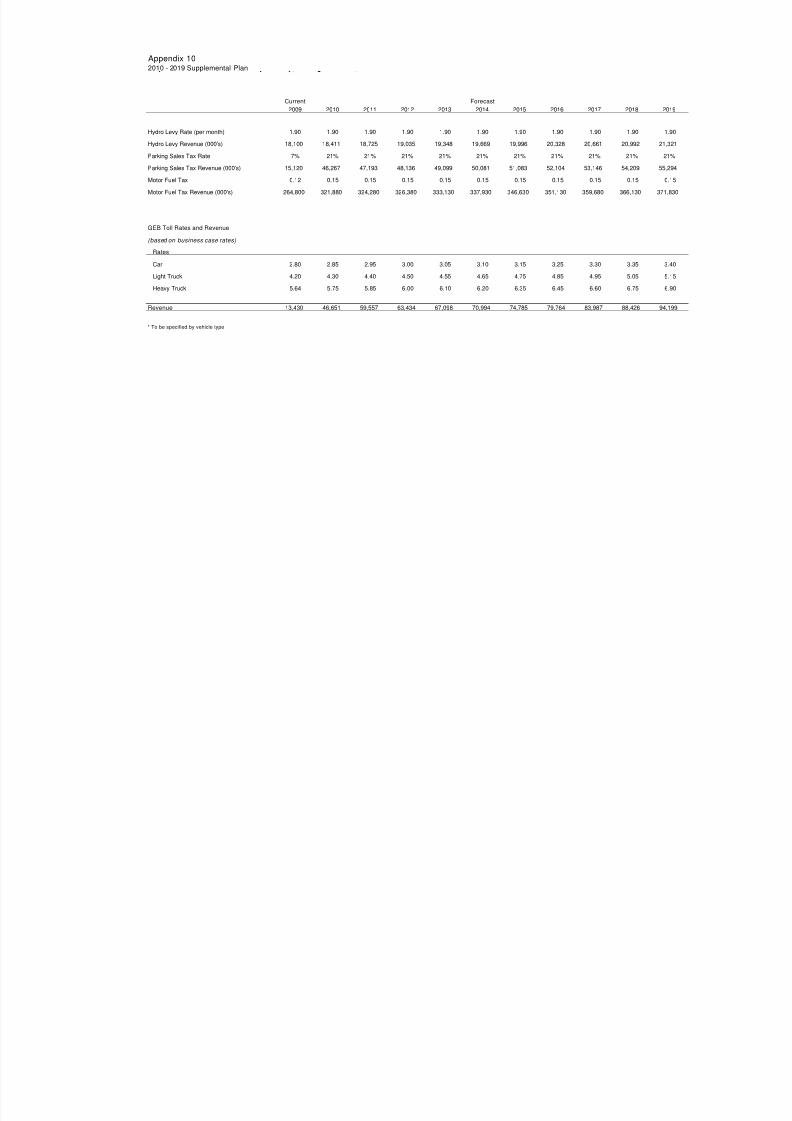
8/7/2019 2010 10 Year Transportation and Financial Plan
http://slidepdf.com/reader/full/2010-10-year-transportation-and-financial-plan 151/154
Appendix 102010 - 2019 Supplemental Plan
Current
2009 2010 2011 2012 2013 2014 2015 2016 2017 2018
Hydro Levy Rate (per month) 1.90 1.90 1.90 1.90 1.90 1.90 1.90 1.90 1.90 1.90
Hydro Levy Revenue (000's) 18,100 18,411 18,725 19,035 19,348 19,669 19,996 20,328 20,661 20,992 2
Parking Sales Tax Rate 7% 21% 21% 21% 21% 21% 21% 21% 21% 21%
Parking Sales Tax Revenue (000's) 15,120 46,267 47,193 48,136 49,099 50,081 51,083 52,104 53,146 54,209 5
Motor Fuel Tax 0.12 0.15 0.15 0.15 0.15 0.15 0.15 0.15 0.15 0.15
Motor Fuel Tax Revenue (000's) 264,800 321,880 324,280 326,380 333,130 337,930 346,630 351,130 359,680 366,130 3
GEB Toll Rates and Revenue
(based on business case rates)
Rates
Car 2.80 2.85 2.95 3.00 3.05 3.10 3.15 3.25 3.30 3.35
Light Truck 4.20 4.30 4.40 4.50 4.55 4.65 4.75 4.85 4.95 5.05
Heavy Truck 5.64 5.75 5.85 6.00 6.10 6.20 6.35 6.45 6.60 6.75
Revenue 13,430 46,651 59,557 63,434 67,098 70,994 74,785 79,764 83,987 88,426 9
* To be specified by vehicle type
Forecast

8/7/2019 2010 10 Year Transportation and Financial Plan
http://slidepdf.com/reader/full/2010-10-year-transportation-and-financial-plan 152/154

8/7/2019 2010 10 Year Transportation and Financial Plan
http://slidepdf.com/reader/full/2010-10-year-transportation-and-financial-plan 153/154

8/7/2019 2010 10 Year Transportation and Financial Plan
http://slidepdf.com/reader/full/2010-10-year-transportation-and-financial-plan 154/154