2009 Employment Profile
3
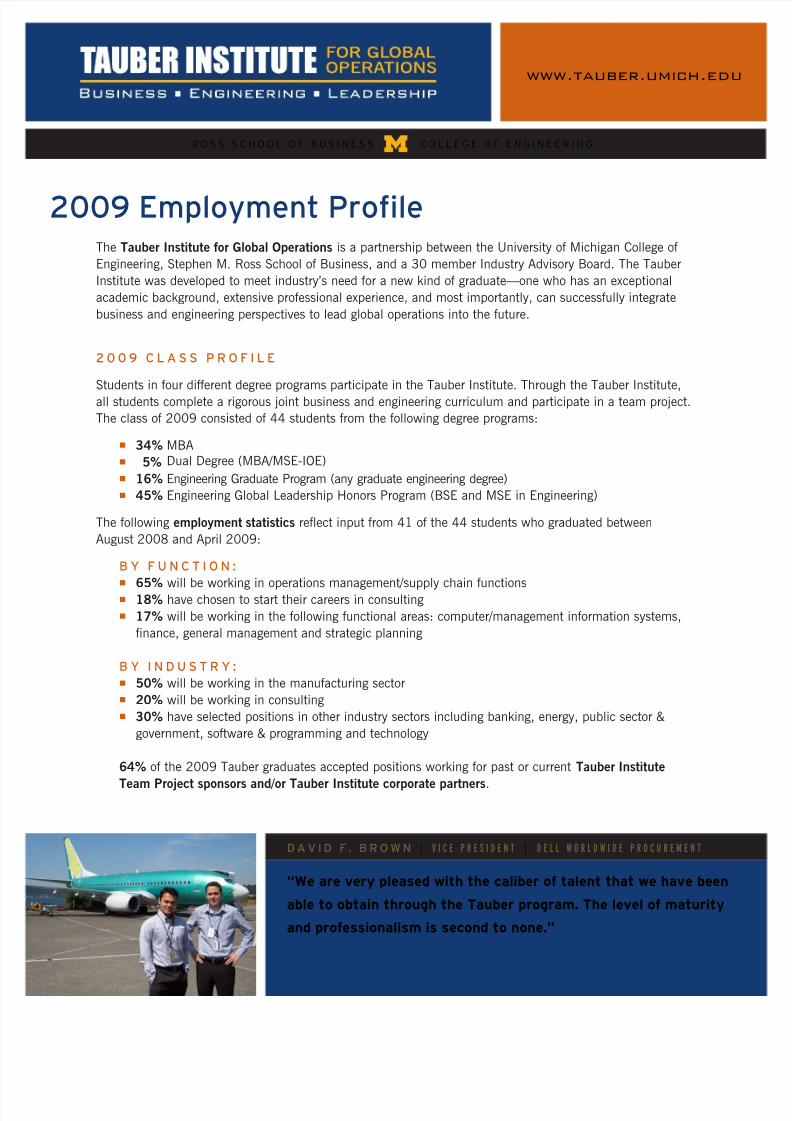
DAVID F. BROWN | VICE PRESIDENT | DELL WORLDWIDE PROCUREMENT “We are very pleased with the caliber of talent that we have been able to obtain through the Tauber program. The level of maturity and professionalism is second to none.” The Tauber Institute for Global Operations is a partnership between the University of Michigan College of Engineering, Stephen M. Ross School of Business, and a 30 member Industry Advisory Board. The Tauber Institute was developed to meet industry’s need for a new kind of graduate—one who has an exceptional academic background, extensive professional experience, and most importantly, can successfully integrate business and engineering perspectives to lead global operations into the future. 2009 CLASS PROFILE Students in four different degree programs participate in the Tauber Institute. Through the Tauber Institute, all students complete a rigorous joint business and engineering curriculum and participate in a team project. The class of 2009 consisted of 44 students from the following degree programs: n 34% MBA n 5% Dual Degree (MBA/MSE-IOE) n 16% Engineering Graduate Program (any graduate engineering degree) n 45% Engineering Global Leadership Honors Program (BSE and MSE in Engineering) The following employment statistics reflect input from 41 of the 44 students who graduated between August 2008 and April 2009: BY FUNCTION: n 65% will be working in operations management/supply chain functions n 18% have chosen to start their careers in consulting n 17% will be working in the following functional areas: computer/management information systems, finance, general management and strategic planning BY INDUSTRY: n 50% will be working in the manufacturing sector n 20% will be working in consulting n 30% have selected positions in other industry sectors including banking, energy, public sector & government, software & programming and technology 64% of the 2009 Tauber graduates accepted positions working for past or current Tauber Institute Team Project sponsors and/or Tauber Institute corporate partners. 2009 Employment Profile www.tauber.umich.edu ROSS SCHOOL OF BUSINESS COLLEGE OF ENGINEERING
-
Upload
rahul-saroha -
Category
Documents
-
view
218 -
download
0
Transcript of 2009 Employment Profile
8/8/2019 2009 Employment Profile
http://slidepdf.com/reader/full/2009-employment-profile 1/2
D A V I D F . B R O W N | V I C E P R E S I D E N T | D E L L W O R L D W I D E P R O C U R E M E N T
“We are very pleased with the caliber of talent that we have been
able to obtain through the Tauber program. The level of maturity
and professionalism is second to none.”
The Tauber Institute for Global Operations is a partnership between the University of Michigan College of
Engineering, Stephen M. Ross School of Business, and a 30 member Industry Advisory Board. The Tauber
Institute was developed to meet industry’s need for a new kind of graduate—one who has an exceptional
academic background, extensive professional experience, and most importantly, can successfully integrate
business and engineering perspectives to lead global operations into the future.
2 0 0 9 C L A S S P R O F I L E
Students in four different degree programs participate in the Tauber Institute. Through the Tauber Institute,
all students complete a rigorous joint business and engineering curriculum and participate in a team project.
The class of 2009 consisted of 44 students from the following degree programs:
n 34% MBAn 5% Dual Degree (MBA/MSE-IOE)
n 16% Engineering Graduate Program (any graduate engineering degree)n 45% Engineering Global Leadership Honors Program (BSE and MSE in Engineering)
The following employment statistics reflect input from 41 of the 44 students who graduated between
August 2008 and April 2009:
B Y F U N C T I O N :
n 65% will be working in operations management/supply chain functionsn 18% have chosen to start their careers in consultingn 17% will be working in the following functional areas: computer/management information systems,
finance, general management and strategic planning
B Y I N D U S T R Y :
n 50% will be working in the manufacturing sectorn 20% will be working in consultingn 30% have selected positions in other industry sectors including banking, energy, public sector &
government, software & programming and technology
64% of the 2009 Tauber graduates accepted positions working for past or current Tauber Institute
Team Project sponsors and/or Tauber Institute corporate partners.
2009 Employment Profile
www.tauber.umich.edu
R O S S S C H O O L O F B U S I N E S S C O L L E G E O F E N G I N E E R I N G

8/8/2019 2009 Employment Profile
http://slidepdf.com/reader/full/2009-employment-profile 2/2
L I S T O F E M P L O Y E R S F O R T H E C L A S S O F 2 0 0 9 :
2 0 0 9 T A U B E R I N S T I T U T E P L A C E M E N T S T A T I S T I C S
August 2008 – April 2009 Graduates
D R . YA VUZ BO Z ER | T A U B E R I N S T I T U T E C O L L E G E O F E N G I N E E R I N G C O - D I R E C T O R
“The Tauber program gives our students the opportunity to find the
right positions and to pursue the careers they want by giving them
the right tools, knowledge and experience to go out, get the job in
the sector they want, and hit the ground running.”
A.T. Kearney (2)
BigMachines Inc.
The Boeing Company (10)
BorgWarner Inc.
Boston Scientific
Campbell Soup Co.
Capital One
Cummins Inc.
GE Healthcare (2)
Government Investment Corp.
IDS America, Inc.
Intel Corporation
Lockheed Martin Corporation (2)
McKinsey & Company (6)
Microsoft (2)
National Grid
Peace Corps
Royal Dutch Shell
Schlumberger
Steelcase
UGI/AmeriGas
United Technologies
US Navy
B Y I N D U S T R Y B A S E T O T A L
% Average Median Range Average Median Range
MBA and Dual Degree 16 of 17 students reporting
Manufacturing 50% $ 102,563 $ 108,000 $ 82,500 – $ 108,000 $ 125,438 $ 131,500 $100,500 – $ 142,000Consulting 13% $ 127,500 $ 127,500 $ 125,000 – $ 130,000 $ 165,000 $ 165,000 $155,000 – $ 175,000Other 38% $ 98,500 $ 100,000 $ 85,000 – $ 112,000 $ 124,142 $ 124,125 $ 96,000 – $ 152,600
EGL 19 of 20 students reporting
Manufacturing 42% $ 76,800 $ 79,950 $ 63,000 – $ 86,000 $ 84,925 $ 83,950 $ 66,500 – $ 99,500Consulting 26% $ 64,000 $ 65,000 $ 60,000 – $ 65,000 $ 76,800 $ 70,000 $ 70,000 – $ 106,000Other 32% $ 71,100 $ 70,000 $ 63,000 – $ 80,000 $ 75,340 $ 70,000 $ 63,000 – $ 93,700
EGP 6 of 7 students reporting
Manufacturing 67% $ 73,750 $ 73,000 $ 63,000 – $ 86,000 $ 82,875 $ 83,000 $ 66,000 – $ 99,500
Consulting 17% $ 75,000 $ 75,000 n/a $ 82,000 $ 82,000 n/aOther 17% $ 54,000 $ 54,000 n/a $ 59,000 $ 59,000 n/a
B Y F U N C T I O N B A S E T O T A L
% Average Median Range Average Median Range
MBA and Dual Degree 16 of 17 students reporting
Operations/Supply Chain 75% $ 103,042 $ 108,000 $ 90,000 – $ 110,000 $ 128,508 $ 131,500 $ 96,000 – $ 152,600Consulting 13% $ 127,500 $ 127,500 $ 120,000 – $ 130,000 $ 165,000 $ 165,000 $155,000 – $ 175,000Other 13% $ 87,500 $ 87,500 $ 95,000 – $ 105,000 $ 103,125 $ 103,125 $ 96,000 – $ 110,200
EGL 19 of 20 students reporting
Operations/Supply Chain 50% $ 76,322 $ 75,000 $ 63,000 – $ 86,000 $ 84,925 $ 87,899 $ 66,500 – $ 99,500Consulting 28% $ 64,000 $ 65,000 $ 60,000 – $ 65,000 $ 76,800 $ 70,000 $ 64,000 – $ 106,000Other 22% $ 71,000 $ 70,000 $ 63,000 – $ 80,000 $ 71,000 $ 70,000 $ 63,000 – $ 80,000
EGP 6 of 7 students reporting
Operations/Supply Chain 83% $ 74,000 $ 75,000 $ 63,000 – $ 86,000 $ 82,700 $ 82,000 $ 66,400 – $ 99,500Other 17% $ 54,000 $ 54,000 n/a $ 59,000 $ 59,000 n/a