20080418 Seafood EU -...
21
April 2008 – Glitnir Seafood Research 1 EU SEAFOOD INDUSTRY REPORT GLITNIR SEAFOOD RESEARCH April 2008
Transcript of 20080418 Seafood EU -...

April 2008 – Glitnir Seafood Research 1
EU SEAFOOD INDUSTRY REPORT GLITNIR SEAFOOD RESEARCH April 2008

April 2008 – Glitnir Seafood Research 2
INDEX
FOREWORD & MAIN FINDINGS 3
FOREWORD 3
MAIN FINDINGS 3
EU – OVERVIEW 3
GENERAL- OVERVIEW 3
THE EU AND SEAFOOD 3
EU IS BY FAR THE BIGGEST SEAFOOD MARKET 3
EU FISHERY MANAGEMENT 3
EU QUOTAS FOR 2008 3
THE EU SEAFOOD SUPPLY 3
OVERVIEW 3
DENMARK AND SPAIN THE LEADING FISHING COUNTRIES 3
FRANCE AND SPAIN LEADING IN AQUACULTURE 3
EU SEAFOOD SELF-SUFFICIENCY DECLINING 3
EU SEAFOOD PROCESSING 3
THE EU FISH PROCESSING SECTOR 3
SEAFOOD – SALES & TRADE 3
EU-27 NEGATIVE SEAFOOD TRADE BALANCE 3
MAIN TRADING PARTNERS OF THE EU-27 - IMPORT 3
MAIN TRADING PARTNERS OF THE EU-27 - EXPORT 3
SEAFOOD – CONSUMPTION 3
PORTUGAL TOPS SEAFOOD CONSUMPTION 3
GERMANY – SEAFOOD CONSUMPTION 3
FRANCE – SEAFOOD CONSUMPTION 3
UK – SEAFOOD CONSUMPTION 3
SPAIN – SEAFOOD CONSUMPTION 3
POLAND – SEAFOOD CONSUMPTION 3
ITALY – SEAFOOD CONSUMPTION 3
PORTUGAL – SEAFOOD CONSUMPTION 3
DENMARK – SEAFOOD CONSUMPTION 3
FRANCE THE LARGEST MARKET FOR SEAFOOD 3
EU SEAFOOD CONSUMPTION 2010 3
THE EU SEAFOOD CONSUMPTION 3
EU SEAFOOD CONSUMPTION 2010-2030 3
GLITNIR SEAFOOD OVERVIEW 3
DISCLAIMER 3
CONTACT INFORMATION 3

April 2008 – Glitnir Seafood Research 3
FOREWORD & MAIN FINDINGS
FOREWORD
Dear Reader,
It is our pleasure to present the latest issue of Glitnir's Seafood Industry Report. In this issue we focus on the
seafood industry in the European Union. We are now in our fifth year of publication and are grateful for the good
feedback we have received from our industry partners.
The European Union, when regarded as one country, boasts the world’s largest catches, surpassed only by
China and Peru in total volume. It is also one of the world's largest seafood markets and has an annual average
per capita consumption of approximately 26.5 kg. This report gives an analytical overview of the main driving
forces within the EU seafood industry combined with our evaluation of likely developments and future
trends.
We trust you find this report of benefit. We at Glitnir are proud of our strong team of seafood industry experts
and look forward to working with you in our quest to make the seafood industry even more dynamic, efficient
and profitable.
You can contact the seafood team via [email protected] and www.glitnirbank.com/seafood
Best regards,
Glitnir Seafood Team
THE SEAFOOD INDUSTRY VALUE CHAIN The purpose of Glitnir’s EU Seafood Report is to assist our current and potential clients in understanding the
fundamentals of the EU seafood industry value chain.
A business may choose to devote its effort to one, several or all of the sectors in this chain. A sound investment
decision, however, must always be based on a clear understanding of each sector in which the value is created.
This report provides a general overview of the development and current status in aquatic catch and culture,
seafood processing, distribution and consumption in the EU.
FishingPrimary
ProcessingSecondaryProcessing
DistributionTrading / Import & Export
ConsumptionTrends / Species
Aquaculture
FishingPrimary
ProcessingSecondaryProcessing
DistributionTrading / Import & Export
ConsumptionTrends / Species
Aquaculture

April 2008 – Glitnir Seafood Research 4
MAIN FINDINGS
• The European Union, when regarded as one country, boasts one of the world's largest catches, surpassed only by China and Peru in total volume
• EU catches have dropped in recent years and aquaculture production has remained stable resulting in increased dependence on seafood imports
• Denmark and Spain are the leading fishing nations. The combined catches of Denmark and Spain account for about one third of total EU catches
• Pelagic species such as herring, mackerel, blue whiting and sprat are the mainstay of EU catches
• Spain, France, the UK and Italy are the major contributors of farmed seafood. The aquaculture sector represented 18% of the EU’s total seafood production in 2005. The species most widely farmed in the EU are blue mussel, rainbow trout and salmon
• The EU is the largest seafood market and if EU-intra trade is included it represented 45% of the world’s total seafood imports in 2006. Even though the EU-intra trade is excluded the EU is still the largest seafood market with 27% of the world’s total seafood imports in 2006
• EU-27 countries import approximately four times more seafood products than they export. In 2006 the seafood trade balance for EU-27 was negative by 3,907,940 MT, worth €13.8 billion
• France is the largest seafood market within the EU (in volume), followed by Spain, Italy, the UK and Germany
• Spain is the EU’s main seafood processor with a total production value of €3.2 billion
• Per capita consumption of seafood is by far the highest in Portugal or 57 kg/year/per capita. The EU has an annual average per capita consumption of approximately 26.5 kg
• According to FAO’s study on European seafood consumption for the year 2010, there is going to be an overall increase in all commodity groups, except for frozen fish. Prepared/preserved fish will continue to increase in the European market as a result of a change in dining habits and spread of supermarket/retail chains

April 2008 – Glitnir Seafood Research 5
EU – OVERVIEW
The European Union (EU) is a political and economic community of twenty-seven member states, located primarily in Europe. GENERAL- OVERVIEW
• EU-27: Austria, Belgium, Bulgaria, Cyprus, Czech Republic, Denmark, Estonia, Finland, France, Germany, Greece, Hungary, Ireland, Italy, Latvia, Lithuania, Luxembourg, Malta, the Netherlands, Poland, Portugal, Romania, Slovenia, Slovakia, Spain, Sweden, and the UK
• EU-27 Area: 4,324,782 sq. km • EU-27 Population: 497.1 million (2008 estimate) • EU-27 GDP real growth rate in 2007(est.): 3% • EU-27 GDP per capita in 2006: €23,700 • EU-27 Inflation: 3.5% (as of March 2008) • EU-27 Foreign Direct Investment in 2006: €399
billion (inward), €436 billion (outward), €37 billion (net outflow)
THE EU AND SEAFOOD
• The total seafood supply of the EU-27 countries in 2005 was 7.1 million tonnes of which 5.8 million tonnes were derived from capture
• The largest fishing nation is Denmark representing 16% of total capture of the EU-27, followed by Spain (15%), the UK (12%) and France (11%)
European Union
The World’s Top Seafood Suppliers 2005
Source: FAO

April 2008 – Glitnir Seafood Research 6
EU IS BY FAR THE BIGGEST SEAFOOD MARKET
• The EU is the largest seafood market and if EU-intra trade is included the EU represented 45% of the world’s total seafood imports in 2006
• Even though the EU-intra trade is excluded the EU is still the largest seafood market with 27% of the world’s total seafood imports in 2006
• The total EU seafood imports excluding intra trade were worth €15.8 billion in 2006
• Between January – November of 2007 the EU imported seafood products for human consumption (fish, crustaceans and molluscs) worth €14.8 billion. In the same period the EU exported seafood products (HC) worth €2.2 billion
The Main Seafood Importers by Value 2006
Source: Glitnir Research
EU FISHERY MANAGEMENT
The EU has the Common Fisheries Policy (CFP) in order to manage its fisheries for the benefit of both fishing communities and consumers.
Source: European Commission, 2006
• The EU has the Common Fisheries Policy (CFP) in order to manage its fisheries for the benefit of both fishing communities and consumers
• The CFP is the European Union's instrument for the management of fisheries and aquaculture. It was created to manage a common resource and to meet the obligation set in the original treaties of the then European Community. Because fish is a natural and mobile resource it is considered as a common resource. In addition, the treaties which created the community stated that there should be a common policy in this area, that is, common rules adopted at EU level and implemented in all member states
• Common measures are agreed in the following main areas:
• Conservation and limitation of the environmental impact of fishing - to protect fish resources by regulating the amount of fish taken from the sea, by allowing young fish to reproduce, and by ensuring that measures are respected
• Structures and fleet management - to help the fishing and aquaculture industries adapt their equipment and organisations to the constraints imposed by scarce resources and the market; measures aimed at creating a balance between fishing effort and available fish resources are also in place
• Markets - to maintain a common organisation of the market in fish products and to match supply and demand for the benefit of both producers and consumers
• Relations with the outside world - to set up fisheries partnerships agreements and to negotiate at the international level within regional and international fisheries organisations for common conservation measures in deep-sea fisheries
• Total Allowable Catches (TACs) are fixed annually by the council of ministers in December. They consider proposals drawn up by the European commission in consultation with its own scientific advisers (Scientific, Technical and Economic Committee of Fisheries STECF)

April 2008 – Glitnir Seafood Research 7
EU FISHERY MANAGEMENT The EU sets the TACs, supplies funding, maintains the common market and negotiates fishing rights with non-EU countries.
Source: European Commission, 2008
Source: European Commission, 2008
Markets Relations with the outside world
Conservation and environment
Structures (Funding)
To protect fish resources by regulating the amount of fish taken from the sea, by allowing young fish to reproduce, and by ensuring that measures are respected • The CFP has to take into account
the biological, economic and social dimension of fishing
• For information on the CFP: http://ec.europa.eu/fisheries/publications/maps_en.htm
• ICES presents recommendations, based on input from scientists of individual member countries, to the Council of Ministers, which decides in December each year the TAC for the following year. Each country’s share of the TAC is called a national quota
• For information on stock situation: http://www.ices.dk/committe/acfm/comwork/report/asp/advice.asp
• STECF (Scientific, Technical and Economic Committee of Fisheries) prepares proposals for TACs
To help the fishing and aquaculture industries adapt their equipment and organisations to the constraints imposed by scarce resources and the market; measures aimed at creating a balance between fishing effort and available fish resources are also in place • Funding is available to adjust and
modernise the fishing fleet and for various socio-economic measures. Measures to support aquaculture, processing, marketing and port facilities and collective measures taken by the industry
• A previous system was ineffective in tackling the overcapacity of the fleet
• A new system will give more responsibility to the member states to balance capacity with available resources
To maintain a common organisation for the fish product market and to match supply and demand for the benefit of both producers and consumers • This was achieved by the creation of
the European single market and opening up of world trade
• Common marketing standards for fresh products
• Producers organisations (POs) set up to protect fishermen from sudden changes in demand
• Creation of minimum prices below which fish cannot be sold. Financial support is available
• Rules for trade with non-EU countries
To set up fisheries partnerships, agreements and to negotiate with regional and international fisheries organisations for common conservation measures in deep-sea fisheries
• Fishing rights for vessels have been negotiated with many non-EU countries in return for various forms of compensation
• These access agreements are now called partnership agreements
• The financial contribution shall cover expenditure linked to fisheries management costs
• In the future, this contribution will be justified by the mutual interest of the two parties to invest in a sustainable fisheries policy
Enforcement
Monitoring of regulations is crucial to effective fisheries management. Control plays a central role in encouraging compliance, deterring fraud and ensuring sustainable fishing • The authorities in the member states
have to ensure that CFP rules are respected
• An EU inspectorate with a staff of 25 inspectors shall ensure that all national enforcement authorities apply the same standards of quality and fairness in their enforcement
• An EU Fisheries Control Agency shall be set up. It shall pool EU and national means of fisheries control and monitor resources and co-ordinate enforcement activities
How has EU been doing?
Many criticize the EU Fishery Management, especially the setting of TACs, as having been unsuccessful. The management is complex due to the number of states, but they are moving in the direction to sustainability • Individual stocks and fishing areas are
many and the situation is very different, depending on what you are looking at. A few examples:
• Cod is the most important species for Denmark. Catch has gone down considerably in recent years. ICES encourages great precaution in catch, but the situation in the largest area for Denmark, the Baltic, is better than in other areas
• The largest fishing ground for plaice is harvested sustainably, to little is known about other areas

April 2008 – Glitnir Seafood Research 8
EU QUOTAS FOR 2008
EU Quota for Main Species – 2008 (MT)
Species EU BE DK DE EE ES FI FR IE LT LV NL PL PT SE UK
Sprat 684,514 - 241,389 30,525 52,060 - 23,469 - - - 62,877 - 133,435 - 101,184 -
Herring 659,786 7,134 93,219 52,584 33,816 112 105,343 21,462 31,426 4,456 23,658 53,537 45,538 112 112,582 74,837
Atlantic Salmon 379,811 - 75,511 8,401 9,255 - 107,995 - - 5,646 48,028 - 22,097 - 102,068 -
Mackerel 291,537 157 25,000 15,057 124 22,276 - 10,573 49,643 91 91 22,217 1,049 4,601 3,674 136,984
Horse mackerel 268,660 58 40,444 14,079 - 48,980 - 8,480 41,109 - - 62,191 - 32,378 750 20,191
Blue Whiting 227,813 - 39,774 10,783 - 48,397 - 19,231 20,745 - - 33,180 - 8,531 6,627 40,544
Cod 107,464 856 24,003 15,041 1,054 255 846 5,902 1,888 2,631 4,005 2,170 12,500 2,299 13,110 18,604
Saithe 90,259 106 5,636 18,504 - - - 46,582 1,549 - - 191 - - 1,654 16,037
Norway lobster 82,461 1,368 6,351 32 - 2,031 - 10,383 9,546 - - 704 - 311 1,359 50,376
Plaice 71,614 3,971 21,229 3,077 - 75 - 3,847 1,918 - - 19,904 480 75 797 16,241
Haddock 67,920 443 4,000 1,917 - - - 11,300 4,112 - - 212 - - 1,146 44,790
Hake 61,047 314 2,595 126 - 19,650 - 28,416 1,670 - - 261 - 2,104 128 5,783
Anglerfish 56,065 3,229 2,120 952 - 4,064 - 25,729 2,644 - - 835 - 324 10 16,158
Source: European Commission, 2008
THE EU SEAFOOD SUPPLY OVERVIEW
• In 2005, the EU-27 catch was 5.8 million tonnes, 6% of the world total
• The Northeast Atlantic fishing region is of major importance with over 70% of the catches
• As a result of unsafe biological stock levels, catch limits are in place for several species such as anchovy, sandeel, herring, blue whiting, cod and sole
• The poor state of a number of commercially important fish stocks has led to a declining trend in catches in the EU as it has in the rest of the world
• The aquaculture sector represented 18% of the total seafood production in 2005
Capture & Aquaculture 1996-2005
Breakdown of EU’s Seafood Production 2005
Source: Eurostat
April 2008 – Glitnir Seafood Research 9
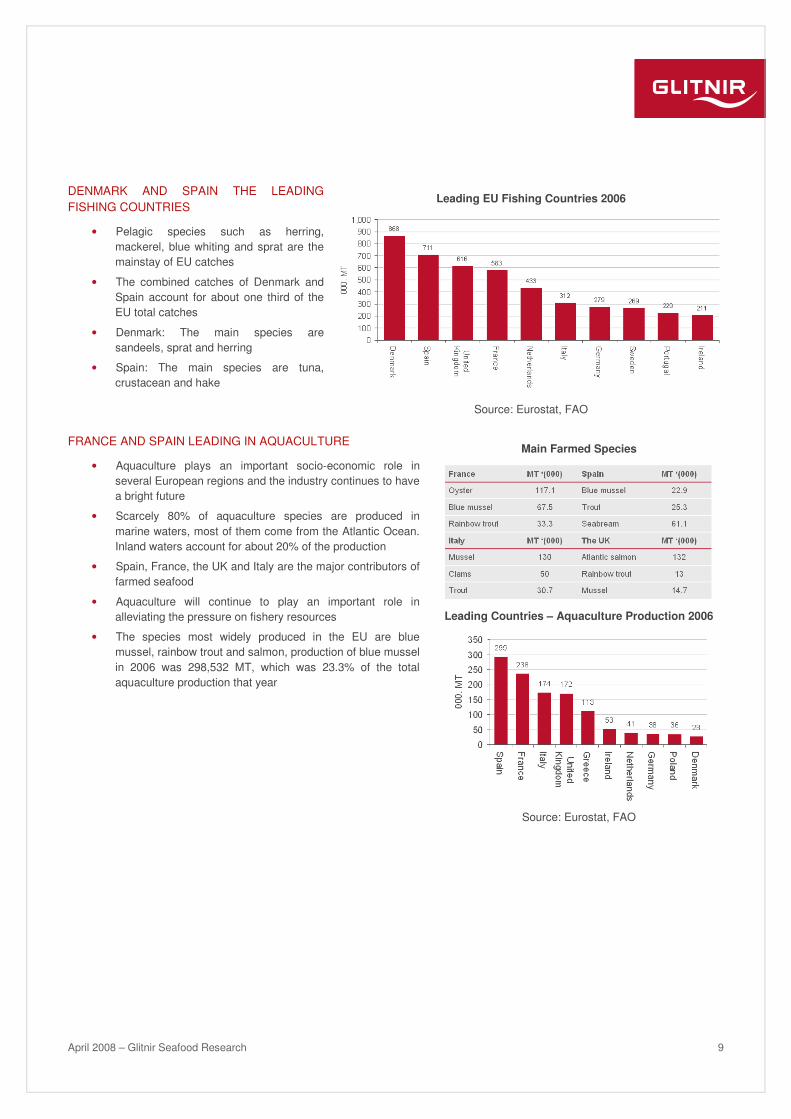
DENMARK AND SPAIN THE LEADING FISHING COUNTRIES
• Pelagic species such as herring, mackerel, blue whiting and sprat are the mainstay of EU catches
• The combined catches of Denmark and Spain account for about one third of the EU total catches
• Denmark: The main species are sandeels, sprat and herring
• Spain: The main species are tuna, crustacean and hake
Leading EU Fishing Countries 2006
Source: Eurostat, FAO FRANCE AND SPAIN LEADING IN AQUACULTURE
• Aquaculture plays an important socio-economic role in several European regions and the industry continues to have a bright future
• Scarcely 80% of aquaculture species are produced in marine waters, most of them come from the Atlantic Ocean. Inland waters account for about 20% of the production
• Spain, France, the UK and Italy are the major contributors of farmed seafood
• Aquaculture will continue to play an important role in alleviating the pressure on fishery resources
• The species most widely produced in the EU are blue mussel, rainbow trout and salmon, production of blue mussel in 2006 was 298,532 MT, which was 23.3% of the total aquaculture production that year
Main Farmed Species
Leading Countries – Aquaculture Production 2006
Source: Eurostat, FAO

April 2008 – Glitnir Seafood Research 10
EU SEAFOOD SELF-SUFFICIENCY DECLINING
• The seafood self-sufficiency of the European Union is estimated to have declined from 53% in 1997 to 36% in 2007 as consumption per capita has increased
• The main reason for this decline is a drop in EU catches which is due to:
- Diminished stocks
- Stricter fishing policy and environmental laws
- Reduced fishing fleet
• Aquaculture production has remained stable in the European Union in recent years
EU Self-Sufficiency
Source: AIPCE report 2006, GAIN
Note: EU 15 1995-2003, EU 25 2004-2007
EU SEAFOOD PROCESSING THE EU FISH PROCESSING SECTOR
Numbers are from 2005
Total production value * (‘000 EUR)
Processing firms* Number of companies with more than 20 employees
Fresh fish* fresh, chilled, frozen, smoked or dried (‘000 EUR)
Crustaceans and molluscs* fresh, chilled, frozen, smoked or dried (‘000 EUR)
Preparations and canned* products of fish or crustaceans and molluscs (‘000 EUR)
Source: European Commission, 2008

April 2008 – Glitnir Seafood Research 11
SEAFOOD – SALES & TRADE EU-27 NEGATIVE SEAFOOD TRADE BALANCE
• EU-27 countries import approximately four times more seafood products than they export. In 2006 the seafood trade balance for EU-27 was negative by 3,907,940 MT worth €13.8 billion
• EU is the world’s biggest importer of seafood products and continues to increase its dependency on imports for its seafood supply
• EU plays a major role as an exporter of high-value seafood products
• Denmark is the single biggest exporting country in both value and volume terms
• Spain remains a key exporter and importer of seafood products to third countries
EU-27 Seafood Extra Trade 2006 – Selected Countries
Source: Eurostat
MAIN TRADING PARTNERS OF THE EU-27 - IMPORT
• Norway is the main supplier of seafood products to the EU, accounting for 17.5% of total EU imports in terms of value in 2006. The other suppliers, ranked in a descending order of importance, were, China, Iceland, US, Morocco, Argentina Thailand, Vietnam, Ecuador, and Chile. According to the latest trade statistic (Jan-Nov 2007), Vietnam and Thailand showed a 19.7% and 15% increase, meanwhile Argentinean exports had decreased by 17.2%. The top ten countries have increased their exports to the EU by 3.4% in 2007 (Jan -Nov) compared to the same period the year before
• Vietnam continued to be the largest Pangasius supplier to the EU. Its exports in the first eleven months of 2007 increased by 34.4% in value and 35% in volume compared to the same period of 2006; in addition, exports of frozen cephalopods also increased by 59.8% in value and 28% in volume, meanwhile frozen shrimp only increased by 2.9% in value and 1.9% in volume
Top Ten Exporting Countries to EU-27 2006
Top Ten Exporting Countries to EU-27 Jan-Nov. 2007
Source: Eurostat

April 2008 – Glitnir Seafood Research 12
MAIN TRADING PARTNERS OF THE EU-27 - EXPORT
• Norway is the main supplier of seafood products to the EU, accounting for 17.5% of total EU imports in terms of value in 2006. The other suppliers, ranked in a descending order of importance, were, China, Iceland, US, Morocco, Argentina Thailand, Vietnam, Ecuador, and Chile. According to the latest trade statistic (Jan-Nov 2007), Vietnam and Thailand showed a 19.7% and 15% increase, meanwhile Argentinean exports had decreased by 17.2%. The top ten countries have increased their exports to the EU by 3.4% in 2007 (Jan -Nov) compared to the same period the year before
• Vietnam continued to be the largest Pangasius supplier to the EU. Its exports in the first eleven months of 2007 increased by 34.4% in value and 35% in volume compared to the same period of 2006; in addition, exports of frozen cephalopods also increased by 59.8% in value and 28% in volume, meanwhile frozen shrimp only increased by 2.9% in value and 1.9% in volume
Top Ten Importing Countries from EU-27 2006
Top Ten Importing Countries to EU-27 Jan-Nov. 2007
Source: Eurostat
SEAFOOD – CONSUMPTION
PORTUGAL TOPS SEAFOOD CONSUMPTION
• In 2005, seafood consumption in Portugal was by far the highest in the EU or 56.9 kg/year/per capita*
• Spain ranks number two with a consumption of 45 kg/year/per capita*
• Germany, France, the UK, Italy and Spain with a population of 83, 63, 61, 58 and 40 million respectively are by far the largest markets for seafood in the EU
• The average seafood consumption in the EU-27 in 2005 was 22 kg/year/per capita*
EU-27 Seafood Consumption 2005
Note: *measured in whole weight equivalent Source: FAOSTAT, University of Portsmouth, CIA World Factbook

April 2008 – Glitnir Seafood Research 13
GERMANY – SEAFOOD CONSUMPTION
• Seafood consumption in Germany has been relatively stable in recent years and in 2005 it was 14.4 kg/year/per capita*
• The most popular species are Alaska pollock (18% of total consumption), herring (18%), Atlantic and Pacific salmon (13%) and tuna (11%)
• Seafood consumption is estimated to have increased by 0.3 kg/year/per capita* in 2006
• Frozen fish products accounted for 32% of total seafood consumption in 2005, followed by canned fish preparations (30%), crayfish and molluscs (14%) and fresh fish (11%)
• Total protein consumption in 2005 was 84.2 kg/year/per capita*, up by 13% since 1996
• Germany’s overall protein consumption per capita increased by 8% between 2000-2005
• In 2005, seafood accounted for 17% of Germany’s total protein consumption
Germany Seafood Consumption
Germany Protein Consumption
Note: *measured in whole weight equivalent
Source: FAOSTAT, GAIN
FRANCE – SEAFOOD CONSUMPTION
• Seafood consumption in France has been relatively stable since 2001, but since 1996 it has increased by 11% up to 33.7 kg/year/per capita*
• In 2005, seafood consumption at-home accounted for 71% of total seafood consumption while food service accounted for 29%
• The most popular species is salmon comprising 2 kg/year/per capita*. France is the largest market for salmon in Europe
• Among other popular species are cod, haddock, Alaska pollock, whiting, tuna, scallops and hake
• Overall protein consumption in France has been relatively stable since 1996 at around 116 kg/year/per capita*
• In 2005, seafood accounted for 29% of the total protein consumption
France Seafood Consumption
France Protein Consumption
Note: *measured in whole weight equivalent
Source: FAOSTAT, GAIN

April 2008 – Glitnir Seafood Research 14
UK – SEAFOOD CONSUMPTION
• In 2005, seafood consumption in the UK was 20 kg/year/per capita*
• In retail, chilled/fresh seafood is the most popular and fastest growing category with salmon as the main species, followed by haddock and cod
• Within the retail chilled/fresh sector, shrimp is the single most increasing species
• The frozen category is also an important category within retail, representing some 50% of total seafood sales (in volume)
• Overall protein consumption in 2005 was 95.5 kg/year/per capita* up by 10% since 1996
• In 2005, seafood accounted for 21% of total protein consumption
UK Seafood Consumption
UK Protein Consumption
Note: *measured in whole weight equivalent
Source: FAOSTAT, GAIN
SPAIN – SEAFOOD CONSUMPTION
• In 2005, seafood consumption in Spain was 44.7 kg/year/per capita*, 5% higher than it was in 1996
• People in Spain tend to prefer whole fresh fish instead of prepared convenience seafood products
• The most popular species in Spain are tuna (24% of total seafood consumption), hake (23%), salmon (9%), cod (9%) and mackerel (6%)
• At-home seafood consumption accounts for around 80% of all consumption
• Seafood consumption is very regional and consumers are considered price sensitive
• Total protein consumption in 2005 was 130.2 kg/year/per capita*, up by 11% since 1996
• In 2005, seafood accounted for 34% of total protein consumption
Spain Seafood Consumption
Spain Protein Consumption
Note: *measured in whole weight equivalent
Source: FAOSTAT, SEAFOODplus Integrated Programme

April 2008 – Glitnir Seafood Research 15
POLAND – SEAFOOD CONSUMPTION
• In 2005, seafood consumption in Poland was 8.6 kg/year/per capita*, down by 9% since 1996
• Herring and mackerel are the most sold fish species, mostly as canned products
• Smoked salmon has also been a popular species but consumption is now moving more towards fresh salmon
• Total protein consumption in 2005 was 67.5 kg/year/per capita*, almost the same as in 1996
• As a proportion of total protein consumption, seafood represents 13%. Among the EU-27 countries, this is the lowest proportion
Poland Seafood Consumption
Poland Protein Consumption
Note: *measured in whole weight equivalent
Source: FAOSTAT, SEAFOODplus Integrated Programme
ITALY – SEAFOOD CONSUMPTION
• In 2005, seafood consumption in Italy was 25.0 kg/year/per capita*, an increase of 17% since 1996 and of more than 50% since 1988
• The strongest demand is for whitefish
• Raw trout is showing the strongest growth, 20% year-on-year in 2005, followed by smoked salmon the consumption of which grew by 11% in the same period
• Fresh seafood constitutes 53% of total seafood consumption, canned 20%, frozen portioned 15%, frozen bulk 8% and dried/smoked/salted 4%
• Total protein consumption in 2005 was 100.8 kg/year/per capita*, up by 4% since 1996
• As a proportion of total protein consumption, seafood represents 25%
Italy Seafood Consumption
Italy Protein Consumption
Note: *measured in whole weight equivalent
Source: FAOSTAT, GAIN

April 2008 – Glitnir Seafood Research 16
PORTUGAL – SEAFOOD CONSUMPTION
• Seafood consumption per capita in Portugal is the highest in the EU-27 or 56.9 kg/year/per capita*. Despite this, consumption has decreased by 10% since 1996
• Of the demersal-fish species, cod and hake are the most popular representing some 60% and 34% of total demersal-fish consumption in 2005, respectively. In 2006, cod represented 63% and hake 31%
• Salted dry cod is one of the most popular seafood product in Portugal
• Fresh seafood is the single most popular product form representing 60% of the total market
• The retail sector dominates seafood sales with an 88% share against the 12% share of foodservice
• Total protein consumption in 2005 was 124 kg/year/per capita*, down by 2% since 1996
• As proportion of total protein consumption, seafood represents 46%. Among the EU-27 countries, this is by far the highest proportion
Portugal Seafood Consumption
Portugal Protein Consumption
Note: *measured in whole weight equivalent
Source: FAOSTAT, GAIN, Telmo Azevedo Fernandes
DENMARK – SEAFOOD CONSUMPTION
• In 2005, seafood consumption in Denmark was 23 kg/year/per capita*, almost the same as it was in 1996
• Around 5% of all seafood is sold directly as fresh fish
• In 2005 supermarket’s share in total seafood sales is estimated to be around 50% up from 15% few years ago. In the next five years their share is projected to increase to 80%
• Total protein consumption in 2005 was 89 kg/year/per capita*, down by 3.8% since 1996
• As a proportion of total protein consumption, seafood represents 26%
Denmark Seafood Consumption
Denmark Protein Consumption
Note: *measured in whole weight equivalent
Source: FAOSTAT, GAIN
April 2008 – Glitnir Seafood Research 17
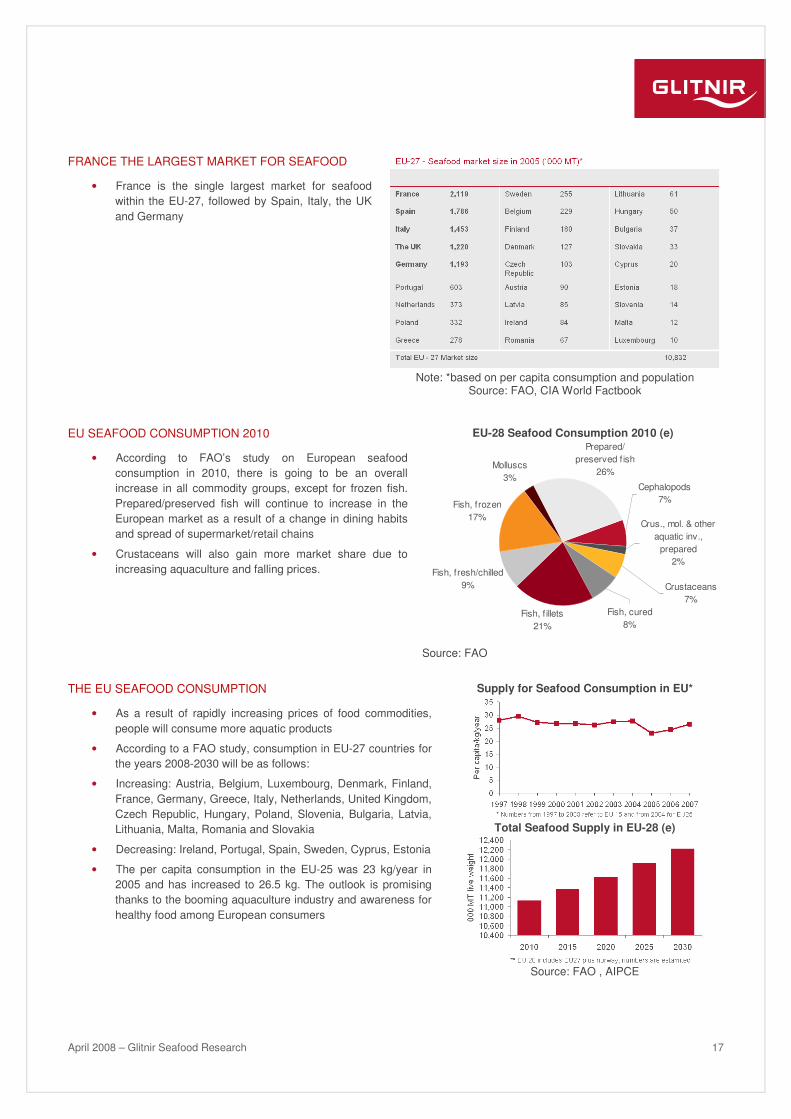
FRANCE THE LARGEST MARKET FOR SEAFOOD
• France is the single largest market for seafood within the EU-27, followed by Spain, Italy, the UK and Germany
Note: *based on per capita consumption and population
Source: FAO, CIA World Factbook
EU SEAFOOD CONSUMPTION 2010
• According to FAO’s study on European seafood consumption in 2010, there is going to be an overall increase in all commodity groups, except for frozen fish. Prepared/preserved fish will continue to increase in the European market as a result of a change in dining habits and spread of supermarket/retail chains
• Crustaceans will also gain more market share due to increasing aquaculture and falling prices.
EU-28 Seafood Consumption 2010 (e)
Source: FAO
THE EU SEAFOOD CONSUMPTION
• As a result of rapidly increasing prices of food commodities, people will consume more aquatic products
• According to a FAO study, consumption in EU-27 countries for the years 2008-2030 will be as follows:
• Increasing: Austria, Belgium, Luxembourg, Denmark, Finland, France, Germany, Greece, Italy, Netherlands, United Kingdom, Czech Republic, Hungary, Poland, Slovenia, Bulgaria, Latvia, Lithuania, Malta, Romania and Slovakia
• Decreasing: Ireland, Portugal, Spain, Sweden, Cyprus, Estonia
• The per capita consumption in the EU-25 was 23 kg/year in 2005 and has increased to 26.5 kg. The outlook is promising thanks to the booming aquaculture industry and awareness for healthy food among European consumers
Supply for Seafood Consumption in EU*
Total Seafood Supply in EU-28 (e)
Source: FAO , AIPCE
Fish, f illets21%
Fish, fresh/chilled9%
Fish, frozen17%
Molluscs3%
Crus., mol. & other aquatic inv.,
prepared2%
Cephalopods7%
Crustaceans7%
Fish, cured8%
Prepared/ preserved f ish
26%

April 2008 – Glitnir Seafood Research 18
EU SEAFOOD CONSUMPTION 2010-2030
• Consumption 2010–2030
• European consumption will be characterized by three important factors over the next 30 years
• Changing consumption habits (paralleled by the predominance of supermarkets in the retailing sector)
• Ecological concerns
• Quality improvements of the fish processing industry
Seafood consumption by OECD groups of commodities from 2010 to 2030 (estimated)*
0
2,000
4,000
6,000
8,000
10,000
12,000
14,000
2010 2015 2020 2025 2030
'000
MT
live
wei
ght
Prepared/preserved f ish
Molluscs
Fish, frozen
Fish, fresh/chilled
Fish, f illets
Fish, cured
Crustaceans
Crus., mol. & other aquatic inv.,preparedCephalopods
Source: FAO, AIPCE

April 2008 – Glitnir Seafood Research 19
GLITNIR SEAFOOD OVERVIEW
Glitnir has been serving the fishery and fish processing industry for over a century. Today, Glitnir serves the financial needs of leading companies in the fish industry on a global basis, offering industry-specific financial services, from convenient financing and tailor-made advice on financial risk, to finding the right industrial partner in another part of the world.
To ensure a superior service, Glitnir has formed a team of specialist bankers who focus on the Seafood Industry. The team consists of corporate financiers, industry analysts, credit officer and dealers with years of experience within banking and the fish industry, people who are truly at home in both worlds.
LONG TRADITION IN SEAFOOD FINANCING
• Home markets are Iceland and Norway • Economies that have been heavily dependent on the
seafood industry through centuries • Iceland and Norway are one of the leaders in utilization and
technical innovation in the global seafood industry • Glitnir is a “one stop shopping” Seafood Bank offering the
whole range of services: - Credits, bonds, equity - M&A advisory - FX dealings - Risk analysis and hedging - Brokerage and private banking
• Strategic partners with leading positions in the industry. GLITNIR SEAFOOD INDUSTRY BUSINESS ORIGINATION
• Extensive research on the global seafood industry • Industry player mapping & networks • Investment opportunity chasing • Advisory for players in the global seafood industry, across
the whole “value chain” • Glitnir Seafood Team located in:
- Iceland & Norway - Denmark - UK - The US - Canada - China
RATIONALIZING OPPORTUNITIES
• Identifying Opportunities - Access to the Whole Value Chain - Monitoring of shifts within/between parts of the chain - Optimizing value creation - Cross-border rationalization of opportunities
• Initiating Changes for Growth - Up-stream and down-stream steps to growth - Focused on value creation within industry sub-sectors - Aid industry players in strategic positioning - Maximizing value within concentrated focus
SELECTED DEALS OF GLITNIR
Copeinca ASA
USD 100 m Private placement
and listing 2006/2007 2007
Sell-side advisory
Sell-side advisory
2007
sale to
Marine Vest II
NOK 250 m
Private placement 2007
Norway Pelagic
NOK 220 m Private placement
2007
Branco
NOK 44 m Private placement
2007
Advisory Financing
Mgmt. Buy-Out
2006
Advisory Structured Sale
sale to
Villa Salmon
NOK 150 m Private placement
2006
£21,000,000 Acquisition Financing
2005 2005
$65,000,000 Syndicated Loan
Syndicated loan participation,
$3 million
2005
Syndicated loan participation,
$3 million
2005
Bond issuance on the Icelandic Stock
Exchange
2005
Bond issuance on the Icelandic Stock
Exchange
2005
2006

April 2008 – Glitnir Seafood Research 20
DISCLAIMER All opinions and analyses represent the views of Glitnir at the time of writing and are subject to change without notice. Glitnir and its employees cannot be held responsible for any trading conducted on the basis of the information and views presented here. Glitnir may at any time have vested interests in individual companies, for example as an investor, creditor or service provider, but its opinions and analyses are produced independently by Glitnir International Banking, based on publicly available information on the company in question. This Seafood Industry Report was written by
Jing Xu – International Banking, [email protected] Magnús Sigurðsson – International Banking [email protected] Sverrir Ingi Ármannsson – International Banking [email protected]

April 2008 – Glitnir Seafood Research 21
CONTACT INFORMATION GLOBAL SEAFOOD TEAM Kristján Th. Davídsson Managing Director, Global Seafood +354 440 4517 [email protected]
Kjartan Olafsson Managing Director, Global Seafood +47 2287 8613 [email protected]
Örvar Th. Ólafsson Senior Business Manager +354 440 4616 [email protected]
Alexander Richter Director, Research & Communication +354 440 4766 [email protected]
SEAFOOD TEAM – REGIONAL REPRESENTATIVES/ CONTACTS Denmark/ Germany Kristján Hjaltason Director +45 8833 5081 [email protected] Norway Kurt Kvalsvik Director, Glitnir Bank +47 7010 2015 [email protected] UK Vinay Gupta Director, Business Management +44 (0) 20 7710 9188 [email protected] South America Jón Gardar Gudmundsson Managing Director, Int’l. Banking +354 440 4516 [email protected] Canada Joe Fillmore Director, Glitnir Rep. Office +1 (902) 429 3114 [email protected] United States Michael Richard Director, Glitnir Capital Corp. +1 (212) 716 0104 [email protected] China Jiang Zhu Director, Glitnir Rep. Office +86 21 6101 0190 [email protected] Japan & Oceania Eythór Eyjólfsson Director, Int’l Banking +354 440 4738 [email protected] Iceland Hjálmur Nordal Director, Corp. Banking +354 440 4522 [email protected] Other Contacts Timothy H. Spanos Managing Director, Corp. Credit +354 440 4777 [email protected] Ignacio Kleiman Managing Director, Corp. Finance +1 (212) 716 0111 [email protected] Conor J. Byrne Director, Corp. Finance +44 (0) 20 77 10 9134 [email protected] Henning Lund Analyst, Equity Research +47 22 01 63 47 [email protected] Valdimar Halldórsson Equity Analyst, Equity Research +354 440 4638 [email protected]