2007 ANNUAL REPORT - Inspirierende Energie - Alpiq · 2007 ANNUAL REPORT (1 ... (EGW/PSO) project...
56
1 / 56 2007 ANNUAL REPORT (1 ST JANUARY 2007 TO 31 DECEMBER 2007) 1. KEY FIGURES 2. COMPANY STRUCTURE 3. 2007 CONSOLIDATED FINANCIAL STATEMENTS 4. 2007 CORPORATE FINANCIAL STATEMENTS Note : in the following tables and commentary, figures are given in thousands of Swiss francs (kCHF), unless otherwise indicated.
Transcript of 2007 ANNUAL REPORT - Inspirierende Energie - Alpiq · 2007 ANNUAL REPORT (1 ... (EGW/PSO) project...

1 / 56
2007 ANNUAL REPORT
(1ST JANUARY 2007 TO 31 DECEMBER 2007)
1. KEY FIGURES
2. COMPANY STRUCTURE
3. 2007 CONSOLIDATED FINANCIAL STATEMENTS
4. 2007 CORPORATE FINANCIAL STATEMENTS
Note : in the following tables and commentary, figures are given in thousands of Swiss francs (kCHF), unless otherwise indicated.

1. Key figures
2 / 56
Financial data Consolidated figures, m CHF 2007 2006
Total operating income 2,572 1,912 Trading results 31 24 EBIT 436 83 % of total operating revenue (16.9%) (4.3%) Net profit 320 48 % of total operating revenue (12.5%) (2.5%) Cash flow 125 77 Balance sheet assets Tangible assets 519 532 Intangible assets 413 276 Financial assets 813 629 Current assets 456 309 Total assets 2,202 1,747 Balance sheet liabilities Shareholders’ equity 1,097 769 Liabilities 1,105 977 Total liabilities 2,202 1,747 Total indebtedness net of cash and cash equivalents
435 510 Ratios Net debt to equity ratio 28 : 72 40 : 60 Indebtedness as % of total balance sheet value net of cash and cash equivalents 21.1% 30.6% Supply and delivery in 2007 Deliveries and sales – EOS Production and purchases – EOS
Contract deliveries to shareholders 4,277 GWh Total hydropower CH 2,652 GWh
Deliveries to other Swiss clients 710 GWh Total thermal power CH 467 GWh
Pumping energy and restitutions, losses 602 GWh Power purchase agreements 3,325 GWh
Sales and trading 85,782 GWh Purchases and trading 84,927 GWh Total 91,371 GWh Total 91,371 GWh Trading 2007 MIO CHF
Sales 60,971 GWh 4,745
Purchases 60,971 GWh 4,711
Mark to market (open positions) -2 Total volume 121,942 GWh 31 Profit on trading operations

2. Structure
3 / 56
Shareholders EOS Holding owns 100 % of the share capital of EOS. EOS Group
Notes 1 2.4 % of the HYDRO EXPLOITATION SA shares held by EOS HOLDING were sold to ROMANDE ENERGIE on 8
June 2007. 2 As part of the Energy Group West (EGW/PSO) project and the restructuring of the AAR ET TESSIN SA
D’ELECTRICITE (ATEL) Group, MOTOR-COLUMBUS SA became ATEL HOLDING SA on 7 November 2007. 3 Company incorporated on 6 December 2007.

2. Structure
4 / 56
Corporate bodies Board of Directors
TERM OF OFFICE BEGINS
TERM OF OFFICE ENDS AT AGM CALLED TO
RECEIVE THE ACCOUNTS
Dominique Dreyer *
Chairman, lawyer, Fribourg
2002 2008
GUY MUSTAKI *
Vice-Chairman, Chairman of Romande Energie Holding SA, Pully
2006 2007
DANIEL BRÉLAZ
Mayor of the City of Lausanne, Lausanne
2002 2009
JEAN DESCHENAUX */***
Company director, Fribourg
2005 2007
DANIEL MOUCHET *
Chairman of Services Industriels de Genève, Veyrier
2003 2008
HUBERT BARDE ***
Member of the Board of Romande Energie Holding SA, Le Mont-sur-Lausanne
2003 2007
CLAUDE HAEGI ***
Vice-Chairman of Services Industriels de Genève, Rolle
2002 2009
JEAN PRALONG **
Chairman of FMV SA, St-Martin
2002 2008
JEAN-YVES PIDOUX ***
Lausanne City Councillor, Lausanne
2006 2007
DANIEL SCHMUTZ **
Member of the Board of Romande Energie Holding SA, La Tour-de-Peilz
2002 2007
PIERRE STEPHAN **
Vice-Chairman of Groupe E SA, Fribourg
2002 2008
Mr Claude Haegi has replaced Mr Jean-Jacques Monney since the 2007 Annual General Meeting. Company secretary (not a member of the Board) : BENOÎT REVAZ * Member of the Executive Committee ** Member of the Audit Committee *** Member of the Nominations and Compensation Committee Auditors ERNST & YOUNG SA, LAUSANNE

2. Structure
5 / 56
Organisational chart

3. 2007 Consolidated financial statements
6 / 56
Page(s)
Commentary 7-8
Consolidated profit and loss account 9
Consolidated balance sheet 10
Consolidated cash flow statement 11
Changes in shareholders’ equity 12
Group accounting policies 13-21
Scope of consolidation 22
Notes to the consolidated financial statements 23-46
Auditors’ report 47
Note : In the following tables and commentary, figures are given in thousands of Swiss francs (kCHF) unless otherwise indicated.

Commentary
7 / 56
Since 2006, the Group has pursued an ambitious growth strategy focused on developing commercial activities, strengthening its generating fleet, increasing production capacity through significant investment, and the ever more sophisticated optimization of its energy portfolio. As a result of this long-term strategy, the Group recorded good net earnings 2007 of CHF 73m, excluding the impact of the impairment reversal of CHF 247m, thus demonstrating constant earnings growth since 2004. Including the exceptional impact of the balance sheet impairment reversal, published net income for 2007 is CHF 320m.
The increase in turnover, which for the first time exceeded CHF 2 bn (CHF 2.2 bn in 2007 as against CHF 1.9 bn in 2006), also reflects the Group’s growth. The balance sheet total stands at CHF 2.2 bn at the end of 2007, compared with CHF 1.7 bn at the end of 2006.
Balance sheet impairment reversal The Group depreciated the value of its assets to reflect their fair value in the balance sheet when it adopted the IFRS standards in 2003. The rise in electricity prices on the European markets since then has led the Group to reverse these impairments by an amount of CHF 247.2m, after depreciation. This accounting adjustment, which does not affect the cash position, improves the 2007 results correspondingly.
2007 Profit and loss account For a number of years, the Group has concentrated on growing its generation portfolio and its capacities as production managers. The Group’s business activity therefore focuses on the optimized management of its generating fleet, which is highly flexible and diversified. This management involves numerous transactions on the wholesale markets, through various energy trading platforms in Switzerland and Europe, and has translated into an increase in turnover, up 19% to CHF 2.2 bn (CHF 1.9 bn in 2006), and in energy purchases, up 18%.
Trading operations showed a profit of CHF 31.5m (CHF 23.9 m in 2006), corresponding to a strongly increasing transaction volume of CHF 4.7 bn.
When compared with 2006, operating income growth in terms of “share of income from equity accounted investments” and “other operating income” reflects the impact of the fixed asset impairment reversal.
The 12% rise in materials and services results essentially from projects carried out jointly with partners, whose share is charged back by the Group, the related revenues appearing in other operating income. To guarantee maximum availability of the generating fleet and transmission infrastructure, the Group maintained considerable operating and maintenance costs for its installations.
The Group added employees, compared with 31 December 2006, to maintain the growth of the commercial businesses and strengthen back office operations.
Depreciation is stable compared with the previous financial year
There are major efforts to contain other operating expenses, which consist essentially of administrative costs. Because this item also includes other projects, notably the costs of the EGW/PSO project, there are variations between the different financial periods, in particular a reduction of costs in 2007.
Earnings before interest and tax (EBIT) stand at CHF 435.5 m (CHF 83,1 m in 2006). Excluding the impairment reversal impact, EBIT is CHF 116.3 m.
Income from other investments posted a loss because of the impairment recorded in the balance sheet.
Interest costs were unchanged in 2007.
The large increase in the tax charge relates to the deferred tax adjustment in connection with the impairment reversal.
Net profit of CHF 320.4 m is up strongly compared with 2006 (CHF 47.8 m), including the impact of the impairment reversal of CHF 247.2 m.

Commentary
8 / 56
Balance sheet The balance sheet total rose to CHF 2.2 bn, an increase of CHF 0.5 bn. Shareholders’ equity in the balance sheet increased to 49.8% compared to 44% in 2006.
Fixed assets rose by CHF 308 m, of which CHF 319 m relates to the impairment reversal.
Current assets rose by CHF 146.5 m, of which CHF 59.6 m is cash. The number of debtors increased corresponding to the increase in the volume of commercial activity.
Thanks to the double impact of the earnings for the period (CHF 320.4 m) and the change in fair value of financial instruments (CHF 7.0 m), shareholders’ equity rose CHF 327.4 m (+43%).
Long-term liabilities decreased by CHF 47.7 m, reflecting a decrease of CHF 121.4 m in financial liabilities (including the transfer of a loan to the “short-term”) and an increase of CHF 67.8 m in deferred tax liabilities connected to the impairment reversal.
Short-term liabilities rose by CHF 175.0 m, of which CHF 105.7 m concerned financial liabilities (including the transfer of a loan from the “long-term”).
Cash Flow Cash flow before changes in working capital was CHF 124.6 m in 2007, compared with CHF 76.8 m in 2006.

Consolidated profit and loss account
9 / 56
2007 2006 Note kCHF kCHF Net turnover 1 2,237,932 1,892,510Share of profit of joint ventures and associated companies 14,15 162,390 2,398Other operating income 2 172,012 17,382Total operating income 2,572,334 1,912,290 Energy purchases 3 (1,989,913) (1,693,169)Materials and services 4 (23,114) (20,648)Personnel expenses 5 (26,782) (24,275)Depreciation 6 (41,849) (42,611)Other operating expenses 7 (55,124) (48,488)Total operating expenses (2,136,782) (1,829,191) Earnings before interest and tax (EBIT) 435,552 83,099 Income from other available-for-sale financial assets 8 (1,963) 7Interest income 9 5,188 2,464Financial cost 9 (27,291) (26,392) Earnings before tax (EBT) 411,486 59,178Income taxes 10 (91,074) (11,347) Net Group profit 320,412 47,831 - attributable to parent company shareholders 319,971 47,664- attributable to minority shareholders 441 167

Consolidated balance sheet
10 / 56
Note 31.12.2007 31.12.2006 kCHF kCHFASSETS Tangible fixed assets 12 519,447 532,351Intangible fixed assets 13 413,215 276,180Investments (joint ventures) 14 805,872 619,521Investments (associated companies) 15 3,734 3,392Other long-term financial assets 16 3,739 6,325Total fixed assets 1,746,007 1,437,769 Inventory and work in progress 17 3,156 1,748Receivables arising from deliveries and services 18 258,555 175,414Other receivables and accruals 19 55,760 53,428Cash and cash equivalents 138,143 78,556Total current assets 455,614 309,146 Total assets 2,201,621 1,746,915 LIABILITIES Share capital 20 145,000 145,000Additional contributions 20 37,935 37,935Accumulated profits 20 911,980 584,903Equity attributable to Group shareholders 1,094,915 767,838Equity attributable to minority shareholders 1,931 1,593 Total shareholders’ equity 1,096,846 769,431 Long-term financial liabilities 21 450,413 571,737Provisions 22 24,642 23,230Employee benefits 23 10,615 11,719Other long-term liabilities 24 20,270 14,870Deferred tax liabilities 10 211,647 143,764Total long-term liabilities 717,587 765,320 Short-term financial liabilities 21 122,490 16,822Liabilities arising from purchases and services 25 193,937 126,849Current tax payable 20,185 9,630Other short-term liabilities and accruals 26 49,979 58,266Provisions 22 597 597Total short-term liabilities 387,188 212,164 Total liabilities 1,104,775 977,484 Total liabilities and shareholders’ equities 2,201,621 1,746,915

Consolidated Cash Flow Statement
11 / 56
2007 2006 Note kCHF kCHF Earnings before tax (EBT) 411,486 59,178Adjustments for: - Depreciation 6 41,849 42,611- Gains and losses on disposals 2,7 (1,824) 32- Variation in provisions 308 (4,345)- Impairment reversal 11 (148,388) -- Other items (7,421) (6,434)- Net financial income 24,066 23,921- Share of profit of joint ventures and associates 14,15 (162,390) (2,398)Dividends received from joint ventures and associates 14,15 3,796 3,704Variation in working capital (13,117) (61,997)Interest paid (22,180) (24,810)Tax paid (14,708) (14,700)Cash flow from operations 111,477 14,762 Tangible and intangible fixed assets - Investments 12,13 (18,900) (22,945)- Disposals 8,136 6,362Acquisition of minority shareholders’ interests - (1,070)Acquisition of a subsidiary - (20)Associated companies and joint ventures - Investments 14 (298) -- Reimbursements 14 (27,801) (14,703)Other financial assets available for sale - Investments (214) (1,946)- Dividends received 35 7Financial loans granted and repaid 667 (548)Interest received 3,652 1,611Cash flow from investing activities (34,723) (33,252) Other financial liabilities - Loans 8,000 125,000- Reimbursements (24,332) (104,530)Dividends paid - (10,150)Dividends paid to minority shareholders (104) (106)Cash flow from financing activities (16,436) 10,214 Unrealized exchange rate differences (731) 234 Change in cash and cash equivalents 59,587 (8,042) Cash at the beginning of the period 78,556 86,598 Cash and cash equivalents at the end of the period 138,143 78,556

Changes in Shareholders’ Equity
12 / 56
Share capital
Additional contributions
Accumulated
profits
Variation of evaluation of
financial instruments
Total Group
equity
Minority Interests
Total
Shareholders’equity
At 1.01.2006 145,000 37,935 554,181 80 737,196 1,667 738,863Change in fair value of other financial assets available for sale 1) (5) (5) (5)Change in fair value of financial hedging instruments (6,867) (6,867) (6,867)Net profit for the year 47,664 47,664 167 47,831Total income and expenses for the period 47,664 (6,872) 40,792 167 40,959Acquisition of minority shares 2) 0 (135) (135)Dividends paid to minority shareholders 0 (106) (106)Dividends paid (10,150) (10,150) (10,150)At 31.12.2006 145,000 37,935 591,695 (6,792) 767,838 1,593 769,431 At 1.01.2007 145,000 37,935 591,695 (6,792) 767,838 1,593 769,431Change in fair value of other financial assets available for sale 1) 2 2 2Change in fair value of financial hedging instruments 7,105 7,105 7,105Net profit for the year 319,971 319,971 441 320,412Total income and expenses for the period 319,971 7,106 327,077 441 327,518Dividends paid to minority shareholders 0 (104) (104)At 31.12.2007 145,000 37,935 911,666 314 1,094,915 1,931 1,096,846
1) Changes in fair value of investment net of tax.
2) Acquisition of 1.183% EES shares in 2006.

Group accounting policies
13 / 56
GENERAL INFORMATION EOS OUEST SUISSE (EOS) is a public limited company incorporated under Swiss law and domiciled in Lausanne: It is a wholly-owned subsidiary of EOS HOLDING. EOS HOLDING is owned by: • Romande Energie SA (RE), Montreux (part of Groupe Romande Energie Holding SA, Morges) 28.72 % • Services Industriels de Genève (SIG), Geneva 23.02 % • Groupe E SA, Fribourg 22.33 % • Ville de Lausanne (SIL), Lausanne 20.06 % • FMV SA, Sion 5.87 %
In the notes to the consolidated financial statements, transactions with EOS HOLDING and its shareholders are shown under "shareholders".
The main business of EOS and its subsidiaries is the production and transmission of electricity in Switzerland and the marketing of electricity in Switzerland and abroad.
The consolidated accounts for the 2007 accounting period were approved by the Board of Directors of EOS on 27 March 2008.
GROUP ACCOUNTING POLICIES
ACCOUNTING BASIS The consolidated accounts have been prepared in accordance with the international accounting standards published by the International Accounting Standards Board (IASB) and the interpretations of the IFRS standards published by the International Financial Reporting Interpretations Committee (IFRIC) of the IASB The financial statements are presented in thousands of Swiss francs (kCHF) and prepared on the historic cost basis, with the exception of certain financial instruments that are measured at fair value.
Drawing up financial statements in accordance with the IFRS standards implies the use of estimates and assumptions impacting the assets and liabilities disclosed the contingent assets and liabilities on the balance sheet date, as well as the revenues and expenses for the accounting period. Although the estimates are based on the best knowledge available to the Executive Management about the current situation or future operations of the Group, actual results can differ from those predicted when the estimates were done. Aspects involving great judgment and complexity and those where assumptions and estimates significantly impact the preparation of the financial statements are described in Note 30.
CHANGES IN ACCOUNTING METHODS The Group adopted the following new standards, amendments to the standards and interpretations during the year. The adoption of these revised standards and interpretations did not have a significant impact on the financial performance or the financial situation of the Group but produced additional disclosures.
The main effects of these changes are:
IFRS 7 – Financial instruments: Disclosures
This standard requires the disclosure of information to enable users of the financial statements to measure the materiality of the Group’s financial instruments and the nature and scope of the risks arising from these financial instruments. The new disclosures are included in the financial statements. Although there was no impact on the financial situation or on the results, the comparative information has been restated where necessary.
Amendment to IAS 1 – Presentation of Financial Statements
This amendment requires the Group to disclose new information to enable users of the financial statements to evaluate the Group’s objectives, rules and processes for managing its capital. This new information is given in Note 20.

Group accounting policies
14 / 56
IFRIC 7–On applying the restatement approach under IAS 29
This interpretation does not apply to the Group.
IFRIC 8 – Scope of IFRS 2
This interpretation does not apply to the Group.
IFRIC 9 – Reassessment of embedded derivatives
This interpretation stipulates that the date for assessing the existence of an embedded derivative is the date on which an entity first becomes a party to the contract and that a reassessment is done solely in the case of a change to the contract that significantly modifies the cash flows. Given that the Group has no embedded derivative requiring separation from the host contract, this interpretation has had no impact on the Group’s financial situation or performance.
IFRIC 10 – Interim Financial Reporting and Impairment
This interpretation prohibits the reversal of an impairment accounted for during a previous interim period in respect of goodwill, an equity instrument or a financial asset carried at acquisition cost. Given that the Group did not reverse any impairment accounted for during a prior period, this interpretation has had no impact on the Group’s financial situation or performance.
FUTURE CHANGES IN ACCOUNTING METHODS On the date the financial statements were approved for publication, the following standards, amendments and interpretations had been published but were not applicable to 2007 and were not adopted ahead of time:
IFRS 8 – Operating segments replacing IAS 14 – Segment reporting
IFRS 8 applies to annual periods beginning on or after 1 January 2009. This new standard imposes a managerial approach under which segment reporting must be disclosed on the same basis as that used for internal reporting requirements. The Group will adopt IFRS 8 from1 January 2009.
The Executive Management is still assessing the expected impact. It is likely that segment reporting will be implemented consistently with the information produced internally for the management bodies. The Group does not anticipate any consequences in terms of its results or financial situation.
IAS 1 – Revised Presentation of Financial Statements
Revised IAS 1 applies to annual periods beginning on or after 1 January 2009. The revision facilitates analysis and comparison of information in the financial statements. The changes require new titles to items in the financial statements, presentation of a financial position statement at the beginning of the earliest comparative period in a retrospective accounting policy application or restatement, introduction of a general income statement and giving of separate information about tax and dividends. The Group will adopt this revised standard as of 1 January 2009. It anticipates no impact on results or financial situation.
IAS 23 – Revised Borrowing Costs
Revised IAS 23 applies to annual periods beginning on or after 23 January 2009. The revision requires capitalization of borrowing costs as soon as they relate to a qualified asset, i.e., an asset requiring a long time to get ready for use or sale. The Group will adopt this amendment as of 1 January 2009. As the Group already capitalizes the borrowing costs of qualified assets, this revision will have no impact on accounting policies.
IFRS 2 – Share-based Payments – Vesting Conditions and Cancellations
This amendment to IFRS 2 applies to annual periods beginning on or after 1 January 2009. The amendment specifies that the terms of acquisition are either service conditions or performance conditions. In addition, according to this amendment, when a non-vesting condition under the control of the entity or the counterparty is not met, it must be accounted for as a cancellation. This amendment does not apply to the Group.

Group accounting policies
15 / 56
IFRS 3 – Revised Business Combinations and IAS 27 – Revised Consolidated and Separate Financial Statements
Revised IFRS 3 and IAS 27 apply to annual periods beginning on or after 1 July 2009. Revised IFRS 3 introduces several changes to the treatment of business combinations that will have an impact on the goodwill accounted for, the results published during the period when the acquisition is made and on future results. Revised IAS 27 requires changes in the shareholding of a parent company in a subsidiary that do not constitute a loss of control to be recognized as equity transactions That being so, such changes will have no impact on goodwill and profit or loss currently. The changes introduced by these two revised standards will have an impact on future acquisitions and on future transactions with minorities.
IAS 32 – Financial Instruments and IAS 1 – Presentation of Financial Statements, amendment of Financial Instruments Puttable at Fair Value and Obligations Arising on Liquidation
The amendments to IAS 32 and IAS 1 apply to annual periods beginning on or after 1 January 2009. The amendment to IAS 32 requires the classification of certain financial instruments redeemable at fair value and obligations arising on liquidation as equity under certain criteria. The amendment to IAS 1 requires certain information about financial instruments redeemable at fair value to be classified under equity. This interpretation does not apply to the Group.
IFRIC 11 – Interpretation of IFRS 2 : Treasury Share Transactions and Group Transactions
This interpretation applies to annual periods beginning on or after 1 March 2008. It concerns the treatment of share-based payments when they involve treasury share and group transactions. This interpretation does not apply to the Group.
IFRIC 12 – Interpretation of Service Concession Agreements
This interpretation applies to annual periods beginning on or after 1 January 2008. It concerns the accounting treatment of contractual arrangements in which a private sector operator is involved in the preparation, financing, operation and maintenance of infrastructures for public sector services. This interpretation does not apply to the Group.
IFRIC 13 – Interpretation concerning Customer Loyalty Programmes
This interpretation applies to annual periods beginning on or after 1 July 2008. It concerns customer loyalty programmes. It specifies that when products or services are sold with a customer loyalty incentive, the contract is a multiple-part contract and what is to be received from the customer is split between the components of the contract on the basis of their fair value. This interpretation does not apply to the Group.
IFRIC 14 – Interpretation of IAS 19 – The Limit on a Defined Benefit Asset, Minimum Funding Requirements and their Interaction
This interpretation applies to annual periods beginning on or after 1 January 2008. It gives instructions about assessing the limit according to IAS 19 of the amount of the surplus that can be recognized on the asset. It also explains how a pension asset or liability can be affected by a statutory or contractual minimum funding requirement. The Group will adopt this amendment as of 1 January 2008, but no impact on the Group’s accounts is anticipated.
SCOPE OF CONSOLIDATION The consolidated accounts include figures for EOS, its subsidiaries, its joint ventures and associated companies.
Subsidiaries are companies under Group control. EOS has control when it has the power to govern, directly or indirectly, the financial and operating policies of an enterprise so as to benefit from its operations (usually more than 50 % of the voting rights). The financial statements of subsidiaries are fully integrated into the consolidated accounts as of the date on which the Group begins to exercise control and until the date on which the Group ceases to do so.
Joint ventures and associated companies are companies in which the Group exercises a significant influence over the financial and operating policies, without however having control (usually between 20 % and 50 % of voting rights). The financial statements of these enterprises are subject to equity accounting from the date on which the Group begins to exercise a significant influence and until the date when the Group ceases to do so.

Group accounting policies
16 / 56
Joint ventures in which the Group holds more than 50 % of voting rights, but has limited control because of contractual rights, or holds less than 20 % of voting rights but has a significant influence, are also accounted for by the equity method.
METHOD OF CONSOLIDATION The Group consolidates newly acquired shareholdings using the purchase method. The difference between the cost and the fair value of the net assets of the company acquired appears in the balance sheet under goodwill. If goodwill is negative, it is recorded directly in the profit and loss account. The goodwill of joint venture partners and associates is included in the carrying amount of equity-accounted shareholdings. When a Group company is disposed of, it is eliminated from the scope of consolidation on the date on which control is lost. The Group records the difference between the selling price and the value of the net assets disposed of in the profit and loss account on the same date.
INTRA-GROUP TRANSACTIONS Transactions and unrealized gains and losses between Group companies are eliminated on consolidation. Unrealized gains with joint venture partners and associates proportionate to the Group’s share of the company are eliminated and deducted from the equity-accounted shareholding in the accounts.
FOREIGN CURRENCY TRANSACTIONS For Group companies, transactions denominated in foreign currencies are translated at the exchange rate applicable when the transaction occurred. Monetary assets and liabilities denominated in foreign currencies are translated at the exchange rates applicable on the balance sheet date. Differences arising on the translation of these operations are stated in the profit and loss account.
All the Group's subsidiaries present their accounts in CHF. The Group's share of the subsidiaries’ net assets is translated at the exchange rate applicable on the balance sheet date and the Group's share of the profits is expressed at the average exchange rate for the year. Exchange differences arising on the translation of these items are stated in shareholders' equity.
NET TURNOVER Turnover represents all revenues from the transmission and commercialization of electricity, net of discounts and reductions. Amounts received are recorded when the electricity has been delivered.
As part of its trading activity, the Group sells large quantities of electricity, which considerably increases the volumes processed during the year. In order to improve the relevance and comparability over time of its turnover, the Group accounts only for the net income from these operations.
INCOME TAXES Taxes on the income of the period include current and deferred taxes. The tax impact on the items recognized under shareholders’ equity is also recorded under equity.
Current tax is the tax payable on the taxable profit for the year, and any adjustments to the tax payable and recoverable in respect of the taxable profit from prior periods.
Deferred tax is recorded to take account of temporary differences that occur when the tax authorities record and assess assets and liabilities using rules that are different from those used to prepare the consolidated accounts. This tax is calculated using the liability method based on the tax rates expected to apply when the assets or liabilities are realized. Any change in the tax rate is recorded in the profit and loss account unless it is directly linked to the items recorded under shareholders' equity.
Deferred tax liabilities are recorded for all taxable timing differences except non-deductible goodwill. Deferred tax assets are recorded for all timing differences and for all deductible losses carried forward to the extent that it is likely that taxable income will be available for offsetting in the future.

Group accounting policies
17 / 56
IMPAIRMENT At each balance sheet date, the Group tests its assets for evidence of impairment. If evidence of impairment is found, the recoverable amount of the asset is estimated, and an impairment charge is recorded in the profit and loss account if the carrying amount is greater than the recoverable amount. The recoverable amount of goodwill and of intangible assets with an indefinite useful life is estimated each year.
The recoverable amount is the higher of the fair value of the asset less costs to sell, and its value in use. The value in use is the discounted value of the estimated future cash flows expected from the asset. If an asset does not generate cash inflows that are largely independent of other assets, the value in use is determined for the cash generating unit to which the asset belongs. The recoverable amount is discounted at the Group's average borrowing rate plus a rate corresponding to the inherent risks of the asset. In the case of the financial assets issued by the Group, the level of discounting is determined by the asset's effective rate of interest. Short-term receivables are not discounted.
An impairment charge entered during prior periods is adjusted when there is a change in the estimated recoverable amount. The adjustment is recorded in the profit and loss account up to an amount corresponding to the carrying amount that would have been determined, net of depreciation, if no impairment had been entered. An impairment of goodwill is not reversed during a subsequent financial year.
TANGIBLE FIXED ASSETS Tangible fixed assets are stated at acquisition or construction cost, net of accumulated depreciation and impairment. The cost includes the costs of replacing part of the assets when they are incurred and if the criteria for recognition are met. The costs of acquiring concessions to use the hydraulic power are included under this heading. All other repair and maintenance costs are recognized under income as they occur.
Interest on the financing of fixed assets under construction is capitalized.
Where a fixed asset is made up of a number of elements with varying estimated useful lives, each element is accounted for separately and depreciated over its useful life.
Depreciation is calculated using the straight-line method over the useful life of each asset. Generating assets subject to a free right of return are maximum depreciated over the life of the concessions. Fixed assets under construction and land are not depreciated. The useful life of the main tangible fixed assets is:
• Hydropower plant , civil engineering works 80 years
• Hydropower plant, equipment and machinery 20 to 40 years
• Nuclear power plant buildings, equipment and machinery 20 to 40 years
• Transmission and distribution network lines (VHV and HV) 40 to 60 years
• Transmission and distribution network substations 25 to 40 years
• Administrative buildings 60 to 80 years
• Other buildings 10 to 25 years
• IT components 1 to 5 years
INTANGIBLE FIXED ASSETS Intangible fixed assets are valued at acquisition cost, net of accumulated depreciation and impairment.
Depreciation is calculated using the straight-line method over the useful life of each asset. Energy drawing rights and rights of use are depreciated over a period equal to the duration of the right, which is generally more than 20 years. IT software, purchased or developed in-house, is depreciated over a period of one to five years, starting from the time when it was brought into service. Goodwill and intangible assets with an indefinite useful life are no longer amortized but are tested annually for impairment. Interest on the financing of energy drawing rights and on current projects is capitalized.

Group accounting policies
18 / 56
HOLDINGS IN JOINT VENTURES AND ASSOCIATED COMPANIES Holdings in joint ventures and associated companies are stated in the consolidated balance sheet using the equity method. Consequently, these equity holdings are entered for an amount corresponding to the Group's share in the net assets of the companies and the goodwill arising on acquisition. The companies' net assets, goodwill and profits are valued on the same accounting basis as the Group. If the restated net assets of joint ventures are negative, the Group's share is treated as a liability and stated under liabilities due to joint ventures.
OTHER FINANCIAL ASSETS Shareholdings in which the Group holds less than 20 % of the voting rights and which are not equity-accounted are considered financial assets available-for-sale and are measured at fair value. All unrealized gains and losses are recorded in shareholders' equity. When an asset is sold, the realized gains and losses are recorded in the profit and loss account. Impairment is recorded in the profit and loss account where there is a sustained loss. Fair value is determined using the market price or estimated future cash flow discounting techniques. When the fair value cannot be reliably estimated, financial assets are stated in the balance sheet at amortized cost.
Long-term loans granted to joint ventures are measured at amortized cost.
INVENTORY AND WORK IN PROGRESS Inventory is valued at the lower of acquisition cost or net realizable value.
Work in progress is stated using the percentage of completion method. When the estimated profit is uncertain or when a loss is expected, the value is adjusted immediately.
RECEIVABLES Receivables are valued at amortized cost. A loss on a receivable is recognized where there is objective evidence (such as likelihood of bankruptcy or significant financial difficulties on the part of the debtor) that the Group will not be able to recover the amounts due under the contractual terms of the invoice. The carrying amount of the customer receivable is reduced by recourse to the "Bad debt provision" account in the balance sheet.
CASH AND CASH EQUIVALENTS Cash comprises cash in hand and at bank and post office and financial institution deposits with a maturity date no greater than 90 days.
DEBT Debt includes bonds, bank financing and other borrowings.
Bonds are stated at depreciated cost. The difference between the issue value and the redemption value is depreciated using the effective interest rate method. Transaction costs are included in the issue value.

Group accounting policies
19 / 56
PROVISIONS Provisions include commitments for which the outcome, due date or amount is uncertain. They are stated in the balance sheet when the Group has a legal or implicit obligation resulting from a past event, when it is probable that an outflow of funds will be necessary in order to settle the obligation and when the amount of the commitment can be reliably estimated. When an outflow of funds is not probable or cannot be reliably estimated, the obligation is not recorded in the balance sheet but disclosed under contingent liabilities.
When the time effect is significant, the expected cash flows to settle the obligation are discounted. The provision is discounted at the market rate plus, if necessary, a rate reflecting the specific risks of the liability. The increase in the provision associated with the passage of time is recognized as a financial cost.
OTHER LIABILITIES Other liabilities mainly comprise commitments to joint ventures and correspond to the share of negative net assets of the consolidated equity-accounted companies.
Other liabilities are valued at amortized cost.
The financial option is measured at fair value. All unrealized gains and losses are recorded in the profit and loss accounts under energy purchases and under financial costs for the discounting effect.
EMPLOYEE BENEFITS Pension liability
EOS HOLDING and the Group's companies are affiliated to the CAISSE PENSION ENERGIE (CPE), a legally independent, collective pension fund, based on the Swiss defined benefits scheme, for the sector.
The liabilities and the fair value of the assets used to fund pension commitments are valued each year by an independent expert. The liability is determined by the projected unit method of funding. This method takes account of pensions currently being paid, future pension costs and estimated future increases in salaries and pensions.
The surpluses and shortfalls in the fair value of the assets compared with the current value of the commitments are treated in different ways.
The sum recognized as a liability or an asset under a defined benefit scheme includes the discounted value of the defined benefits obligation, less the cost of past services not yet recognized and less the fair value of the scheme assets directly used to meet the obligations. The value of an asset is limited to the sum represented by any cost of past services not yet recognized and the discounted value of any economic benefit available in the form of repayment by the scheme or decrease in future contributions to the scheme.
The CPE's articles of association stipulate that if the technical balance sheet has a shortfall of more than one tenth of the liabilities and no improvement is foreseeable, the contributions must be increased and/or anticipated future benefits reduced by an amendment to the articles of association in order to rebalance the CPE's accounts. Thus, shortfalls are stated in the balance sheet for the portion that exceeds 10 % of the discounted value of the commitment (“corridor”). This excess is reflected in the profit and loss account based on the length of the expected average residual working life of the employees.
From 1 January 2007, a cash balance pension plan was taken out for those receiving variable salaries, the contributions paid being recognized in the profit and loss account under "Pension costs"

Group accounting policies
20 / 56
Voluntary pensions
Some companies in the Group have granted all retired employees indexation of pensions not covered by the CPE together with membership of the health insurance scheme.
Voluntary pensions are a liability in respect of all retired employees and are immediately recognized in the profit and loss account.
Early retirement
Some companies in the Group have given all their employees the possibility of taking early retirement at 60 years of age.
Post-employment contract benefits ("Pont AVS") are a liability in respect of all serving members of staff and are recognized immediately in the profit and loss account. Given that these liabilities are on average payable at more than twelve months, the contingency reserve to cover them is discounted.
SEGMENT REPORTING Segment reporting presents the various levels of corporate risk and profitability in terms of business operations and geographical location. The Group operates mainly in the energy sector, which covers electricity generation, transmission and marketing. Activities outside the energy business represent less than 10 % of turnover, earnings and consolidated net assets. No segment information is therefore required concerning these operations.
As for geographical location, the Group’s operations are managed from its head office in Switzerland and include essentially the optimization of its assets, which are mainly located in Switzerland. Moreover, the Group’s interventions on the wholesale markets in Europe are by way of hedging (optimizing) the generating assets. Turnover from end-user deliveries in foreign locations accounts for less than 10 % of the total. Risks and gains are therefore generated essentially in Switzerland.
DERIVATIVE FINANCIAL INSTRUMENTS The Group defines the scope of application of derivative financial instruments according to the provisions and principles of IAS 39. In particular, forward purchase and sale contracts with physical delivery of energy or commodities are excluded from the scope of application of lAS 39, if these contracts have been concluded as part of the "normal" business of the Group. This qualification is respected if the following conditions are met: systematic physical delivery ; the contracts cannot be assimilated to option sales within the meaning of the Standard. In the particular case of
electricity sales contracts, the contract can be substantially assimilated to a fixed term sale or is likened to a capacity sale.
Consistent with IAS 39, the Group analyses all its contracts – whether financial or non-financial - to identify whether any derivative instruments are embedded. Any contract component that affects the flows of the contract like an autonomous financial derivative meets the definition of an embedded derivative.
If the conditions in the Standard are met, an embedded derivative is recognized separately in the accounts, on the date on which the contract is established.
Derivative financial instruments are fair valued. Changes in the fair value of these derivatives are recorded in the profit and loss account unless designated as hedging instruments in a cash flow hedge. In the latter case, changes in the value of the hedging instruments are recognized under shareholders’ equity, with the exception of the ineffective part of the hedges.

Group accounting policies
21 / 56
The Group uses derivative instruments to hedge its foreign exchange and interest rate risks as well as those connected with certain commodities contracts. The criteria adopted by the Group to define a derivative instrument as a hedging operation are those provided in lAS 39: The hedging operation must hedge the changes in the fair value or cash flows of the hedged item attributable to the
hedged risk and the effectiveness of the hedge (degree of offsetting the changes in value of the hedging instrument with those of the item hedged or the future transaction) is within a range of 80 % to 125 % ;
for cash flow hedging operations, the future transaction, the item hedged, must be highly probable ; the effectiveness of the hedge is measured reliably ; the hedging operation is supported by adequate documentation from its inception.
The Group uses the following types of hedge:
(a) Fair value hedge
This is a hedge of the exposure to changes in fair value of an asset or liability recognized in the balance sheet or a firm commitment to buy or sell an asset. The change in fair value of the hedged item attributable to the hedged component is recognized in profit or loss and offset by mirror changes in fair value of the hedging instrument, with only the ineffective part of the hedge impacting earnings.
(b) Cash flow hedge
This is the hedging of future transactions that are highly probable where changes in the cash flow generated by the hedged item are offset by changes in the value of the hedging instrument. Cumulative changes in fair value are recorded under shareholders’ equity for the effective part and under profit or loss for the ineffective part (corresponding to the surplus from variability in the value of the hedging instrument compared with the change in fair value of the hedged item). When the cash flow hedged materializes, the amounts recorded up to that point under shareholders’ equity are placed in the profit and loss account, mirroring the hedged item flows.
The hedging relationship comes to an end when: a derivative instrument ceases to be an effective hedging instrument ; a derivative instrument reaches maturity, is sold, cancelled or exercised ; the hedged item has reached maturity, has been sold or repaid ; a future transaction is no longer considered to be highly probable.
Scope of consolidation
22 / 56
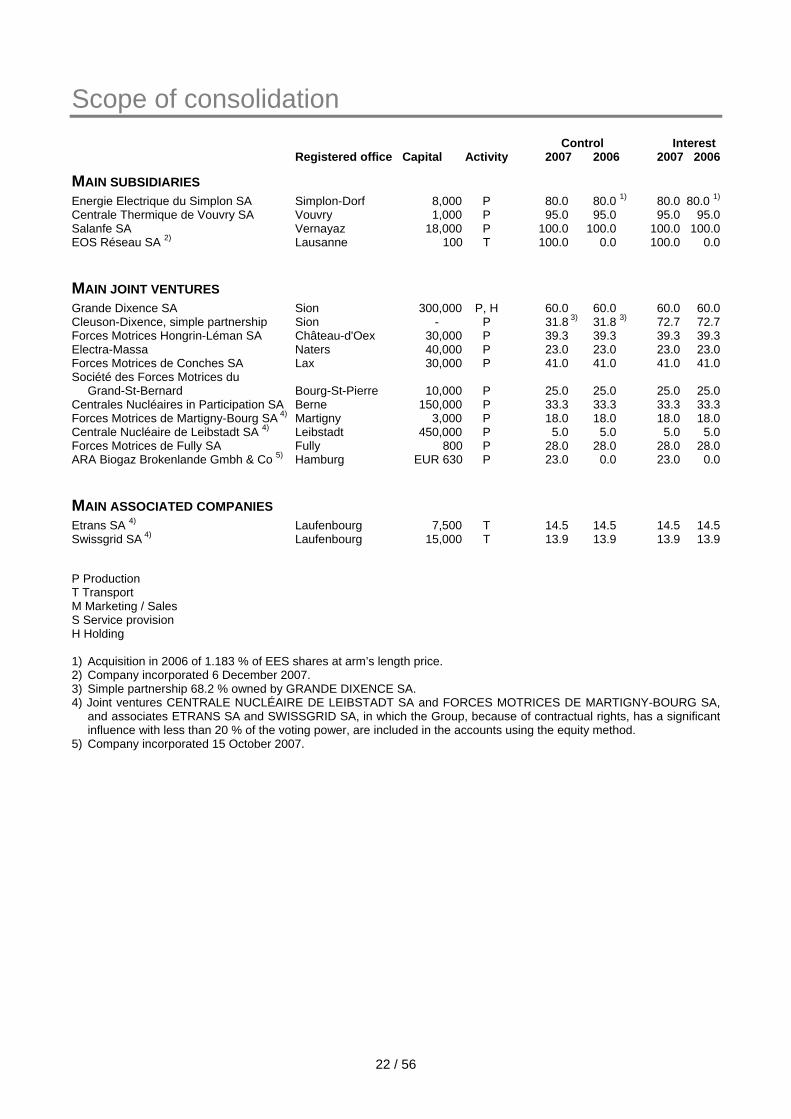
Control Interest Registered office Capital Activity 2007 2006 2007 2006
MAIN SUBSIDIARIES Energie Electrique du Simplon SA Simplon-Dorf 8,000 P 80.0 80.0 1) 80.0 80.0 1) Centrale Thermique de Vouvry SA Vouvry 1,000 P 95.0 95.0 95.0 95.0 Salanfe SA Vernayaz 18,000 P 100.0 100.0 100.0 100.0 EOS Réseau SA 2) Lausanne 100 T 100.0 0.0 100.0 0.0
MAIN JOINT VENTURES Grande Dixence SA Sion 300,000 P, H 60.0 60.0 60.0 60.0 Cleuson-Dixence, simple partnership Sion - P 31.8 3) 31.8 3) 72.7 72.7 Forces Motrices Hongrin-Léman SA Château-d'Oex 30,000 P 39.3 39.3 39.3 39.3 Electra-Massa Naters 40,000 P 23.0 23.0 23.0 23.0 Forces Motrices de Conches SA Lax 30,000 P 41.0 41.0 41.0 41.0 Société des Forces Motrices du Grand-St-Bernard Bourg-St-Pierre 10,000 P 25.0 25.0 25.0 25.0 Centrales Nucléaires in Participation SA Berne 150,000 P 33.3 33.3 33.3 33.3 Forces Motrices de Martigny-Bourg SA 4) Martigny 3,000 P 18.0 18.0 18.0 18.0 Centrale Nucléaire de Leibstadt SA 4) Leibstadt 450,000 P 5.0 5.0 5.0 5.0 Forces Motrices de Fully SA Fully 800 P 28.0 28.0 28.0 28.0 ARA Biogaz Brokenlande Gmbh & Co 5) Hamburg EUR 630 P 23.0 0.0 23.0 0.0
MAIN ASSOCIATED COMPANIES Etrans SA 4) Laufenbourg 7,500 T 14.5 14.5 14.5 14.5 Swissgrid SA 4) Laufenbourg 15,000 T 13.9 13.9 13.9 13.9
P Production T Transport M Marketing / Sales S Service provision H Holding 1) Acquisition in 2006 of 1.183 % of EES shares at arm’s length price. 2) Company incorporated 6 December 2007. 3) Simple partnership 68.2 % owned by GRANDE DIXENCE SA. 4) Joint ventures CENTRALE NUCLÉAIRE DE LEIBSTADT SA and FORCES MOTRICES DE MARTIGNY-BOURG SA,
and associates ETRANS SA and SWISSGRID SA, in which the Group, because of contractual rights, has a significant influence with less than 20 % of the voting power, are included in the accounts using the equity method.
5) Company incorporated 15 October 2007.

Notes to the consolidated financial statements
23 / 56
1. NET TURNOVER Note 2007 2006Energy sales and transmission to - third parties 1,341,072 1,254,305- shareholders 820,648 582,893- joint ventures and associated companies 44,671 31,428- other related parties - 20Profit on trading operations 31,541 23,864 2,237,932 1,892,510Electricity trading activity Sales 4,728,173 2,451,252Purchases (4,694,461) (2,418,125)Adjustments for contracts open at the end of the period 27 (2,171) (9,263)Profit on trading operations 31,541 23,864
2. OTHER OPERATING INCOME Note 2007 2006Capitalized costs 12,13 4,433 4,902Changes in work in progress 1,526 (665)Gains on sales of assets 1,824 278Reversal of impairment 11 148,388 -Release of provisions 23 16 239Other operating income from - third parties 6,353 5,785- shareholders 5,941 3,393- joint ventures and associated companies 1,528 1,689- other related parties 2,003 1,761 172,012 17,382
3. ENERGY PURCHASES 2007 2006Energy purchases from - third parties (1,373,426) (1,280,787)- shareholders (418,133) (185,645)- joint ventures (198,354) (226,737) (1,989,913) (1,693,169)
4. MATERIALS AND SERVICES 2007 2006Materials and services obtained from - third parties (7,925) (8,711)- shareholders (1,874) (1,886)- other related parties (13,315) (10,051) (23,114) (20,648)

Notes to the consolidated financial statements
24 / 56
5. PERSONNEL EXPENSES Note 2007 2006Wages, salaries, other (20,732) (18,562)Pension costs 23 (1,675) (759)Voluntary pension payments 23 (182) (49)Other social security costs (2,458) (2,970)Other staff costs (1,735) (1,935) (26,782) (24,275)
On the balance sheet date, the Group had 172.3 full time equivalent employees (160 the previous year).
6. DEPRECIATION Note 2007 2006Ordinary depreciation of - tangible fixed assets 12 (20,585) (22,001)- intangible fixed assets 13 (21,264) (20,610) (41,849) (42,611)
7. OTHER OPERATING EXPENSES 2007 2006Royalties and special tax on hydropower (10,223) (9,969)Pumping and restoration power (431) (645)Disbursements, travel and entertainment expenses (1,287) (1,311)Insurance (1,062) (1,055)Capital tax, and other taxes (4,992) (4,157)Administrative expenses paid to - third parties (11,756) (13,051)- shareholders (1,614) (1,501)- joint ventures and associated companies (965) (1,398)- other related parties (20,840) (12,017)Other operating expenses paid to - third parties (1,500) (2,625)- shareholders (454) (449)Losses on sales of assets - (310) (55,124) (48,488)

Notes to the consolidated financial statements
25 / 56
8. INCOME FROM OTHER FINANCIAL ASSETS AVAILABLE FOR SALE 2007 2006Other dividends 35 7Impairment of other financial assets (1,998) - (1,963) 7
9. NET FINANCIAL COSTS Note 2007 2006Interest income 5,188 2,464Interest income 5,188 2,464Interest costs (25,369) (25,080)Exchange rate differences, net (966) (566)Bank charges, commissions, other (956) (746)Financial cost (27,291) (26,392) Components of interest income Interest from loans to - third parties 871 502- shareholders 1,299 88- non-consolidated companies - 426- joint ventures and associated companies 517 6- other related parties 11 -Interest income from cash and cash equivalents 783 692Capitalized interest 12,13 569 732Variation of fair value of other derivative financial instruments 1,138 18 5,188 2,464Components of interest cost Interest on bonds (16,269) (13,464)Interest on bank financing and mortgages (621) (769)Interest on other borrowings from - third parties (5,590) (4,967)- shareholders (2) (4,849)- joint ventures and associated companies (7) (12)- other related parties (82) (86)Impact of discounting of provisions and other long-term liabilities 22,24 (1,799) (923)Variation of fair value of other derivative financial instruments (999) (10) (25,369) (25,080)

Notes to the consolidated financial statements
26 / 56
10. TAXES 2007 2006 Income tax Current tax (25,263) (11,571)Deferred tax (65,811) 224 (91,074) (11,347)Components of current tax Tax on profit for the period (25,263) (11,571) (25,263) (11,571)Components of deferred tax Equity-accounted holdings (35,420) 352Tangible fixed assets 161 161Intangible fixed assets (33,723) (232)Other assets 469 11Provisions 42 (74)Other liabilities 192 6Special contributions 2,468 - (65,811) 224 Breakdown of tax charge Group average tax rate 1) 22.56% 22.52% Group earnings before tax (EBT) 411,486 59,178 Income tax at the Group’s average rate (92,826) (13,539)Income and expenses with no tax impact 1,424 2,080Other 328 112 (91,074) (11,347) 31.12.2007 31.12.2006Deferred tax recorded in the balance sheet Deferred tax assets - -Deferred tax liabilities (211,647) (143,764) (211,647) (143,764)Components of deferred tax recorded in the balance sheet Equity-accounted investments (86,182) (50,762)Tangible fixed assets (5,685) (5,846)Intangible fixed assets (33,175) 548Other assets (3,396) (3,865)Provisions 377 335Other liabilities (194) (386)Shareholders’ equity (93) 1,979Special contributions (83,299) (85,767) (211,647) (143,764)Deferred tax on expenses and income recorded in shareholders’ equity Fair value of financial assets available for sale (24) (22)Fair value of financial hedging instruments (69) 2,001 (93) 1,9791) The Group’s average rate of tax depends on the size of the income from each company.

Notes to the consolidated financial statements
27 / 56
11. REVERSAL OF IMPAIRMENT The recoverable amount of Group assets is estimated from the value in use (discount rate 6.75 %). This is based on an average selling price curve with a ‘long-term’ view. The curve takes into account both the wholesale market prices in Europe and the conditions of sale to customers for the long term.
However, the dual effect of the market price rise in the last few years, and the end of the delivery of defined quantities of energy, based on predefined conditions to the "shareholder-clients" on 30 September 2007, led the Group to review the recoverable amount of its assets and reverse some previously recognized impairment, benefiting the 2007 results.
At 31 December 2007, the impairment reversal was as follows:
Investments in joint ventures CHF 170.8 m
Intangible fixed assets CHF 148.4 m
The profit and loss account is impacted under items "Share of profit of joint ventures" for the impairment reversal relating to investments in joint ventures and "Other operating income" for the impairment reversal relating to intangible fixed assets.
12. TANGIBLE FIXED ASSETS
Buildingsand land
Productionfacilities
Transmissionfacilities
Other
Currentprojects
Total
Gross amounts at 01.01.2006 104,884 415,531 568,831 58,718 11,099 1,159,063Investments - - 123 277 17,095 17,495Capitalized costs - - - - 2,781 2,781Capitalized interest - - - - 600 600Disposals - (1,024) (1,183) (76) (4,981) (7,264)Transfers 250 2,208 8,979 1,539 (13,130) (154)Depreciation - - - - (7) (7)Gross amounts at 31.12.2006 105,134 416,715 576,750 60,458 13,457 1,172,514Accumulated depreciation at 01.01.2006 (30,595) (322,705) (218,106) (47,929) - (619,335)Ordinary depreciation (723) (3,778) (15,157) (2,336) - (21,994)Disposals - 714 376 76 - 1,166Accumulated depreciation at 31.12.2006 (31,318) (325,769) (232,887) (50,189) 0 (640,163)Net amounts at 31.12.2006 73,816 90,946 343,863 10,269 13,457 532,351 Gross amounts at 01.01.2007 105,134 416,715 576,750 60,458 13,457 1,172,514Investments - - 40 263 11,026 11,329Capitalized costs - - - - 2,548 2,548Capitalized interest - - - - 114 114Disposals (2) (2,233) (9,909) 0 (1,945) (14,089)Transfers 190 3,024 1,943 361 (5,517) 0Gross amounts at 31.12.2007 105,322 417,506 568,824 61,082 19,683 1,172,416Accumulated depreciation at 01.01.2007 (31,318) (325,769) (232,887) (50,189) 0 (640,163)Ordinary depreciation (617) (4,355) (13,214) (2,399) - (20,585)Disposals - 2,233 5,546 - - 7,779Accumulated depreciation at 31.12.2007 (31,935) (327,891) (240,555) (52,588) 0 (652,969)Net amounts at 31.12.2007 73,387 89,615 328,269 8,494 19,683 519,447
As at every financial year end, the recoverable amount of the production facilities has been estimated. On the balance sheet date, the fire insurance value of buildings, machinery and equipment was CHF 686 m (CHF 686 m the previous year).
Capitalized interest is computed at an interest rate of 3.5 % (4 % in 2006).

Notes to the consolidated financial statements
28 / 56
13. INTANGIBLE FIXED ASSETS
Acquired
rights of useEnergy
drawing Current rights Other projects TotalGross amounts at 01.01.2006 61,407 835,096 9,453 3,838 909,794Change in scope of consolidation - - 3 - 3Investments - - - 5,450 5,450Capitalized costs - - - 2,121 2,121Capitalized interest - - - 132 132Disposals (898) - - (35) (933)Transfers 667 - 5,307 (5,820) 154Depreciation - - - (420) (420)Gross amounts at 31.12.2006 61,176 835,096 14,763 5,266 916,301Accumulated depreciation at 01.01.2006 (24,386) (591,531) (4,648) 0 (620,565)Change in scope of consolidation - - (2) - (2)Ordinary depreciation (786) (18,249) (1,155) - (20,190)Disposals 636 - - - 636Accumulated depreciation at 31.12.2006 (24,536) (609,780) (5,805) 0 (640,121)Net amounts at 31.12.2006 36,640 225,316 8,958 5,266 276,180 Gross amounts at 01.01.2007 61,176 835,096 14,763 5,266 916,301Investments - - - 7,571 7,571Capitalized costs - - - 1,885 1,885Capitalized interest - - - 455 455Transfers - 1,649 5,755 (7,404) 0Gross amounts at 31.12.2007 61,176 836,745 20,518 7,773 926,212Accumulated depreciation at 01.01.2007 (24,536) (609,780) (5,805) 0 (640,121)Ordinary depreciation (774) (18,270) (2,220) - (21,264)Impairment reversal - 148,388 - - 148,388Accumulated depreciation at 31.12.2007 (25,310) (479,662) (8,025) 0 (512,997)Net amounts at 31.12.2007 35,866 357,083 12,493 7,773 413,215
As at every financial year end, the recoverable amount of the energy drawing rights has been estimated. Capitalized interest is computed at an interest rate of 3.5 % (4 % in 2006).

Notes to the consolidated financial statements
29 / 56
14. JOINT VENTURES Note 31.12.2007 31.12.2006 Investments in joint ventures 805,872 619,521Liabilities towards ventures 24 (270) (270) 805,602 619,251
GrandeDixence SA
and Cleuson-
Dixence 1)
Otherjoint
ventures assets 2)
Other joint
ventures liabilities 2)
Total Net amounts at 01.01.2006 443,211 165,190 (2,589) 605,812Investment 14,703 - 14,703Group share of profit (2,316) 4,572 - 2,256Dividends - (3,520) - (3,520)Transfer 3) - (2,319) 2,319 0Net amounts at 31.12.2006 455,598 163,923 (270) 619,251 Net amounts at 01.01.2007 455,598 163,923 (270) 619,251Investment 27,801 298 - 28,099Group share of profit 143,029 18,835 - 161,864Dividends - (3,612) - (3,612)Net amounts at 31.12.2007 626,428 179,444 (270) 805,602
1) GRANDE DIXENCE SA, in which the Group holds 60 % of the voting power, is stated in the balance sheet using the equity method because the Group does not have exclusive control over this company's financial and operating policies. In fact, the Group must obtain a qualified majority for certain important decisions concerning contracts and the articles of association. Similarly, CLEUSON-DIXENCE is also accounted for using the equity method for the same reasons. GRANDE DIXENCE SA in fact owns 15/22nds of CLEUSON-DIXENCE shares while the Group owns only 7/22nds directly. Although the CLEUSON-DIXENCE simple partnership is not a company in the legal sense, the Group has not integrated it by proportionate consolidation as recommended by IAS 31.30, opting rather for the alternative equity method permitted by IAS 31.38. Because of its legal status, its funding comes entirely from its owners. Consequently, the current account between the simple partnership and the Group is stated in the Balance Sheet as an interest accounted for using the equity method.
2) Joint ventures are accounted for using the equity method. The Group's share of net assets, restated to the Group's accounting standards, is stated in assets under investments. A negative share is presented in liabilities. Given its obligation to cover their expenses, the Group states its commitments to the joint ventures as liabilities.
3) At 31 December 2005, the restated equity of CENTRALE NUCLÉAIRE DE LEIBSTADT SA was negative, whereas at 31 December 2006, it had become positive. Consequently, the gross amounts and the Group’s share in this company were classified under Key Figures of Other Active Joint Ventures at 31 December 2006.

Notes to the consolidated financial statements
30 / 56
GRANDE DIXENCE SA AND CLEUSON-DIXENCE CONSOLIDATED KEY FIGURES
Gross
amountsGross
amounts Group share Group share 2007 2006 2007 2006Tangible fixed assets 1,743,754 1,428,435 1,189,209 991,631Intangible fixed assets 10,631 11,143 7,732 8,104Financial assets 21,861 20,291 13,122 12,555Current assets 123,328 5,298 77,757 3,330Long-term liabilities (829,359) (713,543) (497,810) (428,126)Short-term liabilities (267,779) (217,768) (163,582) (131,896)Net assets 802,436 533,856 626,428 455,598 Income from joint ventures 365,358 132,841 220,963 81,387Operating expenses and other operating income (130,893) (140,122) (77,934) (83,703)Net income 234,465 (7,281) 143,029 (2,316)
On 12 December 2000, the Cleuson-Dixence penstock, which brings water from the Grande Dixence dam to the Bieudron power plant, burst. Bringing the plant back into service requires the complete reconstruction of the pressure shaft lining and other work amounting to an investment of about CHF 365 m before building loan interests. The design and engineering work involved started in 2004. The first phase of the civil engineering work has been completed and the sheet metalworking phase began mid-2007. The project, whose size and security requirements make it exceptional, is running to time and budget. The facility is expected to be brought back into operation in 2010.
Following the accident, the owners of the damaged plant (EOS and GD) began civil proceedings against the consortium that supplied and delivered the shaft lining, claiming damages equal to the cost of reconstruction and loss of earnings. However, given various circumstances, an out-of-court settlement was reached at the start of 2008 and the agreed compensation, subject to a confidentiality clause, has been recognized in the 2007 accounts.

Notes to the consolidated financial statements
31 / 56
KEY FIGURES FOR OTHER JOINT VENTURE ASSETS
Gross
amountsGross
amounts Group share Group share 2007 2006 2007 2006 Tangible fixed assets 2,773,152 2,305,468 283,702 260,402Intangible fixed assets 418,838 472,215 139,611 157,403Financial assets 946,879 947,052 52,087 47,438Current assets 292,789 274,536 30,684 35,803Long-term liabilities (3,315,305) (3,225,151) (293,812) (293,625)Short-term liabilities (157,524) (270,865) (33,234) (43,904)Goodwill acquired by the Group - - 406 406Net assets 958,829 503,255 179,444 163,923 Income from joint ventures 1,278,746 817,678 154,801 133,315Operating expenses and other operating income (794,322) (723,009) (135,966) (128,743)Net income 484,424 94,669 18,835 4,572
KEY FIGURES OF OTHER JOINT VENTURE LIABILITIES
Gross
amountsGross
amounts Group share Group share 2007 2006 2007 2006Tangible fixed assets - - - -Financial assets - - - -Current assets 9 8 3 2Long-term liabilities (878) (878) (263) (263)Short-term liabilities (31) (30) (10) (9)Net assets (900) (900) (270) (270) Income from joint ventures 5 5 2 2Operating expenses and other operating income (5) (5) (2) (2)Net income 0 0 0 0

Notes to the consolidated financial statements
32 / 56
15. INVESTMENTS IN ASSOCIATED COMPANIES 31.12.2007 31.12.2006Movements Net amount at the beginning of the period 3,392 3,434Group share of income 526 142Dividends (184) (184)Net amount at the end of the period 3,734 3,392
KEY FIGURES Group share Group share 2007 2006Tangible fixed assets 1,742 1,061Intangible fixed assets 1,756 2,616Financial assets - -Current assets 25,390 7,522Long-term liabilities (555) (3,197)Short-term liabilities (24,599) (4,610) Net assets 3,734 3,392 Operating profit 30,370 7,335 Operating profit (EBIT) 706 289 Group share of net profit 526 142
16. OTHER FINANCIAL ASSETS 31.12.2007 31.12.2006Other financial assets available for sale 434 2,215Long-term loans to - joint ventures and associated companies 3,305 4,110 3,739 6,325
Other investments available for sale are recorded in the balance sheet at fair value. The fair value of other investments was established on the basis of the share price on the balance sheet date.
17. INVENTORY AND WORK IN PROGRESS 31.12.2007 31.12.2006Goods and materials 47 58Work in progress 3,109 1,690 3,156 1,748
Notes to the consolidated financial statements
33 / 56
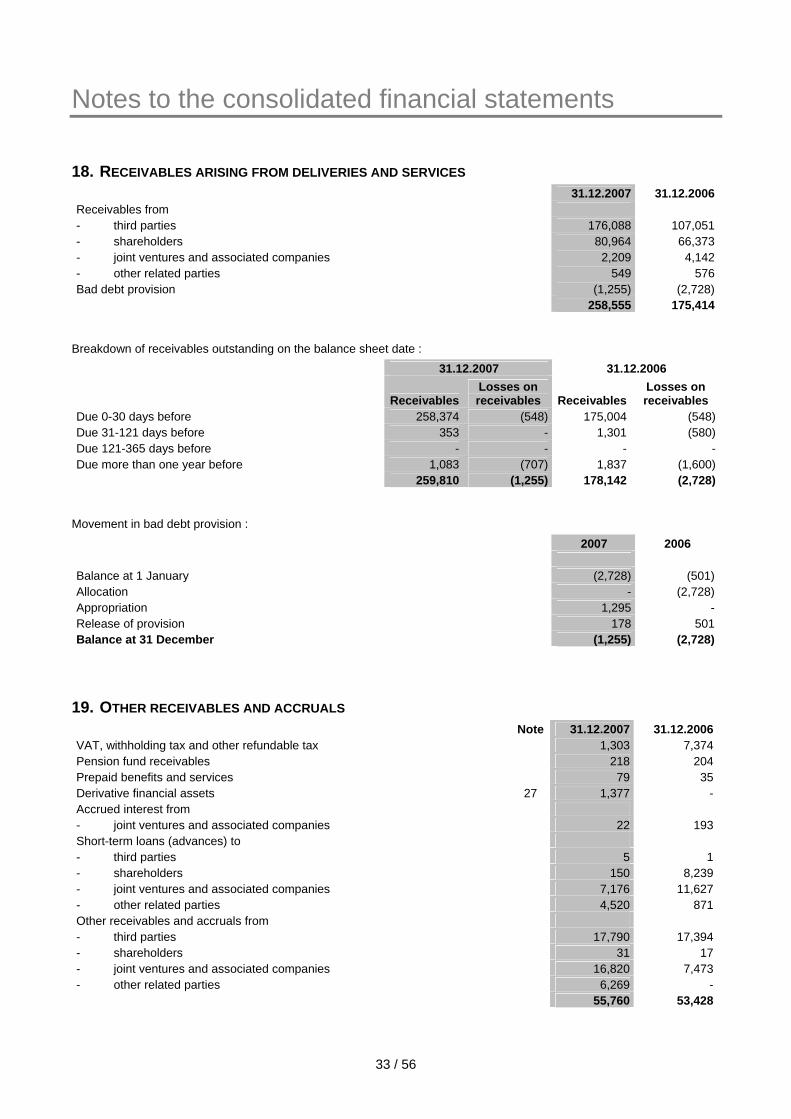
18. RECEIVABLES ARISING FROM DELIVERIES AND SERVICES 31.12.2007 31.12.2006Receivables from - third parties 176,088 107,051- shareholders 80,964 66,373- joint ventures and associated companies 2,209 4,142- other related parties 549 576Bad debt provision (1,255) (2,728) 258,555 175,414
Breakdown of receivables outstanding on the balance sheet date : 31.12.2007 31.12.2006
ReceivablesLosses on receivables Receivables
Losses on receivables
Due 0-30 days before 258,374 (548) 175,004 (548)Due 31-121 days before 353 - 1,301 (580)Due 121-365 days before - - - -Due more than one year before 1,083 (707) 1,837 (1,600) 259,810 (1,255) 178,142 (2,728)
Movement in bad debt provision : 2007 2006 Balance at 1 January (2,728) (501)Allocation - (2,728)Appropriation 1,295 -Release of provision 178 501Balance at 31 December (1,255) (2,728)
19. OTHER RECEIVABLES AND ACCRUALS Note 31.12.2007 31.12.2006VAT, withholding tax and other refundable tax 1,303 7,374Pension fund receivables 218 204Prepaid benefits and services 79 35Derivative financial assets 27 1,377 -Accrued interest from - joint ventures and associated companies 22 193Short-term loans (advances) to - third parties 5 1- shareholders 150 8,239- joint ventures and associated companies 7,176 11,627- other related parties 4,520 871Other receivables and accruals from - third parties 17,790 17,394- shareholders 31 17- joint ventures and associated companies 16,820 7,473- other related parties 6,269 - 55,760 53,428
Notes to the consolidated financial statements
34 / 56
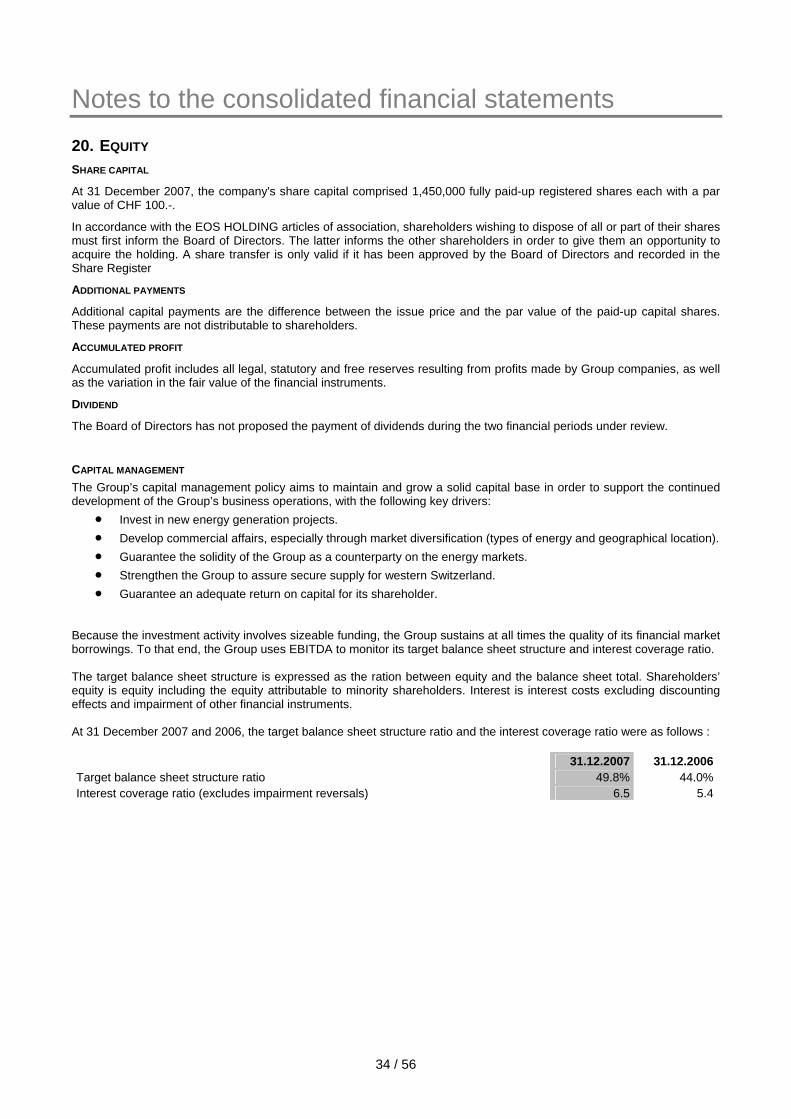
20. EQUITY SHARE CAPITAL
At 31 December 2007, the company's share capital comprised 1,450,000 fully paid-up registered shares each with a par value of CHF 100.-.
In accordance with the EOS HOLDING articles of association, shareholders wishing to dispose of all or part of their shares must first inform the Board of Directors. The latter informs the other shareholders in order to give them an opportunity to acquire the holding. A share transfer is only valid if it has been approved by the Board of Directors and recorded in the Share Register
ADDITIONAL PAYMENTS
Additional capital payments are the difference between the issue price and the par value of the paid-up capital shares. These payments are not distributable to shareholders.
ACCUMULATED PROFIT
Accumulated profit includes all legal, statutory and free reserves resulting from profits made by Group companies, as well as the variation in the fair value of the financial instruments.
DIVIDEND
The Board of Directors has not proposed the payment of dividends during the two financial periods under review.
CAPITAL MANAGEMENT The Group’s capital management policy aims to maintain and grow a solid capital base in order to support the continued development of the Group’s business operations, with the following key drivers:
• Invest in new energy generation projects. • Develop commercial affairs, especially through market diversification (types of energy and geographical location). • Guarantee the solidity of the Group as a counterparty on the energy markets. • Strengthen the Group to assure secure supply for western Switzerland. • Guarantee an adequate return on capital for its shareholder.
Because the investment activity involves sizeable funding, the Group sustains at all times the quality of its financial market borrowings. To that end, the Group uses EBITDA to monitor its target balance sheet structure and interest coverage ratio. The target balance sheet structure is expressed as the ration between equity and the balance sheet total. Shareholders’ equity is equity including the equity attributable to minority shareholders. Interest is interest costs excluding discounting effects and impairment of other financial instruments. At 31 December 2007 and 2006, the target balance sheet structure ratio and the interest coverage ratio were as follows : 31.12.2007 31.12.2006Target balance sheet structure ratio 49.8% 44.0%Interest coverage ratio (excludes impairment reversals) 6.5 5.4

Notes to the consolidated financial statements
35 / 56
21. FINANCIAL LIABILITIES 31.12.2007 31.12.2006Long-term financial liabilities 450,413 571,737Short-term financial liabilities 122,490 16,822 572,903 588,559
Effective Fair Value 1) rate Term 2007 2006 Bonds - CHF 300 million at 4%, due 02.2009 4.20% 1998-2009 301,691 306,625 299,139 298,693- CHF 125 million at 2.875%, due 09.2014 3.12% 2006-2014 124,209 124,105 123,274 123,044Borrowings from financial institutions - Bank 5.00% 2000-2007 - 10,110 - 10,000- Bank 4.34% 2000-2008 10,003 10,142 10,000 10,000- Bank 3.05% 2006-2021 9,416 10,069 10,000 10,000- Bank 3.20% 2007-2022 7,482 - 8,000 -- Bank 2) Libor 2006-2012 - 10,001 - 10,000- Insurance 3.54% 1998-2008 110,075 110,827 110,000 110,000- Insurance 4.44% 2000-2010 10,292 10,425 10,000 10,000Other debts towards - third parties At sight 2,490 58 2,490 58- joint ventures and associated companies At sight - 638 - 638- other related parties - 6,126 - 6,126Total Group financial liabilities 575,658 599,126 572,903 588,559
1) Fair value is based on the discounting of future cash flows at market rates. The Group’s market rates are estimated from the government bond plus a risk premium of 0.5 %.
2) These are committed credit facilities, which can be used in the form of short-term fixed-rate advances . The contractual interest rate is based on the Libor rate at the start of the drawdown operation for the whole term plus a margin. Given that the expiry dates of the confirmed lines of credit are greater than 1 year, they are stated under “long-term financial liabilities”.
The Group had confirmed committed credit facilities with various banks for a total of CHF 230 m at 31 December 2007 (CHF 260 m at 31 December 2006)
Total Maturities < 1 year 1-5 years > 5 years Confirmed credit facilities at 31.12.2007 230,000 - 230,000 - Confirmed credit facilities at 31.12.2006 260,000 - 120,000 140,000

Notes to the consolidated financial statements
36 / 56
22. PROVISIONS 31.12.2007 31.12.2006Long-term provisions 24,642 23,230Short-term provisions 597 597 25,239 23,827
Dismantling Other TotalAt 01.01.2006 23,898 2,978 26,876Allocations - 860 860Appropriations - (2,350) (2,350)Released provisions (668) (891) (1,559)At 31.12.2006 23,230 597 23,827 At 01.01.2007 23,230 597 23,827Allocations - 600 600Appropriations - - 0Released provisions - - 0Discounting effects 813 - 813At 31.12.2007 24,043 1,197 25,239
The dismantling provision is earmarked for the dismantling of the CENTRALE THERMIQUE DE VOUVRY SA facility. As long as no definitive decision has been taken about the restoration of the site, the dismantling of the plant has been indefinitely deferred. From 2007, this provision takes into account the discounting effect recognized under financial costs, which for the period under review amounts to kCHF 813.
The other provisions cover risks connected with the operation of our facilities.

Notes to the consolidated financial statements
37 / 56
23. EMPLOYEE BENEFITS
PensionsEarly
retirementVoluntary pensions Total
At 01.01.2006 3,223 2,740 7,052 13,015Contributions paid (1,760) - (738) (2,498)Net cost stated in profit and loss account 759 633 49 1,441Released provisions - (239) - (239)At 31.12.2006 2,222 3,134 6,363 11,719 At 01.01.2007 2,222 3,134 6,363 11,719Contributions paid (2,223) - (658) (2,881)Net cost stated in profit and loss account 1,605 6 182 1,793Released provisions - (16) - (16)At 31.12.2007 1,604 3,124 5,887 10,615Amount recognized as a liability in the balance sheet 1,604 3,124 5,887 10,615
Pensions represents the Group’s financial commitment to the CPE. It is the portion of the scheme asset shortfall or surplus recognized in the accounts (see below).
Early retirement pensions are the Group’s liability towards serving members of staff. The liability towards employees who have taken early retirement is transferred to the CPE. Early retirement pensions are granted to all employees from the age of 60.
Voluntary pensions are the Group’s liability in respect of former employees. They are made up of the indexing of non-CPE retirement pensions and membership of the health insurance scheme.
31.12.2007 31.12.2006Reconciliation of scheme liabilities
Discounted value of pension liability at the start of the period 206,023 199,304Interest costs 7,089 6,820Current service cost 2,800 1,307Contributions of plan members 980 887Current benefits (10,750) (11,087)Actuarial gains / (losses) 1,906 8,792Discounted value of pension liability at the end of the period 208,048 206,023
31.12.2007 31.12.2006Reconciliation of scheme assets Fair value of assets at the start of the period 216,577 205,098Expected return on assets 10,640 10,045Employer’s contributions 2,223 1,760Contributions of plan members 980 887Current benefits (10,750) (11,087)Actuarial gains / (losses) 4,650 9,874Fair value of assets at the end of the period 224,320 216,577
31.12.2007 31.12.2006Effective return on scheme assets Expected return on assets 10,640 10,045Actuarial gains / (losses) on scheme assets 4,650 9,874Effective return on scheme assets 15,290 19,919

Notes to the consolidated financial statements
38 / 56
31.12.2007 31.12.2006Pension liabilities stated in the balance sheet Discounted value of pension liabilities (208,048) (206,023)Fair value of pension plan assets 224,320 216,577Asset surplus / (shortfall) 16,272 10,554Unrecognized actuarial gains and losses (10,563) (9,846)Amounts not recognized in accounts (§ 58(b) limitation) (7,313) (2,930)Asset surplus/ (shortfall) recognized in accounts (1,604) (2,222)Relating to scheme liabilities 1,604 2,222
The CPE rate of coverage, calculated in accordance with current Swiss accounting rules, was 127.9 % at 31 December 2007 (2006 : 123.8 %).
31.12.2007 31.12.2006Pension charges recognized in the profit and loss account Current service cost 2,800 1,307Interest cost 7,089 6,820Expected return on pension assets (10,640) (10,045)Recognized actuarial losses / (gains) (§ 92 f.) (96) -Recognized actuarial losses / (gains) (§ 58A) (1,930) 370§ 58(b) limitation effect 4,382 2,308Net cost of Group pension liability 1,605 760
The Group expects to pay contributions amounting to kCHF 3,800 to the CPE in 2008.
31.12.2007 31.12.2006Scheme asset components
Equity instruments - Third parties 104,107 107,260Debt instruments - Third parties 83,043 69,637Fixed assets neither occupied nor used 31,988 29,111Other 5,182 10,569Total scheme asset components 224,320 216,577
Notes to the consolidated financial statements
39 / 56
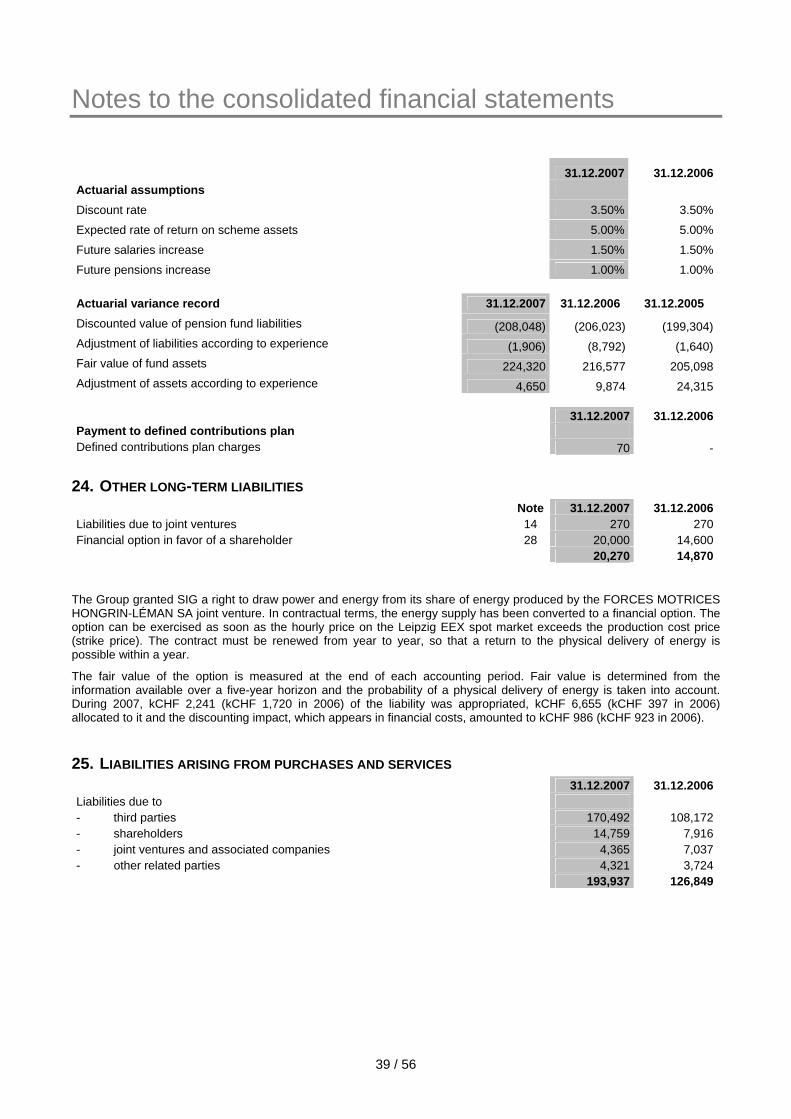
31.12.2007 31.12.2006Actuarial assumptions
Discount rate 3.50% 3.50%
Expected rate of return on scheme assets 5.00% 5.00%
Future salaries increase 1.50% 1.50%
Future pensions increase 1.00% 1.00% Actuarial variance record 31.12.2007 31.12.2006 31.12.2005 Discounted value of pension fund liabilities (208,048) (206,023) (199,304)Adjustment of liabilities according to experience (1,906) (8,792) (1,640)Fair value of fund assets 224,320 216,577 205,098Adjustment of assets according to experience 4,650 9,874 24,315
31.12.2007 31.12.2006Payment to defined contributions plan Defined contributions plan charges 70 -
24. OTHER LONG-TERM LIABILITIES Note 31.12.2007 31.12.2006Liabilities due to joint ventures 14 270 270Financial option in favor of a shareholder 28 20,000 14,600 20,270 14,870
The Group granted SIG a right to draw power and energy from its share of energy produced by the FORCES MOTRICES HONGRIN-LÉMAN SA joint venture. In contractual terms, the energy supply has been converted to a financial option. The option can be exercised as soon as the hourly price on the Leipzig EEX spot market exceeds the production cost price (strike price). The contract must be renewed from year to year, so that a return to the physical delivery of energy is possible within a year.
The fair value of the option is measured at the end of each accounting period. Fair value is determined from the information available over a five-year horizon and the probability of a physical delivery of energy is taken into account. During 2007, kCHF 2,241 (kCHF 1,720 in 2006) of the liability was appropriated, kCHF 6,655 (kCHF 397 in 2006) allocated to it and the discounting impact, which appears in financial costs, amounted to kCHF 986 (kCHF 923 in 2006).
25. LIABILITIES ARISING FROM PURCHASES AND SERVICES 31.12.2007 31.12.2006Liabilities due to - third parties 170,492 108,172- shareholders 14,759 7,916- joint ventures and associated companies 4,365 7,037- other related parties 4,321 3,724 193,937 126,849

Notes to the consolidated financial statements
40 / 56
26. OTHER LIABILITES AND ACCRUALS Note 31.12.2007 31.12.2006VAT, advance tax and other tax payable 368 152Liabilities in respect of pension institutions - -Salaries and other social security costs payable 3,652 716Overtime and holidays payable 971 933Derivative instruments (liabilities) 27 7,652 15,651Accrued interest owed to - third parties 13,466 13,751Other debt and transitional amounts owed to - third parties 13,949 23,262- shareholders 2,013 1,089- joint ventures and associated companies 1,059 437- other related parties 6,849 2,275 49,979 58,266
27. DERIVATIVE FINANCIAL INSTRUMENTS The tables below present the contractual or nominal amounts and the fair values of the derivative instruments at 31 December 2007 and 2006, by type of contract. The contractual or nominal amounts indicate the volume of business transacted on the balance sheet date and not the risk-exposed value. Fair values are determined from forward market prices or actuarial models that take account of forward prices and the historic hourly profile of expected prices based on the spot prices.
Nominal amounts
Positive amounts
Negative amounts Net amounts
Energy trading-related instruments 2007 2006 2007 2006 2007 2006 2007 2006 Forward contracts (110,531) (49,550) 156,877 58,055 (170,459) (57,298) (13,582) 757Option contracts 37,537 17,147 8,848 - (1,416) (4,591) 7,432 (4,591)Capacity contracts 15,475 6,211 - - (2,234) (2,286) (2,234) (2,286)Futures 1,230 1,918 2,422 - (1,690) (571) 732 (571)Total (56,289) (24,274) 168,147 58,055 (175,799) (64,746) (7,652) (6,691) Swap instruments Forward swap contracts (9,951) 18,402 1,047 - (669) (93) 378 (93)Total (9,951) 18,402 1,047 0 (669) (93) 378 (93) Interest rate instrument CAP 100,000 50,000 690 406 - - 690 406Total 100,000 50,000 690 406 0 0 690 406 Total derivative instruments 33,760 44,128 169,884 58,461 (176,468) (64,839) (6,584) (6,378)

Notes to the consolidated financial statements
41 / 56
The Group hedges future cash flows relating to predicted electricity, gas and CO2 purchases and sales. The fair value is the closing price on the EEX stock exchange. In 2007, the cash flow hedge relating to future CO2 purchases was assessed as being highly effective and a latent gain of kCHF 309 for the hedging instrument, net of deferred tax liabilities of kCHF 72, has been recognized under shareholders’ equity. The amount recognized in the profit and loss account for the hedging instrument under "Energy purchases" for 2007 was kCHF 10,128 before tax.
At 31 December 2007, the hedged risk is identified as the movement in the price of CO2 certificates for 2008 to 2012.
Nominal amounts Positive amountsNegative amounts Net amounts
Derivative instruments qualifying as hedges 2007 2006 2007 2006 2007 2006 2007 2006 Gas swaps - 36,810 - - - (8,165) - (8,165)CO2 swaps 33,278 1,071 520 - (211) (702) 309 (702)Total derivative instruments qualifying as hedges 33,278 37,881 520 0 (211) (8,867) 309 (8,867)
28. OBJECTIVES AND POLICIES OF FINANCIAL RISK MANAGEMENT In Its business operations, the Group is exposed to financial risks : market risks (including foreign exchange rate risks, interest rate risks, and energy price-related risks), credit risks and cash risks. The Executive Management monitors these risks regularly for changes.
The internal funding and treasury rules approved by the Board of Directors set out the financing, exchange and interest-rate cover policies, and indicate which operations are authorized. The validation of counterparties and their credit limits and the management of the limits of exposure to the price risk associated with the selling of energy for each portfolio are the responsibility of the Risk Management Committee, which applies the Energy Trading Economic Risk Management Policy established by the Board of Directors.
MARKET RISKS FOREIGN EXCHANGE RISKS
Practically all the international energy trades are denominated in EUR. The Group is exposed to foreign exchange risks to the extent that there are differences between the amounts received and paid in EUR. These flows offset each other to a very large extent. In order to reduce its residual exposure to foreign exchange risk, the Group uses derivative financial instruments to moderate the effects of exchange rate variation.
At 31 December 2007 and 2006, with a variation of +/-5 % between the EURO and the Swiss franc, all other variables remaining constant, the impact on shareholders’ equity and pre-tax profit would have been as follows : kCHF kCHF
31.12.2007 Shareholders'
equity Pre-tax profit Euro 15 5,665
31.12.2006 Shareholders'
equity Pre-tax profit Euro 441 2,233

Notes to the consolidated financial statements
42 / 56
INTEREST RATE RISKS
The production and transmission of electricity require considerable capital. In order to limit the impact of interest-rate fluctuations, the Group uses fixed-rate financing, which is usually long-term with phased maturity dates. Cash is invested short-term in CHF and EUR, mainly in fixed-rate products in order to limit interest-rate and foreign-exchange risk. The Group occasionally uses financial derivatives to moderate the effects of these fluctuations. Investments and derivative instruments are only placed with first-class financial institutions.
At 31 December 2007 and 2006, the Group had no funding at variable rates of interest. The Group’s exposure to interest rate risks from cash and derivative instruments is not significant.
ENERGY PRICE-RELATED RISKS
The energy trading business is exposed to risks from changes in the energy prices on the European wholesale markets. These risks arise from energy price changes on the spot and forward markets, from a change in price differentials between markets and products and from a possible deterioration in market liquidity. In order to manage the risks associated with these changes, the Group uses physical instruments and financial derivatives as appropriate. Only the Group’s core assets and current or future liabilities that are very likely to be realized are hedged. Apart from transactions entered into for hedging purposes, trading is subject to price risk exposure limits approved by the Board of Directors and regularly monitored both by a Risk Management Committee and by the Executive Management. To that end, spot and forward deals are spread across portfolios that have exposure limits ; these limits are monitored daily by a Risk Management Department that is an independent entity in the organization.
Value-at-Risk (VaR) is a measure of the price risk on a forward position. This measure is a way of discovering the maximum loss on a portfolio of market-listed forward or future products with statistical certainty (set by the Group at 99%) over a period of time (set at two days). In other words, the VaR calculated by Risk Management answers the question : “what is the maximum loss – with 99% confidence – that the open position under consideration could produce in two days ?” So, if a decision to liquidate a position or a portfolio were to be taken, this risk measurement is the one to use because the purchase or sale of open positions could be done using forward products.
The estimated potential loss based on instruments exposed to energy-price related risk was CHF 9.19 m at 31 December 2007 and CHF 9.86 m at 31 December 2006.
CREDIT RISKS The majority of forward contracts on the European wholesale markets are over the counter arrangements with other market counterparties. These physical and financial contracts are only entered into with energy market counterparties who meet strict criteria of creditworthiness. A credit line is established for each counterparty based on financial solidity. If the counterparty’s financial solidity is not adequate, the Group requires guarantees : bank guarantees from first-class European banking institutions, joint guarantee from the parent company or cash margin calls to suit the exposure. Counterparty risk exposure, defined as the sum of invoices outstanding and the replacement value of the open positions, is regularly monitored and compared with the credit line previously set by the Executive Management or, if necessary, the amount of the guarantee obtained.
The amount given for financial assets shows the maximum credit exposed to credit risk . 31.12.2007 31.12.2006Other investments available for sale 434 2,215Short-term receivables 258,555 175,414Long-term loans 3,305 4,110Cash and cash equivalents 138,143 78,556Interest swaps - assets 690 406Forward contracts - assets 378 - 401,505 260,701

Notes to the consolidated financial statements
43 / 56
CASH RISK The cash risk is defined as the risk that the Group will not be able to meet its obligations in time or at a reasonable price. Group Treasury is responsible for cash, for finance and for the management of due dates. The Group’s cash situation is managed through its cash flow and committed credit facilities with various banks totaling CHF 230 m at 31 December 2007 and CHF 260 m at 31 December 2006. The table below contains information about the due dates of financial assets and liabilities excluding trade payables and receivables at 31 December 2007 and 2006, based on non-discounted contractual payments.
31 December 2007 Due or with a due date not greater than one month
Due dates between 1 and
12 months
Due dates between 1 and 5
years
Due dates greater than 5
years Total
Assets Financial loans 11,851 - 366 3,458 15,675Derivative instruments - - 33,278 - 33,278Cash flow 138,143 - - - 138,143Total assets 149,994 0 33,644 3,458 187,096 Liabilities Financial liabilities 12,924 111,944 395,763 172,748 693,379Derivative instruments - - 66,240 - 66,240Total liabilities 12,924 111,944 462,003 172,748 759,619
31 December 2006 Due or with a due date not greater than one month
Due dates between 1 and
12 months
Due dates between 1 and 5
years
Due dates greater than 5
years Total
Assets Financial loans 20,738 - 1,183 3,743 25,664Derivative instruments - - 37,881 - 37,881Cash flow 78,556 - - - 78,556Total assets 99,294 0 39,064 3,743 142,101
Liabilities Financial liabilities 6,822 10,868 532,147 164,819 714,656Derivative instruments - - 5,872 - 5,872Total liabilities 6,822 10,868 538,019 164,819 720,528

Notes to the consolidated financial statements
44 / 56
29. RELATED PARTY TRANSACTIONS SHAREHOLDERS
The Group carries on an essential part of its business with its shareholders. The Group buys and sells short- and long-term electricity from and to them, supplies them with power transmission services and obtains “associated” services (top-up power supply and provision of services) on their behalf. In addition, some shareholders have entrusted the Group with the management of commercial and / or trading portfolios. All these services are provided between the parties at arm’s length prices.
Agreements with shareholders
In March 2001, EOS, a subsidiary of EOS HOLDING, signed with its “shareholder-clients” at that time (Groupe E, RE, SIG, SIL), now all EOS HOLDING shareholders, a framework agreement and a series of agreements that took effect on 1 October 2001. These agreements contained the arrangements intended to ensure the financial continuity of the company under a long-term plan approved by its shareholders. Under the framework agreement, from the effective date of 1st October 2001 and for a further period of six years (that is, until 30September 2007), the “shareholder-clients“ were bound to purchase fixed quantities of energy each year on predefined terms and to grant non-interest-bearing convertible loans or prepayments of CHF 155 m. These receivables were passed to EOS HOLDING, which converted them to share capital in 2005.
Under the other agreements, from 1st October 2007 to 31 December 2030, the “shareholder-clients” are entitled to purchase electricity from EOS at a price equivalent to the average cost of producing the energy and in quantities not exceeding a total of 1,500 GWh p.a. This supply option is deemed to be a purchasing right granted to the “shareholder-clients” that will only enter into force when the right is exercised ; the latter depends on future market conditions and will only be extinguished by the physical delivery of the electricity. Where applicable, the cumulative difference accrued over the years between EOS’ average sale price and the average cost of production for the electricity drawn, will impact those financial years in which it occurs and shall not exceed the sum corresponding to the special contributions paid by the “shareholder-clients” during the period between 1st October 2001 and 30 September 2004, i.e. a total of CHF 380 m. For 2007, the “shareholders-clients” exercised their right, and the price difference for the period and cumulatively at 31 December 2007 was CHF 11 m and the balance at 31 December 2007 was CHF 369 m.
In July 2005, EOS signed a long-term energy supply contract with the EOS HOLDING shareholders in order to enhance their security of supply and, for EOS, to limit the risks from fluctuating prices on part of its production. The contract came into effect on 1 October 2007 and will automatically end on the scheduled date of termination, i.e., 31 December 2015. The contract was drawn up on the basis of the arm’s length terms applicable at the time and also includes clauses to safeguard against any significant changes in the market conditions.
Right to draw power and energy from its share of the electricity production of the FORCES MOTRICES HONGRIN-LÉMAN SA joint venture. The Group granted SIG a right to draw power and energy from its share of energy produced by the FORCES MOTRICES HONGRIN-LÉMAN SA joint venture. This right enables SIG to purchase, at production cost, 20% of the joint venture’s average natural water inflows. The right to draw terminates on 30 September 2051 when the current concessions held by FORCES MOTRICES HONGRIN-LÉMAN SA expire. In contractual terms, the energy supply has been converted to a financial option, renegotiable from year to year (see Note 24).
Relations with EOS HOLDING
Some of the Group’s executive leadership tasks are carried out by the management of EOS HOLDING, which coordinates the business activities of EOS, AVENIS and EOS TRADING. EOS HOLDING also makes a financial contribution to the Group.

Notes to the consolidated financial statements
45 / 56
Other transactions
JOINT VENTURES
The Group buys a large portion of its energy from its joint venture companies. The Group enjoys a right to draw power and energy from these companies in proportion to its investment. In return, it has a corresponding contractual obligation to cover their costs.
Accounting and financial information pertaining to the joint ventures is presented in Note 14.
ASSOCIATED COMPANIES
The management and co-ordination of the national and international VHV transmission networks have been delegated to SWISSGRID SA. All these companies invoice their services at arm’s length prices.
Accounting and financial information pertaining to the associated companies is presented in Note 15.
OTHER RELATED PARTIES
Other related parties comprise the companies directly owned by EOS HOLDING.
EOS has contracted EOS TRADING and AVENIS to carry out direct sales and energy portfolio management for the Group. EOS provides some support functions for the business activities of EOS TRADING and AVENIS. All these services are invoiced at arm’s length prices.
HYDRO EXPLOITATION SA is responsible for the maintenance and operation of the Group’s hydropower plants. CLEUSON-DIXENCE CONSTRUCTION SA (CDC) and CISEL INFORMATIQUE SA have been awarded contracts. All these companies invoice their services at arm's length prices.
REMUNERATION OF EXECUTIVE MANAGEMENT AND BOARD OF DIRECTORS
The Board of Directors of the EOS HOLDING Group received remuneration of CHF 1.1 m during the period under review (CHF 1.3 m the previous year). The Executive Management received remuneration amounting to CHF 3.2 m (CHF 3.2 m the previous year).
30. UNCERTAINTY OF ACCOUNTING ESTIMATES At each balance sheet date, the recoverable amount of the generating and supply assets held by the Group, and of the financial option, is estimated. This amount is based on assumptions about future estimated electricity prices. At 31 December 2007, the Group reversed impairments recognized during prior periods (see Note 11).
Changes in electricity prices could have a considerable influence on the future valuation of the generation and supply assets. The composition of these assets and their carrying amounts are :
Notes 31.12.2007 31.12.2006
• Tangible fixed assets (generating facilities) 12 89,615 90,946 • Intangible fixed assets (rights of use and drawing rights) 13 392,949 261,956 • Joint ventures 14 805,602 619,251 • Financial option 24 20,000 14,600

Notes to the consolidated financial statements
46 / 56
31. FUTURE LIABILITIES AND CONTINGENT LIABILITIES The changes in French legislation governing the sustainable management of radioactive materials and waste have caused our French partner to claim that a sum of between CHF 0 and 30 m will be due between now and 2011. However, there is no definite liability so far and no debt has been recognized by the Group.
Apart from the above point, the Group has no commitments other than those given under relations with joint ventures (Note 14).
32. ENERGY GROUP WEST (EGW/PSO) In 2007, important decisions were taken about the creation of EGW/PSO , after the Swiss Supreme Court rejected the complaint of a shareholder who objected to the share exchange offer made by MOTOR-COLUMBUS to ATEL shareholders in 2006.
In November 2007, the shareholders of MOTOR-COLUMBUS (MC) approved the change of the company’s name to ATEL HOLDING SA, the adaptation of the articles of association and the transfer of the registered office from Baden to Olten. The shareholders also agreed to convert the bearer shares to registered shares, and to divide the shares in a ratio of 1 to 25. These measures, among others, were the preliminary conditions for a complex process to create EGW/PSO.
ATEL HOLDING SA (formerly MC) offered ATEL shareholders a public share exchange on 12 November 2007. At the end of the offer, on 10 January 2008, ATEL HOLDING SA controlled 99.82 % of the share capital of the ATEL Group. By mid-2008, ATEL will cancel its remaining outstanding shares and delist from the SWX stock exchange, clearing the way for preliminary steps toward a merger of ATEL Group with the industrial operations and assets of EOS HOLDING, and possibly with the Swiss assets of EDF Group.
Completion of the preliminary stage by the end of 2008 will lead to the full industrial integration of ATEL with the industrial operations and assets of EOS HOLDING and possibly, the Swiss assets of EDF. With this initiative, the foundation for a strong energy group grounded in western Switzerland is established. Based on a broad portfolio of complementary electricity production, the new group will operate across Europe and will have a leading position on the Swiss market. The new company will have more than 10,000 staff and a turnover of more than CHF 15 bn.
33. POST-BALANCE SHEET ACQUISTIONS The EOS Group acquired 35.5 % of the shares of SERHY, Saint-Amans-Soult in the Tarn region (France), on 14 February 2008, as well as 100 % of the shares of S.A.S. Le Bayet, Albertville, on 18 March 2008 (France). The attribution of the cost of acquisition, and the determination of the goodwill have not yet been reported.
34. EVENTS AFTER THE BALANCE SHEET DATE None

Auditors’ report
47 / 56

4. 2007 Corporate financial statements
48 / 56
Page(s)
Profit and loss account 49
Proposed appropriation of balance sheet profit 50 Balance sheet 51-52
Annex 53-55
Auditors’ report 56
Note : In the following tables and commentary, figures are given in thousands of Swiss francs (kCHF) unless otherwise indicated.

Profit and loss account
49 / 56
2007 2006 kCHF kCHF
Net turnover 2,240,321 1,865,649Other operating income 22,441 16,071
Total operating income 2,262,762 1,881,721 Energy purchases (2,009,619) (1,682,592)Materials and purchases (16,778) (14,643)Personnel expenses (26,582) (24,121)Depreciation (44,673) (44,854)Other operating expenses (49,694) (40,611)
Total operating expenses (2,147,346) (1,806,821)
Earnings before interest and tax (EBIT) 115,416 74,899 Interest income 8,790 7,268Financial costs (23,308) (24,075)Net financial cost (14,518) (16,807)
Earnings before tax (EBT) 100,898 58,092 Income tax (23,141) (10,963)
Ordinary profit 77,757 47,129 Extraordinary income from realisation of assets 1,131 1,080Exceptional drawdown of provisions 182,285 4,641Total extraordinary income 183,416 5,721 Other extraordinary expenses (92) (63)Total extraordinary expenses (92) (63)
Net profit 261,081 52,787

Proposed appropriation of balance sheet profit
50 / 56
2007 2006 kCHF kCHF
Carry forward at beginning of period 216,334 163,547
Profit for the period 261,081 52,787
Balance sheet profit 477,415 216,334
Allocation to the general reserve - -
Balance carried forward 477,415 216,334

Balance sheet
51 / 56
31.12.2007 31.12.2006 kCHF kCHFASSETS
Plants in operation 599,487 649,445
Buildings 63,350 51,004
Current projects 70,700 40,327
Total tangible fixed assets 733,537 740,777
Third part energy usage and
energy drawing rights etc 245,961 249,893
Other fixed assets 12,493 8,958
Projects under development 7,621 5,114
Total intangible fixed assets 266,075 263,965
Shareholdings 316,983 318,368
Loans to group companies 3,304 4,110
Total financial assets 320,287 322,478
Total fixed assets 1,319,899 1,327,219
Work in progress and services to be charged 3,543 1,690
Receivables from sales and services to :
Clients 160,436 89,721
Related companies / shareholders 80,598 66,119
Group companies 3,426 5,581
Other receivables from :
Third parties 1,900 1,015
Group companies 12,167 20,741
Cash and securities 142,293 78,081
Accrued assets in respect of :
Third parties 19,494 23,886
Group companies 20,779 7,666
Total current assets 444,636 294,500
Total assets 1,764,535 1,621,719

Balance sheet
52 / 56
31.12.2007 31.12.2006 kCHF kCHFLIABILITIES Share capital 145,000 145,000General statutory reserve 72,500 72,500Special reserve 11,689 11,689Balance sheet profit : Carry forward at start of period 216,334 163,547 Profit for the period 261,081 52,787
Total shareholders’ equity 706,604 445,523 Amortization provision for right of restitution 1,191 591Other provisions 220,043 402,627
Total provisions 221,234 403,217 Bonds and similar items 423,273 533,044Other liabilities towards third parties - 10,000Other liabilities towards related companies / shareholders 20,000 15,000Borrowing from group companies 2,650 2,650
Total long-term liabilities 445,923 560,694 Short-term borrowings and financial liabilities Third parties 112,490 0 Purchases and services payable to : Suppliers 172,390 106,446 Related companies / shareholders 14,781 7,944 Group companies 9,668 9,801 Other debt in respect of : Third parties 18,358 8,982 Related companies / shareholders 34 1 Group companies 18,053 29,227 Accrued liabilities in respect of : Third parties 27,026 31,520 Related companies / shareholders 1,770 1,675 Group companies 3,598 4,082 Accrued interest 12,606 12,606
Total short term liabilities 390,774 212,284
Total liabilities 1,764,535 1,621,719

Annex
53 / 56
Shareholdings 31.12.2007 31.12.2006 Company
Business activity
Share capital
Percentage control
Percentage control
*) EOS Réseau SA, Lausanne Transmission of
electricity 100 100.0% 0%*) Grande Dixence SA, Sion Production of
electricity 300,000 60.0% 60.0%*) Cleuson-Dixence, simple partnership Production of
electricity p.m. 31.8% 31.8%*) Salanfe SA, Vernayaz Production of
electricity 18,000 100.0% 100.0%*) Société des Forces Motrices du Grand-
Saint-Bernard SA, Bourg-Saint-Pierre Production of electricity 10,000 25.0% 25.0%
*) Electra-Massa SA, Naters Production of electricity 40,000 23.0% 23.0%
*) Forces Motrices de Conches SA, Lax Production of electricity 30,000 41.0% 41.0%
*) Forces Motrices Hongrin-Léman SA, Château-d'Oex
Production of electricity 30,000 39.3% 39.3%
*) Hydro-Rhône SA, Sion Production of electricity 100 30.0% 30.0%
Energie Electrique du Simplon SA, Simplon-Dorf
Production of electricity 8,000 80.0% 78.8%
*) Centrale Thermique de Vouvry SA, Vouvry
Production of electricity 1,000 95.0% 95.0%
*) Centrales Nucléaires en Participation SA, Berne
Production of electricity 150,000 33.3% 33.3%
*) Centrale Nucléaire de Leibstadt SA, Leibstadt
Production of electricity 450,000 5.0% 5.0%
AlpEnergie Suisse Sàrl, Lausanne Energy-related service provision 20 100.0% 100.0%
Etrans, Laufenburg Management of Swiss UHV network 7,500 14.5% 14.5%
*) Forces Motrices de Martigny-Bourg SA, Martigny-Bourg
Production of electricity 3,000 18.0% 18.0%
Forces Motrices de Fully SA, Fully
Production of electricity 800 28.0% 28.0%
Swissgrid AG , Laufenburg Management of Swiss UHV network 15,000 14.0% 14.0%
ARA Biogaz Brokenlande Gmbh & Co, Hamburg
Production of electricity EUR 630 23.0% 0%
*) See guarantee obligations towards third parties
Integration of CLEUSON-DIXENCE simple partnership The assets, liabilities, expenses and income of CLEUSON-DIXENCE are individually integrated into the EOS accounts in proportion to its 7/22
nds share of that company.

Annex
54 / 56
Guarantee obligations towards third parties In the joint venture companies, marked with an asterisk, EOS, like the other partners, has undertaken to take delivery of its energy share and to cover the expenses of those companies in proportion to its investment, unless there are special agreements. The annual expenses of these companies include in particular interest and the amortization and provisions necessary for the repayment of bonds.
Fire insurance for fixed assets 31.12.2007 31.12.2006 570,788 570,788 Many of the fixed asset are not insured against fire because of their nature (concrete walls, galleries, various shafts and high-voltage lines). Bonds 31.12.2007 31.12.2006 Maturity date 4 % 1998/2009 10.02.2009 300,000 300,000 2 7/8 % 2006/2014 22.09.2014 125,000 125,000 425,000 425,000
EOS shareholders 31.12.2007 31.12.2006Name
% du capital
Par value of share total
Par valueof share total
EOS HOLDING, Lausanne 100.0% 145,000 145,000
Contingent liabilities
With the exception of those mentioned in Notes 29 and 31 of the consolidated financial statements, there are no other contingent liabilities.
Pension liabilities 31.12.2007 31.12.2006
The company’s personnel is affiliated to the CPE, Caisse Pension Energie in Zurich, a collective provident fund for the sector. Employees are insured under a Swiss defined benefits pension plan.
The CPE rate of coverage, calculated in accordance with current Swiss standards, was 127.9 %.at 31 December 2007 The pension fund therefore has a positive balance.
Liabilities towards pension institutions. - -

Annex
55 / 56
Derivative instruments
Information concerning derivative instruments is given in Note 27 to the consolidated financial statements. The disclosure relates solely to EOS.
Transactions with EOS HOLDING shareholders
In March 2001, EOS signed with its “shareholder-clients” (GROUPE E, RE, SIG, SIL), now all EOS HOLDING shareholders, a framework agreement and a series of agreements that took effect on 1 October 2001. These agreements contain the arrangements that are intended to ensure the financial continuity of the company under a long-term plan approved by its shareholders
. Under the framework agreements, from the effective date of 1 October 2001 and for a further period of six years (that is, until 30 September 2007), the “shareholder-clients” are bound to purchase fixed quantities of energy each year on predefined terms and to grant non-interest-bearing convertible loans or prepayments of CHF 155 m. These receivables were passed to EOS HOLDING, which converted them to share capital in 2005.
Under the other agreements, from 1 October 2007 to 31 December 2030, the “shareholder-clients” will be entitled to purchase electricity from EOS at a price equivalent to the average cost of producing the energy and in quantities not exceeding a total of 1,500 GWh p.a. This supply option is deemed to be a purchasing right granted to the “shareholder-clients” that will only enter in force when the right is exercised ; the latter depends on future market conditions and will only be extinguished by the physical delivery of the electricity. Where applicable, the cumulative difference accrued over the years between EOS's average sale price and the average cost of production for the electricity drawn, will impact those financial years in which it occurs and shall not exceed the sum corresponding to the special contributions paid by the "shareholder-clients" during the period between 1 October 2001 and 30 September 2004, i.e. a total of CHF 380 m. . For 2007, the “shareholders-clients” exercised their right, and the price difference for the period and cumulatively at 31 December 2007 was CHF 11 m and the balance at 31 December 2007 was CHF 369 m.
In July 2005, EOS signed a long-term energy supply contract with the EOS HOLDING shareholders in order to enhance their security of supply and, for EOS, to limit the risks from fluctuating prices on part of its production. The contract will come into effect for deliveries starting 1 October 2007 and will automatically end on the scheduled date of termination, i.e. 31 December 2015. The contract was drawn up on the basis of the arm’s length terms applicable at the time and also includes clauses to safeguard against any significant changes in the market conditions
Additional information On 12 December 2000, the Cleuson-Dixence facility penstock, which brings water from the Grande Dixence dam to the Bieudron power plant, burst. Bringing the plant back into service requires complete reconstruction of the pressure shaft lining and other work amounting to an investment of about CHF 365m before building loan interest. The design and engineering work started in 2004. The first phase of the civil engineering work has been completed and the sheet-metalworking phase began mid-2007. The project, whose size and security requirements make it exceptional, is running to time and budget. The facility is expected to be brought back into operation in 2010. Following the accident, the owners of the damaged plant (EOS and GD) began civil proceedings against the consortium that supplied and delivered the shaft lining, claiming damages equal to the cost of reconstruction and loss of earnings. However, given various circumstances, an out-of-court settlement was reached at the start of 2008 and the agreed compensation, subject to a confidentiality clause, has been recognised in the 2007 accounts. . Lausanne, 27 March 2008 On behalf of the Board of Directors
Chairman Vice-Chairman : Dominique Dreyer Guy Mustaki

Auditors’ report
56 / 56