2006 Survey on Monitoring the Paris Declaration - … · 2006 survey on monitoring the paris...
131
Aid Effectiveness Overview of the Results 2006 Survey on Monitoring the Paris Declaration Also published as the OECD Journal on Development: Volume 8, No. 2
Transcript of 2006 Survey on Monitoring the Paris Declaration - … · 2006 survey on monitoring the paris...
Aid Effectiveness
Overview of the Results
2006 Survey on Monitoring the Paris Declaration
Also published as the OECD Journal on Development: Volume 8, No. 2
2006 SURVEY ON MONITORING THE PARIS DECLARATION
OVERVIEW OF THE RESULTS
ORGANISATION FOR ECONOMIC CO-OPERATION AND DEVELOPMENT
www.oecd.org/dac/effectiveness/monitoring

ORGANISATION FOR ECONOMIC CO-OPERATION AND DEVELOPMENT
The OECD is a unique forum where the governments of 30 democracies work together to address the economic, social and environmental challenges of globalisation. The OECD is also at the forefront of efforts to understand and to help governments respond to new developments and concerns, such as corporate governance, the information economy and the challenges of an ageing population. The Organisation provides a setting where governments can compare policy experiences, seek answers to common problems, identify good practice and work to co-ordinate domestic and international policies.
The OECD member countries are: Australia, Austria, Belgium, Canada, the Czech Republic, Denmark, Finland, France, Germany, Greece, Hungary, Iceland, Ireland, Italy, Japan, Korea, Luxembourg, Mexico, the Netherlands, New Zealand, Norway, Poland, Portugal, the Slovak Republic, Spain, Sweden, Switzerland, Turkey, the United Kingdom and the United States. The Commission of the European Communities takes part in the work of the OECD.
OECD Publishing disseminates widely the results of the Organisation’s statistics gathering and research on economic, social and environmental issues, as well as the conventions, guidelines and standards agreed by its members.
© OECD 2007
No reproduction, copy, transmission or translation of this publication may be made without written permission. Applications should be sent to OECD Publishing: [email protected] or by fax (+33-1) 45 24 13 91. Permission to photocopy a portion of this work should be addressed to the Centre Français d’exploitation du droit de Copie, 20 rue des Grands-Augustins, 75006 Paris, France ([email protected]).

THE PARIS DECLARATION ON AID EFFECTIVENESS (March 2005) defined a number of commitments on the part of donors and partner countries, and a set of indicators to measure progress towards 2010. Within the Working Party on Aid Effectiveness, the Joint Venture on Monitoring the Paris Declaration is responsible for the monitoring and follow-up of the Paris Declaration. This document is the Baseline Survey on Monitoring the Paris Declaration covering 34 partner countries with data from 60 donors.
Although this is a baseline survey, a number of issues stand out, requiring improvements and actions. Examples are:
■ The cost of uncoordinated aid is very high. There are too many actors with competing objectives, especially in the poorest and most aid-dependent countries, leading to high transaction costs.
■ There is still slow progress in untying of aid and technical co-operation is still too much donor-driven.
■ Good headquarters policies are not always matched by in-country practices. ■ There is a need to strengthen country ownership. Mainly a partner responsibility,
donors can assist by capacity development and alignment on country programmes and systems.
■ A lot of work needs to be done in managing for results. Mutual accountability, a key concept in the Paris Agenda, calls for performance assessment frameworks and improved incentive systems in both partner and donor countries.
Increasing the impact of aid on development is fundamental and requires ambitious reforms for both donors and partners, not least to defend the scaling up of aid. The Paris Declaration is designed to help deliver these reforms by holding donors and partners accountable for progress in fulfilling the commitments.
Since 2005 a lot of work has been carried out by the various actors. Donors and partner countries have taken a number of initiatives in line with the Paris Agenda to achieve concrete improvements on the ground. This survey gives some evidence of the challenges ahead, challenges that will require political commitment from both donors and partner countries.
Jan CedergrenChair, OECD-DAC Working Party on Aid Effectiveness
Richard ManningChair, OECD Development Assistance Committee
FOREWORD
32006 SURVEY ON MONITORING THE PARIS DECLARATION: OVERVIEW OF THE RESULTS - ISBN 978-92-64-01965-2 - ©OECD 2007

THE 2006 SURVEY ON MONITORING THE PARIS DECLARATION was prepared under the aegis of the the Development Assistance Committee (DAC) Working Party on Aid Effectiveness, and is based on the work of the Joint Venture on Monitoring the Paris Declaration, co-chaired by Pham Thi Thanh An (Viet Nam) and Gregory Briffa (United Kingdom) and then George Carner (United States). Important contributions were also made by the Joint Venture on Public Financial Management co-chaired by Anthony Hegarty (World Bank) and Riccardo Maggi (European Commission). The Overseas Development Institute (ODI), a British-based independent think tank, assisted with the drafting. David Booth and Verena Fritz contributed to Volume 1 (Overview) and Volume 2 (Country Chapters) involved David Booth, Roo Griffiths, Alan Hudson, Kate Kilpatrick, Dinah McLeod and Sarah Mulley.
The Working Party would like to communicate its special thanks to the governments of the 34 countries that participated in this survey and in particular to the National Co-ordinators who managed the process at country level:
ACKNOWLEDGEMENTS
52006 SURVEY ON MONITORING THE PARIS DECLARATION: OVERVIEW OF THE RESULTS - ISBN 978-92-64-01965-2 - ©OECD 2007
AFGHANISTAN Mustapha AriaALBANIA Albana Vokshi Mezir HaldedaBANGLADESH Nargis IslamBENIN Rigobert LaourouBOLIVIA Fernando Jiménez ZeballosBURKINA FASO Justin Hien BURUNDI Pierre C. Abega Rurakamvye CAMBODIA Chhieng YanaraCAPE VERDE Miryam Vieira Marco Antonio OrtegaCONGO DEMOCRATIC REPUBLIC Benjamin Bonge GibendeDOMINICAN REPUBLIC América Bastidas
EGYPT Fayza AboulnagaETHIOPIA Hailemichael KinfuGHANA Helen Allotey Agatha Gaisie-NketsiahHONDURAS Ricardo AriasKENYA Jackson Kinyanju Bernard MasigaKYRGYZ REPUBLIC Sanjar Makanbetov Dinara DjoldoshevaMALAWI Naomi NgwiraMALI Modibo MakalouMAURITANIA Isselmou Ould Sidi El MoctarMOLDOVA Lucretia CiureaMONGOLIA Ochirkhuu Erdembileg
Mark Baldock provided the statistical analysis. The report was edited by Laura Boutin and Patricia Rogers (Executive Summary and Chapter 3), and designed by Peggy Ford-Fyffe King. The survey was prepared under the direction of Simon Mizrahi, Senior Policy Advisor at the OECD’s Development Co-operation Directorate (DCD) with the assistance of Kjerstin Andreasen.
MOZAMBIQUE Hanifa IbrahimoNICARAGUA Mauricio GómezNIGER Yakoubou Mahaman SaniPERU Agustín Haya de la TorreRWANDA Jean-Jacques NyirubutamaSENEGAL Thierno Seydou NianeSOUTH AFRICA Elaine VenterTANZANIA Joyce MapunjoUGANDA Deo Kamweya Damon Kitabire Peter M. SsentongoVIET NAM Pham Thi Thanh AnYEMEN Nabil ShaibanZAMBIA Paul Lupunga


FOREWORD 3
ACKNOWLEDGEMENTS 5
EXECUTIVE SUMMARY 9
Chapter 1 KEY FINDINGS FROM THE SURVEY 15
Chapter 2 THE SURVEY PROCESS 39
Chapter 3 CONCLUSIONS AND RECOMMENDATIONS 51
STATISTICAL APPENDICES 61
A COUNTRY DATA (One table per Indicator) 65
B DONOR DATA (One table per Indicator) 79
C DONOR DATA (One table per Donor) 89
D SURVEY QUESTIONNAIRES 123
E GLOSSARY OF KEY TERMS 127
TABLE OF CONTENTS
72006 SURVEY ON MONITORING THE PARIS DECLARATION: OVERVIEW OF THE RESULTS - ISBN 978-92-64-01965-2 - ©OECD 2007


92006 SURVEY ON MONITORING THE PARIS DECLARATION: OVERVIEW OF THE RESULTS - ISBN 978-92-64-01965-2 - ©OECD 2007
IN 2005, OECD COUNTRIES INVESTED MORE THAN USD 100 BILLION to advance welfare and eradicate poverty in developing countries. If this foreign aid is to do as much good as it possibly can, it must be used as effectively as possible. Better aid means very different things depending on which side of the develop-ment fence you are on. For countries that receive foreign aid, it means allocating resources to their policy priorities and plans to promote justice, stimulate economic growth and improve social welfare for their citizens. For countries and organisations that provide foreign aid, it means allocating funding to countries that need it most and are more likely to make best use of it (or that need special help to weather crises). But the true test of aid effectiveness is improvement in people’s lives.
A layperson observing today’s aid industry might be understandably baffled by the sheer number of aid actors, funds and programmes. The last time the OECD counted, there were more than 200 bilateral and multilateral organisations channelling official development assistance. Many developing countries may have more than 40 donors financing more than 600 active projects, and may still not be on track to achieve the Millennium Development Goals.
More than 100 countries and donor organisations recognised the imperative of managing aid more ratio-nally when, on March 2, 2005, they endorsed the Paris Declaration on Aid Effectiveness, an ambitious plan to reform the system of aid delivery.
THE PARIS DECLARATION RESTS ON FIVE COMMON-SENSE TENETS, that aid is more likely to promote development when: ■ Developing countries exercise leadership over their development policies and plans
(ownership). ■ Donors base their support on countries’ development strategies and systems (alignment). ■ Donors co-ordinate their activities and minimise the cost of delivering aid (harmonisation). ■ Developing countries and donors orient their activities to achieve the desired results
(managing for results). ■ Donors and developing countries are accountable to each other for progress in managing
aid better and in achieving development results (mutual accountability).
In the Paris Declaration, donors and partners also committed to monitoring their progress in improving aid effectiveness against 56 specific actions, from which 12 indicators were established and targets set for 2010. This report presents the findings and recommendations of the first round of monitoring that was conducted in 2006 on the basis of activities undertaken in 2005. The conclusions of this report are based on a body of evidence from a baseline survey of 34 self-selected countries, and a comprehensive list of donor organisations covering 37% of aid programmed across the world in 2005. The conclusions clearly show that in half of the developing countries signing on to the Paris Declaration, partners and donors have a long road ahead to meet the commitments they have undertaken.
THIS REPORT IS DIVIDED IN TWO VOLUMES. Volume 1 (120 pages) presents an overview of key find-ings across the 34 countries (Chapter 1), assesses the survey process (Chapter 2), and sets out some key conclusions and recommendations (Chapter 3). A statistical appendix provides all the data that underpin the analysis. Volume 2 (400 pages) includes a detailed analysis for each of the 34 countries that undertook the survey. This Executive Summary covers the key conclusions and recommendations of the full report (Volumes 1 and 2). ■
EXECUTIVE SUMMARY

10 2006 SURVEY ON MONITORING THE PARIS DECLARATION: OVERVIEW OF THE RESULTS - ISBN 978-92-64-01965-2 - ©OECD 2007
MAIN POLICY IMPLICATIONS OF THE 2006 SURVEY
HIGH EXPECTATIONS FOR REFORM
The survey shows that the Paris Declaration has stimulated an important dialogue at country level on how to improve aid. All donor agen-cies have made major efforts to implement the Paris Declaration within their organisations and communicate its importance to their staff, and there has been at least some implementation activity in over 60 countries.
Regional-level initiatives to disseminate and communicate the Paris agenda have included five regional workshops on aid effectiveness in 2005-06 in Uganda, Mali, South Africa, Bolivia and the Philippines. From the shores of Lake Victoria to the heights of Santa Cruz the message came out loud and clear: one size does not fit all. For aid to be effective, each country needs to determine its own priorities, pace and sequencing of reforms.
At the same time, many partner countries in regional workshops and elsewhere are voicing concerns about the high transaction costs of managing foreign aid and the slow pace of change in donor practices. They see a strong disconnect between headquarters policies and in-country practices, as illustrated by continued donor-driven technical co-operation and lack of visible progress on untying aid. Demonstrating tangible changes in practices is fundamental in sustaining momentum and achieving further progress by the next High-Level Forum in Ghana (September 2008) and the 2010 targets.
DEEPER OWNERSHIP, MORE ACCOUNTABLE INSTITUTIONS AND SYSTEMS
The quality of partner countries’ national devel-opment plans or poverty reduction strategies is one concrete measure of country ownership. The survey findings show that national development strategies need substantial strengthening if coun-tries are to meet the 2010 target. In 2005, only five countries (17% of the sample) met the six criteria for sound operational development strategies. The most common failing was weakness in the mech-anisms linking budget formulation and execution to national plans, policy priorities and results.
Improving transparency and accountability on the use of development resources is also an important objective of the Paris Declaration. Strengthening the credibility of the budget as a tool for governing the allocation and use of devel-opment resources (domestic and external) can not only improve the alignment of donor support, but also permit parliamentary scrutiny of govern-ment policies on development – which is key to deepening ownership. In 2005, the survey indi-cates, for nearly all countries the credibility of development budgets is undermined by sizable inaccuracies in the budget estimates of aid flows. Meeting the 2010 target will require donors and partner countries to work together so that budget estimates are both more comprehensive and more realistic, and aid is better aligned.
STRENGTHENING AND USING COUNTRY SYSTEMS
The Paris Declaration encourages donors to increasingly use strengthened country systems (for public financial management, procurement, environment, monitoring and evaluation, and other country systems) so that partner countries are empowered to develop institutions that can implement and account for their development policies and resource use to citizens and parlia-ments. On average, the survey shows, in 2005, 39-40% of aid flows for the government sector used country public financial management (PFM) and procurement systems. The degree to which donors rely on country public financial manage-ment systems varies considerably, depending at

112006 SURVEY ON MONITORING THE PARIS DECLARATION: OVERVIEW OF THE RESULTS - ISBN 978-92-64-01965-2 - ©OECD 2007
least partly on the quality of the systems and on such other factors as the existence of reform programmes. Progress will depend on greater understanding of the development benefits and risks of using these systems, and sustained and long-term efforts to strengthen capacity. More countries need to use performance assessment tools to reform and improve their systems (for example, the Public Expenditure and Financial Accountability (PEFA) framework for public financial management systems). Partner coun-tries need to take the lead in defining capacity development priorities, and donors should direct their technical and other assistance to imple-menting co-ordinated strategies.
INCREASING AID EFFICIENCY AND DONOR HARMONISATION
A key aim of the aid effectiveness agenda is to decrease the transaction costs of delivering aid, especially those that burden developing coun-tries by requiring them to manage multiple programmes using different donor procedures.
The survey provides clear evidence that the cost of managing aid is high for partner countries. On a business-as-usual basis, transaction costs for partner countries can be expected to increase significantly as the volume of aid is scaled up, new (emerging) donors become more active and further special initiatives are created. Donors will need to work aggressively to reduce the transaction costs of delivering and managing aid. They should give special attention to: increasing complemen-tarity and rationalising division of labour; making greater use of local harmonisation and alignment action plans, and of sector-wide and programme-based approaches; expanding use of delegated co-operation and other innovative approaches; and reducing the number of project implementation units and better integrating them into ministries.
Donors and partners must acknowledge that initially there are new costs associated with doing business differently. These costs constitute an up-front investment in doing business more effec-tively and should be factored into operational budgets and allocation of staff time.
MANAGING FOR RESULTS
The commitments on management for develop-ment results call for donors and partner coun-tries to direct resources to achieving results, and using information on results to improve decision making and programme performance. The survey suggests that translating evidence on results into processes of policy improvement remains a major challenge in the large majority of surveyed countries. Countries and donors should use performance assessment frameworks and more cost-effective results-oriented reporting. This, too, will require donors to invest in capacity development and rely more on country results reporting systems.
MUTUAL ACCOUNTABILITY
The Paris Declaration introduced the concept of mutual accountability – that aid is more effec-tive when donors and partner governments are not only accountable to their respective publics for the use of resources to achieve development results, but are also accountable to each other for better management of aid. The survey shows that the work to establish specific mechanisms for joint monitoring of aid effectiveness commit-ments at country level is just beginning, and more efforts will be needed to achieve the target by 2010. Aid effectiveness issues and results need to be discussed more explicitly at country level, and credible monitoring mechanisms need to be developed.

REORIENTING CORPORATE-LEVEL INCENTIVES
Most development agencies have taken impor-tant steps to advance implementation of the Paris Declaration, and donor field missions have increased their local efforts to align and harmo-nise their programmes. Nevertheless, the survey suggests that, at the corporate level, a number of hurdles work against donors’ ability to meet the commitments made in Paris. For example, in many agencies the Paris Declaration is still principally owned by policy staff at headquar-ters, while at country level, harmonisation tasks are sometimes seen as getting in the way of efforts to achieve tangible development results. At the corporate level, policy makers are encour-aged to review rules and procedures that get in the way of meeting the Paris commitments. For example, pressure to commit and disburse funds, limited flexibility for staff to devote time to co-ordination, and high staff turnover, which create incentives that reward short-term benefits over longer-term, and collective, gains.
12 2006 SURVEY ON MONITORING THE PARIS DECLARATION: OVERVIEW OF THE RESULTS - ISBN 978-92-64-01965-2 - ©OECD 2007
IMPROVING MONITORING OF THE PARIS DECLARATION
It is evident from the feedback on the baseline survey and the challenges described in Chapter 2 that the interim progress survey planned for 2008 will need to be improved in several ways. Planned changes include: improving the guidance; clari-fying and standardising the definitions; comple-menting the scope of the survey with localised and qualitative data; expanding country coverage; including more fragile states; strengthening the role of National Co-ordinators; reducing the burden to partners and donors in filling out the survey; and ensuring that the 2007 aid disburse-ment data is collected at country level well before the end of the first quarter of 2008. Organising a successful second round of monitoring, in such a short period of time, is no small undertaking. It will require very careful planning, communica-tion and early involvement of donors and partner countries. Beyond the survey, a medium-term monitoring plan is being developed for regional and national integration of ongoing monitoring efforts, planned evaluations, donor self-reporting and DAC peer reviews. The medium-term moni-toring plan will also suggest what strategic use could be made of the survey results at the country, regional or international levels. ■

THE SURVEY FINDINGS and the discussions that have taken place around them point to six major priority areas that need policy makers’ attention right now if countries and donors are to accelerate progress towards achieving the Paris Declaration commitments.
1. Partner countries need to deepen their ownership of the development process by engaging their citizens and parliaments more fully in planning and assessing their development policies and programmes. They should also increase efforts to link their plans much more closely to their budget and results frameworks.
2. Donors need to support these efforts by making better use of partners’ national budgets to align their programmes with country priorities. They also need to improve the transparency and predictability of aid flows by sharing timely and accurate information on intended and actual disbursements with budget authorities.
3. Partner countries need to take the lead in determining priority programmes of capacity development, especially those needed to improve country systems. Donors can help by better co-ordinating their technical assistance with country priorities and fully involving partners when commissioning technical assistance.
4. To further harmonisation, donors must work aggressively to reduce the transaction costs of delivering and managing aid. They should give special attention to enhancing complementarity and rationalising the division of labour; increasing use of local harmonisation and alignment action plans; increasing use of programme-based approaches; expanding reliance on delegated co-operation and other innovative approaches; reducing the number of project implementation units and better integrating them into ministries; and increasing efforts on untying as encouraged by the DAC recommendation.
5. To promote managing for results, countries and donors should make greater use of performance assessment frameworks and more cost-effective results-oriented reporting. This, too, will require donors to invest further in capacity development and increase their use of country results reporting systems.
6. To begin addressing mutual accountability commitments, countries and donors should clearly define a mutual action agenda and discuss aid effectiveness progress and development results more explicitly at country level by using country dialogue mechanisms (e.g. revamped Consultative Group and round table meetings) and developing credible monitoring mechanisms where needed. ■
132006 SURVEY ON MONITORING THE PARIS DECLARATION: OVERVIEW OF THE RESULTS - ISBN 978-92-64-01965-2 - ©OECD 2007
KEY POLICY RECOMMENDATIONS


152006 SURVEY ON MONITORING THE PARIS DECLARATION: OVERVIEW OF THE RESULTS - ISBN 978-92-64-01965-2 - ©OECD 2007
THIS CHAPTER PROVIDES AN OVERVIEW of the survey findings. The survey process is described and assessed in Chapter 2. Major conclusions, lessons and recommendations arising from the exercise are drawn together in Chapter 3.
Like the country studies on which it is based, this chapter draws principally on the survey returns completed in September 2006 under the auspices of the National Co-ordinator for each country. A second important source is the World Bank’s 2005 Comprehensive Development Framework Progress Report (henceforth CDF Progress Report) and the corresponding country profiles. The updated country profiles prepared for the Bank’s forthcoming Aid Effectiveness Review (henceforth AER) have also been consulted. The quantitative assessments for 2005 contained in the CDF Progress Report are the agreed basis for Indicators 1 (country strategies) and 11 (performance assessment systems). Finally, the World Bank’s annual Country Policy and Institutional Assessment (CPIA) is the source for Indicator 2a (quality of public financial management), and OECD data are used on aid tying. These sources are listed at the end of the chapter.
THE PARIS DECLARATION is a joint undertaking on the part of the donor community and partner countries. The commit-ments are highly interdependent. That is, they are only likely to be realised through a combined effort that acts on both sides of the problem. For example, country ownership of development efforts depends to a significant degree on donor behaviour, while several dimensions of alignment depend on actions by countries. Because of this interdependence, the baseline situation in a country can be significantly influ-enced by the size and composition of the country’s donor community. The reverse also applies. The baselines for each donor agency will be affected by the pattern of its engage-ment across countries. In presenting the results, this chapter takes into account the possible influence of this type of factor along with other limitations on comparability across coun-tries and across donors, such as variations in reporting.
1 KEY FINDINGS FROM THE SURVEY
ACRONYMS
AER Aid Effectiveness Review
CDF Comprehensive Development F ramework
CFAA Country Financial Accountability Assessment
CPIA Country Policy and Institutional Assessment
DBS direct budget support
HAP Harmonisation Action Plan
IDA International Development Association
LICUS Low-Income Countries Under Stress
MTEF medium-term expenditure framework
NDS National Development Strategy
ODA official development assistance
PAF performance assessment framework
PBA programme-based approach
PEFA Public Expenditure and Financial Accountability
PFM public financial management
PIU project implementation unit
PRSP Poverty Reduction Strategy Paper
PRS Poverty Reduction Strategy
SWAp sector-wide approach
TC technical co-operation

OWNERSHIP
OWNERSHIP IS THE FIRST of the five thematic head-ings of the Paris Declaration – the apex of a conceptual pyramid whose other building blocks are aid alignment, aid harmonisation, managing for results and mutual accountability (Figure 1.1). It comes first because experience shows that aid is most effective when it supports countries’ own development efforts and policies to which leaders, officials and citizens of the country are truly committed. It is less effective where the policies are donor-driven.
The eventual state of affairs visualised by the Paris Declaration is one in which partner coun-tries exercise effective leadership over their devel-opment policies and strategies, and co-ordinate the efforts of development actors working in the national territory. This obviously has several dimensions, some easily measured or assessed and others not.
The degree to which governments take the lead in co-ordinating aid-funded activities is the subject of a specific commitment in the Paris Declaration. It is also a variable that seems to be subject to significant changes over time. Another dimen-sion of ownership is the degree to which coun-tries have development strategies that are clear and well operationalised, so that development efforts are effective and there is a robust basis for the alignment of aid with country policies. This is the focus of Indicator 1 of the baseline survey. The following discussion focuses mainly on these two linked dimensions of ownership.
LEADERSHIP IN AID CO-ORDINATION
Both the survey returns and the World Bank sources (CDF Progress Report and AER) suggest that governments are more inclined and capable than they were only a few years ago to assume a leadership role in aid co-ordination. This seems to be true both in aid-dependent countries such as Mali or Tanzania and in those that rely to a more limited extent on external grant funding, such as Peru. The trend initiated during the piloting of the CDF – that of holding Consultative Group meetings in country, with the national govern-ment co-chairing the event – has become more common. Increasingly, government officials also convene sector working groups or round tables and thereby exercise a leadership role in rela-tion to donors in sectors, although this remains much more common in the health and educa-tion sectors than in fields where policies and aid efforts are more diffuse. Little by little, govern-ments are prepared to set frameworks with which they expect donors to comply.
Indicators of the willingness and ability of coun-tries to assert themselves in this way are included in other sections of the survey that consider the degree to which aid data are captured in the national budget or the government accounts (Indicators 3 and 7) and the use of programme-based approaches, for which a country-led policy framework is a necessary condition (Indicator 9). The discussion of these variables points to the degree to which country leadership is in part a
FIGURE 1.1: The Aid Effectiveness Pyramid
16 .2006 SURVEY ON MONITORING THE PARIS DECLARATION: OVERVIEW OF THE RESULTS - ISBN 978-92-64-01965-2 - ©OECD 2007
OWNERSHIP Partner countries
ALIGNMENT Donors-partners
HARMONISATION Donors-donors
MANAGING FOR RESULTS
PARTNERS SET THE AGENDA
ALIGNING WITH PARTNERS’
AGENDA
USING PARTNERS’ SYSTEMS
SHARING INFORMATION
SIMPLIFYING PROCEDURES
ESTABLISHING COMMON
ARRANGEMENTS
1
2
3
5
4
MU
TUA
L ACCO
UN
TABILITY

172006 SURVEY ON MONITORING THE PARIS DECLARATION: OVERVIEW OF THE RESULTS - ISBN 978-92-64-01965-2 - ©OECD 2007
function of donors’ willingness to give up some of their independence of action. However, donors cannot by themselves create this (or any other) aspect of country ownership. The interest of the country’s senior officials and, most importantly, its politicians in setting the agenda for devel-opment efforts is a variable that is not directly captured by any of the Paris Declaration indica-tors but is crucial to the whole venture.
OPERATIONAL DEVELOPMENT STRATEGY
The 2005 CDF Progress Report upon which the survey report draws for Indicator 1 specifies that an operational strategy calls for: a coherent long-term vision and a medium-term strategy derived from it; specific targets serving a holistic, balanced and well-sequenced development strategy; and capacity and resources for its implementation. While the necessary components of a robust development policy framework can be described in a number of different ways, this approach from the World Bank is largely commonsensical and ought to be widely accepted. It gives significant weight to the provision of resources for implemen-tation, as well as to prioritisation and sequencing and the derivation of medium-term objectives from a long-term vision. The scoring reflects the weighting of these different concerns.
Chart 1.1 shows the distribution for Indicator 1 of the countries that were both included in the baseline survey and covered by the CDF Progress Report. The CDF exercise only covered International Development Association (IDA)-eligible countries and LICUS (Low-Income Countries Under Stress) that prepared a Poverty
Reduction Strategy Paper (PRSP) or Interim PRSP. Appendix Table A.1 provides more detail. The country profiles on which the scores are based have been updated for the purposes of the forthcoming AER, and some of the placing may change as a result. However, in 2005 the posi-tion was that only five countries, or 17% of the total, had national development strategies consid-ered “largely developed towards achieving good practice” (category B). There were no cases of strategies considered to “substantially achieve good practice” (category A). From the country descriptions, it is clear that this reflects some rather general patterns of strength and weakness in country policy frameworks.
In very many cases – including virtually all IDA countries that have prepared PRSPs – govern-ments have produced documents that begin with a vision and derive from it a medium-term policy framework consisting of broad fields or “pillars” of development effort. Increasingly, the strategies are comprehensive and reasonably well balanced, but they tend to fall down on prioritisation and sequencing. The latter are the key features needed for a realistic implementation plan, given human and material resource constraints. Some countries do have costed targets and operational priorities. However, it is not always the case that these are well specified in terms of government activities, or that there are mechanisms ensuring that prior-itised activities actually get the required resources and implementation capacities. This depends on the linkage of the strategy to a fiscal policy and budget process that raise new resources, reallocate existing resources and stimulate the
CHART 1.1: Do countries have operational development strategies?
INDICATOR 1
A
B
E NDS reflects little action toward achieving good practice.
NDS incorporates some elements of good practice.
NDS reflects action taken towards achieving good practice.
NDS is largely developed towards achieving good practice.17%5
0
0
18
6 21%
62% C
D
SCORENO. OF COUNTRIES CATEGORIES
National Development Strategy (NDS) substantially achieves good practice
Source: World Bank CDF Progress Report for 2005.
LOWER SCORE �
HIGHER SCORE �
Operational value of national development strategies

18 2006 SURVEY ON MONITORING THE PARIS DECLARATION: OVERVIEW OF THE RESULTS - ISBN 978-92-64-01965-2 - ©OECD 2007
THE PARIS DECLARATION visualises a situation in which donors base their support fully on partner countries’ development strategies, institutions and procedures. Experience suggests that aid that is well aligned – with country-owned policies on the one hand and with country systems on the other – makes a bigger contribution to develop-ment than aid that is donor-driven and frag-mented. As with ownership, alignment has several dimensions, and measuring it is challenging. Today bilateral and multilateral donors with few exceptions base their support in at least a general way on established country policy frameworks, be these Poverty Reduction Strategies (PRSs), national plans or sector strategies. However, donor choices are only significantly restricted if the strategies are quite well prioritised and trans-lated into definite activities, which is the excep-tion rather than the rule. For this reason, the monitoring plan of the Paris Declaration aims to set some measures of progress on alignment that demand a greater effort on the part of donors and imply more than a formal acknowledgement of country policies.
The commitments on alignment are mutual, and some of them call for joint action by donors and governments. It is recognised that policy align-ment needs to develop alongside the operation-alisation of the country’s development vision, so that the two processes reinforce each other. At the same time, alignment of aid with country systems entails both efforts by governments to improve the reliability of those systems and efforts by donors to remove barriers to their utilisation that origi-nate in agency rules or operational habits. For this reason, the Paris Declaration demands a stepping up of the pace of change on several aspects of aid alignment, but the specific targets to be achieved by 2010 take into account the baseline situation regarding the reliability of country systems.
BUILDING RELIABLE COUNTRY SYSTEMS
Indicator 2 will eventually cover two aspects of country systems, public financial management (Indicator 2a) and procurement (Indicator 2b). In each case, the focus will be on the degree to which existing systems adhere to broadly accepted good practices or there is a reform programme
efficient use of resources for priority purposes. Operationalisation in these senses is often partic-ularly weak at local tiers of government.
The agreed target for this indicator is to raise the proportion of partner countries with largely or substantially developed operational strategies (category A or B) to 75%. The baseline numbers suggest that this is a difficult challenge, but not a completely unrealistic one. Encouragingly, three out of the five countries rated B in 2005 are countries that have been in the vanguard of the PRSP initiative, having submitted three annual progress reports and a second-generation PRSP by the end of 2006.
The main factor that would enable more coun-tries to move a step up from their 2005 ratings is a commitment by governments to using their central resource allocation instrument, the national budget, in a more vigorous and consis-tent way to support agreed policy priorities. Technical improvements in budget preparation and execution will help in this respect. In partic-ular, the use of medium-term expenditure frame-works (MTEFs) is commonly seen as a key to improving plan-budget linkage. However, this is only the case when the MTEF is used as a policy instrument, steering annual budgets in desired directions, and it can only work if the policy priorities are agreed. The benefits from technical improvements in this area are much affected by the position that development occupies among the country leadership’s priorities. In practice, strategies tend to be more operational the closer they are to the driving political concerns of the president, cabinet or governing party.
In summary, the Paris Declaration commitment to strengthening country ownership of develop-ment efforts poses a substantial challenge. The baseline situation, with only 17% of surveyed countries having operational development strate-gies meeting the agreed quality threshold, leaves a great deal to be done if the target proportion of 75% is to be met by 2010. What needs to be done is clear enough. It is also clear that, because the challenges are as much political as technical, the primary impetus for change must come from within countries.
ALIGNMENT

192006 SURVEY ON MONITORING THE PARIS DECLARATION: OVERVIEW OF THE RESULTS - ISBN 978-92-64-01965-2 - ©OECD 2007
in place to promote improved practices. The survey returns and CDF Progress Report and AER country profiles contain some informa-tion on the improvement of country procure-ment systems, and this is reflected in the country chapters. However, no systematic and quantified assessments of procurement-system quality are available at this point. Therefore, this overview focuses on public financial management (PFM).
The assessment of PFM systems is based on a component of the World Bank’s CPIA. CPIA Indicator 13 is a measure of the quality of a coun-try’s budget and financial management system. It assesses the degree to which the country’s arrangements include:■ A comprehensive and credible budget
linked to policy priorities.■ Effective financial management systems for
budget expenditure and budget revenues.■ Timely and accurate fiscal reporting.■ Clear and balanced assignment of
expenditures and revenues to each level of government.
Previously not in the public domain, CPIA ratings are now published by the Bank for IDA-eligible countries only. Appendix Table A.2 shows the 2005 scores for the surveyed countries covered by the published assessments. Chart 1.2 shows the distribution across the scores. The bulk of the countries covered are within or between the
1.0 Very weak (PFM systems)
1.5
2.0 Weak
5.0 Strong
3.5
28%
3%
0%
0%
0%
38%
17% 3.0 Moderately weak
2.5
4.0 Moderately strong
5.5
6.0 Very strong
4.5
10%
3%
0%
0%
1
0
0
0
8
11
5
3
1
0
0
SCORENO. OF COUNTRIES CATEGORY
Source: World Bank Country Policy and Institutional Assessment (CPIA), 2005.
LOWER SCORE ▲
HIGHER SCORE ▼
Quality of country public financial management systems
Moderately weak and Moderately strong catego-ries. Some 31% of the countries have systems considered at least moderately strong. The Paris Declaration target is that half of partner coun-tries move up at least half a point by 2010.
The published CPIA information does not break the scores down by component. However, from the survey returns and CDF Progress Report and AER profiles, it is possible to identify for each country the areas in which PFM reform efforts are in place and are having effects, as well as the areas of continuing weakness. The general picture is that joint exercises such as Country Financial Accountability Assessments (CFAAs) and increasingly Public Expenditure and Financial Accountability (PEFA) assessments are now being widely undertaken, leading to the adop-tion by governments of action plans for PFM improvement. The countries scoring at the higher end of the central range from 2.0 to 4.5 are those that have made most headway in ensuring the national budget is a credible estimate of actual revenues and expenditures, and in providing a mechanism linking budget formulation and execution to formally agreed policy priorities. Those countries usually have technical systems that assist in the management and reporting of financial flows between sector and tiers of government. However, the main requirement is not technical. A significant political will seems to lie behind most successful efforts to improve
CHART 1.2: How reliable are country public financial systems?
INDICATOR 2a

20 2006 SURVEY ON MONITORING THE PARIS DECLARATION: OVERVIEW OF THE RESULTS - ISBN 978-92-64-01965-2 - ©OECD 2007
PFM systems. In a number of survey countries, the key barrier to an improved score seems to lie in financial management at sub-national levels.
To summarise, it is again relatively clear what is needed for countries to achieve progress in this area: decisive leadership. On experience, moving a country half a point up the CPIA PFM scale is an attainable objective so long as political leaders recognise the importance of credible public finances to their countries’ future and transmit this message to their officials. The biggest chal-lenge will be ensuring that these steps are taken by at least half of the partner countries included in the surveys.
ALIGNING AID FLOWS WITH NATIONAL PRIORITIES
Indicator 3 assumes that donors orient their aid in a broad way to the objectives set out in a PRS or national or sectoral development plan, and goes on to ask the more specific and telling question of how well external financial flows are reflected in the national budget. As noted above, there is some doubt about the ability of national development strategy to govern the actual allocation and use of resources in a good many partner countries. There may also be questions about the credibility of the budget. Nevertheless, the formulation of the budget is a central feature of the formal policy
process in all countries. So the degree to which donor financial contributions to the government sector are fully and accurately reflected in the budget provides a relevant indicator of the degree to which there is a serious effort to connect aid with country policies and policy processes. The indicator is the percentage of aid disbursements to the government sector reported by donors that is included in the budget estimates for the same financial year. The target is to halve the propor-tion of aid disbursements to the government sector not included in the budget by 2010, with at least 85% reported on budget.
Appendix Tables A.3 and B.3 show the raw numbers for aid disbursements and aid included in the budget, by country and by donor. These show that there are discrepancies in both direc-tions, as budgets both under-include aid flows and over-include them. In other words, budgets are unrealistic in two opposite directions. This needs to be taken into account in assessing the baseline position against which future progress will be measured.
If one focuses on the size of the discrepancies (leaving aside their direction), one gets a measure of the overall extent to which budgets are realistic in respect of disbursed aid. The baseline ratio is 88% (Table A.3). Chart 1.3 shows the individual averages for countries and donors respectively.
0%
20%
40%
60%
80%
100%
0%
20%
40%
60%
80%
100%
Aid recorded in countries’ national budgets as a percentage of donors’ disbursements
Donor-by donorCountry-by-country
In 6 countries, less than 50% of aid is recorded in the budget.
In the case of 6 donors, less than 50% of their aid is recorded in national budgets.
2010 target: 85% of aid recorded on budget
2010 target: 85% of aid recorded on budget
34 COUNTRIES LARGEST 22 DONORS
CHART 1.3: Do national budgets record aid realistically and comprehensively?
INDICATOR 3
212006 SURVEY ON MONITORING THE PARIS DECLARATION: OVERVIEW OF THE RESULTS - ISBN 978-92-64-01965-2 - ©OECD 2007
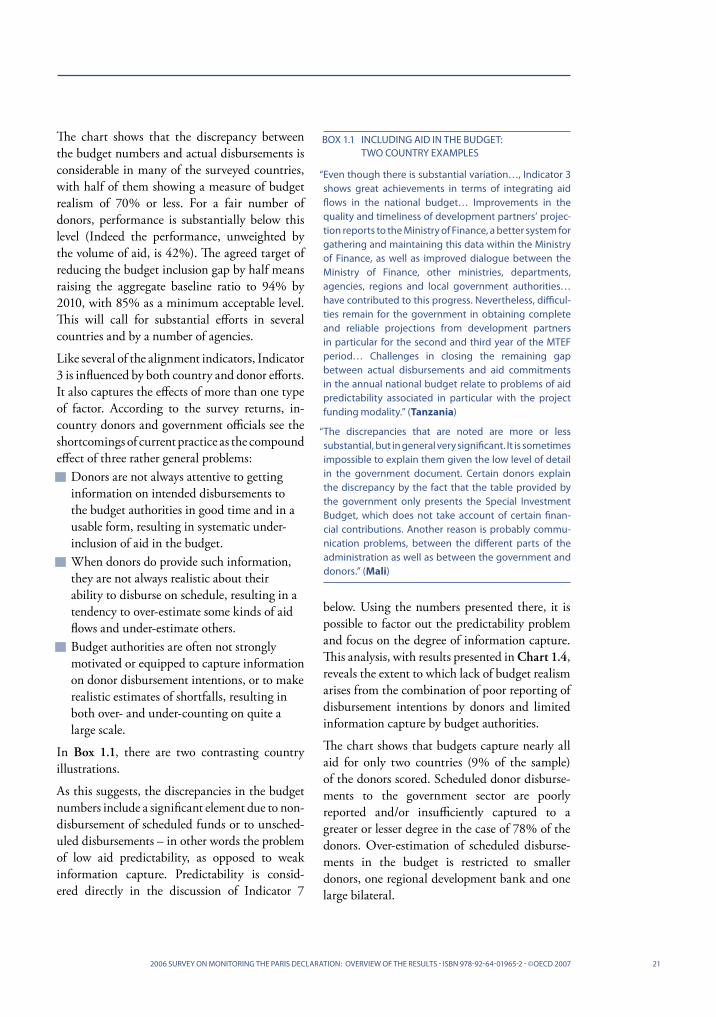
The chart shows that the discrepancy between the budget numbers and actual disbursements is considerable in many of the surveyed countries, with half of them showing a measure of budget realism of 70% or less. For a fair number of donors, performance is substantially below this level (Indeed the performance, unweighted by the volume of aid, is 42%). The agreed target of reducing the budget inclusion gap by half means raising the aggregate baseline ratio to 94% by 2010, with 85% as a minimum acceptable level. This will call for substantial efforts in several countries and by a number of agencies.
Like several of the alignment indicators, Indicator 3 is influenced by both country and donor efforts. It also captures the effects of more than one type of factor. According to the survey returns, in-country donors and government officials see the shortcomings of current practice as the compound effect of three rather general problems:■ Donors are not always attentive to getting
information on intended disbursements to the budget authorities in good time and in a usable form, resulting in systematic under-inclusion of aid in the budget.
■ When donors do provide such information, they are not always realistic about their ability to disburse on schedule, resulting in a tendency to over-estimate some kinds of aid flows and under-estimate others.
■ Budget authorities are often not strongly motivated or equipped to capture information on donor disbursement intentions, or to make realistic estimates of shortfalls, resulting in both over- and under-counting on quite a large scale.
In Box 1.1, there are two contrasting country illustrations.
As this suggests, the discrepancies in the budget numbers include a significant element due to non-disbursement of scheduled funds or to unsched-uled disbursements – in other words the problem of low aid predictability, as opposed to weak information capture. Predictability is consid-ered directly in the discussion of Indicator 7
below. Using the numbers presented there, it is possible to factor out the predictability problem and focus on the degree of information capture. This analysis, with results presented in Chart 1.4, reveals the extent to which lack of budget realism arises from the combination of poor reporting of disbursement intentions by donors and limited information capture by budget authorities.
The chart shows that budgets capture nearly all aid for only two countries (9% of the sample) of the donors scored. Scheduled donor disburse-ments to the government sector are poorly reported and/or insufficiently captured to a greater or lesser degree in the case of 78% of the donors. Over-estimation of scheduled disburse-ments in the budget is restricted to smaller donors, one regional development bank and one large bilateral.
BOX 1.1 INCLUDING AID IN THE BUDGET: TWO COUNTRY EXAMPLES
“ Even though there is substantial variation…, Indicator 3 shows great achievements in terms of integrating aid flows in the national budget… Improvements in the quality and timeliness of development partners’ projec-tion reports to the Ministry of Finance, a better system for gathering and maintaining this data within the Ministry of Finance, as well as improved dialogue between the Ministry of Finance, other ministries, departments, agencies, regions and local government authorities… have contributed to this progress. Nevertheless, difficul-ties remain for the government in obtaining complete and reliable projections from development partners in particular for the second and third year of the MTEF period… Challenges in closing the remaining gap between actual disbursements and aid commitments in the annual national budget relate to problems of aid predictability associated in particular with the project funding modality.” (Tanzania)
“ The discrepancies that are noted are more or less substantial, but in general very significant. It is sometimes impossible to explain them given the low level of detail in the government document. Certain donors explain the discrepancy by the fact that the table provided by the government only presents the Special Investment Budget, which does not take account of certain finan-cial contributions. Another reason is probably commu-nication problems, between the different parts of the administration as well as between the government and donors.” (Mali)

22 2006 SURVEY ON MONITORING THE PARIS DECLARATION: OVERVIEW OF THE RESULTS - ISBN 978-92-64-01965-2 - ©OECD 2007
The differences across donors may reflect not so much failure of notification as the different degrees to which donors are engaged in countries where information capture by the budget authorities is weak. The detailed figures nonetheless reveal quite striking differences among agencies that are involved in similar numbers and types of countries.
To summarise, meeting the Paris objective will call for a concerted assault on several distinct problems which together compromise the ability of the budget to serve as a full and accurate record of donor financial contributions. They include failures of both information supply and infor-mation capture in regard to donor disbursement intentions. They also include lack of realism, on the part of the donors, the budget authorities or both, about the prospects of funds being disbursed on schedule. The precise focus of the necessary efforts will vary somewhat among countries and among modalities of aid delivery. Almost every-where, however, action will be needed from both donors and country authorities.
0%
50%
100%
150%
125%
75%
25%
14 donorsAid in budget is less than scheduled
5 donorsAid in budget is “about” what was scheduled
3 donorsAid in budget is more than what was scheduled
Aid recorded in budgets as a percentage of donors’ scheduled disbursements
LARGEST 22 DONORS
Definition of accurate reporting
This chart tells us how many donors have their scheduled aid accurately reported in budgets.
In practice, aid recorded in budgets is usually less or much less than what donors expect to disburse. In this case (ratio less than 80%), scheduled aid is said to be under-reported.Less frequently, aid recorded in budgets is more or much more than what donors expect to disburse (ratio more than 120%). In this case, scheduled aid is over-reported.Aid is reported accurately when aid recorded in budget matches aid scheduled for disbursement by donors (ratio between 80% and 120%).
CHART 1.4: Do budgets report donor disbursement plans realistically?
CO-ORDINATING SUPPORT TO STRENGTHEN CAPACITY
In the Paris Declaration, capacity improvements are seen critical to improving development results as well as to achieving objectives of ownership, aid alignment and mutual accountability. It is increasingly recognised that capacity develop-ment involves changes in institutional rules and organisational systems, not just training and the transfer of expertise. Likewise, successful capacity development is seen as necessarily endogenous – led by country actors with clear objectives, making effective use of existing capacities and harmonising external support within this frame-work. Indicator 4 focuses on the extent to which donor technical co-operation – as one input into capacity development – is moving towards this country-led model. Donor survey respondents were asked to identify technical co-operation support meeting all of four criteria:■ The programmes support partners’ national
development strategies.■ Partner countries exercise effective leadership
over the capacity development programme supported by donors, implying clearly communicated objectives from senior officials.
■ Donors integrate their support within country-led programmes to strengthen capacity development.

232006 SURVEY ON MONITORING THE PARIS DECLARATION: OVERVIEW OF THE RESULTS - ISBN 978-92-64-01965-2 - ©OECD 2007
The aggregate baseline figure of 48% for this indicator (Appendix Tables A.4 and B.4) might suggest that little needs to be done to achieve the target. However, that would not be a valid conclusion. As Chart 1.5 reveals, the dispersion of the results both by country and by donor is far greater than can plausibly be explained by real differences in co-ordination levels. Conceptual differences leading to divergences in reporting are a more likely explanation.
■ Where more than one donor is involved, arrangements for co-ordinating donor contributions are in place (for example, pooling of resources).
The agreed target is to have 50% of technical co-operation in co-ordinated programmes, defined in this way, by 2010.
As the country chapters explain, several National Co-ordinators took the view that in 2005 there were no technical co-operation programmes in the country meeting all four criteria, making the true baseline zero percent. The element most often missing was effective country leadership based on a specific strategic vision for capacity development. Donor respondents, on the other hand, took the view (sometimes individually and sometimes jointly and with government assent) that the definition in the survey guidance was too stringent. Very different views emerged on what should count as co-ordination and as government leadership. The numbers generated by the survey therefore include technical co-operation efforts that are co-ordinated in a relatively loose sense, with the accent on consistency with the relevant policy framework (e.g. a sector strategy or PFM action plan) rather than on the presence of a specific country initiative for capacity develop-ment. Box 1.2 illustrates.
0%
25%
50%
100%
75%
2010 target: 50% of co-ordinated TC
In 15 countries, less than 30% of TC is co-ordinated.
0%
25%
50%
100%
75%
2010 target: 50% of co-ordinated TC
In the case of 6 donors, less than 30% of their TCis co-ordinated.
Co-ordinated technical assistance as a percentage of total technical co-operation (TC)
Donor-by-donor Country-by-country
34 COUNTRIES LARGEST 22 DONORS
CHART 1.5: How much technical assistance is co-ordinated through country programmes?
INDICATOR 4
BOX 1.2 WHAT IS CO-ORDINATED CAPACITY DEVELOPMENT? THREE COUNTRY APPROACHES
“ The government will dedicate itself in the framework of sectoral dialogue with donors to… define the co-ordinated programmes of capacity strengthening needed to improve the impact of the sector programmes.” (Burkina Faso)
“ All the development partners complained about the difficulties of interpretation of the “co-ordinated technical assistance”. Most of the donors considered technical assistance agreed with the government as co-ordinated… Some donors considered the bulk or all of their assistance as co-ordinated.” (Ghana)
“ In the Nicaraguan case, it has been considered that technical co-operation… that can be included as co-ordinated is that which is supporting priorities explicitly defined by the government, sector approaches or other programme-based approaches. This co-ordination will have been formalised in a document (for example, a bilateral agreement, a memorandum of understanding or resolution of a sector working group).” (Nicaragua)

24 2006 SURVEY ON MONITORING THE PARIS DECLARATION: OVERVIEW OF THE RESULTS - ISBN 978-92-64-01965-2 - ©OECD 2007
This is unfortunate from the point of view of establishing a robust baseline. The survey results on Indicator 4 provide a benchmark against which future progress can be measured only if each agency and country applies the same standards of assessment year by year. This will be difficult to ensure. On the other hand, the results may be seen as providing a welcome wake-up call to the international community. The Paris Declaration’s vision of the future needs of capacity develop-ment is clearly not just unfinished business, but business that has barely begun.
In summary, the baseline position regarding the Paris Declaration commitments on capacity devel-opment is not as favourable as the figure of 48% (against a 2010 target of 50%) might appear to suggest. The survey has revealed quite a profound lack of consensus on valid approaches to capacity development and the meaning of the Paris commit-ments in this area. This should prompt further efforts to disseminate and evaluate the evidence that lies behind the Paris vision. Donors and partners should be reviewing, in the light of this evidence, whether the expectations they currently have of each other and of themselves on this issue are sufficiently far-sighted and ambitious.
USING COUNTRY SYSTEMS
Indicator 5 provides a relatively unambiguous and telling measure of the degree to which systems alignment is taking place. Together with the CPIA rating on PFM quality and the anticipated assessment of procurement systems, it provides a set of realistic targets towards which donors and country authorities may be expected to work together.
This said, the indicator is not entirely free of measurement problems. After thorough review of the data submitted, some concerns remain about the way the survey questions on Indicator 5 were interpreted in some countries and by some donors. For example, for several countries it is not clear that all of the programmes included as using country budget execution systems are accurately described as “subject to normal country budgetary execution procedures, namely procedures for authorisation, approval and payment” (as specified in the survey’s Definitions and Guidance paper). There are also some grey areas affecting the inter-pretation of the indicator. For example, authorisa-tion procedures that are formally those laid down in the country’s laws and public-sector financial regulations can be subject to a large degree of de jure or de facto delegation, meaning that the “use of country systems” is somewhat nominal. Together, these factors may mean that the numbers overstate somewhat the effective use of country systems.
31%Auditing
31%Financial reporting
38%Budget execution
� Use of PFM systems
� Use of procurement systems
0%
20%
20%
40%
40%
60%
80%
60%
80%
Use of country systems as a percentage of aid for governmentCountry-by-country
Use of country PFM systems broken down by component
34 COUNTRIES
CHART 1.6: How much aid for the government sectors uses country systems?
INDICATOR 5
252006 SURVEY ON MONITORING THE PARIS DECLARATION: OVERVIEW OF THE RESULTS - ISBN 978-92-64-01965-2 - ©OECD 2007
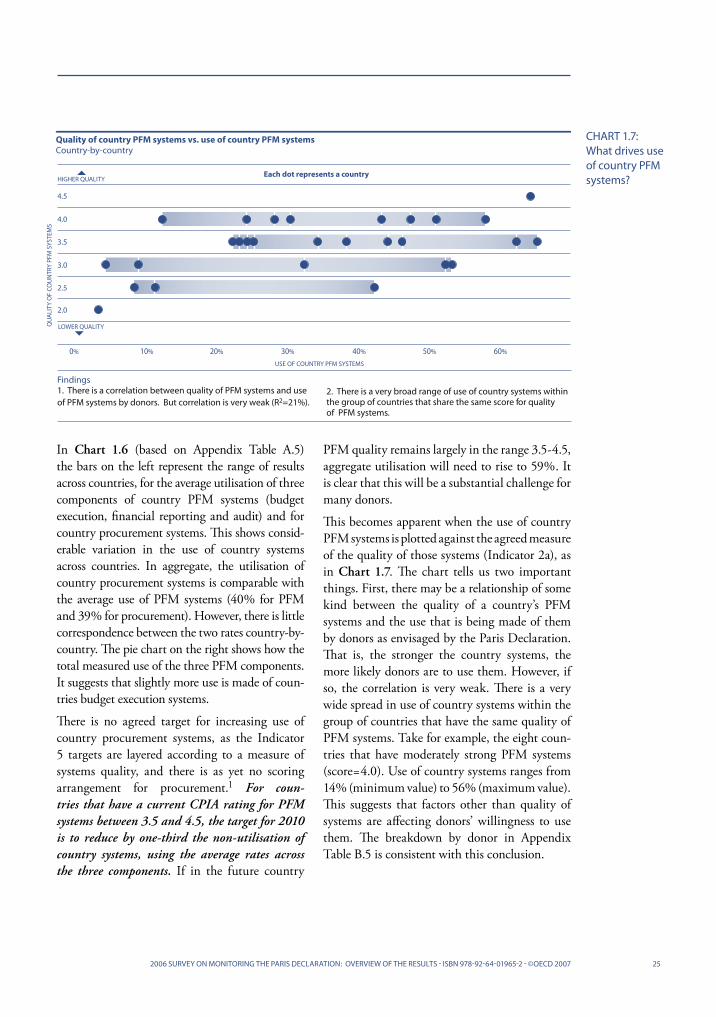
In Chart 1.6 (based on Appendix Table A.5) the bars on the left represent the range of results across countries, for the average utilisation of three components of country PFM systems (budget execution, financial reporting and audit) and for country procurement systems. This shows consid-erable variation in the use of country systems across countries. In aggregate, the utilisation of country procurement systems is comparable with the average use of PFM systems (40% for PFM and 39% for procurement). However, there is little correspondence between the two rates country-by-country. The pie chart on the right shows how the total measured use of the three PFM components. It suggests that slightly more use is made of coun-tries budget execution systems.
There is no agreed target for increasing use of country procurement systems, as the Indicator 5 targets are layered according to a measure of systems quality, and there is as yet no scoring arrangement for procurement.1 For coun-tries that have a current CPIA rating for PFM systems between 3.5 and 4.5, the target for 2010 is to reduce by one-third the non-utilisation of country systems, using the average rates across the three components. If in the future country
PFM quality remains largely in the range 3.5-4.5, aggregate utilisation will need to rise to 59%. It is clear that this will be a substantial challenge for many donors.
This becomes apparent when the use of country PFM systems is plotted against the agreed measure of the quality of those systems (Indicator 2a), as in Chart 1.7. The chart tells us two important things. First, there may be a relationship of some kind between the quality of a country’s PFM systems and the use that is being made of them by donors as envisaged by the Paris Declaration. That is, the stronger the country systems, the more likely donors are to use them. However, if so, the correlation is very weak. There is a very wide spread in use of country systems within the group of countries that have the same quality of PFM systems. Take for example, the eight coun-tries that have moderately strong PFM systems (score=4.0). Use of country systems ranges from 14% (minimum value) to 56% (maximum value). This suggests that factors other than quality of systems are affecting donors’ willingness to use them. The breakdown by donor in Appendix Table B.5 is consistent with this conclusion.
QU
ALI
TY O
F CO
UN
TRY
PFM
SYS
TEM
S
Quality of country PFM systems vs. use of country PFM systemsCountry-by-country
0% 10% 20% 30% 40% 50% 60%
Findings1. There is a correlation between quality of PFM systems and use of PFM systems by donors. But correlation is very weak (R2=21%).
USE OF COUNTRY PFM SYSTEMS
2.0
2.5
3.5
3.0
4.0
4.5
Each dot represents a country
LOWER QUALITY
HIGHER QUALITY
2. There is a very broad range of use of country systems within the group of countries that share the same score for quality of PFM systems.
CHART 1.7: What drives use of country PFM systems?

26 2006 SURVEY ON MONITORING THE PARIS DECLARATION: OVERVIEW OF THE RESULTS - ISBN 978-92-64-01965-2 - ©OECD 2007
Although the survey data do not allow us to confirm this, it seems likely that the use of country PFM systems has increased in recent years as a result of the movement towards general or sector budget support. In a number of coun-tries covered by the survey, budget support or a few large programmes account for almost all of the use of country systems. There are different ways of viewing this. It could be interpreted as a sign of movement towards Paris Declaration objectives. However, it could be taken to indi-cate that there is little commitment to the use of country systems among donors other than those providing budget support.
To summarise, the degree to which donors make use of country PFM systems is highly variable, and little of the variation is explained by differences in the measured quality of the systems. If, as 2010 approaches, some donors continue to make little use of country systems even when these are rated by the CPIA as comparatively strong, the overall performance targets on this indicator will be hard to meet, and donor seriousness about one of the fundamental Paris Declaration commit-ments will be open to question.
AVOIDING PARALLEL IMPLEMENTATION STRUCTURES
The Paris Declaration invites donors to “avoid, to the maximum extent possible, creating dedi-cated structures for day-to-day management and implementation of aid-financed projects and programmes”. Indicator 6 is a count of parallel project implementation units (PIUs), where “parallel” refers to having been created outside existing country institutional structures. The survey guidance makes a distinction between PIUs and executing agencies and gives three typical features of parallel PIUs:■ They are accountable to the external funding
agencies rather than to the country imple-menting agencies (ministries, departments, agencies, etc.).
■ Most of the professional staff are appointed by the donor.
■ The salary of PIU personnel often exceeds that of civil-service personnel.
Interpretation of the survey question on this subject was controversial in a number of coun-tries. It is not clear that within countries all donors applied the same criteria with the same degree of rigour, or that across countries the same standards were used. In a number of cases, the descriptive part of the survey return indicates that some donors applied a legalistic criterion of accountability to the formal executing agency, whereas the National Co-ordinator or other donors would have preferred a greater recognition of the substantive reality of accountability to the
BOX 1.3 PARALLEL PIUs: NATIONAL CO-ORDINATORS’ VIEWS
“ The donors have encountered problems with the defini-tion provided… 7 donors out of 14 reported a total of 24 parallel PIUs… This information, however, may not reflect the full extent of the parallel structures used... (T)here is no system for recording them.” (Ghana)
“ The PIU modality that is most common... is that of pro-jects and programmes under the responsibility of two co-directors, one national and one nominated by the donor. While it could be argued that this is a case of a semi- integrated PIU… it is thought that it is most common that the management… falls almost exclusively to the team that reports to the donor.” (Peru)
“ It has been found difficult to agree on the definition of a “parallel unit”, which has led to very diverse and varied responses, and changes to responses… In future, it is recommended that the survey follows either the interna-tional definitions of the OECD-DAC or definitions that are appropriate to our national context.” (Senegal)
“ Some partners are making an effort to move away from the use of parallel PIUs. For example, the World Bank-financed projects on public financial management and rural education… integrate some of their functions in the respective ministries. However, these units still cannot be considered integrated because they are not component parts of an existing institutional structure; salary amounts exceed those of public employees and the donor is ultimately the one who takes the final deci-sion….” (Moldova)
“ The principal problem in reducing PIUs is the need to reduce at the same time the use of procedures that are not those of the country. If a PIU is eliminated but the co-operation agency continues to require use of its procedures, the government departments will be over-loaded with work….” (Nicaragua)

272006 SURVEY ON MONITORING THE PARIS DECLARATION: OVERVIEW OF THE RESULTS - ISBN 978-92-64-01965-2 - ©OECD 2007
donor. It seems possible that some respondents allowed themselves to confuse the definitional question (is the unit “parallel”?) with the aid-management question (is the parallelism justi-fied in terms of the developmental benefits and costs?). Box 1.3 provides some illustrations.
The effect is that parallel PIUs have probably been under-counted. Nevertheless, as with other alignment measures, the survey has helped to spark a local debate on the subject, and it is to be expected that in the future it will be more common to hear conscious and explicit consid-eration of the trade-offs between project effec-tiveness and strengthening mainstream project management capacities, when projects and programmes are being designed.
The overall target is to reduce the baseline stock of 1 832 parallel PIUs by two-thirds, to only 611, by 2010. As Appendix Table A.6 and the left-hand side of Chart 1.8 reveal, there is considerable varia-tion in the current count across countries, no doubt reflecting differences in criteria as well as in the scale of aid disbursements. Each country is expected to contribute proportionally to the targeted reduc-tion, whatever the basis for the baseline number. Appendix Table B.6 and the right-hand side of the chart confirm that reported parallel PIUs per country vary a good deal by donor.
0
4
2
8
6
10
12
14
0
25
50
75
100
125
150
4 countries have more than 100 parallel PIUs
� Multilateral donor� Bilateral donor
Number of parallel PIUsCountry-by-country
Average number of parallel PIUs per countryDonor-by-donor
34 COUNTRIES LARGEST 22 DONORS
CHART 1.8: How many PIUs are parallel to country structures?
INDICATOR 6
Closer analysis shows that in a few cases, these numbers appear to be in reasonable proportion to the aid disbursed per country. However, this is not always the case, with a small number of large agencies reporting a disproportionate number of parallel PIUs. These organisations may be expected to re-examine the reasons for their continued use of parallel systems. Donor organisations that have, for one reason or another, reported only a small number of projects as currently managed by parallel units face a different sort of challenge. They will be expected to show more progress in reducing the gap.
The evidence brought together by the survey suggests that there is a will to change. A number of large agencies, including the World Bank and the European Commission, are frequently cited as planning to merge existing PIUs into the structures of ministries or agencies, with exam-ples given. However, change will not be easy. The principal hurdles cited in the survey returns include the backlog of projects that were originally set up with very little concern for alignment and ownership goals, the interest of PIU employees and parent ministries in the employment condi-tions and fringe benefits that parallel units permit, and the unwillingness of results-conscious external funding agencies to compromise on the quality of project implementation.
28 2006 SURVEY ON MONITORING THE PARIS DECLARATION: OVERVIEW OF THE RESULTS - ISBN 978-92-64-01965-2 - ©OECD 2007
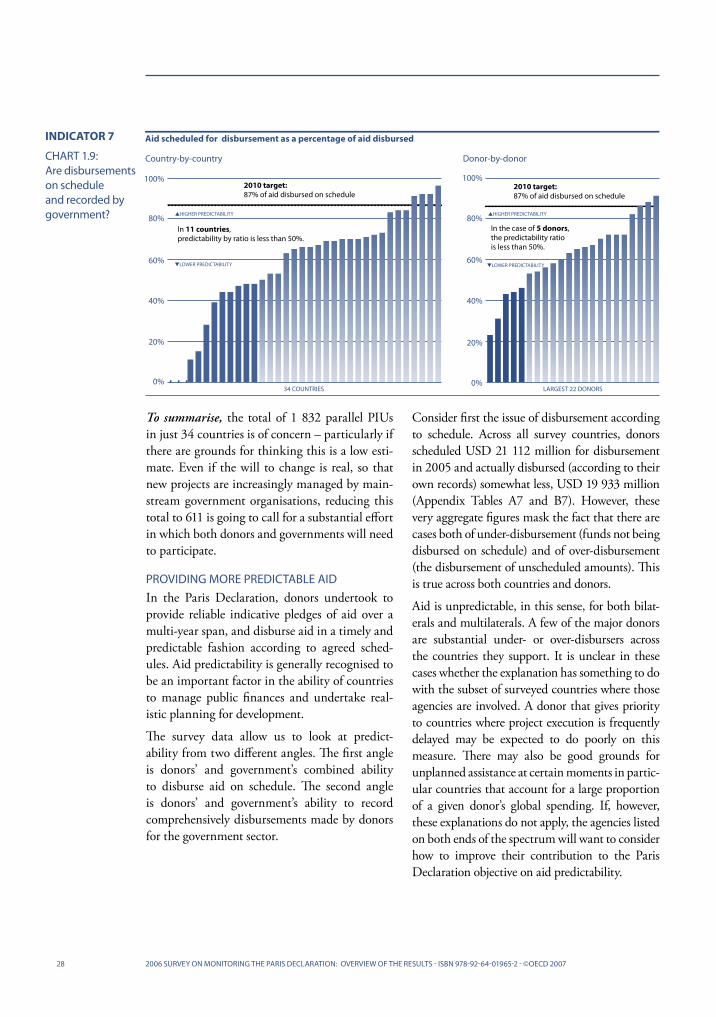
To summarise, the total of 1 832 parallel PIUs in just 34 countries is of concern – particularly if there are grounds for thinking this is a low esti-mate. Even if the will to change is real, so that new projects are increasingly managed by main-stream government organisations, reducing this total to 611 is going to call for a substantial effort in which both donors and governments will need to participate.
PROVIDING MORE PREDICTABLE AID
In the Paris Declaration, donors undertook to provide reliable indicative pledges of aid over a multi-year span, and disburse aid in a timely and predictable fashion according to agreed sched-ules. Aid predictability is generally recognised to be an important factor in the ability of countries to manage public finances and undertake real-istic planning for development.
The survey data allow us to look at predict-ability from two different angles. The first angle is donors’ and government’s combined ability to disburse aid on schedule. The second angle is donors’ and government’s ability to record comprehensively disbursements made by donors for the government sector.
Consider first the issue of disbursement according to schedule. Across all survey countries, donors scheduled USD 21 112 million for disbursement in 2005 and actually disbursed (according to their own records) somewhat less, USD 19 933 million (Appendix Tables A7 and B7). However, these very aggregate figures mask the fact that there are cases both of under-disbursement (funds not being disbursed on schedule) and of over-disbursement (the disbursement of unscheduled amounts). This is true across both countries and donors.
Aid is unpredictable, in this sense, for both bilat-erals and multilaterals. A few of the major donors are substantial under- or over-disbursers across the countries they support. It is unclear in these cases whether the explanation has something to do with the subset of surveyed countries where those agencies are involved. A donor that gives priority to countries where project execution is frequently delayed may be expected to do poorly on this measure. There may also be good grounds for unplanned assistance at certain moments in partic-ular countries that account for a large proportion of a given donor’s global spending. If, however, these explanations do not apply, the agencies listed on both ends of the spectrum will want to consider how to improve their contribution to the Paris Declaration objective on aid predictability.
0%
20%
40%
60%
80%
100%
0%
20%
40%
60%
80%
100%2010 target: 87% of aid disbursed on schedule
In 11 countries, predictability by ratio is less than 50%.
In the case of 5 donors, the predictability ratio is less than 50%.
2010 target: 87% of aid disbursed on schedule
▲HIGHER PREDICTABILITY
▼LOWER PREDICTABILITY
▲HIGHER PREDICTABILITY
▼LOWER PREDICTABILITY
Aid scheduled for disbursement as a percentage of aid disbursed
Donor-by-donorCountry-by-country
34 COUNTRIES LARGEST 22 DONORS
CHART 1.9: Are disbursements on schedule and recorded by government?
INDICATOR 7

292006 SURVEY ON MONITORING THE PARIS DECLARATION: OVERVIEW OF THE RESULTS - ISBN 978-92-64-01965-2 - ©OECD 2007
Consider now the government’s ability to record disbursements. In aggregate terms, govern-ments recorded in their accounting systems only USD 14 861 million of the USD 19 933 million actually disbursed according to donors. For almost all countries and all larger donors, disbursements were under-recorded, sometimes very substan-tially (Appendix Tables A7 and B7). This may reflect failure on the part of donors to notify country authorities in the appropriate way about their disbursements. It may equally reflect the inability of government systems to capture and process the information.
Indicator 7 on predictability has been designed to encourage progress in both of these areas. In other words, it seeks to improve not only the predictability of actual disbursements but also the accuracy of how they are recorded in government accounts – an important feature of ownership, accountability and transparency. It measures the degree to which funds scheduled for disburse-ment within a given year are recorded in govern-ment accounts as disbursed that year, ignoring the direction of any discrepancies. Calculations of this indicator for countries and donors are provided in the final column of Appendix Tables A7 and B7 (the baseline ratio). Chart 1.9 shows the results for countries and donors respectively. It should be reminded that Indicator 7 captures
in-year rather than multi-annual predictability. As a result it is a relatively volatile measure of predictability that is likely to vary considerably from year to year.
The weighted average for this indicator in 2005 was 70% (Table A7). The Paris Declaration objective is gradually to close the gap between this ratio and 100%, reducing it by half – so that the ratio rises to at least 85% – by 2010.
Closing the predictability gap will require donors and government to work increasingly together on various fronts at the same time. Actions might include efforts in improving:■ The realism of predictions on volume and
timing of expected disbursements.■ The way donors notify their disbursements to
government.■ The comprehensiveness of government’s
records of disbursements made by donors.
The particular steps needed to improve predict-ability of aid flows vary among aid modalities as well as across countries. The survey returns include some suggestions that budget support, especially when provided within a multi-year framework and disbursed early in the year, is friendlier to aid predictability than project finance, where imple-mentation delays can be unavoidable. On the other hand, budget support faces predictability problems
0%
25%
50%
75%
100%
0%
25%
50%
75%
100%
In 5 countries, less than 50% of aid is untied.
Share of untied aid
Donor-by-donorCountry-by-country
34 COUNTRIES 15 BILATERAL DONORS
CHART 1.10: How much aid is untied?
INDICATOR 8

30 2006 SURVEY ON MONITORING THE PARIS DECLARATION: OVERVIEW OF THE RESULTS - ISBN 978-92-64-01965-2 - ©OECD 2007
of its own arising from performance-based vari-able tranches, uncompleted prior actions and/or breaches of fundamental principles. If the Paris Declaration target is to be met, actions to reduce the impact of these factors will need to be accom-panied by greater collaboration between donors and the officials responsible for country accounts, so that the latter become progressively more able to record aid flows accurately.
In summary, Indicator 7 is like Indicator 3 in that it captures the joint effects of donor and govern-ment practices. It is influenced by both the ability to disburse funds on schedule, and the extent to which aid can be accurately captured in country accounting systems. The relevant target is not out of reach, but the unweighted average of 41% shows that considerable movement is needed in many donor/partner relationships. As such, a deliberate collaborative effort in each country will be required to meet it.
UNTYING AID
The Paris Declaration reaffirms the 2001 DAC Recommendation on Untying Official Development Assistance to Least Developed Countries and commits the signatories to making strides on this issue. The statistics on the tying status of aid are held by the OECD and are reproduced in the table A.8 (Appendix A). It shows that in the 34 countries 75% of aid is untied as compared to 82% in all the other coun-tries included in the OECD records. Progress on untying will require all bilateral donors to step up their efforts by 2010.
IF DONORS AND GOVERNMENTS were to achieve a complete alignment of aid flows with country-owned policies and country systems, aid harmon-isation would not be an issue. However, as the baseline survey confirms, in the real world align-ment is imperfect – for reasons that have to do with donors and countries. In these circum-stances, aid effectiveness is likely to be enhanced if donors harmonise their actions and adopt as much as possible simple and transparent common procedures.
The baseline survey focuses on just two dimensions of harmonisation: the use of common arrangements within programme-based approaches (PBAs), and conducting joint missions and sharing analysis. Two other groups of commitments on harmonisa-tion are included in the Paris Declaration. There are commitments on increasing donor comple-mentarity on the basis of comparative advantages, with greater use of delegation; and strengthening incentives for collaborative behaviour. The base-line indicators are therefore proxies for a much wider field of commitments on harmonisation.
USING COMMON ARRANGEMENTS
Indicator 9 measures the proportion of aid to the government sector that is disbursed within a programme-based approach. In the survey guid-ance, PBAs are defined in such a way that this proportion is an accurate indicator of the extent to which common arrangements are being used. In the words of the Definitions and Guidance paper, PBAs share all four of the following features:■ Leadership by the host country or
organisation.■ A single comprehensive programme and
budget framework.■ A formalised process for donor co-ordination
and harmonisation of donor procedures for reporting, budgeting, financial management and procurement.
■ Efforts to increase the use of local systems for programme design and implementation, financial management, monitoring and evaluation.
HARMONISATION
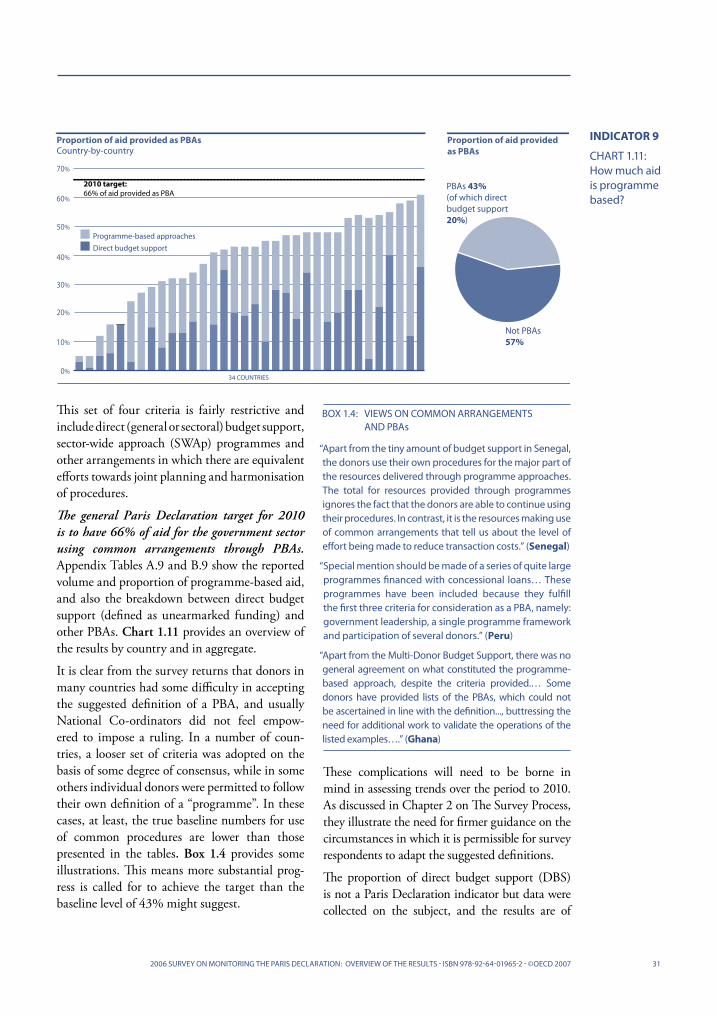
312006 SURVEY ON MONITORING THE PARIS DECLARATION: OVERVIEW OF THE RESULTS - ISBN 978-92-64-01965-2 - ©OECD 2007
BOX 1.4: VIEWS ON COMMON ARRANGEMENTS AND PBAs
“ Apart from the tiny amount of budget support in Senegal, the donors use their own procedures for the major part of the resources delivered through programme approaches. The total for resources provided through programmes ignores the fact that the donors are able to continue using their procedures. In contrast, it is the resources making use of common arrangements that tell us about the level of effort being made to reduce transaction costs.” (Senegal)
“ Special mention should be made of a series of quite large programmes financed with concessional loans… These programmes have been included because they fulfill the first three criteria for consideration as a PBA, namely: government leadership, a single programme framework and participation of several donors.” (Peru)
“ Apart from the Multi-Donor Budget Support, there was no general agreement on what constituted the programme-based approach, despite the criteria provided.… Some donors have provided lists of the PBAs, which could not be ascertained in line with the definition..., buttressing the need for additional work to validate the operations of the listed examples….” (Ghana)
These complications will need to be borne in mind in assessing trends over the period to 2010. As discussed in Chapter 2 on The Survey Process, they illustrate the need for firmer guidance on the circumstances in which it is permissible for survey respondents to adapt the suggested definitions.
The proportion of direct budget support (DBS) is not a Paris Declaration indicator but data were collected on the subject, and the results are of
0%
30%
10%
40%
50%
60%
70%
20%
� Programme-based approaches� Direct budget support
2010 target: 66% of aid provided as PBA
Not PBAs57%
PBAs 43%(of which direct budget support20%)
Proportion of aid provided as PBAsCountry-by-country
Proportion of aid provided as PBAs
34 COUNTRIES
CHART 1.11: How much aid is programmebased?
INDICATOR 9
This set of four criteria is fairly restrictive and include direct (general or sectoral) budget support, sector-wide approach (SWAp) programmes and other arrangements in which there are equivalent efforts towards joint planning and harmonisation of procedures.
The general Paris Declaration target for 2010 is to have 66% of aid for the government sector using common arrangements through PBAs. Appendix Tables A.9 and B.9 show the reported volume and proportion of programme-based aid, and also the breakdown between direct budget support (defined as unearmarked funding) and other PBAs. Chart 1.11 provides an overview of the results by country and in aggregate.
It is clear from the survey returns that donors in many countries had some difficulty in accepting the suggested definition of a PBA, and usually National Co-ordinators did not feel empow-ered to impose a ruling. In a number of coun-tries, a looser set of criteria was adopted on the basis of some degree of consensus, while in some others individual donors were permitted to follow their own definition of a “programme”. In these cases, at least, the true baseline numbers for use of common procedures are lower than those presented in the tables. Box 1.4 provides some illustrations. This means more substantial prog-ress is called for to achieve the target than the baseline level of 43% might suggest.

32 2006 SURVEY ON MONITORING THE PARIS DECLARATION: OVERVIEW OF THE RESULTS - ISBN 978-92-64-01965-2 - ©OECD 2007
interest. DBS was also defined in quite restrictive terms in the survey guidance, limiting it to resources managed according to the recipient’s budgetary procedures and not subject to earmarking (although, in the case of sector budget support, subject to a policy dialogue that focuses on a sector). The survey returns do not indicate the degree to which the guidance was followed.
Chart 1.12 provides an overview of the results by donor. There are a few surprises in the data, even after taking into account the possible effects of country selectivity. A striking feature is how many donors (no less than a quarter of the top 22) report that they are already channelling half of their aid to the government sector through PBAs. The descriptive survey returns suggest that this finding reflects to an important degree the approach that some donors took to the definition of a PBA. Only to a more limited degree does it reflect effective adoption of common procedures with other donors. A sensible objective for these agencies, as well as for those that report them-selves as currently less involved in PBAs, would be to concentrate on the substance of the Paris Declaration commitment. That means moving with deliberate speed towards the use of common procedures, under government leadership and where possible using government systems.
The descriptive part of the survey returns, as well as the CDF Progress Report and AER profiles, point to some general patterns in the adoption of PBAs. There appears to be quite a strong trend towards the adoption of SWAp-type arrange-ments, not only for sectors but also for cross-cutting institutional areas such as private-sector development, and justice, law and order. The sectors that move reasonably quickly towards a full SWAp are invariably health and education. However, joint programmes outside the social sectors make slower and more difficult headway towards common arrangements. Nevertheless, where a PBA is adopted by a large group of donors in a sector or institutional area, there is a positive bandwagon effect. With a few exceptions, addi-tional members are willingly and easily absorbed.
To summarise, the survey provides no grounds for complacency with respect to the Paris Declaration commitment on moving towards the use of common arrangements and proce-dures under country leadership. The use of the programme-based approach as a proxy for joint planning and increasingly harmonised working may have confused the issue to some degree. Despite the relatively encouraging numbers generated by the survey around this indicator, the pace of change in donor practices will need to increase over the coming years if the Paris objective is to be achieved.
20%
40%
60%
80%
100%
0%
500
1,000
1,500
2,000
2,500
3,000
0
2010 target: 66% of aid provided as PBA
USD
(M
ILLI
ON
S)Volume of PBAsDonor-by-donor
Proportion of aid provided as PBAsDonor-by-donor
LARGEST 22 DONORS LARGEST 22 DONORS
� Budget support� Other types of PBAs
� Budget support� Other types of PBAs
CHART 1.12: How much programme- based aid do donors provide?

332006 SURVEY ON MONITORING THE PARIS DECLARATION: OVERVIEW OF THE RESULTS - ISBN 978-92-64-01965-2 - ©OECD 2007
CONDUCTING JOINT MISSIONS AND SHARING ANALYSIS
Indicator 10 measures the extent to which donors are merging their review and analysis activities at the country level. It counts the proportion of missions to the country that were undertaken jointly by more than one donor, and the share of country-analysis exercises that were undertaken on a joint or co-ordinated basis. The 2010 targets are 40% joint missions and 66% joint analytical work.
Data adjustments were necessary to deal with double-counting of both joint missions and joint analytical work in the survey returns from many of the countries. The results for missions are shown in Appendix Tables A.10a and B.10a. Chart 1.13 provides an overview. The total number of missions is strikingly high for some countries and for some donors, notably large multilaterals. In many cases, the number of missions appears to be related to scale of the aid disbursed. However, this is not always the case. Some kinds of support, for example to governance reform, may be mission-intensive for good reasons. At the same time, the proportion of co-ordinated or joint missions remains very low – an average of 18% across coun-tries. It is clear that the Paris Declaration targets in this area will require intensified efforts.
This becomes more apparent when the returns are broken down, as they are in the country chapters. Quite a large share of the reported joint missions is accounted for by the single area of public financial
management assessment (CFAA and PEFA in particular). A further substantial contribution comes from UN agencies, in which case it is assumed that the bulk of the co-ordination is internal to the UN system. Significant advances outside these areas seem to be harder to achieve. In a more positive vein, some partner governments are taking a hand in the problem of mission over-load themselves. In several African countries where the total number of missions is large, governments have taken the initiative by declaring mission-free or “quiet” periods during which officials, especially in Ministries of Finance, are able to concentrate on budget preparation. This is an approach that might be more widely emulated.
Appendix Tables A.10b and B.10b, together with Chart 1.14, present the results for country analy-tical work and joint country analytical work. These suggest a rather greater tendency to undertake activities jointly (in aggregate, 42% across coun-tries). This may reflect to some extent an under-standing of the phrase “country analysis” that is biased towards relatively formal exercises that lend themselves to joint working. There is, on the other hand, a noticeable trend towards the prepara-tion of Joint Assistance Strategies, which may be expected to raise the proportion of joint work in both the mission and the analysis categories.
In summary, the baseline position in joint working may be worse for donor missions than for country analysis, with the 2005 proportion of
0
500
1500
2000
2500
3000
0
100
300
500
700
800
34 COUNTRIES LARGEST 22 DONORS
400
600
200
1000
� Co-ordinated donor missions � Individual donor missions
� Co-ordinated donor missions� Individual donor missions
Number of missions
Donor-by-donorCountry-by-country CHART 1.13: How many donor missions are co-ordinated?
INDICATOR 10a

17% of joint missions across countries falling well short of the 2010 target of 40%. It is certainly worse for missions if joint PFM assessments are excluded. This is clearly an area in which greater donor efforts are going to be needed if the agreed targets are to be met.
MANAGING FOR RESULTS
One of the distinguishing features of the Paris Declaration is an emphasis on the way improve-ments in donor practices and country institu-tions depend on each other and are mutually reinforcing. This is reflected on the one hand in the mutuality of the commitments, and on the other in the inclusion of two major areas not covered, for example, in the Rome Declaration on Harmonisation and Alignment: mutual account-ability and management for results.
The commitments on management for results call for donors and partner countries to work together to manage resources for the achieve-ment of development results, using information on results to improve decision making. Countries are expected to develop cost-effective results-oriented reporting and performance assessment frameworks, while donors commit to using any such arrangements and refraining from requiring separate reporting. Indicator 11 measures the extent to which the country commitment on establishing performance frameworks has been realised, using the scorings of the 2005 CDF Progress Report.
Three assessment criteria are considered:■ The quality of development information.■ Stakeholder access to development information.■ Co-ordinated country-level monitoring
and evaluation.
The assessments therefore reflect both the extent to which sound data on development outputs, outcomes and impacts are collected, and various aspects of the way information is used, disseminated among stakeholders and fed back into policy.
Chart 1.15 shows the distribution of the coun-tries participating in the 2006 baseline survey across the CDF Progress Report five quality cate-gories (A-E), while Appendix Table A.11 provides further detail. Country performance assessment frameworks are placed in category A if they “substantially” achieve good practice, and in B if they are “largely developed” towards good prac-tice. The scores are for 2005 and are limited to the 29 survey countries that were included in the CDF exercise. The participating countries not included are Afghanistan, Dominican Republic, Egypt, Peru and South Africa.
On CDF Progress Report criteria, only two countries have “largely developed” performance assessment frameworks compared to five with “largely developed” operational development strategy indicators. On the other hand, the surveyed countries do better than the full CDF Progress Report sample, with a substantially larger
34 2006 SURVEY ON MONITORING THE PARIS DECLARATION: OVERVIEW OF THE RESULTS - ISBN 978-92-64-01965-2 - ©OECD 2007
34 COUNTRIES LARGEST 22 DONORS
� Co-ordinated analytical work � Individual analytical work
� Co-ordinated analytical work � Individual analytical work
Number of country analyses
Donor-by-donorCountry-by-country
0
200
600
800
1000
0
60
90
120
150
30
400
CHART 1.14: How much country analysis is co-ordinated?
INDICATOR 10b

352006 SURVEY ON MONITORING THE PARIS DECLARATION: OVERVIEW OF THE RESULTS - ISBN 978-92-64-01965-2 - ©OECD 2007
A
B
E PAF reflects little action toward achieving good practice.
PAF incorporates some elements of good practice.
PAF reflects action taken towards achieving good practice
PAF is largely developed towards achieving good practice.
7%2
0
0
17
10 34%
59% C
D
SCORENO. OF COUNTRIES CATEGORY
Performance assessment framework (PAF) substantially achieves good practice
Source: World Bank CDF Progress Report for 2005.
LOWER SCORE ▼
HIGHER SCORE ▲
Quality of country performance assessment frameworks
CHART 1.15: Do countries have monitorable performance-assessment frameworks?
INDICATOR 11
proportion rated in at least the B or C categories than in the whole sample. Countries participating in the baseline survey in 2006 should therefore find it easier than others to move up at least one category. The overall target is to reduce by one-third the proportion of countries not attaining at least a B by 2010. This would mean raising the proportion of countries having frameworks with at least a B rating from the baseline of 7% to 38%. Nine baseline countries need to join the two currently scored B or A over the period.
What it takes to raise a country score by one cate-gory is reasonably clear. In the country chapters, the CDF Progress Report and AER country profiles have been used to interpret the country scores. The general picture that emerges is as follows. The supply of survey-based data on poverty inci-dence and human development variables has been improving in most countries. This leaves the quality of administrative reporting and other sources of information about intermediate perfor-mance variables as the principal area of weakness on the data-generation side. Data sharing and dissemination are somewhat better than they were, but providing feedback loops into policy improvement and budget planning presents a major challenge in most countries. This is at least partly because – as discussed in connection with Operational Development Strategies – country plans are often weakest at the point where moni-toring information might be expected to have some purchase on policy; that is, the specification of an implementation plan in terms of activities to be undertaken. Actions on all of these points are in principle quite feasible, given sufficient
high-level encouragement, and are being in part addressed through specific programmes to build capacity to produce and use statistics.
In summary, channelling evidence on results into processes of policy improvement and budget planning remains a major obstacle in the large majority of surveyed countries. It is both impor-tant and very hard to achieve, given the lack of simple technical fixes for the problems in current arrangements for generating and using data. Bringing the target percentage of country perfor-mance assessment frameworks up to the expected 2010 level will call for efforts that are both well-coordinated and realistic about the clear and evident barriers to performance-based manage-ment in partner countries.
BOX 1.5: TWO AID EFFECTIVENESS MUTUAL REVIEW MECHANISMS
“ Tanzania has recently established a Joint Assistance Strategy for Tanzania (JAST), which replaces the Tanzania Assistance Strategy as the framework for managing devel-opment co-operation. It is more comprehensive…in promoting aid effectiveness in line with the principles of ownership, alignment, harmonisation, managing for results, domestic and mutual accountability. Government and development partner performance in implementing the JAST will be regularly monitored and evaluated on the basis of jointly agreed indicators and targets… JAST indi-cators will also be drawn from the Paris Declaration indica-tors, as adapted to the Tanzanian context.” (Tanzania)
“ The Development Partnership Framework, recently signed by the government of Moldova and donor organisations, lays out principles, procedures and processes aimed at greater aid alignment, co-ordination and harmonisation. The Framework specifies concrete activities… It will represent the basis for further mutual assessment of progress.” (Moldova)

36 2006 SURVEY ON MONITORING THE PARIS DECLARATION: OVERVIEW OF THE RESULTS - ISBN 978-92-64-01965-2 - ©OECD 2007
MUTUAL ACCOUNTABILITY
some in response to the 2006 survey, which may to lead to the formulation of a local action plan. If this happens, the proportion of positive responses may increase when the survey is repeated in 2008. This would bring closer the time when 100% of countries have a mutual assessment mechanism, the target that has been set for 2010.
A caution suggested by some of the country reports is that lengthy periods sometimes elapse between agreement on an HAP and the defini-tion of a monitoring framework for it, with the actual presentation and discussion of monitoring data in an appropriate joint forum taking even longer. A less elaborate form of agreement, with a simpler monitoring mechanism, may be worth considering in future initiatives.
In summary, the movement towards the estab-lishment of specific mechanisms for joint moni-toring of Partnership Commitments at country level is just beginning, building in several coun-tries on earlier experience with Harmonisation Action Plans. It is to be expected that further progress will already be apparent in 2008, so that such arrangements are universal by 2010. ■
1 In accordance with paragraph 9 of the Declaration, the partnership of donors and partner countries hosted by the DAC (Working Party on Aid Effectiveness) comprising OECD-DAC members, partner countries and multilateral institutions, met twice, on 30-31 May 2005 and on 7-8 July 2005 to adopt, and review where appropriate, the targets for the 12 Indicators of Progress. At these meetings an agree-ment was reached on the targets presented under Section III of the present Declaration. This agreement is subject to reservations by one donor on (a) the methodology for assessing the quality of locally managed procurement systems (relating to targets 2b and 5b) and (b) the acceptable quality of public financial management reform programmes (relating to target 5a.ii). Further discussions are underway to address these issues. The targets, including the reservation, have been notified to the Chairs of the High-Level Plenary Meeting of the 59th General Assembly of the United Nations in a letter of 9 September 2005 by Richard Manning, Chair of the OECD Development Assistance Committee (DAC).
Afghanistan
Bolivia
Cambodia
Cape Verde
Egypt
Ethiopia
Ghana
Malawi
Albania
Bangladesh
Benin
Burkina Faso
Burundi
Congo Democratic Republic
Dominican Republic
Honduras
Kenya
Kyrgyz Republic
“YES” “NO”
Countries that DO have mechanisms for mutual review of progress (2005)
Countries that DO NOT have mechanisms for mutual review of progress (2005)
Moldova
Mozambique
Nicaragua
South Africa
Tanzania
Viet Nam
Zambia
15 countries (44%)
Mali
Mauritania
Mongolia
Niger
Peru
Rwanda
Senegal
Uganda
Yemen
19 countries (56%)
INDICATOR 12TABLE 1.1: Do countries have mechanisms for mutual assessment of progress?
THE CONCEPT OF MUTUAL ACCOUNTABILITY is an important innovation of the Paris Declaration. It develops the idea that aid is more effective when both donors and partner governments are accountable to their respective publics for the use of resources to achieve development results, and when they are also accountable to each other. The specific focus of the agreed indicator (Indicator 12) is on mutual accountability for the implementa-tion of the Partnership Commitments included in the Declaration and any local agreements on enhancing aid effectiveness. Specifically, the country survey returns tell us whether there exists a mechanism for mutual review of progress on aid effectiveness commitments.
The table indicates that a minority of surveyed countries (44%) have in place a mechanism of this type. Box 1.5 describes two examples. In several countries, Harmonisation Action Plans (HAPs) were agreed following the Rome Declaration, or where governments have initiated the formulation of country Aid Policies with harmonisation and alignment dimensions. Other country responses indicate that discussions are taking place now,

LIST OF SOURCES
World Bank (2005), Enabling Country Capacity to Achieve Results: 2005 CDF Progress Report, Volume I: Overview; Volume II: Country Profiles, World Bank, Operations Policy and Country Services, Washington, D.C. http://www.worldbank.org/cdf
World Bank, “Draft Aid Effectiveness Profiles”, Aid Effectiveness Review, World Bank, Operations Policy and Country Services, Washington, D.C., forthcoming, http://go.worldbank.org/MR5I91FSP0
World Bank, Country Policy and Institutional Assessment, World Bank, Washington, D.C., http://www.worldbank.org
OECD-DAC, International Development Statistics online, http://www.oecd.org/dac/stats/idsonline
372006 SURVEY ON MONITORING THE PARIS DECLARATION: OVERVIEW OF THE RESULTS - ISBN 978-92-64-01965-2 - ©OECD 2007


THE BASELINE SURVEY WAS DESIGNED TO: stimulate a broad-based dialogue (at both country and international levels) on how to make aid more effective, promote agree-ment on specific actions that contribute to successful implementation of the Paris agenda at country level, and generate an accurate picture of existing aid practices as a baseline for assessing progress.
This chapter examines how far the survey has proven to be an efficient and effective instrument for pursuing these objectives. It considers whether they were well served by the way the process was managed, and whether in prac-tice there were significant trade-offs among the objectives. It concludes by identifying the main areas in which the approach needs to be adjusted in future rounds of the survey.
THE CHAPTER DRAWS ON TWO SOURCES: the survey returns themselves, and the insights and opinions provided by some of the main stakeholders in the process. Important stakeholders include the National Co-ordinators who organised the process at country level; the donor agency respondents at country and headquarters levels; and the DAC Secretariat and help-desk personnel at the OECD, the UNDP and the World Bank who guided the survey process. Face-to-face or telephone interviews were carried out with as many representatives of these stakeholder groups as possible, to obtain a well-rounded and realistic picture of the survey process, and its principal strengths and weaknesses.
2 THE SURVEY PROCESS
392006 SURVEY ON MONITORING THE PARIS DECLARATION: OVERVIEW OF THE RESULTS - ISBN 978-92-64-01965-2 - ©OECD 2007

SCOPE OF THE EXERCISE
The countries that participated in the survey were a self-selected sample. From the 50-60 devel-oping and transition countries that endorsed the Paris Declaration, 43 expressed initial interest in the exercise and 34 actually completed the data collection. The sample thus includes over half of the countries eligible to participate. It covers 37% of global country programmed ODA in 2005 (see Appendix Table A.0). The proportion of highly aid-dependent countries included is no doubt larger than that. Participation was volun-tary and called for a significant effort on the part of the country authorities. Therefore, the sample cannot be considered representative of the rele-vant universe. Rather, it may be assumed that it includes a disproportionate number of countries where there is already active interest in the Paris Declaration process on the part of the govern-ment, the country’s donors, or both.
This fact has been borne in mind in interpreting the results in Chapter 1. The survey findings indi-cate the baseline situation for a large set of coun-tries forming the advance guard of awareness on aid effectiveness. The results that would have been obtained from a larger sample would very likely have indicated a lower baseline and greater progress to be made to meet the 2010 targets. Anecdotal evidence from a number of bilateral donors that have undertaken their own reviews of performance in all their programme countries is consistent with this assumption.
The baseline survey included only a handful of countries classified by the OECD-DAC as fragile states. In fact, the number was so small that it was not possible to investigate any distinctive quali-ties of Paris Declaration implementation in those countries. In future rounds of the survey, it should be possible to improve coverage of countries in general and of fragile states in particular. This does not need to affect the validity of comparisons within the baseline sample. From that point of view, the most important thing will be to ensure that countries that participated in the 2006 survey are included again in the next round in 2008.
BOX 2.1: A TYPICAL COUNTRY PROCESS
Country-level processes generally included four steps:
STEP 1: A launch phase, often including a workshop or individual meetings to present the survey method-ology. Launch workshops provided an initial platform for discussing the Paris Declaration, the commitments entered into, and the indicators agreed upon for moni-toring practices and progress in aid delivery.
STEP 2: A data-collection phase (involving govern-ment and donors). Local donor offices were frequently involved in discussions with their headquarters and with government. In this phase, most countries were asked to comment on the draft findings of the World Bank Aid Effectiveness Review, on the issues covered by Paris Declaration Indicators 1 and 11.
STEP 3: A discussion phase around the indicators and data (including efforts to elicit data from laggard donors). This phase was critical. The data gathered by government and donors diverged in many cases, leading to intense discussion around the interpretation of some indicators.
STEP 4: A finalisation phase. The Country Worksheet was compiled and sent off to the DAC Secretariat. In the subsequent period of follow-up, National Co-ordinators responded to questions concerning the data submitted and organised country responses to the draft country chapters.
STEP 5: Vetting of country chapters. The country chapters were reviewed by National Co-ordinators in consultation with donors.
Several regional and sub-regional meetings on aid effec-tiveness took place in the wake of the survey, which provided opportunities for exchanging experiences on the survey process.
HOW THE SURVEY WAS MANAGED
At the country level, the survey was organised to spark dialogue among government, donors and other in-country stakeholders, while also collecting useful information. This was reflected in the co-ordination of the survey, the method for putting together the information required, the guidance provided and the process of drafting the chapters on the countries. Box 2.1 describes a typical country process.
In keeping with the spirit of the Paris Declaration, the country surveys were convened by govern-ment. Participating countries each appointed a National Co-ordinator as leader of the survey process. Normally, these were the heads of aid co-ordination units in ministries of finance or
40 2006 SURVEY ON MONITORING THE PARIS DECLARATION: OVERVIEW OF THE RESULTS - ISBN 978-92-64-01965-2 - ©OECD 2007
MANAGING THE SURVEY TO STIMULATE DIALOGUE

foreign affairs, or the directors’ offices in agencies for external co-operation. In many places, individual local donors (e.g. UNDP, World Bank, European Commission, DFID or USAID) provided real support, including practical help to National Co-ordinators. However, the reports from a variety of stakeholders suggest that governments maintained leadership throughout the process.
A degree of agreement among the in-country participants was required. The country returns took the form of a single Country Worksheet containing both quantitative information and qualitative commentary relating to the relevant Paris Declaration indicators. The worksheets were compiled by the National Co-ordinator, using the completed two-page questionnaires submitted by in-country donors and government. In many cases, this involved extensive consultations to iron out inconsistencies and reach agreement on issues. Donors testify that communication between themselves and National Co-ordinators was usually open and transparent, even if there were differences of opinion at times.
On launching the survey in May 2006, the DAC Secretariat provided a package of materials which steered a careful course between over- and under-direction of the process. The materials included an Explanatory Note, two-page questionnaires for completion by government and donors, the Country Worksheet (incorporating, an Excel file for the consolidated numerical data) and a comprehensive “Definitions and Guidance” document. These were distributed to National Co-ordinators and also made available through the OECD’s website on monitoring the Paris Declaration. The website included information about the help desks operated by the UNDP, the OECD Secretariat and the World Bank, and other useful tools.
Because of the novelty of the exercise and the communication challenges involved, the survey started with some delay in a number of countries. The initial deadline for submissions was 15 August 2006. A final cut-off date of 30 September was set. Some 26 submissions were received by this deadline, with an additional 8 arriving within the following month, completing the sample of 34.
Chapters on the country findings were then drafted. This proved a time-consuming task, but was undertaken as speedily as possible in order for initial drafts to be submitted to the coun-tries for comment with a minimum of delay. Checking of initial drafts led in many cases to a further round of discussion on the status of aid effectiveness initiatives in the country. Second drafts, adjusted in light of corrections and addi-tional information, were also circulated to the countries. The final drafts of the country chapters take full account of the comments received.
TYPES OF COUNTRY EXPERIENCE
It is clear that this process as a whole was onerous, particularly for the country representatives.A minimum of three person-weeks, and often several times this amount, had to be devoted to the task in those countries where engagement was most intense and included a relatively wide range of stakeholders. These estimates are based on the conversations with National Co-ordinators. They account only for the time that was devoted by government staff dedicated to the survey, and do not include time of donor staff or government staff from other ministries or agencies who partic-ipated in related meetings and workshops. The task was made more difficult as it took place in the Northern summer period, when staff of many donor organisations take their annual holidays.
The process has been burdensome despite the relatively narrow focus and scope of the exercise. The questionnaires and consultations focused only on a few proxy indicators of aid alignment, harmonisation and mutual accountability, and not on the full range of Paris Declaration issues. Moreover, in most countries, the process included government officials and multilateral and DAC bilateral donors only. The involvement of govern-ment departments other than central ministries and aid co-ordination units was variable. The goal of involving a wider range of stakeholders, including non-DAC donors and civil society, was achieved only in a few cases. Ghana was one of a handful of countries where the process involved civil society. The international community did not encourage participation by civil society at
412006 SURVEY ON MONITORING THE PARIS DECLARATION: OVERVIEW OF THE RESULTS - ISBN 978-92-64-01965-2 - ©OECD 2007

the outset, and additional stakeholders that did become involved did so at their own initiative. Some foundations submitted data on the donor questionnaire in individual countries (e.g. the Aga Khan Foundation in Afghanistan). Box 2.2 shows some of the ways in which country processes differed.
A question to be considered is how much of the effort was worthwhile, either as a contribution to the international monitoring effort or because of the stimulus it provided to the in-country debate on aid effectiveness. In other words, which of the efforts brought with them benefits that are suffi-cient to justify the costs, and which did not?
The feedback from stakeholders suggests the need to distinguish among two or three groups of countries participating in the survey. The first group are those countries where discussions have been under way for some years, at least since the Rome Declaration, on the development of a Harmonisation Action Plan and/or a compre-hensive national aid policy. In the second group, harmonisation and alignment had not been discussed until very recently at country level. In these circumstances, the survey brought together the relevant stakeholders for the first time. A possible third category consists of countries where action on alignment and harmonisation had been previously discussed but the process was dormant for various reasons.
In the first group, the survey process was able to make use of existing relationships and procedures. This simplified the task. However, the previous history also meant that there was little immediate gain from the meetings. National Co-ordinators from countries in this first category were notice-ably more inclined to pose “so what?” questions, and to be impatient with a survey instrument that appeared to be limited to recording the current state of donor practices. The potential benefits, for these countries, are associated more obviously with the second purpose of the survey – that of promoting agreement on specific actions leading to appropriate forms of implementation of the Paris agenda at country level. This represents a much tougher test, and the feedback on whether
42 2006 SURVEY ON MONITORING THE PARIS DECLARATION: OVERVIEW OF THE RESULTS - ISBN 978-92-64-01965-2 - ©OECD 2007
BOX 2.2: COUNTRY VARIATIONS
The survey process varied across countries in the following respects:
■ The scope of the questionnaires: Some National Co-ordinators added further questions, or provided addi-tional guidance (for example, on the requirements of a programme-based approach or co-ordinated capacity development). Others limited themselves to collating the contributions.
■ The number of donors that submitted data and the level of effort necessary to elicit responses from other major donors in the country: Peer pressure within a donor group was a favourable factor in some coun-tries, but was largely absent in others. Nevertheless the overall coverage of relevant aid flows was high at 90% ranging from 57% to 118% (Appendix Table A.0).
■ The intensity of data collection within government: In all cases, this involved the quantitative data required to answer the government questionnaire (on Indicators 3 and 7), but some National Co-ordinators went further and, for example, sought line ministries’ views on the number of parallel PIUs in sectors.
■ The length and intensity of the discussion phase: This was affected by capacity, commitment and time constraints, especially in countries where the initial launch of the survey was delayed.
■ The way Country Worksheets were finalised: Some country groups sought consensus between govern-ment and donors, while others in accordance with the guidance on the worksheet chose to reflect diverging views where there was disagreement.
■ The degree of engagement with the Aid Effectiveness Review undertaken by the World Bank: The draft profiles prepared for the AER were helpful in completing Country Worksheets, both in countries where discussion on harmonisation and alignment was recent and in those where it was well established. However, the degree to which the AER was effectively connected with the survey process proper seems to have been quite variable.
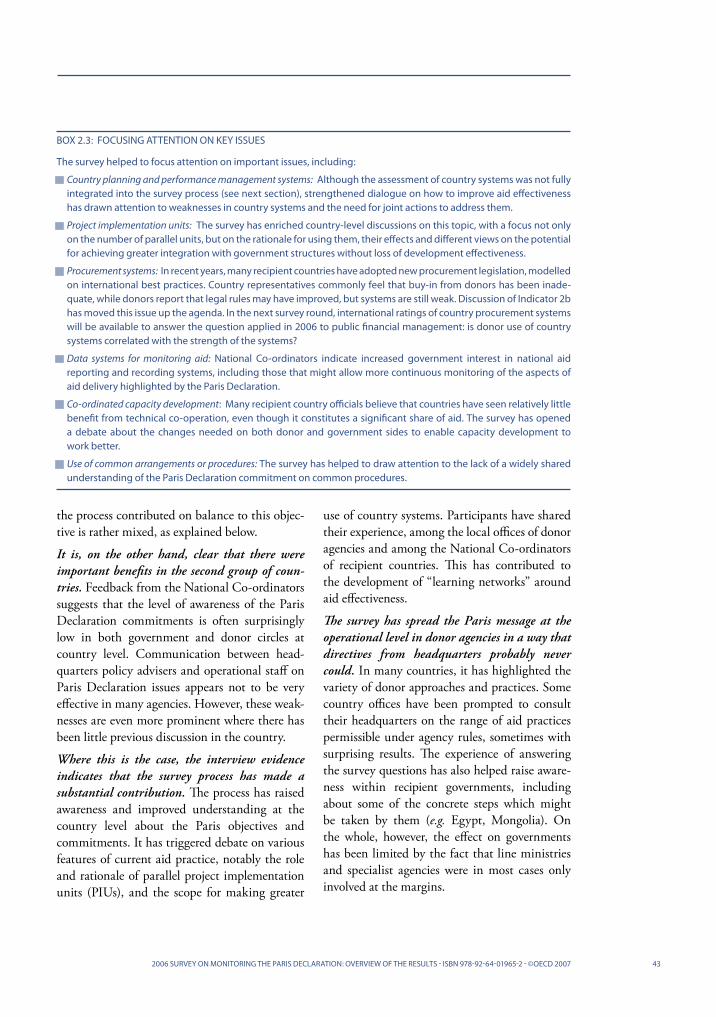
the process contributed on balance to this objec-tive is rather mixed, as explained below.
It is, on the other hand, clear that there were important benefits in the second group of coun-tries. Feedback from the National Co-ordinators suggests that the level of awareness of the Paris Declaration commitments is often surprisingly low in both government and donor circles at country level. Communication between head-quarters policy advisers and operational staff on Paris Declaration issues appears not to be very effective in many agencies. However, these weak-nesses are even more prominent where there has been little previous discussion in the country.
Where this is the case, the interview evidence indicates that the survey process has made a substantial contribution. The process has raised awareness and improved understanding at the country level about the Paris objectives and commitments. It has triggered debate on various features of current aid practice, notably the role and rationale of parallel project implementation units (PIUs), and the scope for making greater
use of country systems. Participants have shared their experience, among the local offices of donor agencies and among the National Co-ordinators of recipient countries. This has contributed to the development of “learning networks” around aid effectiveness.
The survey has spread the Paris message at the operational level in donor agencies in a way that directives from headquarters probably never could. In many countries, it has highlighted the variety of donor approaches and practices. Some country offices have been prompted to consult their headquarters on the range of aid practices permissible under agency rules, sometimes with surprising results. The experience of answering the survey questions has also helped raise aware-ness within recipient governments, including about some of the concrete steps which might be taken by them (e.g. Egypt, Mongolia). On the whole, however, the effect on governments has been limited by the fact that line ministries and specialist agencies were in most cases only involved at the margins.
BOX 2.3: FOCUSING ATTENTION ON KEY ISSUES
The survey helped to focus attention on important issues, including:
■ Country planning and performance management systems: Although the assessment of country systems was not fully integrated into the survey process (see next section), strengthened dialogue on how to improve aid effectiveness has drawn attention to weaknesses in country systems and the need for joint actions to address them.
■ Project implementation units: The survey has enriched country-level discussions on this topic, with a focus not only on the number of parallel units, but on the rationale for using them, their effects and different views on the potential for achieving greater integration with government structures without loss of development effectiveness.
■ Procurement systems: In recent years, many recipient countries have adopted new procurement legislation, modelled on international best practices. Country representatives commonly feel that buy-in from donors has been inade-quate, while donors report that legal rules may have improved, but systems are still weak. Discussion of Indicator 2b has moved this issue up the agenda. In the next survey round, international ratings of country procurement systems will be available to answer the question applied in 2006 to public financial management: is donor use of country systems correlated with the strength of the systems?
■ Data systems for monitoring aid: National Co-ordinators indicate increased government interest in national aid reporting and recording systems, including those that might allow more continuous monitoring of the aspects of aid delivery highlighted by the Paris Declaration.
■ Co-ordinated capacity development: Many recipient country officials believe that countries have seen relatively little benefit from technical co-operation, even though it constitutes a significant share of aid. The survey has opened a debate about the changes needed on both donor and government sides to enable capacity development to work better.
■ Use of common arrangements or procedures: The survey has helped to draw attention to the lack of a widely shared understanding of the Paris Declaration commitment on common procedures.
432006 SURVEY ON MONITORING THE PARIS DECLARATION: OVERVIEW OF THE RESULTS - ISBN 978-92-64-01965-2 - ©OECD 2007
There is evidence that “dormant” country harmonisation processes have been reinvigorated. The survey has given actors within governments who believe that aid effectiveness is an important policy issue a valuable tool for reviving harmoni-sation processes. The data generated are often striking (e.g. the low degree to which national procedures are currently being used). The data reinforce the visibility of problems, helping to bring them onto the country agenda. The regional activities around the survey process were instrumental in disseminating ideas and practices regarding the possible design of national aid poli-cies. Box 2.3 illustrates the way the survey has focused attention on key issues in a number of country contexts.
BENEFITS AND COSTS
In all cases, there are remaining questions about costs associated with undertaking the survey that did not have clear benefits and might possibly have been avoided. Insisting upon a degree of collec-tive agreement on the returns incurred signifi-cant costs but did provoke dialogue, which raised awareness and posed relevant new issues for the participants. The same is probably true about the iterative process of refining the country chapters for the report. But it is less clear that the approach taken by the guidance materials contributed to a positive cost-benefit ratio.
The “Definitions and Guidance” document was quite directive. For each of the agreed Paris Declaration indicators covered by the survey, it defined the terms used and offered additional guidance on their interpretation. The Explanatory Note, on the other hand, contained a more permissive set of instructions. It recognised the possibility that the definitions offered might not cover all possible cases, exceptions and contingen-cies, and invited partner authorities and donors in each country to reach agreement on how to adapt the definitions so that they might be consistently applied throughout the survey. The Country
Worksheets included an instruction to record any differences of opinion. As the discussion of find-ings in Chapter 1 has made clear, this flexibility in the guidance was quite widely interpreted as a mandate for the use of different definitions.
The final section of this chapter considers the diffi-culties this has created for consistent application of the survey, within countries, across countries and through time. Another question is worth asking first. Did this flexibility help in stimu-lating country-level dialogue? A similar question will be considered in the next section, in relation to the objective of getting agreement on specific Paris Declaration implementation measures.
The testimony of the National Co-ordinators seems quite clear. The ability of individual donor respondents to adopt, in effect, their own defi-nition of key terms, such as “programme-based approach” made the process more burden-some without any real justification. National Co-ordinators did what they could to ensure consistent reporting on the Country Worksheet – for example, on what types of support to capacity development should be regarded as “co-ordinated”. However, there were limits to the National Co-ordinators’ authority, particu-larly where donor representatives were receiving instructions from their headquarters. The guid-ance provided by donor headquarters sometimes overruled agreements reached at country level between National Co-ordinators and donors. The Co-ordinator’s role in this regard was diffi-cult, stressful and time-consuming.
It is important to consider possible trade-offs. However, it does not seem that the flexibility on definitions produced useful dialogue that would promote the Paris Declaration’s contribution to aid management in the country. Instead, it diverted dialogue that might have been productively focused on the facts of the situation in the country into a rather unproductive discussion of how to report those facts for the purposes of the survey.
44 2006 SURVEY ON MONITORING THE PARIS DECLARATION: OVERVIEW OF THE RESULTS - ISBN 978-92-64-01965-2 - ©OECD 2007

452006 SURVEY ON MONITORING THE PARIS DECLARATION: OVERVIEW OF THE RESULTS - ISBN 978-92-64-01965-2 - ©OECD 2007
IN COUNTRIES where the discussion on harmoni-sation and alignment was already advanced, the expectation was that the survey process would be decidedly action-oriented. This expectation was fulfilled in some respects. But the ability of the survey to play an action-oriented role was constrained by a number of factors.
IMMEDIATE AND PROSPECTIVE GAINS
The immediate gains include a widening or deepening of existing country efforts. In some countries, the survey was taken as an input into established national monitoring efforts on aid effectiveness, such as those surrounding a Harmonisation Action Plan. In these cases, the process drew in a wider range of stakeholders, renewing their commitment to tracking the actions previously agreed.
In a few such countries, additional questions were integrated into the questionnaires with a view to generating more “actionable” results. They included questions about obstacles to progress. The results of these efforts remain to be assessed, but the practice suggests that future rounds of the survey could be made more action-oriented for all countries, without increasing the scale of the exercise significantly.
In a wider range of countries, the survey has trig-gered debates about methods of record keeping and reporting on aid, on both the government and donor sides. As noted in Chapter 1, data recording systems at country level are often not well-geared to capturing aid flows in a compre-hensive way. There are substantial weaknesses on both the donor and government sides affecting the capture of information. In addition, the aid statistics that exist tend to be disaggregated in traditional terms (e.g. loans vs. grants) and do not distinguish between aid modalities (projects, programme-based, etc.) along the lines required for Paris Declaration monitoring. In a number of countries, the survey has drawn attention to these issues, and led to stepped-up efforts to develop national aid management systems.
Many National Co-ordinators indicate that the survey results are still being “digested”. In a number of countries, the Co-ordinators expect that the results will be translated into an action-able agenda in the near future. For example, there may be plans for phasing out parallel project implementation units, with definite commit-ments by government to strengthen line minis-tries, and by donors to respond in kind. The survey question about mechanisms for moni-toring mutual accountability has encouraged some country aid-management teams to consider introducing such a mechanism. The prospect of future rounds of the survey will likely provide an incentive for the partners to show progress over the next 18 to 24 months.
CONSTRAINTS ON THE FORMULATION OF ACTION AGENDAS
Two features of the 2006 survey process placed constraints on its ability to stimulate local action agendas. One was the separate treatment of two broad areas of the Paris commitments – aid delivery on the one hand and country systems on the other. The second was the scope that the guidance allowed for discussion to be diverted from factual into definitional questions.
As explained in Chapter 1, the proxies for align-ment, harmonisation and mutual accountability (Indicators 3, 4, 5, 6, 9, 10 and 12) were dealt with in the Country Worksheets. In this sense, they were fully part of the country process. On the other hand, the measures of country owner-ship and results orientation (Indicators 1 and 11) were based on two World Bank outputs: the Comprehensive Development Framework Progress Report for 2005 and the forthcoming Aid Effectiveness Review. Work on these indica-tors was undertaken in parallel to the country survey processes. Draft country profiles for the AER were sent to countries for comment during the survey period. In a number of coun-tries, including Ethiopia, Mali, Moldova and the Kyrgyz Republic, the draft profiles served as an input into the Country Worksheet and thus served to advance discussion on progress.
CONTRIBUTING TO AGREEMENT ON SPECIFIC ACTIONS

However, in other countries commenting effec-tively on the AER profiles while also completing the survey was found to be difficult. In these cases, the two main parts of the survey were effec-tively disconnected.
These constraints probably hampered the ability of donor-partner groups at country level to draw up action plans based on the survey experience. In very many areas, including the development of operational development strategies and perfor-mance assessment frameworks, the ability to move forward on the Paris commitments is influenced by both donors and government. However, formu-lating a reciprocal action agenda is more difficult when the evidence on the two sides of the equation has been assembled and validated in a different way. It is clear that in future there will be gains in terms of actionable results if the survey process can become more integrated in this sense.
The second issue has already been touched upon. The DAC survey team provided substantial guid-ance to respondents, but without tightening the definitions of the indicators fully. There was concern that the indicators should be sufficiently flexible to accommodate a variety of country circumstances. Country groups had room to reach a consensus on locally adjusted definitions that could then be applied consistently over time. Unfortunately, few groups seem to have been able to reach a consensus and National Co-ordinators were not empowered to impose a ruling. The issue took up a good deal of debating time that might otherwise have been devoted to discussing how to move forward. In several countries, this was seen as an unwelcome distraction by many stakeholders on both the government and the donor sides.
ACCURACY OF THE PICTURE
46 2006 SURVEY ON MONITORING THE PARIS DECLARATION: OVERVIEW OF THE RESULTS - ISBN 978-92-64-01965-2 - ©OECD 2007
AS A RESULT of the baseline survey, more is now known about aid management systems and prac-tices at the country level. Quantitative data have been generated on a set of reasonable proxies of the Paris Declaration commitments. These data provide a set of benchmarks covering most forms of official aid in 34 countries from all world regions (formerly, such information was avail-able only for specific modalities, such as general budget support and for particular world regions). The data will provide an invaluable input to forth-coming debates on how to improve the effective-ness of aid. The availability of such data is likely to be a factor favouring forward movement on aid effectiveness in countries that participated in the first survey round and others that may join in future rounds.
The picture provided by the results is as accurate as possible, given the constraints that affected the survey process. Considerable efforts have been made to deliver high-quality data, not least by the National Co-ordinators who compiled and checked the returns and responded to at least one round of follow-up queries from the OECD-DAC Secretariat. The use of the data in the country chapters and in Chapter 1 has taken into consideration a range of factors influencing the reporting. In fact, the information contained in the survey returns on how the data were compiled is itself an important source of insight into the state of the Paris Declaration in particular coun-tries. Thus, in this report, a naïve utilisation of the data has certainly been avoided. It is to be hoped that other users of the raw numbers will be similarly circumspect.
That said, an important lesson from the manage-ment of the 2006 survey is about the need for firmer steps to ensure the standardisation of measures. The difficulties created for National Co-ordinators by the lack of standardisation have already been noted. However, concern about this issue was also common among donors, particularly in respect of indicators on which some country-level discretion was permitted by the guidance.

472006 SURVEY ON MONITORING THE PARIS DECLARATION: OVERVIEW OF THE RESULTS - ISBN 978-92-64-01965-2 - ©OECD 2007
It is clear in retrospect that the survey guidance gave too much ground to the case for “localising” concepts and measures. It is, of course, difficult to produce watertight definitions, and there are some genuine grey areas and classification prob-lems needing discussion. Firmer definitions should not be used to gloss over disagreements about the substance of aid policy. Nevertheless, definitions that are looser than they need to be prevent clear discussion of policy differences and do little to assist the technical discussion than may be needed on the genuine borderline cases and grey areas.
A particular concern about the 2005 baseline established by the 2006 survey is that it may systematically overstate the progress already achieved in relation to the 2010 targets. If, as a number of National Co-ordinators perceive, donors have used the permitted leeway on defi-nitions to place their performance closer to the targets than would otherwise be the case, this may create difficulties for them in demonstrating that they have made progress over the first moni-toring period (2005-07). If, as is recommended, the guidance provided in the 2008 survey is tighter and National Co-ordinators are given greater authority, some of the results may show a shocking – although actually illusory – reduction in performance against the commitments. The donor community should be prepared to meet this eventuality in a mature and far-sighted way.
Most stakeholders in the 2006 survey seem to take the view that firmer and clearer guidance on the definition and local application of indica-tors is desirable. This would help to focus discus-sion on the things that matter – why the Paris commitments were made, what actions can be taken to carry them out and what the real obsta-cles are. This means that in preparation for the next survey round, a further effort will be needed to clarify and disseminate the current definitions and hammer out in advance the degree to which they can be consistently applied.
ADJUSTING THE APPROACH IN 2008
THE BASELINE SURVEY has been a major multi-purpose effort that has yielded important results in the form of both substantive findings and lessons learned. The process lessons suggest a number of recommendations for the next round of monitoring in 2008, discussed here and summarised in Box 2.4.
The 2008 survey can and should involve more countries, including a larger number of fragile states, so that the exercise provides a more broad-based stimulus to implementation of the Paris commitments as well as a richer data set with which to monitor progress. A change in the sample need not compromise the ability to measure changes against the baseline established by the 2006 survey, as the 2006 baseline coun-tries can continue to be treated as a distinct subset for the purposes of statistical analysis.
A serious effort needs to be made to reduce those costs incurred in mounting the survey from which no clear benefits are expected. Such costs include the duplication of effort arising from undertaking the work at a time of year when donor representa-tives are hard to contact.
BOX 2.4: SUMMARY OF RECOMMENDATIONS
In brief, the 2006 survey experience calls for:
■ Including more countries in the survey.
■ Reducing those survey costs for which no definite benefit can be identified.
■ Assembling an indicative body of 2007 disbursement data early in 2008.
■ Tightening the guidance on all 12 indicators.
■ Increasing the authority of National Co-ordinators.
■ Capturing additional information on practical obstacles and ways of moving forward.

There are, however, several constraints on the timing of the next survey that will need to be taken into account in settling on dates for starting and completing the survey. One of them is the limited availability early in the year of data on aid disbursements in the previous financial year. Another is the deadline for reporting to the High-Level Forum in Ghana, scheduled for September 2008. For the 2008 survey round, the concern to reduce transaction costs for National Co-ordinators combines with the reporting schedule to suggest that the survey should start earlier than in 2006. This implies that special efforts will be needed to assemble an indicative body of disbursement data for 2007 no later than the first quarter of 2008.
Not all of the unnecessary costs cited by National Co-ordinators relate to timing. Another impor-tant factor was the layer of complexity introduced by the guidance encouraging local adaptations in dealing with some of the indicators. The 2008 round of the monitoring survey should put in place mechanisms to ensure standardised reporting based strictly on centrally agreed defi-nitions for the 12 Paris Declaration indicators. A tightening of the survey guidance in this respect would not just save time and help to generate more robust data. As argued above, it would probably also be more favourable than the current flex-ibility to well-focused, action-oriented dialogue at country level.
The survey instrument should provide scope for feedback on areas of difficulty in applying the definitions, but not for variations that weaken the consistency of the survey data. In view of the need for comparability between the 2006 and 2008 exercises, it is recommended that feedback be collected on the ways in which any changes in the guidance have affected the scores for particular indicators.
48 2006 SURVEY ON MONITORING THE PARIS DECLARATION: OVERVIEW OF THE RESULTS - ISBN 978-92-64-01965-2 - ©OECD 2007
The mechanisms required for implementing these changes will need to include not just a careful revision of the written guidance materials, but also preparatory discussions involving donor agency staffs at different levels as well as country representatives. This will be important to ensure that the principles behind tightening of the guid-ance are understood and appreciated. In any case, employment rotation will mean that those responsible for gathering data will very likely be different in future survey rounds, and this needs to be considered. As part of this package of changes, consideration should be given to increasing the authority of National Co-ordinators, to enable them to play more effectively their role as guar-antors of the consistency of reporting.
So as not to increase the scale of the task, the 2008 survey round should focus closely on the agreed 12 indicators. However, in two particular respects adjustments are suggested.
First, additional attention should be given to capturing insights into obstacles to progress on the indicators and practical ways of moving forward. This recommendation draws on the experience of a few countries of using supplementary questions to help identify a country-specific action agenda on aid effectiveness. The experience suggests that further information could be gathered in a cost-effective way, with significant additional bene-fits. It should be clear that this is not a question of increasing the number of indicators, but of extracting more benefits from the existing opera-tion by encouraging country teams to make fuller use of the spaces for qualitative comment on the Country Worksheet.

492006 SURVEY ON MONITORING THE PARIS DECLARATION: OVERVIEW OF THE RESULTS - ISBN 978-92-64-01965-2 - ©OECD 2007
Second, there would be clear benefits from bringing data collection for Indicators 1 and 11 (operational development strategy and results-oriented performance assessment) within the compass of the survey process under National Co-ordinators. The evidence reviewed here suggests that there would be gains for the quality of country-level processes from ending the sepa-ration of these two components of the Paris Declaration monitoring effort. In particular, a merged process for data collection would be more conducive to a frank discussion that recognises fully the reciprocal obligations and interdepen-dencies involved in any forward action agenda. For example, a revision of the AER profiles could be conducted in-country by integrating the text of the profiles into the survey for the 2008 moni-toring round.
There would remain a need for standardised measures comparable with those generated by the CDF Progress Report and Aid Effectiveness Review in the past. For this reason, there is going to be a continuing need for a credible external body such as the World Bank to take respon-sibility for attaching scores to the descriptive profiles, even if the profiles themselves are gener-ated largely by an in-country process. If a joint approach of this kind can be agreed, an early start should be made in defining its modalities in detail, so that they can be fully reflected in the preparatory discussions. There is relevant experi-ence to draw on, in which a simple scoring system is applied to a descriptive analysis that includes a large element of self-assessment (e.g. PEFA).
These two adjustments could help to ensure that the 2008 round of Paris Declaration monitoring is a rewarding process that adds substantially to the baseline survey. Together with the proposed efforts to involve more countries, adjust the sched-uling and strengthen the survey guidance, they would be expected to enhance the benefits of the exercise at both country and international levels while keeping its costs to a reasonable level. ■
NOTE: This chapter also draws from the consultation undertaken by Stephen Giddings with representatives from donor organisations.


THE PARIS DECLARATION ON AID EFFECTIVENESS (2 March 2005) is an ambitious attempt to improve development impact through more effective use of aid. To this end, it promotes changes to aid delivery and management practices based on agreed principles of country ownership, harmonisation, alignment, mutual accountability and managing for results. The Declaration goes beyond committing parties to a clearly specified set of actions and behavioural changes. It also provides for periodic monitoring at the country level, so that the governments of developing countries and their development partners are increasingly accountable to each other for the progress being made.
THIS CHAPTER DRAWS CONCLUSIONS from the first round of monitoring in 20061 and suggests recommendations that should help achieve progress against the targets agreed in the Paris Declaration. It is structured in four parts. The first part sets out the key policy recommendations that deserve priority attention, the second provides the context and the state of play in 2005, the third identifies the main challenges in accelerating implementation of the Paris Declaration, and the last draws out opera-tional recommendations.
The baseline survey was designed to document the situation in 2005 with a view to benchmarking progress in 2008 and in 2010. It does not provide any direct evidence on trends of change; that will require a second survey. It describes the position in a self-selected sample of 34 developing countries, and does not claim to provide a fully comprehensive assessment of aid practices across the world – though it does cover 37% of relevant aid flows. Rather, it helps focus attention on the actions that could be taken in the years remaining before 2010, the target date for fulfilling the Paris commitments and a critical milestone on the road to meeting the Millennium Development Goals in 2015. This chapter provides a summary of conclusions from the 2006 monitoring round.
3 CONCLUSIONS AND RECOMMENDATIONS
512006 SURVEY ON MONITORING THE PARIS DECLARATION: OVERVIEW OF THE RESULTS - ISBN 978-92-64-01965-2 - ©OECD 2007
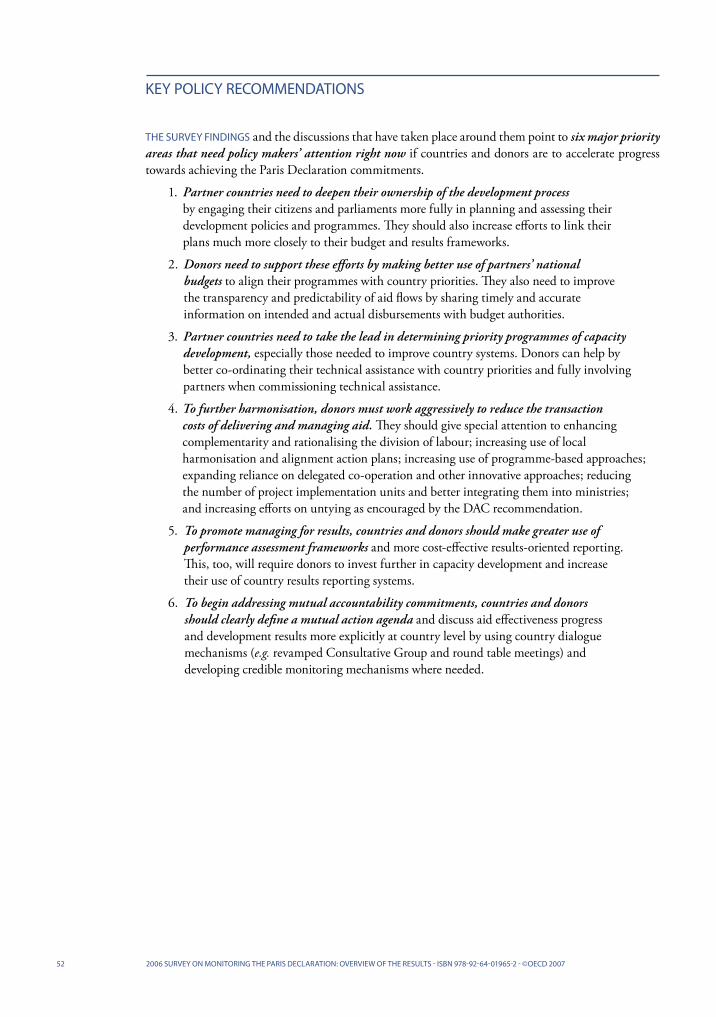
THE SURVEY FINDINGS and the discussions that have taken place around them point to six major priority areas that need policy makers’ attention right now if countries and donors are to accelerate progress towards achieving the Paris Declaration commitments.
1. Partner countries need to deepen their ownership of the development process by engaging their citizens and parliaments more fully in planning and assessing their development policies and programmes. They should also increase efforts to link their plans much more closely to their budget and results frameworks.
2. Donors need to support these efforts by making better use of partners’ national budgets to align their programmes with country priorities. They also need to improve the transparency and predictability of aid flows by sharing timely and accurate information on intended and actual disbursements with budget authorities.
3. Partner countries need to take the lead in determining priority programmes of capacity development, especially those needed to improve country systems. Donors can help by better co-ordinating their technical assistance with country priorities and fully involving partners when commissioning technical assistance.
4. To further harmonisation, donors must work aggressively to reduce the transaction costs of delivering and managing aid. They should give special attention to enhancing complementarity and rationalising the division of labour; increasing use of local harmonisation and alignment action plans; increasing use of programme-based approaches; expanding reliance on delegated co-operation and other innovative approaches; reducing the number of project implementation units and better integrating them into ministries; and increasing efforts on untying as encouraged by the DAC recommendation.
5. To promote managing for results, countries and donors should make greater use of performance assessment frameworks and more cost-effective results-oriented reporting. This, too, will require donors to invest further in capacity development and increase their use of country results reporting systems.
6. To begin addressing mutual accountability commitments, countries and donors should clearly define a mutual action agenda and discuss aid effectiveness progress and development results more explicitly at country level by using country dialogue mechanisms (e.g. revamped Consultative Group and round table meetings) and developing credible monitoring mechanisms where needed.
52 2006 SURVEY ON MONITORING THE PARIS DECLARATION: OVERVIEW OF THE RESULTS - ISBN 978-92-64-01965-2 - ©OECD 2007
KEY POLICY RECOMMENDATIONS

SINCE THE PARIS DECLARATION was agreed two years ago, strong expectations for reform have been created. Despite the diversity of country condi-tions in Africa, Asia and Latin America, the Paris Declaration principles and commitments are consid-ered relevant and important. This is one of the key messages that emerged at the five regional work-shops on aid effectiveness in 2005-06 in Uganda, Mali, South Africa, Bolivia and the Philippines. At the same time, country contexts clearly matter. The potential of the Paris agenda can be realised only in countries that have determined for themselves their own priorities, pace and sequencing of reforms. The survey shows that an increasing number of countries – such as Ghana, Nicaragua and Vietnam – have already established their own action plans, working groups and review processes to guide implementa-tion. World Bank sources suggest that less intensive activities are taking place in as many as 60 countries.
Most donor agencies have made major efforts to implement the Paris Declaration within their organisations and communicate its importance to
532006 SURVEY ON MONITORING THE PARIS DECLARATION: OVERVIEW OF THE RESULTS - ISBN 978-92-64-01965-2 - ©OECD 2007
THE STATE OF PLAY IN 2005
their staff. A large majority of DAC members, for example, have developed corporate action plans to implement the Paris Declaration, and five of them have informed their national parliaments. At the same time, partner countries are increas-ingly voicing concerns about the slow pace of change in donor practices: for example, a discon-nect between headquarters policies and in-country practices, donor-driven capacity development and lack of progress on untying aid.
Much more needs to be done to implement the Paris Declaration if the mutual commitments and targets are to be met. The 2006 baseline results for the 12 indicators show that meeting the 2010 targets will require significant efforts (see Table 3.1), especially when it involves changing deeply rooted institutional behaviours. Addressing these concerns and, more generally, demonstrating tangible results against the Paris Declaration is fundamental to sustaining momentum and achieving further progress up to the next High-Level Forum in Ghana (September 2008).
5a Use of country PFM systems
4 Co-ordinated capacity development
12 Reviews of mutual accountability
10b Co-ordinated country analytical work
10a Co-ordinated missions
11 Sound performance
assessment framework
8 Untied aid
7 In-year predictability
6 Parallel PIUs
5b Use of country procurement systems
3 Aid reported on budget
9 Use of programme-based approaches 43%
88%
39%
1 832
70%
75%
7% of countries meet criteria
18%
42%
38% of countries meet criteria
48%
40%
66%
94%
[80%]d
611
87%
Progress over time
38%
40%
66%
100%
50%
[80%]c
35%
42%
38%
61 per country
41%
82%
--
29%
52%
--
42%
33%
TABLE 3.1: BASELINE VALUES FOR THE 12 INDICATORS AGREED IN PARIS
Indicators
1 Ownership – Operational PRS
2a Quality of PFM systems
For Reference: Avg. country ratiosb
2010 Global Target 2005 Global Baselinea
31% of countries meet criteria
17% of countries meet criteria At least 75%
Half of partner countries increase their scores
--
--
2b Quality of procurement systems Not available yet One third of partner countries increase their scores
--
a The global baseline is the weighted average of the survey results. In other words, for each indicator it is the sum, for each of the 34 countries, of the values of the numerator divided by the sum of the values of the denominator. For Indicator 3, for example, this accurately reflects that in total 88% of the aid provided to the 34 countries is reported on budget. However as amounts over budget offset amounts under budget, the overall ratio is high for this indicator.
b The average country ratio is the unweighted average ratio across 34 countries; that is the sum of the indicator for each donor in each country divided by the number of donor/country observations irrespective of the volume of aid provided by the donor. For indicator 3 it shows that the typical donor has to move from 45% of aid reported on budget to the minimum target of 85%. On the other hand for Indicator 10, the typical donor is above the baseline average, suggesting the degree of co ordination is greater for smaller donors compared to larger ones.
c The level of ambition of this target is determined by Indicator 2a. The figure in square brackets is provided for illustrative purposes and is based on a two-thirds reduction of the gap. For more information please refer to the Paris Declaration.
d The level of ambition of this target is determined by Indicator 2b. The figure in square brackets is provided for illustrative purposes and is based on a two-thirds reduction of the gap. For more information please refer to the Paris Declaration.

DEEPENING OWNERSHIP THAT LEADS TO DEVELOPMENT EFFECTIVENESS AND RESULTS
The starting point for aid effectiveness is that developing countries assume leadership of their own development process, responding to their citizens’ needs and articulating their own devel-opment priorities. The survey focuses on the degree to which national development plans draw on long-term visions and are prioritised and linked to budgets, expenditures and results. Survey findings show that very few countries in the survey (17% of the sample) meet the criteria for fully operational national development strat-egies. For most of the 34 countries surveyed, ownership needs substantial strengthening. As noted in Chapter 1, the main factor that would enable more countries to move a step up from their 2005 ratings is a commitment by govern-ments to using their central resource-allocation instrument, the national budget, more vigorously and consistently to support agreed policy priori-ties (this is also discussed below). While the main responsibility lies with the developing country, donors can build up leadership capacity through well-designed support programmes that create space for countries to exercise ownership.
Discussions and expectations around the Paris Declaration emphasise that aid can only be considered effective if it contributes to achieving development results. The survey shows that only 7% of the countries in the survey have achieved good practice in using performance assessment frameworks to monitor and manage necessary improvements in the quality of their development programmes. The survey findings underline the need to pay much more attention to managing for results. Countries need functioning performance assessment frameworks that are linked with the budget, that systematically produce and analyse data on progress in implementing national devel-opment strategies, and that feed the data back into strategy upgrades.
MAJOR CHALLENGES
54 2006 SURVEY ON MONITORING THE PARIS DECLARATION: OVERVIEW OF THE RESULTS - ISBN 978-92-64-01965-2 - ©OECD 2007
PROMOTING STRONGER AND MORE ACCOUNTABLE BUDGET PROCESSES
Improving transparency and accountability on the use of development resources is widely recog-nised as a powerful catalyst of progress. Enhancing the credibility of the budget as a mechanism for governing the allocation and use of development resources (internal and external) is key: not only does it facilitate alignment of donor support, but it also enables parliamentary as well as civil society scrutiny of government policies on devel-opment and thus broadens country ownership. The credibility of the budget depends to a large extent on whether it is a reasonably accurate state-ment of available resources and their use.
Aid contributes to a significant proportion of many countries’ public expenditure, but a large proportion of aid flows are not reflected in governments’ annual budget estimates. In 2005, the baseline survey indicates that for nearly all countries, the credibility of development budgets is undermined by sizable discrepancies between the funds disbursed by donors and the informa-tion recorded in the budget estimates. Making improvements will require concerted and joint efforts by partner country authorities and donors on three fronts: ■ Donors should be more attentive to getting
information on intended disbursements to the budget authorities in good time and in a usable form.
■ Donors should be much more realistic about their ability to disburse the intended amounts on (agreed) schedules.
■ Partner country budget authorities need to be better equipped to capture information on donor disbursement intentions, or to make realistic estimates of expected shortfalls.

STRENGTHENING AND USING COUNTRY SYSTEMS
In the past, donors’ attempts to substitute for weak management capacity in partner govern-ments have led to many poor aid practices. The Paris Declaration encourages donors to increas-ingly use strengthened country systems to help partner countries develop institutions that can implement and account for their development policies and resource use to citizens and parlia-ments. By using country systems, donors also help strengthen them by avoiding poor aid prac-tices such as parallel implementation structures that are set up to satisfy donors’ individual fidu-ciary concerns.
In the two areas of public financial management and procurement that the survey focused on, use of country systems is proving more difficult than alignment with country strategies. In 2005, on average, 39-40% of aid flows used country public financial management and procurement systems. The degree of reliance on public financial management systems varies considerably among countries – from 2% in the Dominican Republic to 64% in Cape Verde. One factor that explains donors’ use of these systems is their quality – but only, analysis shows, to a small extent; other factors might also play an important role (e.g. the existence of reform programmes).
Progress on this agenda will require a better understanding of why donors use, or avoid using, country systems. In this connection, the use of common diagnostic tools to measure quality and decide on a reform agenda may be useful. There is encouraging evidence that countries are rapidly adopting the PEFA framework, the most commonly shared methodology for assessing public financial management performance. PEFA frameworks have now been prepared for 45 countries (usually as joint diagnostics carried out by two or more donors) and 78 countries are expected to be covered by the end of 2008.
Upgrading country systems is a major commit-ment and requires long-term support by donors. The survey clearly indicates that capacity devel-opment needs are often ill-defined and poorly addressed; there is still no common understanding of how donors can best support countries’ efforts to strengthen capacity. Here again common diag-nostic tools can focus dialogue on co-ordinated support to capacity development strategies.
SCALING DOWN THE COST OF MANAGING AID
A key aim of the aid effectiveness agenda is to decrease partner governments’ transaction costs of managing aid – especially the costs that arise from managing different donor procedures and channels of aid delivery. The Paris Declaration aims to curtail these costs by encouraging donors to align their aid with country priorities and systems, use common arrangements, and gener-ally reduce the number of uncoordinated donor activities (missions, reports, etc.).
The baseline survey provides clear evidence that the cost of managing aid is high for partner governments. For example, it shows that in 2005 donors fielded 10 453 missions in 34 countries – an average of 307 missions per country per year. (Other examples are presented in the individual country chapters, Volume 2 of the survey.)
Donors have a legitimate need for information to meet their own accountability requirements; however, demands by many donors for financial and performance information that a country does not require for its own management and account-ability needs can divert efforts away from reform processes. Donors need to make much greater efforts to satisfy their fiduciary requirements (the assurance that donor funds are used for intended purposes) with information that countries need to meet their own development objectives.
552006 SURVEY ON MONITORING THE PARIS DECLARATION: OVERVIEW OF THE RESULTS - ISBN 978-92-64-01965-2 - ©OECD 2007

The cost of managing aid could increase signifi-cantly as the volume of aid is scaled up, new (emerging) donors become more active and new initiatives are created. This is why the interna-tional community needs to focus on the issue, both by curbing transactions costs and by finding ways for donors to internalise the normal costs of delivering aid more effectively.■ Curbing transaction costs aggressively
As the survey indicates, significant efforts have already been made to reduce transaction costs at country level: using local harmonisation and alignment action plans, collaborating on joint country assistance strategies, creating division-of-labour and lead donor arrangements, and establishing “quiet periods” when donors agree not to field missions in a particular country. Donors and partner countries should continue to pursue (and to scale up) these mechanisms. They also need to give special attention to expanded use of delegated co-operation and other innovative approaches, and to increased reliance on strengthened country systems. Taken individually or in combination, these mechanisms should contribute to decreasing and better co-ordinating the number of separate procedures for aid delivery at country or sector level, and thus to reducing the transaction costs to partner countries.
■ Internalising the normal operational costs of doing business differently More effective aid is not necessarily aid delivered cheaply. Donors and partners must understand that initially there may be new costs associated with doing business differently. For example, collaborative work is not cost-free: according to the World Bank, co-ordinated multi-donor programmes typically require 15-20% more staff and budget resources than traditional stand- alone projects. Such costs constitute an up-front investment in doing business more effectively and should be factored into operational budgets and allocation of staff time.
MUTUAL ACCOUNTABILITY
The survey shows that an increasing number of countries are beginning to establish monitoring and review processes to track donor and govern-ment performance against aid effectiveness commitments. There are two important features in these mechanisms:■ Annual reporting against aid effectiveness
commitments by both donors and government.
■ Periodic independent evaluations, addressing particular aid effectiveness topics.
The results of these monitoring processes should be used to enhance dialogue between government and donors on aid effectiveness. A significant number of countries are using the 2006 survey to establish baselines and review processes; and a number of donors report that the survey mecha-nism has already encouraged them to review their practices, and has helped to advocate for change within their own organisations. Repeating the survey on a regular basis will help sustain the momentum for progress.
56 2006 SURVEY ON MONITORING THE PARIS DECLARATION: OVERVIEW OF THE RESULTS - ISBN 978-92-64-01965-2 - ©OECD 2007

572006 SURVEY ON MONITORING THE PARIS DECLARATION: OVERVIEW OF THE RESULTS - ISBN 978-92-64-01965-2 - ©OECD 2007
DONOR CORPORATE-LEVEL INCENTIVES FOR ACTION
Most development agencies have made major efforts to achieve their commitments under the Paris Declaration, and donor staff are often dedicated to the objectives of increased aid effec-tiveness. Nevertheless, the survey suggests that, at the corporate level, a number of obstacles work against donors’ ability to meet the commitments they made in Paris. Aid effectiveness actions are implemented at country level but need to be enabled by donor headquarters.
For example, in many agencies the Paris Declaration is principally owned by policy staff at headquarters. At country level, harmonisation tasks are sometimes seen as getting in the way of efforts to achieve tangible development results. Staff have found that collaborative work is typi-cally more onerous than stand-alone project work: it is time-consuming, often frustrating, requires protracted discussions and typically entails concessions that are seen to compromise the effectiveness of programmes. Donor organi-sations need to acknowledge the importance of these efforts, and they need to provide incentives for staff that reflect the importance of improving aid effectiveness and collective development impact through collaborative efforts.
Corporate rules and practices can get in the way of implementing some of the Paris commitments: for example, pressures to commit and disburse funds and high staff turnover can create incentives that reward short-term and tangible outputs over longer-term and sustainable results. There may also be competing incentives at work regarding assuring donor financial controls, reducing legal liabilities and upholding procurement integrity, that will need to be reviewed and reconciled with aid effectiveness objectives.
Donors can do more to improve collaborative work through four sets of actions, to be carefully considered when preparing and updating their corporate aid effectiveness action plans and in subsequent reporting on their efforts to imple-ment the Paris Declaration: ■ Provide leadership
At the corporate level the most influential source of incentives is leadership: conveying the consistent message that aid effectiveness is a key priority.
■ Acknowledge the cost and benefits of collaborative work It is important that headquarters offices fully acknowledge both the costs and benefits of undertaking harmonisation and alignment actions and create positive incentives as well as removing negative ones.
■ Focus incentives on development outcomes (rather than just individual programme outputs) This might include, for instance, rewarding country staff for progress made on aid effectiveness at the country level, country-level progress against the Paris indicators and broader development results.
■ Review procedural and legal frameworks Donors can make an effort to identify rules, procedures or practices that work against the commitments made in Paris.

The following matrix aims to set out the action-oriented conclusions and recommendations that can be drawn from the baseline survey analysis. They build on the five pillars of the Paris Declaration (owner-ship, alignment, harmonisation, managing for results and accountability) and have been enriched by the discussions between developing-country and donor partners at country level, in recent regional conferences, in the OECD-DAC Working Party on Aid Effectiveness and by consultations with civil society. They are intended to draw attention to the key issues and areas that cannot necessarily be addressed at the country level alone and likely will require attention at corporate policy and operation levels before the Ghana High-Level Forum on Aid Effectiveness.
58 2006 SURVEY ON MONITORING THE PARIS DECLARATION: OVERVIEW OF THE RESULTS - ISBN 978-92-64-01965-2 - ©OECD 2007
RECOMMENDATIONS FOR ACTION
RECOMMENDED ACTIONS BASELINE CONCLUSIONS
National development strategies
■ Senior policy makers should clearly signal the importance of translating strategies into well-prioritised and sequenced action plans.
■ Strategies need to be more effectively connected to national budgets.
■ Governments should be increasingly accountable for their strategies through the regular mechanisms of democratic accountability.
■ Donors should help countries strengthen plans and their links to the budget through focused support for capacity development.
■ Increasingly, countries have sound medium-term policy frameworks. However, very few countries (17%) in the survey meet the agreed criteria for fully operational development strategies.
■ Parliaments and civil society are not always in a position to scrutinise national development strategies.
■ There are weaknesses in mechanisms linking budget formulation and execution to national plans, policy priorities and results.
Alignment of aid on national budgets
■ Countries need to establish a comprehensive and credible budget linked to policy priorities.
■ Donors need to provide information on intended disbursements to the budget authorities and provide aid on budget in good time, and aligned with programme and sector priorities in the budget.
■ Donors and partners need to work together to ensure that budget estimates are more realistic.
■ A large proportion of aid flows to the government are not comprehensively and accurately reflected in partner governments’ annual budget estimates.
■ This undermines the credibility of the national budget as a tool for governing effective allocation of resources in accordance with policy priorities.
Quality of country systems
■ Senior policy makers in partner countries should clearly signal the importance of improving the performance of their systems.
■ More partner countries should use performance assessment tools and frameworks to improve performance of their systems.
■ Countries are increasingly making use of performance assessment tools such the PEFA framework to improve quality of their systems.
■ However, only 31% of countries in the survey have at least moderately strong public financial management systems (no information is yet available on procurement systems).
Strengthen capacity
■ Donors should work with existing country capacity, taking care not to displace it with foreign expertise.
■ Technical assistance should be demand-driven and closely linked to the achievement of national reform goals.
■ Donors should involve partners more systematically in defining the role and profile of technical assistance required.
■ Technical co-operation accounts for nearly a third (29%) of aid for the government sector (USD 5.6 billion).
■ The survey suggests that nearly half (48%) of technical co-operation is provided in a co-ordinated way. There is agreement at country level that the baseline is overstated.
■ Absence of a shared understanding on what constitutes co-ordinated technical co-operation means that the baseline captures a very broad range of practices, including contentious practices.
OWNERSHIP AND ALIGNMENT
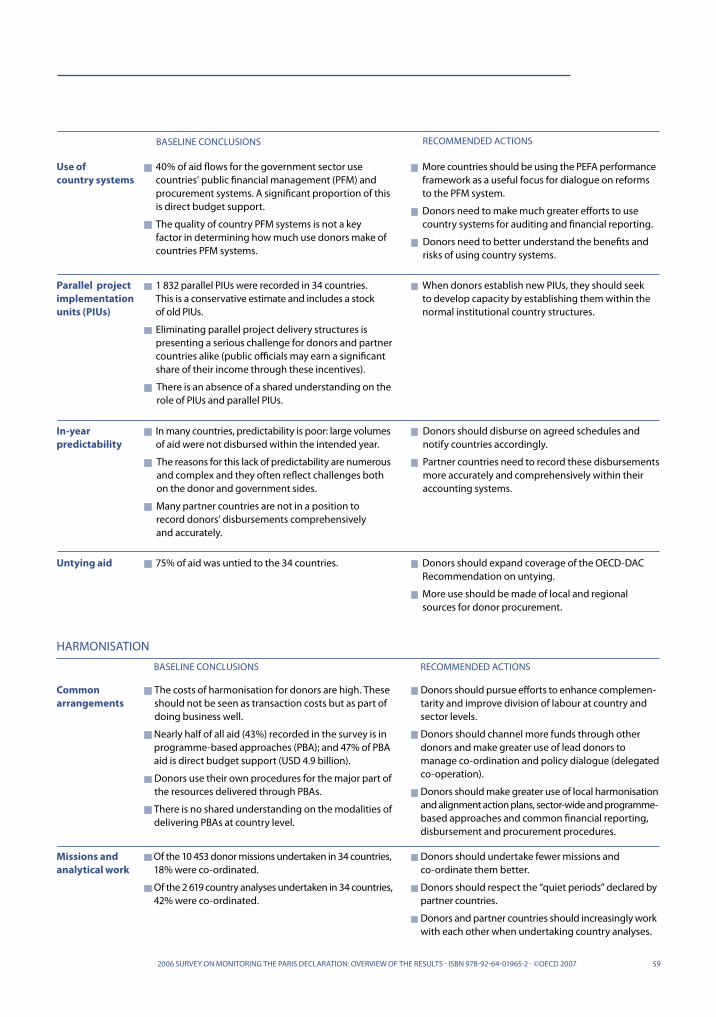
RECOMMENDED ACTIONS BASELINE CONCLUSIONS
In-year predictability
■ Donors should disburse on agreed schedules and notify countries accordingly.
■ Partner countries need to record these disbursements more accurately and comprehensively within their accounting systems.
■ In many countries, predictability is poor: large volumes of aid were not disbursed within the intended year.
■ The reasons for this lack of predictability are numerous and complex and they often reflect challenges both on the donor and government sides.
■ Many partner countries are not in a position to record donors’ disbursements comprehensively and accurately.
Parallel project implementation units (PIUs)
■ When donors establish new PIUs, they should seek to develop capacity by establishing them within the normal institutional country structures.
■ 1 832 parallel PIUs were recorded in 34 countries. This is a conservative estimate and includes a stock of old PIUs.
■ Eliminating parallel project delivery structures is presenting a serious challenge for donors and partner countries alike (public officials may earn a significant share of their income through these incentives).
■ There is an absence of a shared understanding on the role of PIUs and parallel PIUs.
Untying aid ■ Donors should expand coverage of the OECD-DAC Recommendation on untying.
■ More use should be made of local and regional sources for donor procurement.
■ 75% of aid was untied to the 34 countries.
Use of country systems
■ More countries should be using the PEFA performance framework as a useful focus for dialogue on reforms to the PFM system.
■ Donors need to make much greater efforts to use country systems for auditing and financial reporting.
■ Donors need to better understand the benefits and risks of using country systems.
■ 40% of aid flows for the government sector use countries’ public financial management (PFM) and procurement systems. A significant proportion of this is direct budget support.
■ The quality of country PFM systems is not a key factor in determining how much use donors make of countries PFM systems.
592006 SURVEY ON MONITORING THE PARIS DECLARATION: OVERVIEW OF THE RESULTS - ISBN 978-92-64-01965-2 - ©OECD 2007
RECOMMENDED ACTIONS BASELINE CONCLUSIONS
Common arrangements
■ Donors should pursue efforts to enhance complemen-tarity and improve division of labour at country and sector levels.
■ Donors should channel more funds through other donors and make greater use of lead donors to manage co-ordination and policy dialogue (delegated co-operation).
■ Donors should make greater use of local harmonisation and alignment action plans, sector-wide and programme- based approaches and common financial reporting, disbursement and procurement procedures.
■ The costs of harmonisation for donors are high. These should not be seen as transaction costs but as part of doing business well.
■ Nearly half of all aid (43%) recorded in the survey is in programme-based approaches (PBA); and 47% of PBA aid is direct budget support (USD 4.9 billion).
■ Donors use their own procedures for the major part of the resources delivered through PBAs.
■ There is no shared understanding on the modalities of delivering PBAs at country level.
HARMONISATION
Missions and analytical work
■ Donors should undertake fewer missions and co-ordinate them better.
■ Donors should respect the “quiet periods” declared by partner countries.
■ Donors and partner countries should increasingly work with each other when undertaking country analyses.
■ Of the 10 453 donor missions undertaken in 34 countries, 18% were co-ordinated.
■ Of the 2 619 country analyses undertaken in 34 countries, 42% were co-ordinated.

60 2006 SURVEY ON MONITORING THE PARIS DECLARATION: OVERVIEW OF THE RESULTS - ISBN 978-92-64-01965-2 - ©OECD 2007
RECOMMENDED ACTIONS BASELINE CONCLUSIONS
Mutual accountability
■ Countries should establish monitoring and review processes to track donor and government performance against aid effectiveness commitments.
■ The results of these monitoring processes should be used to enhance the dialogue between government and donors in Consultative Groups, round tables and “Results and Resource” processes.
■ 44% of the countries (15 countries) in the survey have a mechanism for mutual review of progress on aid effectiveness commitments.
■ The key challenge for mutual accountability is to strike a better balance between donor and country domestic accountability needs for effective use and desired impact of aid.
■ Civil society is often a major player in demanding accountability.
MUTUAL ACCOUNTABILITY
MANAGING FOR RESULTS RECOMMENDED ACTIONS BASELINE CONCLUSIONS
Managing for results
■ Partners and donors should use agreed performance assessment frameworks based on a manageable set of indicators to track results included in national development and sector strategies.
■ Donors should provide more support for evidence-based policy making by helping countries improve their statistical, monitoring and evaluation systems.
■ Major investments have been made in recent years in improving poverty monitoring.
■ However, there are still major deficits in the monitoring of national development plans: only 7% of countries in the survey (two countries) have achieved good practice in this area.
■ Performance matrices are often too elaborate and rely on information that is difficult to capture.
■ At the programme level, managing for results depends more on well-designed review processes.
1 A baseline survey of 34 countries; findings from the World Bank’s 2005 CDF Progress Report, which provides the baselines for Indicators 1 and 11; and the country profiles prepared for the World Bank’s Aid Effectiveness Review.

THE FOLLOWING TABLES PROVIDE THE DATA for all 12 of the indicators on a country- by-country basis (Appendices B and C provide information on a donor-by-donor basis). The data draws from a number of different sources:
Indicator 1 (Ownership) and Indicator 11 (Performance Assessment Frameworks) are based on the World Bank’s Comprehensive Development Framework (CDF) Progress Report.
Indicator 2a (Quality of country public financial management systems) is drawn from the World Bank’s Country Policy and Institutional Assessment (CPIA) sub-component 13.
Indicator 8 (Untying aid) is based on OECD-DAC data on untied aid.
Indicators 3 to 12 (but not Indicator 8) are drawn from the 2006 Survey on Monitoring the Paris Declaration. The process for establishing the data is fully explained in Chapter 2 of this report.
The charts in Chapter 1 are based on data presented in Appendices A and B.
STATISTICAL APPENDICES
612006 SURVEY ON MONITORING THE PARIS DECLARATION: OVERVIEW OF THE RESULTS - ISBN 978-92-64-01965-2 - ©OECD 2007

APPENDIX A DATA ON COUNTRIES (one table per indicator)
Table Indicator
A.0 Aid reported in the survey vs. core aid reported to the DAC 66
A.1 1 Do countries have operational development strategies? 67
A.2 2a How reliable are country public financial management systems? 67
A.3 3 Are government budget estimates comprehensive and realistic? 68
A.4 4 How much technical assistance is co-ordinated with country programmes? 69
A.5 5 How much aid for the government sectors uses country systems? 70
A.6 6 How many PIUs are parallel to country structures? 71
A.7 7 Are disbursements on schedule and recorded by government? 72
A.8 8 How much aid is untied? 73
A.9 9 How much aid is programme based? 74
A.10a 10a How many donor missions are co-ordinated? 75
A.10b 10b How much country analysis is co-ordinated? 76
A.11 11 Do countries have monitorable performance assessment frameworks? 77
A.12 12 Do countries have reviews of mutual accountability? 77
APPENDIX B DATA ON DONORS (one table per indicator)
Table Indicator
B.3 3 Are government budget estimates comprehensive and realistic? 80
B.4 4 How much technical assistance is co-ordinated with country programmes? 81
B.5 5 How much aid for the government sectors uses country systems? 82
B.6 6 How many PIUs are parallel to country structures? 83
B.7 7 Are disbursements on schedule and recorded by government? 84
B.8 8 How much aid is untied? 85
B.9 9 How much aid is programme based? 86
B.10a 10a How many donor missions are co-ordinated? 87
B.10b 10b How much country-analysis is co-ordinated? 88
STATISTICAL APPENDICES
TABLE OF CONTENTS
632006 SURVEY ON MONITORING THE PARIS DECLARATION: OVERVIEW OF THE RESULTS - ISBN 978-92-64-01965-2 - ©OECD 2007

64 2006 SURVEY ON MONITORING THE PARIS DECLARATION: OVERVIEW OF THE RESULTS - ISBN 978-92-64-01965-2 - ©OECD 2007
APPENDIX C DATA ON DONORS (one table per donor)
C.0 2010 Targets for the Paris Declaration 90
C.1 African Development Bank 92
C.2 Asian Development Bank 93
C.3 Australia 94
C.4 Austria 95
C.5 Belgium 96
C.6 Canada 97
C.7 Denmark 98
C.8 European Commission 99
C.9 Finland 100
C.10 France 101
C.11 GAVI Alliance 102
C.12 Germany 103
C.13 Global Fund 104
C.14 Inter-American Development Bank 105
C.15 Ireland 106
C.16 Italy 107
C.17 Japan 108
C.18 Korea 109
C.19 Luxembourg 110
C.20 Netherlands 111
C.21 New Zealand 112
C.22 Norway 113
C.23 Portugal 114
C.24 Spain 115
C.25 Sweden 116
C.26 Switzerland 117
C.27 United Kingdom 118
C.28 United Nations 119
C.29 United States 120
C.30 World Bank 121
APPENDIX D SURVEY QUESTIONNAIRES 123
Donor Questionnaire 124
Government Questionnaire 126
APPENDIX E GLOSSARY OF KEY TERMS 127

652006 SURVEY ON MONITORING THE PARIS DECLARATION: OVERVIEW OF THE RESULTS - ISBN 978-92-64-01965-2 - ©OECD 2007
THE FOLLOWING TABLES provide the data for all 12 of the indicators on a country-by-country basis. Data are available for the 34 countries that have taken part in the 2006 survey. The charts on the 34 country results presented in Chapter 1 are based on data included in Appendix A.
Table A.0 provides information on the coverage of the 2006 survey. The amounts reported in the Survey equate to 92% of the core aid – that is aid programmed for spending in countries – that members of the Development Assistance Committee reported for 2005. The coverage ranged from 62% to 118% – the differences could be due to aid from other donors, variations in timing of recording the flows and slight differences of definition. The 34 countries covered by the survey accounted for 37% of global country allocable aid provided by DAC members in 2005.
A COUNTRY DATA
ONE TABLE PER INDICATOR

TABLE A.0 Aid reported in the Survey vs. core aid reported to the DAC
66 2006 SURVEY ON MONITORING THE PARIS DECLARATION: OVERVIEW OF THE RESULTS - ISBN 978-92-64-01965-2 - ©OECD 2007
Aid reported in the 2006 survey
(USD m)a
Core aid reported to the DACx
(USD m)b
Ratio
(%)c = a / b
Gross ODA reported to the DAC y
(USD m)d
Ratio
(%)
e = a / d
x “Core aid” matches closely the definition of aid used in the survey; it excludes debt reorganisation and humanitarian aid.
y “Gross ODA” includes all types of ODA reported to the DAC for the calendar year 2005.z The total includes country allocable aid only; it excludes regional and global activities.
AFGHANISTAN 2 437 2 527 96% 2 776 88%
ALBANIA 343 331 104% 341 101%
BANGLADESH 1 837 1 696 108% 1 783 103%
BENIN 255 377 67% 405 63%
BOLIVIA 791 669 118% 701 113%
BURKINA FASO 593 688 86% 718 83%
BURUNDI 142 230 62% 399 36%
CAMBODIA 470 545 86% 555 85%
CAPE VERDE 110 176 62% 177 62%
CONGO DEM.REP. 934 1 024 91% 1 893 49%
DOMINICAN REPUBLIC 156 145 108% 147 106%
EGYPT 1 030 1 302 79% 1 491 69%
ETHIOPIA 1 288 1 333 97% 2 083 62%
GHANA 1 047 1 147 91% 1 619 65%
HONDURAS 432 553 78% 1 331 32%
KENYA 667 793 84% 917 73%
KYRGYZ REPUBLIC 187 293 64% 305 61%
MALAWI 605 564 107% 656 92%
MALI 625 714 88% 780 80%
MAURITANIA 165 186 89% 234 71%
MOLDOVA 139 162 86% 192 73%
MONGOLIA 171 223 77% 234 73%
MOZAMBIQUE 1 267 1 326 96% 1 359 93%
NICARAGUA 533 635 84% 834 64%
NIGER 393 447 88% 565 70%
PERU 559 569 98% 652 86%
RWANDA 571 545 105% 628 91%
SENEGAL 515 683 75% 836 62%
SOUTH AFRICA 583 759 77% 763 76%
TANZANIA 1 433 1 543 93% 1 648 87%
UGANDA 1 088 1 126 97% 1 320 82%
VIET NAM 1 956 2 078 94% 2 090 94%
YEMEN 370 353 105% 443 83%
ZAMBIA 773 845 91% 1 876 41%
TOTAL 24 465 26 583 92% 32 752 75%
FOR REFERENCE: Global coverage of the survey
Total for the survey (34 countries) 24 465 26 583 92% 32 752 75%
All other countries (120 countries) -- 39 342 -- 68 723 --
TOTALz 24 465 65 925 37% 101 475 24%

TABLE A.2 Indicator 2a: How reliable are country public financial management systems?
AFGHANISTAN ..
ALBANIA 4
BANGLADESH 3
BENIN 4
BOLIVIA 3.5
BURKINA FASO 4
BURUNDI 2.5
CAMBODIA 2.5
CAPE VERDE 3.5
CONGO 2.5
DOMINICAN REPUBLIC ..
EGYPT 3.0
ETHIOPIA 3.5
GHANA 3.5
HONDURAS 4
KENYA 3.5
KYRGYZ REPUBLIC 3
MALAWI 3
MALI 4
MAURITANIA 2
MOLDOVA 3.5
MONGOLIA 4
MOZAMBIQUE 3.5
NICARAGUA 3.5
NIGER 3.5
PERU ..
RWANDA 3.5
SENEGAL 3.5
SOUTH AFRICA ..
TANZANIA 4.5
UGANDA 4
VIET NAM 4
YEMEN 3
ZAMBIA 3
Country Score Country Score Country Score
Source: World Bank Country Policy and Institutional Assessment (CPIA), 2005
TABLE A.1 Indicator 1: Do countries have operational development strategies?
AFGHANISTAN ..
ALBANIA C
BANGLADESH C
BENIN C
BOLIVIA C
BURKINA FASO C
BURUNDI D
CAMBODIA C
CAPE VERDE C
CONGO D
DOMINICAN REPUBLIC ..
EGYPT D
ETHIOPIA C
GHANA C
HONDURAS C
KENYA D
KYRGYZ REPUBLIC C
MALAWI C
MALI C
MAURITANIA B
MOLDOVA D
MONGOLIA D
MOZAMBIQUE C
NICARAGUA D
NIGER C
PERU ..
RWANDA B
SENEGAL C
SOUTH AFRICA ..
TANZANIA B
UGANDA B
VIET NAM B
YEMEN C
ZAMBIA C
Country Score Country Score Country Score
Source: World Bank CDF Progress Report for 2005.
672006 SURVEY ON MONITORING THE PARIS DECLARATION: OVERVIEW OF THE RESULTS - ISBN 978-92-64-01965-2 - ©OECD 2007

TABLE A.3 Indicator 3: Are government budget estimates comprehensive and realistic?
Government’s budget estimates of aid flows for FY05
(USD m)a
Aid disbursed by donors for government sector in FY05
(USD m)b
Baseline ratio*
(%)c = a / b c = b /a
* Baseline ratio is c = a / b except where government’s budget estimates are greater than disbursements (c = b /a).
AFGHANISTAN 2 312 1 262 55%
ALBANIA 85 269 32%
BANGLADESH 1 249 1 414 88%
BENIN 112 240 47%
BOLIVIA 885 628 71%
BURKINA FASO 359 531 68%
BURUNDI 72 183 39%
CAMBODIA 314 397 79%
CAPE VERDE 95 111 85%
CONGO DEM. REP. 804 651 81%
DOMINICAN REPUBLIC 57 92 62%
EGYPT 581 998 58%
ETHIOPIA 779 1 048 74%
GHANA 985 946 96%
HONDURAS 667 334 50%
KENYA 415 456 91%
KYRGYZ REPUBLIC 104 149 70%
MALAWI 264 493 54%
MALI 334 557 60%
MAURITANIA 82 126 65%
MOLDOVA 62 89 70%
MONGOLIA 4 149 2%
MOZAMBIQUE 944 1 133 83%
NICARAGUA 305 418 73%
NIGER 346 344 99%
PERU 197 429 46%
RWANDA 272 554 49%
SENEGAL 403 453 89%
SOUTH AFRICA 249 351 71%
TANZANIA 1 158 1 294 90%
UGANDA 1 079 854 79%
VIET NAM 1 563 1 941 81%
YEMEN 0 341 0%
ZAMBIA 361 696 52%
TOTAL 17 497 19 931 88%
Average country ratio .. .. 42%
68 2006 SURVEY ON MONITORING THE PARIS DECLARATION: OVERVIEW OF THE RESULTS - ISBN 978-92-64-01965-2 - ©OECD 2007

692006 SURVEY ON MONITORING THE PARIS DECLARATION: OVERVIEW OF THE RESULTS - ISBN 978-92-64-01965-2 - ©OECD 2007
TABLE A.4 Indicator 4: How much technical assistance is co-ordinated with country programmes?
Co-ordinated technical co-operation (USD m)
a
Total technical co-operation (USD m)
b
Baseline ratio* (%)
c = a / b
* Baseline ratio is c = a / b except where government’s budget estimates are greater than disbursements (c = b /a).
AFGHANISTAN 79 214 37%
ALBANIA 44 156 28%
BANGLADESH 73 238 31%
BENIN 20 36 56%
BOLIVIA 143 178 80%
BURKINA FASO 3 75 3%
BURUNDI 25 59 43%
CAMBODIA 77 212 36%
CAPE VERDE 40 43 93%
CONGO DEM. REP. 12 109 11%
DOMINICAN REPUBLIC 40 108 37%
EGYPT 245 321 76%
ETHIOPIA 51 189 27%
GHANA 70 174 40%
HONDURAS 70 148 47%
KENYA 104 173 60%
KYRGYZ REPUBLIC 18 77 24%
MALAWI 34 73 47%
MALI 16 103 15%
MAURITANIA 9 45 19%
MOLDOVA 22 86 26%
MONGOLIA 13 69 18%
MOZAMBIQUE 78 204 38%
NICARAGUA 36 124 29%
NIGER 9 58 15%
PERU 14 267 5%
RWANDA 78 135 58%
SENEGAL 20 111 18%
SOUTH AFRICA 279 293 95%
TANZANIA 123 248 50%
UGANDA 70 168 42%
VIET NAM 702 827 85%
YEMEN 23 140 16%
ZAMBIA 55 170 32%
TOTAL 2 694 5 631 48%
Average country ratio .. .. 42%

TABLE A.5 Indicator 5: How much aid for the government sectors uses country systems?
AFGHANISTAN 1 262 571 545 545 44% 558 44%
ALBANIA 269 47 39 26 14% 15 6%
BANGLADESH 1 414 899 503 854 53% 680 48%
BENIN 240 134 132 107 52% 154 64%
BOLIVIA 628 296 137 60 26% 95 15%
BURKINA FASO 531 234 263 212 45% 321 60%
BURUNDI 183 53 47 35 24% 35 19%
CAMBODIA 397 69 35 12 10% 22 6%
CAPE VERDE 111 74 73 67 64% 60 53%
CONGO DEM. REP. 651 200 22 30 13% 200 31%
DOMINICAN REPUBLIC 92 3 0 4 2% 5 5%
EGYPT 998 283 297 265 28% 249 25%
ETHIOPIA 1 048 609 473 338 45% 449 43%
GHANA 946 653 581 530 62% 491 52%
HONDURAS 334 131 101 30 26% 17 5%
KENYA 456 216 208 223 47% 204 45%
KYRGYZ REPUBLIC 149 5 5 5 3% 3 2%
MALAWI 493 250 275 284 55% 173 35%
MALI 557 180 159 153 29% 249 45%
MAURITANIA 126 5 5 6 4% 25 20%
MOLDOVA 89 22 22 22 25% 22 25%
MONGOLIA 149 78 78 63 49% 38 26%
MOZAMBIQUE 1 133 449 396 373 36% 431 38%
NICARAGUA 418 287 152 112 44% 116 28%
NIGER 344 128 78 73 27% 168 49%
PERU 429 209 163 183 43% 188 44%
RWANDA 554 207 224 221 39% 255 46%
SENEGAL 453 114 106 89 23% 131 29%
SOUTH AFRICA 351 126 147 128 38% 153 44%
TANZANIA 1 294 989 785 784 66% 792 61%
UGANDA 854 566 413 563 60% 463 54%
VIET NAM 1 941 707 622 542 32% 635 33%
YEMEN 341 35 26 35 10% 46 13%
ZAMBIA 696 228 254 231 34% 303 44%
TOTAL 19 933 9 057 7 365 7 205 40% 7 745 39%
Average country ratio .. .. .. .. 33% .. 38%
70 2006 SURVEY ON MONITORING THE PARIS DECLARATION: OVERVIEW OF THE RESULTS - ISBN 978-92-64-01965-2 - ©OECD 2007
Procurement
Aid disbursed by donors for government
sector (USD m)
a
Public financial management
Budget execution (USD m)
b
Financial reporting (USD m)
c
Auditing
(USD m)d
Baseline ratio (%)
avg (b,c,d) / a
Baseline ratio (%)e/a
Procurement systems (USD m)
e

712006 SURVEY ON MONITORING THE PARIS DECLARATION: OVERVIEW OF THE RESULTS - ISBN 978-92-64-01965-2 - ©OECD 2007
TABLE A.6 Indicator 6: How many PIUs are parallel to country structures?
AFGHANISTAN 28
ALBANIA 57
BANGLADESH 38
BENIN 29
BOLIVIA 66
BURKINA FASO 131
BURUNDI 37
CAMBODIA 56
CAPE VERDE 10
CONGO DEMOCRATIC REPUBLIC 34
DOMINICAN REPUBLIC 50
EGYPT 100
ETHIOPIA 103
GHANA 45
HONDURAS 52
KENYA 17
KYRGYZ REPUBLIC 85
MALAWI 69
MALI 65
MAURITANIA 23
MOLDOVA 43
MONGOLIA 80
MOZAMBIQUE 40
NICARAGUA 107
NIGER 52
PERU 55
RWANDA 48
SENEGAL 23
SOUTH AFRICA 15
TANZANIA 56
UGANDA 54
VIET NAM 111
YEMEN 29
ZAMBIA 24
TOTAL 1 832
Average 61
Parallel PIUs
(PIUs)

TABLE A.7 Indicator 7: Are disbursements on schedule and recorded by government?
72 2006 SURVEY ON MONITORING THE PARIS DECLARATION: OVERVIEW OF THE RESULTS - ISBN 978-92-64-01965-2 - ©OECD 2007
Disbursements recorded by government in FY05
(USD m)
a
Aid scheduled by donors for
disbursement in FY05 (USD m)
b
Baseline ratio*
(%) (%)c = a / b c = b / a
Aid actually disbursed by donors
in FY05 (USD m)
for reference only
* Baseline ratio is c = a / b except where disbursements recorded by government are greater than aid scheduled for disbursement (c = b /a).
AFGHANISTAN 1 267 1 061 1 262 84%
ALBANIA 108 222 269 49%
BANGLADESH 1 249 1 366 1 414 91%
BENIN 112 212 240 53%
BOLIVIA 455 722 628 63%
BURKINA FASO 438 478 531 92%
BURUNDI 72 137 183 53%
CAMBODIA 314 455 397 69%
CAPE VERDE 95 103 111 92%
CONGO DEM. REP. 516 622 651 83%
DOMINICAN REPUBLIC 14 127 92 11%
EGYPT 415 1 420 998 29%
ETHIOPIA 1 012 1 055 1 048 96%
GHANA 968 887 946 92%
HONDURAS 291 404 334 72%
KENYA 272 620 456 44%
KYRGYZ REPUBLIC 89 136 149 66%
MALAWI 317 550 493 58%
MALI 391 553 557 71%
MAURITANIA 99 252 126 39%
MOLDOVA 62 93 89 67%
MONGOLIA 74 158 149 47%
MOZAMBIQUE 861 1 228 1 133 70%
NICARAGUA 384 549 418 70%
NIGER 110 151 344 73%
PERU 211 440 429 48%
RWANDA 340 519 554 66%
SENEGAL 332 479 453 69%
SOUTH AFRICA 159 359 351 44%
TANZANIA 989 1 408 1 294 70%
UGANDA 811 966 854 84%
VIET NAM 1 568 2 013 1 941 78%
YEMEN 0 441 341 0%
ZAMBIA 465 930 696 50%
TOTAL 14 861 21 112 19 933 70%
Average country ratio .. .. .. 41%

732006 SURVEY ON MONITORING THE PARIS DECLARATION: OVERVIEW OF THE RESULTS - ISBN 978-92-64-01965-2 - ©OECD 2007
TABLE A.8 Indicator 8: How much aid is untied?
Untied aid
(USD m)a
Total bilateral aid as reported to the DAC
(USD m)b
Share of untied aid
(%)
c = a / b
AFGHANISTAN 671 1 543 44%
ALBANIA 41 69 59%
BANGLADESH 535 651 82%
BENIN 158 199 79%
BOLIVIA 258 330 78%
BURKINA FASO 361 391 92%
BURUNDI 87 146 60%
CAMBODIA 129 150 86%
CAPE VERDE 50 223 22%
CONGO DEM. REP. 725 823 88%
DOMINICAN REPUBLIC 8 29 28%
EGYPT 230 492 47%
ETHIOPIA 533 1 373 39%
GHANA 653 726 90%
HONDURAS 742 1 009 74%
KENYA 291 372 78%
KYRGYZ REPUBLIC 59 60 97%
MALAWI 439 452 97%
MALI 273 287 95%
MAURITANIA 76 104 73%
MOLDOVA 40 49 81%
MONGOLIA 56 66 85%
MOZAMBIQUE 611 686 89%
NICARAGUA 411 482 85%
NIGER 136 162 84%
PERU 114 180 63%
RWANDA 123 151 82%
SENEGAL 340 374 91%
SOUTH AFRICA 326 336 97%
TANZANIA 747 789 95%
UGANDA 442 546 81%
VIET NAM 883 1 321 67%
YEMEN 124 136 91%
ZAMBIA 1 481 1 494 99%
TOTAL 12 149 16 200 75%
Average country ratio .. .. 82%
FOR REFERENCE: Untied aid in 34 countries vs. the rest of the worldTotal for the survey (34 countries) 12 149 16 200 75%
All other countries (116 countries) 35 003 44 952 78%
TOTAL 47 152 61 152 77%

TABLE A.9 Indicator 9: How much aid is programme based?
74 2006 SURVEY ON MONITORING THE PARIS DECLARATION: OVERVIEW OF THE RESULTS - ISBN 978-92-64-01965-2 - ©OECD 2007
Programme-based approaches Total aid disbursed
(USD m
d
Baseline ratio
(%)
e = c / d
AFGHANISTAN 559 485 1 043 2 437 43%
ALBANIA 4 13 17 343 5%
BANGLADESH 300 457 757 1 837 41%
BENIN 91 64 155 255 61%
BOLIVIA 101 152 253 791 32%
BURKINA FASO 168 101 269 593 45%
BURUNDI 6 70 76 142 54%
CAMBODIA 15 98 113 470 24%
CAPE VERDE 15 26 40 110 37%
CONGO DEM. REP. 206 297 503 934 54%
DOMINICAN REPUBLIC 4 4 8 156 5%
EGYPT 144 487 630 1 030 61%
ETHIOPIA 356 322 678 1 288 53%
GHANA 296 256 552 1 047 53%
HONDURAS 83 102 185 432 43%
KENYA 65 233 298 667 45%
KYRGYZ REPUBLIC 10 12 22 187 12%
MALAWI 113 79 192 605 32%
MALI 124 176 300 625 48%
MAURITANIA 0 61 61 165 37%
MOLDOVA 22 0 22 139 16%
MONGOLIA 26 23 50 171 29%
MOZAMBIQUE 337 249 586 1 267 46%
NICARAGUA 93 163 256 533 48%
NIGER 33 89 123 393 31%
PERU 33 54 87 559 16%
RWANDA 198 39 237 571 42%
SENEGAL 60 235 295 515 57%
SOUTH AFRICA 0 154 154 583 27%
TANZANIA 573 222 795 1 433 55%
UGANDA 391 152 543 1 088 50%
VIET NAM 337 328 665 1 956 34%
YEMEN 11 172 184 370 50%
ZAMBIA 143 222 365 773 47%
TOTAL 4 916 5 597 10 513 24 465 43%
Average country ratio .. .. .. .. 35%
Budget support (USD m)
a
Other PBAs (USD m)
b
Total (USD m)c = a + b

752006 SURVEY ON MONITORING THE PARIS DECLARATION: OVERVIEW OF THE RESULTS - ISBN 978-92-64-01965-2 - ©OECD 2007
TABLE A.10a Indicator 10a: How many donor missions are co-ordinated?
Total donor missions (missions)
b
Baseline ratio (%)
c = a / b
Co-ordinated donor missions* (missions)
a
AFGHANISTAN 94 363 26%
ALBANIA 23 257 9%
BANGLADESH 55 286 19%
BENIN 25 175 14%
BOLIVIA 44 257 17%
BURKINA FASO 63 375 17%
BURUNDI 34 139 24%
CAMBODIA 146 568 26%
CAPE VERDE 8 74 11%
CONGO DEM. REP. 80 208 38%
DOMINICAN REPUBLIC 17 85 20%
EGYPT 69 381 18%
ETHIOPIA 55 207 27%
GHANA 66 336 20%
HONDURAS 112 521 22%
KENYA 29 319 9%
KYRGYZ REPUBLIC 79 340 23%
MALAWI 43 180 24%
MALI 22 300 7%
MAURITANIA 50 362 14%
MOLDOVA 40 201 20%
MONGOLIA 12 479 3%
MOZAMBIQUE 144 310 46%
NICARAGUA 34 356 9%
NIGER 35 168 21%
PERU 9 81 11%
RWANDA 21 244 9%
SENEGAL 47 310 15%
SOUTH AFRICA 32 169 19%
TANZANIA 94 542 17%
UGANDA 79 456 17%
VIET NAM 76 791 10%
YEMEN 120 458 26%
ZAMBIA 23 155 15%
TOTAL 1 880 10 453 18%
(*) Number of co-ordinated missions by country have been adjusted to avoid double counting.

76 2006 SURVEY ON MONITORING THE PARIS DECLARATION: OVERVIEW OF THE RESULTS - ISBN 978-92-64-01965-2 - ©OECD 2007
TABLE A.10b Indicator 10b: How much country analysis is co-ordinated?
Co-ordinated donor analytical work*
(analyses)a
Total donor analytical work
(analyses)b
Baseline ratio
(%)
c = a / b
AFGHANISTAN 50 147 34%
ALBANIA 17 74 22%
BANGLADESH 26 70 38%
BENIN 28 74 38%
BOLIVIA 15 50 30%
BURKINA FASO 35 78 45%
BURUNDI 17 30 55%
CAMBODIA 76 118 64%
CAPE VERDE 8 22 34%
CONGO DEM. REP. 53 149 35%
DOMINICAN REPUBLIC 14 30 48%
EGYPT 41 103 40%
ETHIOPIA 26 53 50%
GHANA 19 47 40%
HONDURAS 64 141 45%
KENYA 26 79 32%
KYRGYZ REPUBLIC 40 75 53%
MALAWI 21 35 60%
MALI 12 40 30%
MAURITANIA 33 56 59%
MOLDOVA 11 22 50%
MONGOLIA 21 60 35%
MOZAMBIQUE 55 87 63%
NICARAGUA 34 64 53%
NIGER 31 77 40%
PERU 8 55 15%
RWANDA 25 68 36%
SENEGAL 46 113 40%
SOUTH AFRICA 7 9 75%
TANZANIA 31 81 38%
UGANDA 59 146 40%
VIET NAM 35 144 24%
YEMEN 80 145 55%
ZAMBIA 35 77 46%
TOTAL 1 099 2 619 42%
(*) Total number of co-ordinated analytical works by country have been adjusted to avoid double counting.

TABLE A.11 Indicator 11: Do countries have monitorable performance assessment frameworks?
AFGHANISTAN ..
ALBANIA D
BANGLADESH D
BENIN C
BOLIVIA C
BURKINA FASO C
BURUNDI D
CAMBODIA C
CAPE VERDE D
CONGO D
DOM. REP. ..
EGYPT D
ETHIOPIA C
GHANA C
HONDURAS C
KENYA C
KYRGYZ REP. C
MALAWI C
MALI D
MAURITANIA C
MOLDOVA D
MONGOLIA C
MOZAMBIQUE C
NICARAGUA C
NIGER D
PERU ..
RWANDA C
SENEGAL C
SOUTH AFRICA ..
TANZANIA B
UGANDA B
VIET NAM C
YEMEN D
ZAMBIA D
Country Score Country Score Country Score
772006 SURVEY ON MONITORING THE PARIS DECLARATION: OVERVIEW OF THE RESULTS - ISBN 978-92-64-01965-2 - ©OECD 2007
TABLE A.12 Indicator 12: Do countries have reviews of mutual accountability?
AFGHANISTAN
BOLIVIA
CAMBODIA
CAPE VERDE
EGYPT
ETHIOPIA
GHANA
MALAWI
MOLDOVA
MOZAMBIQUE
NICARAGUA
SOUTH AFRICA
TANZANIA
VIET NAM
ZAMBIA
15 countries (44%)
ALBANIA
BANGLADESH
BENIN
BURKINA FASO
BURUNDI
CONGO DEMOCRATIC REPUBLIC
DOMINICAN REPUBLIC
HONDURAS
KENYA
KYRGYZ REPUBLIC
MALI
MAURITANIA
MONGOLIA
NIGER
PERU
RWANDA
SENEGAL
UGANDA
YEMEN
19 countries (56%)
“YES” “NO”
Countries that DO have mechanisms for mutual review of progress (2005)
Countries that DO NOT have mechanisms for mutual review of progress (2005)


792006 SURVEY ON MONITORING THE PARIS DECLARATION: OVERVIEW OF THE RESULTS - ISBN 978-92-64-01965-2 - ©OECD 2007
THE FOLLOWING TABLES PRESENT RESULTS on a donor-by-donor basis for all the indicators that are based on donors’ data (Indicators 3 to 10b). The tables are listed indicator-by-indicator for all donors (one table per indicator).
Data are available for the 55 donors that took part in the 2006 survey. Not all donors are listed in the tables below. The following criteria were applied in establishing donors that are listed in Appendix B:
■ All OECD donors that have reported data in at least one country.
■ Other donors (bilateral and multilateral) that have reported over USD 100 million for the government sector in at least three countries, or that have asked to be included.
Donors that are not listed individually have been aggregated in the “All Other Donors” category in the tables.
The charts presenting the results of the largest donors in Chapter 1 are based on data included in Appendix B. The largest donors include only those donors that have reported over USD 100 million for the government sector in at least three countries.
B DONOR DATA
ONE TABLE PER INDICATOR

TABLE B.3 Indicator 3: Are government budget estimates comprehensive and realistic?
No. of countries Government’s budget estimates
of aid flows for FY05 (USD m)
a
Aid disbursed by donors for government sector
in FY05 (USD m)
b
80 2006 SURVEY ON MONITORING THE PARIS DECLARATION: OVERVIEW OF THE RESULTS - ISBN 978-92-64-01965-2 - ©OECD 2007
Baseline ratio*
(%)c = a / b c = b /a
* Baseline ratio is c = a / b except where government’s budget estimates are greater than disbursements (c = b /a).
African Development Bank 17 734 700 95%
Asian Development Bank 6 587 671 88%
Australia 5 28 77 36%
Austria 7 10 13 79%
Belgium 16 64 145 44%
Canada 22 258 342 75%
Denmark 18 246 520 47%
European Commission 34 1 919 2 364 81%
Finland 11 101 87 87%
France 26 205 392 52%
GAVI Alliance 11 0 61 0% Germany 32 555 1 000 55%
Global Fund 27 88 338 26%
Inter-American Development Bank 5 505 305 60%
Ireland 6 70 147 48%
Italy 13 49 138 36%
Japan 30 1 096 1 615 68%
Korea 3 2 17 12%
Luxembourg 3 26 33 77%
Netherlands 24 410 586 70%
New Zealand 3 2 4 40%
Norway 13 139 248 56%
Portugal 2 18 75 24%
Spain 11 91 104 87%
Sweden 24 216 444 49%
Switzerland 22 66 126 52%
United Kingdom 23 921 1 102 84%
United Nations 34 411 1 148 36%
United States 29 1 328 1 199 90%
World Bank 32 5 012 5 307 94%
All Other Donors -- 2 340 623 27%
TOTAL 17 497 19 933 88%
Average country ratio .. .. 42%
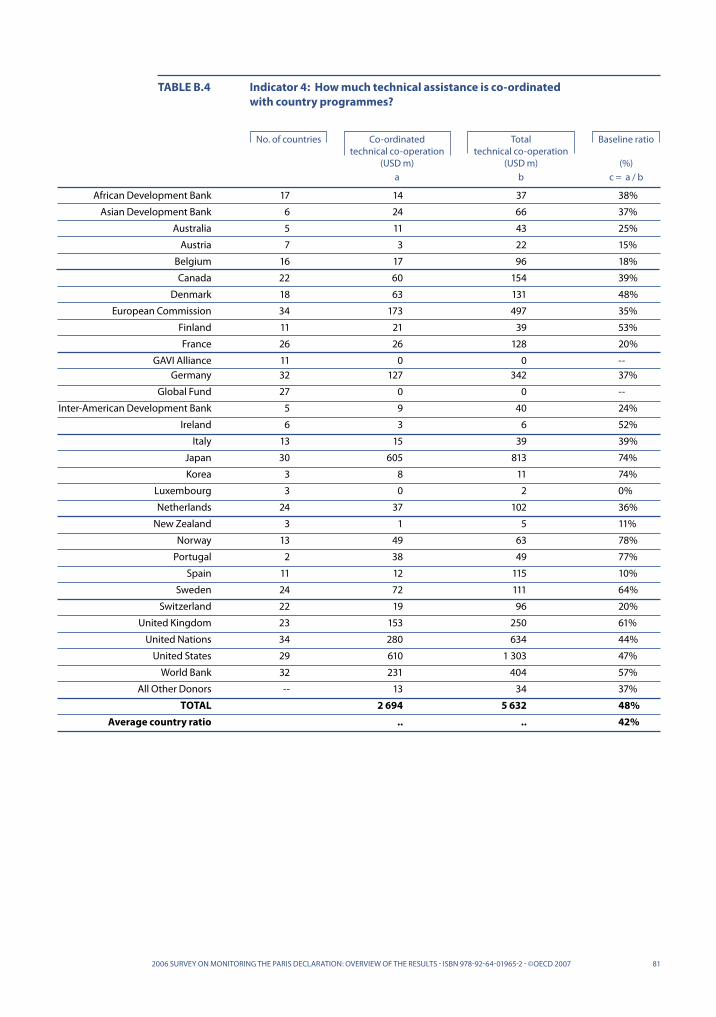
812006 SURVEY ON MONITORING THE PARIS DECLARATION: OVERVIEW OF THE RESULTS - ISBN 978-92-64-01965-2 - ©OECD 2007
TABLE B.4 Indicator 4: How much technical assistance is co-ordinated with country programmes?
No. of countries Co-ordinated technical co-operation
(USD m)a
Total technical co-operation
(USD m) b
Baseline ratio
(%)c = a / b
African Development Bank 17 14 37 38%
Asian Development Bank 6 24 66 37%
Australia 5 11 43 25%
Austria 7 3 22 15%
Belgium 16 17 96 18%
Canada 22 60 154 39%
Denmark 18 63 131 48%
European Commission 34 173 497 35%
Finland 11 21 39 53%
France 26 26 128 20%
GAVI Alliance 11 0 0 -- Germany 32 127 342 37%
Global Fund 27 0 0 --
Inter-American Development Bank 5 9 40 24%
Ireland 6 3 6 52%
Italy 13 15 39 39%
Japan 30 605 813 74%
Korea 3 8 11 74%
Luxembourg 3 0 2 0%
Netherlands 24 37 102 36%
New Zealand 3 1 5 11%
Norway 13 49 63 78%
Portugal 2 38 49 77%
Spain 11 12 115 10%
Sweden 24 72 111 64%
Switzerland 22 19 96 20%
United Kingdom 23 153 250 61%
United Nations 34 280 634 44%
United States 29 610 1 303 47%
World Bank 32 231 404 57%
All Other Donors -- 13 34 37%
TOTAL 2 694 5 632 48%
Average country ratio .. .. 42%

Procurement systems
e (USD m) e /a
TABLE B.5 Indicator 5: How much aid for the government sectors uses country systems?
82 2006 SURVEY ON MONITORING THE PARIS DECLARATION: OVERVIEW OF THE RESULTS - ISBN 978-92-64-01965-2 - ©OECD 2007
No. of countries
Aid disbursed
for gov. sector
(USD m) a
PFM systems
African Development Bank 17 700 304 195 194 33% 304 43%
Asian Development Bank 6 671 567 408 408 69% 300 45%
Australia 5 77 0 1 14 6% 4 5%
Austria 7 13 4 1 3 22% 4 32%
Belgium 16 145 34 38 31 24% 63 43%
Canada 22 342 151 144 137 42% 153 45%
Denmark 18 520 159 167 128 29% 234 45%
European Commission 34 2 364 998 967 865 40% 972 41%
Finland 11 87 35 37 26 38% 45 52%
France 26 392 111 144 70 28% 234 60%
GAVI Alliance 11 61 0 0 60 33% 1 2%
Germany 32 1 000 404 360 302 35% 337 34%
Global Fund 27 338 215 197 0 41% 150 44%
Inter-American Development Bank 5 305 292 94 24 45% 0 0%
Ireland 6 147 141 130 124 90% 142 96%
Italy 13 138 36 57 29 29% 69 50%
Japan 30 1 615 469 466 469 29% 423 26%
Korea 3 17 7 7 7 45% 0 0%
Luxembourg 3 33 0 0 0 0% 0 0%
Netherlands 24 586 407 405 427 71% 459 78%
New Zealand 3 4 0 1 0 10% 1 14%
Norway 13 248 159 146 149 61% 171 69%
Portugal 2 75 60 60 60 79% 60 80%
Spain 11 104 34 6 12 16% 15 14%
Sweden 24 444 220 217 190 47% 214 48%
Switzerland 22 126 56 59 63 47% 66 52%
United Kingdom 23 1 102 851 827 796 75% 839 76%
United Nations 34 1 148 254 183 179 18% 86 8%
United States 29 1 199 125 117 119 10% 145 12%
World Bank 32 5 307 2 634 1 843 2 230 42% 2 146 40%
All Other Donors -- 623 329 86 92 27% 108 17%
TOTAL 19 931 9 056 7363 7 208 40% 7 745 39%
Average country ratio .. .. .. .. 33% .. 38%
Budget executions
(USD m)b
Financial reporting (USD m)
c
Auditing
(USD m)d
Average use of 3 systems
(%)avg(b,c,d) / a
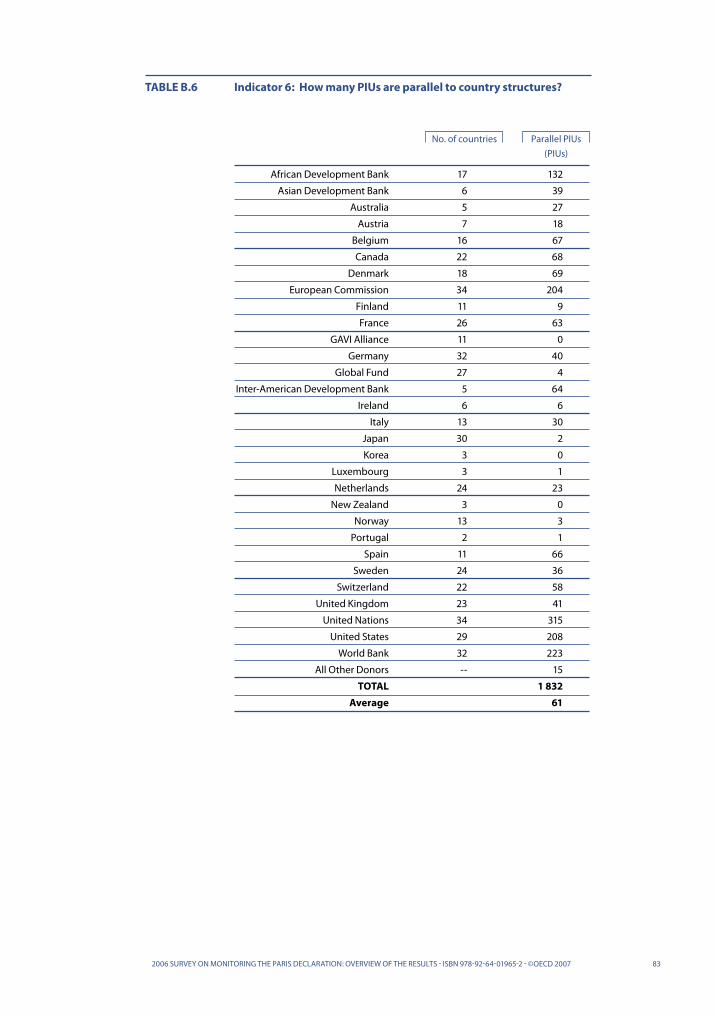
832006 SURVEY ON MONITORING THE PARIS DECLARATION: OVERVIEW OF THE RESULTS - ISBN 978-92-64-01965-2 - ©OECD 2007
TABLE B.6 Indicator 6: How many PIUs are parallel to country structures?
No. of countries Parallel PIUs
(PIUs)
African Development Bank 17 132
Asian Development Bank 6 39
Australia 5 27
Austria 7 18
Belgium 16 67
Canada 22 68
Denmark 18 69
European Commission 34 204
Finland 11 9
France 26 63
GAVI Alliance 11 0
Germany 32 40
Global Fund 27 4
Inter-American Development Bank 5 64
Ireland 6 6
Italy 13 30
Japan 30 2
Korea 3 0
Luxembourg 3 1
Netherlands 24 23
New Zealand 3 0
Norway 13 3
Portugal 2 1
Spain 11 66
Sweden 24 36
Switzerland 22 58
United Kingdom 23 41
United Nations 34 315
United States 29 208
World Bank 32 223
All Other Donors -- 15
TOTAL 1 832
Average 61

TABLE B.7 Indicator 7: Are disbursements on schedule and recorded by government?
84 2006 SURVEY ON MONITORING THE PARIS DECLARATION: OVERVIEW OF THE RESULTS - ISBN 978-92-64-01965-2 - ©OECD 2007
Disbursements recorded by government
in FY05(USD m)
a
Aid scheduled by donors for disbursement
in FY05 (USD m)
b
Baseline ratio*
(%)c = a / b c = b / a
Aid actually disbursed by donors
in FY05 (USD m)
for ref. only
No. of countries
* Baseline ratio is c = a / b except where disbursements recorded by government are greater than aid scheduled for disbursement (c = b /a).
African Development Bank 17 515 925 700 56%
Asian Development Bank 6 560 612 671 91%
Australia 5 23 78 77 29%
Austria 7 4 10 13 36%
Belgium 16 60 159 145 38%
Canada 22 251 345 342 73%
Denmark 18 248 501 520 49%
European Commission 34 1 632 2 515 2 364 65%
Finland 11 26 94 87 27%
France 26 156 344 392 45%
GAVI Alliance 11 0 62 61 0%
Germany 32 516 688 1 000 75%
Global Fund 27 68 335 338 20%
Inter-American Development Bank 5 282 344 305 82%
Ireland 6 90 125 147 72%
Italy 13 28 62 138 45%
Japan 30 1 042 1 588 1 615 66%
Korea 3 2 17 17 12%
Luxembourg 3 20 35 33 57%
Netherlands 24 421 644 586 65%
New Zealand 3 2 5 4 38%
Norway 13 144 287 248 50%
Portugal 2 18 88 75 20%
Spain 11 70 92 104 76%
Sweden 24 254 471 444 54%
Switzerland 22 78 136 126 58%
United Kingdom 23 988 1 094 1 102 90%
United Nations 34 392 1 227 1 148 32%
United States 29 713 1 573 1 199 45%
World Bank 32 4 150 6 061 5 307 68%
All Other Donors -- 2 112 597 623 28%
TOTAL 14 861 21 112 19 933 70%
Average country ratio .. .. .. 41%

852006 SURVEY ON MONITORING THE PARIS DECLARATION: OVERVIEW OF THE RESULTS - ISBN 978-92-64-01965-2 - ©OECD 2007
TABLE B.8 Indicator 8: How much aid is untied?
Total bilateral aid as reported to the DAC
(USD m)a
Untied aid
(USD m)b
Share of untied aid
(%)c = b / a
No. of countries
African Development Bank 17 -- -- --
Asian Development Bank 6 -- -- --
Australia 5 46 25 54%
Austria 7 53 27 51%
Belgium 16 251 244 97%
Canada 22 441 351 80%
Denmark 18 1 130 961 85%
European Commission 34 -- -- --
Finland 11 155 152 98%
France 26 1 080 974 90%
GAVI Alliance 11 -- -- -- Germany 32 726 682 94%
Global Fund 27 -- -- --
` Inter-American Development Bank 5 -- -- --
Ireland 6 256 256 100%
Italy 13 502 208 41%
Japan 30 3 089 2 759 89%
Korea 3 -- -- --
Luxembourg 3 91 91 100%
Netherlands 24 1 230 1 114 91%
New Zealand 3 25 12 48%
Norway 13 550 544 99%
Portugal 2 75 19 26%
Spain 11 484 147 30%
Sweden 24 814 814 100%
Switzerland 22 237 228 96%
United Kingdom 23 2 356 2 356 100%
United Nations 34 -- -- --
United States 29 2 612 186 7%
World Bank 32 -- -- --
All Other Donors -- -- -- --
TOTAL 16 200 12 149 75%
Average country ratio .. .. 82%

TABLE B.9 Indicator 9: How much aid is programme based?
86 2006 SURVEY ON MONITORING THE PARIS DECLARATION: OVERVIEW OF THE RESULTS - ISBN 978-92-64-01965-2 - ©OECD 2007
Programme-based approaches Total aid disbursed
(USD m)
d
Baseline ratio
(%)
e = c / d
No. of countries
Budget support (USD m)
a
Other PBAs (USD m)
b
Total (USD m)c = a + b
African Development Bank 17 236 49 285 705 40%
Asian Development Bank 6 141 20 161 693 23%
Australia 5 4 27 31 108 29%
Austria 7 1 12 13 29 45%
Belgium 16 16 45 61 192 32%
Canada 22 111 139 250 495 51%
Denmark 18 101 266 368 617 60%
European Commission 34 870 524 1 394 2 777 50%
Finland 11 11 33 44 111 39%
France 26 85 52 137 490 28%
GAVI Alliance 11 0 10 10 61 17%
Germany 32 62 155 218 1 082 20%
Global Fund 27 0 382 382 465 82%
Inter-American Development Bank 5 24 120 144 323 45%
Ireland 6 79 34 113 176 64%
Italy 13 8 54 63 155 40%
Japan 30 88 467 554 1 687 33%
Korea 3 0 0 0 17 0%
Luxembourg 3 0 14 14 34 41%
Netherlands 24 194 305 499 733 68%
New Zealand 3 0 0 0 6 6%
Norway 13 74 72 147 409 36%
Portugal 2 1 1 3 79 4%
Spain 11 20 19 39 287 14%
Sweden 24 140 147 287 605 47%
Switzerland 22 37 25 62 233 27%
United Kingdom 23 628 273 901 1 523 59%
United Nations 34 14 458 472 1 623 29%
United States 29 110 687 798 2 835 28%
World Bank 32 1 810 1 186 2 997 5 228 57%
All Other Donors -- 51 17 68 687 10%
TOTAL 4 916 5 597 10 513 24 465 43%
Average country ratio .. .. .. .. 35%

872006 SURVEY ON MONITORING THE PARIS DECLARATION: OVERVIEW OF THE RESULTS - ISBN 978-92-64-01965-2 - ©OECD 2007
TABLE B.10a Indicator 10a: How many donor missions are co-ordinated?
Co-ordinated donor missions* (missions)
a
Total donor missions (missions)
b
Baseline ratio (%)
c = a / b
No. of countries
African Development Bank 17 60 317 19%
Asian Development Bank 6 22 405 5%
Australia 5 1 15 7%
Austria 7 5 36 14%
Belgium 16 15 67 22%
Canada 22 55 333 17%
Denmark 18 52 158 33%
European Commission 34 189 580 33%
Finland 11 21 80 26%
France 26 66 687 10%
GAVI Alliance 11 0 0 --
Germany 32 120 425 28%
Global Fund 27 12 71 17%
Inter-American Development Bank 5 117 285 41%
Ireland 6 13 32 41%
Italy 13 7 93 8%
Japan 30 11 537 2%
Korea 3 0 19 0%
Luxembourg 3 2 10 20%
Netherlands 24 70 153 46%
New Zealand 3 1 5 20%
Norway 13 44 79 56%
Portugal 2 3 6 50%
Spain 11 5 66 8%
Sweden 24 65 203 32%
Switzerland 22 39 117 33%
United Kingdom 23 156 354 44%
United Nations 34 866 2 876 30%
United States 29 96 347 28%
World Bank 32 437 2 058 21%
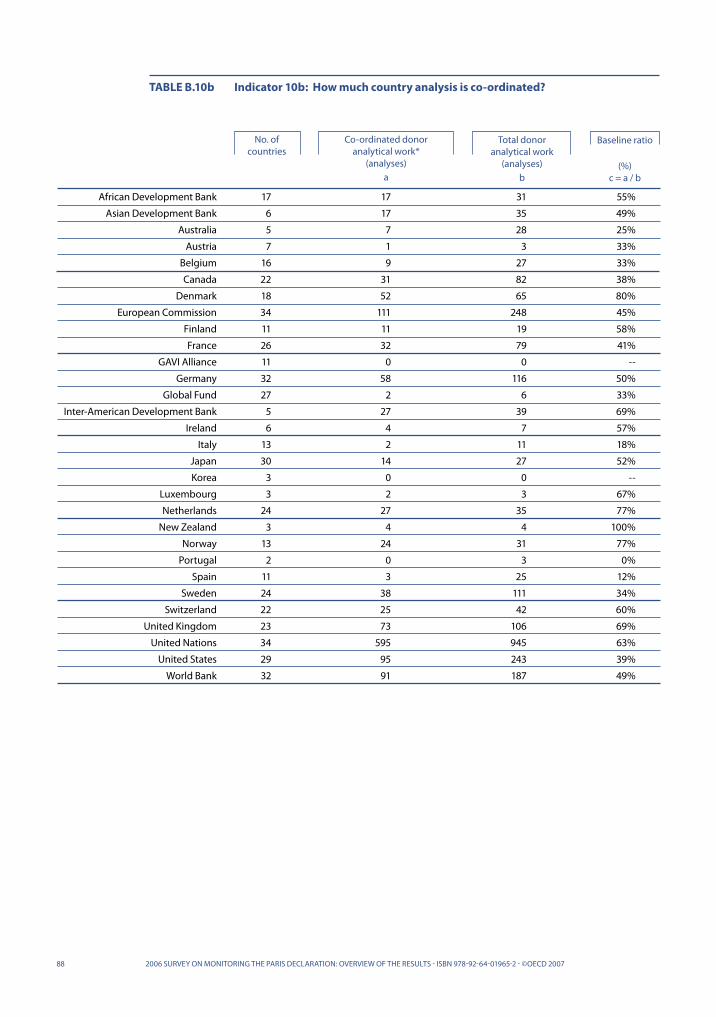
88 2006 SURVEY ON MONITORING THE PARIS DECLARATION: OVERVIEW OF THE RESULTS - ISBN 978-92-64-01965-2 - ©OECD 2007
TABLE B.10b Indicator 10b: How much country analysis is co-ordinated?
Co-ordinated donor analytical work*
(analyses)a
Total donor analytical work
(analyses)b
Baseline ratio
(%)c = a / b
No. of countries
African Development Bank 17 17 31 55%
Asian Development Bank 6 17 35 49%
Australia 5 7 28 25%
Austria 7 1 3 33%
Belgium 16 9 27 33%
Canada 22 31 82 38%
Denmark 18 52 65 80%
European Commission 34 111 248 45%
Finland 11 11 19 58%
France 26 32 79 41%
GAVI Alliance 11 0 0 --
Germany 32 58 116 50%
Global Fund 27 2 6 33%
Inter-American Development Bank 5 27 39 69%
Ireland 6 4 7 57%
Italy 13 2 11 18%
Japan 30 14 27 52%
Korea 3 0 0 --
Luxembourg 3 2 3 67%
Netherlands 24 27 35 77%
New Zealand 3 4 4 100%
Norway 13 24 31 77%
Portugal 2 0 3 0%
Spain 11 3 25 12%
Sweden 24 38 111 34%
Switzerland 22 25 42 60%
United Kingdom 23 73 106 69%
United Nations 34 595 945 63%
United States 29 95 243 39%
World Bank 32 91 187 49%

892006 SURVEY ON MONITORING THE PARIS DECLARATION: OVERVIEW OF THE RESULTS - ISBN 978-92-64-01965-2 - ©OECD 2007
THE FOLLOWING TABLES present results on a donor-by-donor basis for all the indicators that are based on donors’ data (Indicators 3 to 10b). There is one table per donor.
Data are available for the 55 donors that took part in the 2006 survey. Not all donors have a table in the appendix. The following criteria were applied in establishing the 30 donors that are shown in Appendix C: ■ All OECD donors that have reported data in at least one country. ■ Other donors (bilateral and multilateral) that have reported over USD 100
million for the government sector in at least three countries, or that have asked to be included.
IMPORTANT NOTE ON TABLES C.1 TO C.30
IN THE PARIS DECLARATION donors and partner countries agreed to collective targets for 2010. All donors are working to contribute to the achievement of these targets and are working with their partners on implementation plans in each country. The survey coverage of each donor’s ODA varies, as indicated at the top of each donor table. Some donors are at present unable to calculate targets that are representative of their total bilateral ODA. Some other donors have asked to include a column setting out individual targets in their tables. These notional targets, based on applying the Paris Declaration targets arithmetically, are for illustrative purposes only and reflect only the set of countries included in the survey for each donor. They do not prejudge individual targets that donors or partner countries might wish to set at a later date.
C DONOR DATA
ONE TABLE PER DONOR
IN ADDITION, FOR EACH DONOR, the table includes two columns: a baseline ratio and an average country ratio.
The baseline ratio is a weighted average, based on each donor’s portfolio in the surveyed countries. It is the Paris Declaration survey result for the base year of 2005. It is the aggregate value of the numerator divided by the aggregate value of the denominator; i.e. each country is weighted by the volume of activity (see illustrative example below).
The average country ratio is an unweighted average. It provides a comparative measure of the baseline irrespective of the volume of activity in each country; i.e. it gives equal weight to each country. It provides an indication of the variability of individual country baselines compared to the weighted average.
Illustrative exampleThe following example illustrates how the baseline ratio and the average country ratio are calculated for three countries.
In this example the baseline ratio is much lower than the average country ratio because of the high weight (87 out of 100 units) for Country C.
Country A = = 66%23
Average country ratio (unweighted average) =
x (66% + 90% + 18%) = 58% 13
Country B = = 90%9
10
Country C = = 18%1687
Baseline ratio (weighted average) =
= = 27% 2 + 9 + 16
3 + 10 + 8727
100
TABLE C.0 overleaf lists the agreed Paris Declaration collective targets for 2010.

TABLE C.0 2010 Targets for the Paris Declaration
OWNERSHIP TARGET FOR 2010
ALIGNMENT TARGETS FOR 2010
Strengthen capacity by co-ordinated support Percent of donor capacity-development support provided through co-ordinated programmes consistent with partners’ national development strategies.
50% of technical co-operation flows are implemented through co-ordinated programmes consistent with national development strategies.
4
Use of country public financial management systems Percent of donors and of aid flows that use public financial management systems in partner countries, which either (a) adhere to broadly accepted good practices or (b) have a reform programme in place to achieve these.
Percent of DonorsScore* Target
5+ All donors use partner countries’ PFM systems.
3.5 to 4.5 90% of donors use partner countries’ PFM systems.
Percent of Aid FlowsScore* Target
5+ A two-thirds reduction in the % of aid to the public sector not using partner countries’ PFM systems.
3.5 to 4.5 A one-third reduction in the % of aid to the public sector not using partner countries’ PFM systems.
5a
Use of country procurement systems Percent of donors and of aid flows that use partner country procurement systems which either (a) adhere to broadly accepted good practices or (b) have a reform programme in place to achieve these.
Percent of DonorsScore* Target
A All donors use partner countries’ procurement systems.
B 90% of donors use partner countries’ procurement systems.
Percent of Aid FlowsScore* Target
A A two-thirds reduction in the % of aid to the public sector not using partner countries’ procurement systems.
B A one-third reduction in the % of aid to the public sector not using partner countries’ procurement systems.
5b
Partners have operational development strategies Number of countries with national development strategies (including PRSs) that have clear strategic priorities linked to a medium-term expenditure framework and reflected in annual budgets.
At least 75% of partner countries have operational development strategies.
1
Reliable country systems Number of partner countries that have procurement and public financial management systems that either (a) adhere to broadly accepted good practices or (b) have a reform programme in place to achieve these.
(a) Public financial management Half of partner countries move up at least one measure (i.e. 0.5 points) on the PFM/ CPIA (Country Policy and Institutional Assessment) scale of performance.
(b) Procurement One-third of partner countries move up at least one measure (i.e. from D to C, C to B or B to A) on the four-point scale used to assess performance for this indicator.
Aid flows are aligned on national priorities Percent of aid flows to the government sector that is reported on partners’ national budgets.
Halve the gap halve the proportion of aid flows to government sector not reported on government’s budget(s) (with at least 85% reported on budget).
3
90 2006 SURVEY ON MONITORING THE PARIS DECLARATION: OVERVIEW OF THE RESULTS - ISBN 978-92-64-01965-2 - ©OECD 2007
2

Mutual accountability Number of partner countries that undertake mutual assessments of progress in implementing agreed commitments on aid effectiveness including those in this Declaration.
All partner countries have mutual assessment reviews in place.12
MANAGING FOR RESULTS TARGET FOR 2010
MUTUAL ACCOUNTABILITY TARGET FOR 2010
Important Note: In accordance with paragraph 9 of the Declaration, the partnership of donors and partner countries hosted by the DAC (Working Party on Aid Effectiveness) comprising OECD-DAC members, partner countries and multilateral institutions, met twice, on 30-31 May 2005 and on 7-8 July 2005 to adopt, and review where appropriate, the targets for the 12 Indicators of Progress. At these meetings an agreement was reached on the targets presented under Section III of the Declaration. This agreement is subject to reservations by one donor on (a) the methodology for assessing the quality of locally managed procurement systems (relating to targets 2b and 5b) and (b) the acceptable quality of public financial management reform programmes (relating to target 5a.ii). Further discussions are underway to address these issues. The targets, including the reservation, have been notified to the Chairs of the High-Level Plenary Meeting of the 59th General Assembly of the United Nations in a letter of 9 September 2005 by Richard Manning, Chair of the OECD Development Assistance Committee (DAC).
* Note on Indicator 5: Scores for Indicator 5 are determined by the methodology used to measure quality of procurement and public financial management systems under Indicator 2 above.
Aid is more predictable Percent of aid disbursements released according to agreed schedules in annual or multi-year frameworks.
Halve the gap Halve the proportion of aid not disbursed within the fiscal year for which it was scheduled.
7
ALIGNMENT TARGETS FOR 2010
10 Encourage shared analysis Percent of (a) field missions and/or (b) country analytical work, including diagnostic reviews that are joint.
(a) 40% of donor missions to the field are joint.
(b) 66% of country analytical work is joint.
11 Results-oriented frameworks Number of countries with transparent and monitorable performance assessment frameworks to assess progress against (a) the national development strategies and (b) sector programmes.
Reduce the gap by one-third Reduce the proportion of countries without transparent and monitorable performance assessment frameworks by one-third.
Aid is untied Percent of bilateral aid that is untied.
Continued progress over time.8
HARMONISATION TARGETS FOR 2010
Use of common arrangements or procedures Percent of aid provided as programme-based approaches.
66% of aid flows are provided in the context of programme-based approaches.
9
Strengthen capacity by avoiding parallel implementation structures Number of parallel project implementation units (PIUs) per country.
Reduce by two-thirds the stock of parallel project implementation units (PIUs).
6
912006 SURVEY ON MONITORING THE PARIS DECLARATION: OVERVIEW OF THE RESULTS - ISBN 978-92-64-01965-2 - ©OECD 2007

92 2006 SURVEY ON MONITORING THE PARIS DECLARATION: OVERVIEW OF THE RESULTS - ISBN 978-92-64-01965-2 - ©OECD 2007
TABLE C.1 African Development Bank
Information in the table below covers data reported in 17 countries out of 34 and reflects 74% of country programmed aid in 2005.
Indicators Definitions 2005 Baseline ratio a
Average country ratio b
3 Aid flows are aligned on national priorities
Aid for government sector in budget USD 734 m
USD 700 m Aid disbursed for government sector
4 Strengthen capacity by co-ordinated support
Co-ordinated technical co-operation USD 14 m
USD 37 m Technical co-operation
5a Use of country public financial management systems
USD 231 m
USD 700 m Aid disbursed for government sector
Use of PFM systems
5b Use of country procurement systems
USD 304 m
USD 700 m Aid disbursed for government sector
Use of procurement systems
6 Avoid parallel implementation structures
132
17Number of countries
Number of parallel PIUs
7 Aid is more predictable USD 515 m
USD 925 m Aid scheduled for disbursement
Aid recorded as disbursed
8 Aid is untied --
-- Total bilateral aid
Untied aid
9 Use of common arrangements or procedures
USD 285 m
USD 705 m Total aid disbursed
Programme-based approaches
10a Joint missions 60
317Total number of missions
Number of joint missions
10b Joint country analytical work 17
95%
38%
33%
43%
132
56%
--
40%
19%
55%
59%
36%
28%
32%
7.8
52%
--
37%
19%
55%31Total number of country analyses
Number of joint analyses
a weighted averageb unweighted average

a weighted averageb unweighted average
932006 SURVEY ON MONITORING THE PARIS DECLARATION: OVERVIEW OF THE RESULTS - ISBN 978-92-64-01965-2 - ©OECD 2007
TABLE C.2 Asian Development Bank
Information in the table below covers data reported in 6 countries out of 34 and reflects 54% of country programmed aid in 2005.
Indicators Definitions 2005 Baseline ratio a
Average country ratio b
3 Aid flows are aligned on national priorities
Aid for government sector in budget USD 587 m
USD 671 m Aid disbursed for government sector
4 Strengthen capacity by co-ordinated support
Co-ordinated technical co-operation USD 24 m
USD 66 m Technical co-operation
5a Use of country public financial management systems
USD 461 m
USD 671 m Aid disbursed for government sector
Use of PFM systems
5b Use of country procurement systems
USD 300 m
USD 671 m Aid disbursed for government sector
Use of procurement systems
6 Avoid parallel implementation structures
39
6 Number of countries
Number of parallel PIUs
7 Aid is more predictable USD 560 m
USD 612 m Aid scheduled for disbursement
Aid recorded as disbursed
8 Aid is untied --
-- Total bilateral aid
Untied aid
9 Use of common arrangements or procedures
USD 161 m
USD 693 m Total aid disbursed
Programme-based approaches
10a Joint missions 22
405Total number of missions
Number of joint missions
10b Joint country analytical work 17
88%
37%
69%
45%
39
91%
--
23%
5%
49%
62%
64%
56%
35%
6.5
86%
--
27%
5%
49%35 Total number of country analyses
Number of joint analyses

a weighted averageb unweighted average
94 2006 SURVEY ON MONITORING THE PARIS DECLARATION: OVERVIEW OF THE RESULTS - ISBN 978-92-64-01965-2 - ©OECD 2007
TABLE C.3 Australia
Information in the table below covers data reported in 5 countries out of 34 and reflects 12% of country programmed aid in 2005.
Indicators Definitions 2005 Baseline ratio a
Average country ratio b
3 Aid flows are aligned on national priorities
Aid for government sector in budget USD 28 m
USD 77 m Aid disbursed for government sector
4 Strengthen capacity by co-ordinated support
Co-ordinated technical co-operation USD 11 m
USD 43 m Technical co-operation
5a Use of country public financial management systems
USD 5 m
USD 77 m Aid disbursed for government sector
Use of PFM systems
5b Use of country procurement systems
USD 4 m
USD 77 m Aid disbursed for government sector
Use of procurement systems
6 Avoid parallel implementation structures
27
5 Number of countries
Number of parallel PIUs
7 Aid is more predictable USD 23 m
USD 78 m Aid scheduled for disbursement
Aid recorded as disbursed
8 Aid is untied USD 25 m
USD 46 m Total bilateral aid
Untied aid
9 Use of common arrangements or procedures
USD 31 m
USD 108 m Total aid disbursed
Programme-based approaches
10a Joint missions 1
15Total number of missions
Number of joint missions
10b Joint country analytical work 7
36%
25%
6%
5%
27
29%
54%
29%
7%
25%
29%
53%
6%
10%
5.4
33%
39%
28%
7%
25%28Total number of country analyses
Number of joint analyses

952006 SURVEY ON MONITORING THE PARIS DECLARATION: OVERVIEW OF THE RESULTS - ISBN 978-92-64-01965-2 - ©OECD 2007
TABLE C.4 Austria
Information in the table below covers data reported in 7 countries out of 34 and reflects 16% of country programmed aid in 2005.
Indicators
3 Aid flows are aligned on national priorities
2005 Baseline ratio a
79%
15%
22%
32%
18
36%
51%
45%
14%
33%
Average country ratio b
36%
12%
23%
33%
2.6
23%
49%
28%
14%
33%
USD 10 m
USD 13 m
Definitions
Aid for government sector in budget
Aid disbursed for government sector
4 Strengthen capacity by co-ordinated support
USD 3 m
USD 22 m
Co-ordinated technical co-operation
Technical co-operation
5a Use of country public financial management systems
USD 3 m
USD 13 m Aid disbursed for government sector
Use of PFM systems
5b Use of country procurement systems
USD 4 m
USD 13 m Aid disbursed for government sector
Use of procurement systems
6 Avoid parallel implementation structures
18
7 Number of countries
Number of parallel PIUs
7 Aid is more predictable
USD 4 m
USD 10 m Aid scheduled for disbursement
Aid recorded as disbursed
8 Aid is untied USD 27 m
USD 53 m Total bilateral aid
Untied aid
9 Use of common arrangements or procedures
USD 13 m
USD 29 m Total aid disbursed
Programme-based approaches
10a Joint missions 5
36Total number of missions
Number of joint missions
10b Joint country analytical work
1
3Total number of country analyses
Number of joint analyses
Illustrative 2010 Targets
90%
50%
Relative to Indicator 2a
Relative to Indicator 2b
6
68%
More than 54%
66%
40%
66%
a weighted averageb unweighted average

96 2006 SURVEY ON MONITORING THE PARIS DECLARATION: OVERVIEW OF THE RESULTS - ISBN 978-92-64-01965-2 - ©OECD 2007
Information in the table below covers data reported in 16 countries out of 34 and reflects 38% of country programmed aid in 2005.
Indicators
3 Aid flows are aligned on national priorities
2005 Baseline ratio a
44%
18%
24%
43%
67
38%
97%
32%
22%
33%
Average country ratio b
42%
26%
29%
54%
4.2
32%
89%
32%
22%
33%
USD 64 m
USD 145 m
Definitions
Aid for government sector in budget
Aid disbursed for government sector
4 Strengthen capacity by co-ordinated support
USD 17 m
USD 96 m
Co-ordinated technical co-operation
Technical co-operation
5a Use of country public financial management systems
USD 35 m
USD 145 m Aid disbursed for government sector
Use of PFM systems
5b Use of country procurement systems
USD 63 m
USD 145 m Aid disbursed for government sector
Use of procurement systems
6 Avoid parallel implementation structures
67
16 Number of countries
Number of parallel PIUs
7 Aid is more predictable
USD 60 m
USD 159 m Aid scheduled for disbursement
Aid recorded as disbursed
8 Aid is untied USD 244 m
USD 251 m Total bilateral aid
Untied aid
9 Use of common arrangements or procedures
USD 61 m
USD 192 m Total aid disbursed
Programme-based approaches
10a Joint missions 15
67Total number of missions
Number of joint missions
10b Joint country analytical work
9
27Total number of country analyses
Number of joint analyses
Illustrative 2010 Targets
85%
50%
Relative to Indicator 2a
Relative to Indicator 2b
22
69%
100%
66%
40%
66%
a weighted averageb unweighted average
TABLE C.5 Belgium

a weighted averageb unweighted average
972006 SURVEY ON MONITORING THE PARIS DECLARATION: OVERVIEW OF THE RESULTS - ISBN 978-92-64-01965-2 - ©OECD 2007
TABLE C.6 Canada
Information in the table below covers data reported in 22 countries out of 34 and reflects 42% of country programmed aid in 2005.
Indicators Definitions 2005 Baseline ratio a
Average country ratio b
3 Aid flows are aligned on national priorities
Aid for government sector in budget USD 258 m
USD 342 m Aid disbursed for government sector
4 Strengthen capacity by co-ordinated support
Co-ordinated technical co-operation USD 60 m
USD 154 m Technical co-operation
5a Use of country public financial management systems
USD 144 m
USD 342 m Aid disbursed for government sector
Use of PFM systems
5b Use of country procurement systems
USD 153 m
USD 342 m Aid disbursed for government sector
Use of procurement systems
6 Avoid parallel implementation structures
68
22 Number of countries
Number of parallel PIUs
7 Aid is more predictable USD 251 m
USD 345 m Aid scheduled for disbursement
Aid recorded as disbursed
8 Aid is untied USD 351 m
USD 441 mTotal bilateral aid
Untied aid
9 Use of common arrangements or procedures
USD 250 m
USD 495 mTotal aid disbursed
Programme-based approaches
10a Joint missions 55
333Total number of missions
Number of joint missions
10b Joint country analytical work 31
75%
39%
42%
45%
68
73%
80%
51%
17%
38%
51%
32%
35%
39%
3.1
42%
73%
33%
17%
38%82Total number of country analyses
Number of joint analyses

98
Information in the table below covers data reported in 18 countries out of 34 and reflects 69% of country programmed aid in 2005.
Indicators
3 Aid flows are aligned on national priorities
2005 Baseline ratio a
47%
48%
29%
45%
69
49%
85%
60%
33%
80%
Average country ratio b
47%
44%
27%
46
3.8
50%
93%
58%
33%
80%
USD 246 m
USD 520 m
Definitions
Aid for government sector in budget
Aid disbursed for government sector
4 Strengthen capacity by co-ordinated support
USD 63 m
USD 131 m
Co-ordinated technical co-operation
Technical co-operation
5a Use of country public financial management systems
USD 151 m
USD 520 m Aid disbursed for government sector
Use of PFM systems
5b Use of country procurement systems
USD 234 m
USD 520 mAid disbursed for government sector
Use of procurement systems
6 Avoid parallel implementation structures
69
18 Number of countries
Number of parallel PIUs
7 Aid is more predictable
USD 248 m
USD 501 m Aid scheduled for disbursement
Aid recorded as disbursed
8 Aid is untied USD 961 m
USD 1 130 mTotal bilateral aid
Untied aid
9 Use of common arrangements or procedures
USD 368 m
USD 617 m Total aid disbursed
Programme-based approaches
10a Joint missions 52
158 Total number of missions
Number of joint missions
10b Joint country analytical work
52
65Total number of country analyses
Number of joint analyses
Illustrative 2010 Targets
85%
50%
Relative to Indicator 2a
Relative to Indicator 2b
23
75%
More than 85%
66%
40%
Target of 66% achieved
a weighted averageb unweighted average
TABLE C.7 Denmark
2006 SURVEY ON MONITORING THE PARIS DECLARATION: OVERVIEW OF THE RESULTS - ISBN 978-92-64-01965-2 - ©OECD 2007

99
Information in the table below covers data reported in 34 countries out of 34 and reflects 45% of country programmed aid in 2005.
Indicators
3 Aid flows are aligned on national priorities
2005 Baseline ratio a
81%
35%
40%
41%
204
65%
--
50%
33%
45%
Average country ratio b
56%
23%
38%
40%
6.0
49%
--
45%
33%
45%
USD 1 919 m
USD 2 364 m
Definitions
Aid for government sector in budget
Aid disbursed for government sector
4 Strengthen capacity by co-ordinated support
USD 173 m
USD 497 m
Co-ordinated technical co-operation
Technical co-operation
5a Use of country public financial management systems
USD 943 m
USD 2 364 mAid disbursed for government sector
Use of PFM systems
5b Use of country procurement systems
USD 972 m
USD 2 364 mAid disbursed for government sector
Use of procurement systems
6 Avoid parallel implementation structures
204
34 Number of countries
Number of parallel PIUs
7 Aid is more predictable
USD 1 632 m
USD 2 515 mAid scheduled for disbursement
Aid recorded as disbursed
8 Aid is untied --
--Total bilateral aid
Untied aid
9 Use of common arrangements or procedures
USD 1 394 m
USD 2 777 mTotal aid disbursed
Programme-based approaches
10a Joint missions 189
580Total number of missions
Number of joint missions
10b Joint country analytical work
111
248Total number of country analyses
Number of joint analyses
Illustrative 2010 Targets
91%
100% (EU Target)
50% (EU Target)
50% (EU Target)
68 PIUs & no new PIUs (EU Target)
83%
--
66% (EU Target)
40%
66%
a weighted averageb unweighted average
TABLE C.8 European Commission
2006 SURVEY ON MONITORING THE PARIS DECLARATION: OVERVIEW OF THE RESULTS - ISBN 978-92-64-01965-2 - ©OECD 2007

Information in the table below covers data reported in 11 countries out of 34 and reflects 49% of country programmed aid in 2005.
Indicators
3 Aid flows are aligned on national priorities
2005 Baseline ratio a
87%
53%
38%
52%
9
27%
98%
39%
26%
58%
Average country ratio b
32%
59%
30%
43%
0.8
34%
95%
40%
26%
58%
USD 101 m
USD 87 m
Definitions
Aid for government sector in budget
Aid disbursed for government sector
4 Strengthen capacity by co-ordinated support
USD 21 m
USD 39 m
Co-ordinated technical co-operation
Technical co-operation
5a Use of country public financial management systems
USD 33 m
USD 87 mAid disbursed for government sector
Use of PFM systems
5b Use of country procurement systems
USD 45 m
USD 87 mAid disbursed for government sector
Use of procurement systems
6 Avoid parallel implementation structures
9
11 Number of countries
Number of parallel PIUs
7 Aid is more predictable
USD 26 m
USD 94 mAid scheduled for disbursement
Aid recorded as disbursed
8 Aid is untied USD 152 m
USD 155 mTotal bilateral aid
Untied aid
9 Use of common arrangements or procedures
USD 44 m
USD 111 mTotal aid disbursed
Programme-based approaches
10a Joint missions 21
80Total number of missions
Number of joint missions
10b Joint country analytical work
11
19Total number of country analyses
Number of joint analyses
Illustrative 2010 Targets
93%
100% (EU Target)
50% (EU Target)
50% (EU Target)
3 & no new PIUs
(EU Target)
64%
More than 98%
66%
63% (EU Target)
66%
a weighted averageb unweighted average
TABLE C.9 Finland
100 2006 SURVEY ON MONITORING THE PARIS DECLARATION: OVERVIEW OF THE RESULTS - ISBN 978-92-64-01965-2 - ©OECD 2007
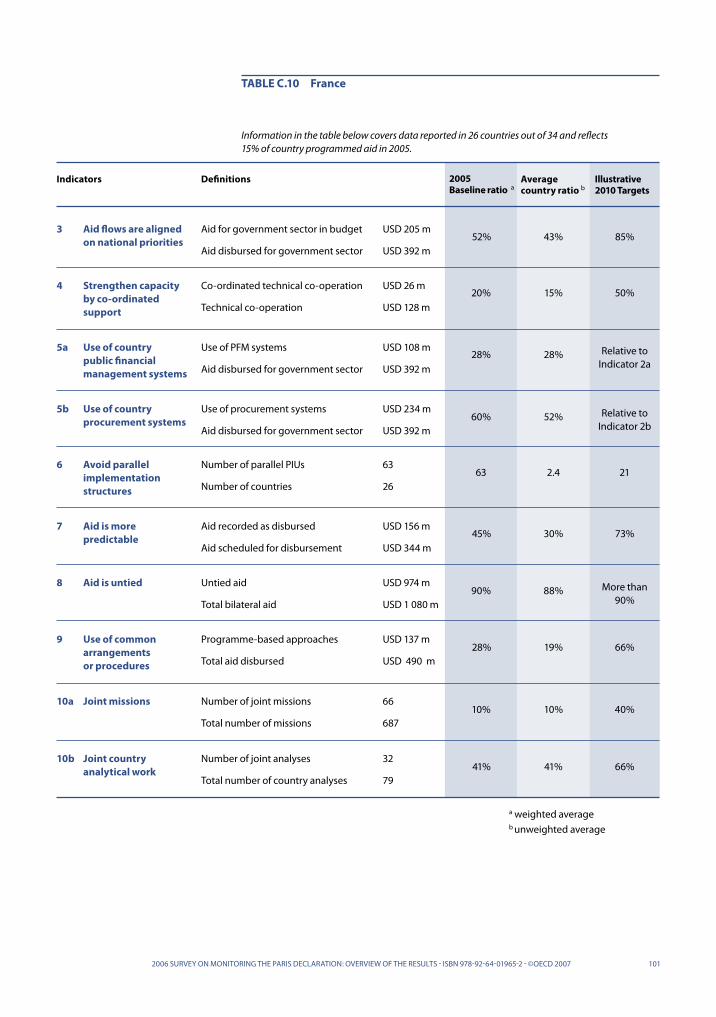
101
Information in the table below covers data reported in 26 countries out of 34 and reflects 15% of country programmed aid in 2005.
Indicators
3 Aid flows are aligned on national priorities
2005 Baseline ratio a
52%
20%
28%
60%
63
45%
90%
28%
10%
41%
Average country ratio b
43%
15%
28%
52%
2.4
30%
88%
19%
10%
41%
USD 205 m
USD 392 m
Definitions
Aid for government sector in budget
Aid disbursed for government sector
4 Strengthen capacity by co-ordinated support
USD 26 m
USD 128 m
Co-ordinated technical co-operation
Technical co-operation
5a Use of country public financial management systems
USD 108 m
USD 392 mAid disbursed for government sector
Use of PFM systems
5b Use of country procurement systems
USD 234 m
USD 392 mAid disbursed for government sector
Use of procurement systems
6 Avoid parallel implementation structures
63
26 Number of countries
Number of parallel PIUs
7 Aid is more predictable
USD 156 m
USD 344 mAid scheduled for disbursement
Aid recorded as disbursed
8 Aid is untied USD 974 m
USD 1 080 mTotal bilateral aid
Untied aid
9 Use of common arrangements or procedures
USD 137 m
USD 490 mTotal aid disbursed
Programme-based approaches
10a Joint missions 66
687Total number of missions
Number of joint missions
10b Joint country analytical work
32
79Total number of country analyses
Number of joint analyses
Illustrative 2010 Targets
85%
50%
Relative to Indicator 2a
Relative to Indicator 2b
21
73%
More than 90%
66%
40%
66%
a weighted averageb unweighted average
TABLE C.10 France
2006 SURVEY ON MONITORING THE PARIS DECLARATION: OVERVIEW OF THE RESULTS - ISBN 978-92-64-01965-2 - ©OECD 2007

a weighted averageb unweighted average
102
TABLE C.11 GAVI Alliance
Information in the table below covers data reported in 11 countries out of 34 and reflects --% of country programmed aid in 2005..
Indicators Definitions 2005 Baseline ratio a
Average country ratio b
3 Aid flows are aligned on national priorities
Aid for government sector in budget USD 0 m
USD 61 mAid disbursed for government sector
4 Strengthen capacity by co-ordinated support
Co-ordinated technical co-operation USD 0 m
USD 0 mTechnical co-operation
5a Use of country public financial management systems
USD 20 m
USD 61 mAid disbursed for government sector
Use of PFM systems
5b Use of country procurement systems
USD 1 m
USD 61 mAid disbursed for government sector
Use of procurement systems
6 Avoid parallel implementation structures
0
11 Number of countries
Number of parallel PIUs
7 Aid is more predictable USD 0 m
USD 62 mAid scheduled for disbursement
Aid recorded as disbursed
8 Aid is untied --
-- Total bilateral aid
Untied aid
9 Use of common arrangements or procedures
USD 10 m
USD 61 mTotal aid disbursed
Programme-based approaches
10a Joint missions 0
0Total number of missions
Number of joint missions
10b Joint country analytical work 0
0%
--
33%
2%
0
0%
--
17%
--
--
0%
--
30%
6%
0
0%
--
27%
--
--0Total number of country analyses
Number of joint analyses
2006 SURVEY ON MONITORING THE PARIS DECLARATION: OVERVIEW OF THE RESULTS - ISBN 978-92-64-01965-2 - ©OECD 2007

103
Information in the table below covers data reported in 32 countries out of 34 and reflects 30% of country programmed aid in 2005
Indicators
3 Aid flows are aligned on national priorities
2005 Baseline ratio a
55%
37%
35%
34%
40
75%
94%
20%
28%
50%
Average country ratio b
50%
36%
28%
35%
1.3
48%
69%
23%
28%
50%
USD 555 m
USD 1 000 m
Definitions
Aid for government sector in budget
Aid disbursed for government sector
4 Strengthen capacity by co-ordinated support
USD 127 m
USD 342 m
Co-ordinated technical co-operation
Technical co-operation
5a Use of country public financial management systems
USD 355 m
USD 1 000 mAid disbursed for government sector
Use of PFM systems
5b Use of country procurement systems
USD 337 m
USD 1 000 mAid disbursed for government sector
Use of procurement systems
6 Avoid parallel implementation structures
40
32 Number of countries
Number of parallel PIUs
7 Aid is more predictable
USD 516 m
USD 688 mAid scheduled for disbursement
Aid recorded as disbursed
8 Aid is untied USD 682 m
USD 726 mTotal bilateral aid
Untied aid
9 Use of common arrangements or procedures
USD 218 m
USD 1 082 mTotal aid disbursed
Programme-based approaches
10a Joint missions 120
425Total number of missions
Number of joint missions
10b Joint country analytical work
58
116Total number of country analyses
Number of joint analyses
Illustrative 2010 Targets
85%
50%
Relative to Indicator 2a
Relative to Indicator 2b
13
87%
More than 94%
66%
40%
66%
a weighted averageb unweighted average
TABLE C.12 Germany
2006 SURVEY ON MONITORING THE PARIS DECLARATION: OVERVIEW OF THE RESULTS - ISBN 978-92-64-01965-2 - ©OECD 2007

Information in the table below covers data reported in 27 countries out of 34 and reflects 47% of country programmed aid in 2005.
Indicators
3 Aid flows are aligned on national priorities
2005 Baseline ratio a
26%
--
41%
44%
4
20%
--
82%
17%
33%
Average country ratio b
35%
--
37%
38%
0.1
33%
--
73%
17%
33%
USD 88 m
USD 338 m
Definitions
Aid for government sector in budget
Aid disbursed for government sector
4 Strengthen capacity by co-ordinated support
USD 0 m
USD 0 m
Co-ordinated technical co-operation
Technical co-operation
5a Use of country public financial management systems
USD 137 m
USD 338 mAid disbursed for government sector
Use of PFM systems
5b Use of country procurement systems
USD 150 m
USD 338 mAid disbursed for government sector
Use of procurement systems
6 Avoid parallel implementation structures
4
27 Number of countries
Number of parallel PIUs
7 Aid is more predictable
USD 68 m
USD 335 mAid scheduled for disbursement
Aid recorded as disbursed
8 Aid is untied --
--Total bilateral aid
Untied aid
9 Use of common arrangements or procedures
USD 382 m
USD 465 mTotal aid disbursed
Programme-based approaches
10a Joint missions 12
71Total number of missions
Number of joint missions
10b Joint country analytical work
2
6Total number of country analyses
Number of joint analyses
Illustrative 2010 Targets
85%
--
Relative to Indicator 2a
Relative to Indicator 2b
1
60%
--
Target of 66% achieved
40%
66%
a weighted averageb unweighted average
TABLE C.13 Global Fund*
* The Global Fund disburses finances for health. Disbursements reported to Ministries of Health are included in the national budget and recorded by the National Treasury at the discretion of each country. For the survey year, 90% of Global Fund disbursements were notified to country health ministries. The differences are due to reporting from Ministry of Health to the National Treasury
104 2006 SURVEY ON MONITORING THE PARIS DECLARATION: OVERVIEW OF THE RESULTS - ISBN 978-92-64-01965-2 - ©OECD 2007

a weighted averageb unweighted average
105
TABLE C.14 Inter-American Development Bank
Information in the table below covers data reported in 5 countries out of 34 and reflects 65% of country programmed aid in 2005.
Indicators Definitions 2005 Baseline ratio a
Average country ratio b
3 Aid flows are aligned on national priorities
Aid for government sector in budget USD 505 m
USD 305 mAid disbursed for government sector
4 Strengthen capacity by co-ordinated support
Co-ordinated technical co-operation USD 9 m
USD 40 mTechnical co-operation
5a Use of country public financial management systems
USD 137 m
USD 305 mAid disbursed for government sector
Use of PFM systems
5b Use of country procurement systems
USD 0 m
USD 305 mAid disbursed for government sector
Use of procurement systems
6 Avoid parallel implementation structures
64
5 Number of countries
Number of parallel PIUs
7 Aid is more predictable USD 282 m
USD 344 mAid scheduled for disbursement
Aid recorded as disbursed
8 Aid is untied --
--Total bilateral aid
Untied aid
9 Use of common arrangements or procedures
USD 144 m
USD 323 mTotal aid disbursed
Programme-based approaches
10a Joint missions 117
285Total number of missions
Number of joint missions
10b Joint country analytical work 27
60%
24%
45%
0%
64
82%
--
45%
41%
69%
48%
40%
29%
0%
12.8
88%
--
25%
41%
69%39 Total number of country analyses
Number of joint analyses
2006 SURVEY ON MONITORING THE PARIS DECLARATION: OVERVIEW OF THE RESULTS - ISBN 978-92-64-01965-2 - ©OECD 2007
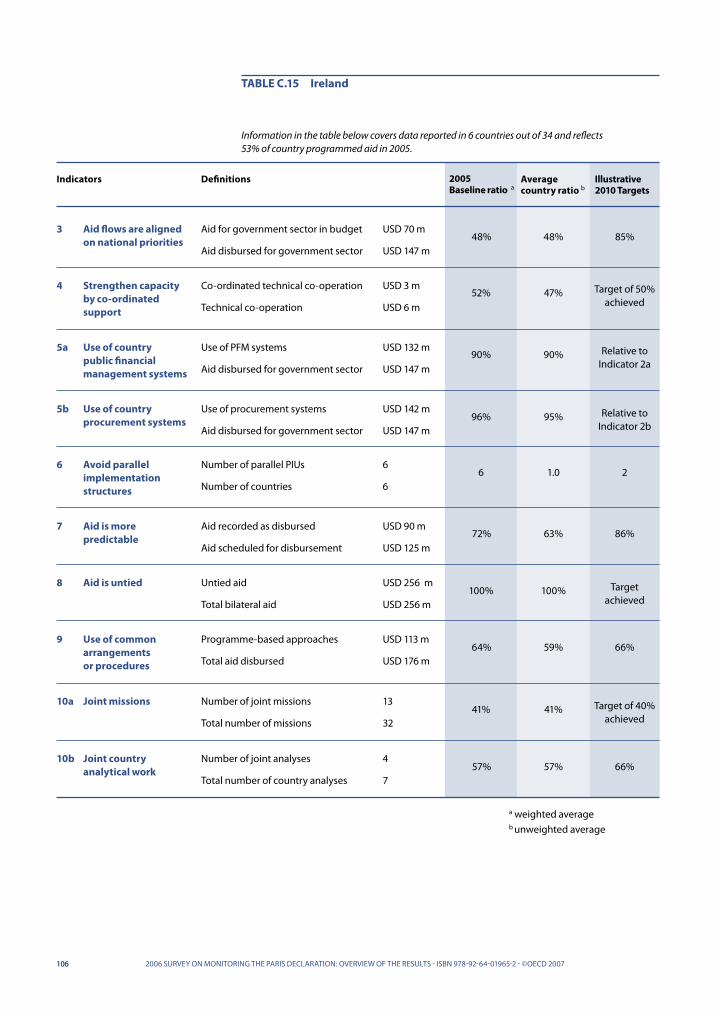
106
Information in the table below covers data reported in 6 countries out of 34 and reflects 53% of country programmed aid in 2005.
Indicators
3 Aid flows are aligned on national priorities
2005 Baseline ratio a
48%
52%
90%
96%
6
72%
100%
64%
41%
57%
Average country ratio b
48%
47%
90%
95%
1.0
63%
100%
59%
41%
57%
USD 70 m
USD 147 m
Definitions
Aid for government sector in budget
Aid disbursed for government sector
4 Strengthen capacity by co-ordinated support
USD 3 m
USD 6 m
Co-ordinated technical co-operation
Technical co-operation
5a Use of country public financial management systems
USD 132 m
USD 147 mAid disbursed for government sector
Use of PFM systems
5b Use of country procurement systems
USD 142 m
USD 147 mAid disbursed for government sector
Use of procurement systems
6 Avoid parallel implementation structures
6
6 Number of countries
Number of parallel PIUs
7 Aid is more predictable
USD 90 m
USD 125 mAid scheduled for disbursement
Aid recorded as disbursed
8 Aid is untied USD 256 m
USD 256 mTotal bilateral aid
Untied aid
9 Use of common arrangements or procedures
USD 113 m
USD 176 mTotal aid disbursed
Programme-based approaches
10a Joint missions 13
32Total number of missions
Number of joint missions
10b Joint country analytical work
4
7Total number of country analyses
Number of joint analyses
Illustrative 2010 Targets
85%
Target of 50% achieved
Relative to Indicator 2a
Relative to Indicator 2b
2
86%
Target achieved
66%
Target of 40% achieved
66%
a weighted averageb unweighted average
TABLE C.15 Ireland
106 2006 SURVEY ON MONITORING THE PARIS DECLARATION: OVERVIEW OF THE RESULTS - ISBN 978-92-64-01965-2 - ©OECD 2007

107
Information in the table below covers data reported in 13 countries out of 34 and reflects 31% of country programmed aid in 2005.
Indicators
3 Aid flows are aligned on national priorities
2005 Baseline ratio a
36%
39%
29%
50%
30
45%
41%
40%
8%
18%
Average country ratio b
16%
45%
38%
49%
2.3
8%
91%
25%
8%
18%
USD 49 m
USD 138 m
Definitions
Aid for government sector in budget
Aid disbursed for government sector
4 Strengthen capacity by co-ordinated support
USD 15 m
USD 39 m
Co-ordinated technical co-operation
Technical co-operation
5a Use of country public financial management systems
USD 40 m
USD 138 m Aid disbursed for government sector
Use of PFM systems
5b Use of country procurement systems
USD 69 m
USD 138 m Aid disbursed for government sector
Use of procurement systems
6 Avoid parallel implementation structures
30
13 Number of countries
Number of parallel PIUs
7 Aid is more predictable
USD 28 m
USD 62 m Aid scheduled for disbursement
Aid recorded as disbursed
8 Aid is untied USD 208 m
USD 502 m Total bilateral aid
Untied aid
9 Use of common arrangements or procedures
USD 63 m
USD 155 m Total aid disbursed
Programme-based approaches
10a Joint missions 7
93Total number of missions
Number of joint missions
10b Joint country analytical work
2
11Total number of country analyses
Number of joint analyses
Illustrative 2010 Targets
85%
50%
Relative to Indicator 2a
Relative to Indicator 2b
10
73%
More than 41%
66%
40%
66%
a weighted averageb unweighted average
TABLE C.16 Italy
2006 SURVEY ON MONITORING THE PARIS DECLARATION: OVERVIEW OF THE RESULTS - ISBN 978-92-64-01965-2 - ©OECD 2007

108 2006 SURVEY ON MONITORING THE PARIS DECLARATION: OVERVIEW OF THE RESULTS - ISBN 978-92-64-01965-2 - ©OECD 2007
a weighted averageb unweighted average
TABLE C.17 Japan
Information in the table below covers data reported in 30 countries out of 34 and reflects 20% of country programmed aid in 2005.
Indicators Definitions 2005 Baseline ratio a
Average country ratio b
3 Aid flows are aligned on national priorities
Aid for government sector in budget USD 1 096 m
USD 1 615 mAid disbursed for government sector
4 Strengthen capacity by co-ordinated support
Co-ordinated technical co-operation USD 605 m
USD 813 mTechnical co-operation
5a Use of country public financial management systems
USD 468 m
USD 1 615 mAid disbursed for government sector
Use of PFM systems
5b Use of country procurement systems
USD 423 m
USD 1 615 mAid disbursed for government sector
Use of procurement systems
6 Avoid parallel implementation structures
2
30 Number of countries
Number of parallel PIUs
7 Aid is more predictable USD 1 042 m
USD 1 588 mAid scheduled for disbursement
Aid recorded as disbursed
8 Aid is untied USD 2 759 m
USD 3 089 mTotal bilateral aid
Untied aid
9 Use of common arrangements or procedures
USD 554 m
USD 1 687 mTotal aid disbursed
Programme-based approaches
10a Joint missions 11
537Total number of missions
Number of joint missions
10b Joint country analytical work 14
68%
74%
29%
26%
2
66%
89%
33%
2%
52%
30%
36%
16%
14%
0.1
34%
99%
26%
2%
52%27Total number of country analyses
Number of joint analyses

a weighted averageb unweighted average
109
TABLE C.18 Korea
Information in the table below covers data reported in 3 countries out of 34 and reflects 4% of country programmed aid in 2005
Indicators Definitions 2005 Baseline ratio a
Average country ratio b
3 Aid flows are aligned on national priorities
Aid for government sector in budget USD 2 m
USD 17 mAid disbursed for government sector
4 Strengthen capacity by co-ordinated support
Co-ordinated technical co-operation USD 8 m
USD 11 mTechnical co-operation
5a Use of country public financial management systems
USD 7 m
USD 17 mAid disbursed for government sector
Use of PFM systems
5b Use of country procurement systems
USD 0 m
USD 17 mAid disbursed for government sector
Use of procurement systems
6 Avoid parallel implementation structures
0
3 Number of countries
Number of parallel PIUs
7 Aid is more predictable USD 2 m
USD 17 mAid scheduled for disbursement
Aid recorded as disbursed
8 Aid is untied --
-- Total bilateral aid
Untied aid
9 Use of common arrangements or procedures
USD 0 m
USD 17 mTotal aid disbursed
Programme-based approaches
10a Joint missions 0
19Total number of missions
Number of joint missions
10b Joint country analytical work 0
12%
74%
45%
0%
0
12%
--
0%
0%
--
11%
50%
33%
0%
0.0
11%
--
0%
0%
--0 Total number of country analyses
Number of joint analyses
2006 SURVEY ON MONITORING THE PARIS DECLARATION: OVERVIEW OF THE RESULTS - ISBN 978-92-64-01965-2 - ©OECD 2007

110 2006 SURVEY ON MONITORING THE PARIS DECLARATION: OVERVIEW OF THE RESULTS - ISBN 978-92-64-01965-2 - ©OECD 2007
a weighted averageb unweighted average
TABLE C.19 Luxembourg
Information in the table below covers data reported in 3 countries out of 34 and reflects 25% of country programmed aid in 2005.
Indicators Definitions 2005 Baseline ratio a
Average country ratio b
3 Aid flows are aligned on national priorities
Aid for government sector in budget USD 26 m
USD 33 mAid disbursed for government sector
4 Strengthen capacity by co-ordinated support
Co-ordinated technical co-operation USD 0 m
USD 2 m Technical co-operation
5a Use of country public financial management systems
USD 0 m
USD 33 mAid disbursed for government sector
Use of PFM systems
5b Use of country procurement systems
USD 0 m
USD 33 mAid disbursed for government sector
Use of procurement systems
6 Avoid parallel implementation structures
1
3 Number of countries
Number of parallel PIUs
7 Aid is more predictable USD 20 m
USD 35 mAid scheduled for disbursement
Aid recorded as disbursed
8 Aid is untied USD 91 m
USD 91 mTotal bilateral aid
Untied aid
9 Use of common arrangements or procedures
USD 14 m
USD 34 mTotal aid disbursed
Programme-based approaches
10a Joint missions 2
10Total number of missions
Number of joint missions
10b Joint country analytical work 2
77%
0%
0%
0%
1
57%
100%
41%
20%
67%
66%
0%
0%
0%
0.3
51%
100%
32%
20%
67%3Total number of country analyses
Number of joint analyses
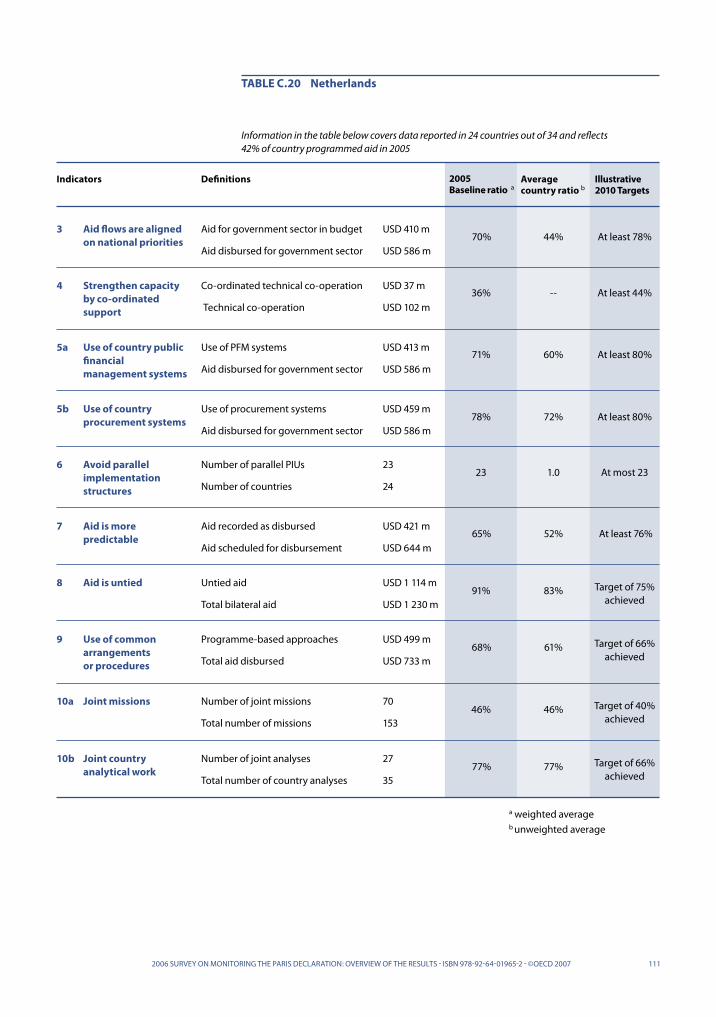
111
Information in the table below covers data reported in 24 countries out of 34 and reflects 42% of country programmed aid in 2005
Indicators
3 Aid flows are aligned on national priorities
2005 Baseline ratio a
70%
36%
71%
78%
23
65%
91%
68%
46%
77%
Average country ratio b
44%
--
60%
72%
1.0
52%
83%
61%
46%
77%
USD 410 m
USD 586 m
Definitions
Aid for government sector in budget
Aid disbursed for government sector
4 Strengthen capacity by co-ordinated support
USD 37 m
USD 102 m
Co-ordinated technical co-operation
Technical co-operation
5a Use of country public financial management systems
USD 413 m
USD 586 mAid disbursed for government sector
Use of PFM systems
5b Use of country procurement systems
USD 459 m
USD 586 mAid disbursed for government sector
Use of procurement systems
6 Avoid parallel implementation structures
23
24 Number of countries
Number of parallel PIUs
7 Aid is more predictable
USD 421 m
USD 644 mAid scheduled for disbursement
Aid recorded as disbursed
8 Aid is untied USD 1 114 m
USD 1 230 mTotal bilateral aid
Untied aid
9 Use of common arrangements or procedures
USD 499 m
USD 733 mTotal aid disbursed
Programme-based approaches
10a Joint missions 70
153Total number of missions
Number of joint missions
10b Joint country analytical work
27
35Total number of country analyses
Number of joint analyses
Illustrative 2010 Targets
At least 78%
At least 44%
At least 80%
At least 80%
At most 23
At least 76%
Target of 75% achieved
Target of 66% achieved
Target of 40% achieved
Target of 66% achieved
a weighted averageb unweighted average
TABLE C.20 Netherlands
2006 SURVEY ON MONITORING THE PARIS DECLARATION: OVERVIEW OF THE RESULTS - ISBN 978-92-64-01965-2 - ©OECD 2007

TABLE C.21 New Zealand
Information in the table below covers data reported in 3 countries out of 34 and reflects 5% of country programmed aid in 2005.
Indicators Definitions 2005 Baseline ratio a
Average country ratio b
3 Aid flows are aligned on national priorities
Aid for government sector in budget USD 2 m
USD 4 mAid disbursed for government sector
4 Strengthen capacity by co-ordinated support
Co-ordinated technical co-operation USD 1 m
USD 5 m Technical co-operation
5a Use of country public financial management systems
USD 0 m
USD 4 mAid disbursed for government sector
Use of PFM systems
5b Use of country procurement systems
USD 1 m
USD 4 mAid disbursed for government sector
Use of procurement systems
6 Avoid parallel implementation structures
0
3 Number of countries
Number of parallel PIUs
7 Aid is more predictable USD 2 m
USD 5 mAid scheduled for disbursement
Aid recorded as disbursed
8 Aid is untied USD 12 m
USD 25 m Total bilateral aid
Untied aid
9 Use of common arrangements or procedures
USD 0.4 m
USD 6 mTotal aid disbursed
Programme-based approaches
10a Joint missions 1
5Total number of missions
Number of joint missions
10b Joint country analytical work 4
40%
11%
10%
14%
0
38%
48%
6%
20%
100%
58%
7%
34%
36%
0
58%
89%
8%
20%
100%4Total number of country analyses
Number of joint analyses
112
a weighted averageb unweighted average
2006 SURVEY ON MONITORING THE PARIS DECLARATION: OVERVIEW OF THE RESULTS - ISBN 978-92-64-01965-2 - ©OECD 2007
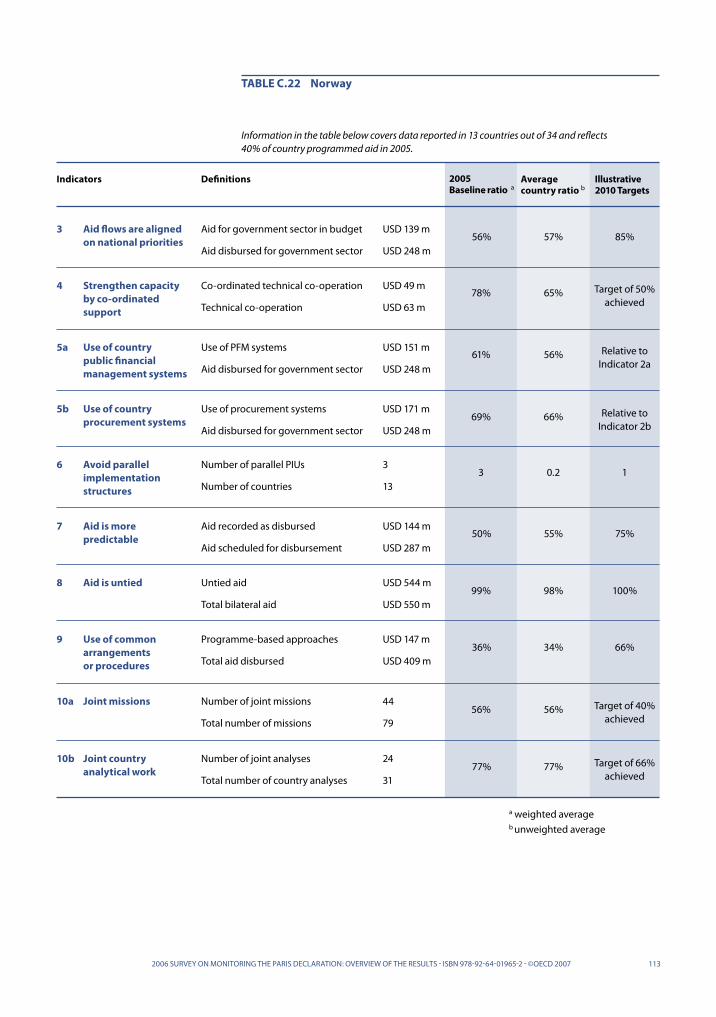
113
Information in the table below covers data reported in 13 countries out of 34 and reflects 40% of country programmed aid in 2005.
Indicators
3 Aid flows are aligned on national priorities
2005 Baseline ratio a
56%
78%
61%
69%
3
50%
99%
36%
56%
77%
Average country ratio b
57%
65%
56%
66%
0.2
55%
98%
34%
56%
77%
USD 139 m
USD 248 m
Definitions
Aid for government sector in budget
Aid disbursed for government sector
4 Strengthen capacity by co-ordinated support
USD 49 m
USD 63 m
Co-ordinated technical co-operation
Technical co-operation
5a Use of country public financial management systems
USD 151 m
USD 248 mAid disbursed for government sector
Use of PFM systems
5b Use of country procurement systems
USD 171 m
USD 248 mAid disbursed for government sector
Use of procurement systems
6 Avoid parallel implementation structures
3
13 Number of countries
Number of parallel PIUs
7 Aid is more predictable
USD 144 m
USD 287 mAid scheduled for disbursement
Aid recorded as disbursed
8 Aid is untied USD 544 m
USD 550 mTotal bilateral aid
Untied aid
9 Use of common arrangements or procedures
USD 147 m
USD 409 mTotal aid disbursed
Programme-based approaches
10a Joint missions 44
79Total number of missions
Number of joint missions
10b Joint country analytical work
24
31 Total number of country analyses
Number of joint analyses
Illustrative 2010 Targets
85%
Target of 50% achieved
Relative to Indicator 2a
Relative to Indicator 2b
1
75%
100%
66%
Target of 40% achieved
Target of 66% achieved
a weighted averageb unweighted average
TABLE C.22 Norway
2006 SURVEY ON MONITORING THE PARIS DECLARATION: OVERVIEW OF THE RESULTS - ISBN 978-92-64-01965-2 - ©OECD 2007

TABLE C.23 Portugal
Information in the table below covers data reported in 2 countries out of 34 and reflects 44% of country programmed aid in 2005.
Indicators Definitions 2005 Baseline ratio a
Average country ratio b
3 Aid flows are aligned on national priorities
Aid for government sector in budget USD 18 m
USD 75 mAid disbursed for government sector
4 Strengthen capacity by co-ordinated support
Co-ordinated technical co-operation USD 38 m
USD 49 m Technical co-operation
5a Use of country public financial management systems
USD 60 m
USD 75 mAid disbursed for government sector
Use of PFM systems
5b Use of country procurement systems
USD 60 m
USD 75 mAid disbursed for government sector
Use of procurement systems
6 Avoid parallel implementation structures
1
2 Number of countries
Number of parallel PIUs
7 Aid is more predictable USD 18 m
USD 88 mAid scheduled for disbursement
Aid recorded as disbursed
8 Aid is untied USD 19 m
USD 75 m Total bilateral aid
Untied aid
9 Use of common arrangements or procedures
USD 3 m
USD 79 mTotal aid disbursed
Programme-based approaches
10a Joint missions 3
6Total number of missions
Number of joint missions
10b Joint country analytical work 0
24%
77%
79%
80%
1
20%
26%
4%
50%
0%
15%
50%
54%
54%
0.5
15%
85%
6%
50%
0%3Total number of country analyses
Number of joint analyses
114
a weighted averageb unweighted average
2006 SURVEY ON MONITORING THE PARIS DECLARATION: OVERVIEW OF THE RESULTS - ISBN 978-92-64-01965-2 - ©OECD 2007

115
Information in the table below covers data reported in 11 countries out of 34 and reflects 25% of country programmed aid in 2005.
Indicators
3 Aid flows are aligned on national priorities
2005 Baseline ratio a
87%
10%
16%
14%
66
76%
30%
14%
8%
12%
Average country ratio b
41%
38%
21%
23%
6.0
25%
10%
14%
8%
12%
USD 91 m
USD 104 m
Definitions
Aid for government sector in budget
Aid disbursed for government sector
4 Strengthen capacity by co-ordinated support
USD 12 m
USD 115 m
Co-ordinated technical co-operation
Technical co-operation
5a Use of country public financial management systems
USD 17 m
USD 104 mAid disbursed for government sector
Use of PFM systems
5b Use of country procurement systems
USD 15 m
USD 104 mAid disbursed for government sector
Use of procurement systems
6 Avoid parallel implementation structures
66
11 Number of countries
Number of parallel PIUs
7 Aid is more predictable
USD 70 m
USD 92 mAid scheduled for disbursement
Aid recorded as disbursed
8 Aid is untied USD 147 m
USD 484 mTotal bilateral aid
Untied aid
9 Use of common arrangements or procedures
USD 39 m
USD 287 mTotal aid disbursed
Programme-based approaches
10a Joint missions 5
66Total number of missions
Number of joint missions
10b Joint country analytical work
3
25 Total number of country analyses
Number of joint analyses
Illustrative 2010 Targets
93%
50%
Relative to Indicator 2a
Relative to Indicator 2b
22
88%
More than 30%
66%
40%
66%
a weighted averageb unweighted average
TABLE C.24 Spain
2006 SURVEY ON MONITORING THE PARIS DECLARATION: OVERVIEW OF THE RESULTS - ISBN 978-92-64-01965-2 - ©OECD 2007

Information in the table below covers data reported in 24 countries out of 34 and reflects 59% of country programmed aid in 2005.
Indicators
3 Aid flows are aligned on national priorities
2005 Baseline ratio a
49%
64%
47%
48%
36
54%
100%
47%
32%
34%
Average country ratio b
35%
58%
40%
42%
1.5
48%
100%
38%
32%
34%
USD 216 m
USD 444 m
Definitions
Aid for government sector in budget
Aid disbursed for government sector
4 Strengthen capacity by co-ordinated support
USD 72 m
USD 111 m
Co-ordinated technical co-operation
Technical co-operation
5a Use of country public financial management systems
USD 209 m
USD 444 mAid disbursed for government sector
Use of PFM systems
5b Use of country procurement systems
USD 214 m
USD 444 mAid disbursed for government sector
Use of procurement systems
6 Avoid parallel implementation structures
36
24 Number of countries
Number of parallel PIUs
7 Aid is more predictable
USD 254 m
USD 471 mAid scheduled for disbursement
Aid recorded as disbursed
8 Aid is untied USD 814 m
USD 814 mTotal bilateral aid
Untied aid
9 Use of common arrangements or procedures
USD 287 m
USD 605 mTotal aid disbursed
Programme-based approaches
10a Joint missions 65
203Total number of missions
Number of joint missions
10b Joint country analytical work
38
111 Total number of country analyses
Number of joint analyses
Illustrative 2010 Targets
85%
100% (EU Target)
At least 50% (EU Target)
50% (EU Target)
12 & no new PIUs
(EU Target)
77%
Target achieved
66%
66% (EU Target)
66%
a weighted averageb unweighted average
TABLE C.25 Sweden
116116 2006 SURVEY ON MONITORING THE PARIS DECLARATION: OVERVIEW OF THE RESULTS - ISBN 978-92-64-01965-2 - ©OECD 2007

117
TABLE C.26 Switzerland
Information in the table below covers data reported in 22 countries out of 34 and reflects 44% of country programmed aid in 2005.
Indicators Definitions 2005 Baseline ratio a
Average country ratio b
3 Aid flows are aligned on national priorities
Aid for government sector in budget USD 66 m
USD 126 mAid disbursed for government sector
4 Strengthen capacity by co-ordinated support
Co-ordinated technical co-operation USD 19 m
USD 96 m Technical co-operation
5a Use of country public financial management systems
USD 59 m
USD 126 mAid disbursed for government sector
Use of PFM systems
5b Use of country procurement systems
USD 66 m
USD 126 mAid disbursed for government sector
Use of procurement systems
6 Avoid parallel implementation structures
58
22 Number of countries
Number of parallel PIUs
7 Aid is more predictable USD 78 m
USD 136 mAid scheduled for disbursement
Aid recorded as disbursed
8 Aid is untied USD 228 m
USD 237 mTotal bilateral aid
Untied aid
9 Use of common arrangements or procedures
USD 62 m
USD 233 m Total aid disbursed
Programme-based approaches
10a Joint missions 39
117Total number of missions
Number of joint missions
10b Joint country analytical work 25
52%
20%
47%
52%
58
58%
96%
27%
33%
60%
43%
27%
55%
61%
2.6
42%
93%
20%
33%
60% 42Total number of country analyses
Number of joint analyses
a weighted averageb unweighted average
2006 SURVEY ON MONITORING THE PARIS DECLARATION: OVERVIEW OF THE RESULTS - ISBN 978-92-64-01965-2 - ©OECD 2007

Information in the table below covers data reported in 23 countries out of 34 and reflects 50% of country programmed aid in 2005.
Indicators
3 Aid flows are aligned on national priorities
2005 Baseline ratio a
84%
61%
75%
76%
41
90%
100%
59%
44%
69%
Average country ratio b
45%
52%
53%
51%
1.8
48%
100%
50%
44%
69%
USD 921 m
USD 1 102 m
Definitions
Aid for government sector in budget
Aid disbursed for government sector
4 Strengthen capacity by co-ordinated support
USD 153 m
USD 250 m
Co-ordinated technical co-operation
Technical co-operation
5a Use of country public financial management systems
USD 825 m
USD 1 102 mAid disbursed for government sector
Use of PFM systems
5b Use of country procurement systems
USD 839 m
USD 1 102 mAid disbursed for government sector
Use of procurement systems
6 Avoid parallel implementation structures
41
23 Number of countries
Number of parallel PIUs
7 Aid is more predictable
USD 988 m
USD 1 094 mAid scheduled for disbursement
Aid recorded as disbursed
8 Aid is untied USD 2 356 m
USD 2 356 mTotal bilateral aid
Untied aid
9 Use of common arrangements or procedures
USD 901 m
USD 1 523 mTotal aid disbursed
Programme-based approaches
10a Joint missions 156
354 Total number of missions
Number of joint missions
10b Joint country analytical work
73
106 Total number of country analyses
Number of joint analyses
Illustrative 2010 Targets
92%
Target of 50% achieved
50% (EU Target)
50% (EU Target)
14
95%
Target achieved
66%
Target of 40% achieved
Target of 66% achieved
a weighted averageb unweighted average
TABLE C.27 United Kingdom
118 2006 SURVEY ON MONITORING THE PARIS DECLARATION: OVERVIEW OF THE RESULTS - ISBN 978-92-64-01965-2 - ©OECD 2007

a weighted averageb unweighted average
119
TABLE C.28 United Nations
Information in the table below covers data reported in 34 countries out of 34 and reflects 53% of country programmed aid in 2005.
Indicators Definitions 2005 Baseline ratio a
Average country ratio b
3 Aid flows are aligned on national priorities
Aid for government sector in budget USD 411 m
USD 1 148 mAid disbursed for government sector
4 Strengthen capacity by co-ordinated support
Co-ordinated technical co-operation USD 280 m
USD 634 m Technical co-operation
5a Use of country public financial management systems
USD 205 m
USD 1 148 mAid disbursed for government sector
Use of PFM systems
5b Use of country procurement systems
USD 86 m
USD 1 148 mAid disbursed for government sector
Use of procurement systems
6 Avoid parallel implementation structures
315
34 Number of countries
Number of parallel PIUs
7 Aid is more predictable USD 392 m
USD 1 227 mAid scheduled for disbursement
Aid recorded as disbursed
8 Aid is untied --
-- Total bilateral aid
Untied aid
9 Use of common arrangements or procedures
USD 472 m
USD 1 623 m Total aid disbursed
Programme-based approaches
10a Joint missions 866
2 876Total number of missions
Number of joint missions
10b Joint country analytical work 595
30%
44%
18%
8%
315
32%
--
29%
30%
63%
34%
53%
15%
9%
9.3
18%
--
46%
30%
63%945Total number of country analyses
Number of joint analyses
2006 SURVEY ON MONITORING THE PARIS DECLARATION: OVERVIEW OF THE RESULTS - ISBN 978-92-64-01965-2 - ©OECD 2007
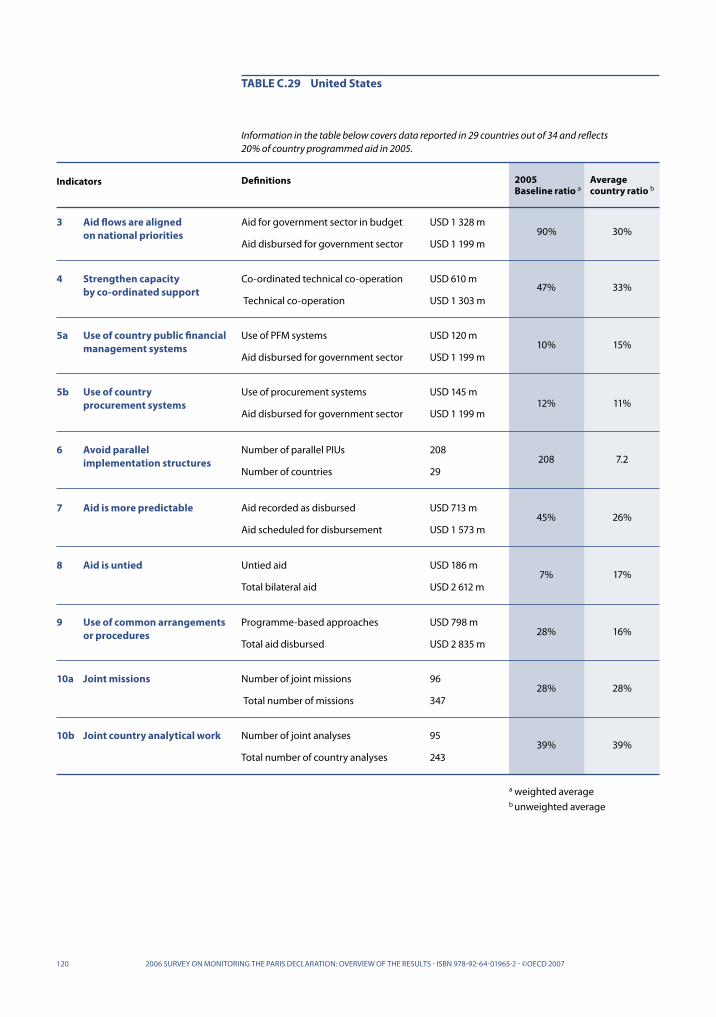
120 2006 SURVEY ON MONITORING THE PARIS DECLARATION: OVERVIEW OF THE RESULTS - ISBN 978-92-64-01965-2 - ©OECD 2007
a weighted averageb unweighted average
TABLE C.29 United States
Information in the table below covers data reported in 29 countries out of 34 and reflects 20% of country programmed aid in 2005.
Indicators Definitions 2005 Baseline ratio a
Average country ratio b
3 Aid flows are aligned on national priorities
Aid for government sector in budget USD 1 328 m
USD 1 199 mAid disbursed for government sector
4 Strengthen capacity by co-ordinated support
Co-ordinated technical co-operation USD 610 m
USD 1 303 m Technical co-operation
5a Use of country public financial management systems
USD 120 m
USD 1 199 mAid disbursed for government sector
Use of PFM systems
5b Use of country procurement systems
USD 145 m
USD 1 199 mAid disbursed for government sector
Use of procurement systems
6 Avoid parallel implementation structures
208
29 Number of countries
Number of parallel PIUs
7 Aid is more predictable USD 713 m
USD 1 573 mAid scheduled for disbursement
Aid recorded as disbursed
8 Aid is untied USD 186 m
USD 2 612 mTotal bilateral aid
Untied aid
9 Use of common arrangements or procedures
USD 798 m
USD 2 835 mTotal aid disbursed
Programme-based approaches
10a Joint missions 96
347 Total number of missions
Number of joint missions
10b Joint country analytical work 95
90%
47%
10%
12%
208
45%
7%
28%
28%
39%
30%
33%
15%
11%
7.2
26%
17%
16%
28%
39%243 Total number of country analyses
Number of joint analyses

a weighted averageb unweighted average
121
TABLE C.30 World Bank
Information in the table below covers data reported in 32 countries out of 34 and reflects 53% of country programmed aid in 2005.
Indicators Definitions 2005 Baseline ratio a
Average country ratio b
3 Aid flows are aligned on national priorities
Aid for government sector in budget USD 5 012 m
USD 5 307 mAid disbursed for government sector
4 Strengthen capacity by co-ordinated support
Co-ordinated technical co-operation USD 231 m
USD 404 m Technical co-operation
5a Use of country public financial management systems
USD 2 236 m
USD 5 307 mAid disbursed for government sector
Use of PFM systems
5b Use of country procurement systems
USD 2 146 m
USD 5 307 mAid disbursed for government sector
Use of procurement systems
6 Avoid parallel implementation structures
223
32 Number of countries
Number of parallel PIUs
7 Aid is more predictable USD 4 150 m
USD 6 061 mAid scheduled for disbursement
Aid recorded as disbursed
8 Aid is untied --
--Total bilateral aid
Untied aid
9 Use of common arrangements or procedures
USD 2 997 m
USD 5 228 m Total aid disbursed
Programme-based approaches
10a Joint missions 437
2 058 Total number of missions
Number of joint missions
10b Joint country analytical work 91
94%
57%
42%
40%
223
68%
--
57%
21%
49%
62%
51%
36%
30%
7.0
63%
--
44%
21%
49%187Total number of country analyses
Number of joint analyses
2006 SURVEY ON MONITORING THE PARIS DECLARATION: OVERVIEW OF THE RESULTS - ISBN 978-92-64-01965-2 - ©OECD 2007


1232006 SURVEY ON MONITORING THE PARIS DECLARATION: OVERVIEW OF THE RESULTS - ISBN 978-92-64-01965-2 - ©OECD 2007
TWO QUESTIONNAIRES WERE USED to collect data at country level and stimulate dialogue on aid effectiveness for the 2006 survey. The donor questionnaire was to be completed by all donors operating in the country. The government questionnaire was to be filled in by government authorities. Once completed the results of the questionnaires were consolidated into various tables which were validated collectively. Both the donor and the government questionnaire are reproduced below, edited to refer only to the indicators obtained through the survey and material included in this report.
D SURVEY QUESTIONNAIRES

2006 SURVEY ON MONITORING THE PARIS DECLARATION: OVERVIEW OF THE RESULTS - ISBN 978-92-64-01965-2 - ©OECD 2007
DONOR QUESTIONNAIRE
ABOUT THIS QUESTIONNAIRE
This questionnaire is to be completed by all donor agencies providing official development assistance (ODA) directly to the country receiving aid. Each donor should complete a single questionnaire. It should be noted that in cases where a donor provides funds through another donor (bilateral or multi-lateral), the latter is responsible for reporting in this questionnaire. Once the questionnaire has been completed it should be communicated to the National Co-ordinator for the consolidation of results at country level.
DONOR & COUNTRY INFORMATION
■ Country:
■ Name of donor:
INDICATOR 3: Aid flows are aligned on national priorities
■ How much ODA (excluding debt reorganisation) did you disburse at country level in FY 2005?
Qd1. Total ODA disbursed (USD):
Qd2. How much of this was for the government sector (USD):
INDICATOR 4: Strengthen capacity by co-ordinated support
■ How much technical co-operation did you provide in FY 2005?
Qd3. Total technical co-operation (USD):
■ How much technical co-operation did you provide through co-ordinated programmes in support of capacity development in FY 2005? (A full list of co-ordinated programmes is to be established by the National Co-ordinator.)
Qd4. Co-ordinated technical co-operation (USD):
INDICATOR 5a: Use of country public financial management systems
■ How much ODA disbursed for the government sector in FY 2005 used...
Qd5. ...National budget execution procedures (USD)?
Qd6. ...National financial reporting procedures (USD)?
Qd7. ...National auditing procedures (USD)?
Qd8. ...All three national procedures as defined above (USD)?
INDICATOR 5b: Use of country procurement systems
■ How much ODA disbursed for the government sector in FY 2005 used national procurement systems?
Qd9. Use of national procurement systems (USD):
INDICATOR 6: Avoiding parallel implementation structures
■ How many parallel project implementation units did you make use of in 2005?
(An illustrative (or full) list of parallel PIUs might be established by the National Co-ordinator in order to guide donors’ responses and improve consistency between donors.)
Qd10. Number of parallel PIUs:
1 UN agencies are encouraged to report both individually and collectively in completing the Donor Questionnaire.
124

2006 SURVEY ON MONITORING THE PARIS DECLARATION: OVERVIEW OF THE RESULTS - ISBN 978-92-64-01965-2 - ©OECD 2007
INDICATOR 7: Aid is more predictable
■ How much total ODA for the government sector did you schedule for disbursement in FY 2005?
Qd11. Total ODA for the government sector (USD):
Qd12. How much of this was direct budget support (USD):
INDICATOR 9: Use of common arrangements or procedures
■ How much ODA did you disburse in support of initiatives adopting programme-based approaches in FY 2005? Please provide information for the following components of PBAs.
(A full list of other forms of programme assistance is to be established by the National Co-ordinator):
Qd13. Direct budget support (USD):
Qd14. Other forms of assistance (USD):
INDICATOR 10a: Joint missions
■ How many donor missions to the field were undertaken in FY 2005?
Qd15. Number of missions:
Qd16. How many of these were co-ordinated:
INDICATOR 10b: Joint country analytical work
■ How many country analytical works did you undertake in FY 2005?
Qd17. Number of works:
Qd18. How many of these were co-ordinated:
INDICATOR 12: Mutual accountability
This indicator is to be established in the Country Worksheet.
125
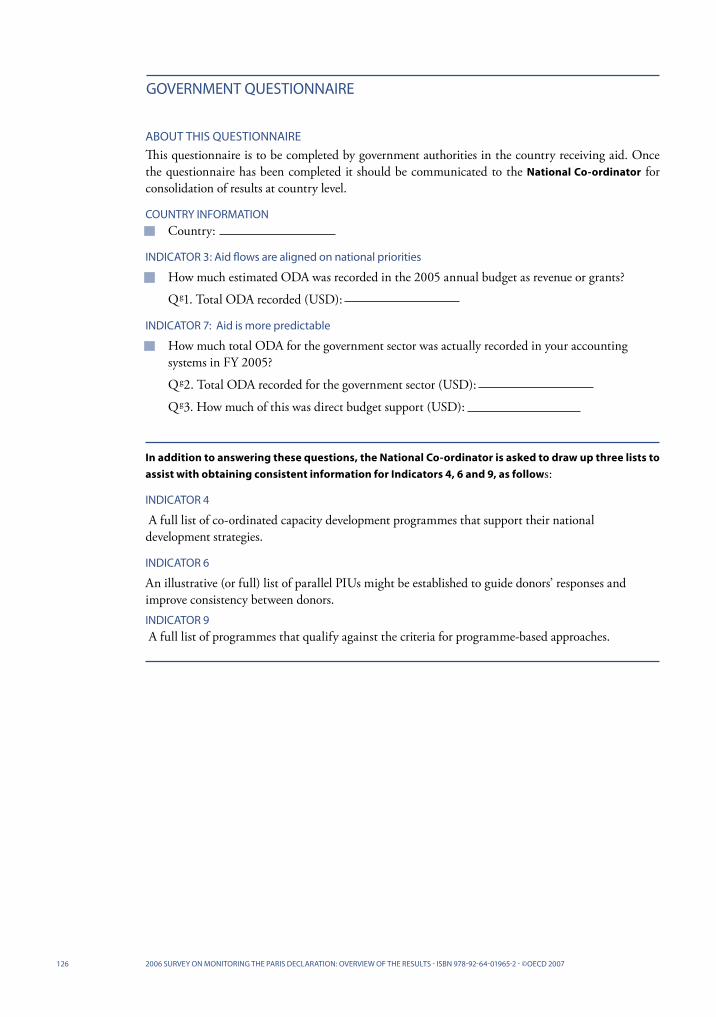
126 2006 SURVEY ON MONITORING THE PARIS DECLARATION: OVERVIEW OF THE RESULTS - ISBN 978-92-64-01965-2 - ©OECD 2007
GOVERNMENT QUESTIONNAIRE
ABOUT THIS QUESTIONNAIRE
This questionnaire is to be completed by government authorities in the country receiving aid. Once the questionnaire has been completed it should be communicated to the National Co-ordinator for consolidation of results at country level.
COUNTRY INFORMATION
■ Country:
INDICATOR 3: Aid flows are aligned on national priorities
■ How much estimated ODA was recorded in the 2005 annual budget as revenue or grants?
Qg1. Total ODA recorded (USD):
INDICATOR 7: Aid is more predictable
■ How much total ODA for the government sector was actually recorded in your accounting systems in FY 2005?
Qg2. Total ODA recorded for the government sector (USD):
Qg3. How much of this was direct budget support (USD):
In addition to answering these questions, the National Co-ordinator is asked to draw up three lists to
assist with obtaining consistent information for Indicators 4, 6 and 9, as follows:
INDICATOR 4
A full list of co-ordinated capacity development programmes that support their national development strategies.
INDICATOR 6
An illustrative (or full) list of parallel PIUs might be established to guide donors’ responses and improve consistency between donors.INDICATOR 9
A full list of programmes that qualify against the criteria for programme-based approaches.

1272006 SURVEY ON MONITORING THE PARIS DECLARATION: OVERVIEW OF THE RESULTS - ISBN 978-92-64-01965-2 - ©OECD 2007
THE FOLLOWING GLOSSARY PROVIDES THE DEFINITIONS FOR THE KEY TERMS USED IN THE DONOR AND
GOVERNMENT QUESTIONNAIRES (SEE APPENDIX D).
Key term Definition & guidance
Donor A donor is an official agency — including state and local govern-ments — that provides official development assistance. Non-governmental organisations (NGO) and private companies do not qualify as donors under this definition.
ODA Grants or loans to countries and territories on the DAC List of ODA Recipients (developing countries) which are: (a) undertaken by the official sector; (b) with promotion of economic develop-ment and welfare as the main objective; (c) at concessional finan-cial terms [if a loan, having a grant element of at least 25%]. In addition to financial flows, technical co-operation is included in aid. Grants, loans and credits for military purposes are excluded. Transfer payments to private individuals (e.g. pensions, reparations or insurance payouts) are in general not counted.
E GLOSSARY OF KEY TERMS
Transactions not to be
recorded in this surveyThe following transactions are excluded from the scope of this survey and should not be recorded: ■ Transactions made to beneficiaries that are not based in the
country receiving ODA or to regional organisations. ■ Debt reorganisation/restructuring1
■ Emergency and relief assistance2
FY 2005 FY 2005 is the fiscal year of the country receiving ODA. Both the donor and the partner government must report on the same fiscal year basis. If fiscal year 2005 is not yet complete at the time of undertaking this survey the respondent should use fiscal year 2004 data and clearly indicate the time period used in the Country Worksheet.
Disbursements A disbursement is the placement of resources at the disposal of a recipient country or agency. Disbursements record the actual inter-national transfer of financial resources, or of goods or services valued at the cost of the donor. Resources provided in kind should only be included when the value of the resources have been mone-tised in an agreement or in a document communicated to govern-ment. In order to avoid double counting in cases where one donor disburses ODA funds on behalf of another, it is the donor that makes the final disbursement to the government that should report on these funds.

2006 SURVEY ON MONITORING THE PARIS DECLARATION: OVERVIEW OF THE RESULTS - ISBN 978-92-64-01965-2 - ©OECD 2007
Key term Definition & guidance
Government sector Administrations (ministries, departments, agencies or municipali-ties) authorised to receive revenue or undertake expenditures on behalf of central government.
128
Annual budget Is the annual budget as it was originally approved by the legislature. In order to support discipline and credibility of the budget prepara-tion process, subsequent revisions to the original annual budget — even when approved by the legislature — should NOT be recorded under question Qg1. This is because it is the credibility of the orig-inal, approved budget that is important to measure and because revisions to the annual budget in many cases are retroactive.
Exchange rates ODA should be reported in US dollars.
Capacity development Different organisations use different definitions for capacity devel-opment. According to the OECD-DAC Network on Governance, capacity development is the process whereby people, organisations and society as a whole unleash, strengthen, create, adapt and main-tain capacity over time. Recent research (OECD 2005) shows that capacity development is more likely to be effective when:
■ Capacity development is treated as a goal in its own right and that increased efforts are made to identify the objectives it seeks to achieve (“Capacity development for what?”).
■ Support for capacity development addresses three dimensions: human capacity, organisational capacity and broader institutional capacity.
■ Capacity development is country owned rather than donor driven.
Disbursements for
the government sectorThis category includes the disbursement of ODA in the context of an agreement with the government sector (see definition above), including works, goods or services delegated or subcontracted by government to other entities (e.g. NGOs, private companies).
ODA recorded
in annual budgetThis should include all ODA recorded in the annual budget as revenue or grants.

2006 SURVEY ON MONITORING THE PARIS DECLARATION: OVERVIEW OF THE RESULTS - ISBN 978-92-64-01965-2 - ©OECD 2007
Key term Definition & guidance
Technical co-operation Technical co-operation (also referred to as technical assistance) is the provision of know-how in the form of personnel, training, research and associated costs. It comprises donor-financed:
■ Activities that augment the level of knowledge, skills, technical know-how or productive aptitudes of people in developing countries; and
■ Services such as consultancies, technical support or the provision of know-how that contribute to the execution of a capital project.
Technical co-operation includes both free-standing technical co operation and technical co-operation that is embedded in invest-ment programmes (or included in programme-based approaches). In order to report against this question donors are invited to review their portfolio of projects and programmes and estimate the share of technical co-operation.
Coordinated
technical co-operation Donors should only record technical co-operation (free-standing and embedded technical co-operation) provided in the context of co-ordinated programmes to strengthen capacity development. To this end, the National Co-ordinator should establish, in consulta-tion with donors, a list of co-ordinated programmes that meet all of the following criteria:■ Capacity development programmes support partners’ national
development strategies.■ Partner country exercises effective leadership over the capacity
development programme supported by donors. This implies clearly communicated objectives from senior country officials.
■ Donors’ integrate their support within country-led programmes to strengthen capacity development.
■ Where more than one donor is involved, arrangements for co-ordinating donor contributions are in place. This includes, for example, arrangements for pooling technical assistance (see example below).
Only technical co-operation provided in programmes included in the above list should be recorded under question Qd4.
Use of national budget
execution procedures (Qd5) Donors use national budget execution procedures when the funds they provide are managed according to the national budgeting procedures as they were established in the general legislation and implemented by government. This means that programmes sup-ported by donors are subject to normal country budgetary execution procedures namely procedures for authorisation, approval and payment.
129

2006 SURVEY ON MONITORING THE PARIS DECLARATION: OVERVIEW OF THE RESULTS - ISBN 978-92-64-01965-2 - ©OECD 2007130
Key term Definition & guidance
Use of national financial
reporting procedures (Qd6) Legislative frameworks normally provide for specific types of financial reports to be produced as well as for the periodicity of such reporting. The use of national financial reporting means that donors do not make additional requirements on governments for financial reporting. In particular they do NOT require:■ The production of additional financial reports.■ Periodicities for reporting that are different from government’s
normal reporting cycle.■ Formats for reporting that do not use government’s existing
chart of accounts.
Use of national auditing
procedures (Qd7) Donors rely on the audit opinions, issued by the country’s supreme audit institution, on the government’s normal financial reports/statements as defined above. The use of national auditing proce-dures means that donors do not make additional requirements on governments for auditing.
All three national procedures
(Qd8) Disbursements of ODA for the government sector that use all three components of a country’s national public financial manage-ment procedures, i.e.: (i) national budget execution procedures; (ii) national financial reporting procedures; and (iii) national auditing procedures.
Use of national procurement
proceduresDonors use national procurement procedures when the funds they provide for the implementation of projects and programmes are managed according to the national procurement procedures as they were established in the general legislation and implemented by government. The use of national procurement procedures means that donors do not make additional, or special, requirements on govern-ments for the procurement of works, goods and services. (Where weaknesses in national procurement systems have been identified, donors may work with partner countries in order to improve the efficiency, economy and transparency of their implementation).
1 Debt reorganisation (also restructuring): Any action officially agreed between creditor and debtor that alters the terms previously established for repayment. This may include forgiveness (extinction of the loan), or rescheduling which can be implemented either by revising the repayment schedule or extending a new refinancing loan.
2 Emergency aid: An “emergency” is an urgent situation created by an abnormal event which a government cannot meet out of its own resources and which results in human suffering and/or loss of crops or livestock. Such an emer-gency can result from i) sudden natural or man-made disasters, including wars or severe civil unrest; or ii) food scarcity conditions arising from crop failure owing to drought, pests and diseases. This item also includes support for disaster preparedness.