2006 Annual Report on Form 10-K
116
2006 Annual Report on Form 10-K
Transcript of 2006 Annual Report on Form 10-K

2006 Annual Report on Form 10-K
24259_FC_BCN:Layout 1 3/9/07 22:40 Page 1

ABOUT THE COMPANY
NewMarket Corporation
through its subsidiaries,
Afton Chemical Corporation and Ethyl Corporation,
develops, manufactures, blends, and delivers
chemical additives that enhance the
performance of petroleum products. From
additive components to custom-formulated chemical blends,
the NewMarket family of companies
provides the world with products and solutions
to make fuels burn cleaner, engines
run smoother, and machines last longer.

FINANCIAL HIGHLIGHTS
2006 2005
(in thousands exceptper-share amounts)
OPERATIONS:Earnings excluding special items . . . . . . . . . . . . . . . . . . . . . . . . . . . $ 53,696 $ 34,948Special items income (a) . . . . . . . . . . . . . . . . . . . . . . . . . . . . . . . . . 3,826 7,433
Net income . . . . . . . . . . . . . . . . . . . . . . . . . . . . . . . . . . . . . . . . . . . . $ 57,522 $ 42,381
PER DILUTED COMMON SHARE: (b)Earnings per share:
Earnings excluding special items . . . . . . . . . . . . . . . . . . . . . . . $ 3.08 $ 2.02Special items income (a) . . . . . . . . . . . . . . . . . . . . . . . . . . . . . .22 .43
Net income . . . . . . . . . . . . . . . . . . . . . . . . . . . . . . . . . . . . . . . . . . . . $ 3.30 $ 2.45
Shares used to compute diluted earnings per share . . . . . . . . . . . . . 17,407 17,320
FINANCIAL POSITION AND OTHER DATA:Cash and cash equivalents . . . . . . . . . . . . . . . . . . . . . . . . . . . . . . . . $ 60,300 $ 56,413Total long-term debt . . . . . . . . . . . . . . . . . . . . . . . . . . . . . . . . . . . . . $153,439 $153,829Shareholders’ equity . . . . . . . . . . . . . . . . . . . . . . . . . . . . . . . . . . . . . $301,402 $266,060Cash dividends declared per share . . . . . . . . . . . . . . . . . . . . . . . . . . $ .50 $ —
(a) The earnings for both 2006 and 2005 includes certain special items. We have reported netincome including special items, as well as earnings excluding special items and therelated per-share amounts. Earnings and earnings per share, excluding special items, arenot financial measures required by, or calculated in accordance with, accountingprinciples generally accepted in the United States (GAAP). We have presented thesenon-GAAP financial measures with the most directly comparable GAAP financialmeasures and have reconciled them to such GAAP financial measures above. Ourmanagement believes this provides information about our operations and, in doing so,provides transparency to investors and enhances period-to-period comparability ofperformance. Our management further believes that this information enables the reader tohave a clear understanding of the results of operations included in the GAAP financialstatements.
Special items income after income taxes:
Settlements-net benefit . . . . . . . . . . . . . . . . . . . . . . . . . . . . . . . $ 5,501 $ 2,464Pharmaceutical earn-out agreement . . . . . . . . . . . . . . . . . . . . . 3,291 —Gain on sale of property . . . . . . . . . . . . . . . . . . . . . . . . . . . . . . 2,028 4,969Loss on early extinguishment of debt . . . . . . . . . . . . . . . . . . . . (6,994) —
$ 3,826 $ 7,433
(b) Information on basic earnings per share is included in the Consolidated Statements ofIncome.

[THIS PAGE INTENTIONALLY LEFT BLANK]

To Our Shareholders:
I am very pleased to report that 2006 was an extremely successful year on many fronts for our company.
Our petroleum additives business, represented by our subsidiary Afton Chemical Corporation, continued togrow and to realize the benefit of its strategy through earnings that were up 74% over last year. This industry hasexperienced many challenges over the past several years, and our team has done an excellent job of steering usthrough those challenges. We were successful in restoring margins to the levels we enjoyed before the rapidescalation in raw materials that started in late 2004. Our employees around the world are focused on helping ourcustomers to grow in their marketplace, and this approach has proven its value to our profit line. While we arevery pleased with our recent improvement in earnings, there is still plenty of room to grow within this relativelylow-growth market. We will be pursuing growth both geographically and through product line extensions. Weare pleased with the returns we deliver to our shareholders for the large amount that we invest each year inresearch and development. We know that this spending is necessary to meet the long term needs of our customersand our industry. In summary, it was just a great year with the organization hitting on all cylinders.
As anticipated, our TEL business declined again in 2006, as this product is in the last years of its economiclife. TEL usage has now been phased out of most major markets, and the segment will only be a smallcontributor to the corporation in future years. This decline has been foreseen for many years, and we have madeour plans and conducted our business accordingly.
We took advantage of our improved balance sheet and financial position to restructure our debt during 2006.We repurchased our outstanding 8.875% senior notes during December and replaced them with $150 million, 10year senior notes with a rate of 7.125%. This reduction in interest rates will lower our interest expenseapproximately $2.6 million each year. Both major credit agencies upgraded our senior notes, as a further externalrecognition of our improved financial position. We are very comfortable with the level of debt issued with thenew senior notes and believe it fits well with our growth ambitions. Finally, we amended our bank loan packageto terms that are more flexible and at a lower cost than the previous bank loan.
We have a dedicated team assessing acquisition opportunities complementary to our core businesses. Weare taking a patient, disciplined approach to identify the appropriate investments for our company.
In early 2007, we announced that we would be developing some of the downtown Richmond property thatwe have owned for many years. This will be a new business line for us and represents a way to unlock some ofthe value that we have in these very desirable properties. We intend to finance this effort mostly with debt. Wewill be reporting more on this project as time goes. We see this as an excellent opportunity to benefit ourshareholders and the downtown development of the City of Richmond.
As we look to 2007, we are very pleased with the performance of our businesses, our strong balance sheet,and our prospects for future growth. It remains our goal to use our financial capabilities to create shareholdervalue, and we will continue to assess the best uses of our cash flow.
I will close, as in previous years, with a salute to our employees. I am more impressed each year by theirattention to detail and dedication to our company. Once again, our safety record was among the best in theindustry as Safety and Quality remain a way of doing business at NewMarket. Thank you for all you do.
Sincerely,
Thomas E. GottwaldPresident and CEO

[THIS PAGE INTENTIONALLY LEFT BLANK]

UNITED STATESSECURITIES AND EXCHANGE COMMISSION
Washington, D.C. 20549
FORM 10-KÈ ANNUAL REPORT PURSUANT TO SECTION 13 OR 15(d) OF THE SECURITIES EXCHANGE ACT
OF 1934
For the fiscal year ended December 31, 2006OR
‘ TRANSITION REPORT PURSUANT TO SECTION 13 OR 15(d) OF THE SECURITIES EXCHANGE ACTOF 1934
For the transition period from toCommission file number 1-32190
NEWMARKET CORPORATIONIncorporated pursuant to the Laws of the Commonwealth of VirginiaInternal Revenue Service Employer Identification No. 20-0812170
330 South Fourth StreetRichmond, Virginia 23219-4350
804-788-5000
Securities registered pursuant to Section 12(b) of the Act:Title of each class Name of each exchange on which registered
COMMON STOCK, without par value NEW YORK STOCK EXCHANGESecurities registered pursuant to Section 12(g) of the Act: None
Indicate by check mark if the registrant is a well-known seasoned issuer, as defined in Rule 405 of the SecuritiesAct Yes È No ‘
Indicate by check mark if the registrant is not required to file reports pursuant to Section 13 or Section 15(d) ofthe Act Yes ‘ No È
Indicate by check mark whether the registrant (1) has filed all reports required to be filed by Section 13 or 15(d) ofthe Securities Exchange Act of 1934 during the preceding 12 months (or for such shorter period that the registrant wasrequired to file such reports), and (2) has been subject to such filing requirements for the past 90days. Yes È No ‘
Indicate by check mark if disclosure of delinquent filers pursuant to Item 405 of Regulation S-K is not containedherein, and will not be contained, to the best of registrant’s knowledge, in definitive proxy or information statementsincorporated by reference in Part III of this Form 10-K or any amendment to this Form 10-K. È
Indicate by check mark whether the registrant is a large accelerated filer, an accelerated filer, or a non-acceleratedfiler. See definition of “accelerated filer and large accelerated filer” in Rule 12b-2 of the Exchange Act. (check one):
Large accelerated filer È Accelerated filer ‘ Non-accelerated filer ‘
Indicate by check mark whether the registrant is a shell company (as defined in Rule 12b-2 of theAct). Yes ‘ No È
Aggregate market value of voting stock held by non-affiliates of the registrant as of June 30, 2006 (the lastbusiness day of the registrant’s most recently completed second fiscal quarter): $717,120,715 *
Number of shares of Common Stock outstanding as of January 31, 2007: 17,293,860
DOCUMENTS INCORPORATED BY REFERENCEPortions of NewMarket Corporation’s definitive Proxy Statement for its 2007 Annual Meeting of Shareholders to
be filed with the Securities and Exchange Commission pursuant to Regulation 14A under the Securities Exchange Actof 1934 are incorporated by reference into Part III of this Annual Report on Form 10-K.
*In determining this figure, an aggregate of 2,628,041 shares of Common Stock as beneficially owned by BruceC. Gottwald and members of his immediate family have been excluded and treated as shares held by affiliates. SeeItem 12. The aggregate market value has been computed on the basis of the closing price in the New York StockExchange Composite Transactions on June 30, 2006 as reported by The Wall Street Journal.

Form 10-KTable of Contents
PART I
Item 1. Business . . . . . . . . . . . . . . . . . . . . . . . . . . . . . . . . . . . . . . . . . . . . . . . . . . . . . . . . . . . . . . . . . . . . 3
Item 1A. Risk Factors . . . . . . . . . . . . . . . . . . . . . . . . . . . . . . . . . . . . . . . . . . . . . . . . . . . . . . . . . . . . . . . . . 12
Item 1B. Unresolved Staff Comments . . . . . . . . . . . . . . . . . . . . . . . . . . . . . . . . . . . . . . . . . . . . . . . . . . . . . 20
Item 2. Properties . . . . . . . . . . . . . . . . . . . . . . . . . . . . . . . . . . . . . . . . . . . . . . . . . . . . . . . . . . . . . . . . . . . 20
Item 3. Legal Proceedings . . . . . . . . . . . . . . . . . . . . . . . . . . . . . . . . . . . . . . . . . . . . . . . . . . . . . . . . . . . . . 21
Item 4. Submission of Matters to a Vote of Security Holders . . . . . . . . . . . . . . . . . . . . . . . . . . . . . . . . . 23
PART II
Item 5. Market for Registrant’s Common Equity, Related Stockholder Matters and Issuer Purchases ofEquity Securities . . . . . . . . . . . . . . . . . . . . . . . . . . . . . . . . . . . . . . . . . . . . . . . . . . . . . . . . . . . . 24
Item 6. Selected Financial Data . . . . . . . . . . . . . . . . . . . . . . . . . . . . . . . . . . . . . . . . . . . . . . . . . . . . . . . . 26
Item 7. Management’s Discussion and Analysis of Financial Condition and Results of Operation . . . . 28
Item 7A. Quantitative and Qualitative Disclosures about Market Risk . . . . . . . . . . . . . . . . . . . . . . . . . . . 42
Item 8. Financial Statements and Supplementary Data . . . . . . . . . . . . . . . . . . . . . . . . . . . . . . . . . . . . . . 44
Item 9. Changes in and Disagreements with Accountants on Accounting and Financial Disclosure . . . 96
Item 9A. Controls and Procedures . . . . . . . . . . . . . . . . . . . . . . . . . . . . . . . . . . . . . . . . . . . . . . . . . . . . . . . . 96
Item 9B. Other Information . . . . . . . . . . . . . . . . . . . . . . . . . . . . . . . . . . . . . . . . . . . . . . . . . . . . . . . . . . . . . 97
PART III
Item 10. Directors, Executive Officers and Corporate Governance . . . . . . . . . . . . . . . . . . . . . . . . . . . . . . 98
Item 11. Executive Compensation . . . . . . . . . . . . . . . . . . . . . . . . . . . . . . . . . . . . . . . . . . . . . . . . . . . . . . . 98
Item 12. Security Ownership of Certain Beneficial Owners and Management and Related StockholderMatters . . . . . . . . . . . . . . . . . . . . . . . . . . . . . . . . . . . . . . . . . . . . . . . . . . . . . . . . . . . . . . . . . . . 98
Item 13. Certain Relationships and Related Transactions, and Director Independence . . . . . . . . . . . . . . . 99
Item 14. Principal Accounting Fees and Services . . . . . . . . . . . . . . . . . . . . . . . . . . . . . . . . . . . . . . . . . . . . 99
PART IV
Item 15. Exhibits, Financial Statement Schedules . . . . . . . . . . . . . . . . . . . . . . . . . . . . . . . . . . . . . . . . . . . 100
Signatures . . . . . . . . . . . . . . . . . . . . . . . . . . . . . . . . . . . . . . . . . . . . . . . . . . . . . . . . . . . . . . . . . . . 103

PART I
ITEM 1. BUSINESS
NewMarket Corporation (NewMarket) (NYSE:NEU) is a holding company which is the parent company ofAfton Chemical Corporation (Afton), Ethyl Corporation (Ethyl), NewMarket Services Corporation (NewMarketServices), and NewMarket Development Corporation (NewMarket Development). NewMarket, through itssubsidiaries Afton and Ethyl, develops, manufactures, blends, and delivers performance chemical additives thatenhance the performance of petroleum products, and markets and sells these chemical additives worldwide.
Afton and Ethyl manage their own assets and liabilities. Afton encompasses the petroleum additivesbusiness, while Ethyl represents the tetraethyl lead (TEL) business and certain manufacturing operations.NewMarket Services provides various administrative services to NewMarket, Afton, and Ethyl. NewMarketServices departmental expenses and other expenses are billed to Afton, Ethyl, and NewMarket pursuant toservices agreements between the companies.
References in this Annual Report on Form 10-K to “we,” “our,” and “NewMarket” are to NewMarketCorporation and its subsidiaries on a consolidated basis, unless the context indicates otherwise.
As a specialty chemicals company, Afton provides highly formulated packages of lubricant and fueladditives. Afton develops, manufactures, and blends fuel and lubricant additive products, and markets and sellsthese products worldwide. Afton is one of the largest global producers of lubricant additives and offers a broadline of fuel additives worldwide. Lubricant and fuel additives are necessary products for efficient maintenanceand reliable operation of all vehicles and machinery. From custom-formulated chemical blends to market-generaladditive components, we believe Afton provides customers with products and solutions that make fuels burncleaner, engines run smoother, and machines last longer.
Afton serves the petroleum additives market with five unique brands. HiTEC® petroleum additives areformulated to provide our customers with a measurable and sustainable marketing or cost advantage. TheGREENBURN® product line provides formulated products to provide immediate, sustained, and economicalperformance features and emission reductions across the entire spectrum of fuels, the TecGARD™ brand isspecially formulated to meet the operating demands of the global metalworking industry, and our BioTEC™additives are designed specifically for the biofuels marketplace. Afton also markets its methylcyclopentadienylmanganese tricarbonyl (MMT®) gasoline additive under several HiTEC products. While providing refinersimproved gasoline production efficiency, MMT has been proven to provide significant environmental andvehicle performance benefits. All five brands are marketed worldwide by Afton employees and our valuabledistributors.
Afton has developed long-term relationships with its customers in every major region of the world, whichAfton serves through seven manufacturing facilities in the Americas and Europe.
Afton has more than 235 employees dedicated to research and development who work closely with theircustomers to develop chemical formulations that are tailored to the customers’ and the end-users’ specific needs.Afton’s portfolio of technologically advanced, value-added products allows it to provide a full range of productsand services to its customers.
Through Ethyl, we are one of the primary marketers of TEL in North America, and through the marketingagreements with affiliates of Innospec Inc., we are the only marketer of TEL outside of North America.
We were incorporated in the Commonwealth of Virginia in 2004. Our principal executive offices are locatedat 330 South Fourth Street, Richmond, Virginia, and our telephone number is (804) 788-5000. We employed1,185 people at year-end 2006.
3

Business Segments
We report our business in two distinct segments: petroleum additives, represented by Afton, and TEL,represented by Ethyl. We divide our business this way due to the operational differences between the twobusiness units. The petroleum additives business operates in a market where we actively seek growthopportunities, while TEL is a mature product with declining demand and is marketed primarily through third-party agreements. Financial information concerning our segments is provided in Item 8, “Financial Statementsand Supplementary Data.”
Petroleum Additives—Petroleum additives are used in lubricating oils and fuels to enhance theirperformance in machinery, vehicles, and other equipment. We manufacture chemical components that areselected to perform one or more specific functions and blend those chemicals with other components to formadditive packages for use in specified end-user applications. The petroleum additives market is an internationalmarketplace, with customers ranging from oil companies and refineries to original equipment manufacturers(OEMs) and other specialty chemical companies. The petroleum additives segment includes common customers,is served by the same plants, shares common components or building blocks, and is supported with a commonsales, as well as research and development, workforce.
We believe our success in the petroleum additives market is largely due to our ability to bring value to ourcustomers. We accomplish this by understanding their needs and applying our technical capabilities, formulationexpertise, broadly differentiated product offerings, and global distribution capabilities to meet those needs. Weinvest significantly in research and development in order to meet our customers’ needs, as well as the rapidlychanging environment for new and improved products and services.
We view the petroleum additives marketplace as being comprised of two broad product groupings: lubricantadditives and fuel additives. Lubricant additives are highly formulated chemical products that improve theperformance, durability, and functionality of mineral oils, synthetic oils, and biodegradable oils, therebyenhancing the performance of machinery and engines. Fuel additives are chemical components and products thatimprove the refining process and performance of gasoline, diesel, and other fuels, resulting in lower fuel costs,improved vehicle performance, reduced tailpipe or smokestack emissions, or improved power plant efficiency.
Lubricant Additives
Lubricant additives are essential ingredients for lubricating oils. Lubricant additives are used in a widevariety of vehicle and industrial applications, including engine oils, automatic transmission fluids, gear oils,hydraulic oils, turbine oils, and in virtually any other application where metal-to-metal moving parts are utilized.Lubricant additives are organic and synthetic chemical components that enhance wear protection, preventdeposits, and protect against the hostile operating environment of an engine, transmission, axle, hydraulic pump,or industrial machine.
Lubricants are used in nearly every piece of operating machinery from heavy industrial equipment tovehicles. Lubricants provide a layer of insulation and protection between moving mechanical parts. Without thislayer of protection, the normal functioning of machinery would not occur. Effective lubricants reduce downtime,prevent accidents, and increase efficiency. Specifically, lubricants serve the following main functions:
• Friction reduction—Friction is reduced by maintaining a thin film of lubricant between moving surfaces,preventing them from coming into direct contact with one another and reducing wear on movingmachinery.
• Heat removal—Lubricants act as coolants by removing heat resulting from either friction or throughcontact with other, higher temperature materials.
• Containment of contaminants—Lubricants can be contaminated in many ways, especially over time.Lubricants are required to function by carrying contaminants away from the machinery and neutralizingthe deleterious impact of the by-products of combustion.
4

The functionality of lubricants is created through an exact balance between a base fluid and performanceenhancing additives. This balance is the goal of effective formulations achieved by experienced researchprofessionals. We offer a full line of lubricant additive products, each of which is composed of componentchemicals specially selected to perform desired functions. We manufacture most of the chemical components andblend these components to create products designed to meet industry and customer specifications. Lubricantadditive components are generally classified based upon their intended functionality, including:
• detergents, which clean moving parts of engines and machines, suspend oil contaminants and combustionby-products, and absorb acidic combustion products;
• dispersants, which serve to inhibit the formation of sludge and particulates;
• extreme pressure/antiwear agents, which reduce wear on moving engine and machinery parts;
• viscosity index modifiers, which improve the viscosity and temperature characteristics of lubricants andhelp the lubricant flow evenly to all parts of an engine or machine; and
• antioxidants, which prevent oil from degrading over time.
We are one of the leading global suppliers of specially formulated lubricant additives that combine some orall of the components described above to develop our products. Our products are highly formulated, complexchemical compositions derived from extensive research and testing to ensure all additive components worktogether to provide the intended results. Our products are engineered to meet specifications prescribed by eitherthe industry generally or a specific customer. Purchasers of lubricant additives tend to be oil companies,distributors, refineries, and compounder/blenders.
Key drivers of demand for lubricant additives include total vehicle miles driven, vehicle production, equipmentproduction, the average age of vehicles on the road, new engine and driveline technologies, and drain/refillintervals.
We view our participation in the lubricant marketplace in three primary areas: engine oil additives, drivelineadditives, and industrial additives. Our view is not necessarily the same way our competitors view the market.
Engine Oil Additives—The largest submarket within the lubricant additives marketplace is engine oils,which we estimate represents approximately 65% of the overall lubricant additives market volume, but a muchlower percentage of the overall market profitability. The engine oils market ultimate customers includeconsumers, service stations, and OEMs. The extension of drain intervals has generally offset increased demanddue to higher vehicle population and more miles driven. The primary functions of engine oil additives are toreduce friction, prevent wear, control formation of sludge and oxidation, and prevent rust. Engine oil additivesare typically sold to lubricant manufacturers who combine them with a base oil product to meet internal,industry, and OEM specifications.
Key drivers of the engine oils market are the number of vehicles on the road, drain intervals for engine oils,engine and crankcase size, changes in engine design, and temperature and specification changes driven by theOEMs. Customer and supplier dynamics have created a difficult marketplace for engine oil additives in recentyears as the marketplace values engine oil products more like a commodity.
Afton’s goal is to improve the profitability of this product line by developing additives that are speciallyformulated for the vehicles people drive and the way they drive them. Afton offers additives for oils that webelieve protect the modern engine and makes additives that are specially formulated to protect high mileagevehicles. Afton offers products that enhance the performance of mineral, part-synthetic, and fully-syntheticengine oils.
Driveline Additives—The driveline additives submarket is comprised of additives designed for productssuch as automatic transmission fluids (ATF), gear oils, and tractor fluids. This submarket shares in the 35% of
5

the market not covered by engine oils but has a much higher profitability than engine oils on a unit basis. ATFsprimarily serve as the power transmission and heat transfer medium in the area of the transmission where thetorque of the drive shaft is transferred to the gears of the vehicle. Gear additives lubricate gears, bearings,clutches, and bands in the gear-box and are used in vehicles, off-highway, hydraulic, and marine equipment.Other products in this area consist of hydraulic transmission fluids, universal tractor fluids, power steering fluids,shock absorber fluids, gear oils, lubricants for heavy machinery, and vehicle greases. These products mustconform to highly prescribed specifications developed by vehicle OEMs for specific models or designs. Theseadditives are generally sold to oil companies and often ultimately sold to vehicle OEMs for new vehicles(factory-fill). End-products are also sold to service dealers for aftermarket servicing (service-fill), as well asretailers and distributors.
Key drivers of the driveline additives marketplace are the number of vehicles manufactured, drain intervalsfor ATF and gear applications, changes in engine and transmission design and temperatures, and specificationchanges driven by the OEMs.
Industrial Additives—The industrial additives submarket is comprised of additives designed for products forindustrial applications such as hydraulic fluids, grease, industrial gear fluids, industrial specialty applications,and metalworking additives. This submarket also shares in the 35% of the market not covered by engine oils andhas a much higher profitability margin than engine oils. These products must conform to industry specifications,OEM requirements and/or application and operating environment demands. Industrial additives are generallysold to oil companies, service dealers for aftermarket servicing, retailers, and distributors.
Key drivers of the industrial additives marketplace are gross domestic product growth and industrialproduction.
Fuel Additives
Fuel additives are chemical compounds that are used to improve both the oil refining process and theperformance of gasoline, diesel, residual, and other fuels. Benefits of fuel additives in the oil refining processinclude reduced use of crude oil, lower processing costs, and improved fuel storage properties. Fuel performancebenefits include ignition improvements, combustion efficiency, reduced emission particulates, fuel economyimprovements, and engine cleanliness, as well as protection against deposits in fuel injectors, intake valves, andthe combustion chamber. Our fuel additives are extensively tested and designed to meet stringent industry,government, OEM, and individual customer requirements.
Many different types of additives are used in fuels. Their use is generally determined by customer, industry,OEM, and government specifications, and often differs from country to country. The types of fuel additives weoffer include:
• gasoline performance additives, which clean and maintain key elements of the fuel delivery systems,including fuel injectors and intake valves, in gasoline engines;
• diesel fuel performance additives, which perform similar cleaning functions in diesel engines;
• cetane improvers, which increase the cetane number (ignition quality) in diesel fuel by reducing the delaybetween injection and ignition;
• stabilizers, which reduce or eliminate oxidation in fuel;
• corrosion inhibitors, which minimize the corrosive effects of combustion by-products and prevent rust;
• lubricity additives, which restore lubricating properties lost in the refining process;
• cold flow improvers, which improve the pumping and flow of diesel in cold temperatures; and
• octane enhancers, which increase octane ratings and decrease emissions.
6

We offer a broad line of fuel additives worldwide and sell our products to major fuel marketers and refiners,as well as independent terminals and other fuel blenders.
Key drivers in the fuel additive marketplace include total vehicle miles driven, the introduction of moresophisticated engines, regulations on emissions (both gasoline and diesel), quality of the crude oil slate andperformance standards, and marketing programs of major oil companies.
Competition
In the lubricant additives submarket of petroleum additives, we believe that the four top suppliers in 2006supplied over 80% of the market. These suppliers include Afton, The Lubrizol Corporation, Infineum (a jointventure between ExxonMobil Chemical and Royal Dutch Shell plc), and Oronite (a subsidiary of Chevron).Several other suppliers comprise the remaining market share.
The fuel additives submarket is fragmented and characterized by more competitors. While we participate inmany facets of the fuel additives market, our competitors tend to be more narrowly focused. In the gasolinedetergent market, we compete mainly against BASF AG, Oronite, and Lubrizol; in the cetane improver market,we compete against Innospec, Groupe SNPE of France, and Exchem EPC Groupe of the U.K.; and in the dieselmarkets, we compete against Lubrizol, Infineum, BASF, and Innospec.
The competition among the participants in these industries is characterized by the need to provide customerswith cost effective, technologically capable products that meet or exceed industry specifications. The need tocontinually lower cost through formulation technology and cost improvement programs is vital for success in thisenvironment.
Tetraethyl Lead—TEL is a distinct business segment. TEL is used as an octane enhancer in gasoline toimprove ignition qualities and operating performance of fuel. Since the 1920s, TEL has been used to prevent“engine knock,” a condition of poor combustion timing causing loss of engine power. In the 1970s, U.S.automobile manufacturers began including emissions control technology in vehicles to comply with the FederalClean Air Act. When the surface metal of a catalytic converter in emissions control systems was deemedincompatible with lead, unleaded gasoline became the fuel standard in the United States with other countriesfollowing. Innospec is now the only manufacturer of TEL worldwide. Through our agreements with Innospec, wereceive 32% of the net proceeds from the sale of TEL by Innospec in all regions of the world except NorthAmerica. In North America, we continue to purchase TEL from Innospec and sell it to selected customers foraviation and racing fuel. Our agreements with Innospec expire in 2010, but contain provisions for extensionsthereafter.
As we look forward, we expect a continuing decline in demand for TEL. We do expect that the demand forthis product will continue for many years to come, but at a low level of volume and profits.
Raw Materials and Product Supply
We use a variety of raw materials and chemicals in our manufacturing and blending processes and believethe sources of these are adequate for our current operations. The most important raw materials for Afton are baseoil, polyisobutylene, maleic anhydride, olefin copolymers, antioxidants, alcohols, and methacrylates. Thechemical industry, in general, is experiencing some tightness in the supply of certain commodity materials. Wecontinue to monitor the situation and will adjust our procurement strategies accordingly. Generally, we purchasemajor raw materials and chemicals under long-term contracts with multi-source suppliers. Certain products,however, are obtained through single-source suppliers.
We have the following long-term supply agreements for raw materials and finished products:
• Innospec supplies TEL for our North American sales of that product under an agreement dated January 1,1998.
7

• Until October 2006, Albemarle Corporation (Albemarle) supplied MMT, a fuel additive, under a supplyagreement which was originally set to expire in 2014. Effective October 31, 2006, Afton purchasedsubstantially all of the assets used in the production of MMT from Albemarle. Albemarle will continue tooperate the MMT production facility for the benefit of Afton pursuant to the terms of an Amended andRestated Supply Agreement.
Research, Development, and Testing
Research, development, and testing (R&D) provides the basis for our global petroleum additivestechnology. We develop products through a combination of chemical synthesis, formulation, engineering designand performance testing. In addition to products, R&D also provides our customers with technical support andproduct differentiation to assure total customer satisfaction.
We are committed to providing the most advanced products, comprehensive testing programs and superiortechnical support to our customers and to OEMs worldwide. R&D expenditures, which totaled $70 million in2006 and $65 million in 2005 and 2004, are expected to grow modestly in 2007 in support of our core technologyareas. The efficiency of our R&D spending continues to improve through expansion of internal testingcapabilities, implementation of leading-edge data acquisition, control and analysis techniques, and advancedproject/portfolio management processes.
Afton continues to develop new technology and products to meet the changing requirements of OEMs andto keep our customers well positioned for the future. A significant portion of our R&D investment is dedicated tothe development of the next-generation additive technologies that will be required for future hardware designs,changing use patterns, and the technical differentiation of our customers’ products.
In 2006, we continued the advancement of our global automatic transmission fluid additive line with thecommercialization of new highly-durable fluid technologies, both at OEMs and in the service fill arena. Newcomponent technology was invented for use in gear additive packages that provides strong anti-wearperformance in fuel efficient lubricants. New engine oil component technology and formulations were developedin 2006 which will be commercialized in 2007 in both passenger car and heavy-duty diesel areas. We continuedto broaden our product portfolio in the industrial lubricant area with the introduction of several new products andentrance into new markets. Several new products were developed in the fuel additive area, which extend ourability to provide exceptional “keep clean” and “clean up” performance, as well as fuel economy improvement inglobal vehicle platforms.
Intellectual Property
Our intellectual property, including our patents, licenses, and trademarks, is an important component of ourbusiness. We actively protect our inventions, new technologies, and product developments by filing patentapplications or maintaining trade secrets. We currently own approximately 1,600 issued United States andforeign patents, with a significant number of additional patents pending. The use of technology covered byseveral of these patents and trade secrets is licensed to others through a royalty-generating licensing program. Inaddition, we have acquired the rights under patents and inventions of others through licenses or otherwise. Wetake care to respect the intellectual property rights of others and we believe our products do not infringe uponthose rights. We vigorously participate in patent opposition proceedings around the world, where necessary, tosecure a technology base free of infringement. We believe our patent position is strong, aggressively managed,and sufficient for the conduct of our business.
We also have several hundred trademark registrations throughout the world for our marks, including AftonChemical®, Ethyl®, MMT®, HiTEC®, and GREENBURN®, as well as several pending service mark andtrademark applications, including NewMarketSM, TecGARD™, and BioTEC™.
8

Commitment to Environmental and Safety Excellence
We are committed to continuous improvement and vigilant management of the health and safety of ouremployees, neighbors, and customers, as well as the stewardship of the environment. One way our companiesdemonstrate this is through our commitment to the principles of the American Chemistry Council (ACC)Responsible Care® program. In 2006, the Environmental, Health, Safety and Security Management Systems ofboth Afton and Ethyl were certified by an independent auditing process as established by the ACC as arequirement of membership. Additionally, Afton’s Sauget, Illinois plant completed certification in theenvironmental standard ISO 14001. This plant also continues to be an OSHA Star VPP (Voluntary ProtectionProgram) location.
Safety and environmental responsibility is a way of life at NewMarket—enhancing operations, the way wework, and the relationships we maintain with our customers and our communities. Our executive managementmeetings begin with a review of our environmental and safety performance. We believe we are a leader in thechemical industry with our performance.
Our objective is to establish a culture where our employees understand that good environmental and safetyperformance is good business and understand that environmental compliance and safety is their personalresponsibility.
Our worldwide injury/illness recordable rate (which is the number of injuries per 200,000 hours worked) in2006 was 0.99. The 2005 rate was 0.72, which was our best year ever. We intend to continue to demonstrate oursafety culture with continuous improvement in our safety record. This represents a focused effort by all of ouremployees. We are extremely proud of our accomplishments in the safety area, especially when compared tosafety records in other industries.
As members of the ACC, Afton and Ethyl provide data on twelve metrics used to track environmental,safety, energy use, and product stewardship performance of ACC member companies. These can be viewed atwww.responsiblecare-us.com. The information on this website is not, and shall not be deemed to be, a part of thisAnnual Report on Form 10-K or incorporated by reference in this Annual Report on Form 10-K or any otherfilings we make with the Securities and Exchange Commission (SEC).
Environmental
We operate under policies that we believe comply with federal, state, local, and foreign requirementsregarding the handling, manufacture, and use of materials. One or more regulatory agencies may classify some ofthese materials as hazardous or toxic. We also believe that we comply in all material respects with laws,regulations, statutes, and ordinances protecting the environment, including those related to the discharge ofmaterials. We expect to continue to comply in all material respects.
We regularly review the status of significant existing or potential environmental issues. We accrue andexpense our proportionate share of environmental remediation and monitoring costs in accordance withStatement of Financial Accounting Standards (SFAS) No. 5 and Financial Accounting Standards BoardInterpretation No. 14, as clarified by the American Institute of Certified Public Accountants Statement ofPosition 96-1. As necessary, we adjust our accruals based on current information.
Total gross liabilities accrued at year-end for environmental remediation were $19 million for 2006 and $23million for 2005. In addition to the accruals for environmental remediation, we also had accruals for dismantlingand decommissioning costs of $3 million at December 31, 2006 and $7 million at December 31, 2005. Thedecrease in these amounts between 2006 and 2005 primarily reflects the dismantling of our TEL facility inCanada. As new technology becomes available, it may be possible to reduce accrued amounts. While we believethat we are fully accrued for known environmental issues, it is possible that unexpected future costs could have asignificant financial impact on our financial position and results of operations.
9

During the third quarter of 2004, we reached a $16 million environmental insurance settlement resulting inthe collection of insurance reimbursements. The gain on this settlement amounted to $13 million and is reflectedin the Consolidated Statements of Income under the caption “Special item income.” We received $8 millionduring 2004. We received $4 million in February 2005 and $4 million in February 2006 in accordance with apreviously agreed-upon payment schedule.
We spent approximately $16 million in 2006, $13 million in 2005, and $14 million in 2004 for ongoingenvironmental operating and clean-up costs, excluding depreciation of previously capitalized expenditures. Theseenvironmental operating and clean-up expenses are included in cost of goods sold. In 2007, we expectenvironmental operating and clean-up costs to be about the same as 2006.
For capital expenditures on pollution prevention and safety projects, we spent $6 million in 2006, $5 millionin 2005, and $4 million in 2004.
Our estimate of the effects of complying with governmental pollution prevention and safety regulations issubject to:
• potential changes in applicable statutes and regulations (or their enforcement and interpretation);
• uncertainty as to the success of anticipated solutions to pollution problems;
• uncertainty as to whether additional expense may prove necessary; and
• potential for emerging technology to affect remediation methods and reduce associated costs.
We are subject to the federal Superfund law and similar state laws under which we may be designated as apotentially responsible party (PRP). As a PRP, we may be liable for a share of the costs associated with cleaningup hazardous waste sites, such as a landfill to which we may have sent waste.
In de minimis PRP matters and in some minor PRP matters, we generally negotiate a consent decree to payan apportioned settlement. This relieves us of any further liability as a PRP, except for remote contingencies.Settlement costs for a de minimis participant are typically less than $50,000. Settlement costs for a minorparticipant are typically less than $300,000.
We are also a PRP at some Superfund sites where our liability may be in excess of de minimis or minor PRPlevels. Most Superfund sites where we are a PRP represent environmental issues that are quite mature. The siteshave been investigated, and in many cases, the remediation methodology, as well as the proportionate shares ofeach PRP, has been established. Other sites are not as mature, which makes it more difficult to reasonablyestimate our share of the future clean-up or remediation costs. We have previously accrued the estimated expenseof the remediation and monitoring of these sites. Generally, remediation and monitoring will go on for anextended period.
During 2000, the Environmental Protection Agency (EPA) named us as a PRP under Superfund law for theclean-up of soil and groundwater contamination at the Sauget Area 2 Site in Sauget, Illinois. Without admittingany fact, responsibility, fault, or liability in connection with this site, we are participating with other PRPs in siteinvestigations and feasibility studies.
The Sauget Area 2 Site PRPs submitted a Remedial Investigation and Feasibility Study (RI/FS) to the EPAin early 2004. We have accrued our estimated proportional share of the expenses for the RI/FS. We also accruedour best estimate of our proportional share of the remediation liability proposed in that submission. The EPA didnot accept the RI/FS. Through a series of submissions and meetings, the scope of the RI/FS has changed so that itis now scheduled to be submitted to the EPA in late 2007. The RI/FS work is ongoing, and we believe it is not ata stage where any further conclusion can be drawn as to the remediation liability we may incur. We do notbelieve there is any additional information available as a basis for revision of the liability that we haveestablished. The amount accrued for this site is not material.
10

We also have several other environmental sites where we are in the process of remediation and monitoring.At one of our major sites in the United States, we have substantially completed environmental remediation andwill be monitoring the site for an extended period. In addition, during 2004 we began the dismantling and relatedremediation of some TEL facilities no longer in use at our Canadian plant. That dismantling and remediation issubstantially complete and we expect will be fully completed in 2007.
Geographic Areas
We have operations in the United States, Europe, Asia, Latin America, Australia, the Middle East, and Canada.The economies are stable in most of the countries where we operate. In countries with more political or economicuncertainty, we generally minimize our risk of loss by utilizing U.S. Dollar-denominated transactions, letters ofcredit, and prepaid transactions. We also participate in selective foreign currency forward contracts at certain times.Our foreign customers mainly consist of financially viable government organizations and large companies.
The table below reports net sales and long-lived assets by geographic area. Except for the United States, nocountry exceeded 10% of net sales during any year. The United States was the only country that exceeded 10%of long-lived assets in any year. We assign revenues to geographic areas based on the location to which theproduct was shipped. The change in net sales during the three-year period is discussed more fully in Item 7,“Management’s Discussion and Analysis of Financial Condition and Results of Operation.”
Geographic Areas
2006 2005 2004
(in millions of dollars)
Net SalesUnited States . . . . . . . . . . . . . . . . . . . . . . . . . . . . . . . . . . . . . . . . . . . . . . . . . . . . . . . $ 517 $ 419 $326Foreign . . . . . . . . . . . . . . . . . . . . . . . . . . . . . . . . . . . . . . . . . . . . . . . . . . . . . . . . . . . 746 657 568
Consolidated net sales . . . . . . . . . . . . . . . . . . . . . . . . . . . . . . . . . . . . . . . . . . . . $1,263 $1,076 $894
Long-lived assets (a)United States . . . . . . . . . . . . . . . . . . . . . . . . . . . . . . . . . . . . . . . . . . . . . . . . . . . . . . . $ 191 $ 183 $199Foreign . . . . . . . . . . . . . . . . . . . . . . . . . . . . . . . . . . . . . . . . . . . . . . . . . . . . . . . . . . . 31 34 44
Total long-lived assets . . . . . . . . . . . . . . . . . . . . . . . . . . . . . . . . . . . . . . . . . . . . $ 222 $ 217 $243
(a) Long-lived assets include property, plant, and equipment, net of depreciation, as well as intangible assetsand prepayments for services, both net of amortization.
Net sales to two customers of our petroleum additives segment exceeded 10% of total net sales in 2006,2005, and 2004. Sales to BP plc and its affiliates (BP) amounted to $127 million (10% of net sales) in 2006, $112million (10% of total net sales) in 2005, and $99 million (11% of total net sales) in 2004. Sales to Royal DutchShell plc and its affiliates (Shell) amounted to $169 million (13% of total net sales) in 2006, $143 million (13%of total net sales) in 2005, and $119 million (13% of total net sales) in 2004. These net sales represent a wide-range of products sold to these two customers in multiple regions of the world.
Recent Developments
In January 2007, Foundry Park I, LLC (Foundry Park I), a wholly-owned subsidiary of NewMarketDevelopment, entered into a Deed of Lease Agreement with MeadWestvaco Corporation (MeadWestvaco) underwhich MeadWestvaco will lease an office building which will be constructed on approximately three acres ofreal property which is owned by Foundry Park I. The property is part of a larger office park and mixed-usedevelopment known as “Foundry Park.” The office building is designed to include approximately 304,000
11

rentable square feet. In addition to the office building, MeadWestvaco has the right to parking facilities that areexpected to contain approximately 1,050 parking spaces, and the right to use all common areas within the officebuilding and Foundry Park.
Foundry Park I plans to invest between approximately $110 million and $140 million in completingconstruction of the building. Most of the cost will be financed through construction and permanent indebtedness.Foundry Park I expects construction to require at least two years. The lease, which will cover the entire officebuilding, is a long-term lease with lease payments at competitive market rates.
On November 21, 2006, we commenced a tender offer to purchase any and all $150 million in aggregateprincipal amount of our outstanding 8.875% senior notes due 2010 and a related solicitation of consents tocertain amendments to the indenture governing the 8.875% senior notes designed to remove substantially all ofthe restrictive covenants and certain events of default that applied to the 8.875% senior notes. As of 5:00 p.m.,New York City time, on December 21, 2006, the expiration date for the tender offer, we had accepted tender of8.875% senior notes from holders of $149,750 million (or 99.83%) in aggregate principal amount of theoutstanding 8.875% senior notes. We redeemed the remaining $250,000 in aggregate principal amount of the8.875% senior notes on February 7, 2007 at a redemption price equal to 105.105% of the principal amount of theredeemed notes, plus accrued and unpaid interest to February 7, 2007.
Availability of Reports Filed with the Securities and Exchange Commission and Corporate GovernanceDocuments
Our internet website address is www.newmarket.com. We make available, free of charge through ourwebsite, our Annual Report on Form 10-K, Quarterly Reports on Form 10-Q, Current Reports on Form 8-K andamendments to those reports filed or furnished pursuant to Section 13(a) or 15(d) of the Securities Exchange Actof 1934, as amended (Exchange Act), as soon as reasonably practicable after such documents are electronicallyfiled with, or furnished to, the SEC. In addition, our Corporate Governance Guidelines, Code of Conduct, and thecharters of our Audit; Bonus, Salary and Stock Option; and Nominating and Corporate Governance Committees,are available on our website and are available in print, without charge, to any shareholder upon request bycontacting our Corporate Secretary at NewMarket Corporation, 330 South Fourth Street, Richmond, Virginia23219. The information on our website is not, and shall not be deemed to be, a part of this Annual Report onForm 10-K or incorporated by reference in this Annual Report on Form 10-K or any other filings we make withthe SEC.
ITEM 1A. RISK FACTORS
Our business is subject to many factors that could materially adversely affect our future performance andcause our actual results to differ materially from those expressed or implied by forward-looking statements madein this Annual Report on Form 10-K. Those risk factors are outlined below.
• Competition could adversely affect our operating results.
We face intense competition in certain of the product lines and markets in which we compete. We expectthat our competitors will develop and introduce new and enhanced products, which could cause a declinein the market acceptance of certain products we manufacture. Our competition may also expand theirproduction capacity, which could decrease market prices for our products and adversely affect ourprofitability. In addition, as a result of price competition, we may be compelled to reduce the prices forsome of our products, which could adversely affect our margins and profitability. Competitive pressurescan also result in the loss of major customers. Our inability to compete successfully could have a materialadverse effect on our results of operations, financial condition, and cash flows in any given period. Inaddition, some of our competitors may have greater financial, technological, and other resources than wehave. Some of our competitors may also be able to maintain greater operating and financial flexibility
12

than we are able to maintain. As a result, these competitors may be able to better withstand changes inconditions within our industry, changes in the prices for raw materials, and changes in general economicconditions.
• Sudden or sharp raw materials price increases may adversely affect our profit margins.
We utilize a variety of raw materials in the manufacture of our products, including base oil,polyisobutylene, maleic anhydride, olefin copolymers, antioxidants, alcohols, and methacrylates. Ourprofitability is sensitive to changes in the costs of these materials caused by changes in supply, demand orother market conditions, over which we have little or no control. Political and economic conditions in theMiddle East and Latin America have caused and may continue to cause the cost of our raw materials tofluctuate. War, armed hostilities, terrorist acts, civil unrest, or other incidents may also cause a sudden orsharp increase in the cost of our raw materials. We cannot assure you that we will be able to pass on toour customers any future increases in raw material costs in the form of price increases for our products.
• Availability of raw materials and transportation systems could have a material adverse effect onour operations.
The chemical industry and transportation industry are in a situation where supply and demand are inbalance. Any significant disruption in supply could affect our ability to obtain raw materials ortransportation systems. This could have a material adverse effect on our operations.
• Our reliance on a small number of significant customers may have a material adverse effect on ourresults of operations.
Our principal customers are major multinational oil companies. The oil industry is characterized byconcentration of a few large participants as a result of consolidation. Two of our customers individuallyaccounted for more than 10% of our net sales in 2006. Net sales for 2006 to BP amounted to $126 million(10% of total net sales), and net sales to Shell amounted to $169 million (13% of total net sales). The lossof either of these customers, or a material reduction in purchases by either of them, or by any other largeor significant customer, could have a material adverse effect on our results of operations, financialcondition, and cash flow.
• Our customers are concentrated in the lubricant and fuel industries and, as a result, our reliance onthat industry is significant.
Most of our customers are primarily engaged in the fuel and lubricant industries. This concentration ofcustomers affects our overall risk profile, since our customers will be similarly affected by changes ineconomic, geopolitical, and industry conditions. Many factors affect the level of our customers’ spendingon our products, including, among others, general business conditions, changes in technology, interestrates, gasoline prices, and consumer confidence in future economic conditions. A sudden or protracteddownturn in these industries could adversely affect the buying power and purchases by our customers.
• We may be unable to respond effectively to technological changes in our industry.
Our future business success will depend upon our ability to maintain and enhance our technologicalcapabilities, develop and market products and applications that meet changing customer needs, andsuccessfully anticipate or respond to technological changes on a cost-effective and timely basis. Ourindustry is characterized by frequent changes in industry performance standards, which affect the amountand timing of our research and development costs and other technology-related costs. As a result, the lifecycle of our products is often hard to predict. Further, technological changes in some or all of ourcustomers’ products or processes may make our products obsolete. Any inability to anticipate, respond to,
13

or utilize changing technologies could have a material adverse effect on our results of operations,financial condition, and cash flow in any given period.
• We may not be able to consummate future acquisitions or successfully integrate future acquisitionsinto our business, which could result in unanticipated expenses and losses.
As part of our business growth strategy, we intend to pursue acquisitions and joint venture opportunities.Our ability to implement this component of our growth strategy will be limited by our ability to identifyappropriate acquisition or joint venture candidates and our financial resources, including available cashand borrowing capacity. The expense incurred in consummating acquisitions or entering into jointventures, the time it takes to integrate an acquisition, or our failure to integrate businesses successfully,could result in unanticipated expenses and losses. Furthermore, we may not be able to realize any of theanticipated benefits from acquisitions or joint ventures.
The process of integrating acquired operations into our existing operations may result in unforeseenoperating difficulties and may require significant financial resources that would otherwise be available forthe ongoing development or expansion of existing operations. Some of the risks associated with theintegration of acquisitions include:
• potential disruption of our ongoing business and distraction of management;
• unforeseen claims and liabilities, including unexpected environmental exposures;
• unforeseen adjustments, charges, and write-offs;
• problems enforcing the indemnification obligations of sellers of businesses or joint venturepartners for claims and liabilities;
• unexpected losses of customers of, or suppliers to, the acquired business;
• difficulty in conforming the acquired business’ standards, processes, procedures and controls withour operations;
• variability in financial information arising from the implementation of purchase price accounting;
• inability to coordinate new product and process development;
• loss of senior managers and other critical personnel and problems with new labor unions; and
• challenges arising from the increased scope, geographic diversity, and complexity of ouroperations.
• Our TEL business has declined and will continue to decline.
Historically, TEL, an octane enhancer in leaded gasoline used to improve ignition qualities and operatingperformance of fuel, has been a material component of our product line. However, during the 1970s, theimplementation of the Federal Clean Air Act led to the use of catalytic converters that are deemed nolonger compatible with leaded gasoline, and unleaded gasoline became the fuel standard in the UnitedStates with other countries following. As a result, our TEL financial results have declined. The TELsegment represented approximately 2.8% of our 2006 segment operating profit. We do not expect TEL torebound from this low level of profits.
• Our TEL results would be adversely affected if Innospec did not comply with the terms of themarketing and supply agreements or if we did not prevail in our arbitrations with Innospec.
Results for our TEL segment include the operating profit contribution from marketing agreementsbetween Ethyl or its subsidiaries and subsidiaries of Innospec for the sale of TEL outside of North
14

America. Innospec is now the only manufacturer of TEL worldwide. Under our marketing agreementswith Innospec, we receive 32% of the net proceeds from the sale of TEL by Innospec in all regions of theworld, except North America. As a result, our TEL results would be adversely affected if Innospec didnot comply with the terms of the marketing agreements.
After the commencement of the arbitration discussed below, Ethyl received three requests for arbitrationfiled by three subsidiaries of Innospec related to the marketing agreements. Innospec is claiming the rightto terminate the agreements. Although the marketing agreements relate only to TEL, Innospec contendsthat the agreements impose certain duties that were breached by sales and marketing of MMT in Iraq andSouth Africa by affiliates of Ethyl. Although we believe these claims have no merit, an adverse outcomein the arbitrations could have a material effect on our financial condition or results of operations.
Ethyl filed a request for arbitration against a subsidiary of Innospec related to a supply agreement thatrequires the Innospec subsidiary to supply Ethyl with TEL for resale by Ethyl in the United States. Ethylfiled this request because it believes that Innospec has violated the supply agreement by attempting toincrease the price it charges Ethyl for TEL in the United States in a manner not in accordance with thecontract. The difference in prices that Innospec is claiming is approximately $1.7 million for productsupplied through September 30, 2006 and would amount to approximately an additional $1 million if thesame factors were applied to TEL supplied in the fourth quarter 2006. We are confident in our positionand believe we will prevail. Regardless of the outcome, we do not believe the TEL dispute will have amaterial effect on our financial condition or results of operations. However, with TEL segment operatingprofit at such a low level, a relatively small increase in cost resulting from this arbitration could bematerial to TEL segment results.
• Several of our products are produced solely at one facility, and a significant disruption or disasterat such a facility could have a material adverse effect on our results of operations.
Several of the products we produce or sell are produced only in one location. We are dependent upon thecontinued safe operation of those production facilities. Those production facilities are subject to varioushazards associated with the manufacture, handling, storage, and transportation of chemical materials andproducts, including leaks and ruptures, explosions, fires, inclement weather and natural disasters,unscheduled downtime, and environmental hazards. Some of our products involve the manufacture andhandling of a variety of reactive, explosive, and flammable materials. Many of these hazards could causea disruption in the production of our products. We cannot assure you that these facilities will notexperience these types of hazards and disruptions in the future or that these incidents will not result inproduction delays or otherwise have an adverse effect on our results of operations, financial condition orcash flows in any given period.
• We face risks related to our foreign operations that may negatively affect our business.
In 2006, net sales to customers outside North America accounted for approximately 52% of total netsales. We do business in all major regions of the world, some of which do not have stable economies orgovernments. In particular, we sell and market products in countries experiencing political and economicinstability in the Middle East, Asia Pacific, and Latin America. Our international operations are subject tointernational business risks, including unsettled political conditions, expropriation, import and exportrestrictions, increases in royalties, exchange controls, national and regional labor strikes, taxes,government royalties, inflationary economies and currency exchange rate fluctuations, and changes inlaws and policies governing operations of foreign-based companies (such as restrictions on repatriation ofearnings or proceeds from liquidated assets of foreign subsidiaries). The occurrence of any one or acombination of these factors may increase our costs or have other adverse effects on our business.
15

• We are exposed to fluctuations in foreign exchange rates, which may adversely affect our results ofoperations.
We conduct our business in the local currency of most of the countries in which we operate. The financialcondition and results of operations of our foreign operating subsidiaries are reported in the relevant localcurrency and then translated to U.S. Dollars at the applicable currency exchange rate for inclusion in ourconsolidated financial statements. Changes in exchange rates between these foreign currencies and theU.S. Dollar will affect the recorded levels of our assets and liabilities as foreign assets and liabilities aretranslated into U.S. Dollars for presentation in our financial statements, as well as our net sales, cost ofgoods sold, and operating margins. The primary foreign currencies in which we have exchange ratefluctuation exposure are the European Union Euro, British Pound Sterling, Japanese Yen, and CanadianDollar. Exchange rates between these currencies and U.S. Dollars have fluctuated significantly in recentyears and may do so in the future.
• Our failure to protect our intellectual property rights could adversely affect our futureperformance and growth.
Protection of our proprietary processes, methods, compounds, and other technologies is important to ourbusiness. We depend upon our ability to develop and protect our intellectual property rights to distinguishour products from those of our competitors. Failure to protect our existing intellectual property rights mayresult in the loss of valuable technologies or having to pay other companies for infringing on theirintellectual property rights. We rely on a combination of patent, trade secret, trademark, and copyright law,as well as judicial enforcement, to protect such technologies. We currently own approximately 1,600 issuedU.S. and foreign patents, with a significant number of additional patents pending. Some of these patents arelicensed to others. In addition, we have acquired the rights under patents and inventions of others throughlicenses or otherwise. We have developed and may in the future develop technologies with universities orother academic institutions, or with the use of government funding. In such cases, the academic institution orthe government may retain certain rights to the developed intellectual property. We also own approximately500 trademark and service mark registrations throughout the world for our marks, including AftonChemical®, Ethyl®, HiTEC®, GREENBURN® and MMT®, as well as pending trademark and service markapplications, including BioTEC™, TecGARD™ and NewMarketSM. In the event that we are unable tocontinue using certain of our marks, we may be forced to rebrand our products, which could result in theloss of brand recognition, and could require us to devote resources to advertise and market brands. Inparticular, the loss of our HiTEC® mark would have a material adverse effect on our business.
We cannot assure you that the measures taken by us to protect these assets and rights will providemeaningful protection for our trade secrets or proprietary manufacturing expertise or that adequateremedies will be available in the event of an unauthorized use or disclosure of our trade secrets ormanufacturing expertise. We cannot assure you that any of our intellectual property rights will not bechallenged, invalidated, circumvented, or rendered unenforceable. Furthermore, we cannot assure youthat any pending patent application filed by us will result in an issued patent, or if patents are issued to us,that those patents will provide meaningful protection against competitors or against competitivetechnologies. The failure of our patents or other measures to protect our processes, apparatuses,technology, trade secrets and proprietary manufacturing expertise, methods, and compounds could havean adverse effect on our results of operations, financial condition, and cash flow.
We could face patent infringement claims from our competitors or others alleging that our processes orproducts infringe on their proprietary technologies. If we are found to be infringing on the proprietarytechnology of others, we may be liable for damages, and we may be required to change our processes, toredesign our products partially or completely, to pay to use the technology of others or to stop using certaintechnologies or producing the infringing product entirely. Even if we ultimately prevail in an infringementsuit, the existence of the suit could prompt customers to switch to products that are not the subject ofinfringement suits. We may not prevail in any intellectual property litigation and such litigation may resultin significant legal costs or otherwise impede our ability to produce and distribute key products.
16

• Our business is subject to government regulation, and could be adversely affected by futuregovernmental regulation.
We are subject to regulation by local, state, federal, and foreign governmental authorities. In somecircumstances, before we may sell certain products, these authorities must approve these products, ourmanufacturing processes, and facilities. We are also subject to ongoing reviews of our products,manufacturing processes, and facilities by governmental authorities.
In order to obtain regulatory approval of certain new products, we must, among other things, demonstrateto the relevant authority that the product is safe and effective for its intended uses and that we are capableof manufacturing the product in accordance with current regulations. The process of seeking approvalscan be costly, time consuming, and subject to unanticipated and significant delays. There can be noassurance that approvals will be granted to us on a timely basis, or at all. Any delay in obtaining, or anyfailure to obtain or maintain, these approvals would adversely affect our ability to introduce new productsand to generate net sales from those products.
New laws and regulations may be introduced in the future that could result in additional compliance costs,seizures, confiscation, recall, or monetary fines, any of which could prevent or inhibit the development,distribution, and sale of our products. If we fail to comply with applicable laws and regulations, we maybe subject to civil remedies, including fines, injunctions, and recalls or seizures, any of which could havean adverse effect on our results of operations, financial condition, and cash flow.
Our business and our customers will be subject to significant new regulations under the EuropeanCommission’s Registration, Evaluation and Authorization of Chemicals (REACH) regulation. REACHwill enter into force on June 1, 2007. It imposes obligations on European Union manufacturers andimporters of chemicals and other products into the European Union to compile and file comprehensivereports, including testing data, on each chemical substance, perform chemical safety assessments, andobtain pre-market authorization with respect to certain substances of particularly high concern. The newregulation imposes significant additional burdens on chemical producers and importers, and, to a lesserextent, downstream users of chemical substances and preparations. Our manufacturing presence and salesactivities in the European Union will likely require us to incur significant additional compliance costs.
• Political, economic, and regulatory factors concerning one of our products, MMT, could adverselyaffect our sales of MMT.
The EPA studied MMT and determined that it does not cause or contribute to the failure of vehicleemission systems. The Canadian government has made similar findings. However, the EPA is requiringadditional testing to fill some data gaps, including potential risks to public health, and a change in currentdeterminations could have a material adverse effect on our results of operations. In addition, certainindustry groups are urging greater regulation of all metal-based gasoline additives, including MMT. In2002, the Alliance of Automobile Manufacturers (AAM) issued a fleet test report on MMT based on testsconducted by the AAM, the Association of International Automobile Manufacturers, and the CanadianVehicle Manufacturers’ Association. The report alleges that MMT significantly raises vehicle emissions,increases fuel emissions, increases fuel consumption, and impairs the proper operation of vehicleemission control systems. In December 2003, the government of Canada released its “ProposedFramework for an Independent Third-Party Review of New Information on the Effects of MMT onVehicle Emissions.” In its proposal, the Canadian government provided no timetable for thecommencement or completion of the review. Substantially all of our customers in Canada have suspendedthe use of MMT, pending the results of the government of Canada-sponsored independent third-partyreview. To date, the government of Canada has not initiated the review. We expect that the EuropeanUnion will also review all metal-based petroleum additives, including MMT, for their impact on pollutionabatement technology. Increased government regulation of MMT if it occurs or additional studiesevaluating MMT, even if government regulation does not occur, could have a material adverse effect onour sales of that product.
17

• Legal proceedings and other claims could impose substantial costs on us.
We are involved in numerous administrative and legal proceedings that result from, and are incidental to,the conduct of our business. From time to time, these proceedings involve environmental, productliability, TEL, premises asbestos liability, and other matters. See Item 3, “Legal Proceedings.” We haveinsurance coverage that we believe would be available to mitigate potential damages in many of theseproceedings. However, there is no assurance that our available insurance will cover these claims, that ourinsurers will not challenge coverage for certain claims, or that final damage awards will not exceed ouravailable insurance coverage. Any of the foregoing could have a material adverse effect on our results ofoperations, financial condition, and cash flows in any given period.
• Environmental matters could have a substantial negative impact on our results of operations.
As a manufacturer and distributor of chemical products, we are generally subject to extensive local, state,federal, and foreign environmental, safety, and health laws and regulations concerning, among otherthings, emissions to the air, discharges to land and water, the generation, handling, treatment, anddisposal of hazardous waste and other materials, and remediation of contaminated soil, surface, andground water. Our operations entail the risk of violations of those laws and regulations, many of whichprovide for substantial fines and criminal sanctions for violations. We believe our operations are currentlyin substantial compliance with these laws and regulations in all material respects. However, we cannotassure you that we have been or will be at all times in compliance with all of these requirements.
In addition, these requirements, and the enforcement or interpretation of these requirements, may becomemore stringent in the future. Although we cannot predict the ultimate cost of compliance with any suchrequirements, the costs could be material. Non-compliance could subject us to material liabilities, such asgovernment fines, damages arising from third-party lawsuits, or the suspension and potential cessation ofnon-compliant operations. We may also be required to make significant site or operational modificationsat substantial cost. Future developments could also restrict or eliminate the use of or require us to makemodifications to our products, which could have an adverse effect on our results of operations, financialcondition, and cash flows in any given period.
At any given time, we are involved in claims, litigation, administrative proceedings, and investigations ofvarious types in a number of jurisdictions involving potential environmental liabilities, including clean-upcosts associated with waste disposal sites, natural resource damages, property damage, and personalinjury. We cannot assure you that the resolution of these environmental matters will not have an adverseeffect on our results of operations, financial condition, and cash flows in any given period.
There may be environmental problems associated with our properties of which we are unaware. Some ofour properties contain, or may have contained in the past, on-site facilities or underground tanks for thestorage of chemicals, hazardous materials, and waste products that could create a potential for release ofhazardous substances or contamination of the environment. The discovery of environmental liabilitiesattached to our properties could have a material adverse effect on our results of operations, financialcondition, and cash flow.
We may also face liability arising from current or future claims alleging personal injury, product liability,property damage due to exposure to chemicals or other hazardous substances, such as premises asbestos,at or from our facilities. We may also face liability for personal injury, product liability, property damage,natural resource damage, or clean-up costs for the alleged migration of contaminants or hazardoussubstances from our facilities or for future accidents or spills. A significant increase in the number orsuccess of these claims could adversely affect our financial condition, results of operations, and cashflow. For further discussion of some related claims, see Item 1, “Business—Environmental.”
The ultimate costs and timing of environmental liabilities are difficult to predict. Liability underenvironmental laws relating to contaminated sites can be imposed retroactively and on a joint and severalbasis. A liable party could be held responsible for all costs at a site, whether currently or formerly owned
18

or operated regardless of fault, knowledge, timing of the contamination, cause of the contamination,percentage of contribution to the contamination, or the legality of the original disposal. We could incursignificant costs, including clean-up costs, natural resource damages, civil or criminal fines and sanctions,and third-party claims, as a result of past or future violations of, or liabilities under, environmental laws.
• We have been identified, and in the future may be identified, as a PRP in connection with state andfederal laws regarding environmental clean-up projects.
We are subject to the federal Superfund law and similar state laws under which we may be designated asa PRP. As a PRP, we may be liable for a share of the costs associated with cleaning up hazardous wastesites, such as a landfill to which we may have sent waste.
In de minimis PRP matters and in some minor PRP matters, we generally negotiate a consent decree topay an apportioned settlement. This relieves us of any further liability as a PRP, except for remotecontingencies. Settlement costs for a de minimis participant are less than $50,000. Settlement costs for aminor participant are less than $300,000.
We are also a PRP at Superfund sites where our liability may be in excess of de minimis or minor PRPlevels. Most Superfund sites where we are a PRP represent environmental issues that are quite mature.The sites have been investigated, and in many cases, the remediation methodology, as well as theproportionate shares of each PRP have been established. Other sites are not as mature, which makes itmore difficult to reasonably estimate our share of future clean-up or remediation costs. Generally,remediation and monitoring will go on for an extended period. As a result, we may incur substantialexpenses for all these sites over a number of years, a portion of which may be covered by insurance.
• Our financial results will vary according to the timing of customer orders and other externalfactors, which reduces your ability to gauge our performance.
External factors beyond our control, such as customer orders, product shipment dates, and other factorscan cause shifts in net sales and income from quarter to quarter. These external factors can magnify theimpact of industry cycles. As a result, our income and cash flow may fluctuate significantly on aquarter-to-quarter basis, and your ability to gauge trends in our business may be impaired.
• Restrictive covenants in our debt instruments may adversely affect our business.
Our senior credit agreement and senior notes contain restrictive covenants. These covenants mayconstrain our activities and limit our operational and financial flexibility. The failure to comply with thesecovenants could result in an event of default, which, if not cured or waived, could have a material adverseeffect on our business, financial condition, and results of operations.
• Our business is subject to hazards common to chemical businesses, any of which could interruptour production or our transportation systems and adversely affect our results of operations.
Our business is subject to hazards common to chemical manufacturing, storage, handling, andtransportation, including explosions, fires, inclement weather, natural disasters, mechanical failure,unscheduled downtime, transportation interruptions, remediation, chemical spills, discharges or releasesof toxic or hazardous substances or gases, and other risks. These hazards can cause personal injury andloss of life, severe damage to, or destruction of, property and equipment, and environmentalcontamination. In addition, the occurrence of material operating problems at our facilities due to any ofthese hazards may diminish our ability to meet our output goals. Accordingly, these hazards and theirconsequences could have a material adverse effect on our operations as a whole, including our results ofoperations, and cash flows, both during and after the period of operational difficulties.
19

• We could be required to make additional contributions to our pension funds, which may beunderfunded due to past and any future under performance of the equities markets.
Our pension plan asset allocation is predominantly weighted towards equities. Cash contributionrequirements to our pension plans are sensitive to changes in our plans’ actual return on assets.Reductions in our plans’ expected return on assets due to poor performance of the equities markets couldcause our pension plans to be underfunded and require us to make additional cash contributions.
• The insurance that we maintain may not fully cover all potential exposures.
We maintain property, business interruption, and casualty insurance, but such insurance may not cover allrisks associated with the hazards of our business and is subject to limitations, including deductibles andmaximum liabilities covered. We may incur losses beyond the limits, or outside the coverage, of ourinsurance policies, including liabilities for environmental remediation. In the future, we may not be able toobtain coverage at current levels, and our premiums may increase significantly on coverage that we maintain.
• The occurrence or threat of extraordinary events, including natural disasters and domestic andinternational terrorist attacks may disrupt our operations and decrease demand for our products.
Chemical-related assets may be at greater risk of future terrorist attacks than other possible targets in theUnited States and throughout the world. Federal legislation is under consideration that could imposesignificant new site security requirements specifically on chemical manufacturing facilities that mayincrease our overhead expenses. Federal regulations have already been adopted to increase the security ofthe transportation of hazardous chemicals in the United States.
The occurrence of extraordinary events, including future terrorist attacks and the outbreak or escalation ofhostilities, cannot be predicted, and their occurrence can be expected to continue to affect negatively theeconomy in general, and specifically the markets for our products. The resulting damage from a directattack on our assets or assets used by us could include loss of life and property damage. In addition,available insurance coverage may not be sufficient to cover all of the damage incurred or, if available,may be prohibitively expensive.
ITEM 1B. UNRESOLVED STAFF COMMENTS
None.
ITEM 2. PROPERTIES
Our principal operating properties are shown below. Unless indicated, we own the research, development, andtesting facilities and manufacturing properties, which primarily support the petroleum additives business segment.
Research, Development, and Testing Richmond, VirginiaBracknell, England (leased)Tsukuba, Japan (leased)Ashland, Virginia (leased)
Manufacturing and Distribution Feluy, Belgium (lubricant additives)Houston, Texas (lubricant and fuel additives; also TEL storageand distribution)Orangeburg, South Carolina (fuel additives)Port Arthur, Texas (lubricant additives)Rio de Janeiro, Brazil (petroleum additives storage anddistribution; leased)Sarnia, Ontario, Canada (fuel additives)Sauget, Illinois (lubricant and fuel additives)
20

We own our corporate headquarters located in Richmond, Virginia, and generally lease our regional andsales offices located in a number of areas worldwide.
We own approximately 42 acres of real estate available for development in downtown Richmond, Virginia,adjacent to our principal executive offices. In January 2007, Foundry Park I, a wholly-owned subsidiary ofNewMarket Development, entered into a Deed of Lease Agreement with MeadWestvaco under which it willlease an office building which we will construct on approximately three acres.
Production Capacity
We believe our plants and supply agreements are sufficient to meet expected sales levels. Operating rates ofthe plants vary with product mix and normal sales swings. We believe that our facilities are well maintained andin good operating condition.
ITEM 3. LEGAL PROCEEDINGS
We are involved in legal proceedings that are incidental to our business and include administrative orjudicial actions seeking remediation under environmental laws, such as Superfund. Some of these legalproceedings relate to environmental matters and involve governmental authorities. For further information see“Environmental” in Part I, Item 1.
While it is not possible to predict or determine with certainty the outcome of any legal proceeding, webelieve the outcome of any of these proceedings, or all of them combined, will not result in a material adverseeffect on our financial condition or results of operations.
Innospec Inc.
On August 16, 2006, Ethyl filed a request for arbitration against a subsidiary of Innospec. This arbitration isrelated to a long-standing supply agreement that requires the Innospec subsidiary to supply Ethyl with TEL forresale by Ethyl in the United States (the U.S. Supply Agreement). The request was filed pursuant to the rules ofthe London Court of International Arbitration. Ethyl filed this request because it believes that Innospec hasviolated the U.S. Supply Agreement by attempting to increase the price it charges Ethyl for TEL in the UnitedStates in a manner not in accordance with the contract. As such, we have not recorded an accrual of these costs.The difference in prices that Innospec is claiming is approximately $1.7 million for product supplied throughSeptember 30, 2006 and would amount to approximately an additional $1 million if the same factors wereapplied to TEL supplied in the fourth quarter 2006. We have placed $1.7 million for product supplied throughSeptember 30, 2006 in an escrow account pending resolution of the arbitration. We are confident in our positionand believe we will prevail. Regardless of the outcome, we do not believe the TEL dispute will have a materialeffect on our financial condition, results of operations, or cash flows. However, with TEL segment operatingprofit at such a low level, a relatively small increase in cost may be material to TEL segment results.
After the commencement of the above arbitration, Ethyl received three requests for arbitration filed by threesubsidiaries of Innospec. The Innospec requests were filed on October 2, 2006, pursuant to the rules of theLondon Court of International Arbitration and allegedly pursuant to long-standing marketing and supplyagreements between Ethyl or its subsidiaries and subsidiaries of Innospec for the sale of TEL outside of theUnited States. Innospec is claiming the right to terminate the agreements and is seeking damages. Although thesemarketing and supply agreements relate only to TEL, Innospec contends that the agreements impose certainduties that were breached by the sales and marketing of MMT in Iraq and South Africa by affiliates of Ethyl.Ethyl will vigorously defend the cases and believes it will ultimately prevail in these arbitrations. Therefore, noaccrual has been recorded.
21

Infineum International Ltd. and Infineum USA L.P.
In December 2005, Afton was sued by a competitor, Infineum International Ltd. and Infineum USA L.P.,(Infineum) in federal court in Delaware. The suit alleged patent infringement of one patent in connection withsome lubricant additive packages. Infineum and Afton have entered into an agreement to resolve Infineum’sclaims against Afton’s products and to effect settlement of the patent infringement suit. The lawsuit has beendismissed.
TEL
Legal proceedings include certain product liability cases. The only product liability cases of potentialconsequence in which we are involved are TEL-related. In one case, Ethyl was served as a defendant in a casefiled in the Circuit Court for Baltimore City, Maryland, in September 1999. The plaintiffs in Smith, et al. v. LeadIndustries Association, Inc., et al., alleged personal injuries for seven children from lead exposure arising fromlead paint and dust from tailpipe emissions due to leaded gasoline. The court dismissed Ethyl and some otherdefendants from the case in February 2002 and granted summary judgment to other defendants in November2002. However, a series of appellate and trial court decisions have the effect that an appeal remains pendingagainst other defendants. It is our current belief that these proceedings will not have a material impact on ourconsolidated financial condition or result of operations.
Asbestos
Like many other companies, we are also a defendant in personal injury lawsuits involving exposure toasbestos. These cases involve exposure to asbestos in premises owned or operated, or formerly owned oroperated, by subsidiaries of NewMarket. We have never manufactured, sold, or distributed products that containasbestos. Nearly all of these cases are pending in Texas, Louisiana, or Illinois and involve multipledefendants. We maintain an accrual for these proceedings, as well as a receivable for expected insurancerecoveries.
During 2005, we entered into an agreement with Travelers Indemnity Company (Travelers) resolvingcertain long-standing issues regarding our coverage for certain premises asbestos claims. In addition, ouragreement with Travelers provides a procedure for allocating defense and indemnity costs with respect to certainfuture premises asbestos claims. The lawsuit we had previously filed against Travelers in the Southern District ofTexas was dismissed. We also settled our outstanding receivable from Albemarle for certain premises asbestosliability obligations.
The accrual for our premises asbestos liability related to currently asserted claims is based on the followingassumptions and factors:
• We are often one of many defendants. This factor influences both the number of claims settled against usand also the indemnity cost associated with such resolutions.
• The estimated percent of claimants in each case that will actually, after discovery, make a claim againstus, out of the total number of claimants in a case, is based on a level consistent with past experience andcurrent trends.
• We utilize average comparable plaintiff cost history as the basis for estimating pending premises asbestosrelated claims. These claims are filed by both former contractors’ employees, and former employees whoworked at past and present company locations. We also include an estimated inflation factor in thecalculation.
• No estimate is made for unasserted claims.
• The estimated recoveries from insurance and Albemarle for these cases are based on, and are consistentwith, the 2005 settlement agreements.
22

Based on the above assumptions, we have provided an undiscounted liability related to premises asbestosclaims of $12 million at year-end 2006 and $10 million at year-end 2005. The liabilities related to asbestosclaims are included in accrued expenses (current portion) and other noncurrent liabilities on the balancesheet. Certain of these costs are recovered through our insurance coverage and agreement with Albemarle. Thereceivable for these recoveries related to premises asbestos liabilities was $9 million at December 31, 2006 and$8 million at December 31, 2005. These receivables are included in trade and other accounts receivable for thecurrent portion. The noncurrent portion is included in other assets.
ITEM 4. SUBMISSION OF MATTERS TO A VOTE OF SECURITY HOLDERS
There were no issues submitted to a vote of security holders during the fourth quarter of 2006.
23

PART II
ITEM 5. MARKET FOR REGISTRANT’S COMMON EQUITY, RELATED STOCKHOLDERMATTERS AND ISSUER PURCHASES OF EQUITY SECURITIES
Our common stock, with no par value, has traded on the New York Stock Exchange (NYSE) under thesymbol “NEU” since June 21, 2004 when we became the parent holding company of Ethyl and its subsidiaries.
There were 17,289,860 shares of our common stock outstanding as of December 31, 2006. We had 3,627shareholders of record at December 31, 2006.
On December 16, 2005, our Board of Directors approved a share repurchase program that authorizesmanagement to repurchase up to $50 million of our outstanding common stock until December 31, 2007, asmarket conditions warrant and covenants under our existing agreements permit. We may conduct our sharerepurchases in the open-market and in privately negotiated transactions. The repurchase program does not requireus to acquire any specific number of shares and may be terminated at any time. No shares were repurchasedduring 2006 or 2005 under this program.
Cash dividends declared for 2006 on our common stock totaled 50 cents per share including: a dividend of12.5 cents per share declared on February 23, 2006 and paid April 3, 2006; a dividend of 12.5 cents per sharedeclared on April 27, 2006 and paid on July 3, 2006; a dividend of 12.5 cents per share declared on July 20, 2006and paid on October 2, 2006; and a dividend of 12.5 cents per share declared on October 24, 2006 and paid onJanuary 2, 2007.
On February 22, 2007, our Board of Directors declared a quarterly dividend of 12.5 cents per share on ourcommon stock. The dividend is payable April 1, 2007 to shareholders of record on March 15, 2007.
The declaration and payment of dividends is subject to the discretion of our Board of Directors. Futuredividends will depend on various factors, including our financial condition, earnings, cash requirements, legalrequirements, restrictions in agreements governing our outstanding indebtedness, and other factors deemedrelevant by our Board of Directors. For a discussion of the restrictions on our ability to declare and paydividends, see Note 12 of the Notes to Consolidated Financial Statements.
The following table shows the high and low prices of our common stock on the NYSE for each of the lasteight quarters.
2006
First Quarter Second Quarter Third Quarter Fourth Quarter
High . . . . . . . . . . . . . . . . . . . . . . . . . . . . . . . . . . . . . . $48.29 $62.80 $67.34 $70.00Low . . . . . . . . . . . . . . . . . . . . . . . . . . . . . . . . . . . . . . $23.55 $37.65 $43.15 $52.12
2005
First Quarter Second Quarter Third Quarter Fourth Quarter
High . . . . . . . . . . . . . . . . . . . . . . . . . . . . . . . . . . . . . . $20.55 $18.80 $17.90 $25.26Low . . . . . . . . . . . . . . . . . . . . . . . . . . . . . . . . . . . . . . $17.50 $12.95 $14.75 $14.38
The performance graph showing the five-year cumulative total return on our common stock as compared toLubrizol, specialty chemical companies, and the S&P 500 is shown below. The graph assumes $100 invested onthe last day of December 2001. Dividends are assumed to be reinvested quarterly.
24

PERFORMANCE GRAPHComparison of Five-Year Cumulative Total Return
Performance through December 31, 2006
$1,400
2001 2002 2003 2004 2005 2006
$0
NewMarket Corporation The Lubrizol Corporation Specialty Chemicals S&P 500
$200
$400
$600
$800
$1,000
$1,200
25

ITEM 6. SELECTED FINANCIAL DATA
NewMarket Corporation & Subsidiaries
Five Year Summary
Years Ended December 31
2006 2005 2004 2003 2002
(in thousands except per-share amounts)Results of OperationsNet sales . . . . . . . . . . . . . . . . . . . . . . . . . . . . . . . . . . . . . . . . . . . . $1,263,297 $1,075,544 $894,109 $756,341 $656,350Costs and expenses . . . . . . . . . . . . . . . . . . . . . . . . . . . . . . . . . . . 1,178,665 1,037,490 878,020 736,385 642,716Operating profit from TEL marketing agreements services . . . . 8,181 23,154 33,226 29,603 25,756Special item income, net (1) (2) (3) . . . . . . . . . . . . . . . . . . . . . . . 14,825 11,668 13,245 — —
Operating profit . . . . . . . . . . . . . . . . . . . . . . . . . . . . . . . . . . . . 107,638 72,876 62,560 49,559 39,390Interest and financing expenses . . . . . . . . . . . . . . . . . . . . . . . . . . 15,403 16,849 18,254 21,128 25,574Loss on early extinguishment of debt (4) . . . . . . . . . . . . . . . . . . 11,209 — — — —Other income (expense), net (5) . . . . . . . . . . . . . . . . . . . . . . . . . 7,117 925 324 911 (547)
Income before income taxes . . . . . . . . . . . . . . . . . . . . . . . . . . . . 88,143 56,952 44,630 29,342 13,269Income tax expense (6) . . . . . . . . . . . . . . . . . . . . . . . . . . . . . . . . 30,621 14,571 11,572 8,718 3,756
Net income from continuing operations . . . . . . . . . . . . . . . . . . . 57,522 42,381 33,058 20,624 9,513Income from operations of discontinued business
(net of tax) (7) . . . . . . . . . . . . . . . . . . . . . . . . . . . . . . . . . . . . . — — — 14,805 2,901
Income before cumulative effect of accounting changes . . . . . . . 57,522 42,381 33,058 35,429 12,414Cumulative effect of accounting changes (net of tax) (8) . . . . . . — — — 1,624 (2,505)
Net income . . . . . . . . . . . . . . . . . . . . . . . . . . . . . . . . . . . . . . . . . . $ 57,522 $ 42,381 $ 33,058 $ 37,053 $ 9,909
Financial Position and Other DataTotal assets . . . . . . . . . . . . . . . . . . . . . . . . . . . . . . . . . . . . . . . . . . $ 744,793 $ 701,532 $676,195 $649,748 $656,261Operations:
Working capital . . . . . . . . . . . . . . . . . . . . . . . . . . . . . . . . . . . . $ 301,777 $ 244,912 $220,072 $184,174 $143,216Current ratio . . . . . . . . . . . . . . . . . . . . . . . . . . . . . . . . . . . . . . . 2.88 to 1 2.47 to 1 2.57 to 1 2.47 to 1 2.10 to 1Depreciation and amortization . . . . . . . . . . . . . . . . . . . . . . . . . $ 31,592 $ 36,396 $ 44,775 $ 50,391 $ 52,422Capital expenditures . . . . . . . . . . . . . . . . . . . . . . . . . . . . . . . . $ 26,161 $ 17,830 $ 14,650 $ 11,617 $ 12,671Gross profit as a % of net sales . . . . . . . . . . . . . . . . . . . . . . . . 20.9 18.6 19.9 21.9 21.1Research, development, and testing expenses (9) . . . . . . . . . . $ 70,263 $ 65,394 $ 65,356 $ 57,865 $ 51,069
Total debt . . . . . . . . . . . . . . . . . . . . . . . . . . . . . . . . . . . . . . . . . . . $ 153,439 $ 153,829 $184,438 $208,817 $290,067Common and other shareholders’ equity . . . . . . . . . . . . . . . . . . . $ 301,402 $ 266,060 $231,882 $199,683 $153,078Total debt as a % of total capitalization (debt plus equity) . . . . . 33.7 36.6 44.3 51.1 65.5Net income as a % of average shareholders’ equity . . . . . . . . . . 20.3 17.0 15.3 21.0 6.6
Common StockBasic earnings per share:
Earnings from continuing operations . . . . . . . . . . . . . . . . . . . . $ 3.34 $ 2.49 $ 1.95 $ 1.23 $ .57Earnings from operations of discontinued business
(net of tax) (7) . . . . . . . . . . . . . . . . . . . . . . . . . . . . . . . . . . . — — — .88 .17Cumulative effect of accounting changes (net of tax) (8) . . . . — — — .10 (.15)
Net income . . . . . . . . . . . . . . . . . . . . . . . . . . . . . . . . . . . . . . . . . . $ 3.34 $ 2.49 $ 1.95 $ 2.21 $ .59
Diluted earnings per share:Earnings from continuing operations . . . . . . . . . . . . . . . . . . . . $ 3.30 $ 2.45 $ 1.92 $ 1.22 $ .57Earnings from operations of discontinued business
(net of tax) (7) . . . . . . . . . . . . . . . . . . . . . . . . . . . . . . . . . . . — — — .88 .17Cumulative effect of accounting changes (net of tax) (8) . . . . — — — .09 (.15)
Net income . . . . . . . . . . . . . . . . . . . . . . . . . . . . . . . . . . . . . . . . . . $ 3.30 $ 2.45 $ 1.92 $ 2.19 $ .59
Shares used to compute basic earnings per share . . . . . . . . . . . . 17,223 17,028 16,916 16,733 16,689Shares used to compute diluted earnings per share . . . . . . . . . . . 17,407 17,320 17,199 16,940 16,732Equity per share . . . . . . . . . . . . . . . . . . . . . . . . . . . . . . . . . . . . . . $ 17.43 $ 15.58 $ 13.66 $ 11.90 $ 9.17Cash dividends declared per share . . . . . . . . . . . . . . . . . . . . . . . . $ .50 $ — $ — $ — $ —
26

Notes to the Five Year Summary
(1) Special item income was $14.8 million in 2006 and included a $5.3 million gain related to an earn-outagreement for certain pharmaceutical intellectual property that we sold in 1994; a $3.3 million gainassociated with a legal settlement related to transportation charges; a $5.5 million gain resulting from a classaction lawsuit related to raw materials; a $2.5 million loss related to a legal settlement; and a $3.3 milliongain on the sale of property.
(2) Special item income was $12 million in 2005 and included an aggregate $8 million gain on the sales ofcorporate property and a $4 million gain on an insurance settlement related to our premises asbestosliabilities.
(3) The special item in 2004 was $13 million income and represents the gain on the environmental insurancesettlement.
(4) In December 2006, we purchased $149.75 million of the outstanding $150 million aggregate principalamount of our 8.875% senior notes due 2010 in a tender offer. As a result of the transaction, we recognizeda loss of $11 million on the early extinguishment of debt. This loss included the write-off of unamortizeddeferred financing costs of $2.6 million and cash paid of $8.6 million related to the premium and other costsof the purchase of the senior notes. Subsequently in December 2006, we issued $150 million aggregateprincipal amount of our 7.125% senior notes due in 2016.
(5) Other income (expense), net in 2006 includes a gain of $4 million for interest on an income tax settlement,as well as $2 million investment income.
Other income (expense), net in 2003 includes a $1 million refund from an insurance company related toemployee benefit policies.
Other income (expense), net in 2002 includes a loss on impairment of nonoperating assets of $4 million, aswell as expenses related to debt refinancing activities of $1 million. In addition, 2002 reflects $1 millioninterest income from a settlement with the Internal Revenue Service (IRS), as well as $2.4 million forinterest income from a lawsuit settlement.
(6) Income tax expense in 2005 and 2004 includes a favorable impact of approximately $1 million from thesettlement of certain tax years with the IRS.
(7) Discontinued operations reflect the phenolic antioxidant business, which was sold in January 2003. The2003 amount is the gain on the disposal of this business of $23.2 million ($14.8 million after tax). Prior yearamounts represent the after-tax earnings of this business.
(8) The cumulative effect of accounting change for 2003 reflects the gain of $2.5 million ($1.6 million after tax)recognized upon adoption of SFAS No. 143 on January 1, 2003. The 2002 amount reflects the impairment ofgoodwill of $3.1 million ($2.5 million after tax) resulting from the January 1, 2002 adoption of SFAS No. 142.
(9) Of the total research, development, and testing expenses, the portion related to new products and processeswas $37 million in 2006, $34 million in 2005, $33 million in 2004, $28 million in 2003, and $30 million in2002.
27

ITEM 7. MANAGEMENT’S DISCUSSION AND ANALYSIS OF FINANCIAL CONDITION ANDRESULTS OF OPERATION
Forward-Looking Statements
The following discussion contains forward-looking statements about future events and expectations withinthe meaning of the Private Securities Litigation Reform Act of 1995. We have based these forward-lookingstatements on our current expectations and projections about future results. When we use words in this document,such as “anticipates,” “intends,” “plans,” “believes,” “estimates,” “expects,” and similar expressions, we do so toidentify forward-looking statements. Examples of forward-looking statements include statements we makeregarding future prospects of growth in the petroleum additives market, the level of future declines in the marketfor TEL, our ability to maintain or increase our market share, and our future capital expenditure levels.
We believe our forward-looking statements are based on reasonable expectations and assumptions, withinthe bounds of what we know about our business and operations. However, we offer no assurance that actualresults will not differ materially from our expectations due to uncertainties and factors that are difficult to predictand beyond our control.
These factors include, but are not limited to, timing of sales orders, gain or loss of significant customers,competition from other manufacturers, resolution of environmental liabilities, changes in the demand for ourproducts, significant changes in new product introduction, increases in product cost, the impact of fluctuations inforeign exchange rates on reported results of operations, changes in various markets, geopolitical risks in certainof the countries in which we conduct business, and the impact of consolidation of the petroleum additivesindustry. In addition, certain risk factors are also discussed in Item 1A, “Risk Factors.”
You should keep in mind that any forward-looking statement made by us in this discussion or elsewherespeaks only as of the date on which we make it. New risks and uncertainties arise from time to time, and it isimpossible for us to predict these events or how they may affect us. We have no duty to, and do not intend to,update or revise the forward-looking statements in this discussion after the date hereof, except as may be requiredby law. In light of these risks and uncertainties, you should keep in mind that any forward-looking statementmade in this discussion, or elsewhere, might not occur.
OVERVIEW
The 2006 year reflected increases in net sales, as well as operating profit, across both lubricant additives andfuel additives as compared to 2005 and 2004. We supply our customers with a diverse portfolio of products tomeet their business needs and we believe this is reflected in our results. While the petroleum additives industryexperienced escalating raw material costs in 2006, we were generally able to recover these costs throughimproved pricing and the introduction of more cost-effective products. Our production facilities are operating athigh levels and we are selling a product mix with higher margins. As expected, the TEL market continues todecline and segment operating results are lower than last year.
Our balance sheet remains strong at year-end 2006. Our investment in working capital has increased overDecember 31, 2005 levels in support of our business. We continue to have no outstanding bank debt. In late2006, we completed the refinancing of both our 8.875% senior notes due 2010 and senior credit facility,providing us with more favorable terms and greater flexibility as we look to the future.
RESULTS OF OPERATIONS
Net Sales
Continuing the trend from the last two years, 2006 net sales increased in essentially all areas of thepetroleum additives segment. In addition, total consolidated net sales were higher in 2006 than in either 2005 or2004. When comparing 2006 with 2005, net sales increased 17%. The increase between 2005 and 2004 was 20%.
28

In 2006, 2005, and 2004, net sales to two customers of our petroleum additives segment exceeded 10% oftotal net sales. Sales to BP amounted to $127 million (10% of net sales) in 2006, $112 million (10% of total netsales) in 2005, and $99 million (11% of total net sales) in 2004. Sales to Shell amounted to $169 million (13% oftotal net sales) in 2006, $143 million (13% of total net sales) in 2005, and $119 million (13% of total net sales) in2004. These net sales represent a wide-range of products sold to these two customers in multiple regions of theworld.
No other single customer accounted for 10% or more of our total net sales in 2006, 2005, or 2004.
The following table shows our net sales by segment for each of the last three years.
Net Sales by Segment
2006 2005 2004
(in millions of dollars)
Petroleum additives . . . . . . . . . . . . . . . . . . . . . . . . . . . . . . . . . . . . . . $1,252 $1,067 $885Tetraethyl lead . . . . . . . . . . . . . . . . . . . . . . . . . . . . . . . . . . . . . . . . . . 11 9 9
Consolidated net sales . . . . . . . . . . . . . . . . . . . . . . . . . . . . . . . . . . . . $1,263 $1,076 $894
Petroleum Additives—Our petroleum additives sales improved over both 2005 and 2004.
When comparing 2006 to 2005, petroleum additives net sales were up $185 million or 17%. The increasewas across both lubricant additives and fuel additives. Increases in selling prices resulted in most of theimprovement in net sales, with changes in the mix of products sold also contributing to the higher net sales. Totalshipments were essentially unchanged comparing 2006 to 2005. The change in net sales between the two yearsalso includes a small unfavorable foreign currency impact.
Petroleum additives net sales for 2005 increased $182 million, or 21%, over 2004 levels. The increase wasacross all product lines. Shipments were approximately 7% higher than in 2004 with the increase predominantlyin the engine oil additives product line. There were smaller increases in industrial additives and fuel additivesproduct lines. Price increases and a favorable foreign currency impact also contributed to the higher net sales.
The approximate components of the petroleum additives increase in net sales of $185 million whencomparing 2006 to 2005 and $182 million when comparing 2005 to 2004 are shown below in millions.
Net sales for year ended December 31, 2004 . . . . . . . . . . . . . . . . . . . . . . . . . . . . . . . . $ 885Increase in shipments and changes in product mix . . . . . . . . . . . . . . . . . . . . . . . . . . . 81Changes in selling prices including foreign currency impact . . . . . . . . . . . . . . . . . . . 101
Net sales for year ended December 31, 2005 . . . . . . . . . . . . . . . . . . . . . . . . . . . . . . . . 1,067Increase in shipments and changes in product mix . . . . . . . . . . . . . . . . . . . . . . . . . . . 45Changes in selling prices including foreign currency impact . . . . . . . . . . . . . . . . . . . 140
Net sales for year ended December 31, 2006 . . . . . . . . . . . . . . . . . . . . . . . . . . . . . . . . $1,252
Tetraethyl Lead—Most of the TEL marketing activity is through the marketing agreements with Innospec,under which we do not record the sales transactions. Therefore, the TEL net sales shown above are those madeby our wholly-owned subsidiary, Ethyl, in areas not covered by the Innospec marketing agreements. The salesmade in areas not covered by the marketing agreements are minor compared to the TEL sales made through theInnospec marketing agreements. See Note 3 of the Notes to Consolidated Financial Statements.
TEL net sales in areas not covered by the Innospec marketing agreements were up slightly in 2006 over2005 and 2004. This increase primarily represents price increases in 2006.
29

Segment Operating Profit
NewMarket evaluates the performance of Afton’s petroleum additives business and Ethyl’s TEL businessbased on segment operating profit. NewMarket Services departments and other expenses are billed to Afton andEthyl based on the services provided under the holding company structure pursuant to service agreementsbetween NewMarket Services and Afton and NewMarket Services and Ethyl. Depreciation on segment property,plant, and equipment, and amortization of segment intangible assets and the prepayments for services areincluded in the operating profit of each segment.
The table below reports operating profit by segment for the last three years. The “Contract manufacturingand other” classification in the table below primarily represents certain manufacturing operations that Ethylprovides to Afton. Certain prior period amounts have been reclassified to conform to the current presentation.
Segment Operating Profit2006 2005 2004
(in millions of dollars)
Petroleum additives . . . . . . . . . . . . . . . . . . . . . . . . . . . . . . . . . . . . . . . . . . . . . . . . . . . . . . . . . . $104 $60 $42
Tetraethyl lead . . . . . . . . . . . . . . . . . . . . . . . . . . . . . . . . . . . . . . . . . . . . . . . . . . . . . . . . . . . . . . $ 3 $18 $37
Contract manufacturing and other . . . . . . . . . . . . . . . . . . . . . . . . . . . . . . . . . . . . . . . . . . . . . . . $ 4 $ 3 $ 2
Petroleum Additives—Petroleum additives operating profit for 2006 increased $44 million, or 74%, whencompared to the 2005 level of $60 million. Operating profit for 2006 includes a gain of $3 million associatedwith a legal settlement related to transportation charges, as well as a gain of $6 million resulting from a classaction lawsuit related to raw materials and a loss of $5 million from other legal settlements. The increase inoperating profit was in both lubricant and fuel additives reflecting improved net sales and profit margins. Netsales were approximately 17% higher than 2005 reflecting improved pricing and improvements in product mix.
While raw material costs escalated in 2006, we were able to implement certain price increases. These priceincreases have enabled us to restore our margins that have been under pressure since the significant increase inraw material costs began in 2004. Our production facilities are operating at high rates and we are selling moreefficient product formulations. These improved product formulations lower both our cost, as well as ourcustomers’ costs. The 2006 results also include a small, unfavorable foreign currency impact.
Petroleum additives operating profit for 2005 was approximately $60 million, an increase of $18 million, or43%, over 2004. The increases were primarily in the engine oil additives, industrial additives, and certain fueladditives product lines. While net sales of our remaining fuel additives products also increased, higher rawmaterial costs caused operating profit from these products to be considerably lower in 2005 than in 2004.
Overall, the increase in operating profit in 2005 as compared to 2004 resulted from 21% higher net sales and7% higher shipments. The impact of the increases in selling prices that we were able to achieve during the yearsubstantially covered the increases in raw material costs for 2005, with higher shipments accounting for most ofthe improved profitability. Both 2005 and 2004 results include a favorable foreign currency impact, primarilyfrom the European Union Euro. The 2004 results also include a gain of about $1 million from an environmentalinsurance settlement.
Total R&D was $70 million in 2006 and $65 million in both 2005 and 2004. The increase in R&D whencomparing 2006 and 2005 is across all product lines, but mainly in engine oil additives. While our R&Dexpenses were the same in both 2005 and 2004, the projects and product lines that were researched were quitedifferent. This is normal for our business and is a function of industry specifications, customers’ expectations,and competitive forces. There was also a small favorable foreign currency impact in 2006, but a smallunfavorable foreign currency impact in 2005 and 2004. R&D related to new products and processes was $37million in 2006, $34 million in 2005, and $33 million in 2004. All of our R&D expenses were related to thepetroleum additives segment.
30

Selling, general, and administrative expenses (SG&A) in 2006 for this segment were approximately $10million higher than 2005, while 2005 was approximately $3 million higher than 2004. The increase in 2006primarily resulted from higher professional fees and personnel-related expenses. The increases in both 2005 and2004 included the impact of an unfavorable foreign currency effect. As a percentage of net segment sales, SG&Acombined with R&D expenses were 12.7% in 2006, 13.5% in 2005, and 16.0% in 2004. The improvement in thepercentages when comparing each of the years reflects larger increases in net sales as compared to the smallerincreases in SG&A and R&D.
Tetraethyl Lead—Results of our TEL segment include the operating profit contribution from ourmarketing agreements and certain TEL operations not included in the marketing agreements.
The operating profit contribution from our marketing agreements was $8 million in 2006, $23 million in2005, and $33 million in 2004. As expected, volumes shipped declined when comparing both 2006 to 2005 and2005 to 2004. Volumes were 62% lower for 2006 compared to 2005 and 27% lower when comparing 2005 and2004. Pricing did improve when comparing 2006 to 2005 and 2005 to 2004. In addition, amortization of theprepayment for services was approximately $2 million lower in 2006 than in 2005 and $1 million lower in 2005than in 2004, reflecting the declining balance method of amortization. These improvements were not enough tooffset the impact on operating profit from the decrease in shipments. The decrease in volumes shipped primarilyreflects the result of certain of the major TEL customers under the marketing agreement discontinuing use of theproduct, as well as the ongoing decline in the market as other customers discontinue use of the product.
See Note 3 of the Notes to Consolidated Financial Statements for additional information on the TELmarketing agreements. The TEL market will continue to decline as customers discontinue use of the product.
The loss from other TEL operations that was not a part of the marketing agreements was unchanged whencomparing 2006 to 2005 and approximately $9 million unfavorable when comparing 2005 to 2004. The largeprior year variances were primarily due to certain insurance settlements. While there were none during 2006, the2005 results include a special item of $4 million for an insurance settlement gain related to our premises asbestosliabilities. The 2004 results include a special item gain of $12 million from an environmental insurancesettlement.
The 2006 results in other TEL operations include a favorable impact from lower environmental expensescompared to 2005. This favorable impact in 2006 from environmental charges was mostly offset by the favorablepremises asbestos items in 2005. When comparing 2005 and 2004, the 2005 other TEL operations results includelower premises asbestos charges reflecting the favorable impact of a change in expected future insurancereimbursements. The favorable impact from the premises asbestos items in 2005 was partially offset by anincrease in environmental clean-up costs.
The following discussion references certain captions on the Consolidated Statements of Income.
Special Item Income
Special item income was $15 million in 2006 and included a $5.3 million gain related to an earn-outagreement for certain pharmaceutical intellectual property that was sold in 1994; a $3.3 million gain associatedwith a legal settlement related to transportation charges; a $5.5 million gain resulting from a class action lawsuitrelated to raw materials; a $2.5 million loss from a legal settlement; and a $3.3 million gain on the sale ofproperty.
Special item income was $12 million in 2005 and included an aggregate $8 million of gains on the sales ofcorporate property and a $4 million gain on an insurance settlement related to our premises asbestos liabilitiesdiscussed below.
31

During the second quarter 2005, we entered into an agreement with Travelers resolving certain long-standing issues regarding our coverage for certain premises asbestos claims. In addition, our agreement withTravelers provides a procedure for allocating defense and indemnity costs with respect to future premisesasbestos claims. The lawsuit we had previously filed against Travelers in the Southern District of Texas wasdismissed.
In 2005, we also settled our outstanding receivable from Albemarle for premises asbestos liabilityobligations. As a result of the insurance settlement described above, the outstanding amount owed to us byAlbemarle was adjusted to $1.4 million, compared to $4 million at year-end 2004. Albemarle paid us $1.4million in the third quarter of 2005.
The net gain of $4 million in 2005 represents amounts paid to us to settle historical claims in excess of thereceivables we carried on our financial statements from both Travelers and Albemarle in the aggregate. Thisamount is reflected in TEL segment operating profit as discussed above.
Special item income was $13 million in 2004 and represents the gain on an environmental insurancesettlement. The terms of the settlement provide for a total payment of $16 million. In addition to the $8 millionreceived during 2004, we received $4 million in February 2005 and the remaining $4 million in February 2006 inaccordance with a previously agreed-upon payment schedule.
Interest and Financing Expenses
Interest and financing expenses were $15 million in 2006, $17 million in 2005, and $18 million in 2004. Thedecrease resulted primarily from lower debt during 2006 as compared to 2005. We had no drawn bank debt underour revolving credit facility during 2006. Fees and amortization costs were substantially unchanged between thetwo periods excluding the effect of the loss on the early extinguishment of debt.
Lower average debt when comparing 2005 to 2004 resulted in a $1.6 million reduction in interest andfinancing expenses, while higher average interest rates resulted in increased expenses of $800 thousand. Fees andamortization of financing costs were $600 thousand lower for 2005.
Loss on Early Extinguishment of Debt
In December 2006, we purchased $149.75 million of the outstanding $150 million aggregate principalamount of our 8.875% senior notes due 2010 in a tender offer. As a result of the transaction, we recognized a lossof $11 million on the early extinguishment of debt. This loss included the write-off of unamortized deferredfinancing costs of $2.6 million and cash paid of $8.6 million related to the premium and other costs of thepurchase of the 8.875% senior notes.
Other Income, Net
Other income, net was $7 million in 2006, $900 thousand in 2005, and $300 thousand in 2004. The 2006amount included a $4 million gain on interest income from an income tax settlement, as well as $2 millioninvestment income. Both 2005 and 2004 were comprised of a number of small items.
Income Tax Expense
Income tax expense was $31 million in 2006, $15 million in 2005, and $12 million in 2004. The effectivetax rate was 34.7% in 2006, 25.6% in 2005, and 25.9% in 2004. The effective tax rate in each year reflectscertain foreign and other tax benefits.
The increase in income before income taxes from 2005 to 2006 resulted in an increase of $8 million inincome taxes in 2006. The increase in the effective tax rate from 2005 to 2006 also resulted in an increase of
32

$8 million in income taxes in 2006. Part of the rate increase in 2006 relates to the strengthening of foreigncurrencies resulting in a $2.6 million increase in the tax provision on undistributed earnings of foreignsubsidiaries in 2006, while weakening currencies in 2005 resulted in a tax credit of $2.2 million. The 2005 and2004 rates include the favorable impact of approximately $1 million from the settlement of certain open tax yearswith the IRS.
The increase in income before income taxes from 2004 to 2005 resulted in the full $3 million increase intaxes between the two years. The effective tax rate between the two years was essentially unchanged.
To comply with international trade rules, the American Jobs Creation Act of 2004 (the Act), signed into lawon October 22, 2004, repealed the FSC Repeal and Extraterritorial Income Exclusion Act of 2000. The Actrepealed the Extraterritorial Income Exclusion for transactions entered into after December 31, 2004 subject to aphase-out that allowed current beneficiaries to claim benefits in 2005 and 2006. In 2005, the benefit of excluding$6 million from taxable income was 80% of the amount calculated under prior law. In 2006, the benefit ofexcluding approximately $5 million from taxable income was 60% of the amount calculated under prior law. For2007 and beyond, no benefit will be allowed.
Our deferred taxes are in a net asset position. Based on current forecast operating plans, we believe that wewill recover the full benefit of our deferred tax assets. See Note 22 of the Notes to Consolidated FinancialStatements for details on income taxes.
Net Income
Net income was $57.5 million ($3.30 per diluted share) in 2006, $42.4 million ($2.45 per diluted share) in2005, and $33.1 million ($1.92 per diluted share) in 2004.
CASH FLOWS DISCUSSION
We generated cash from operating activities of $37 million in 2006, $64 million in 2005, and $37 million in2004.
During 2006, we realized cash flows of $3 million from the sale of property, as well as $5 million from apayment under an earn-out agreement related to our pharmaceuticals business, which we sold in 1994. Inaddition, we had gross proceeds of $150 million from the issuance of our 7.125% senior notes due 2016. Weused these proceeds, as well as the cash from operations to purchase $149.75 million of our 8.875% senior notesdue 2010, fund capital expenditures of $26 million, acquire an intangible asset for $4 million, pay dividends onour common stock of $9 million, and pay debt issuance costs of $4 million. Our book overdrafts decreased$2 million. These items resulted in an increase of $4 million in cash and cash equivalents. Fluctuations in foreigncurrency rates resulted in a favorable impact of $1 million on cash and cash equivalents throughout 2006.Included in the 2006 cash flows from operating activities were collections of $11 million from settlements,including $4 million related to the 2004 environmental insurance settlement discussed below, as well aspayments of $18 million to fund our pension plans and $9 million for costs related to the early extinguishment ofour 8.875% senior notes. Cash flows from operating activities for 2006 also included an increase in workingcapital requirements, which are discussed more fully under “Working Capital.”
In 2005, we realized $14 million in before-tax proceeds from the sales of corporate assets. We used theseproceeds, as well as the cash flows from operating activities, to fund capital expenditures of $18 million andpay-off our outstanding bank debt of $30 million. Our book overdrafts decreased $1 million. These items resultedin an increase in cash and cash equivalents of $28 million. Cash and cash equivalents throughout 2005 included a$1 million negative impact from foreign currency. Included in the 2005 cash flows from operating activities werecollections of $4 million related to the 2004 environmental insurance settlement, which provides for a totalpayment of $16 million ($8 million of which we received in 2004, $4 million of which we received in 2005 and
33

$4 million of which we received in February 2006 in accordance with a previously agreed-upon paymentschedule) and $7 million from the 2005 insurance settlement related to our premises asbestos liabilities, as wellas payments of $12 million to fund our pension plans.
In 2004, we used the cash flows from operating activities, as well as $1 million of proceeds from theexercise of stock options and $5 million cash on hand, to fund capital expenditures of $15 million, to make a netrepayment on bank debt of $24 million, to pay debt issuance costs of $1 million, and to purchase certain propertyfor $3 million. Our book overdrafts increased $1 million. Included in the cash flows from operating activities was$8 million related to the 2004 environmental insurance settlement. In addition, cash flows from operatingactivities included cash outlays of approximately $12 million to fund our pension plans.
Excluding the construction of the office building by our wholly-owned subsidiary, Foundry Park I, weexpect that cash from operations, together with borrowing available under our senior credit facility, will continueto be sufficient to cover our operating expenses and planned capital expenditures for the foreseeable future. Formore information on the construction of the office building by Foundry Park I, see “Recent Developments” inPart I, Item 1.
FINANCIAL POSITION AND LIQUIDITY
Cash
At December 31, 2006, we had cash and cash equivalents of $60 million as compared to $56 million at theend of 2005.
We also had restricted cash of $200 thousand at December 31, 2006 and $1.4 million at December 31, 2005.In addition, at December 31, 2006, we had restricted funds of $1 million recorded as a long-term asset in otherassets. Of these total restricted funds at December 31, 2006, $700 thousand was cash received from MetropolitanLife Insurance Company (Metropolitan) during 2005 and 2003. These funds amounted to $900 thousand atDecember 31, 2005. The funds from Metropolitan are being used to reduce the employee portion of retiree healthbenefit costs. The remaining $500 thousand of restricted funds at both December 31, 2006 and December 31,2005 represents funds related to the issuance of a European bank guarantee.
At both December 31, 2006 and December 31, 2005, we had a book overdraft for some of our disbursementcash accounts. A book overdraft represents disbursements that have not cleared the bank accounts at the end ofthe reporting period. We transfer cash on an as-needed basis to fund these items as they clear the bank insubsequent periods.
Debt
Senior Notes—On November 21, 2006, we commenced a cash tender offer for any and all $150 millionaggregate principal amount of our then outstanding 8.875% senior notes due 2010. Upon the expiration of thetender offer on December 21, 2006, we accepted for purchase and purchased $149.75 million aggregate principalamount of our 8.875% senior notes. As a result of this transaction, we recognized a loss of $11 million on theearly extinguishment of debt. The loss included the write-off of $2.6 million in unamortized deferred financingcosts and cash paid of $8.6 million related to the premium and other costs of the purchase of the 8.875% seniornotes. We redeemed the remaining outstanding $250 thousand aggregate principal amount of our 8.875% seniornotes on February 7, 2007.
On December 12, 2006, we issued $150 million aggregate principal amount of our 7.125% senior notes due2016. The purchase of our 8.875% senior notes in the tender offer was financed with net proceeds from theissuance of the 7.125% senior notes, as well as cash on hand.
34

The 7.125% senior notes are our senior unsecured obligations and are jointly and severally guaranteed on anunsecured basis by all of our existing and future wholly-owned domestic restricted subsidiaries. We incurredfinancing costs of approximately $3 million related to the 7.125% senior notes, which are being amortized overten years.
The 7.125% senior notes and the subsidiary guarantees rank:
• effectively junior to all of our and the guarantors’ existing and future secured indebtedness, including anyborrowings under the senior credit facility described below;
• equal in right of payment with any of our and the guarantors’ existing and future unsecured seniorindebtedness; and
• senior in right of payment to any of our and the guarantors’ existing and future subordinatedindebtedness.
The indenture governing the 7.125% senior notes contains covenants that, among other things, limit ourability and the ability of our restricted subsidiaries to:
• incur additional indebtedness;
• create liens;
• pay dividends or repurchase capital stock;
• make certain investments;
• sell assets or consolidate or merge with or into other companies; and
• engage in transactions with affiliates.
We were in compliance with the covenants in the indenture governing the 7.125% senior notes as ofDecember 31, 2006 and those in the indenture governing the 8.875% senior notes as of December 31, 2006.
Senior Credit Facility—On December 21, 2006, we entered into a Second Amended and Restated CreditAgreement. This credit agreement amended and restated the credit agreement that we entered into onJune 18, 2004.
The credit agreement includes a $100 million revolving senior credit facility. We have an option to increasethe senior credit facility commitment by an amount not to exceed $50 million, subject to the satisfaction ofcertain terms and conditions. We incurred additional financing costs of approximately $600 thousand, whichresulted in total unamortized deferred financing costs of approximately $3 million related to the senior creditfacility. These costs are being amortized over five years.
The $100 million senior credit facility is for working capital and other general corporate purposes forNewMarket and our subsidiaries and includes a $50 million sub-facility for letters of credit. Borrowings bearinterest, at our election, at either a base rate plus a margin (25 basis points as of December 31, 2006) or LIBORplus a margin (125 basis points as of December 31, 2006). The revolving credit facility matures on December 21,2011. There were no borrowings outstanding at December 31, 2006 under the senior credit facility. AtDecember 31, 2006, we had outstanding letters of credit of $3.5 million, resulting in the unused portion of thesenior credit facility amounting to $96.5 million.
The senior credit facility is secured by liens on a significant portion of our U.S. assets. In addition, thesenior credit facility is guaranteed by our U.S. subsidiaries.
35

The credit agreement contains covenants, representations, and events of default that management considerstypical of a credit agreement of this nature. The financial covenants include:
• minimum consolidated net worth;
• a minimum fixed charge coverage ratio;
• a maximum leverage ratio; and
• restrictions on the payment of dividends or repurchases of capital stock.
We were in compliance with these covenants at December 31, 2006.
* * *
We had combined current and noncurrent long-term debt of $153.4 million at December 31, 2006 and$153.8 million at December 31, 2005.
During 2005, we paid-off our bank debt under our previous credit agreement which amounted to$30 million. We also paid $600 thousand on the capital lease obligations. All of our debt is discussed more fullyin Note 12 of the Notes to Consolidated Financial Statements.
As a percentage of total capitalization (total long-term debt and shareholders’ equity), our total debtdecreased from 36.6% at the end of 2005 to 33.7% at the end of 2006. The decrease reflects the increase inshareholders’ equity due to earnings, as well as the small pay down of debt. Normally, we repay long-term debtwith cash from operations, as well as with proceeds from occasional sales of business units, plant sites, or otherassets.
Working Capital
At December 31, 2006, we had working capital of $302 million, resulting in a current ratio (which is definedas current assets divided by current liabilities) of 2.88 to 1. Our working capital at year-end 2005 was$245 million resulting in a current ratio of 2.47 to 1.
The increase in working capital primarily reflects higher accounts receivable and inventories. The increasein accounts receivable is equally due to longer payment terms than in the past, as well as higher past due amountsat December 31, 2006. The increase in inventories results from higher raw material costs, as well as an increasein volumes in support of increased customer demands and our manufacturing plans.
Capital Expenditures
Excluding the construction of the office building by Foundry Park I, a wholly-owned subsidiary ofNewMarket Development, we expect capital expenditures to be approximately $30 million in 2007. We expect tocontinue to finance this capital spending through cash provided from operations, together with borrowingavailable under our senior credit facility. For more information on the construction of the office building byFoundry Park I, see “Recent Developments” in Part I, Item 1.
Environmental Expenses
We spent approximately $16 million in 2006, $13 million in 2005, and $14 million in 2004 for ongoingenvironmental operating and clean-up costs, excluding depreciation of previously capitalized expenditures. Theseenvironmental operating and clean-up expenses are included in cost of goods sold. In 2007, we expectenvironmental operating and remediation costs to be about the same as 2006. Further, we expect to continue tofund these costs through cash provided by operations.
36

Contractual Obligations
The table below shows our year-end contractual obligations by year due.
Payments due by period (in millions of dollars)
TotalLess than
1 Year1 - 3
Years3 - 5
YearsMore than
5 Years
Long-term debt obligations (a) . . . . . . . . . . . . . . . . . . . . . . . . . . . . . . $150 $— $— $— $150Interest payable on long-term debt and capital lease obligations . . . . 107 11 22 21 53Letters of credit (b) . . . . . . . . . . . . . . . . . . . . . . . . . . . . . . . . . . . . . . . 4 — — — 4Capital lease obligations (c) . . . . . . . . . . . . . . . . . . . . . . . . . . . . . . . . 3 1 1 1 —Operating lease obligations . . . . . . . . . . . . . . . . . . . . . . . . . . . . . . . . . 43 9 13 7 14Property, plant, and equipment purchase obligations . . . . . . . . . . . . . 3 3 — — —Raw material purchase obligations (d) . . . . . . . . . . . . . . . . . . . . . . . . 364 71 102 97 94Other long-term liabilities (e) . . . . . . . . . . . . . . . . . . . . . . . . . . . . . . . 25 19 1 3 2Real estate development (f) . . . . . . . . . . . . . . . . . . . . . . . . . . . . . . . . . 110 10 100 — —
Total . . . . . . . . . . . . . . . . . . . . . . . . . . . . . . . . . . . . . . . . . . . . . . . $809 $124 $239 $129 $317
(a) Amounts represent contractual payments due on the senior notes.(b) We intend to renew letters of credit when necessary as they mature; therefore, the obligations do not have a
definitive maturity date.(c) Amounts represent the debt obligation under the capital lease, as well as future minimum lease payments in
excess of the capital lease debt obligation.(d) Raw material purchase obligations include agreements to purchase goods or services that are enforceable
and legally binding on Afton or Ethyl and that specify all significant terms, including: fixed or minimumquantities to be purchased; fixed, minimum, or variable price provisions; and the approximate timing of thetransaction. Purchase obligations exclude agreements that are cancelable without penalty.
Purchase orders made in the ordinary course of business are excluded from the above table. Any amountsfor which we are liable under purchase orders are reflected in our Consolidated Balance Sheets as accountspayable and accrued liabilities.
(e) These represent other long-term liability amounts reflected in our Consolidated Balance Sheets that haveknown payment streams. Amounts include asset retirement obligations and contributions associated withpension and postretirement benefit plans. Amounts accrued for the potential exposure with respect tolitigation, claims, and assessments are not included in the table above.
(f) Foundry Park I, a wholly-owned subsidiary of NewMarket Development, entered into a Deed of LeaseAgreement in January 2007, with MeadWestvaco under which it will lease an office building which we willconstruct in Richmond, Virginia. We plan to invest between $110 million and $140 million in completing theconstruction of the building and parking facilities.
Under the marketing agreements with Innospec, we are required to provide approximately one-third of thecost of product sold to customers in the territory from our TEL inventory or post an equivalent dollar valuedeposit with Innospec. The approximate requirement is $12 million at year-end 2006 and $13 million at year-end2005. We now cover this requirement of the marketing agreements through the value of a working capitaladvance to Innospec. This advance is being repaid to Ethyl as the requirement decreases and will be repaid in fullat the end of the marketing agreements. These amounts have been recorded in other assets and deferred chargeson the Consolidated Balance Sheets. See Note 9 of the Notes to Consolidated Financial Statements.
Pension and Postretirement Benefit Plans
We apply SFAS No. 87, “Employers’ Accounting for Pensions”, SFAS No. 106, “Employers’ Accountingfor Postretirement Benefits Other Than Pensions”, and SFAS No. 158, “Employers’ Accounting for DefinedBenefit Pension and Other Postretirement Plans” to account for our pension and postretirement plans. We use a
37

December 31 measurement date to determine our pension and postretirement expenses and related financialdisclosure information. Additional information on our pension and postretirement plans is in Note 18 of theNotes to Consolidated Financial Statements.
Investment Return Assumptions under SFAS 87 and Asset Allocation—We periodically review ourassumptions for the long-term expected return on pension plan assets. As part of the review and to developexpected rates of return, we considered, with the assistance of our independent consulting actuaries, a stochasticanalysis of expected returns based on the domestic plans’ asset allocation as of both January 1, 2005 andJanuary 1, 2006. This forecast reflects our expected long-term rates of return for each significant asset class oreconomic indicator. As of January 1, 2007, the expected rates were 9.1% (9.4% last year) for U.S. large capstocks, 6.3% (5.7% last year) for U.S. long-term corporate bonds, and 2.7% (2.8% last year) for inflation. Therange of returns developed relies both on forecasts and on broad-market historical benchmarks for expectedreturn, correlation, and volatility for each asset class.
Our asset allocation is predominantly weighted toward equities. Through a review of our investments andafter reducing our long-term rate of return by 25 basis points at December 31, 2005, we have determined that weshould maintain the expected long-term rate of return for our domestic plans at 8.75% at December 31, 2006.
An actuarial gain, where the actual return exceeds the expected return, occurred during 2006 resulting in theactual investment return exceeding the assumed return in 2006 by approximately $3 million for all of ourdomestic pension plans. Despite the actuarial gain for 2006, we continue to have a net unrecognized loss atDecember 31, 2006. Actuarial losses, where the actual return was less than the expected return, resulted during2005 and 2004. The one-year investment return was lower than the long-term assumption by approximately $4million in 2005 and $1 million in 2004 for all of our domestic pension plans. Investment losses enter earnings onan amortized basis so that recent years’ losses resulted in increased expense of approximately $400 thousand in2006, as well as an expected $40 thousand increased expense in 2007. We expect that there will be continuedvolatility in pension expense as actual investment returns vary from the expected return, but we continue tobelieve the potential benefits justify the risk premium for equity investments.
Pension expense is sensitive to changes in the expected return on assets. For example, decreasing theexpected rate of return by 25 basis points to 8.50% (while holding other assumptions constant) would increasethe forecasted 2007 expense for our domestic pension plans by approximately $200 thousand. Similarly, a 25basis point increase in the expected rate of return to 9.00% (while holding other assumptions constant) wouldreduce forecasted 2006 pension expense by approximately $200 thousand.
Discount Rate Assumption under SFAS 87 and SFAS 106—We utilize the Citigroup Pension DiscountCurve (discount curve) and Liability Index in developing the discount rate assumption. We apply the expectedcash flows of the specific defined benefit retirement plan to the interest rates provided in the discount curve. Therate is developed based on the discount curve on the last day of December. The discount rate at December 31,2006 was 5.875%.
Pension expense is also sensitive to changes in the discount rate. For example, decreasing the discount rateby 25 basis points to 5.625% (while holding other assumptions constant) would increase the forecasted 2007expense for our domestic pension plans by approximately $400 thousand. A 25 basis point increase in thediscount rate to 6.125% would reduce forecasted 2007 pension expense by approximately $300 thousand.
Rate of Projected Compensation Increase—We have maintained our rate of projected compensationincrease at December 31, 2006 at 3.75%. The rate assumption was based on an analysis of our projectedcompensation increases for the foreseeable future.
Liquidity—Cash contribution requirements to the pension plan are sensitive to changes in assumed interestrates in the same manner as pension expense. We expect our aggregate domestic cash contributions, before incometaxes, will be approximately $7 million in 2007 while foreign cash contributions will be approximately $8 million.
38

Other Assumptions under SFAS 106—During 2002, we reviewed our assumption for the health care costtrend rate under SFAS 106. This review was done with reference to cost increases in our own plans, as well asbroader market increases in employer-provided health care costs and observations of SFAS 106 assumptionsused by other large employers. Consequently, as of December 31, 2002, we increased our assumption for thehealth care cost trend rate substantially to a rate of 11% in 2002 scaling down to 5.5% over the next ten years.Previously, the health care cost trend rate was 6% to 7%. The assumption of declining inflation is consistent withthe expectation that medical cost increases will abate after several years of double-digit growth. We havereviewed these assumptions and believe they continue to be appropriate for 2006.
The expected long-term rate of return on our postretirement plans is 7%. This rate varies from the pensionrate of 8.75% primarily because of the difference in investment of assets. The assets of the postretirement planare held in an insurance contract, which results in a lower assumed rate of investment return.
OUTLOOK
We believe we are in a strong financial position today. Our overall strategy remains unchanged. It is ourintent to leverage our financial strength to grow the business, with acquisitions being an area of primary interest.Our primary focus in the acquisition area remains on the petroleum additives industry. We believe that in thecurrent mergers and acquisition environment, this industry will provide the greatest opportunity for a good returnon investment while minimizing risk. As we have stated in the past, we remain patient in this pursuit. We havemany internal opportunities for growth in the near term, from both geographical and product line extensions. Wewill wait and make the right acquisition for our company when the opportunity arises.
During 2006, we restructured our debt by purchasing our 8.875% senior notes in a tender offer, issuing new7.125% senior notes, and amending and restating the credit agreement governing our senior credit facility. Thenew senior notes and credit agreement provide us with lower interest rates and terms that more accurately reflectour improved financial position. With no bank debt outstanding, we continue to build cash on the balance sheet.We are considering a full range of uses for this cash.
Early in 2007, we announced our intention to develop some of the downtown Richmond property that weown by constructing a multi-story office building for MeadWestvaco. We plan to invest between approximately$110 million and $140 million in completing construction of the building. We expect to primarily finance thisproject through construction and permanent indebtedness. Significant needs for cash for this project will notbegin until 2008.
We will also be investigating a range of other investments. We will balance all of these options with thelikelihood of merger and acquisition activity and decide on the best course of action to increase shareholdervalue.
Petroleum Additives
By any measure, 2006 was an outstanding year for our petroleum additives segment. We continue to focuson growing our business by helping our customers be successful in their marketplace. Our strategy is twofold:cost management in those areas that are commodity-like in their characteristics through reformulations and newcomponent introduction and growth through product differentiation in the other areas where margins are higher.
We expect that our approach in 2007 will be much the same. As in any year, there are many variables whichwill determine the ultimate profit achieved for the year. Raw material costs remain a significant unknown. Wecontinue to expect significant volatility during 2007 in the cost of raw materials that are related to crude oil andnatural gas. Base oil pricing has decreased at the beginning of 2007. This is primarily a result of higherinventories which may not be sustained as demand increases or as plant turnarounds occur in early 2007.However, prices of other raw materials, such as polyisobutylene, alpha olefins, 2-ethylhexanol, and
39

ethyleneamine, continue to stay firm. In fact, many raw materials we buy today tend to be governed by thesupply and demand balance in their own market. On the demand side, worldwide usage remains strong. Ourplants continue to operate at very high rates and we anticipate no slowdown during the year. As is a constantfeature of our business, the costs continue to escalate. Our R&D investment increased by 7% in 2006 over 2005and we expect it to increase again this year. The newly adopted REACH legislation in Europe will furtherincrease our costs. We have worked hard in the past year to provide better, more cost effective products to ourcustomers. As a result our margins have improved during 2006.
We expect to continue on the successes of 2006 and expect that petroleum additives will have a higheroperating profit in 2007 than 2006.
TEL
This segment took a significant step-down in its overall contribution to our results during 2006. Thisproduct is being phased out around the world and we expect it to remain a very small contributor to our overallprofits. Our plans are to continue to manage costs within this business and to raise prices to reflect the economicvalue of the product.
CRITICAL ACCOUNTING POLICIES AND ESTIMATES
It is our goal to clearly present our financial information in a manner that enhances the understanding of oursources of earnings and cash flows, as well as our financial condition. We do this by including the informationrequired by the SEC, as well as additional information that gives further insight into our financial operations.
Our financial report includes a discussion of our accounting principles, as well as methods and estimatesused in the preparation of our financial statements. We believe these discussions and statements fairly representthe financial position and operating results of our company. The purpose of this portion of our discussion is tofurther emphasize some of the more critical areas where a significant change in facts and circumstances in ouroperating and financial environment could cause a change in reported financial results.
TEL Marketing Agreements Services
As discussed in various sections of this Annual Report on Form 10-K, we have made certain paymentsrelated to our TEL marketing agreements. We made the final payment of $3 million in 2003. The unamortizedtotal is $8 million at December 31, 2006. We are amortizing these costs on an accelerated basis using a decliningbalance method over the life of the contracts. We believe this is the appropriate methodology and time period forthis amortization based on the facts and circumstances of our TEL operations and the estimated product life ofTEL. The customer base of TEL is significantly concentrated in a few countries and when conditions change thatcause a shorter product life or other restrictions outside of our control, the amortization period is adjustedaccordingly. Any adjustment to the amortization period would impact earnings, but would have no effect on cashflows. We continue to keep our accounting for this issue current with the business conditions.
The total amortization related to the TEL marketing agreements is currently projected to be:
• $3.7 million in 2007,
• $2.6 million in 2008, and
• $1.8 million in 2009.
40

Intangibles, Net of Amortization
We also have certain identifiable intangibles amounting to $52 million at year-end 2006 that are discussedin Note 10 of the Notes to Consolidated Financial Statements. These intangibles relate to our petroleum additivesbusiness and are being amortized over periods with up to ten years of remaining life. We continue to assess themarket related to these intangibles, as well as their specific values, and have concluded the amortization periodsand values are appropriate. We also evaluate these intangibles for any potential impairment when significantevents or circumstances occur that might impair the value of these assets. These evaluations continue to supportthe value at which these identifiable intangibles are carried on our financial statements. However, if conditionswere to substantially deteriorate in this market, it could possibly cause a reduction in the periods of thisamortization charge or result in a noncash write-off of a portion of the intangibles’ carrying value. A reduction inthe amortization period would have no effect on cash flows. While we do not anticipate such a change in themarket conditions, this disclosure is provided to enhance the understanding of the factors involved.
Environmental
We have made disclosure of our environmental matters in Item 1 of this Annual Report on Form 10-K, aswell as in the Notes to Consolidated Financial Statements. We believe our environmental accruals are appropriatefor the exposures and regulatory guidelines under which we currently operate. While we currently do notanticipate significant changes to the many factors that could impact our environmental requirements, we continueto keep our accruals consistent with these requirements as they change.
Also, as noted in the discussion of “Legal Proceedings” in Item 3 of this Annual Report on Form 10-K,while it is not possible to predict or determine with certainty the outcome of any legal proceeding, we do notbelieve that we will experience any material adverse effects on our results of operations or financial condition asa result of any pending or threatened proceeding.
Pension Plans and Other Postretirement Benefits
We use assumptions to record the impact of the pension and postretirement plans in the financial statements.These assumptions include the discount rate, expected long-term rate of return on plan assets, rate ofcompensation increase, and health-care cost trend rate. A change in any one of these assumptions could result indifferent results for the plans. We develop these assumptions after considering advice from a major globalactuarial consulting firm. Information is provided on the pension and postretirement plans in Note 18 of theNotes to Consolidated Financial Statements. In addition, further disclosure on the effect of changes in theseassumptions is provided in the “Financial Position and Liquidity” section of Item 7.
Income Taxes
We file consolidated U.S. federal and state income tax returns, as well as individual foreign income taxreturns, under which assumptions may be made to determine the deductibility of certain costs. In addition, wemake certain assumptions in the determination of the estimated future recovery of deferred tax assets.
RELATED PARTY TRANSACTIONS
Thomas E. Gottwald, our chief executive officer and a director, is a son of Bruce C. Gottwald, our chairmanof the board of directors and our former chief executive officer. The members of the family of Bruce C. Gottwaldmay be deemed to be control persons of NewMarket. Bruce C. Gottwald owns more than 5% of the outstandingshares of our common stock.
Effective September 24, 2004, NewMarket Services, entered into a Membership Units Purchase andAssignment Agreement (the Agreement), with Bruce C. Gottwald and Floyd D. Gottwald, Jr., who are brothers
41

(collectively the Gottwalds) and Old Town LLC (Old Town), under which NewMarket Services agreed topurchase all of the voting and non-voting units in Old Town owned by the Gottwalds. The purchase price of $3.3million was based on an appraisal. The Agreement also provided that each of the Gottwalds must resign as amanager of Old Town. Our Audit Committee and all of our independent directors unanimously approved theAgreement.
Under the terms of the Agreement, in the event that NewMarket Services decides to sell substantially all ofthe assets of Old Town and receives an offer from a third-party for such assets, NewMarket Services mustprovide the offer to the Gottwalds, who will have 30 days to purchase the assets of Old Town on the same termsand conditions as contained in the third-party offer.
In April 2001, we had sold this same property, located in King William, Virginia, and consisting ofapproximately 1,600 acres, to Old Town, which at the time was owned by the Gottwalds, for $2.9 million in cash,which was a value based on appraisals. We managed the property for Old Town.
RECENTLY ISSUED ACCOUNTING STANDARDS
In June 2006, the FASB issued Financial Interpretation 48, “Accounting for Uncertainty in Income Taxes—an interpretation of FASB Statement No. 109” (FIN 48). FIN 48 provides guidelines for financial statementrecognition and measurement of a tax position taken or expected to be taken in a tax return. It further clarifies theaccounting for uncertainty in income taxes recognized in the financial statements in accordance with FinancialAccounting Statement No. 109, “Accounting for Income Taxes.” The interpretation is effective for fiscal yearsbeginning after December 15, 2006. We adopted FIN 48 on January 1, 2007. We currently do not expect FIN 48to have a material impact on our financial statements; however, we are still finalizing our review.
In September 2006, the FASB issued Statement of Financial Accounting Standard No. 157, “Fair ValueMeasurements” (SFAS 157). The standard defines fair value, outlines a framework for measuring fair value, anddetails the required disclosures about fair value measurements. The standard is effective for years beginning afterNovember 15, 2007. We are evaluating the impact of the adoption of SFAS 157 on our financial statements.
ITEM 7A. QUANTITATIVE AND QUALITATIVE DISCLOSURES ABOUT MARKET RISK
We are exposed to many market risk factors, including fluctuations in interest and foreign currency rates, aswell as changes in the cost of raw materials and marketable security prices. These risk factors may affect ourresults of operations, cash flows, and financial position.
We manage these risks through regular operating and financing methods, including the use of derivativefinancial instruments. When we have derivative instruments, they are with major financial institutions and are notfor speculative or trading purposes. Also, as part of our financial risk management, we regularly reviewsignificant contracts for embedded derivatives. As of December 31, 2006, based on our review, we had nocontracts with an embedded derivative.
The following analysis presents the effect on our earnings, cash flows, and financial position as if thehypothetical changes in market risk factors occurred at year-end 2006. We analyzed only the potential impacts ofour hypothetical assumptions. This analysis does not consider other possible effects that could impact ourbusiness.
Interest Rate Risk
At December 31, 2006, we had total debt of $153 million with none of that amount at variable interest rates.Because all of our debt at year-end was at a fixed rate, there was no interest rate risk at the end of the year. If wewere to borrow under our senior credit facility in the future, we would experience interest rate risk based on theinterest rates available to us at that time.
42

Since all of our debt at year-end 2006 is at a fixed rate, a hypothetical 10% decrease in interest rates,holding all other variables constant, would have resulted in a change of $8 million in fair value of our debt.
Foreign Currency Risk
We sell to customers in foreign markets through our foreign subsidiaries, as well as through export salesfrom our plants in the United States. These transactions are often denominated in currencies other than the U.S.Dollar. Our primary currency exposures are the European Union Euro, British Pound Sterling, Japanese Yen, andCanadian Dollar.
We sometimes enter into forward contracts as hedges to minimize the fluctuation of accounts receivabledenominated in foreign currencies. During 2006, we entered into $15 million of Euro-denominated forwardcontracts to minimize currency exposure from expected cash flows from foreign operations. The contracts allhave maturity dates in 2006 and 2007. At December 31, 2006, there were $6 million remaining of these Euro-denominated contracts. With other variables held constant, a hypothetical 10% adverse change in theDecember 31, 2006 forward Euro rates would have resulted in a decrease of about $1 million in the value of thecontracts.
Raw Material Price Risk
We utilize a variety of raw materials in the manufacture of our products, including base oil, polyisobutylene,olefin copolymers, maleic anhydride, antioxidants, alcohols, and methacrylates. Our profitability is sensitive tochanges in the costs of these materials caused by changes in supply, demand or other market conditions, overwhich we have little or no control. If we experience sudden or sharp increases in the cost of our raw materials, wemay not be able to pass on these increases in whole or in part to our customers. Political and economic conditionsin the Middle East and Latin America have caused and may continue to cause the cost of our raw materials tofluctuate. War, armed hostilities, terrorist acts, civil unrest or other incidents may also cause a sudden or sharpincrease in the cost of our raw materials. If we cannot pass on to our customers any future increases in rawmaterial costs in the form of price increases for our products, there will be a negative impact on operating profit.
* * * *
FINANCIAL POLICY
NewMarket Corporation’s Financial Standards—Our goal is to present clearly NewMarket’s financialinformation to enhance your understanding of our sources of earnings and cash flows and our financial condition.
Management’s Report on the Financial Statements—NewMarket prepared the financial statements andrelated notes in accordance with GAAP. In doing so, management made informed judgments and estimates of theexpected effects of certain events and transactions on the reported amounts of assets and liabilities at the dates ofthe financial statements. The same is true for the reported amounts of revenues and expenses during thesereporting periods. Financial data appearing elsewhere in this Annual Report on Form 10-K is consistent withthese financial statements. However, actual results could differ from the estimates on which these financialstatements are based.
PricewaterhouseCoopers LLP (PwC), an independent registered public accounting firm, auditedNewMarket’s consolidated financial statements as of December 31, 2006 and 2005, and for each of the threeyears in the period ended December 31, 2006, in accordance with the standards of the Public CompanyAccounting Oversight Board (United States).
The Audit Committee of the Board of Directors, composed only of independent directors, meets withmanagement and PwC to review accounting, auditing, and financial reporting matters. The independentregistered public accounting firm is appointed by the Audit Committee.
43

ITEM 8. FINANCIAL STATEMENTS AND SUPPLEMENTARY DATA
Report of Independent Registered Public Accounting Firm
To the Board of Directors and Shareholders of NewMarket Corporation:
We have completed integrated audits of NewMarket Corporation’s consolidated financial statements and ofits internal control over financial reporting as of December 31, 2006, in accordance with the standards of thePublic Company Accounting Oversight Board (United States). Our opinions, based on our audits, are presentedbelow.
Consolidated financial statements
In our opinion, the accompanying consolidated balance sheets and the related consolidated statements ofincome, shareholders’ equity and cash flows present fairly, in all material respects, the financial position ofNewMarket Corporation and its subsidiaries at December 31, 2006 and 2005, and the results of their operationsand their cash flows for each of the three years in the period ended December 31, 2006 in conformity withaccounting principles generally accepted in the United States of America. These financial statements are theresponsibility of the Company’s management. Our responsibility is to express an opinion on these financialstatements based on our audits. We conducted our audits of these statements in accordance with the standards ofthe Public Company Accounting Oversight Board (United States). Those standards require that we plan andperform the audit to obtain reasonable assurance about whether the financial statements are free of materialmisstatement. An audit of financial statements includes examining, on a test basis, evidence supporting theamounts and disclosures in the financial statements, assessing the accounting principles used and significantestimates made by management, and evaluating the overall financial statement presentation. We believe that ouraudits provide a reasonable basis for our opinion.
As discussed in Note 18 to the consolidated financial statements, the Company changed the manner inwhich it accounts for defined benefit pension and other postretirement plans effective December 31, 2006.
Internal control over financial reporting
Also, in our opinion, management’s assessment, included in Management’s Report on Internal Control OverFinancial Reporting appearing under Item 9A, that the Company maintained effective internal control overfinancial reporting as of December 31, 2006 based on criteria established in Internal Control—IntegratedFramework issued by the Committee of Sponsoring Organizations of the Treadway Commission (COSO), isfairly stated, in all material respects, based on those criteria. Furthermore, in our opinion, the Companymaintained, in all material respects, effective internal control over financial reporting as of December 31, 2006,based on criteria established in Internal Control—Integrated Framework issued by the COSO. The Company’smanagement is responsible for maintaining effective internal control over financial reporting and for itsassessment of the effectiveness of internal control over financial reporting. Our responsibility is to expressopinions on management’s assessment and on the effectiveness of the Company’s internal control over financialreporting based on our audit. We conducted our audit of internal control over financial reporting in accordancewith the standards of the Public Company Accounting Oversight Board (United States). Those standards requirethat we plan and perform the audit to obtain reasonable assurance about whether effective internal control overfinancial reporting was maintained in all material respects. An audit of internal control over financial reportingincludes obtaining an understanding of internal control over financial reporting, evaluating management’sassessment, testing and evaluating the design and operating effectiveness of internal control, and performing suchother procedures as we consider necessary in the circumstances. We believe that our audit provides a reasonablebasis for our opinions.
A company’s internal control over financial reporting is a process designed to provide reasonable assuranceregarding the reliability of financial reporting and the preparation of financial statements for external purposes in
44

accordance with generally accepted accounting principles. A company’s internal control over financial reportingincludes those policies and procedures that (i) pertain to the maintenance of records that, in reasonable detail,accurately and fairly reflect the transactions and dispositions of the assets of the company; (ii) provide reasonableassurance that transactions are recorded as necessary to permit preparation of financial statements in accordancewith generally accepted accounting principles, and that receipts and expenditures of the company are being madeonly in accordance with authorizations of management and directors of the company; and (iii) provide reasonableassurance regarding prevention or timely detection of unauthorized acquisition, use, or disposition of thecompany’s assets that could have a material effect on the financial statements.
Because of its inherent limitations, internal control over financial reporting may not prevent or detectmisstatements. Also, projections of any evaluation of effectiveness to future periods are subject to the risk thatcontrols may become inadequate because of changes in conditions, or that the degree of compliance with thepolicies or procedures may deteriorate.
/s/ PricewaterhouseCoopers LLP
Richmond, VirginiaFebruary 23, 2007
45

NewMarket Corporation and Subsidiaries
Consolidated Statements of Income
Years Ended December 31
2006 2005 2004
(in thousands except per-share amounts)
Net sales . . . . . . . . . . . . . . . . . . . . . . . . . . . . . . . . . . . . . . . . . . . . . . . . . . . . $1,263,297 $1,075,544 $894,109Cost of goods sold . . . . . . . . . . . . . . . . . . . . . . . . . . . . . . . . . . . . . . . . . . . . 999,211 875,286 715,809
Gross profit . . . . . . . . . . . . . . . . . . . . . . . . . . . . . . . . . . . . . . . . . . . . . . 264,086 200,258 178,300Operating profit from TEL marketing agreements services . . . . . . . . . . . . 8,181 23,154 33,226Selling, general, and administrative expenses . . . . . . . . . . . . . . . . . . . . . . . 109,191 96,810 96,855Research, development, and testing expenses . . . . . . . . . . . . . . . . . . . . . . . 70,263 65,394 65,356Special item income . . . . . . . . . . . . . . . . . . . . . . . . . . . . . . . . . . . . . . . . . . . 14,825 11,668 13,245
Operating profit . . . . . . . . . . . . . . . . . . . . . . . . . . . . . . . . . . . . . . . . . . 107,638 72,876 62,560Interest and financing expenses, net . . . . . . . . . . . . . . . . . . . . . . . . . . . . . . . 15,403 16,849 18,254Loss on early extinguisment of debt . . . . . . . . . . . . . . . . . . . . . . . . . . . . . . 11,209 — —Other income, net . . . . . . . . . . . . . . . . . . . . . . . . . . . . . . . . . . . . . . . . . . . . . 7,117 925 324
Income before income taxes . . . . . . . . . . . . . . . . . . . . . . . . . . . . . . . . . . . . . 88,143 56,952 44,630Income tax expense . . . . . . . . . . . . . . . . . . . . . . . . . . . . . . . . . . . . . . . . . . . 30,621 14,571 11,572
Net income . . . . . . . . . . . . . . . . . . . . . . . . . . . . . . . . . . . . . . . . . . . . . . . . . . $ 57,522 $ 42,381 $ 33,058
Basic earnings per share . . . . . . . . . . . . . . . . . . . . . . . . . . . . . . . . . . . . . . . . $ 3.34 $ 2.49 $ 1.95
Diluted earnings per share . . . . . . . . . . . . . . . . . . . . . . . . . . . . . . . . . . . . . . $ 3.30 $ 2.45 $ 1.92
Shares used to compute basic earnings per share . . . . . . . . . . . . . . . . . . . . . 17,223 17,028 16,916
Shares used to compute diluted earnings per share . . . . . . . . . . . . . . . . . . . 17,407 17,320 17,199
See accompanying Notes to Consolidated Financial Statements.
46

NewMarket Corporation and Subsidiaries
Consolidated Balance Sheets
December 31
2006 2005
(in thousands exceptshare amounts)
ASSETSCurrent assets:
Cash and cash equivalents . . . . . . . . . . . . . . . . . . . . . . . . . . . . . . . . . . . . . . . . . . . . . . . $ 60,300 $ 56,413Restricted cash . . . . . . . . . . . . . . . . . . . . . . . . . . . . . . . . . . . . . . . . . . . . . . . . . . . . . . . . 240 1,419Trade and other accounts receivable, net . . . . . . . . . . . . . . . . . . . . . . . . . . . . . . . . . . . 198,243 189,460Inventories . . . . . . . . . . . . . . . . . . . . . . . . . . . . . . . . . . . . . . . . . . . . . . . . . . . . . . . . . . . 185,581 151,999Deferred income taxes . . . . . . . . . . . . . . . . . . . . . . . . . . . . . . . . . . . . . . . . . . . . . . . . . . 12,277 9,289Prepaid expenses . . . . . . . . . . . . . . . . . . . . . . . . . . . . . . . . . . . . . . . . . . . . . . . . . . . . . . 5,319 3,119
Total current assets . . . . . . . . . . . . . . . . . . . . . . . . . . . . . . . . . . . . . . . . . . . . . . . . 461,960 411,699
Property, plant, and equipment, at cost . . . . . . . . . . . . . . . . . . . . . . . . . . . . . . . . . . . . . . . . . 751,355 764,945Less accumulated depreciation and amortization . . . . . . . . . . . . . . . . . . . . . . . . . . . . . 589,241 610,939
Net property, plant, and equipment . . . . . . . . . . . . . . . . . . . . . . . . . . . . . . . . . . . . 162,114 154,006
Prepaid pension cost . . . . . . . . . . . . . . . . . . . . . . . . . . . . . . . . . . . . . . . . . . . . . . . . . . . . . . . 85 18,316Deferred income taxes . . . . . . . . . . . . . . . . . . . . . . . . . . . . . . . . . . . . . . . . . . . . . . . . . . . . . . 30,088 23,157Other assets and deferred charges . . . . . . . . . . . . . . . . . . . . . . . . . . . . . . . . . . . . . . . . . . . . . 38,838 44,480Intangibles, net of amortization . . . . . . . . . . . . . . . . . . . . . . . . . . . . . . . . . . . . . . . . . . . . . . . 51,708 49,874
TOTAL ASSETS . . . . . . . . . . . . . . . . . . . . . . . . . . . . . . . . . . . . . . . . . . . . . . . . . . . . . . . . . $744,793 $701,532
LIABILITIES AND SHAREHOLDERS’ EQUITYCurrent liabilities:
Accounts payable . . . . . . . . . . . . . . . . . . . . . . . . . . . . . . . . . . . . . . . . . . . . . . . . . . . . . $ 81,623 $ 88,350Accrued expenses . . . . . . . . . . . . . . . . . . . . . . . . . . . . . . . . . . . . . . . . . . . . . . . . . . . . . 59,692 58,847Dividends payable . . . . . . . . . . . . . . . . . . . . . . . . . . . . . . . . . . . . . . . . . . . . . . . . . . . . . 2,162 —Book overdraft . . . . . . . . . . . . . . . . . . . . . . . . . . . . . . . . . . . . . . . . . . . . . . . . . . . . . . . . 2,549 4,222Long-term debt, current portion . . . . . . . . . . . . . . . . . . . . . . . . . . . . . . . . . . . . . . . . . . 691 640Income taxes payable . . . . . . . . . . . . . . . . . . . . . . . . . . . . . . . . . . . . . . . . . . . . . . . . . . 13,466 14,728
Total current liabilities . . . . . . . . . . . . . . . . . . . . . . . . . . . . . . . . . . . . . . . . . . . . . 160,183 166,787
Long-term debt . . . . . . . . . . . . . . . . . . . . . . . . . . . . . . . . . . . . . . . . . . . . . . . . . . . . . . . . . . . 152,748 153,189Other noncurrent liabilities . . . . . . . . . . . . . . . . . . . . . . . . . . . . . . . . . . . . . . . . . . . . . . . . . . 130,460 115,496Commitments and contingencies (Note 17)
Shareholders’ equity:Common stock and paid in capital (without par value; authorized shares—
80,000,000; outstanding—17,289,860 at December 31, 2006 and 17,081,559 atDecember 31, 2005) . . . . . . . . . . . . . . . . . . . . . . . . . . . . . . . . . . . . . . . . . . . . . . . . . 88,263 85,162
Accumulated other comprehensive loss . . . . . . . . . . . . . . . . . . . . . . . . . . . . . . . . . . . . (47,165) (30,511)Retained earnings . . . . . . . . . . . . . . . . . . . . . . . . . . . . . . . . . . . . . . . . . . . . . . . . . . . . . 260,304 211,409
301,402 266,060
TOTAL LIABILITIES AND SHAREHOLDERS’ EQUITY . . . . . . . . . . . . . . . . . . . . . $744,793 $701,532
See accompanying Notes to Consolidated Financial Statements.
47

NewMarket Corporation and Subsidiaries
Consolidated Statements of Shareholders’ Equity
Common Stock andPaid in Capital
AccumulatedOther
Comprehensive(Loss) Income
RetainedEarnings
TotalShareholders’
EquityShares Amount
(in thousands except share amounts)
Balance at December 31, 2003 . . . . . . . . . . . . . . . 16,786,009 $83,877 $(20,164) $135,970 $199,683Comprehensive income:
Net income . . . . . . . . . . . . . . . . . . . . . . . . . . 33,058 33,058Changes in (net of tax):
Foreign currency translationadjustments . . . . . . . . . . . . . . . . . . . . 3,231 3,231
Unrealized gains on marketablesecurities . . . . . . . . . . . . . . . . . . . . . . 178 178
Minimum pension liability . . . . . . . . . . (4,170) (4,170)Derivative net loss . . . . . . . . . . . . . . . . (945) (945)
Total comprehensive income . . . . 31,352
Stock options exercised . . . . . . . . . . . . . . . . 194,750 847 847
Balance at December 31, 2004 . . . . . . . . . . . . . . . 16,980,759 84,724 (21,870) 169,028 231,882Comprehensive income:
Net income . . . . . . . . . . . . . . . . . . . . . . . . . . 42,381 42,381Changes in (net of tax):
Foreign currency translationadjustments . . . . . . . . . . . . . . . . . . . . (7,237) (7,237)
Unrealized loss on marketablesecurities . . . . . . . . . . . . . . . . . . . . . . (127) (127)
Minimum pension liability . . . . . . . . . . (2,222) (2,222)Derivative net gain . . . . . . . . . . . . . . . . 945 945
Total comprehensive income . . . . 33,740
Stock options exercised . . . . . . . . . . . . . . . . 100,800 438 438
Balance at December 31, 2005 . . . . . . . . . . . . . . . 17,081,559 85,162 (30,511) 211,409 266,060
Comprehensive income:Net income . . . . . . . . . . . . . . . . . . . . . . . . . . 57,522 57,522Changes in (net of tax):
Foreign currency translationadjustments . . . . . . . . . . . . . . . . . . . . 7,575 7,575
Unrealized loss on marketablesecurities . . . . . . . . . . . . . . . . . . . . . . (19) (19)
Minimum pension liability . . . . . . . . . . 8,929 8,929Derivative net loss . . . . . . . . . . . . . . . . (129) (129)
Total comprehensive income . . . . 73,878Initial adoption of Statement of Financial
Accounting Standard No. 158, net of tax(Note 18) . . . . . . . . . . . . . . . . . . . . . . . . . . (33,010) (33,010)
Cash dividends ($0.50 per share) . . . . . . . . . (8,627) (8,627)Stock options exercised . . . . . . . . . . . . . . . . 196,700 856 856Stock appreciation rights exercised . . . . . . . 11,601 744 744Stock option tax benefit . . . . . . . . . . . . . . . . 1,501 1,501
Balance at December 31, 2006 . . . . . . . . . . . . . . 17,289,860 $88,263 $(47,165) $260,304 $301,402
See accompanying Notes to Consolidated Financial Statements.
48

NewMarket Corporation and Subsidiaries
Consolidated Statements of Cash Flows
Years Ended December 31
2006 2005 2004
(in thousands)Cash and Cash Equivalents at Beginning of Year . . . . . . . . . . . . . . . . . . . . . . . . . . . . . . . . . $ 56,413 $ 28,778 $ 33,367
Cash Flows from Operating ActivitiesNet income . . . . . . . . . . . . . . . . . . . . . . . . . . . . . . . . . . . . . . . . . . . . . . . . . . . . . . . . . . . . 57,522 42,381 33,058Adjustments to reconcile net income to cash flows from operating activities:
Depreciation and amortization . . . . . . . . . . . . . . . . . . . . . . . . . . . . . . . . . . . . . . . . . 29,738 34,506 42,191Amortization of deferred financing costs . . . . . . . . . . . . . . . . . . . . . . . . . . . . . . . . . 1,854 1,890 2,584Noncash pension expense . . . . . . . . . . . . . . . . . . . . . . . . . . . . . . . . . . . . . . . . . . . . . 12,501 12,956 10,803Loss on early extinguishment of debt . . . . . . . . . . . . . . . . . . . . . . . . . . . . . . . . . . . . 11,209 — —Deferred income tax expense (benefit) . . . . . . . . . . . . . . . . . . . . . . . . . . . . . . . . . . . 3,059 (15,741) 3,401Pharmaceutical earn-out agreement . . . . . . . . . . . . . . . . . . . . . . . . . . . . . . . . . . . . . (5,274) — —Interest on income tax settlement . . . . . . . . . . . . . . . . . . . . . . . . . . . . . . . . . . . . . . . (4,429) — —Gains on sales of corporate property . . . . . . . . . . . . . . . . . . . . . . . . . . . . . . . . . . . . . (3,250) (7,800) —Net gain on settlements . . . . . . . . . . . . . . . . . . . . . . . . . . . . . . . . . . . . . . . . . . . . . . . (4,201) (3,868) (13,245)Stock-based compensation . . . . . . . . . . . . . . . . . . . . . . . . . . . . . . . . . . . . . . . . . . . . 744 — —
Change in assets and liabilities:Trade and other accounts receivable, net . . . . . . . . . . . . . . . . . . . . . . . . . . . . . . . . . . . (3,584) (36,000) (14,262)Inventories . . . . . . . . . . . . . . . . . . . . . . . . . . . . . . . . . . . . . . . . . . . . . . . . . . . . . . . . . . . (24,348) (951) (28,613)Prepaid expenses . . . . . . . . . . . . . . . . . . . . . . . . . . . . . . . . . . . . . . . . . . . . . . . . . . . . . . (2,293) (784) 1,569Accounts payable and accrued expenses . . . . . . . . . . . . . . . . . . . . . . . . . . . . . . . . . . . . (14,905) 17,890 19,077Income taxes payable . . . . . . . . . . . . . . . . . . . . . . . . . . . . . . . . . . . . . . . . . . . . . . . . . . 3,584 15,385 (10,898)
Cash pension contributions . . . . . . . . . . . . . . . . . . . . . . . . . . . . . . . . . . . . . . . . . . . . . . . . (17,920) (12,265) (12,195)Cash costs of 8.875% senior notes purchase . . . . . . . . . . . . . . . . . . . . . . . . . . . . . . . . . . . (8,609) — —Net proceeds from settlements . . . . . . . . . . . . . . . . . . . . . . . . . . . . . . . . . . . . . . . . . . . . . 11,422 11,150 7,650Excess tax benefits from stock-based payment arrangements . . . . . . . . . . . . . . . . . . . . . (1,501) — —TEL working capital advance . . . . . . . . . . . . . . . . . . . . . . . . . . . . . . . . . . . . . . . . . . . . . . 957 1,499 (3,522)Other, net . . . . . . . . . . . . . . . . . . . . . . . . . . . . . . . . . . . . . . . . . . . . . . . . . . . . . . . . . . . . . . (5,200) 3,747 (789)
Cash provided from operating activities . . . . . . . . . . . . . . . . . . . . . . . . . . . . . . . . 37,076 63,995 36,809
Cash Flows from Investing ActivitiesCapital expenditures . . . . . . . . . . . . . . . . . . . . . . . . . . . . . . . . . . . . . . . . . . . . . . . . . . . . . (26,161) (17,830) (14,650)Acquisition of intangible asset . . . . . . . . . . . . . . . . . . . . . . . . . . . . . . . . . . . . . . . . . . . . . (4,476) — —Purchase of certain property . . . . . . . . . . . . . . . . . . . . . . . . . . . . . . . . . . . . . . . . . . . . . . . — — (3,323)Proceeds from pharmaceutical earn-out agreement . . . . . . . . . . . . . . . . . . . . . . . . . . . . . 5,274 — —Proceeds from sale of certain assets . . . . . . . . . . . . . . . . . . . . . . . . . . . . . . . . . . . . . . . . . 3,408 13,721 —Other, net . . . . . . . . . . . . . . . . . . . . . . . . . . . . . . . . . . . . . . . . . . . . . . . . . . . . . . . . . . . . . . 108 64 255
Cash used in investing activities . . . . . . . . . . . . . . . . . . . . . . . . . . . . . . . . . . . . . . (21,847) (4,045) (17,718)
Cash Flows from Financing ActivitiesIssuance of 7.125% senior notes . . . . . . . . . . . . . . . . . . . . . . . . . . . . . . . . . . . . . . . . . . . . 150,000 — —Repayment of 8.875% senior notes . . . . . . . . . . . . . . . . . . . . . . . . . . . . . . . . . . . . . . . . . . (149,750) — —Repayments of debt—old agreements . . . . . . . . . . . . . . . . . . . . . . . . . . . . . . . . . . . . . . . . — — (53,807)Net (repayments) borrowings under revolving credit agreement . . . . . . . . . . . . . . . . . . . — (30,000) 30,000Dividends . . . . . . . . . . . . . . . . . . . . . . . . . . . . . . . . . . . . . . . . . . . . . . . . . . . . . . . . . . . . . (8,627) — —Change in book overdraft . . . . . . . . . . . . . . . . . . . . . . . . . . . . . . . . . . . . . . . . . . . . . . . . . (1,673) (793) 1,101Debt issuance costs . . . . . . . . . . . . . . . . . . . . . . . . . . . . . . . . . . . . . . . . . . . . . . . . . . . . . . (3,608) — (1,280)Excess tax benefits from stock-based payment arrangements . . . . . . . . . . . . . . . . . . . . . 1,501 — —Proceeds from exercise of options . . . . . . . . . . . . . . . . . . . . . . . . . . . . . . . . . . . . . . . . . . 856 438 847Payments on the capital lease . . . . . . . . . . . . . . . . . . . . . . . . . . . . . . . . . . . . . . . . . . . . . . (640) (609) (572)
Cash used in financing activities . . . . . . . . . . . . . . . . . . . . . . . . . . . . . . . . . . . . . . (11,941) (30,964) (23,711)
Effect of foreign exchange on cash and cash equivalents . . . . . . . . . . . . . . . . . . . . . . . . . . . 599 (1,351) 31
Increase (decrease) in cash and cash equivalents . . . . . . . . . . . . . . . . . . . . . . . . . . . . . . . . . 3,887 27,635 (4,589)
Cash and Cash Equivalents at End of Year . . . . . . . . . . . . . . . . . . . . . . . . . . . . . . . . . . . . . . $ 60,300 $ 56,413 $ 28,778
See accompanying Notes to Consolidated Financial Statements.
49

Notes to Consolidated Financial Statements
(tabular amounts in thousands, except per-share amounts)
1. Summary of Significant Accounting Policies
Consolidation—Our consolidated financial statements include the accounts of NewMarket Corporation andits subsidiaries. All significant intercompany transactions are eliminated upon consolidation. References to “we,”“our,” and “NewMarket,” are to NewMarket Corporation and its subsidiaries on a consolidated basis, unless thecontext indicates otherwise.
NewMarket is the parent company of two operating companies, each managing its own assets and liabilities.Those companies are Afton, which focuses on petroleum additive products, and Ethyl, representing certainmanufacturing operations and the TEL business. NewMarket is also the parent company of NewMarket Services,which provides various administrative services to NewMarket, Afton, and Ethyl.
Foreign Currency Translation—We translate the balance sheets of our foreign subsidiaries into U.S.Dollars based on the current exchange rate at the end of each period. We translate the statements of income usingthe weighted-average exchange rates for the period. NewMarket includes translation adjustments in the balancesheet as part of accumulated other comprehensive loss and transaction adjustments in net income.
Revenue Recognition—Our policy is to recognize revenue from the sale of products when title and risk ofloss have transferred to the buyer, the price is fixed and determinable, and collectibility is reasonably assured.Provisions for rebates to customers are recorded in the same period the related sales are recorded. Freight costsincurred on the delivery of product are included in cost of goods sold. The majority of our sales are sold FOB(“free on board”) shipping point or on an equivalent basis. Our standard terms of delivery are included in ourcontracts, sales order confirmation documents, and invoices.
Cash and Cash Equivalents—Our cash equivalents generally consist of government obligations andcommercial paper which mature in less than 90 days. We state cash and cash equivalents at cost, whichapproximates fair value.
Accounts Receivable—We record our accounts receivable at net realizable value. We maintain anallowance for doubtful accounts for estimated losses resulting from our customers not making requiredpayments. We determine the adequacy of the allowance by periodically evaluating each customer’s receivablebalance, considering our customers’ financial condition and credit history, and current economic conditions.
Inventories—NewMarket values its domestic petroleum additives and TEL inventories at the lower of costor market, with cost determined on the last-in, first-out (LIFO) basis. In countries where the LIFO method is notpermitted, we use the weighted-average method. Inventory cost includes raw materials, direct labor, andmanufacturing overhead.
Property, Plant, and Equipment—We state property, plant, and equipment at cost and computedepreciation by the straight-line method based on the estimated useful lives of the assets. NewMarket capitalizesexpenditures for significant improvements that extend the useful life of the related property. We expense repairsand maintenance, including plant turnaround costs, as incurred. When property is sold or retired, we remove thecost and accumulated depreciation from the accounts and any related gain or loss is included in income.
Our policy on capital leases is to record the asset at the lower of fair value at lease inception or the presentvalue of the total minimum lease payments. We compute amortization by the straight-line method over the lesserof the estimated economic life of the asset or the term of the lease.
Intangible Assets—Identifiable intangibles include the cost of acquired favorable contracts and formulas.We assign a value to identifiable intangibles based on independent appraisals and internal estimates. NewMarketamortizes intangibles using the straight-line method over the estimated economic life of the intangible.
50

Notes to Consolidated Financial Statements—Continued
(tabular amounts in thousands, except per-share amounts)
Impairment of Long-Lived Assets—When significant events or circumstances occur that might impair thevalue of long-lived assets, we evaluate recoverability of the recorded cost of these assets. Assets are consideredto be impaired if their carrying value is not recoverable from the estimated undiscounted cash flows associatedwith the assets. If we determine an asset is impaired and its recorded cost is higher than fair market value basedon the estimated present value of future cash flows, we adjust the asset to fair market value.
Asset Retirement Obligations—Asset retirement obligations, including costs associated with theretirement of tangible long-lived assets, are recorded at the fair value of the liability for an asset retirementobligation when incurred instead of ratably over the life of the asset. The asset retirement costs must becapitalized as part of the carrying value of the long-lived asset. If the liability is settled for an amount other thanthe recorded balance, we recognize either a gain or loss at settlement.
Environmental Costs—NewMarket capitalizes environmental compliance costs if they extend the usefullife of the related property or prevent future contamination. Environmental compliance costs also includemaintenance and operation of pollution prevention and control facilities. We expense these compliance costs asincurred.
Accrued environmental remediation and monitoring costs relate to an existing condition caused by pastoperations. NewMarket accrues these costs in current operations when it is probable that we have incurred aliability and the amount can be reasonably estimated.
We generally record environmental liabilities on an undiscounted basis. When we can reliably determine theamount and timing of future cash flows, we discount these liabilities. We incorporate an inflation factor indetermining the discount rate.
Employee Savings Plan—Most of our full-time salaried and hourly employees may participate in definedcontribution savings plans. Employees who are covered by collective bargaining agreements may also participatein a savings plan according to the terms of their bargaining agreements. Employees, as well as NewMarket,contribute to the plans. We made contributions of $3 million in 2006 and $2 million in both 2005 and 2004related to these plans.
Research, Development, and Testing Expenses—NewMarket expenses all research, development, andtesting costs as incurred. Of the total research, development, and testing expenses, those related to new productsand processes were $37 million in 2006, $34 million in 2005, and $33 million in 2004.
Income Taxes—We recognize deferred income taxes for temporary differences between the financialreporting basis and the income tax basis of assets and liabilities. We also adjust for changes in tax rates and lawsat the time the changes are enacted. A valuation allowance is recorded when it is more likely than not that adeferred tax asset will not be realized.
Derivative Financial Instruments—We have used derivative financial instruments to manage the risk offoreign currency exchange. NewMarket does not enter into derivative financial instruments for trading orspeculative purposes. We record these derivative financial instruments at fair value. When using derivativeinstruments for cash flow hedge purposes, we record realized gains and losses in net income, and unrealizedgains and losses in accumulated other comprehensive loss.
Earnings Per Share—Basic earnings per share reflect reported earnings divided by the weighted-averagenumber of common shares outstanding. Diluted earnings per share include the effect of dilutive stock optionsoutstanding during the year. See Note 2 of the Notes to Consolidated Financial Statements.
51

Notes to Consolidated Financial Statements—Continued
(tabular amounts in thousands, except per-share amounts)
Stock-Based Compensation—On January 1, 2006, we adopted Statement of Financial AccountingStandards No. 123 (revised 2004), “Share-Based Payment” (SFAS 123R), using the modified prospectiveapplication. SFAS 123R requires that the cost from share-based payment transactions be recognized in thefinancial statements and be determined using a fair-value-based measurement method. We use an option-pricingmodel similar to Black-Scholes to estimate the fair-value of options. This standard primarily applies to all awardsgranted or modified after January 1, 2006, as well as to non-vested awards.
Prior to adoption of SFAS 123R, we accounted for our stock-based compensation plan using the intrinsic-value method. Under this method, we did not record compensation cost for stock options unless the quotedmarket price of the stock at grant date or other measurement date exceeded the amount the employee must pay toexercise the stock option. Compensation cost for restricted stock grants, if issued, was recognized over thevesting period.
See Note 15 of the Notes to Consolidated Financial Statements for further information on our stock-basedcompensation plan. The following table illustrates the effect on net income and earnings per share as if we hadapplied the fair-value method of accounting for the stock-based compensation plan for the years endedDecember 31, 2005 and December 31, 2004.
Years Ended December 31
2005 2004
Net income, as reported . . . . . . . . . . . . . . . . . . . . . . . . . . . . . . . . . . . . . . . . . . . . . . . . . . . . $42,381 $33,058Less: Total stock-based employee compensation expense determined under fair value
based method, net of related tax effects . . . . . . . . . . . . . . . . . . . . . . . . . . . . . . . . . . . (23) (123)
Pro forma net income . . . . . . . . . . . . . . . . . . . . . . . . . . . . . . . . . . . . . . . . . . . . . . . . . $42,358 $32,935
Earnings per share:Basic, as reported . . . . . . . . . . . . . . . . . . . . . . . . . . . . . . . . . . . . . . . . . . . . . . . . . . . . $ 2.49 $ 1.95
Basic, pro forma . . . . . . . . . . . . . . . . . . . . . . . . . . . . . . . . . . . . . . . . . . . . . . . . . . . . . $ 2.49 $ 1.95
Diluted, as reported . . . . . . . . . . . . . . . . . . . . . . . . . . . . . . . . . . . . . . . . . . . . . . . . . . . $ 2.45 $ 1.92
Diluted, pro forma . . . . . . . . . . . . . . . . . . . . . . . . . . . . . . . . . . . . . . . . . . . . . . . . . . . . $ 2.45 $ 1.92
Investments—We classify marketable securities as “available for sale” and record them at fair value withthe unrealized gains or losses, net of tax, included as a component of shareholders’ equity in accumulated othercomprehensive loss. The fair value is determined based on quoted market prices.
When a decline in the fair value of a marketable security is considered other than temporary, we writedownthe investment to market value with a corresponding charge to earnings.
Estimates and Risks Due to Concentration of Business—The preparation of financial statements inconformity with GAAP requires management to make estimates and assumptions that affect the amountsreported in the financial statements and accompanying notes. Actual results could differ from those estimates.
In addition, our financial results can be influenced by certain risk factors. Some of our significantconcentrations of risk include the following:
• Reliance on a small number of significant customers;
• Customers concentrated in the fuel and lubricant industries;
52

Notes to Consolidated Financial Statements—Continued
(tabular amounts in thousands, except per-share amounts)
• Production of several of our products solely at one facility; and
• Political, social, economic, and regulatory factors associated with various regions around the world.
2. Earnings Per Share
Basic and diluted earnings per share are calculated as follows:
Years Ended December 31
2006 2005 2004
Basic earnings per shareNumerator:
Net income, as reported . . . . . . . . . . . . . . . . . . . . . . . . . . . . . . . . . . . . . . . . . . $57,522 $42,381 $33,058
Denominator:Weighted-average number of shares of common stock outstanding . . . . . . . . 17,223 17,028 16,916
Basic earnings per share . . . . . . . . . . . . . . . . . . . . . . . . . . . . . . . . . . . . . . . . . . . . . . $ 3.34 $ 2.49 $ 1.95
Diluted earnings per shareNumerator:
Net Income, as reported . . . . . . . . . . . . . . . . . . . . . . . . . . . . . . . . . . . . . . . . . . $57,522 $42,381 $33,058
Denominator:Weighted-average number of shares of common stock outstanding . . . . . . . . 17,223 17,028 16,916Shares issuable upon exercise of stock options . . . . . . . . . . . . . . . . . . . . . . . . 184 292 283
Total shares . . . . . . . . . . . . . . . . . . . . . . . . . . . . . . . . . . . . . . . . . . . . . . . . . . . 17,407 17,320 17,199
Diluted earnings per share . . . . . . . . . . . . . . . . . . . . . . . . . . . . . . . . . . . . . . . . . . . . $ 3.30 $ 2.45 $ 1.92
Options are not included in the computation of diluted earnings per share when the option exercise priceexceeds the average market price of the underlying common share, as the impact on earnings per share would beanti-dilutive. During 2006, 2005, and 2004, we had outstanding options to purchase 50,000 shares of commonstock at an exercise price of $44.375 per share. At December 31, 2006, these options were no longer outstandingas the related stock appreciation rights were exercised in November 2006. Due to the anti-dilutive effect, during2005 and 2004, these options were not included in the computation of diluted earnings per share as the exerciseprices exceeded the average market price of the underlying share of NewMarket common stock. These optionswere included in diluted earnings per share beginning in the second quarter 2006 when they were no longer anti-dilutive.
3. TEL Marketing Agreements Services
On October 1, 1998, Ethyl entered into marketing agreements with Innospec to market and sell TEL in allworld areas except for North America and the European Economic Area (Innospec marketing agreements). Salesmade under the Innospec marketing agreements are in the name of Innospec. We provided certain bulkdistribution, marketing, and other services related to sales made under these agreements. Innospec produces theTEL marketed under this arrangement and also provides marketing and other services.
Effective January 1, 2000, Ethyl’s Swiss subsidiaries entered into TEL marketing agreements with AlcorChemie AG and Alcor Chemie Vertriebs AG, a subsidiary of Innospec (collectively, Alcor), to market and sellTEL outside North America and the European Economic Area (Alcor marketing agreements). Innospec
53

Notes to Consolidated Financial Statements—Continued
(tabular amounts in thousands, except per-share amounts)
purchased Alcor, another TEL producer, in the fall of 1999. These agreements are similar to the Innospecmarketing agreements. On April 19, 2000, Ethyl’s Swiss subsidiaries made a payment of $39 million to Alcor asa prepayment for services provided under the terms of the Alcor marketing agreements. This payment wasfunded under our then-existing loan agreements.
During 2001, the Alcor marketing agreements were amended to include the proceeds from the sale of TELresulting from agreements entered into by an Alcor subsidiary. These agreements are with Veritel Chemicals BV(Veritel) and its parent company, General Innovative Investment NV (GII), and provide for the exclusive right tomarket and sell TEL sourced from Veritel in certain areas of the world, excluding primarily the United States andthe Russian Federation. Veritel is party to supply agreements granting it the exclusive right to distribute TELmanufactured by OAO Sintez, a Russian company, to areas outside the United States and the Russian Federation.The amended Alcor marketing agreements are effective for an initial period from January 1, 2000 toDecember 31, 2010, but may be extended under certain circumstances. Under the amended Alcor marketingagreements, Ethyl’s Swiss subsidiaries agreed to pay Alcor up to $22 million, representing an increase in theprepayment for services in proportion to the expanded agreements. Ethyl’s Swiss subsidiaries made an initialpayment of $2.5 million to Alcor in December 2001 as a payment for services under the terms of the amendedAlcor marketing agreements. We recorded this amount as a liability at year-end 2001. The payments under theamended Alcor marketing agreements were completed during 2003.
The payments related to the amended Alcor marketing agreements are being amortized over the life of theagreements using a declining balance method which is designed to be in proportion to future cash flows andservices from the Alcor marketing agreements as a result of declining volumes. During 2005, Innospec advisedus that one of the major TEL customers under our marketing agreements had discontinued the use of TEL earlierthan we had previously expected. Because of this development, we evaluated the prepayment for TEL marketingagreement services for impairment and concluded the unamortized value reflected in our consolidated financialstatements is not impaired. We adjusted the rate of amortization for these prepayments from a 20% decliningbalance method to a 30% declining balance method. In addition, based on revised projections of productshipments and product life expectancy, the amortization period is expected to run through 2009. Totalamortization related to the TEL marketing agreements is currently projected to be:
• 2007 . . . . . . . . . . $3.7 million
• 2008 . . . . . . . . . . $2.6 million
• 2009 . . . . . . . . . . $1.8 million
The unamortized portion of the payments totaled $8 million at year-end 2006 and $13 million at year-end2005 and is included in the accompanying consolidated balance sheets. Related amortization expense wasapproximately $5 million in 2006, $7 million in 2005, and $8 million in 2004.
Under the Innospec and amended Alcor marketing agreements, 32% of the net proceeds are paid to Ethyl forservices provided by Ethyl. The proceeds, net of amortization, earned by Ethyl under all of these marketingagreements are reflected in the Consolidated Statements of Income under “Operating profit from TEL marketingagreements services.”
54

Notes to Consolidated Financial Statements—Continued
(tabular amounts in thousands, except per-share amounts)
Summary financial information related to the marketing agreements is presented below. The territory salesshown in the table below are not recorded as sales in our Consolidated Statements of Income. The benefit of theterritory sales is reflected in the “Operating profit from TEL marketing agreements services” caption on ourConsolidated Statements of Income.
Years Ended December 31
2006 2005 2004
Territory sales . . . . . . . . . . . . . . . . . . . . . . . . . . . . . . . . . . . . . . . . . . . . . . . . . . . . $96,004 $197,646 $251,937Contractual cost of sales . . . . . . . . . . . . . . . . . . . . . . . . . . . . . . . . . . . . . . . . . . . . 41,908 88,798 108,803
54,096 108,848 143,134Selling, general, and administrative expenses . . . . . . . . . . . . . . . . . . . . . . . . . . . 12,196 14,169 15,632
Net proceeds for services . . . . . . . . . . . . . . . . . . . . . . . . . . . . . . . . . . . . . . . . . . $41,900 $ 94,679 $127,502
Ethyl’s share . . . . . . . . . . . . . . . . . . . . . . . . . . . . . . . . . . . . . . . . . . . . . . . . . . . . . $13,408 $ 30,297 $ 40,801Amortization expense and adjustments . . . . . . . . . . . . . . . . . . . . . . . . . . . . . . . . 5,227 7,143 7,575
Operating profit from TEL marketing agreements services . . . . . . . . . . . . . $ 8,181 $ 23,154 $ 33,226
Ethyl owed Innospec and Alcor approximately $8 million at December 31, 2006 for our share of netproceeds for services and unreimbursed costs as provided by the marketing agreements; whereas, Innospec andAlcor owed Ethyl approximately $3 million at December 31, 2005 for our share of net proceeds for services andunreimbursed costs, as provided by the marketing agreements. We received cash from these marketingagreements of $21 million in 2006, $32 million in 2005, and $35 million in 2004.
We record reimbursement of expenses as a reduction of the related expenses. Expense reimbursementsreceived from Innospec and Alcor under the marketing agreements totaled $600 thousand in 2006, $4 million in2005, and $5 million in 2004. These reimbursements were for certain bulk distribution, marketing, and otherservices we provided under the agreements.
Under the marketing agreements, we are required to provide approximately one-third of the cost of productsold to customers in the territory from our TEL inventory or post an equivalent dollar value deposit withInnospec. The approximate requirement is $12 million at year-end 2006 and $13 million at year-end 2005. Wenow cover this requirement of the marketing agreements through the value of a working capital advance toInnospec. This advance is being repaid to Ethyl as the requirement decreases and will be repaid in full at the endof the marketing agreements. These amounts have been recorded in other assets and deferred charges on theconsolidated balance sheets. See Note 9 of the Notes to Consolidated Financial Statements.
In 2006, Ethyl received three requests for arbitration filed by three subsidiaries of Innospec. The Innospecrequests were filed on October 2, 2006, pursuant to the rules of the London Court of International Arbitration andallegedly pursuant to these long-standing marketing and supply agreements between Ethyl or its subsidiaries andsubsidiaries of Innospec for the sale of TEL outside of the United States. Innospec is claiming the right toterminate the agreements and is seeking damages. Although these marketing and supply agreements relate onlyto TEL, Innospec contends that the agreements impose certain duties that were breached by the sales andmarketing of MMT in Iraq and South Africa by affiliates of Ethyl. Ethyl will vigorously defend the cases andbelieves it will ultimately prevail in these arbitrations. Therefore, no accrual has been recorded.
55

Notes to Consolidated Financial Statements—Continued
(tabular amounts in thousands, except per-share amounts)
4. Supplemental Cash Flow Information
Years Ended December 31
2006 2005 2004
Cash paid during the year forInterest and financing expenses (net of capitalization) . . . . . . . . . . . . . . . . . . $15,406 $15,118 $15,826Income taxes . . . . . . . . . . . . . . . . . . . . . . . . . . . . . . . . . . . . . . . . . . . . . . . . . . . 26,123 10,392 13,443
5. Cash and Cash Equivalents
December 31
2006 2005
Cash and time deposits . . . . . . . . . . . . . . . . . . . . . . . . . . . . . . . . . . . . . . . $39,742 $28,943Short-term securities . . . . . . . . . . . . . . . . . . . . . . . . . . . . . . . . . . . . . . . . . 20,558 27,470
$60,300 $56,413
The maturity of time deposits is less than 90 days. Our short-term securities are generally governmentobligations and commercial paper, which mature in less than 90 days. We state these securities at cost and recordaccrued income on these securities in other accounts receivables. Throughout the year, we have cash balances inexcess of federally insured amounts on deposit with various financial institutions.
We also had restricted cash of $200 thousand at December 31, 2006 and $1.4 million at December 31, 2005.In addition, at December 31, 2006, we had restricted funds of $1.0 million recorded as a long-term asset in otherassets and deferred charges. Of these total restricted cash and funds, $700 thousand at December 31, 2006 and$900 thousand at December 31, 2005 was cash received from Metropolitan Life Insurance Company(Metropolitan) during 2005 and 2003. The funds from Metropolitan are used to reduce the employee portion ofretiree health benefit costs. The remaining $500 thousand of restricted cash and funds at both December 31, 2006and December 31, 2005, represents funds related to the issuance of a European bank guarantee.
At both December 31, 2006 and December 31, 2005, we had a book overdraft for some of our disbursement cashaccounts. A book overdraft represents disbursements that have not cleared the bank accounts at the end of the reportingperiod. We transfer cash on an as-needed basis to fund these items as the items clear the bank in subsequent periods.
6. Trade and Other Accounts Receivable, Net
December 31
2006 2005
Trade receivables . . . . . . . . . . . . . . . . . . . . . . . . . . . . . . . . . . . . . . . . . . $176,004 $168,168Income tax receivables . . . . . . . . . . . . . . . . . . . . . . . . . . . . . . . . . . . . . 10,551 6,162Environmental insurance settlement receivable . . . . . . . . . . . . . . . . . . — 4,283Other . . . . . . . . . . . . . . . . . . . . . . . . . . . . . . . . . . . . . . . . . . . . . . . . . . . 12,523 11,892Allowance for doubtful accounts . . . . . . . . . . . . . . . . . . . . . . . . . . . . . (835) (1,045)
$198,243 $189,460
Bad debt expense was $44 thousand in 2006 and $1.4 million in 2004. We had no bad debt expense in 2005.The allowance for doubtful accounts amounted to $1 million at December 31, 2004. The change in the allowancefor doubtful accounts between 2004 and 2005, as well as between 2005 and 2006 reflects allowances for disputedinvoiced prices and quantities.
56

Notes to Consolidated Financial Statements—Continued
(tabular amounts in thousands, except per-share amounts)
7. Inventories
December 31
2006 2005
Finished goods and work-in-process . . . . . . . . . . . . . . . . . . . . . . . . . . . $150,468 $121,493Raw materials . . . . . . . . . . . . . . . . . . . . . . . . . . . . . . . . . . . . . . . . . . . . 28,002 22,440Stores, supplies, and other . . . . . . . . . . . . . . . . . . . . . . . . . . . . . . . . . . . 7,111 8,066
$185,581 $151,999
The reserve for obsolete and slow moving inventory amounted to $2 million at both December 31, 2006 andDecember 31, 2005. These amounts are included in the table above.
Our foreign inventories amounted to $109 million at year-end 2006 and $93 million at year-end 2005.
Our inventories which are stated on the LIFO basis amounted to $71 million at year-end 2006, which wasbelow replacement cost by approximately $37 million. At year-end 2005, LIFO basis inventories were $55million, about $31 million below replacement cost.
During 2006, TEL inventory quantities were reduced resulting in a liquidation of LIFO layers. The effect ofthis liquidation increased net income by $100 thousand. During 2005, the petroleum additives inventoryquantities were reduced resulting in a liquidation of LIFO layers. The effect of this liquidation increased netincome by $400 thousand. During 2004, TEL inventory quantities were reduced resulting in a liquidation ofLIFO layers. The effect of this liquidation increased net income by $200 thousand.
8. Property, Plant, and Equipment
December 31
2006 2005
Land . . . . . . . . . . . . . . . . . . . . . . . . . . . . . . . . . . . . . . . . . . . . . . . . . . . . $ 32,574 $ 32,303Land improvements . . . . . . . . . . . . . . . . . . . . . . . . . . . . . . . . . . . . . . . . 27,310 31,145Buildings . . . . . . . . . . . . . . . . . . . . . . . . . . . . . . . . . . . . . . . . . . . . . . . . 90,266 90,414Machinery and equipment . . . . . . . . . . . . . . . . . . . . . . . . . . . . . . . . . . . 587,761 596,480Capitalized interest . . . . . . . . . . . . . . . . . . . . . . . . . . . . . . . . . . . . . . . . 3,473 7,208Construction in progress . . . . . . . . . . . . . . . . . . . . . . . . . . . . . . . . . . . . 9,971 7,395
$751,355 $764,945
We depreciate the cost of property, plant, and equipment generally by the straight-line method and primarilyover the following useful lives:
Land improvements . . . . . . . . . . . . . . . . . . . . . . . . . . . . . . . . . . . . . . . . . . . . . . . 5-30 yearsBuildings . . . . . . . . . . . . . . . . . . . . . . . . . . . . . . . . . . . . . . . . . . . . . . . . . . . . . . . . 10-40 yearsMachinery and equipment . . . . . . . . . . . . . . . . . . . . . . . . . . . . . . . . . . . . . . . . . . 3-15 years
Interest capitalized was $200 thousand in 2006, $100 thousand in 2005, and $200 thousand in 2004.Capitalized interest is amortized generally over the same lives as the asset to which it relates. Depreciation expensewas $20 million in 2006, $22 million in 2005, and $27 million in 2004. Amortization of capitalized interest, whichis included in depreciation expense, was $300 thousand in 2006, $1.1 million in 2005 and $1.5 million in 2004.
57

Notes to Consolidated Financial Statements—Continued
(tabular amounts in thousands, except per-share amounts)
9. Other Assets and Deferred Charges
December 31
2006 2005
TEL prepayment for services, net of amortization . . . . . . . . . . . . . . . . . . $ 8,160 $13,484TEL working capital advance to Innospec . . . . . . . . . . . . . . . . . . . . . . . . 11,983 12,939Deferred financing costs, net of amortization . . . . . . . . . . . . . . . . . . . . . . 6,341 7,151Other . . . . . . . . . . . . . . . . . . . . . . . . . . . . . . . . . . . . . . . . . . . . . . . . . . . . . 12,354 10,906
$38,838 $44,480
The accumulated amortization on the TEL prepayment for services was $56 million at December 31, 2006and $51 million at December 31, 2005.
The accumulated amortization on the deferred financing fees relating to our 7.125% senior notes and seniorcredit facility was $3 million at December 31, 2006. During 2006, we purchased $149.75 million of the $150million aggregate principal amount of our 8.875% senior notes and wrote off unamortized deferred financingcosts of $3 million. We also issued $150 million aggregate principal amount of our 7.125% senior notes and paiddeferred financing costs of $3 million in 2006. Also during 2006, we incurred additional deferred financing costsof $600 thousand related to the amendment and restatement of the credit agreement governing our senior creditfacility. In addition to the write-off of unamortized deferred financing cost related to the 8.875% senior notes, weamortized a total of $2 million for deferred financing costs during 2006. The accumulated amortization ondeferred financing costs at December 31, 2005 was $4 million. See Note 12 of the Notes to ConsolidatedFinancial Statements for further information on our long-term debt.
10. Intangibles, Net of Amortization
December 31
2006 2005
Identifiable Intangibles
GrossCarryingAmount
AccumulatedAmortization
GrossCarryingAmount
AccumulatedAmortization
Amortizing intangible assetsFormulas . . . . . . . . . . . . . . . . . . . . . . . . . . . . . . . . . . . . . . . $85,910 $44,430 $ 85,910 $39,905Contracts . . . . . . . . . . . . . . . . . . . . . . . . . . . . . . . . . . . . . . . 10,376 148 40,873 40,873
$96,286 $44,578 $126,783 $80,778
Nonamortizing intangible assetsMinimum pension liabilities . . . . . . . . . . . . . . . . . . . . . . . . $ — $ 3,869
Aggregate amortization expense . . . . . . . . . . . . . . . . . . . . . . . . $ 4,673 $ 5,364
The decrease in the identifiable intangibles balances between December 31, 2005 and December 31, 2006reflects approximately $41 million of the contracts becoming fully amortized. Contracts with a value ofapproximately $10 million were acquired during 2006. We paid approximately $4 million for the acquisition ofthese intangibles during 2006 and recorded the remaining amount payable under the contracts as a liability atDecember 31, 2006. The fair value of intangible assets is estimated based upon management’s assessment, aswell as independent third-party appraisals, in some cases. All of the intangibles relate to the petroleum additivessegment.
58

Notes to Consolidated Financial Statements—Continued
(tabular amounts in thousands, except per-share amounts)
Estimated amortization expense for the next five years is expected to be:
• 2007 . . . . . . . . . . $6,152
• 2008 . . . . . . . . . . $6,152
• 2009 . . . . . . . . . . $6,152
• 2010 . . . . . . . . . . $6,152
• 2011 . . . . . . . . . . $6,079
We amortize the cost of intangible assets by the straight-line method, over their economic lives. Wegenerally amortize contracts over five to ten years. We generally amortize formulas over 20 years.
During 2003, we were notified by DSM Copolymer, Inc., our supplier of olefin copolymer viscosity indeximprovers, of its intent to terminate a supply contract with us in mid-2005. The contract was initially scheduledto terminate in 2012. We adjusted the amortization period of the intangible asset associated with this contract tocoincide with the 2005 termination date.
11. Accrued Expenses
December 31
2006 2005
Employee benefits, payroll, and related taxes . . . . . . . . . . . . . . . . . . . . . . $19,143 $15,203Customer rebates . . . . . . . . . . . . . . . . . . . . . . . . . . . . . . . . . . . . . . . . . . . . 13,246 14,652Environmental remediation . . . . . . . . . . . . . . . . . . . . . . . . . . . . . . . . . . . . 1,044 3,045Environmental dismantling . . . . . . . . . . . . . . . . . . . . . . . . . . . . . . . . . . . . 980 4,250Other . . . . . . . . . . . . . . . . . . . . . . . . . . . . . . . . . . . . . . . . . . . . . . . . . . . . . 25,279 21,697
$59,692 $58,847
Environmental remediation and environmental dismantling include asset retirement obligations.
12. Long-Term Debt
December 31
2006 2005
Senior notes—7.125% due 2016 . . . . . . . . . . . . . . . . . . . . . . . . . . . . . . $150,000 $ —Senior notes—8.875% due 2010 . . . . . . . . . . . . . . . . . . . . . . . . . . . . . . 250 150,000Capital lease obligations . . . . . . . . . . . . . . . . . . . . . . . . . . . . . . . . . . . . 3,189 3,829
153,439 153,829Current maturities . . . . . . . . . . . . . . . . . . . . . . . . . . . . . . . . . . . . . . . . . (691) (640)
$152,748 $153,189
Senior Notes—On November 21, 2006, we commenced a cash tender offer for any and all $150 millionaggregate principal amount of our then outstanding 8.875% senior notes due 2010. Upon the expiration of thetender offer on December 21, 2006, we accepted for purchase and purchased $149.75 million aggregate principalamount of our 8.875% senior notes. As a result of this transaction, we recognized a loss of $11 million on theearly extinguishment of debt. The loss included the write-off of $2.6 million in unamortized deferred financing
59

Notes to Consolidated Financial Statements—Continued
(tabular amounts in thousands, except per-share amounts)
costs and cash paid of $8.6 million related to the premium and other costs of the purchase. We redeemed theremaining outstanding $250 thousand aggregate principal amount of our 8.875% senior notes on February 7, 2007.
On December 12, 2006, we issued $150 million aggregate principal amount of our 7.125% senior notes due2016. The purchase of our 8.875% senior notes in the tender offer was financed with net proceeds from theissuance of the 7.125% senior notes, as well as cash on hand.
The 7.125% senior notes are our senior unsecured obligations and are jointly and severally guaranteed on anunsecured basis by all of our existing and future wholly-owned domestic restricted subsidiaries. We incurredfinancing costs of approximately $3 million related to the 7.125% senior notes, which are being amortized overten years.
The 7.125% senior notes and the subsidiary guarantees rank:
• effectively junior to all of our and the guarantors’ existing and future secured indebtedness, including anyborrowings under the senior credit facility described below;
• equal in right of payment with any of our and the guarantors’ existing and future unsecured seniorindebtedness; and
• senior in right of payment to any of our and the guarantors’ existing and future subordinatedindebtedness.
The indenture governing the 7.125% senior notes contains covenants that, among other things, limit ourability and the ability of our restricted subsidiaries to:
• incur additional indebtedness;
• create liens;
• pay dividends or repurchase capital stock;
• make certain investments;
• sell assets or consolidate or merge with or into other companies; and
• engage in transactions with affiliates.
We were in compliance with the covenants in the indenture governing the 7.125% senior notes as ofDecember 31, 2006 and those in the indenture governing the 8.875% senior notes as of December 31, 2006.
Senior Credit Facility—On December 21, 2006, we entered into a Second Amended and Restated CreditAgreement. This credit agreement amended and restated the credit agreement that we entered into on June 18, 2004.
The credit agreement includes a $100 million revolving senior credit facility. We have an option to increasethe senior credit facility commitment by an amount not to exceed $50 million, subject to the satisfaction ofcertain terms and conditions. We incurred additional financing costs of approximately $600 thousand, whichresulted in total unamortized deferred financing costs of approximately $3 million related to the senior creditfacility. These costs are being amortized over five years.
The $100 million senior credit facility is for working capital and other general corporate purposes forNewMarket and our subsidiaries and includes a $50 million sub-facility for letters of credit. Borrowings bearinterest, at our election, at either a base rate plus a margin (25 basis points as of December 31, 2006) or LIBORplus a margin (125 basis points as of December 31, 2006). The revolving credit facility matures on December 21,
60

Notes to Consolidated Financial Statements—Continued
(tabular amounts in thousands, except per-share amounts)
2011. There were no borrowings outstanding at December 31, 2006 under the senior credit facility. AtDecember 31, 2006, we had outstanding letters of credit of $3.5 million, resulting in the unused portion of thesenior credit facility amounting to $96.5 million.
The senior credit facility is secured by liens on a significant portion of our U.S. assets. In addition, thesenior credit facility is guaranteed by our U.S. subsidiaries.
The credit agreement contains covenants, representations, and events of default that management considerstypical of a credit agreement of this nature. The financial covenants include:
• minimum consolidated net worth;
• a minimum fixed charge coverage ratio;
• a maximum leverage ratio; and
• restrictions on the payment of dividends or repurchases of capital stock.
We were in compliance with these covenants at December 31, 2006.
We did not borrow during 2006 under our senior credit facility. The weighted-average interest rate on theborrowings under our senior credit facility contained in our previous credit agreement was 5.32% in 2005 and4.77% in 2004. All of our debt under the senior credit facility contained in our previous credit agreement was atvariable rates.
Other Borrowings—We record our capital lease obligations at the fair market value of the related asset atthe inception of the lease. Capital lease obligations, including interest, will be approximately $900 thousand eachyear for the next four years and approximately $100 thousand in the fifth year. The future minimum leasepayments in excess of the capital lease obligation are included in the noncancelable future lease paymentsdiscussed in Note 17 of the Notes to Consolidated Financial Statements.
Principal debt payments for the next five years are scheduled as follows:
• 2007 . . . . . . . . . . . . . . . . . . . . . . . . . . . . . . . . $ 0.9 million
• 2008 . . . . . . . . . . . . . . . . . . . . . . . . . . . . . . . . $ 0.7 million
• 2009 . . . . . . . . . . . . . . . . . . . . . . . . . . . . . . . . $ 0.8 million
• 2010 . . . . . . . . . . . . . . . . . . . . . . . . . . . . . . . . $ 0.8 million
• 2011 . . . . . . . . . . . . . . . . . . . . . . . . . . . . . . . . $ 0.1 million
• After 2011 . . . . . . . . . . . . . . . . . . . . . . . . . . . $ 150.0 million
13. Other Noncurrent Liabilities
December 31
2006 2005
Employee benefits . . . . . . . . . . . . . . . . . . . . . . . . . . . . . . . . . . . . . . . . . $ 92,368 $ 80,261Environmental remediation . . . . . . . . . . . . . . . . . . . . . . . . . . . . . . . . . . 18,327 19,832Environmental dismantling . . . . . . . . . . . . . . . . . . . . . . . . . . . . . . . . . . 2,041 2,722Asbestos litigation reserve . . . . . . . . . . . . . . . . . . . . . . . . . . . . . . . . . . 10,232 8,181Other . . . . . . . . . . . . . . . . . . . . . . . . . . . . . . . . . . . . . . . . . . . . . . . . . . . 7,492 4,500
$130,460 $115,496
61

Notes to Consolidated Financial Statements—Continued
(tabular amounts in thousands, except per-share amounts)
Environmental remediation and environmental dismantling include our asset retirement obligations.
14. Asset Retirement Obligations
Our asset retirement obligations are related primarily to TEL operations. The following table illustrates the2006 and 2005 activity associated with our asset retirement obligations.
Years Ended December 31
2006 2005
Asset retirement obligation, beginning of year . . . . . . . . . . . . . . . . . . . . . . . . . . . . . . . . . . $10,386 $10,268Accretion expense . . . . . . . . . . . . . . . . . . . . . . . . . . . . . . . . . . . . . . . . . . . . . . . . . . . . . . . . 690 761Liabilities incurred . . . . . . . . . . . . . . . . . . . . . . . . . . . . . . . . . . . . . . . . . . . . . . . . . . . . . . . — 675Liabilities settled . . . . . . . . . . . . . . . . . . . . . . . . . . . . . . . . . . . . . . . . . . . . . . . . . . . . . . . . . (5,269) (3,736)Changes in expected cash flows and timing . . . . . . . . . . . . . . . . . . . . . . . . . . . . . . . . . . . . (654) 2,292Foreign currency impact . . . . . . . . . . . . . . . . . . . . . . . . . . . . . . . . . . . . . . . . . . . . . . . . . . . 115 126
Asset retirement obligation, end of year . . . . . . . . . . . . . . . . . . . . . . . . . . . . . . . . . . . . . . . $ 5,268 $10,386
15. Stock-Based Compensation
On May 27, 2004, at the Ethyl annual meeting, Ethyl shareholders approved the 2004 IncentiveCompensation and Stock Plan (the Plan). In connection with the holding company formation, NewMarketassumed all of Ethyl’s rights, liabilities, and obligations under the Plan. Any employee of our company or anaffiliate or a person who is a member of our board of directors or the board of directors of an affiliate is eligibleto participate in the Plan if the Bonus, Salary and Stock Option Committee of our Board of Directors (theAdministrator), in its sole discretion, determines that such person has contributed significantly or can be expectedto contribute significantly to the profits or growth of our company or its affiliates (each, a participant). Under theterms of the Plan, we may grant participants stock awards, incentive awards, or options (which may be eitherincentive stock options or nonqualified stock options), or stock appreciation rights (SARs), which may be grantedwith a related option. Stock options entitle the participant to purchase a specified number of shares of ourcommon stock at a price that is fixed by the Administrator at the time the option is granted; provided, however,that the price cannot be less than the shares’ fair market value on the date of grant. The maximum period inwhich an option may be exercised is fixed by the Administrator at the time the option is granted but, in the caseof an incentive stock option, cannot exceed ten years.
The maximum aggregate number of shares of our common stock that may be issued under the Plan is1,500,000. No shares have yet been issued under the Plan resulting in 1,500,000 shares being available for grantat December 31, 2006. No participant may be granted or awarded in any calendar year options or SARs coveringmore than 200,000 shares of our common stock in the aggregate. For purposes of this limitation and theindividual limitation on the grant of options, an option and corresponding SAR are treated as a single award.
Some previously granted options became exercisable when the market price of our common stock reachedspecified levels or when our earnings meet designated objectives. Other options became exercisable over a statedperiod of time. These previously granted outstanding options were awarded under Ethyl’s 1982 Stock OptionPlan, which terminated in March 2004, and pursuant to which no further options may be granted.
At December 31, 2006, we had outstanding 132,500 options to purchase shares of our common stock at anexercise price of $4.35 per share. None of these options include an associated SAR. These options are fullyvested and exercisable at December 31, 2006. All but 20,000 of the $4.35 options will expire on September 28,2011. The remaining 20,000 options will expire on October 10, 2012.
62

Notes to Consolidated Financial Statements—Continued
(tabular amounts in thousands, except per-share amounts)
A summary of activity during 2006 in NewMarket’s stock option plan is presented below in whole shares:
WholeShares
WeightedAverageExercise
Price
WeightedAverage
RemainingContractual
Term inYears
AggregateIntrinsicValue (in
thousands)
Outstanding at January 1, 2006 . . . . . . . . . . . . . . . . . . . . . . . . . . . . 379,200 $ 9.63Exercised . . . . . . . . . . . . . . . . . . . . . . . . . . . . . . . . . . . . . . . . . . . . . (196,700) 4.35 $7,843
Surrendered upon exercise of SARs . . . . . . . . . . . . . . . . . . . . . . . . . (50,000) 44.375 $ 992
Outstanding at December 31, 2006 . . . . . . . . . . . . . . . . . . . . . . . . . 132,500 $ 4.35 4.90 $7,248
Exercisable at December 31, 2006 . . . . . . . . . . . . . . . . . . . . . . . . . . 132,500 $ 4.35 4.90 $7,248
We have neither granted nor modified any awards in 2006, 2005, or 2004. The total intrinsic value ofoptions exercised was $8 million for 2006, $1 million for 2005, and $3 million for 2004.
We recorded compensation costs of approximately $1 million during 2006 related to our $44.375 stockoptions. All of the 50,000 options outstanding to purchase shares of our common stock at $44.375 becameexercisable and fully vested on November 13, 2006. Upon vesting, the fair value of these options to purchase50,000 shares of our common stock was $1 million. At December 31, 2006, these options were no longeroutstanding as the related SARs were exercised in November 2006. We paid approximately $100 thousandduring 2006 for the exercise of related SARs. We recognized a tax benefit on the $4.35 options of $1.5 millionfor 2006. At December 31, 2006, there was no unrecognized compensation cost.
Prior to January 1, 2006, we used the intrinsic value method to account for our stock option plan.Accordingly, we recognized no compensation cost in 2005 or 2004. See “Stock-Based Compensation” of Note 1of the Notes to Consolidated Financial Statements for pro forma net income and earnings per share as if we hadapplied the fair-value method of accounting.
16. Financial Instruments
Fair Value—We determine the fair value of our outstanding financial instruments as follows:
Cash and Cash Equivalents—The carrying value approximates fair value.
Restricted Cash—The carrying value approximates fair value.
Investments in Marketable Securities—The carrying value approximates the fair value. See Note 23 ofthe Notes to Consolidated Financial Statements.
Long-Term Debt—We estimate the fair value of our long-term debt based on current rates available tous for debt of the same remaining duration.
Foreign Currency Forward Contracts—We record foreign currency forward contracts at fair value inour consolidated balance sheet. The fair value is based on published forward rates. We include theunrealized gains and losses, net of tax, as a component of shareholders’ equity in accumulated othercomprehensive loss.
63

Notes to Consolidated Financial Statements—Continued
(tabular amounts in thousands, except per-share amounts)
The estimated fair values of our financial instruments are:
2006 2005
CarryingAmount Fair Value
CarryingAmount Fair Value
Cash and cash equivalents . . . . . . . . . . . . . . . . . . . . . . . . . . . . . $ 60,300 $ 60,300 $ 56,413 $ 56,413Restricted cash . . . . . . . . . . . . . . . . . . . . . . . . . . . . . . . . . . . . . . $ 240 $ 240 $ 1,419 $ 1,419Investments in marketable securities . . . . . . . . . . . . . . . . . . . . . $ — $ — $ 136 $ 136Long-term debt, including current maturities . . . . . . . . . . . . . . $(153,439) $(153,439) $(153,829) $(151,882)Foreign currency forward contracts liability . . . . . . . . . . . . . . . $ (207) $ (207) $ — $ —
Derivatives—As part of our strategy to minimize the fluctuation of accounts receivable denominated inforeign currencies, we sometimes use foreign currency forward contracts.
During 2006, NewMarket entered into $15 million of Euro-denominated forward contracts to minimizecurrency exposure from expected cash flows from foreign operations. Some of the contracts matured in 2006.The remaining contracts mature in 2007.
During 2004, we entered into derivative instruments with maturity dates throughout 2005 to hedge theforeign currency exposure of approximately $26 million of Euro-denominated intercompany sales in 2005.
Both the 2006 and 2004 derivative instruments were cash flow hedges and were highly effective since aforeign currency rate change that impacts the value of the forward contract was offset by a corresponding changein the value of the hedged Euro-denominated transaction.
NewMarket had Euro-denominated foreign currency forward contracts outstanding of $6 million atDecember 31, 2006 and recorded unrealized losses of $129 thousand, net of tax, in accumulated othercomprehensive loss on these forward contracts. There were no forward contracts outstanding at December 31,2005.
During 2006, we recognized a $60 thousand loss on the 2006 contracts at the maturity dates. During 2005,we recognized a $1 million gain on the 2004 contracts as these contracts matured in 2005. A correspondingchange in the U.S. Dollar value of the Euro-denominated transaction offset the loss in 2006 and the gain in 2005.NewMarket includes foreign currency transaction gains and losses in cost of sales.
17. Contractual Commitments and Contingencies
Contractual Commitments—NewMarket has operating lease agreements primarily for office space,transportation equipment, and storage facilities. Rental expense was $18 million in both 2006 and 2005, and $20million in 2004.
Future lease payments for all noncancelable operating leases as of December 31, 2006 are:
• 2007 . . . . . . . . . . . . $ 9 million
• 2008 . . . . . . . . . . . . $ 7 million
• 2009 . . . . . . . . . . . . $ 6 million
• 2010 . . . . . . . . . . . . $ 4 million
• 2011 . . . . . . . . . . . . $ 3 million
• After 2011 . . . . . . . . $ 13 million
64

Notes to Consolidated Financial Statements—Continued
(tabular amounts in thousands, except per-share amounts)
Future minimum lease payments in excess of the capital lease debt obligation as of December 31, 2006amount to approximately $1 million for each year through 2010 and $200 thousand in 2011. We have contractualobligations for the construction of assets, as well as purchases of property and equipment of approximately $3million at December 31, 2006.
Under the TEL marketing agreements, we are required to provide approximately one-third of the cost ofproduct sold to customers in the territory from our TEL inventory or post an equivalent dollar value deposit withInnospec. The approximate requirement is $12 million at year-end 2006 and $13 million at year-end 2005. Wenow cover this requirement of the marketing agreements through the value of a working capital advance duefrom Innospec. This advance is being repaid to Ethyl as the requirement decreases and will be paid in full at theend of the agreements. These amounts have been recorded in other assets and deferred charges. See Note 9 of theNotes to Consolidated Financial Statements.
Litigation—We are involved in legal proceedings that are incidental to our business and includeadministrative or judicial actions seeking remediation under environmental laws, such as Superfund. Some ofthese legal proceedings relate to environmental matters and involve governmental authorities. For furtherinformation see “Environmental” below.
While it is not possible to predict or determine with certainty the outcome of any legal proceeding, webelieve the outcome of any of these proceedings, or all of them combined, will not result in a material adverseeffect on our consolidated financial condition or results of operations.
Innospec Inc.
On August 16, 2006, Ethyl filed a request for arbitration against a subsidiary of Innospec. This arbitration isrelated to a long-standing supply agreement that requires the Innospec subsidiary to supply Ethyl with TEL forresale by Ethyl in the United States (the U.S. Supply Agreement). The request was filed pursuant to the rules ofthe London Court of International Arbitration. Ethyl filed this request because it believes that Innospec hasviolated the U.S. Supply Agreement by attempting to increase the price it charges Ethyl for TEL in the UnitedStates in a manner not in accordance with the contract. As such, we have not recorded an accrual of these costs.The difference in prices that Innospec is claiming is approximately $1.7 million for product supplied throughSeptember 30, 2006 and would amount to approximately an additional $1 million if the same factors wereapplied to TEL supplied in the fourth quarter 2006. We have placed $1.7 million for product supplied throughSeptember 30, 2006 in an escrow account pending resolution of the arbitration. We are confident in our positionand believe we will prevail. Regardless of the outcome, we do not believe the TEL dispute will have a materialeffect on our financial condition, results of operations, or cash flows. However, with TEL segment operatingprofit at such a low level, a relatively small increase in cost may be material to TEL segment results.
After the commencement of the above arbitration, Ethyl received three requests for arbitration filed by threesubsidiaries of Innospec. The Innospec requests were filed on October 2, 2006, pursuant to the rules of theLondon Court of International Arbitration and allegedly pursuant to long-standing marketing and supplyagreements between Ethyl or its subsidiaries and subsidiaries of Innospec for the sale of TEL outside of theUnited States. Innospec is claiming the right to terminate the agreements and is seeking damages. Although thesemarketing and supply agreements relate only to TEL, Innospec contends that the agreements impose certainduties that were breached by the sales and marketing of MMT in Iraq and South Africa by affiliates of Ethyl.Ethyl will vigorously defend the cases and believes it will ultimately prevail in these arbitrations. Therefore, noaccrual has been recorded.
65

Notes to Consolidated Financial Statements—Continued
(tabular amounts in thousands, except per-share amounts)
Infineum International Ltd. and Infineum USA L.P.
In December 2005, Afton was sued by a competitor, Infineum International Ltd. and Infineum USA L.P.,(Infineum) in federal court in Delaware. The suit alleged patent infringement of one patent in connection withsome lubricant additive packages. Infineum and Afton have entered into an agreement to resolve Infineum’sclaims against Afton’s products and to effect settlement of the patent infringement suit. The lawsuit has beendismissed.
TEL
Legal proceedings include certain product liability cases. The only product liability cases of potentialconsequence in which we are involved are TEL-related. In one case, Ethyl was served as a defendant in a casefiled in the Circuit Court for Baltimore City, Maryland, in September 1999. The plaintiff in Smith, et al. v. LeadIndustries Association, Inc., et al., alleged personal injuries for seven children from lead exposure arising fromlead paint and dust from tailpipe emissions due to leaded gasoline. The court dismissed Ethyl and some otherdefendants from the case in February 2002 and granted summary judgment to other defendants in November2002. However, a series of appellate and trial court decisions have the effect that an appeal remains pendingagainst other defendants. It is our current belief that these proceedings will not have a material impact on ourconsolidated financial condition or results of operations.
Asbestos
Like many other companies, we are also a defendant in personal injury lawsuits involving exposure toasbestos. These cases involve exposure to asbestos in premises owned or operated, or formerly owned or operated,by subsidiaries of NewMarket. We have never manufactured, sold, or distributed products that containasbestos. Nearly all of these cases are pending in Texas, Louisiana, or Illinois and involve multiple defendants. Wemaintain an accrual for these proceedings, as well as a receivable for expected insurance recoveries.
During 2005, we entered into an agreement with Travelers resolving certain long-standing issues regardingour coverage for certain premises asbestos claims. In addition, our agreement with Travelers provides aprocedure for allocating defense and indemnity costs with respect to certain future premises asbestos claims. Thelawsuit we had previously filed against Travelers in the Southern District of Texas was dismissed.
We also settled our outstanding receivable from Albemarle for certain premises asbestos liabilityobligations. As a result of the insurance settlement described above, the outstanding amount owed to us byAlbemarle was adjusted to $1.4 million, compared to $4 million at year-end 2004. Albemarle paid us $1.4million in the third quarter of 2005.
These settlements resulted in an aggregate gain of $3.9 million which is included as a special item for2005. The net gain represents amounts paid to us to settle historical claims in excess of the receivables we carriedon our financial statements from both Travelers and Albemarle in the aggregate.
The accrual for our premises asbestos liability related to currently asserted claims is based on the followingassumptions and factors:
• We are often one of many defendants. This factor influences both the number of claims settled against usand also the indemnity cost associated with such resolutions.
• The estimated percent of claimants in each case that will actually, after discovery, make a claim againstus, out of the total number of claimants in a case, is based on a level consistent with past experience andcurrent trends.
66

Notes to Consolidated Financial Statements—Continued
(tabular amounts in thousands, except per-share amounts)
• We utilize average comparable plaintiff cost history as the basis for estimating pending premises asbestosrelated claims. These claims are filed by both former contractors’ employees, and former employees whoworked at past and present company locations. We also include an estimated inflation factor in thecalculation.
• No estimate is made for unasserted claims.
• The estimated recoveries from insurance and Albemarle for these cases are based on, and are consistentwith, the 2005 settlement agreements.
Based on the above assumptions, we have provided an undiscounted liability related to premises asbestosclaims of $12 million at year-end 2006 and $10 million at year-end 2005. The liabilities related to asbestosclaims are included in accrued expenses (current portion) and other noncurrent liabilities on the balancesheet. Certain of these costs are recovered through our insurance coverage and agreement with Albemarle. Thereceivable for these recoveries related to premises asbestos liabilities was $9 million at December 31, 2006 and$8 million at December 31, 2005. These receivables are included in trade and other accounts receivable for thecurrent portion. The noncurrent portion is included in other assets and deferred charges.
Environmental—During 2000, the EPA named us as a PRP under Superfund law for the clean-up of soiland groundwater contamination at the Sauget Area 2 Site in Sauget, Illinois. Without admitting any fact,responsibility, fault, or liability in connection with this site, we are participating with other PRPs in siteinvestigations and feasibility studies.
The Sauget Area 2 Site PRPs submitted a Remedial Investigation and Feasibility Study (RI/FS) to the EPAin early 2004. We have accrued our estimated proportional share of the expenses for the RI/FS. We also accruedour best estimate of our proportional share of the remediation liability proposed in that submission. The EPA didnot accept the RI/FS. Through a series of submissions and meetings, the scope of the RI/FS has changed so that itis now scheduled to be submitted to the EPA in late 2007. The RI/FS work is ongoing and we believe it is not at astage where any further conclusion can be drawn as to the remediation liability we may incur. We do not believethere is any additional information available as a basis for revision of the liability that we have established. Theamount accrued for this site is not material.
At a former TEL plant site located in the state of Louisiana, we have substantially completed environmentalremediation and will be monitoring the site for an extended period. The accrual for this site was $9 million atboth year-end 2006 and year-end 2005. We based these amounts on the best estimate of future costs discounted atapproximately 3% in both 2006 and 2005. We incorporated an inflation factor in determining the discount rate.The remaining environmental liabilities are not discounted. At a plant site in Houston, Texas, we have an accrualof $7 million for environmental remediation, dismantling, and decontamination at December 31, 2006 and $8million at December 31, 2005. Included in this amount is $3 million at both year-end 2006 and year-end 2005 forsite remediation.
We accrue for environmental remediation and monitoring activities for which costs can be reasonablyestimated and are probable. These estimates are based on an assessment of the site, available clean-up methods,and prior experience in handling remediation. While we believe we are currently fully accrued for knownenvironmental issues, it is possible that unexpected future costs could have a significant impact on our financialposition and results of operations.
At December 31, our total accruals for environmental remediation were $19 million for 2006 and $23million for 2005. In addition to the accruals for environmental remediation, we also have accruals for dismantling
67

Notes to Consolidated Financial Statements—Continued
(tabular amounts in thousands, except per-share amounts)
and decommissioning costs of $3 million at December 31, 2006 and $7 million at December 31, 2005. Thedecrease in these amounts between 2006 and 2005 primarily reflects the dismantling of our TEL facility inCanada.
During 2004, we reached a $16 million environmental insurance settlement resulting in the collection ofinsurance reimbursements. The gain on this settlement amounted to $13 million and is reflected in theConsolidated Statements of Income under the caption “Special item income.” We received $8 million during2004. We received $4 million in 2005 and received the remaining $4 million in February 2006 in accordancewith a previously agreed-upon payment schedule.
NewMarket spent $16 million in 2006, $13 million in 2005, and $14 million in 2004 for ongoingenvironmental operating and clean-up costs, excluding depreciation of previously capitalized expenditures. Oncapital expenditures for pollution prevention and safety projects, we spent $6 million in 2006, $5 million in 2005,and $4 million in 2004.
18. Pension Plans and Other Postretirement Benefits
NewMarket adopted Statement of Financial Accounting Standards No. 158, “Employers’ Accounting forDefined Benefit Pension and Other Postretirement Plans” (SFAS No. 158) as of December 31, 2006. Thisstandard requires an employer that is a business entity that sponsors one or more single employer benefit plans to(a) recognize the funded status (defined as the difference between the fair value of plan assets and the benefitobligation) of a benefit plan in the statement of financial position; (b) recognize as a component of othercomprehensive income, net of tax, the gains or losses and prior service costs or credits that arise during theperiod but are not recognized as components of net periodic benefit cost; (c) measure defined benefit plan assetsand obligations as of the date of the employer’s fiscal year end; and (d) disclose in the notes to the financialstatements additional information about certain effects on net periodic benefit cost for the next fiscal year thatarise from delayed recognition of the gains or losses, prior service costs or credits, and transition asset orobligation.
Information presented below for 2006 has been conformed to the disclosure provisions of SFAS No. 158. Inaccordance with SFAS No. 158, the disclosures for 2005 and 2004 have not been modified from those previouslyreported.
NewMarket uses a December 31 measurement date for all of our plans.
U.S. Retirement Plans
NewMarket sponsors pension plans for most U.S. employees that offer a benefit based primarily on years ofservice and compensation. Employees do not contribute to these pension plans.
In addition, we offer unfunded, nonqualified supplemental pension plans. These plans restore the pensionbenefits from our regular pension plans that would have been payable to designated participants if it were not forlimitations imposed by U.S. federal income tax regulations.
We also provide postretirement health care benefits and life insurance to eligible retired employees.NewMarket and retirees share in the cost of postretirement health care benefits. NewMarket pays the premiumfor the insurance contract that holds plan assets for retiree life insurance benefits.
68

Notes to Consolidated Financial Statements—Continued
(tabular amounts in thousands, except per-share amounts)
Pension and postretirement benefit costs are shown below.
Years Ended December 31
Pension Benefits Postretirement Benefits
2006 2005 2004 2006 2005 2004
Net periodic benefit costService cost . . . . . . . . . . . . . . . . . . . . . . . . . . . . . . . . $ 4,946 $ 5,277 $ 4,842 $ 1,524 $ 1,453 $ 1,259Interest cost . . . . . . . . . . . . . . . . . . . . . . . . . . . . . . . . 6,177 5,998 5,561 3,891 3,817 3,808Expected return on plan assets . . . . . . . . . . . . . . . . . (6,183) (5,922) (5,639) (1,882) (1,907) (1,904)Amortization of prior service cost . . . . . . . . . . . . . . . 288 690 758 (21) (21) (29)Amortization of net loss . . . . . . . . . . . . . . . . . . . . . . 2,324 2,011 1,499 — — —
Net periodic benefit cost . . . . . . . . . . . . . . . . . . . . . . $ 7,552 $ 8,054 $ 7,021 $ 3,512 $ 3,342 $ 3,134
The estimated net loss which will be amortized from accumulated other comprehensive loss into netperiodic benefit cost during 2007 is expected to be $2 million for pension plans. The estimated prior service costwhich will be amortized from accumulated other comprehensive loss into net periodic benefit cost during 2007 isexpected to be $30 thousand for pension plans and $20 thousand for postretirement benefit plans.
Changes in the plans’ benefit obligations and assets, as well as a reconciliation of the funded status atDecember 31, 2005, follow. The plan amendments of $5 million in 2006 reflect the amendment to our domesticsalaried pension plan. The amendment changes the factors for determining early retirement benefits so that theearly retirement benefit payable at all ages is actuarially equivalent to the normal retirement benefit payable atage 65. Previously, the early retirement factors resulted in a more favorable retirement benefit at ages prior to 65.The amendment was effective August 1, 2006.
69

Notes to Consolidated Financial Statements—Continued
(tabular amounts in thousands, except per-share amounts)
Years Ended December 31
Pension Benefits Postretirement Benefits
2006 2005 2006 2005
Change in benefit obligationBenefit obligation at beginning of year . . . . . . . . . . . . . . . . . . . . . . $115,634 $104,851 $ 72,314 $ 67,101Service cost . . . . . . . . . . . . . . . . . . . . . . . . . . . . . . . . . . . . . . . . . . . . 4,946 5,277 1,524 1,453Interest cost . . . . . . . . . . . . . . . . . . . . . . . . . . . . . . . . . . . . . . . . . . . . 6,177 5,998 3,891 3,817Plan amendments . . . . . . . . . . . . . . . . . . . . . . . . . . . . . . . . . . . . . . . (5,072) — — 87Actuarial net (gain) loss . . . . . . . . . . . . . . . . . . . . . . . . . . . . . . . . . . (6,789) 4,083 (2,740) 4,094Benefits paid . . . . . . . . . . . . . . . . . . . . . . . . . . . . . . . . . . . . . . . . . . . (4,436) (4,575) (4,047) (4,238)
Benefit obligation at end of year . . . . . . . . . . . . . . . . . . . . . . . . . . . $110,460 $115,634 $ 70,942 $ 72,314
Change in plan assetsFair value of plan assets at beginning of year . . . . . . . . . . . . . . . . . $ 64,366 $ 58,786 $ 28,079 $ 28,436Actual return on plan assets . . . . . . . . . . . . . . . . . . . . . . . . . . . . . . . 9,150 1,454 1,780 1,567Employer contributions . . . . . . . . . . . . . . . . . . . . . . . . . . . . . . . . . . 7,522 8,701 2,278 2,314Benefits paid . . . . . . . . . . . . . . . . . . . . . . . . . . . . . . . . . . . . . . . . . . . (4,436) (4,575) (4,047) (4,238)
Fair value of plan assets at end of year . . . . . . . . . . . . . . . . . . . . . . . $ 76,602 $ 64,366 $ 28,090 $ 28,079
Funded status . . . . . . . . . . . . . . . . . . . . . . . . . . . . . . . . . . . . . . . . . . $ (33,858) $ (51,268) $(42,852) $(44,235)
Amounts recognized in the consolidated balance sheet atDecember 31, 2006
Current liabilities . . . . . . . . . . . . . . . . . . . . . . . . . . . . . . . . . . . . . . . $ (2,512) $ (2,341)Noncurrent liabilities . . . . . . . . . . . . . . . . . . . . . . . . . . . . . . . . . . . . (31,346) (40,511)
$ (33,858) $(42,852)
Amounts recognized in accumulated other comprehensive lossat December 31, 2006
Net actuarial loss . . . . . . . . . . . . . . . . . . . . . . . . . . . . . . . . . . . . . . . $ 37,152 $ 3,218Prior service cost . . . . . . . . . . . . . . . . . . . . . . . . . . . . . . . . . . . . . . . (1,703) 43
$ 35,449 $ 3,261
Reconciliation of funded statusFunded Status . . . . . . . . . . . . . . . . . . . . . . . . . . . . . . . . . . . . . . . . . . $ (51,268) $(44,235)Unrecognized net actuarial loss . . . . . . . . . . . . . . . . . . . . . . . . . . . . 49,233 5,857Unrecognized prior service cost . . . . . . . . . . . . . . . . . . . . . . . . . . . . 3,657 22
Prepaid (accrued) benefit cost . . . . . . . . . . . . . . . . . . . . . . . . . . . . . $ 1,622 $(38,356)
Amounts recognized in the consolidated balance sheet atDecember 31, 2005
Prepaid benefit cost . . . . . . . . . . . . . . . . . . . . . . . . . . . . . . . . . . . . . $ 16,233 $ —Accrued benefit cost . . . . . . . . . . . . . . . . . . . . . . . . . . . . . . . . . . . . . (31,395) (38,356)Intangible asset . . . . . . . . . . . . . . . . . . . . . . . . . . . . . . . . . . . . . . . . . 2,271 —Accumulated other comprehensive loss . . . . . . . . . . . . . . . . . . . . . . 14,513 —
Net amount recognized . . . . . . . . . . . . . . . . . . . . . . . . . . . . . . . . . . . $ 1,622 $(38,356)
The change in the minimum pension liability included in other comprehensive loss was an increase of $5million in 2005.
70

Notes to Consolidated Financial Statements—Continued
(tabular amounts in thousands, except per-share amounts)
The accumulated benefit obligation for all domestic defined benefit pension plans was $93 million atDecember 31, 2006 and $92 million at December 31, 2005.
The fair market value of the plan assets of our largest domestic pension plan (the salaried plan) exceeded itsaccumulated benefit obligation at both December 31, 2006 and December 31, 2005. The projected benefitobligation of the salaried plan exceeded the fair market value of assets for both years. The net liability position ofthis plan in 2006 is included in other noncurrent liabilities on the balance sheet. The net asset position of this planin 2005 is included in prepaid pension cost on the balance sheet.
The accumulated benefit obligation and projected benefit obligation exceeded the fair market value of planassets for all of the other domestic qualified plans, as well as the nonqualified plan at December 31, 2006 andDecember 31, 2005. The accrued benefit cost of these plans is included in other noncurrent liabilities on thebalance sheet for both years and includes minimum pension liabilities of $17 million at year-end 2005. A portionof the accrued benefit cost for the nonqualified plan is included in current liabilities at December 31, 2006. Asthe nonqualified plan is unfunded, the amount reflected in current liabilities represents the expected benefitpayments related to the nonqualified plan for 2007. Prior to the implementation of SFAS No. 158, the minimumpension liability included in noncurrent liabilities for 2006 was $13 million.
The following table shows information on domestic plans with the accumulated benefit obligation in excessof plan assets. The second table presents information on domestic plans with the projected benefit obligation inexcess of plan assets.
2006 2005
Plans with the accumulated benefit obligationin excess of the fair market value of plan assets
Projected benefit obligation . . . . . . . . . . . . . . . . . . . . . . . . . . . . . . . . . . . . . . . . . . . . . $ 49,929 $ 51,436Accumulated benefit obligation . . . . . . . . . . . . . . . . . . . . . . . . . . . . . . . . . . . . . . . . . . 48,736 49,283Fair market value of plan assets . . . . . . . . . . . . . . . . . . . . . . . . . . . . . . . . . . . . . . . . . . 22,507 18,445
2006 2005
Plans with the projected benefit obligationin excess of the fair market value of plan assets
Projected benefit obligation . . . . . . . . . . . . . . . . . . . . . . . . . . . . . . . . . . . . . . . . . . . . . $110,460 $115,634Fair market value of plan assets . . . . . . . . . . . . . . . . . . . . . . . . . . . . . . . . . . . . . . . . . . 76,602 64,366
While there were no assets held in the nonqualified plan by the trustee, we had maintained a rabbi trust forthe retired beneficiaries of the nonqualified plan. The trust was terminated at the end of 2005. At December 31,2005, assets in the rabbi trust were valued at $100 thousand. There were no assets in the rabbi trust atDecember 31, 2006. The assets of the rabbi trust are not included in any of the pension tables above. Since thetermination of the rabbi trust, payments to retired beneficiaries of the nonqualified plan are being made with cashfrom operations.
71

Notes to Consolidated Financial Statements—Continued
(tabular amounts in thousands, except per-share amounts)
Assumptions—We used the following assumptions to calculate the results of our retirement plans:
Pension Benefits Postretirement Benefits
2006 2005 2004 2006 2005 2004
Weighted-average assumptionsused to determine net periodicbenefit cost for years ended December 31
Discount rate . . . . . . . . . . . . . . . . . . . . . . . . . . . . . . . . . . . 5.50% 5.75% 6.00% 5.50% 5.75% 6.00%Expected long-term rate of return on plan assets . . . . . . . 8.75% 9.00% 9.00% 7.00% 7.00% 7.00%Rate of projected compensation increase . . . . . . . . . . . . . 3.75% 4.00% 4.00% — — —
Weighted-average assumptionsused to determine benefitobligations at December 31
Discount rate . . . . . . . . . . . . . . . . . . . . . . . . . . . . . . . . . . . 5.875% 5.50% 5.75% 5.875% 5.50% 5.75%Rate of projected compensation increase . . . . . . . . . . . . . 3.75% 3.75% 4.00% — — —
We base the assumed expected long-term rate of return for plan assets on an analysis of our actualinvestments, including our asset allocation, as well as a stochastic analysis of expected returns. This analysisreflects the expected long-term rates of return for each significant asset class and economic indicator. As ofJanuary 1, 2007, the expected rates were 9.1% for U.S. large cap stocks, 6.3% for U.S. long-term corporatebonds, and 2.7% for inflation. The range of returns developed relies both on forecasts and on broad-markethistorical benchmarks for expected return, correlation, and volatility for each asset class. While our assetallocation is predominantly weighted towards equities, a review of our investments at the end of 2005 indicated aslightly lower expected long-term rate of return than we have had in years prior to 2006. Accordingly, wereduced the rate by 25 basis points to 8.75% for 2006. We expect to maintain an 8.75% rate for 2007.
We utilize the Citigroup Pension Discount Curve (discount curve) and Liability Index in developing thediscount rate assumption. We apply the expected cash flows of the specific defined benefit retirement plan to theinterest rates provided in the discount curve. The rate is developed based on the discount curve on the last day ofDecember.
Assumed health care cost trend rates at December 31 are shown in the table below. The expected health carecost trend rate for 2006 was 8.5% which was the actual rate that was used to develop the postretirement medicalexpense.
2006 2005
Health care cost trend rate assumed for next year . . . . . . . . . . . . . . . . . . . . . . . . . . . . . . . . . . . . . . 8.0% 8.5%Rate to which the cost trend rate is assumed to decline (the ultimate trend rate) . . . . . . . . . . . . . . 5.5% 5.5%Year that the rate reaches the ultimate trend rate . . . . . . . . . . . . . . . . . . . . . . . . . . . . . . . . . . . . . . 2012 2012
A one-percentage point change in the assumed health care cost trend rate would have the following effects.
1%Increase
1%Decrease
Effect on accumulated postretirement benefit obligation as of December 31, 2006 . . . . . . . . . $8,234 $(6,575)Effect on net periodic postretirement benefit cost in 2006 . . . . . . . . . . . . . . . . . . . . . . . . . . . . . 906 (696)
Plan Assets—Pension plan assets are held and distributed by trusts and consist principally of common stockand investment-grade fixed income securities. Our target allocation is 90% to 97% in equities and 3% to 10% in
72

Notes to Consolidated Financial Statements—Continued
(tabular amounts in thousands, except per-share amounts)
debt securities or cash. The pension plan weighted-average asset allocations at December 31, 2006 andDecember 31, 2005 by asset category follow.
2006 2005
Asset CategoryEquity securities . . . . . . . . . . . . . . . . . . . . . . . . . . . . . . . . . . . . . . . . . . . . . . . . . . . . . . . . . . . . . 94% 93%Debt securities . . . . . . . . . . . . . . . . . . . . . . . . . . . . . . . . . . . . . . . . . . . . . . . . . . . . . . . . . . . . . . 2% 6%Cash . . . . . . . . . . . . . . . . . . . . . . . . . . . . . . . . . . . . . . . . . . . . . . . . . . . . . . . . . . . . . . . . . . . . . . 4% 1%
100% 100%
The pension obligation is long-term in nature and the investment philosophy followed by the PensionInvestment Committee is likewise long-term in its approach. The majority of the pension funds are invested inequity securities as historically, equity securities have outperformed debt securities and cash investmentsresulting in a higher investment return over the long-term. While in the short-term, equity securities may under-perform other investment classes, we are less concerned with short-term results and more concerned with long-term improvement. The pension funds are managed by three different investment companies who predominatelyinvest in U.S. large cap stocks. Each investment company’s performance is reviewed quarterly. A small portionof the funds is in investments, such as cash or short-term bonds, which are less vulnerable to short-term marketswings. This fund is used to provide the cash needed to meet our monthly obligations.
The equity securities do not include any NewMarket common stock for any year presented.
The assets of the postretirement benefit plan are invested completely in an insurance contract held byMetropolitan Life. No NewMarket common stock is included in these assets.
Cash Flows—For U.S. plans, NewMarket expects to contribute $7 million to the pension plans and $2million to our other postretirement benefit plans in 2007. The expected benefit payments for the next ten yearsare as follows.
Expected PostretirementBenefit Payments
Expected PensionBenefit Payments
Before ExpectedMedicare
Part D BenefitExpected Medicare
Part D Benefit
2007 . . . . . . . . . . . . . . . . . . . . . . . . . . . . $ 5,034 $ 5,164 $ 4482008 . . . . . . . . . . . . . . . . . . . . . . . . . . . . 5,363 5,125 4552009 . . . . . . . . . . . . . . . . . . . . . . . . . . . . 5,747 5,094 4632010 . . . . . . . . . . . . . . . . . . . . . . . . . . . . 6,175 5,050 4702011 . . . . . . . . . . . . . . . . . . . . . . . . . . . . 6,528 4,935 4662012 through 2016 . . . . . . . . . . . . . . . . . 39,935 23,726 2,421
Foreign Retirement Plans
For most employees of our foreign subsidiaries, NewMarket has defined benefit pension plans that offerbenefits based primarily on years of service and compensation. These defined benefit plans provide benefits foremployees of our foreign subsidiaries located in Belgium, the United Kingdom, Germany, and Canada.NewMarket generally contributes to investment trusts and insurance policies to provide for these plans.
73

Notes to Consolidated Financial Statements—Continued
(tabular amounts in thousands, except per-share amounts)
In addition to the foreign defined benefit pension plans, NewMarket also provides retirement benefits inJapan and Brazil which are not defined benefit plans. The total pension expense for these plans was $100thousand for 2006, $200 thousand for 2005, and $100 thousand for 2004.
Our foreign subsidiary in Canada also sponsors a defined benefit postretirement plan. This postretirementplan provides certain health care benefits and life insurance to eligible retired employees. We pay the entirepremium for these benefits. During 2005, an actuarial valuation was initially prepared for this plan in accordancewith SFAS No. 106. This resulted in a transition obligation related to past years of $1.2 million, of which $700thousand was recognized in 2005. The remaining transition obligation is being amortized over ten years.
Pension and postretirement benefit costs for the foreign defined benefit plans are shown below.
Years Ended December 31
Pension BenefitsPostretirement
Benefits
2006 2005 2004 2006 2005
Net periodic benefit costService cost . . . . . . . . . . . . . . . . . . . . . . . . . . . . . . . . . . . . . . . . . . . . $ 2,833 $ 2,081 $ 1,593 $ 17 $ 11Interest cost . . . . . . . . . . . . . . . . . . . . . . . . . . . . . . . . . . . . . . . . . . . . 4,342 4,216 3,724 113 109Expected return on plan assets . . . . . . . . . . . . . . . . . . . . . . . . . . . . . . (3,958) (3,311) (2,999) — —Amortization of prior service cost . . . . . . . . . . . . . . . . . . . . . . . . . . . 131 316 312 — —Amortization of transition (asset) obligation . . . . . . . . . . . . . . . . . . . (35) (47) (42) 47 678Amortization of net loss . . . . . . . . . . . . . . . . . . . . . . . . . . . . . . . . . . . 1,512 1,508 1,064 73 45
Net periodic benefit cost . . . . . . . . . . . . . . . . . . . . . . . . . . . . . . . . . . $ 4,825 $ 4,763 $ 3,652 $250 $843
The estimated net loss which will be amortized from accumulated other comprehensive loss into netperiodic benefit cost during 2007 is expected to be $2 million for foreign pension plans and $60 thousand forforeign postretirement benefit plans. The estimated prior service cost which will be amortized from accumulatedother comprehensive loss into net periodic benefit cost during 2007 is expected to be $70 thousand for foreignpension plans. The estimated unrecognized transition asset which is expected to be amortized from accumulatedother comprehensive loss into net periodic benefit cost during 2007 is expected to be $30 thousand income forforeign pension plans. The estimated unrecognized transition obligation which is expected to be amortized fromaccumulated other comprehensive loss into net periodic benefit cost during 2007 is expected to be $50 thousandexpense for postretirement benefit plans.
Changes in the benefit obligations and assets, as well as a reconciliation of the funded status atDecember 31, 2005, of the foreign defined benefit plans follow. The plan amendments of $4 million in 2006primarily reflect a change to our United Kingdom pension plan modifying the amount of lump sum cashsettlements allowed at retirement.
74

Notes to Consolidated Financial Statements—Continued
(tabular amounts in thousands, except per-share amounts)
Years Ended December 31
Pension BenefitsPostretirement
Benefits
2006 2005 2006 2005
Change in benefit obligationBenefit obligation at beginning of year . . . . . . . . . . . . . . . . . . . . . . . . . $ 89,652 $ 85,383 $ 2,231 $ 1,864Service cost . . . . . . . . . . . . . . . . . . . . . . . . . . . . . . . . . . . . . . . . . . . . . . . 2,833 2,081 17 11Interest cost . . . . . . . . . . . . . . . . . . . . . . . . . . . . . . . . . . . . . . . . . . . . . . . 4,342 4,216 113 109Plan amendments . . . . . . . . . . . . . . . . . . . . . . . . . . . . . . . . . . . . . . . . . . (3,763) — — —Employee contributions . . . . . . . . . . . . . . . . . . . . . . . . . . . . . . . . . . . . . 469 414 — —Actuarial net loss . . . . . . . . . . . . . . . . . . . . . . . . . . . . . . . . . . . . . . . . . . 498 8,862 — 258Benefits paid . . . . . . . . . . . . . . . . . . . . . . . . . . . . . . . . . . . . . . . . . . . . . . (3,188) (2,365) (97) (88)Foreign currency translation . . . . . . . . . . . . . . . . . . . . . . . . . . . . . . . . . . 10,633 (8,939) 9 77
Benefit obligation at end of year . . . . . . . . . . . . . . . . . . . . . . . . . . . . . . . $101,476 $ 89,652 $ 2,273 $ 2,231
Change in plan assetsFair value of plan assets at beginning of year . . . . . . . . . . . . . . . . . . . . . $ 65,035 $ 56,528 $ — $ —Actual return on plan assets . . . . . . . . . . . . . . . . . . . . . . . . . . . . . . . . . . 3,952 9,687 — —Employer contributions . . . . . . . . . . . . . . . . . . . . . . . . . . . . . . . . . . . . . . 10,387 6,186 98 88Employee contributions . . . . . . . . . . . . . . . . . . . . . . . . . . . . . . . . . . . . . 469 414 — —Benefits paid . . . . . . . . . . . . . . . . . . . . . . . . . . . . . . . . . . . . . . . . . . . . . . (3,188) (2,035) (98) (88)Foreign currency translation . . . . . . . . . . . . . . . . . . . . . . . . . . . . . . . . . . 8,342 (5,745) — —
Fair value of plan assets at end of year . . . . . . . . . . . . . . . . . . . . . . . . . . $ 84,997 $ 65,035 $ — $ —
Funded Status . . . . . . . . . . . . . . . . . . . . . . . . . . . . . . . . . . . . . . . . . . . . . $ (16,479) $(24,617) $(2,273) $(2,231)
Amounts recognized in the consolidated balance sheet atDecember 31, 2006
Noncurrent assets . . . . . . . . . . . . . . . . . . . . . . . . . . . . . . . . . . . . . . . . . . $ 85 $ —Current liabilities . . . . . . . . . . . . . . . . . . . . . . . . . . . . . . . . . . . . . . . . . . (357) (103)Noncurrent liabilities . . . . . . . . . . . . . . . . . . . . . . . . . . . . . . . . . . . . . . . (16,207) (2,170)
$ (16,479) $(2,273)
Amounts recognized in accumulated other comprehensive loss atDecember 31, 2006
Net loss . . . . . . . . . . . . . . . . . . . . . . . . . . . . . . . . . . . . . . . . . . . . . . . . . . $ 32,441 $ 789Prior service cost . . . . . . . . . . . . . . . . . . . . . . . . . . . . . . . . . . . . . . . . . . . (2,100) —Transition (asset) obligation . . . . . . . . . . . . . . . . . . . . . . . . . . . . . . . . . . (135) 536
$ 30,206 $ 1,325
Reconciliation of funded statusFunded status . . . . . . . . . . . . . . . . . . . . . . . . . . . . . . . . . . . . . . . . . . . . . $(24,617) $(2,231)Unrecognized net actuarial loss . . . . . . . . . . . . . . . . . . . . . . . . . . . . . . . 29,908 865Unrecognized prior service cost . . . . . . . . . . . . . . . . . . . . . . . . . . . . . . . 1,857 —Unrecognized transition (asset) obligation . . . . . . . . . . . . . . . . . . . . . . . (168) 579
Prepaid (accrued) benefit cost . . . . . . . . . . . . . . . . . . . . . . . . . . . . . . . . . $ 6,980 $ (787)
Amounts recognized in the consolidated balance sheetPrepaid benefit cost . . . . . . . . . . . . . . . . . . . . . . . . . . . . . . . . . . . . . . . . . $ 2,083 $ —Accrued benefit cost . . . . . . . . . . . . . . . . . . . . . . . . . . . . . . . . . . . . . . . . (11,130) (787)Intangible asset . . . . . . . . . . . . . . . . . . . . . . . . . . . . . . . . . . . . . . . . . . . . 1,598 —Accumulated other comprehensive loss . . . . . . . . . . . . . . . . . . . . . . . . . 14,429 —
Net amount recognized . . . . . . . . . . . . . . . . . . . . . . . . . . . . . . . . . . . . . . $ 6,980 $ (787)
75

Notes to Consolidated Financial Statements—Continued
(tabular amounts in thousands, except per-share amounts)
The change in the minimum pension liability included in other comprehensive loss was a decrease of $3million in 2005.
The accumulated benefit obligation for all foreign defined benefit pension plans was $85 million atDecember 31, 2006 and $75 million at December 31, 2005.
The fair market value of plan assets exceeded both the accumulated benefit obligation and projected benefitobligation for the Canadian Hourly plan at year-end 2006 and 2005. For the Canadian Salary plan, the fair marketvalue of plan assets exceeded the accumulated benefit obligation, but not the projected benefit obligation, for theyear-ended 2005. For the United Kingdom plan, the fair market value of plan assets exceeded the accumulatedbenefit obligation, but not the projected benefit obligation, for the year-ended 2006. The net asset position of theCanadian Hourly plan is included in prepaid pension cost on the balance sheet for both years. The net liabilityposition in 2006 of the Canadian Salary plan and the United Kingdom plan is included in noncurrent liabilities.The net asset position of the Canadian Salary plan in 2005 is included in prepaid pension cost on the balancesheet.
The accumulated benefit obligation and projected benefit obligation exceeded the fair market value of planassets for the Belgium and German plans at December 31, 2006 and December 31, 2005, as well as for theCanadian Salary plan at December 31, 2006 and the United Kingdom plan at December 31, 2005. The Germanplan has no assets. The accrued benefit cost of these plans is included in other noncurrent liabilities on thebalance sheet. As the German plan is unfunded, a portion of the accrued benefit cost for the German plan isincluded in current liabilities at year-end 2006 reflecting the expected benefit payments related to the plan for2007. The accrued benefit cost includes minimum pension liabilities of $16 million at year-end 2005. Prior to theimplementation of SFAS No. 158, the minimum pension liability included in noncurrent liabilities for 2006 was$3 million.
The following table shows information on foreign plans with the accumulated benefit obligation in excess ofplan assets. The second table shows information on plans with the projected benefit obligation in excess of planassets.
2006 2005
Plans with the accumulated benefit obligationin excess of the fair market value of plan assets
Projected benefit obligation . . . . . . . . . . . . . . . . . . . . . . . . . . . . . . . . . . . . . . . . . . . . . . . $25,712 $81,851Accumulated benefit obligation . . . . . . . . . . . . . . . . . . . . . . . . . . . . . . . . . . . . . . . . . . . . 21,696 68,320Fair market value of plan assets . . . . . . . . . . . . . . . . . . . . . . . . . . . . . . . . . . . . . . . . . . . . 13,774 57,189
2006 2005
Plans with the projected benefit obligationin excess of the fair market value of plan assets
Projected benefit obligation . . . . . . . . . . . . . . . . . . . . . . . . . . . . . . . . . . . . . . . . . . . . . . . $99,188 $87,583Fair market value of plan assets . . . . . . . . . . . . . . . . . . . . . . . . . . . . . . . . . . . . . . . . . . . . 82,625 62,920
76

Notes to Consolidated Financial Statements—Continued
(tabular amounts in thousands, except per-share amounts)
Assumptions—The information in the table below provides the weighted-average assumptions used tocalculate the results of our foreign defined benefit plans.
Pension BenefitsPostretirement
Benefits
2006 2005 2004 2006 2005
Weighted-average assumptionsused to determine net periodicbenefit cost for the yearsended December 31
Discount rate . . . . . . . . . . . . . . . . . . . . . . . . . . . . . . . . . . . . . . . . . . . . 4.60% 5.25% 5.53% 6.00% 6.00%Expected long-term rate of return on plan assets . . . . . . . . . . . . . . . . . 5.58% 6.19% 6.60% — —Rate of projected compensation increase . . . . . . . . . . . . . . . . . . . . . . . 4.30% 4.44% 4.38% — —
Weighted-average assumptionsused to determine benefitobligations at December 31
Discount rate . . . . . . . . . . . . . . . . . . . . . . . . . . . . . . . . . . . . . . . . . . . . 4.94% 4.60% 5.25% 5.00% 6.00%Rate of projected compensation increase . . . . . . . . . . . . . . . . . . . . . . . 4.30% 4.30% 4.44% — —
The actual assumptions used by the various foreign locations are based upon the circumstances of eachparticular country and pension plan. The factors impacting the determination of the long-term rate of return for aparticular foreign pension plan include the market conditions within a particular country, as well as theinvestment strategy and asset allocation of the specific plan.
Assumed health care cost trend rates at December 31 are shown in the table below.
2006 2005
Health care cost trend rate assumed for next year . . . . . . . . . . . . . . . . . . . . . . . . . . . . . . . . . . . . . . . 7.5% 8.0%Rate to which the cost trend rate is assumed to decline (the ultimate trend rate) . . . . . . . . . . . . . . . 5.0% 5.0%Year that the rate reaches the ultimate trend rate . . . . . . . . . . . . . . . . . . . . . . . . . . . . . . . . . . . . . . . . 2013 2013
A one-percentage point change in the assumed health care cost trend rate would have the following effects.
1%Increase
1%Decrease
Effect on accumulated postretirement benefit obligation as of December 31, 2006 . . . . . . . . . $205 $(163)Effect on net periodic postretirement benefit cost in 2006 . . . . . . . . . . . . . . . . . . . . . . . . . . . . . $ 15 $ (12)
77

Notes to Consolidated Financial Statements—Continued
(tabular amounts in thousands, except per-share amounts)
Plan Assets—Pension plan assets vary by foreign location and plan. Assets are held and distributed bytrusts and, dependent upon the foreign location and plan, consist of common stock, investment-grade fixedincome securities, real estate, cash, and insurance contracts. The combined average target allocation of ourforeign pension plans is 54.8% in equities, 36.0% in debt securities, 8.7% in insurance contracts, 0.2% in realestate, and 0.3% in cash. The pension plan weighted-average asset allocations at December 31, 2006 andDecember 31, 2005 by asset category are as follows:
2006 2005
Asset CategoryEquity securities . . . . . . . . . . . . . . . . . . . . . . . . . . . . . . . . . . . . . . . . . . . . . . . . . . . . . . . . . . . 53.1% 54.0%Debt securities . . . . . . . . . . . . . . . . . . . . . . . . . . . . . . . . . . . . . . . . . . . . . . . . . . . . . . . . . . . . . 33.8% 35.4%Insurance contracts . . . . . . . . . . . . . . . . . . . . . . . . . . . . . . . . . . . . . . . . . . . . . . . . . . . . . . . . . 8.7% 10.2%Cash . . . . . . . . . . . . . . . . . . . . . . . . . . . . . . . . . . . . . . . . . . . . . . . . . . . . . . . . . . . . . . . . . . . . . 4.1% 0.0%Real estate . . . . . . . . . . . . . . . . . . . . . . . . . . . . . . . . . . . . . . . . . . . . . . . . . . . . . . . . . . . . . . . . 0.3% 0.4%
100.0% 100.0%
While the pension obligation is long-term in nature for each of our foreign plans, the investment strategiesfollowed by each plan vary to some degree based upon the laws of a particular country, as well as the provisionsof the specific pension trust. The United Kingdom and Canadian plans are invested predominantly in equitysecurities and debt securities. The funds of these plans are managed by various trustees and investmentcompanies whose performance is reviewed throughout the year. The Belgian plan is invested in insurancecontracts. The German plan has no assets.
The equity securities do not include any NewMarket common stock for any year presented. The benefits ofthe Canadian postretirement benefit plan are paid through an insurance contract held by Sun Life AssuranceCompany of Canada.
Cash Flows—For foreign pension plans, NewMarket expects to contribute $8 million to the plans in 2007.We expect to contribute approximately $100 thousand to the Canadian postretirement benefit plan. The expectedbenefit payments for the next ten years are as follows:
Expected PensionBenefit Payments
ExpectedPostretirement
Benefit Payments
2007 . . . . . . . . . . . . . . . . . . . . . . . . . . . . . . . . . . . . . . . . . . . $ 2,898 $1032008 . . . . . . . . . . . . . . . . . . . . . . . . . . . . . . . . . . . . . . . . . . . 2,854 1102009 . . . . . . . . . . . . . . . . . . . . . . . . . . . . . . . . . . . . . . . . . . . 5,501 1172010 . . . . . . . . . . . . . . . . . . . . . . . . . . . . . . . . . . . . . . . . . . . 3,005 1232011 . . . . . . . . . . . . . . . . . . . . . . . . . . . . . . . . . . . . . . . . . . . 3,777 1282012 through 2016 . . . . . . . . . . . . . . . . . . . . . . . . . . . . . . . 23,048 710
78

Notes to Consolidated Financial Statements—Continued
(tabular amounts in thousands, except per-share amounts)
Implementation of SFAS No. 158
The incremental effect of applying SFAS No. 158 on the domestic and foreign pension and postretirementbenefit plans at December 31, 2006 is shown in the table below.
BeforeImplementationof SFAS No. 158 Adjustments
AfterImplementationof SFAS No. 158
Deferred income taxes—current . . . . . . . . . . . . . . . . . . . . . . . . . . . . $ 11,678 $ 599 $ 12,277Prepaid pension cost . . . . . . . . . . . . . . . . . . . . . . . . . . . . . . . . . . . . . 33,424 (33,339) 85Deferred income taxes—long-term . . . . . . . . . . . . . . . . . . . . . . . . . . 8,411 21,677 30,088Intangibles, net of amortization . . . . . . . . . . . . . . . . . . . . . . . . . . . . 53,355 (1,647) 51,708
Total assets . . . . . . . . . . . . . . . . . . . . . . . . . . . . . . . . . . . . . . . . . . . . 757,503 (12,710) 744,793
Accrued expenses . . . . . . . . . . . . . . . . . . . . . . . . . . . . . . . . . . . . . . . 58,137 1,555 59,692Other noncurrent liabilities . . . . . . . . . . . . . . . . . . . . . . . . . . . . . . . . 111,715 18,745 130,460
Accumulated other comprehensive loss . . . . . . . . . . . . . . . . . . . . . . (14,155) (33,010) (47,165)
Total shareholders’ equity . . . . . . . . . . . . . . . . . . . . . . . . . . . . . . . . . 334,412 (33,010) 301,402
Total liabilities and shareholders’ equity . . . . . . . . . . . . . . . . . . . . . 757,503 (12,710) 744,793
19. Special Items Income
Special items income of $15 million for 2006 included a $5.3 million gain related to a payment under anearn-out agreement for certain pharmaceutical intellectual property that we sold in 1994, as well as a $3.3 milliongain associated with a legal settlement related to transportation charges. Special items income also included a$3.3 million gain on the sale of property, a $5.5 million gain resulting from a class action lawsuit related to rawmaterials, and a $2.5 million loss from a legal settlement.
Special items income for 2005 was $12 million and included gains of an aggregate of $8 million on the salesof corporate property, and a gain of $4 million associated with the insurance settlement related to premisesasbestos liabilities, as previously described in Note 17 of the Notes to Consolidated Financial Statements.
Special item income for 2004 was $13 million and represented the gain on an environmental insurancesettlement. The terms of the settlement provided for a total payment of $16 million. In addition to the $8 millionreceived during 2004, we received $4 million in 2005 and received the remaining $4 million in February 2006 inaccordance with a previously agreed-upon payment schedule.
20. Other Income, Net
Other income, net was $7 million in 2006, $900 thousand in 2005, and $300 thousand in 2004. The 2006year included a $4 million gain on interest income on an income tax settlement, as well as $2 million ininvestment income. Both of the 2005 and 2004 periods were comprised of a number of small items.
21. Gains and Losses on Foreign Currency
Foreign currency transactions resulted in a net loss of $1 million in 2006 and a net gain of $2 million in both2005 and 2004. These amounts are reported in cost of sales.
79

Notes to Consolidated Financial Statements—Continued
(tabular amounts in thousands, except per-share amounts)
22. Income Tax Expense
Our income before income taxes, as well as the provision for income taxes, follows:
Years Ended December 31
2006 2005 2004
Income before income taxesDomestic . . . . . . . . . . . . . . . . . . . . . . . . . . . . . . . . . . . . . . . . . . . . . . . . . . . . . $30,292 $ 18,100 $28,573Foreign . . . . . . . . . . . . . . . . . . . . . . . . . . . . . . . . . . . . . . . . . . . . . . . . . . . . . . 57,851 38,852 16,057
$88,143 $ 56,952 $44,630
Income tax expenseCurrent income taxes . . . . . . . . . . . . . . . . . . . . . . . . . . . . . . . . . . . . . . . . . .
Federal . . . . . . . . . . . . . . . . . . . . . . . . . . . . . . . . . . . . . . . . . . . . . . . . . . . $10,093 $ 19,441 $ 7,133State . . . . . . . . . . . . . . . . . . . . . . . . . . . . . . . . . . . . . . . . . . . . . . . . . . . . . 2,117 705 (220)Foreign . . . . . . . . . . . . . . . . . . . . . . . . . . . . . . . . . . . . . . . . . . . . . . . . . . 15,352 10,166 1,258
27,562 30,312 8,171
Deferred income taxes . . . . . . . . . . . . . . . . . . . . . . . . . . . . . . . . . . . . . . . . .Federal . . . . . . . . . . . . . . . . . . . . . . . . . . . . . . . . . . . . . . . . . . . . . . . . . . . 1,097 (15,765) 1,720State . . . . . . . . . . . . . . . . . . . . . . . . . . . . . . . . . . . . . . . . . . . . . . . . . . . . . (114) (1,508) (623)Foreign . . . . . . . . . . . . . . . . . . . . . . . . . . . . . . . . . . . . . . . . . . . . . . . . . . 2,076 1,532 2,304
3,059 (15,741) 3,401
Total income tax expense . . . . . . . . . . . . . . . . . . . . . . . . . . . . . . . . . . . . . . . . . . . $30,621 $ 14,571 $11,572
Income tax expense for the year 2005 and 2004 includes the settlement of certain tax years with the IRS,under which the timing of certain tax deductible items was agreed upon. The settlement of these items increasedcurrent tax expense with a like amount recorded as a deferred tax credit.
The reconciliation of the U.S. federal statutory rate to the effective income tax rate follows:
% of IncomeBefore Income Taxes
2006 2005 2004
Federal statutory rate . . . . . . . . . . . . . . . . . . . . . . . . . . . . . . . . . . . . . . . . . . . . . . . . . . . . . . . 35.0 % 35.0% 35.0%State taxes, net of federal tax . . . . . . . . . . . . . . . . . . . . . . . . . . . . . . . . . . . . . . . . . . . . . . . . . 1.2 0.3 (1.6)Foreign operations . . . . . . . . . . . . . . . . . . . . . . . . . . . . . . . . . . . . . . . . . . . . . . . . . . . . . . . . . 2.4 (2.2) 0.1Extraterritorial income exclusion . . . . . . . . . . . . . . . . . . . . . . . . . . . . . . . . . . . . . . . . . . . . . . (1.9) (3.8) (4.0)Research tax credit . . . . . . . . . . . . . . . . . . . . . . . . . . . . . . . . . . . . . . . . . . . . . . . . . . . . . . . . . (1.7) (2.2) (3.4)Tax settlements . . . . . . . . . . . . . . . . . . . . . . . . . . . . . . . . . . . . . . . . . . . . . . . . . . . . . . . . . . . — (1.1) (2.3)Other items and adjustments . . . . . . . . . . . . . . . . . . . . . . . . . . . . . . . . . . . . . . . . . . . . . . . . . (0.3) (0.4) 2.1
Effective income tax rate . . . . . . . . . . . . . . . . . . . . . . . . . . . . . . . . . . . . . . . . . . . . . . . . . . . . 34.7 % 25.6% 25.9%
The above tax rates for 2004 through 2006 reflect tax expense as a percent of income before income taxes.
Based on available foreign tax credits and current U.S. income tax rates, we believe that we have adequatelyprovided for any additional U.S. taxes that would be incurred when a foreign subsidiary returns its earnings incash to Afton or Ethyl.
80

Notes to Consolidated Financial Statements—Continued
(tabular amounts in thousands, except per-share amounts)
Certain foreign operations have a U.S. tax impact due to our election to include their earnings in our federalincome tax return.
To comply with international trade rules, the American Jobs Creation Act of 2004 (the Act), signed into lawon October 22, 2004, repealed the FSC Repeal and Extraterritorial Income Exclusion Act of 2000. The Actrepealed the Extraterritorial Income Exclusion for transactions entered into after December 31, 2004 subject to aphase-out that allowed current beneficiaries to claim benefits in 2005 and 2006. In 2005, the benefit of excluding$6 million from taxable income was 80% of the amount calculated under prior law. In 2006, the benefit ofexcluding approximately $5 million from taxable income was 60% of the amount calculated under prior law. For2007 and beyond, no benefit will be allowed.
Our deferred income tax assets and liabilities follow.
December 31
2006 2005
Deferred income tax assetsFuture employee benefits . . . . . . . . . . . . . . . . . . . . . . . . . . . . . . . . . . . . . . . . . . . . . . . . . $41,229 $24,955Environmental and future shutdown reserves . . . . . . . . . . . . . . . . . . . . . . . . . . . . . . . . . . 8,105 10,576Intercompany profit in ending inventory . . . . . . . . . . . . . . . . . . . . . . . . . . . . . . . . . . . . . 4,559 2,952Litigation accruals . . . . . . . . . . . . . . . . . . . . . . . . . . . . . . . . . . . . . . . . . . . . . . . . . . . . . . . 1,212 895Inventory valuation and related reserves . . . . . . . . . . . . . . . . . . . . . . . . . . . . . . . . . . . . . . 37 —Foreign currency translation adjustments . . . . . . . . . . . . . . . . . . . . . . . . . . . . . . . . . . . . . — 4,308Depreciation and amortization . . . . . . . . . . . . . . . . . . . . . . . . . . . . . . . . . . . . . . . . . . . . . — 134Other . . . . . . . . . . . . . . . . . . . . . . . . . . . . . . . . . . . . . . . . . . . . . . . . . . . . . . . . . . . . . . . . . 4,047 2,995
59,189 46,815
Deferred income tax liabilitiesIntangibles . . . . . . . . . . . . . . . . . . . . . . . . . . . . . . . . . . . . . . . . . . . . . . . . . . . . . . . . . . . . . 7,285 6,934Undistributed earnings of foreign subsidiaries . . . . . . . . . . . . . . . . . . . . . . . . . . . . . . . . . 7,094 4,454Foreign currency translation adjustments . . . . . . . . . . . . . . . . . . . . . . . . . . . . . . . . . . . . . 96 —Depreciation and amortization . . . . . . . . . . . . . . . . . . . . . . . . . . . . . . . . . . . . . . . . . . . . . 54 —Inventory valuation and related reserves . . . . . . . . . . . . . . . . . . . . . . . . . . . . . . . . . . . . . . — 450Other . . . . . . . . . . . . . . . . . . . . . . . . . . . . . . . . . . . . . . . . . . . . . . . . . . . . . . . . . . . . . . . . . 2,295 2,531
16,824 14,369
Net deferred income tax assets . . . . . . . . . . . . . . . . . . . . . . . . . . . . . . . . . . . . . . . . . . . . . . . . . $42,365 $32,446
Reconciliation to financial statementsDeferred income tax assets—current . . . . . . . . . . . . . . . . . . . . . . . . . . . . . . . . . . . . . . . . $12,277 $ 9,289Deferred income tax assets—noncurrent . . . . . . . . . . . . . . . . . . . . . . . . . . . . . . . . . . . . . 30,088 23,157
Net deferred income tax assets . . . . . . . . . . . . . . . . . . . . . . . . . . . . . . . . . . . . . . . . . . . . . . . . . $42,365 $32,446
81

Notes to Consolidated Financial Statements—Continued
(tabular amounts in thousands, except per-share amounts)
23. Accumulated Other Comprehensive Loss
The pre-tax, tax, and after-tax effects related to the adjustments in accumulated other comprehensive lossfollow:
ForeignCurrency
TranslationAdjustments
UnrealizedGain (Loss)
onMarketableSecurities
Adjustments
Pension Plansand Other
PostretirementBenefits
Adjustments
AccumulatedDerivative
Gain (Loss)
AccumulatedOther
ComprehensiveLoss
December 31, 2003 . . . . . . . . . . . . . . . . . . $ (8,211) $ (32) $(11,921) $ — $(20,164)
Adjustments . . . . . . . . . . . . . . . . . . . . . . . 5,082 285 (6,407) (1,514)Tax (expense) benefit . . . . . . . . . . . . . . . . (1,851) (107) 2,237 569
Other comprehensive income (loss) . . . . . 3,231 178 (4,170) (945) (1,706)
December 31, 2004 . . . . . . . . . . . . . . . . . . (4,980) 146 (16,091) (945) (21,870)
Adjustments . . . . . . . . . . . . . . . . . . . . . . . (11,506) (203) (3,750) 2,744Reclassification adjustment for the gain
included in net income resulting fromthe maturity of contracts . . . . . . . . . . . . — — — (1,230)
Tax benefit (expense) . . . . . . . . . . . . . . . . 4,269 76 1,528 (569)
Other comprehensive (loss) income . . . . . (7,237) (127) (2,222) 945 (8,641)
December 31, 2005 . . . . . . . . . . . . . . . . . . (12,217) 19 (18,313) — (30,511)
Adjustments . . . . . . . . . . . . . . . . . . . . . . . 12,030 (31) 13,001 (263)Reclassification adjustment for the loss
included in net income resulting fromthe maturity of contracts . . . . . . . . . . . . — — — 56
Tax (expense) benefit . . . . . . . . . . . . . . . . (4,455) 12 (4,072) 78
Other comprehensive income (loss) . . . . . 7,575 (19) 8,929 (129) 16,356
Initial adoption of Statement ofFinancial Accounting StandardNo. 158, net of tax . . . . . . . . . . . . . . . . — — (33,010) — (33,010)
December 31, 2006 . . . . . . . . . . . . . . . . . . $ (4,642) $ — $(42,394) $ (129) $(47,165)
Prior to December 31, 2006, the pension plans and other postretirement benefits adjustments were theminimum pension liability adjustments within shareholders equity. Effective December 31, 2006, and incompliance with SFAS 158, the pension plans and other postretirement benefits adjustments were based upon thedifference in retirement plan assets and the projected benefit obligation of the retirement plans. See Note 18 ofthe Notes to Consolidated Financial Statements for further information.
82

Notes to Consolidated Financial Statements—Continued
(tabular amounts in thousands, except per-share amounts)
24. Segment and Geographic Area Information
Segment Information—We manage our business in two distinct segments: petroleum additives and TEL.We divided our business this way due to the operational differences between the two business units. Thepetroleum additives business operates in a market where we actively seek opportunities, while TEL is a matureproduct primarily marketed through third-party agreements.
The accounting policies of the segments are the same as those described in Note 1 of the Notes toConsolidated Financial Statements. We evaluate the performance of the petroleum additives business and theTEL business based on operating profit. NewMarket Services departments and other expenses are billed to Aftonand Ethyl based on the services provided under the holding company structure. Depreciation on segmentproperty, plant, and equipment and amortization of prepayments for services and segment intangible assets areincluded in the operating profit of each segment. No transfers occurred between the segments during the periodspresented. TEL sales made through the marketing agreements with Innospec are not recorded as sales by Ethyl.The table below reports net sales and operating profit by segment, as well as a reconciliation to income beforeincome taxes for the last three years.
Certain prior periods have been reclassified to conform to the current presentation. These reclassificationsincluded allocating postretirement benefit expense out of “other income (expense), net” to segment operatingprofit and “corporate, general, and administrative expense.”
2006 2005 2004
Net salesPetroleum additives . . . . . . . . . . . . . . . . . . . . . . . . . . . . . . . . . . . . . . . . . . . $1,252,617 $1,066,921 $884,643Tetraethyl lead . . . . . . . . . . . . . . . . . . . . . . . . . . . . . . . . . . . . . . . . . . . . . . . 10,680 8,623 9,466
Consolidated net sales (a) . . . . . . . . . . . . . . . . . . . . . . . . . . . . . . . $1,263,297 $1,075,544 $894,109
Segment operating profitPetroleum additives (b) . . . . . . . . . . . . . . . . . . . . . . . . . . . . . . . . . . . . . . . . $ 104,400 $ 60,020 $ 41,899Tetraethyl lead (b) . . . . . . . . . . . . . . . . . . . . . . . . . . . . . . . . . . . . . . . . . . . . 3,091 17,929 36,655Other . . . . . . . . . . . . . . . . . . . . . . . . . . . . . . . . . . . . . . . . . . . . . . . . . . . . . . . 4,162 2,756 1,765
Segment operating profit . . . . . . . . . . . . . . . . . . . . . . . . . . . . . . . . . . . 111,653 80,705 80,319
Corporate, general, and administrative expense . . . . . . . . . . . . . . . . . . . . . (12,915) (14,614) (15,234)Special items (c) . . . . . . . . . . . . . . . . . . . . . . . . . . . . . . . . . . . . . . . . . . . . . . 12,953 7,800 —Loss on early extinguishment of debt (d) . . . . . . . . . . . . . . . . . . . . . . . . . . . (11,209) — —Interest of debt . . . . . . . . . . . . . . . . . . . . . . . . . . . . . . . . . . . . . . . . . . . . . . . (15,403) (16,849) (18,254)Other income (expense), net . . . . . . . . . . . . . . . . . . . . . . . . . . . . . . . . . . . . . 3,064 (90) (2,201)
Income before income taxes . . . . . . . . . . . . . . . . . . . . . . . . . . . . . $ 88,143 $ 56,952 $ 44,630
(a) In 2006, 2005, and 2004, net sales to two customers of our petroleum additives segment exceeded 10% oftotal net sales. Sales to BP amounted to $127 million (10% of net sales) in 2006, $112 million (10% of totalnet sales) in 2005, and $99 million (11% of total net sales) in 2004. Sales to Shell amounted to $169 million(13% of total net sales) in 2006, $143 million (13% of total net sales) in 2005, and $119 million (13% oftotal net sales) in 2004. These net sales represent a wide-range of products sold to these two customers inmultiple regions of the world.
(b) There are several nonrecurring items included in petroleum additives and TEL segment operating profit. In2006, the petroleum additives segment includes a gain of $3 million from a legal settlement related totransportation charges, as well as a gain of $6 million resulting from a class action lawsuit related to raw
83
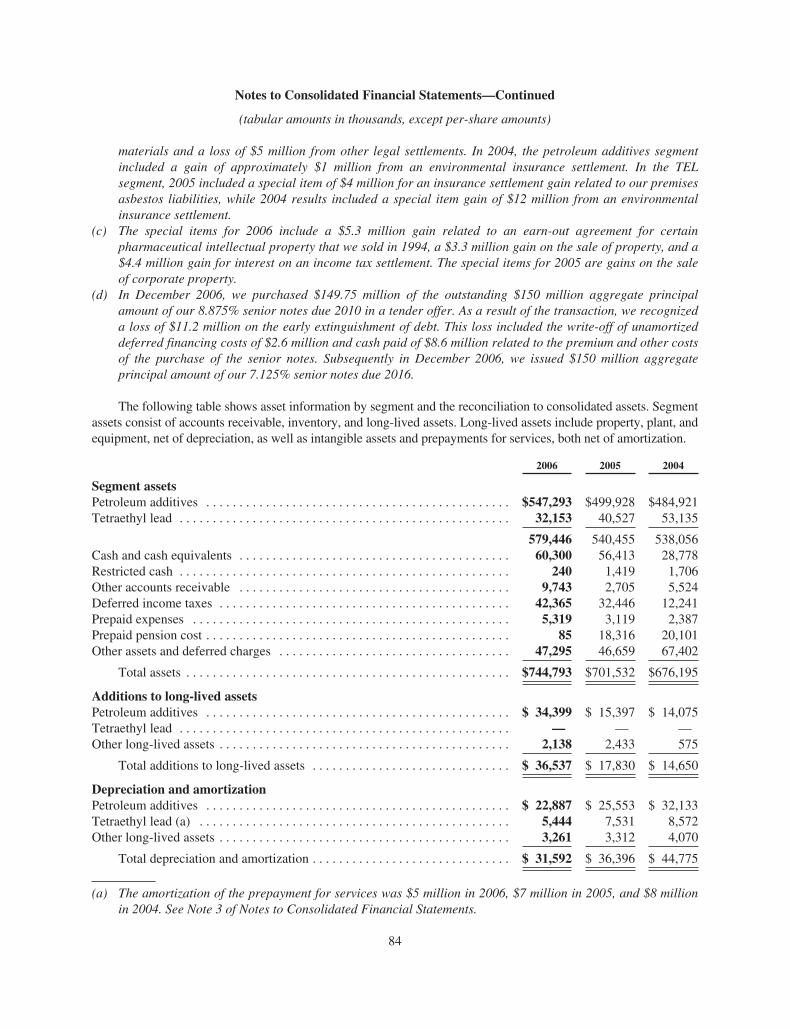
Notes to Consolidated Financial Statements—Continued
(tabular amounts in thousands, except per-share amounts)
materials and a loss of $5 million from other legal settlements. In 2004, the petroleum additives segmentincluded a gain of approximately $1 million from an environmental insurance settlement. In the TELsegment, 2005 included a special item of $4 million for an insurance settlement gain related to our premisesasbestos liabilities, while 2004 results included a special item gain of $12 million from an environmentalinsurance settlement.
(c) The special items for 2006 include a $5.3 million gain related to an earn-out agreement for certainpharmaceutical intellectual property that we sold in 1994, a $3.3 million gain on the sale of property, and a$4.4 million gain for interest on an income tax settlement. The special items for 2005 are gains on the saleof corporate property.
(d) In December 2006, we purchased $149.75 million of the outstanding $150 million aggregate principalamount of our 8.875% senior notes due 2010 in a tender offer. As a result of the transaction, we recognizeda loss of $11.2 million on the early extinguishment of debt. This loss included the write-off of unamortizeddeferred financing costs of $2.6 million and cash paid of $8.6 million related to the premium and other costsof the purchase of the senior notes. Subsequently in December 2006, we issued $150 million aggregateprincipal amount of our 7.125% senior notes due 2016.
The following table shows asset information by segment and the reconciliation to consolidated assets. Segmentassets consist of accounts receivable, inventory, and long-lived assets. Long-lived assets include property, plant, andequipment, net of depreciation, as well as intangible assets and prepayments for services, both net of amortization.
2006 2005 2004
Segment assetsPetroleum additives . . . . . . . . . . . . . . . . . . . . . . . . . . . . . . . . . . . . . . . . . . . . . . $547,293 $499,928 $484,921Tetraethyl lead . . . . . . . . . . . . . . . . . . . . . . . . . . . . . . . . . . . . . . . . . . . . . . . . . . 32,153 40,527 53,135
579,446 540,455 538,056Cash and cash equivalents . . . . . . . . . . . . . . . . . . . . . . . . . . . . . . . . . . . . . . . . . 60,300 56,413 28,778Restricted cash . . . . . . . . . . . . . . . . . . . . . . . . . . . . . . . . . . . . . . . . . . . . . . . . . . 240 1,419 1,706Other accounts receivable . . . . . . . . . . . . . . . . . . . . . . . . . . . . . . . . . . . . . . . . . 9,743 2,705 5,524Deferred income taxes . . . . . . . . . . . . . . . . . . . . . . . . . . . . . . . . . . . . . . . . . . . . 42,365 32,446 12,241Prepaid expenses . . . . . . . . . . . . . . . . . . . . . . . . . . . . . . . . . . . . . . . . . . . . . . . . 5,319 3,119 2,387Prepaid pension cost . . . . . . . . . . . . . . . . . . . . . . . . . . . . . . . . . . . . . . . . . . . . . . 85 18,316 20,101Other assets and deferred charges . . . . . . . . . . . . . . . . . . . . . . . . . . . . . . . . . . . 47,295 46,659 67,402
Total assets . . . . . . . . . . . . . . . . . . . . . . . . . . . . . . . . . . . . . . . . . . . . . . . . . $744,793 $701,532 $676,195
Additions to long-lived assetsPetroleum additives . . . . . . . . . . . . . . . . . . . . . . . . . . . . . . . . . . . . . . . . . . . . . . $ 34,399 $ 15,397 $ 14,075Tetraethyl lead . . . . . . . . . . . . . . . . . . . . . . . . . . . . . . . . . . . . . . . . . . . . . . . . . . — — —Other long-lived assets . . . . . . . . . . . . . . . . . . . . . . . . . . . . . . . . . . . . . . . . . . . . 2,138 2,433 575
Total additions to long-lived assets . . . . . . . . . . . . . . . . . . . . . . . . . . . . . . $ 36,537 $ 17,830 $ 14,650
Depreciation and amortizationPetroleum additives . . . . . . . . . . . . . . . . . . . . . . . . . . . . . . . . . . . . . . . . . . . . . . $ 22,887 $ 25,553 $ 32,133Tetraethyl lead (a) . . . . . . . . . . . . . . . . . . . . . . . . . . . . . . . . . . . . . . . . . . . . . . . 5,444 7,531 8,572Other long-lived assets . . . . . . . . . . . . . . . . . . . . . . . . . . . . . . . . . . . . . . . . . . . . 3,261 3,312 4,070
Total depreciation and amortization . . . . . . . . . . . . . . . . . . . . . . . . . . . . . . $ 31,592 $ 36,396 $ 44,775
(a) The amortization of the prepayment for services was $5 million in 2006, $7 million in 2005, and $8 millionin 2004. See Note 3 of Notes to Consolidated Financial Statements.
84

Notes to Consolidated Financial Statements—Continued
(tabular amounts in thousands, except per-share amounts)
Geographic Area Information—The table below reports net sales, total assets, and long-lived assets bygeographic area. No country, except for the United States, exceeded 10% of net sales in any year. NewMarketassigns revenues to geographic areas based on the location to which the product was shipped.
2006 2005 2004
Net salesUnited States . . . . . . . . . . . . . . . . . . . . . . . . . . . . . . . . . . . . . . . . . . . . . . . . $ 516,655 $ 418,825 $325,990Foreign . . . . . . . . . . . . . . . . . . . . . . . . . . . . . . . . . . . . . . . . . . . . . . . . . . . . . 746,642 656,719 568,119
Consolidated net sales . . . . . . . . . . . . . . . . . . . . . . . . . . . . . . . . . . . . . $1,263,297 $1,075,544 $894,109
Total assetsUnited States . . . . . . . . . . . . . . . . . . . . . . . . . . . . . . . . . . . . . . . . . . . . . . . . $ 430,999 $ 415,334 $408,977Foreign . . . . . . . . . . . . . . . . . . . . . . . . . . . . . . . . . . . . . . . . . . . . . . . . . . . . . 313,794 286,198 267,218
Total assets . . . . . . . . . . . . . . . . . . . . . . . . . . . . . . . . . . . . . . . . . . . . . . $ 744,793 $ 701,532 $676,195
Long-lived assetsUnited States . . . . . . . . . . . . . . . . . . . . . . . . . . . . . . . . . . . . . . . . . . . . . . . . $ 191,302 $ 182,809 $199,432Foreign . . . . . . . . . . . . . . . . . . . . . . . . . . . . . . . . . . . . . . . . . . . . . . . . . . . . . 30,680 34,555 43,925
Total long-lived assets . . . . . . . . . . . . . . . . . . . . . . . . . . . . . . . . . . . . . $ 221,982 $ 217,364 $243,357
25. Selected Quarterly Consolidated Financial Data (unaudited)
2006First
QuarterSecondQuarter
ThirdQuarter
FourthQuarter
Net sales . . . . . . . . . . . . . . . . . . . . . . . . . . . . . . . . . . . . . . . . . . . . . $301,950 $330,066 $325,119 $306,162Gross profit . . . . . . . . . . . . . . . . . . . . . . . . . . . . . . . . . . . . . . . . . . . $ 64,004 $ 69,701 $ 66,164 $ 64,217Net income . . . . . . . . . . . . . . . . . . . . . . . . . . . . . . . . . . . . . . . . . . . $ 13,772 $ 20,369 $ 18,921 $ 4,460Basic earnings per share:
Net income . . . . . . . . . . . . . . . . . . . . . . . . . . . . . . . . . . . . . . . $ .80 $ 1.18 $ 1.10 $ .26Diluted earnings per share:
Net income . . . . . . . . . . . . . . . . . . . . . . . . . . . . . . . . . . . . . . . $ .79 $ 1.17 $ 1.09 $ .26Shares used to compute basic earnings per share . . . . . . . . . . . . . . 17,122 17,232 17,257 17,281Shares used to compute diluted earnings per share . . . . . . . . . . . . . 17,394 17,411 17,409 17,415
2005
Net sales . . . . . . . . . . . . . . . . . . . . . . . . . . . . . . . . . . . . . . . . . . . . . $239,114 $271,842 $270,932 $293,656Gross profit . . . . . . . . . . . . . . . . . . . . . . . . . . . . . . . . . . . . . . . . . . . $ 43,113 $ 52,161 $ 53,171 $ 51,813Net income . . . . . . . . . . . . . . . . . . . . . . . . . . . . . . . . . . . . . . . . . . . $ 4,762 $ 13,067 $ 13,401 $ 11,151Basic earnings per share:
Net income . . . . . . . . . . . . . . . . . . . . . . . . . . . . . . . . . . . . . . . $ .28 $ .77 $ .79 $ .65Diluted earnings per share:
Net income . . . . . . . . . . . . . . . . . . . . . . . . . . . . . . . . . . . . . . . $ .28 $ .76 $ .77 $ .64Shares used to compute basic earnings per share . . . . . . . . . . . . . . 16,982 17,016 17,042 17,071Shares used to compute diluted earnings per share . . . . . . . . . . . . . 17,314 17,305 17,317 17,341
85

Notes to Consolidated Financial Statements—Continued
(tabular amounts in thousands, except per-share amounts)
26. Consolidating Financial Information
The 7.125% senior notes due 2016 are fully and unconditionally guaranteed by certain of our subsidiaries(Guarantor Subsidiaries) on a joint and several unsecured senior basis. The Guarantor Subsidiaries include all ofour existing and future wholly-owned domestic restricted subsidiaries. The Guarantor Subsidiaries and thesubsidiaries that do not guarantee the senior notes (the Non-Guarantor Subsidiaries) are wholly-owned byNewMarket Corporation (the Parent Company). The Guarantor Subsidiaries consist of the following:
Ethyl Corporation Afton Chemical Corporation
Ethyl Asia Pacific LLC Afton Chemical Asia Pacific LLC
Ethyl Canada Holdings, Inc. Afton Chemical Canada Holdings, Inc.
Ethyl Export Corporation Afton Chemical Japan Holdings, Inc.
Ethyl Interamerica Corporation Afton Chemical Additives Corporation
Ethyl Ventures, Inc. NewMarket Services Corporation
Interamerica Terminals Corporation The Edwin Cooper Corporation
Afton Chemical Intangibles LLC Old Town LLC
NewMarket Investment Company NewMarket Development Corporation
Foundry Park I, LLC Foundry Park II, LLC
Gamble’s Hill, LLC Gamble’s Hill Lab, LLC
Gamble’s Hill Landing, LLC Gamble’s Hill Third Street, LLC
Gamble’s Hill Tredegar, LLC
We conduct all of our business and derive all of our income from our subsidiaries. Therefore, our ability tomake payments on the senior notes or other obligations is dependent on the earnings and the distribution of fundsfrom our subsidiaries. There are no restrictions on the ability of any of our domestic subsidiaries to transfer fundsto the Parent Company.
The following sets forth the Consolidating Statements of Income for the years ended December 31,2006, December 31, 2005, and December 31, 2004, Consolidating Balance Sheets as of December 31, 2006 andDecember 31, 2005 and Condensed Consolidating Statements of Cash Flows for the years ended December 31,2006, December 31, 2005, and December 31, 2004 for the Parent Company, the Guarantor Subsidiaries andNon-Guarantor Subsidiaries. The financial information is based on our understanding of the SEC’s interpretationand application of Rule 3-10 of the SEC Regulation S-X.
The financial information may not necessarily be indicative of results of operations or financial position hadthe Guarantor Subsidiaries or Non-Guarantor Subsidiaries operated as independent entities. The Parent Companyaccounts for investments in these subsidiaries using the equity method.
86

Notes to Consolidated Financial Statements—Continued
(tabular amounts in thousands, except per-share amounts)
NewMarket Corporation and Subsidiaries
Consolidating Statements of IncomeYear Ended December 31, 2006
ParentCompany
GuarantorSubsidiaries
Non-GuarantorSubsidiaries
TotalConsolidatingAdjustments Consolidated
Net sales . . . . . . . . . . . . . . . . . . . . . . . . . . . . . $ — $950,970 $624,936 $(312,609) $1,263,297Cost of goods sold . . . . . . . . . . . . . . . . . . . . . (77) 757,336 550,383 (308,431) 999,211
Gross profit . . . . . . . . . . . . . . . . . . . . . . 77 193,634 74,553 (4,178) 264,086Operating profit from TEL marketing
agreements services . . . . . . . . . . . . . . . . . . — — 8,181 — 8,181Intercompany service fee income (expense)
from TEL marketing agreements . . . . . . . . — 6,517 (6,517) — —Selling, general, and administrative
expenses . . . . . . . . . . . . . . . . . . . . . . . . . . . 4,203 89,308 15,680 — 109,191Research, development, and testing
expenses . . . . . . . . . . . . . . . . . . . . . . . . . . . — 54,598 15,665 — 70,263Special item income . . . . . . . . . . . . . . . . . . . . 5,274 9,551 — — 14,825
Operating profit . . . . . . . . . . . . . . . . . . . 1,148 65,796 44,872 (4,178) 107,638Interest and financing expenses, net . . . . . . . 15,406 (596) 593 — 15,403Loss on early extinguishment of debt . . . . . . 11,209 — — — 11,209Other income (expense), net . . . . . . . . . . . . . 6,636 (267) 748 — 7,117
(Loss) income before income taxes andequity income of subsidiaries . . . . . . . . . . (18,831) 66,125 45,027 (4,178) 88,143
Income tax (benefit) expense . . . . . . . . . . . . . (6,592) 22,529 16,243 (1,559) 30,621Equity income of subsidiaries . . . . . . . . . . . . 69,761 — — (69,761) —
Net income . . . . . . . . . . . . . . . . . . . . . . . . . . . $ 57,522 $ 43,596 $ 28,784 $ (72,380) $ 57,522
87

Notes to Consolidated Financial Statements—Continued
(tabular amounts in thousands, except per-share amounts)
NewMarket Corporation and Subsidiaries
Consolidating Statements of IncomeYear Ended December 31, 2005
ParentCompany
GuarantorSubsidiaries
Non-GuarantorSubsidiaries
TotalConsolidatingAdjustments Consolidated
Net sales . . . . . . . . . . . . . . . . . . . . . . . . . . . . . $ — $791,429 $539,688 $(255,573) $1,075,544Cost of goods sold . . . . . . . . . . . . . . . . . . . . . 1,469 664,751 460,267 (251,201) 875,286
Gross (loss) profit . . . . . . . . . . . . . . . . . (1,469) 126,678 79,421 (4,372) 200,258Operating profit from TEL marketing
agreements services . . . . . . . . . . . . . . . . . . — — 23,154 — 23,154Intercompany service fee income (expense)
from TEL marketing agreements . . . . . . . . — 16,169 (16,169) — —Selling, general, and administrative
expenses . . . . . . . . . . . . . . . . . . . . . . . . . . . 6,343 49,947 40,520 — 96,810Research, development, and testing
expenses . . . . . . . . . . . . . . . . . . . . . . . . . . . — 50,713 14,681 — 65,394Special item income . . . . . . . . . . . . . . . . . . . . — 11,668 — — 11,668
Operating (loss) profit . . . . . . . . . . . . . . (7,812) 53,855 31,205 (4,372) 72,876Interest and financing expenses, net . . . . . . . 16,707 (1,006) 1,148 — 16,849Other income, net . . . . . . . . . . . . . . . . . . . . . . 537 141 247 — 925
(Loss) income before income taxes andequity income of subsidiaries . . . . . . . . . . (23,982) 55,002 30,304 (4,372) 56,952
Income tax (benefit) expense . . . . . . . . . . . . . (1,764) 9,653 8,326 (1,644) 14,571Equity income of subsidiaries . . . . . . . . . . . . 64,599 — — (64,599) —
Net income . . . . . . . . . . . . . . . . . . . . . . . . . . . $ 42,381 $ 45,349 $ 21,978 $ (67,327) $ 42,381
88

Notes to Consolidated Financial Statements—Continued
(tabular amounts in thousands, except per-share amounts)
NewMarket Corporation and Subsidiaries
Consolidating Statements of IncomeYear Ended December 31, 2004
ParentCompany
GuarantorSubsidiaries
Non-GuarantorSubsidiaries
TotalConsolidatingAdjustments Consolidated
Net sales . . . . . . . . . . . . . . . . . . . . . . . . . . . . . $ — $650,673 $477,844 $(234,408) $894,109Cost of goods sold . . . . . . . . . . . . . . . . . . . . . 802 541,939 412,386 (239,318) 715,809
Gross (loss) profit . . . . . . . . . . . . . . . . . (802) 108,734 65,458 4,910 178,300Operating profit from TEL marketing
agreements services . . . . . . . . . . . . . . . . . . — — 33,226 — 33,226Intercompany service fee income (expense)
from TEL marketing agreements . . . . . . . . — 29,204 (29,204) — —Selling, general, and administrative
expenses . . . . . . . . . . . . . . . . . . . . . . . . . . . 6,004 52,665 38,186 — 96,855Research, development, and testing
expenses . . . . . . . . . . . . . . . . . . . . . . . . . . . — 51,331 14,025 — 65,356Special item income . . . . . . . . . . . . . . . . . . . . — 13,245 — — 13,245
Operating (loss) profit . . . . . . . . . . . . . . (6,806) 47,187 17,269 4,910 62,560Interest and financing expenses, net . . . . . . . 18,142 (1,383) 1,495 — 18,254Other (expense) income, net . . . . . . . . . . . . . (553) (356) 1,233 — 324
(Loss) income before income taxes andequity income of subsidiaries . . . . . . . . . . (25,501) 48,214 17,007 4,910 44,630
Income tax (benefit) expense . . . . . . . . . . . . . (9,466) 15,233 3,940 1,865 11,572Equity income of subsidiaries . . . . . . . . . . . . 49,093 — — (49,093) —
Net income . . . . . . . . . . . . . . . . . . . . . . . . . . . $ 33,058 $ 32,981 $ 13,067 $ (46,048) $ 33,058
89

Notes to Consolidated Financial Statements—Continued
(tabular amounts in thousands, except per-share amounts)
NewMarket Corporation and Subsidiaries
Consolidating Balance SheetsDecember 31, 2006
ParentCompany
GuarantorSubsidiaries
Non-GuarantorSubsidiaries
TotalConsolidatingAdjustments Consolidated
ASSETSCash and cash equivalents . . . . . . . . . . . . . . . . . $ 19,688 $ 8,211 $ 32,401 $ — $ 60,300Restricted cash . . . . . . . . . . . . . . . . . . . . . . . . . 240 — — — 240Trade and other accounts receivable, net . . . . . 9,686 87,971 100,586 — 198,243Amounts due from affiliated companies . . . . . . — 164,649 36,037 (200,686) —Inventories . . . . . . . . . . . . . . . . . . . . . . . . . . . . . — 99,967 96,105 (10,491) 185,581Deferred income taxes . . . . . . . . . . . . . . . . . . . . 1,825 5,589 887 3,976 12,277Prepaid expenses . . . . . . . . . . . . . . . . . . . . . . . . 2,259 2,022 1,038 — 5,319
Total current assets . . . . . . . . . . . . . . 33,698 368,409 267,054 (207,201) 461,960
Amounts due from affiliated companies . . . . . . — 17,744 — (17,744) —Property, plant and equipment, at cost . . . . . . . — 614,592 136,763 — 751,355
Less accumulated depreciation andamortization . . . . . . . . . . . . . . . . . . . . . . — 474,758 114,483 — 589,241
Net property, plant, and equipment . . . . . . — 139,834 22,280 — 162,114
Investment in consolidated subsidiaries . . . . . . 539,014 — — (539,014) —Prepaid pension cost . . . . . . . . . . . . . . . . . . . . . — — 85 — 85Deferred income taxes . . . . . . . . . . . . . . . . . . . . 28,254 (522) 2,356 — 30,088Other assets and deferred charges . . . . . . . . . . . 6,886 10,126 21,826 — 38,838Intangibles, net of amortization . . . . . . . . . . . . — 51,708 — — 51,708
Total assets . . . . . . . . . . . . . . . . . . . . . . . . . . . . $607,852 $587,299 $313,601 $(763,959) $744,793
LIABILITIES AND SHAREHOLDERS’EQUITY
Accounts payable . . . . . . . . . . . . . . . . . . . . . . . $ 197 $ 50,269 $ 31,157 $ — $ 81,623Accrued expenses . . . . . . . . . . . . . . . . . . . . . . . 5,996 36,896 16,800 — 59,692Dividends payable . . . . . . . . . . . . . . . . . . . . . . . 2,162 — — — 2,162Book overdraft . . . . . . . . . . . . . . . . . . . . . . . . . 8 2,541 — — 2,549Amounts due to affiliated companies . . . . . . . . 78,034 42,656 79,997 (200,687) —Long-term debt, current portion . . . . . . . . . . . . — 691 — — 691Income taxes payable . . . . . . . . . . . . . . . . . . . . 853 4,719 7,894 — 13,466
Total current liabilities . . . . . . . . . . . 87,250 137,772 135,848 (200,687) 160,183
Long-term debt . . . . . . . . . . . . . . . . . . . . . . . . . 150,250 2,498 — — 152,748Amounts due to affiliated companies . . . . . . . . — 2,346 15,398 (17,744) —Other noncurrent liabilities . . . . . . . . . . . . . . . . 68,950 39,856 21,654 — 130,460
Total liabilities . . . . . . . . . . . . . . . . . 306,450 182,472 172,900 (218,431) 443,391
Shareholders’ equity:Common stock and paid in capital . . . . . . 88,263 238,949 75,189 (314,138) 88,263Accumulated other comprehensive loss . . (47,165) (8,780) (22,624) 31,404 (47,165)Retained earnings . . . . . . . . . . . . . . . . . . . 260,304 174,658 88,136 (262,794) 260,304
Total shareholders’ equity . . . . . . . . . 301,402 404,827 140,701 (545,528) 301,402
Total liabilities and shareholders’ equity . . . $607,852 $587,299 $313,601 $(763,959) $744,793
90

Notes to Consolidated Financial Statements—Continued
(tabular amounts in thousands, except per-share amounts)
NewMarket Corporation and Subsidiaries
Consolidating Balance SheetsDecember 31, 2005
ParentCompany
GuarantorSubsidiaries
Non-GuarantorSubsidiaries
TotalConsolidatingAdjustments Consolidated
ASSETSCash and cash equivalents . . . . . . . . . . . . . . . . . . $ 26,973 $ 8,760 $ 20,680 $ — $ 56,413Restricted cash . . . . . . . . . . . . . . . . . . . . . . . . . . . 917 — 502 — 1,419Trade and other accounts receivable, net . . . . . . . 2,663 94,628 92,169 — 189,460Amounts due from affiliated companies . . . . . . . — 183,064 32,819 (215,883) —Inventories . . . . . . . . . . . . . . . . . . . . . . . . . . . . . . — 81,557 76,756 (6,314) 151,999Deferred income taxes . . . . . . . . . . . . . . . . . . . . . 1,128 4,866 876 2,419 9,289Prepaid expenses . . . . . . . . . . . . . . . . . . . . . . . . . 129 1,981 1,009 — 3,119
Total current assets . . . . . . . . . . . . . . . . 31,810 374,856 224,811 (219,778) 411,699
Amounts due from affiliated companies . . . . . . . — 16,989 — (16,989) —Property, plant and equipment, at cost . . . . . . . . . — 626,689 138,256 — 764,945
Less accumulated depreciation andamortization . . . . . . . . . . . . . . . . . . . . . . . — 491,895 119,044 — 610,939
Net property, plant, and equipment . . . . . . . — 134,794 19,212 — 154,006
Investment in consolidated subsidiaries . . . . . . . . 507,668 — — (507,668) —Prepaid pension cost . . . . . . . . . . . . . . . . . . . . . . . 16,233 — 2,083 — 18,316Deferred income taxes . . . . . . . . . . . . . . . . . . . . . 16,180 1,058 5,919 — 23,157Other assets and deferred charges . . . . . . . . . . . . 7,483 10,020 26,977 — 44,480Intangibles, net of amortization . . . . . . . . . . . . . . 729 47,547 1,598 — 49,874
Total assets . . . . . . . . . . . . . . . . . . . . . . . . . . . . . $580,103 $585,264 $280,600 $(744,435) $701,532
LIABILITIES AND SHAREHOLDERS’EQUITY
Accounts payable . . . . . . . . . . . . . . . . . . . . . . . . . $ 12 $ 55,562 $ 32,776 $ — $ 88,350Accrued expenses . . . . . . . . . . . . . . . . . . . . . . . . . 5,561 36,008 17,278 — 58,847Book overdraft . . . . . . . . . . . . . . . . . . . . . . . . . . . 10 4,212 — — 4,222Amounts due to affiliated companies . . . . . . . . . . 105,559 31,298 79,026 (215,883) —Long-term debt, current portion . . . . . . . . . . . . . . — 640 — — 640Income taxes payable . . . . . . . . . . . . . . . . . . . . . . (9,166) 21,203 2,691 — 14,728
Total current liabilities . . . . . . . . . . . . . 101,976 148,923 131,771 (215,883) 166,787
Long-term debt . . . . . . . . . . . . . . . . . . . . . . . . . . . 150,000 3,189 — — 153,189Amounts due to affiliated companies . . . . . . . . . . — 4,503 12,486 (16,989) —Other noncurrent liabilities . . . . . . . . . . . . . . . . . . 62,067 37,238 16,191 — 115,496
Total liabilities . . . . . . . . . . . . . . . . . . . 314,043 193,853 160,448 (232,872) 435,472
Shareholders’ equity:Common stock and paid in capital . . . . . . . . 85,162 236,190 76,745 (312,935) 85,162Accumulated other comprehensive loss . . . . (30,511) (10,090) (16,156) 26,246 (30,511)Retained earnings . . . . . . . . . . . . . . . . . . . . . 211,409 165,311 59,563 (224,874) 211,409
Total shareholders’ equity . . . . . . . . . . 266,060 391,411 120,152 (511,563) 266,060
Total liabilities and shareholders’ equity . . . . . $580,103 $585,264 $280,600 $(744,435) $701,532
91

Notes to Consolidated Financial Statements—Continued
(tabular amounts in thousands, except per-share amounts)
NewMarket Corporation and Subsidiaries
Condensed Consolidating Statements of Cash FlowsYear Ended December 31, 2006
ParentCompany
GuarantorSubsidiaries
Non-GuarantorSubsidiaries
TotalConsolidatingAdjustments Consolidated
Cash (used in) provided from operatingactivities . . . . . . . . . . . . . . . . . . . . . . . . . . . . $ (17,349) $ 35,752 $18,673 $ — $ 37,076
Cash flows from investing activitiesCapital expenditures . . . . . . . . . . . . . . . . . — (20,982) (5,179) — (26,161)Acquisition of intangible asset . . . . . . . . . . — (4,476) — — (4,476)Proceeds from pharmaceutical earn-out
agreement . . . . . . . . . . . . . . . . . . . . . . . . 5,274 — — — 5,274Proceeds from sale of certain assets . . . . . — 3,408 — — 3,408Increase in intercompany loans . . . . . . . . . (7,000) — — 7,000 —Cash dividends from subsidiaries . . . . . . . 21,420 — — (21,420) —Other, net . . . . . . . . . . . . . . . . . . . . . . . . . . — 108 — — 108
Cash provided from (used in)investing activities . . . . . . . . . . . . . 19,694 (21,942) (5,179) (14,420) (21,847)
Cash flows from financing activitiesIssuance of 7.125% senior notes . . . . . . . . 150,000 — — — 150,000Repayment of 8.875% senior notes . . . . . . (149,750) — — — (149,750)Dividends . . . . . . . . . . . . . . . . . . . . . . . . . . (8,627) (21,420) — 21,420 (8,627)Change in book overdraft . . . . . . . . . . . . . (2) (1,671) — — (1,673)Debt issuance costs . . . . . . . . . . . . . . . . . . (3,608) — — — (3,608)Excess tax benefits from stock-based
payment arrangements . . . . . . . . . . . . . . 1,501 — — — 1,501Proceeds from exercise of options . . . . . . . 856 — — — 856Payments on the capital lease . . . . . . . . . . — (640) — — (640)Financing from affiliated companies . . . . . — 7,000 — (7,000) —
Cash used in financing activities . . . . (9,630) (16,731) — 14,420 (11,941)
Effect of foreign exchange on cash and cashequivalents . . . . . . . . . . . . . . . . . . . . . . . . . . . — 2,372 (1,773) — 599
(Decrease) increase in cash and cashequivalents . . . . . . . . . . . . . . . . . . . . . . . . . . (7,285) (549) 11,721 — 3,887
Cash and cash equivalents at beginning ofyear . . . . . . . . . . . . . . . . . . . . . . . . . . . . . . . . 26,973 8,760 20,680 — 56,413
Cash and cash equivalents at end of year . . . $ 19,688 $ 8,211 $32,401 $ — $ 60,300
92

Notes to Consolidated Financial Statements—Continued
(tabular amounts in thousands, except per-share amounts)
NewMarket Corporation and Subsidiaries
Condensed Consolidating Statements of Cash FlowsYear Ended December 31, 2005
ParentCompany
GuarantorSubsidiaries
Non-GuarantorSubsidiaries
TotalConsolidatingAdjustments Consolidated
Cash (used in) provided from operatingactivities . . . . . . . . . . . . . . . . . . . . . . . . . . . . $(20,349) $ 84,225 $ 119 $ — $ 63,995
Cash flows from investing activitiesCapital expenditures . . . . . . . . . . . . . . . . . — (13,210) (4,620) — (17,830)Proceeds from sale of certain assets . . . . . — 13,721 — — 13,721Increase in intercompany loans . . . . . . . . . (7,400) (1,000) — 8,400 —Cash dividends from subsidiaries . . . . . . . 84,240 — — (84,240) —Other, net . . . . . . . . . . . . . . . . . . . . . . . . . . — 64 — — 64
Cash provided from (used in)investing activities . . . . . . . . . . . . . 76,840 (425) (4,620) (75,840) (4,045)
Cash flows from financing activitiesNet repayments under revolving credit
agreement . . . . . . . . . . . . . . . . . . . . . . . . (30,000) — — — (30,000)Change in book overdraft . . . . . . . . . . . . . (7) (786) — — (793)Proceeds from exercise of options . . . . . . . 438 — — — 438Payments on the capital lease . . . . . . . . . . — (609) — — (609)Repayment of intercompany note
payable . . . . . . . . . . . . . . . . . . . . . . . . . . — — (2,900) 2,900 —Financing from affiliated companies . . . . . — 7,400 3,900 (11,300) —Dividends . . . . . . . . . . . . . . . . . . . . . . . . . . — (84,240) — 84,240 —
Cash (used in) provided fromfinancing activities . . . . . . . . . . . . . (29,569) (78,235) 1,000 75,840 (30,964)
Effect of foreign exchange on cash and cashequivalents . . . . . . . . . . . . . . . . . . . . . . . . . . . — (3,275) 1,924 — (1,351)
Increase (decrease) in cash and cashequivalents . . . . . . . . . . . . . . . . . . . . . . . . . . 26,922 2,290 (1,577) — 27,635
Cash and cash equivalents at beginning ofyear . . . . . . . . . . . . . . . . . . . . . . . . . . . . . . . . 51 6,470 22,257 — 28,778
Cash and cash equivalents at end of year . . . $ 26,973 $ 8,760 $20,680 $ — $ 56,413
93

Notes to Consolidated Financial Statements—Continued
(tabular amounts in thousands, except per-share amounts)
NewMarket Corporation and Subsidiaries
Condensed Consolidating Statements of Cash FlowsYear Ended December 31, 2004
ParentCompany
GuarantorSubsidiaries
Non-GuarantorSubsidiaries
TotalConsolidatingAdjustments Consolidated
Cash (used in) provided from operatingactivities . . . . . . . . . . . . . . . . . . . . . . . . . . . . . . . . $(12,617) $ 47,301 $ 2,125 $ — $ 36,809
Cash flows from investing activitiesCapital expenditures . . . . . . . . . . . . . . . . . . . . . — (10,987) (3,663) — (14,650)Purchase of certain assets and property . . . . . . . — (3,323) — — (3,323)Cash dividends from subsidiaries . . . . . . . . . . . 40,636 — — (40,636) —Increase in intercompany loans . . . . . . . . . . . . . (12,245) — 12,245 —Other, net . . . . . . . . . . . . . . . . . . . . . . . . . . . . . . — 255 — — 255
Cash provided from (used in) investingactivities . . . . . . . . . . . . . . . . . . . . . . . . . 28,391 (14,055) (3,663) (28,391) (17,718)
Cash flows from financing activitiesRepayments of debt—old agreements . . . . . . . . (53,807) — — — (53,807)Net borrowings under revolving credit
agreement . . . . . . . . . . . . . . . . . . . . . . . . . . . . 30,000 — — — 30,000Change in book overdraft . . . . . . . . . . . . . . . . . 17 1,084 — — 1,101Debt issuance costs . . . . . . . . . . . . . . . . . . . . . . (1,280) — — — (1,280)Proceeds from exercise of options . . . . . . . . . . . 847 — — — 847Payments on the capital lease . . . . . . . . . . . . . . — (572) — — (572)Financing from affiliated companies . . . . . . . . . — 12,245 — (12,245) —Cash dividend paid . . . . . . . . . . . . . . . . . . . . . . . — (40,636) — 40,636 —
Cash used in financing activities . . . . . . . . (24,223) (27,879) — 28,391 (23,711)
Effect of foreign exchange on cash and cashequivalents . . . . . . . . . . . . . . . . . . . . . . . . . . . . . . . — (4,423) 4,454 — 31
(Decrease) increase in cash and cashequivalents . . . . . . . . . . . . . . . . . . . . . . . . . . . . . . (8,449) 944 2,916 — (4,589)
Cash and cash equivalents at beginning ofyear . . . . . . . . . . . . . . . . . . . . . . . . . . . . . . . . . . . . 8,500 5,526 19,341 — 33,367
Cash and cash equivalents at end of year . . . . . . . $ 51 $ 6,470 $22,257 $ — $ 28,778
27. Related Party Transactions
Thomas E. Gottwald, our chief executive officer and a director, is a son of Bruce C. Gottwald, our chairmanof the board of directors and our former chief executive officer. The members of the family of Bruce C. Gottwaldmay be deemed to be control persons of NewMarket. Bruce C. Gottwald owns more than 5% of the outstandingshares of our common stock.
Effective September 24, 2004, NewMarket Services, entered into a Membership Units Purchase andAssignment Agreement (the Agreement), with Bruce C. Gottwald and Floyd D. Gottwald, Jr., who are brothers(collectively the Gottwalds) and Old Town LLC (Old Town), under which NewMarket Services agreed to purchaseall of the voting and non-voting units in Old Town owned by the Gottwalds. The purchase price of $3.3 million wasbased on an appraisal. The Agreement also provided that each of the Gottwalds must resign as a manager of OldTown. Our Audit Committee and all of our independent directors unanimously approved the Agreement.
94

Notes to Consolidated Financial Statements—Continued
(tabular amounts in thousands, except per-share amounts)
Under the terms of the Agreement, in the event that NewMarket Services decides to sell substantially all ofthe assets of Old Town and receives an offer from a third-party for such assets, NewMarket Services mustprovide the offer to the Gottwalds, who will have 30 days to purchase the assets of Old Town on the same termsand conditions as contained in the third-party offer.
In April 2001, we had sold this same property, located in King William, Virginia, and consisting ofapproximately 1,600 acres, to Old Town, which at the time was owned by the Gottwalds, for $2.9 million in cash,which was a value based on appraisals. We managed the property for Old Town.
28. Recently Issued Accounting Standards
In June 2006, the FASB issued Financial Interpretation 48, “Accounting for Uncertainty in Income Taxes—an interpretation of FASB Statement No. 109” (FIN 48). FIN 48 provides guidelines for financial statementrecognition and measurement of a tax position taken or expected to be taken in a tax return. It further clarifies theaccounting for uncertainty in income taxes recognized in the financial statements in accordance with FinancialAccounting Statement No. 109, “Accounting for Income Taxes.” The interpretation is effective for fiscal yearsbeginning after December 15, 2006. We adopted FIN 48 on January 1, 2007. We currently do not expect FIN 48to have a material impact on our financial statements; however, we are still finalizing our review.
In September 2006, the FASB issued Statement of Financial Accounting Standard No. 157, “Fair ValueMeasurements” (SFAS 157). The standard defines fair value, outlines a framework for measuring fair value, anddetails the required disclosures about fair value measurements. The standard is effective for years beginning afterNovember 15, 2007. We are evaluating the impact of the adoption of SFAS 157 on our financial statements.
29. Subsequent Events
On February 22, 2007, the Board of Directors declared a quarterly dividend in the amount of 12.5 cents pershare on the common stock of the corporation. The dividend is payable April 1, 2007 to shareholders of record onMarch 15, 2006.
In January 2007, Foundry Park I, a wholly-owned subsidiary of NewMarket Development, entered into aDeed of Lease Agreement with MeadWestvaco under which MeadWestvaco will lease an office building whichwill be constructed on approximately three acres of real property which is owned by Foundry Park I. Theproperty is part of a larger office park and mixed use development known as “Foundry Park.” The office buildingis designed to include approximately 304,000 rentable square feet. In addition to the office building,MeadWestvaco has the right to parking facilities that are expected to contain approximately 1,050 parkingspaces, and the right to use all common areas within the office building and Foundry Park.
Foundry Park I plans to invest between approximately $110 million and $140 million in completingconstruction of the building. Most of the cost will be financed through construction and permanent indebtedness.Foundry Park I expects construction to require at least two years. The lease, which will cover the entire officebuilding, is a long-term lease with lease payments at competitive market rates.
We redeemed the remaining $250,000 in aggregate principal amount of the 8.875% senior notes onFebruary 7, 2007 at a redemption price equal to 105.105% of the principal amount of the redeemed notes, plusaccrued and unpaid interest to February 7, 2007.
95

ITEM 9. CHANGES IN AND DISAGREEMENTS WITH ACCOUNTANTS ON ACCOUNTING ANDFINANCIAL DISCLOSURE
None.
ITEM 9A. CONTROLS AND PROCEDURES
Evaluation of Disclosure Controls and Procedures
We maintain a system of internal control over financial reporting to provide reasonable, but not absolute,assurance of the reliability of the financial records and the protection of assets. Our controls and proceduresinclude written policies and procedures, careful selection and training of qualified personnel, and an internalaudit program. We use a third-party firm, separate from our independent registered public accounting firm, toassist with internal audit services.
We work closely with the business groups, operations personnel, and information technology to ensuretransactions are recorded properly. Environmental and legal staff are consulted to determine the appropriatenessof our environmental and legal liabilities for each reporting period. We regularly review the regulations and rulechanges that affect our financial disclosures.
Our disclosure control procedures include signed representation letters from our regional officers, as well assenior management.
We have formed a Financial Disclosure Committee, which is made up of the president and senior vicepresident of Afton, the president of Ethyl, the general counsel of NewMarket and the controller of NewMarket.The committee, as well as regional management, makes representations with regard to the financial statementsthat, to the best of their knowledge, the report does not contain any misstatement of a material fact or omit amaterial fact that is necessary to make the statements not misleading with respect to the periods covered by thereport.
The committee and the regional management also represent, to the best of their knowledge, that the financialstatements and other financial information included in the report fairly present, in all material respects, thefinancial condition, results of operations and cash flows of the company as of and for the periods presented in thereport.
Pursuant to Rule 13a-15(b) under the Securities Exchange Act of 1934 (the Exchange Act), we carried out anevaluation, with the participation of our management, including our principal executive officer and our principalfinancial officer, of the effectiveness of our disclosure controls and procedures (as defined under Rule 13a-15(e))under the Exchange Act as of the end of the period covered by this report. Based upon that evaluation, our principalexecutive officer and our principal financial officer concluded that our disclosure controls and procedures areeffective.
There has been no change in our internal control over financial reporting, as such term is defined inRule 13a-15(f) under the Exchange Act, during the quarter ended December 31, 2006 that has materiallyaffected, or is reasonably likely to materially affect, our internal control over financial reporting.
Management’s Report on Internal Control Over Financial Reporting
Our management is responsible for establishing and maintaining adequate internal control over financialreporting, as such term is defined in Rule 13a-15(f), under the Securities Exchange Act of 1934.
96

Our internal control over financial reporting is a process designed to provide reasonable assurance regardingthe reliability of financial reporting and the preparation of financial statements for external purposes inaccordance with accounting principles generally accepted in the United States of America. Internal control overfinancial reporting includes those policies and procedures that:
• pertain to the maintenance of records that, in reasonable detail, accurately and fairly reflect thetransactions and dispositions of our assets;
• provide reasonable assurance that transactions are recorded as necessary to permit preparation of financialstatements in accordance with accounting principles generally accepted in the United States of Americaand that our receipts and expenditures are being made only in accordance with authorization of ourmanagement and directors; and
• provide reasonable assurance regarding prevention or timely detection of unauthorized acquisition, use ordisposition of assets that could have a material effect on the consolidated financial statements.
Because of its inherent limitations, internal control over financial reporting may not prevent or detectmisstatements. Also, projections of any evaluation of effectiveness to future periods are subject to the risk thatcontrols may become inadequate because of changes in conditions, or that the degree of compliance with thepolicies or procedures may deteriorate.
Under the supervision and with the participation of our management, including our principal executiveofficer and principal financial officer, we conducted an evaluation of the effectiveness of our internal controlover financial reporting based on the framework in “Internal Control – Integrated Framework” issued by theCommittee of Sponsoring Organizations of the Treadway Commission. Based on our evaluation under theframework in “Internal Control – Integrated Framework,” our management concluded that our internal controlover financial reporting was effective as of December 31, 2006. Our management’s assessment of theeffectiveness of the internal control over financial reporting as of December 31, 2006, has been audited byPricewaterhouseCoopers LLP, an independent registered public accounting firm, as stated in their report, whichis included in Item 8 of this Annual Report on Form 10-K.
ITEM 9B. OTHER INFORMATION
None.
97

PART III
ITEM 10. DIRECTORS, EXECUTIVE OFFICERS AND CORPORATE GOVERNANCE
The information required by this item is incorporated herein by reference to our definitive Proxy Statementfor our 2007 annual meeting of shareholders (Proxy Statement). In addition, the names and ages of all executiveofficers as of February 26, 2007 follow.
Name Age Positions
Thomas E. Gottwald . . . . . . . . . . 46 President and Chief Executive Officer (Principal Executive Officer)David A. Fiorenza . . . . . . . . . . . . 57 Vice President and Treasurer (Principal Financial Officer)Steven M. Edmonds . . . . . . . . . . 54 Vice President—General CounselBruce R. Hazelgrove, III . . . . . . . 46 Vice President—Corporate ResourcesWayne C. Drinkwater . . . . . . . . . 60 Controller (Principal Accounting Officer)M. Rudolph West . . . . . . . . . . . . 53 SecretaryRussell L. Gottwald, Jr. . . . . . . . 55 President, Ethyl CorporationC. S. Warren Huang . . . . . . . . . . 57 President, Afton Chemical Corporation
Our officers hold office until the meeting of the Board of Directors following the next annual shareholders’meeting. Prior to their appointment as officers of NewMarket, all of the officers, with the exception of Steven M.Edmonds, Russell L. Gottwald, Jr., and C.S. Warren Huang, were employed by Ethyl in similar capacities for atleast the last five years. Mr. Russell Gottwald and Mr. Huang have both been employed by Ethyl or Afton for atleast the last five years in various senior management capacities. Prior to joining Ethyl in 2002, Mr. Edmondswas a partner with a law firm since 1981. His practice focused on general corporate matters, mergers andacquisitions, finance transactions, and commercial real estate.
We have adopted a Code of Conduct that applies to our directors, officers, and employees (including ourprincipal executive officer, principal financial officer, and principal accounting officer) and have posted the Codeof Conduct on our internet website. We intend to satisfy the disclosure requirement under Item 10 of Form 8-Krelating to amendments to or waivers from any provision of our Code of Conduct applicable to the principalexecutive officer, principal financial officer, and principal accounting officer by posting this information on ourinternet website. Our internet website address is www.newmarket.com.
Because our common stock is listed on the NYSE, our chief executive officer is required to make, and hehas made, an annual certification to the NYSE stating that he was not aware of any violation by us of thecorporate governance listing standards of the NYSE. Our chief executive officer made his annual certification tothat effect to the NYSE as of May 1, 2006. In addition, we have filed, as exhibits to this Annual Report onForm 10-K, the certifications of our principal executive officer and principal financial officer required underSections 906 and 302 of the Sarbanes Oxley Act of 2002 to be filed with the SEC regarding the quality of ourpublic disclosure.
ITEM 11. EXECUTIVE COMPENSATION
The information required by this item is incorporated herein by reference to our Proxy Statement.
ITEM 12. SECURITY OWNERSHIP OF CERTAIN BENEFICIAL OWNERS AND MANAGEMENTAND RELATED STOCKHOLDER MATTERS
Except as noted below, the information required by this item is incorporated herein by reference to ourProxy Statement.
98

The following table presents information as of December 31, 2006 with respect to equity compensationplans under which shares of our common stock are authorized for issuance.
Plan Category
Number ofSecurities to Be
Issued uponExercise of
OutstandingOptions, Warrants
and Rights (a)
Weighted-AverageExercise Price of
OutstandingOptions,
Warrants andRights
Number ofSecurities
RemainingAvailable for
Future IssuanceUnder EquityCompensation
Plans (b)
Equity compensation plans approved by shareholders:2004 Incentive Plan . . . . . . . . . . . . . . . . . . . . . . . . . . . . — $ — 1,500,0001982 Incentive Plan . . . . . . . . . . . . . . . . . . . . . . . . . . . . 132,500 4.35 — (c)
Equity compensation plans not approved byshareholders (d): . . . . . . . . . . . . . . . . . . . . . . . . . . . . . . . . . — — —
Total . . . . . . . . . . . . . . . . . . . . . . . . . . . . . . . . . . . . . . . . . . . . 132,500 $4.35 1,500,000
(a) There are no outstanding rights or warrants.(b) Amounts exclude any securities to be issued upon exercise of outstanding options.(c) The 1982 Incentive Plan was terminated on March 2, 2004. We cannot make any further grants or awards
under this plan.(d) We do not have any equity compensation plans that have not been approved by shareholders.
ITEM 13. CERTAIN RELATIONSHIPS AND RELATED TRANSACTIONS, AND DIRECTORINDEPENDENCE
The information required by this item is incorporated herein by reference to our Proxy Statement.
ITEM 14. PRINCIPAL ACCOUNTING FEES AND SERVICES
The information required by this item is incorporated herein by reference to our Proxy Statement.
99

PART IV
ITEM 15. EXHIBITS, FINANCIAL STATEMENT SCHEDULES
(A)(1) Management’s Report on the Financial Statements
Report of Independent Registered Public Accounting Firm
Consolidated Statements of Income for each of the three years in the periods ended December 31,2006, 2005, and 2004
Consolidated Balance Sheets as of December 31, 2006 and 2005
Consolidated Statements of Shareholders’ Equity for each of the three years in the periods endedDecember 31, 2006, 2005, and 2004
Consolidated Statements of Cash Flows for each of the three years in the periods ended December 31,2006, 2005, and 2004
Notes to Consolidated Financial Statements
(A)(2) Financial Statement Schedules—none required
(A)(3) Exhibits
2.1 Agreement and Plan of Merger, dated as of March 5, 2004, by and among Ethyl Corporation,NewMarket Corporation, and Ethyl Merger Sub, Inc. (incorporated by reference to Exhibit 2.1to Form 10-K (File No. 1-32190) filed March 14, 2005)
3.1 Articles of Incorporation (incorporated by reference to Exhibit 3.1 to Form 10-K (FileNo. 1-32190) filed March 14, 2005)
3.2 Amended Bylaws (incorporated by reference to Exhibit 3.1 to Form 8-K (File No. 1-32190)filed February 28, 2005)
4.1 Indenture, dated as of April 30, 2003, among Ethyl Corporation, the guarantors named on thesignature pages thereto and Wells Fargo Bank Minnesota, N.A., as trustee (incorporated byreference to Exhibit 4.1 to Ethyl Corporation’s Form 10-Q (File No. 1-5112) filed on May 9,2003)
4.2 Supplemental Indenture, dated as of June 18, 2004, among Ethyl Corporation, Afton ChemicalAsia Pacific LLC, Afton Chemical Canada Holdings, Inc., Afton Chemical Intangibles LLC,Ethyl Asia Pacific LLC, NewMarket Corporation, NewMarket Services Corporation, the otherguarantors named on the signature pages thereto and Wells Fargo Bank, N.A., as trustee(incorporated by reference to Exhibit 10.4 to Form 10-Q (File No. 1-32190) filed August 5,2004)
4.3 Second Supplemental Indenture, dated as of July 1, 2004, among NewMarket Corporation,Afton Chemical SPRL, and Wells Fargo Bank, N.A., as trustee
4.4 Third Supplemental Indenture, dated as of November 2, 2004, among NewMarket Corporation,Old Town LLC, and Wells Fargo Bank, N.A., as trustee
4.5 Fourth Supplemental Indenture, dated as of December 6, 2006, among NewMarket Corporation,the guarantors named on the signature pages thereto and Wells Fargo Bank, N.A., as trustee(incorporated by reference to Exhibit 4.1 to Form 8-K (File No. 1-32190) filed December 13,2006)
4.6 Form of 8.875% Senior Notes due 2010 (incorporated by reference to Exhibit 4.2 to EthylCorporation’s Form 10-Q (File No. 1-5112) filed May 9, 2003)
4.7 Indenture, dated as of December 12, 2006, among NewMarket Corporation, the guarantors listedon the signature pages thereto and Wells Fargo Bank, N.A., as trustee, (incorporated byreference to Exhibit 4.2 to Form 8-K (File No. 1-32190) filed December 13, 2006)
100

4.8 First Supplemental Indenture, dated as of February 7, 2007 among NewMarket Corporation,NewMarket Development Corporation, Foundry Park I, LLC, Foundry Park II, LLC, Gamble’sHill, LLC, Gamble’s Hill Tredegar, LLC, Gamble’s Hill Lab, LLC, Gamble’s Hill Landing,LLC and Gamble’s Hill Third Street, LLC, and Wells Fargo Bank, N.A., as trustee
4.9 Form of 7.125% Senior Notes due 2016 (Included in Exhibit 4.7) (incorporated by reference toExhibit 4.3 to Form 8-K (File No. 1-32190) filed December 13, 2006)
4.10 Registration Rights Agreement, dated as of December 12, 2006, among NewMarketCorporation, the guarantors listed on the signature pages thereto and Credit Suisse Securities(USA) LLC (incorporated by reference to Exhibit 4.4 to Form 8-K (File No. 1-32190) filedDecember 13, 2006)
10.1 Second Amended and Restated Credit Agreement, dated as of December 21, 2006, amongNewMarket Corporation, SunTrust Bank, as administrative agent, SunTrust Capital Markets, aslead arranger and book manager, and the lenders from time to time party thereto (incorporatedby reference to Exhibit 10.1 to Form 8-K (File No. 1-32190) filed December 28, 2006)
10.2 Deed of Lease Agreement, dated as of January 11, 2007, by and between Foundry Park I, LLCand MeadWestvaco Corporation*
10.3 MMT Supply Agreement, dated as of February 28, 1994, by and between Ethyl Corporation andAlbemarle Corporation (incorporated by reference to Exhibit 10.1 to Ethyl Corporation’s Form 10-Q(File No. 1-5112) filed August 8, 2003)
10.4 2004 Incentive Compensation and Stock Plan (incorporated by reference to Exhibit 10.4 toForm 10-K (File No. 1-32190) filed March 14, 2005)
10.5 Amended Non-Employee Directors’ Stock Acquisition Plan (incorporated by reference toExhibit 10.2 to Ethyl Corporation’s Form 10-K (File No. 1-5112) filed March 14, 2003)
10.6 Excess Benefit Plan (incorporated by reference to Exhibit 10.4 to Ethyl Corporation’s Form 10-K(File No. 1-5112) filed on February 25, 1993)
10.7 Supply Agreement, dated as of December 22, 1993, between Ethyl Corporation and TheAssociated Octel Company Limited (incorporated by reference to Exhibit 99 to EthylCorporation’s Form 8-K (File No. 1-5112) filed on February 17, 1994)
10.8 Antiknock Marketing and Sales Agreement, dated October 1, 1998, between Ethyl Corporationand The Associated Octel Company Limited (incorporated by reference to Exhibit 10 to EthylCorporation’s Form 10-Q (File No. 1-5112) filed on November 10, 1998)
10.9 Trust Agreement between Ethyl Corporation and Merrill Lynch Trust Company of America(incorporated by reference to Exhibit 4.5 to Ethyl Corporation’s Registration Statement on Form S-8(Registration No. 333-60889) filed on August 7, 1998)
10.10 Amended and Restated Product Marketing and Sales Agreement, dated as of June 13, 2001, betweenEthyl Services GmbH and Alcor Chemie Vertriebs AG, Alcor Chemie AG, and Noofot GmbH(incorporated by reference to Exhibit 10.8 to Ethyl Corporation’s Form 10-K (File No. 1-5112) filedon March 29, 2002)
10.11 NewMarket Corporation and Affiliates Bonus Plan (incorporated by reference to Exhibit 10.9 toEthyl Corporation’s Form 10-K (File No. 1-5112) filed on March 14, 2003)
10.12 Indemnification Agreement, dated as of July 1, 2004 by and among NewMarket Corporation,Ethyl Corporation and Afton Chemical Corporation (incorporated by reference to Exhibit 10.5to Form 10-Q (File No. 1-32190) filed August 5, 2004)
10.13 Contract Services Agreement, dated June 8, 2004, by and between Ethyl Corporation andNewton A. Perry (incorporated by reference to Exhibit 10.6 to Form 10-Q (File No. 1-32190)filed August 5, 2004)
101

10.14 Membership Units Purchase and Assignment Agreement, effective as of September 24, 2004, byand between Bruce C. Gottwald and Floyd D. Gottwald, Jr., NewMarket Services Corporationand Old Town LLC (incorporated by reference to Exhibit 10.1 to Form 8-K (File No. 1-32190)filed September 24, 2004)
10.15 Services Agreement, dated as of July 1, 2004, by and between NewMarket Services Corporationand Afton Chemical Corporation (incorporated by reference to Exhibit 10.2 to Form 10-Q (FileNo. 1-32190) filed November 5, 2004)
10.16 Services Agreement, dated as of July 1, 2004, by and between NewMarket Services Corporationand Ethyl Corporation (incorporated by reference to Exhibit 10.3 to Form 10-Q (File No. 1-32190)filed November 5, 2004)
10.17 Services Agreement, dated as of July 1, 2004, by and between NewMarket Services Corporation andNewMarket Corporation (incorporated by reference to Exhibit 10.4 to Form 10-Q (File No. 1-32190)filed November 5, 2004)
10.18 Summary of Executive Compensation
10.19 Summary of Directors’ Compensation
10.20 NewMarket Corporation Additional Benefit Agreement, dated May 1, 2006, betweenNewMarket Corporation and C.S. Warren Huang (incorporated by reference to Exhibit 10.1 toForm 8-K (File No. 1-32190) filed May 2, 2006)
12 Computation of Ratios
21 Subsidiaries of the Registrant
23 Consent of Independent Registered Public Accounting Firm
31(a) Certification pursuant to Rule 13a-14(a) under the Securities Exchange Act of 1934, as adoptedpursuant to Section 302 of the Sarbanes-Oxley Act of 2002, by Thomas E. Gottwald
31(b) Certification pursuant to Rule 13a-14(a) under the Securities Exchange Act of 1934, as adoptedpursuant to Section 302 of the Sarbanes-Oxley Act of 2002, by David A. Fiorenza
32(a) Certification pursuant to 18 U.S.C. Section 1350, as adopted pursuant to Section 906 of theSarbanes-Oxley Act of 2002, by Thomas E. Gottwald
32(b) Certification pursuant to 18 U.S.C. Section 1350, as adopted pursuant to Section 906 of theSarbanes-Oxley Act of 2002, by David A. Fiorenza
* Subject to a request for confidential treatment, certain portions of this agreement have been intentionallyomitted. A complete version of this agreement has been filed separately with the Securities and ExchangeCommission.
(B) Exhibits—The response to this portion of Item 15 is submitted as a separate section of this Annual Reporton Form 10-K.
102

SIGNATURES
Pursuant to the requirements of section 13 or 15(d) of the Securities Exchange Act of 1934, the registranthas duly caused this report to be signed on its behalf by the undersigned, thereunto duly authorized.
NEWMARKET CORPORATION
By: /s/ THOMAS E. GOTTWALD
(Thomas E. Gottwald, President and Chief Executive Officer)
Dated: February 26, 2007
Pursuant to the requirements of the Securities Exchange Act of 1934, this report has been signed below bythe following persons on behalf of the registrant and in the capacities indicated as of February 26, 2007.
SIGNATURE TITLE
/s/ BRUCE C. GOTTWALD
(Bruce C. Gottwald)
Chairman of the Board, Chairman of the ExecutiveCommittee, and Director
/s/ THOMAS E. GOTTWALD
(Thomas E. Gottwald)
President, Chief Executive Officer and Director(Principal Executive Officer)
/s/ D. A. FIORENZA
(David A. Fiorenza)
Vice President and Treasurer (Principal FinancialOfficer)
/s/ WAYNE C. DRINKWATER
(Wayne C. Drinkwater)
Controller (Principal Accounting Officer)
/s/ PHYLLIS L. COTHRAN
(Phyllis L. Cothran)
Director
/s/ PATRICK D. HANLEY
(Patrick D. Hanley)
Director
/s/ J. E. ROGERS
(James E. Rogers)
Director
/s/ S. B. SCOTT
(Sidney Buford Scott)
Director
/s/ C. B. WALKER
(Charles B. Walker)
Director
103

[THIS PAGE INTENTIONALLY LEFT BLANK]

Exhibit 31(a)
CERTIFICATION
I, Thomas E. Gottwald, certify that:
1. I have reviewed this Annual Report on Form 10-K for the year ended December 31, 2006 ofNewMarket Corporation;
2. Based on my knowledge, this report does not contain any untrue statement of a material fact or omit tostate a material fact necessary to make the statements made, in light of the circumstances under whichsuch statements were made, not misleading with respect to the period covered by this report;
3. Based on my knowledge, the financial statements, and other financial information included in thisreport, fairly present in all material respects the financial condition, results of operations and cashflows of the registrant as of, and for, the periods presented in this report;
4. The registrant’s other certifying officer(s) and I are responsible for establishing and maintainingdisclosure controls and procedures (as defined in Exchange Act Rules 13a-15(e) and 15d-15(e)) andinternal control over financial reporting (as defined in Exchange Act Rules 13a-15(f) and 15d-15(f)) forthe registrant and have:
(a) Designed such disclosure controls and procedures, or caused such disclosure controls andprocedures to be designed under our supervision, to ensure that material information relating tothe registrant, including its consolidated subsidiaries, is made known to us by others within thoseentities, particularly during the period in which this report is being prepared;
(b) Designed such internal control over financial reporting, or caused such internal control overfinancial reporting to be designed under our supervision, to provide reasonable assuranceregarding the reliability of financial reporting and the preparation of financial statements forexternal purposes in accordance with generally accepted accounting principles;
(c) Evaluated the effectiveness of the registrant’s disclosure controls and procedures and presented inthis report our conclusions about the effectiveness of the disclosure controls and procedures, as ofthe end of the period covered by this report based on such evaluation; and
(d) Disclosed in this report any change in the registrant’s internal control over financial reporting thatoccurred during the registrant’s most recent fiscal quarter (the registrant’s fourth fiscal quarter inthe case of an annual report) that has materially affected, or is reasonably likely to materiallyaffect, the registrant’s internal control over financial reporting; and
5. The registrant’s other certifying officer(s) and I have disclosed, based on our most recent evaluation ofinternal control over financial reporting, to the registrant’s auditors and the audit committee of theregistrant’s board of directors (or persons performing the equivalent functions):
(a) All significant deficiencies and material weaknesses in the design or operation of internal controlover financial reporting which are reasonably likely to adversely affect the registrant’s ability torecord, process, summarize and report financial information; and
(b) Any fraud, whether or not material, that involves management or other employees who have asignificant role in the registrant’s internal control over financial reporting.
Date: February 26, 2007
By: /s/ Thomas E. Gottwald
Thomas E. GottwaldPresident and Chief Executive Officer

Exhibit 31(b)
CERTIFICATION
I, David A. Fiorenza, certify that:
1. I have reviewed this Annual Report on Form 10-K for the year ended December 31, 2006 ofNewMarket Corporation;
2. Based on my knowledge, this report does not contain any untrue statement of a material fact or omit tostate a material fact necessary to make the statements made, in light of the circumstances under whichsuch statements were made, not misleading with respect to the period covered by this report;
3. Based on my knowledge, the financial statements, and other financial information included in thisreport, fairly present in all material respects the financial condition, results of operations and cashflows of the registrant as of, and for, the periods presented in this report;
4. The registrant’s other certifying officer(s) and I are responsible for establishing and maintainingdisclosure controls and procedures (as defined in Exchange Act Rules 13a-15(e) and 15d-15(e)) andinternal control over financial reporting (as defined in Exchange Act Rules 13a-15(f) and 15d-15(f)) forthe registrant and have:
(a) Designed such disclosure controls and procedures, or caused such disclosure controls andprocedures to be designed under our supervision, to ensure that material information relating tothe registrant, including its consolidated subsidiaries, is made known to us by others within thoseentities, particularly during the period in which this report is being prepared;
(b) Designed such internal control over financial reporting, or caused such internal control overfinancial reporting to be designed under our supervision, to provide reasonable assuranceregarding the reliability of financial reporting and the preparation of financial statements forexternal purposes in accordance with generally accepted accounting principles;
(c) Evaluated the effectiveness of the registrant’s disclosure controls and procedures and presented inthis report our conclusions about the effectiveness of the disclosure controls and procedures, as ofthe end of the period covered by this report based on such evaluation; and
(d) Disclosed in this report any change in the registrant’s internal control over financial reporting thatoccurred during the registrant’s most recent fiscal quarter (the registrant’s fourth fiscal quarter inthe case of an annual report) that has materially affected, or is reasonably likely to materiallyaffect, the registrant’s internal control over financial reporting; and
5. The registrant’s other certifying officer(s) and I have disclosed, based on our most recent evaluation ofinternal control over financial reporting, to the registrant’s auditors and the audit committee of theregistrant’s board of directors (or persons performing the equivalent functions):
(a) All significant deficiencies and material weaknesses in the design or operation of internal controlover financial reporting which are reasonably likely to adversely affect the registrant’s ability torecord, process, summarize and report financial information; and
(b) Any fraud, whether or not material, that involves management or other employees who have asignificant role in the registrant’s internal control over financial reporting.
Date: February 26, 2007
By: /s/ D. A. Fiorenza
David A. FiorenzaVice President and Treasurer

[THIS PAGE INTENTIONALLY LEFT BLANK]

[THIS PAGE INTENTIONALLY LEFT BLANK]

SHAREHOLDER INFORMATION
TICKER SYMBOL: NEU
TRANSFER AGENT:
Computershare Investor Services
Attention: Shareholder Communications
P.O. Box 43078
Providence, Rhode Island 02940-3078
Website: www-us.computershare.com
e-mail: [email protected]
Other inquiries should be directed to
NewMarket’s toll-free Shareholder Information Line
at 1-800-625-5191
or outside the United States at 1-312-360-5144

24259_FC_BCN:Layout 1 3/9/07 22:40 Page 2