FR EMN NCP study_Attracting qualified and highly-qualified ...

FORM 10-KEASTMAN CHEMICAL CO - EMNFiled: March 01, 2007 (period: December 31, 2006)
Annual report which provides a comprehensive overview of the company for thepast year

Table of Contents
PART I
PART I
ITEM 1. BUSINESS ITEM
1A.RISK FACTORS
ITEM1B.
UNRESOLVED STAFF COMMENTS
ITEM 2. PROPERTIES ITEM 3. LEGAL PROCEEDINGS ITEM 4. SUBMISSION OF MATTERS TO A VOTE OF SECURITY HOLDERS PART II
ITEM 5. MARKET FOR THE REGISTRANT'S COMMON STOCK, RELATEDSTOCKHOLDER MATTERS AND ISSUER PURCHASES O
ITEM 6. SELECTED FINANCIAL DATA ITEM 7. MANAGEMENT'S DISCUSSION AND ANALYSIS OF FINANCIAL CONDITION
AND RESULTS OF OPERATIONS
ITEM7A.
QUANTITATIVE AND QUALITATIVE DISCLOSURES ABOUT MARKET RISK
ITEM 8. FINANCIAL STATEMENTS AND SUPPLEMENTARY DATA ITEM 9. CHANGES IN AND DISAGREEMENTS WITH ACCOUNTANTS ON ACCOUNTING
AND FINANCIAL DISCLOSURE
ITEM9A.
CONTROLS AND PROCEDURES
ITEM9B.
OTHER INFORMATION
PART III
ITEM 10. DIRECTORS, EXECUTIVE OFFICERS AND CORPORATE GOVERNANCE ITEM 11. EXECUTIVE COMPENSATION ITEM 12. SECURITY OWNERSHIP OF CERTAIN BENEFICIAL OWNERS AND
MANAGEMENT AND RELATED STOCKHOLDER MATT
ITEM 13. CERTAIN RELATIONSHIPS AND RELATED TRANSACTIONS, AND DIRECTORINDEPENDENCE
ITEM 14. PRINCIPAL ACCOUNTING FEES AND SERVICES PART IV
ITEM 15. EXHIBITS AND FINANCIAL STATEMENT SCHEDULES

SIGNATURES
EX-12.01 (COMPUTATION OF RATIOS OF EARNINGS TO FIXED CHARGES)
EX-21.01 (ECC SUBSIDIARIES)
EX-23.01 (CONSENT OF INDEPENDENTLY REGISTERED PUBLIC ACCOUNTING FIRM)
EX-31.01 (CEO CERTIFICATION)
EX-31.02 (CFO CERTIFICATION)
EX-32.01 (CEO 1350 CERTIFICATION)
EX-32.02 (CFO 1350 CERTIFICATION)
EX-99.01 (ECC DETAIL OF SALES REVENUE FOR DIVESTED PRODUCT LINES)

UNITED STATES
SECURITIES AND EXCHANGE COMMISSIONWASHINGTON, DC 20549
FORM 10-K
(MarkOne)
[X]ANNUAL REPORT PURSUANT TO SECTION 13 OR 15(d) OF THE SECURITIES EXCHANGE ACT OF1934
For the fiscal year ended December 31, 2006 OR
[ ] TRANSITION REPORT PURSUANT TO SECTION 13 OR 15(d) OF THE SECURITIES EXCHANGE ACTOF 1934
For the transition period from ______________ to ______________
Commission file number 1-12626
EASTMAN CHEMICAL COMPANY(Exact name of registrant as specified in its charter)
Delaware 62-1539359(State or other jurisdiction of (I.R.S. Employerincorporation or organization) Identification no.)
200 South Wilcox Drive Kingsport, Tennessee 37662
(Address of principal executive offices) (Zip Code)
Registrant’s telephone number, including area code: (423) 229-2000
Securities registered pursuant to Section 12(b) of the Act:
Title of each class Name of each exchange on which registeredCommon Stock, par value $0.01 per share New York Stock Exchange
Securities registered pursuant to Section 12(g) of the Act: None
____________________________________________________________________________________________PAGE 1 OF 128 TOTAL SEQUENTIALLY NUMBERED PAGES
EXHIBIT INDEX ON PAGE 125
1
Source: EASTMAN CHEMICAL CO, 10-K, March 01, 2007
Yes NoIndicate by check mark if the registrant is a well-known seasoned issuer, as defined in Rule 405 of theSecurities Act.
[X]
Yes NoIndicate by check mark if the registrant is not required to file reports pursuant to Section 13 or 15(d) ofthe Act.
[X]
Yes NoIndicate by check mark whether the registrant (1) has filed all reports required to be filed by Section 13 or15(d) of the Securities Exchange Act of 1934 during the preceding 12 months (or for such shorter periodthat the registrant was required to file such reports), and (2) has been subject to such filing requirementsfor the past 90 days.
[X]
Yes NoIndicate by check mark if disclosure of delinquent filers pursuant to Item 405 of Regulation S-K is notcontained herein, and will not be contained, to the best of the registrant's knowledge, in definitive proxyor information statements incorporated by reference in Part III of this Form 10-K or any amendment tothis Form 10-K.
[X]
Indicate by check mark whether the registrant is a large accelerated filer, an accelerated filer, or anon-accelerated filer. See definition of "accelerated filer and large accelerated filer" in Rule 12b-2 of theExchange Act.
Large accelerated filer [X] Accelerated filer [ ] Non-accelerated filer [ ]
Yes NoIndicate by check mark whether the registrant is a shell company (as defined in Rule 12b-2 of the Act). [X]
The aggregate market value (based upon the closing price on the New York Stock Exchange on June 30, 2006) of the 83,230,422shares of common equity held by nonaffiliates as of December 31, 2006 was approximately $4,494,442,788, using beneficialownership rules adopted pursuant to Section 13 of the Securities Exchange Act of 1934, as amended, to exclude common stock thatmay be deemed beneficially owned as of December 31, 2006 by Eastman Chemical Company’s (“Eastman” or the “Company”)directors and executive officers and charitable foundation, some of whom might not be held to be affiliates upon judicialdetermination. A total of 83,637,623 shares of common stock of the registrant were outstanding at December 31, 2006.
DOCUMENTS INCORPORATED BY REFERENCE
Portions of the registrant's definitive Proxy Statement relating to the 2007 Annual Meeting of Stockholders (the "2007 ProxyStatement"), to be filed with the Securities and Exchange Commission, are incorporated by reference in Part III, Items 10 to 14 of thisAnnual Report on Form 10-K (the "Annual Report") as indicated herein.
FORWARD-LOOKING STATEMENTS
Certain statements in this Annual Report are forward-looking in nature as defined in the Private Securities Litigation Reform Act of1995. These statements, and other written and oral forward-looking statements made by the Company from time to time, may relate to,among other things, such matters as planned and expected capacity increases and utilization; anticipated capital spending; expecteddepreciation and amortization; environmental matters; legal proceedings; exposure to, and effects of hedging of, raw material andenergy costs and foreign currencies; global and regional economic, political, and business conditions; competition; growthopportunities; supply and demand, volume, price, cost, margin, and sales; earnings, cash flow, dividends, and other expected financialresults and conditions; expectations, strategies, and plans for individual assets and products, businesses, and segments, as well as forthe whole of Eastman Chemical Company; cash requirements and uses of available cash; financing plans; pension expenses andfunding; credit ratings; anticipated restructuring, divestiture, and consolidation activities; cost reduction and control efforts andtargets; integration of acquired businesses; strategic initiatives and development, production, commercialization, and acceptance ofnew products, services and technologies and related costs; asset, business and product portfolio changes; and expected tax rates andnet interest costs.
2
Source: EASTMAN CHEMICAL CO, 10-K, March 01, 2007

These plans and expectations are based upon certain underlying assumptions, including those mentioned with the specific statements.Such assumptions are in turn based upon internal estimates and analyses of current market conditions and trends, management plansand strategies, economic conditions, and other factors. These plans and expectations and the assumptions underlying them arenecessarily subject to risks and uncertainties inherent in projecting future conditions and results. Actual results could differ materiallyfrom expectations expressed in the forward-looking statements if one or more of the underlying assumptions and expectations provesto be inaccurate or is unrealized. Certain important factors that could cause actual results to differ materially from those in theforward-looking statements are included with such forward-looking statements and in Part II—Item 7—"Management's Discussionand Analysis of Financial Condition and Results of Operations—Forward-Looking Statements and Risk Factors" of this AnnualReport on Form 10-K.
3
Source: EASTMAN CHEMICAL CO, 10-K, March 01, 2007

TABLE OF CONTENTS
ITEM PAGE
PART I
1. Business 5 1A. Risk Factors 23 1B. Unresolved Staff Comments 23 Executive Officers of the Company 24 2. Properties 25 3. Legal Proceedings 26 4. Submission of Matters to a Vote of Security Holders 27
PART II
5. Market for the Registrant's Common Stock, Related Stockholder Mattersand Issuer Purchases of Equity Securities
28
6. Selected Financial Data 30 7. Management's Discussion and Analysis of Financial Condition and
Results of Operations
32 7A. Quantitative and Qualitative Disclosures About Market Risk 66 8. Financial Statements and Supplementary Data 67 9. Changes in and Disagreements With Accountants on Accounting and
Financial Disclosure
119 9A. Controls and Procedures 119 9B. Other Information 119
PART III
10. Directors, Executive Officers and Corporate Governance 120 11. Executive Compensation 120 12. Security Ownership of Certain Beneficial Owners and Management and
Related Stockholder Matters
120 13. Certain Relationships, Related Transactions, and Director Independence 121 14. Principal Accounting Fees and Services 121
PART IV
15. Exhibits and Financial Statement Schedules 122
SIGNATURES
Signatures 123
4
Source: EASTMAN CHEMICAL CO, 10-K, March 01, 2007

PART I
ITEM 1. BUSINESS
CORPORATE OVERVIEW
Eastman Chemical Company ("Eastman" or the "Company") is a global chemical company which manufactures and sells a broadportfolio of chemicals, plastics, and fibers. Eastman began business in 1920 for the purpose of producing chemicals for EastmanKodak Company's photographic business and became a public company, incorporated in Delaware, as of December 31, 1993.Eastman has 16 manufacturing sites in 10 countries that supply chemicals, plastics, and fibers products to customers throughout theworld. The Company's headquarters and largest manufacturing site are located in Kingsport, Tennessee.
In 2006, the Company had sales revenue of $7.5 billion, operating earnings of $640 million, and net earnings of $409 million.Earnings per diluted share were $4.91 in 2006. Included in 2006 operating earnings were accelerated depreciation related torestructuring decisions of $10 million, asset impairments and restructuring charges of $101 million and other operating income of $68million.
The Company’s products and operations are managed and reported in five operating segments: the Coatings, Adhesives, SpecialtyPolymers, and Inks ("CASPI") segment, the Fibers segment, the Performance Chemicals and Intermediates ("PCI") segment, thePerformance Polymers segment and the Specialty Plastics ("SP") segment. A segment is determined primarily by the customermarkets in which it sells its products and services. For additional information related to the Company’s operating segments, see Note21 "Segment Information" to the Company’s consolidated financial statements in Part II, Item 8 of this 2006 Annual Report on Form10K.
In addition to the segments, the Company manages certain costs and initiatives at the corporate level including certain research anddevelopment costs not allocated to any one operating segment. Coal gasification, including chemicals from coal, is one of the moresignificant of these corporate initiatives.
Eastman's management believes that the Company is well-positioned for sustained success both in the near-term and the long-term.Eastman's objective is to leverage its heritage of expertise and innovation in acetyl, polyester, and olefins chemistries to drive growth,meet increasing demand and create new opportunities for the Company's products in key markets.
•��The Company expects continued strong and steady financial performance from its solid base of businesses in the Fibers,CASPI and SP segments, and growth of the SP segment's business through introduction by Eastman of a new family ofcopolyesters to be commercially available by the end of 2007.
•��Through innovation and strategic actions, Eastman expects to substantially improve the profitability of its polyethyleneterephthalate ("PET") polymers business by the second half of 2008.
•��By leveraging its expertise in coal gasification, Eastman expects over time to increase the volume of products derived fromcoal as a raw material to approximately 50 percent, from approximately 20 percent, thereby providing the Company with asignificant cost advantage.
To better focus on its core strengths, the Company divested a portion of its product portfolio in the fourth quarter 2006. The Companysold its Batesville, Arkansas manufacturing facility and related assets in the PCI segment and its polyethylene ("PE") related assets inthe Performance Polymers and CASPI segments. In 2006, these divested product lines had sales revenue of $811 million andoperating earnings of $124 million.
5
Source: EASTMAN CHEMICAL CO, 10-K, March 01, 2007

Manufacturing Streams
As stated above, Eastman's objective is to leverage its heritage of expertise and innovation in acetyl, polyester, and olefins chemistriesto drive growth in key markets including packaging, tobacco, durable goods, building and construction, and others. For each of thesechemistries, Eastman has developed a combination of assets and technologies that are operated within three manufacturing "streams".
•��In the acetyl stream, the Company begins with high sulfur coal which is then gasified in its coal gasification facility. Theresulting synthesis gas is converted into a number of chemicals including methanol, methyl acetate, acetic acid and aceticanhydride. These chemicals are used in products throughout the Company including acetate tow, acetate yarn and celluloseesters. The Company's ability to use coal is a competitive advantage for raw materials and energy. The Company isinvestigating opportunities to further leverage its coal-based process know-how in a corporate initiative referred to as"chemicals from coal", with the objective of increasing product volume derived from coal gasification-based raw materialsversus crude oil to enable Eastman to achieve lower, more stable costs.
•��In the polyester stream, the Company begins with purchased paraxylene and produces purified terephthalic acid ("PTA") anddimethyl terephthalate ("DMT") while most of its polyester competitors start with PTA and DMT. The Company alsopurchases PTA for use at some of its facilities outside the U.S. PTA or DMT is then reacted with ethylene glycol, which theCompany both makes and purchases, along with other raw materials (some of which the Company makes and are proprietary)to produce PET and copolyesters. This backward integration of its polyester manufacturing provides several competitiveadvantages. For PET, this gives Eastman a cost advantage in a commodity market. For copolyester, Eastman adds a specialtymonomer to provide clear, tough, chemically resistant product characteristics. As a result, the Company's copolyesters cancompete with materials such as polycarbonate and acrylic.
•��In the olefins stream, the Company begins primarily with propane and ethane, which are then cracked at its facility inLongview, Texas into propylene and ethylene. The company also purchases propylene for use at its facilities outside the U.S.The propylene is used in oxo derivative products, while the ethylene is used in oxo derivatives, acetaldehyde and ethyleneglycol production and also sold to external markets.
6
Source: EASTMAN CHEMICAL CO, 10-K, March 01, 2007

The following chart shows markets and significant Eastman products by segment and manufacturing stream.
SEGMENT ACETYLSTREAM
POLYESTERSTREAM
OLEFINSSTREAM
KEY PRODUCTS, MARKETS AND ENDUSES
CASPI X X
Adhesives (tape, label, nonwovens), paint andcoatings (architectural, automotive, industrial,and original equipment manufacturing("OEM"))
Fibers X Acetate tow, apparel, home furnishings, andindustrial applications
PCI X X X
Agrochemical, automotive, beverages,nutrition, pharmaceuticals, coatings, medicaldevices, toys, photographic and imaging,household products, polymers, textiles, andconsumer and industrials
Performance Polymers X X
Beverage and food packaging, custom-careand cosmetic packaging, health care andpharmaceutical uses, household products, andindustrial packaging applications
SP X X
Appliances, store fixtures and displays,building and construction, electronicpackaging, medical devices and packaging,graphic arts, general purpose packaging,personal care and cosmetics, food andbeverage packaging, performance films, tapeand labels, fibers/nonwovens, photographicand optical films, and liquid crystal displays
Cyclicality and Seasonality
Certain segments, particularly the PCI and Performance Polymers segments, are impacted by the cyclicality of key products andmarkets, while other segments are more sensitive to global economic conditions. Supply and demand dynamics determine profitabilityat different stages of cycles and global economic conditions affect the length of each cycle. Despite some sensitivity to globaleconomic conditions, many of the products in the Fibers, CASPI and SP segments provide a more stable foundation of earnings. The Company's earnings and cash flows also typically have some seasonal characteristics. The Company's earnings are typicallygreater in the second and third quarters, while cash from operations is usually greater in the fourth quarter. Demand for CASPIsegment products is typically stronger in the second and third quarters due to the increased use of coatings products in the building andconstruction industries, while demand is typically weaker during the winter months because of seasonal construction downturns. ThePCI segment typically has a weaker fourth quarter, due in part to a seasonal downturn in demand for products used in certain buildingand construction and agricultural markets. The Performance Polymers segment typically has stronger demand for its PET polymers forbeverage container plastics during the second and early third quarters due to higher consumption of beverages in the Northernhemisphere, while demand typically weakens during the late third and fourth quarters.
7
Source: EASTMAN CHEMICAL CO, 10-K, March 01, 2007

CASPI SEGMENT
• Overview
The CASPI segment manufactures liquid vehicles, additives, specialty polymers, and other raw materials which are integral to theproduction of paints and coatings, inks, adhesives, and other formulated products. The CASPI segment focuses on producing rawmaterials rather than finished products in order to develop long-term, strategic relationships and achieve preferred supplier status withits customers. Growth in these markets in North America and Europe typically approximates economic growth in general, due to thewide variety of end uses for these applications and dependence on the economic conditions of the markets for durable goods,packaged goods, automobiles, and housing. However, higher growth sub-markets exist within North America and Europe, driven bycustomers' growing demands for performance requirements that are protective of the environment and meet increasingly stringentgovernment regulation. For example, the coatings and adhesives industries are promoting products and technologies designed toreduce air emissions. Growth in Asia and Latin America is substantially higher than general economic growth, driven primarily by theincreasing government regulations in industrializing economies.
In 2006, the CASPI segment had sales revenue of $1.4 billion, which represented 19 percent of Eastman’s total sales. In fourth quarter2006, the Company sold the CASPI segment's Epolene polymer businesses and related assets in conjunction with the sale of thepolyethylene business. Product lines associated with the divestiture had sales revenue of $65 million in 2006.
•��Products
Ø Coatings Additives, Coalescents and SolventsThe additives product lines consist of differentiated and proprietary products, including cellulosic polymers which enhance theaesthetic appeal and improve the performance of industrial and automotive original equipment and refinish coatings and inks.Coalescents include products such as Texanol ester alcohol which improves film formation and durability in architectural latexpaints, and chlorinated polyolefins which promote the adherence of paints and coatings to plastic substrates. Solvents, whichconsist of ester, ketone, glycol ether and alcohol solvents, are used in both paints and inks to maintain the formulation in liquidform for ease of application. Environmental regulations that impose limits on the emission of volatile organic compounds andhazardous air pollutants continue to impact coatings formulations requiring compliant coatings raw materials. Eastman’scoatings additives, coalescents and solvents are currently used in compliant coatings. Additional products are underdevelopment to meet the growing demand for waterborne and high solids coatings. Coatings additives, coalescents and solventscomprised 60 percent of the CASPI segment’s total sales for 2006.
Ø Adhesives Raw MaterialsThe adhesives product lines consist of hydrocarbon resins, rosin resins, resin dispersions, and polymer raw materials. Theseproducts are sold to adhesive formulators and tape and label manufacturers for use as raw materials in hot melt and pressuresensitive adhesives and as binders in nonwoven products such as disposable diapers, feminine products, and pre-saturatedwipes. Eastman is one of the largest manufacturers of hydrogenated gum rosins used in adhesive and chewing gumapplications. Eastman offers the broadest product portfolio of raw materials for the adhesives industry, ranking as the secondlargest global tackifier supplier. Adhesives raw materials comprised 40 percent of the CASPI segment’s total sales for 2006.
The profitability of the CASPI segment products is sensitive to the global economy, exchange rates, market trends and broaderchemical cycles, particularly the olefins cycle. The CASPI segment's specialty products, which include coatings additives, coalescents,and selected hydrocarbon resins, are less sensitive to the olefins cycle due to their functional performance attributes. The cyclicalcommodity products, which include commodity solvents and polymer raw materials, are impacted by the olefins cycle. The Companyleverages its proprietary technologies, competitive cost structure and integrated manufacturing facilities to maintain a strongcompetitive position throughout such cycles.
8
Source: EASTMAN CHEMICAL CO, 10-K, March 01, 2007

•��Strategy and Innovation
A key element of the CASPI segment growth strategy is the continued development of innovative product offerings, building onproprietary technologies in high-growth markets and regions that meet customers’ evolving needs and improve the quality andperformance of customers’ end products. Management believes that its ability to leverage the CASPI segment's broad product line andEastman's research and development capabilities makes it uniquely capable of offering a broad array of solutions for new andemerging markets. The Company is pursuing high value incremental expansions of existing CASPI manufacturing assets to ensurethat adequate capacity is available to meet the increasing demand for the segment's differentiated products.
The CASPI segment is focused on the expansion of the coatings and inks additives and specialty solvents product offerings into otherhigh-growth areas. These include market areas with growth due to specific market trends and product developments, such as highsolids and water-based coatings and inks, as well as growth in geographic areas due to the level and timing of industrial development.The Company's global manufacturing presence positions the CASPI segment to take advantage of areas of high industrial growth,particularly in Asia from its facility in Singapore and joint venture operations in China.
The CASPI segment is also focused on the expansion of the adhesives raw materials product offerings into high-growth markets andregions by leveraging applications technology and increasing production capacity. The segment expects to take advantage of growth indemand for specialty hydrocarbon resins through the 25 percent expansion of the Company's hydrogenated hydrocarbon resinsmanufacturing capacity in Middelburg, the Netherlands, completed in the fourth quarter 2006, and through the 30 percent expansionof hydrocarbon resin production capacity at Eastman's joint venture operation in Nanjing, China, completed in the second quarter2006. Additionally, the CASPI segment has increased profitability within this group of product lines through cost reduction initiativesand leveraging of best manufacturing practices.
The Company intends to continue to leverage its resources to strengthen its CASPI segment innovation pipeline through improvedmarket connect and the expanded use of proprietary products and technologies. Although CASPI segment sales and applicationdevelopment are often specialized by end-use markets, developments in technology may be successfully shared across multipleend-uses and markets.
•��Customers and Markets
As a result of the variety of end uses for its products, the customer base for the CASPI segment is broad and diverse. This segment hasmore than 1,250 customers around the world, and approximately 80 percent of its sales revenue in 2006 was attributable toapproximately 90 customers. The CASPI segment focuses on establishing long-term, customer service-oriented relationships with itsstrategic customers in order to become their preferred supplier and to leverage these relationships to pursue sales opportunities inpreviously underserved markets and to expand the scope of its value-added services. However, from time to time, customers decide todevelop products internally or diversify their sources of supply that had been provided by Eastman's CASPI segment. Growth in NorthAmerican and European markets typically coincides with economic growth in general, due to the wide variety of end uses for theseapplications and their dependence on the economic conditions of the markets for durable goods, packaged goods, automobiles, andhousing.
9
Source: EASTMAN CHEMICAL CO, 10-K, March 01, 2007

•��Competition
Competition within the CASPI segment's markets varies widely depending on the specific product or product group. Because of thedepth and breadth of its product offerings, Eastman does not believe any one of its competitors presently offers all the products itmanufactures within the CASPI segment. The Company’s major competitors in the CASPI segment's markets include largercompanies such as Dow Chemical Company ("Dow"), BASF and Exxon Mobil Corporation, which may have greater financial andother resources than Eastman. Additionally, within each CASPI segment product market the Company competes with other smaller,regionally focused companies that may have advantages based upon location, local market knowledge, manufacturing strength in aspecific product, or other similar factors. However, Eastman does not believe that any of its competitors has a dominant positionwithin the CASPI segment's markets. The Company believes its competitive advantages include its level of vertical integration,breadth of product and technology offerings, low-cost manufacturing position, consistent product quality, and process and marketknowledge. In addition, Eastman attempts to leverage its strong customer base and long-standing customer relationships to promotesubstantial recurring business, further strengthening its competitive position.
FIBERS SEGMENT
• Overview
The Fibers segment manufactures Estron acetate tow and Estrobond triacetin plasticizers, which are used primarily in cigarette filters;Estron natural and Chromspun solution-dyed acetate yarns for use in apparel, home furnishings and industrial fabrics; and acetateflake and acetyl raw materials for other acetate fiber producers. The Fibers segment is one of the world’s two largest suppliers ofacetate tow and has been a market leader in the manufacture and sale of acetate tow since it began producing the product in the early1950s. The Fibers segment is the world’s largest producer of acetate yarn and has been in this business for over 75 years. In 2006, theFibers segment had sales revenue of $910 million, which represented 12 percent of Eastman's total sales.
The Fibers segment’s long history and experience in the fibers markets are reflected in its operating expertise, both within theCompany and in support of its customers’ processes. The Fibers segment’s expertise in internal operating processes allows it toachieve a consistently high level of product quality, a differentiating factor in the industry. The Fibers segment's knowledge of theindustry and of customers' processes allows it to assist its customers in maximizing their processing efficiencies, promoting repeatsales and mutually beneficial, long-term customer relationships. The Fibers segment’s fully integrated facilities from coal-based acetylraw materials through acetate tow and yarn allow a reduction in dependence on petrochemicals from third parties. Managementbelieves the Fibers segment employs the only continuous flake manufacturing process that can use multiple sources of wood pulp asraw material. As a result, the segment has qualified all major high-purity wood pulp suppliers that make pulp suitable for acetatefibers. Despite the continuing consolidation of pulp suppliers, the Fibers segment has dependable sources of pulp supply. The Fiberssegment management believes that these factors combine to make it an industry leader in reliability of supply and cost position.
In addition to the cost advantage of being coal-based, the Fibers segment believes its competitive strengths include high-qualityproducts, technical expertise, large scale vertically-integrated processes, reliability of supply, reputation for excellent technical andcommercial customer service, and a strong customer base characterized by long-term customer relationships. The Fibers segment iscapitalizing and building on these strengths to improve its strategic position.
•��Products
Ø Acetate TowThe Fibers segment manufactures acetate tow under the Estron trademark according to a wide variety of customer specifications,primarily for use in the manufacture of cigarette filters. World-wide demand for acetate tow is expected to increase byapproximately 3 percent per year through 2010.
10
Source: EASTMAN CHEMICAL CO, 10-K, March 01, 2007

Ø Acetate Yarn The Fibers segment manufactures acetate filament yarn under the Estron and Chromspun trademarks in a wide variety ofspecifications. Consisting of pure cellulose acetate, Estron acetate yarn is available in bright and dull luster and is suitable forsubsequent dyeing in the fabric form. Chromspun acetate yarn is solution-dyed in the manufacturing process and is available inmore than 20 colors. These products are used in fabrics for apparel, home furnishings, and industrial applications. From a retailcustomer’s perspective, garments containing acetate yarn are noted for their rich colors, silky feel, supple drape, breathability, andcomfort. World-wide demand for acetate yarn is expected to continue to be negatively affected by lower-priced substitutematerials. Ø Acetyl Chemical ProductsAcetyl chemicals products sold primarily to other acetate fiber producers include acetate flake, acetylation-grade acetic acid, andacetic anhydride. In addition, the Fibers segment markets acetyl-based triacetin plasticizers under the Estrobond trademark,generally for use by cigarette manufacturers as a bonding agent in cigarette filters.
���•���Strategy and Innovation Ø Growth In the Fibers segment, Eastman is leveraging its strong customer relationships and knowledge of the industry to identify growthoptions.
In September 2006, the Company announced a 60 percent capacity expansion of acetate tow at its Workington, England site with atargeted completion date in mid-2008. The location of this site will serve existing customers in Western Europe and the growingdemand in Eastern Europe. The acetate flake for the capacity expansion will be sourced from existing flake capacity in Kingsport,Tennessee.
The Company is also considering the construction of new acetate tow capacity in Asia, a major growth region. The Companywould likely supply acetate flake for this expansion from its Kingsport, Tennessee site.
Ø Continue to Capitalize on Fiber Technology ExpertiseThe Fibers segment intends to continue to make use of its capabilities in fibers technology to maintain a strong focus onincremental product and process improvements, with the goals of meeting customers' evolving needs and improving the segment'smanufacturing process efficiencies.
Ø Maintain Cost-Effective Operations and Consistent Cash Flows and EarningsThe Fibers segment expects to continue to operate in a cost effective manner, capitalizing on its scale and vertical integration, andto make further productivity and efficiency improvements through continued investments in research and development. TheCompany plans to reinvest in the Fibers business to sustain consistently strong earnings and cash flows.
Ø Research and DevelopmentResearch and development efforts for the Fibers segment are primarily focused on incremental process and product improvements,as well as cost reduction, with the objectives of increasing sales and reducing costs. Recent achievements have included fiberproduct advancements that allow improved processability on customers’ equipment and improved packaging designs. The Fiberssegment also engages in research to assist acetate tow customers in the effective use of the segment's products and in thecustomers’ product development efforts.
��•��Customers and Markets
The customer base in the Fibers segment is relatively concentrated, consisting of approximately 175 companies in the tobacco andtextile industries, located in all regions of the world. The largest 20 customers within the Fibers segment include multinational as wellas regional cigarette producers, fabric manufacturers and other acetate fiber producers. These top 20 customers accounted for about 80percent of the segment’s total sales revenue in 2006. The segment maintains a strong position in acetate tow imports into China, one ofthe largest and fastest growing markets in the world.
11
Source: EASTMAN CHEMICAL CO, 10-K, March 01, 2007

• Competition
Competitors in the fibers market for acetate tow include one global competitor, Celanese Corporation ("Celanese"); threemulti-regional competitors, Acetate Products Ltd. ("Acordis"), Rhodia S.A. and Daicel Chemical Industries Ltd ("Daicel").; and tworegional competitors, SK Chemicals Co. ("SK"), Ltd. and Mitsubishi Rayon Co., Ltd. ("Mitsubishi Rayon"). Some consolidation isongoing within the acetate fiber industry with the pending acquisition of Acordis by Celanese. For acetate yarn, major competitorsinclude three companies that target multi-regional markets, BembergCell, INACSA and UAB Korelita, and two regional producers,SK and Mitsubishi Rayon.
In the acetate tow market, two major competitors, Celanese and Daicel, have joint venture capacity in China and expanded theircapacity in 2005 and 2006. However, current global capacity utilization rates are expected to remain high given the world-widegrowth in demand and the industry structure changes that occurred in 2005 when a major competitor closed a North American acetatetow production facility.
Eastman is the world leader in acetate yarn production, the only acetate yarn producer vertically integrated in acetate flake production,and the only acetate yarn producer in North America. The Fibers segment is well positioned to serve this market due to an in-depthknowledge of end-use markets; careful selection of a balanced portfolio of markets, customers, and products; and a highly integrated,large-scale manufacturing operation. Eastman's reputation for quality and supply stability gives it a competitive advantage in themarket.
PCI SEGMENT
��•��Overview
The Company’s PCI segment manufactures diversified products that are sold externally, as well as used internally by other segments.The PCI segment's earnings are highly dependent on how the Company chooses to optimize the acetyls stream and the olefins stream.In 2006, the PCI segment had sales revenue of $1.7 billion, which represented 22 percent of Eastman’s total sales.
In fourth quarter 2006, Eastman sold its Batesville, Arkansas manufacturing facility and related assets and the specialty organicchemicals product lines in the PCI segment. Product lines associated with the divestiture had revenue of $111 million in 2006. Inaddition, as part of the sale of the Performance Polymers segment's polyethylene business, the Company has agreed to supply ethyleneto the buyer. These sales of ethylene, which was previously used internally, will be reported in the PCI segment. The company alsoexpects to begin a staged phase-out of older cracking units in 2007, with timing dependent in part on market conditions.
��•��Products
The PCI segment offers over 135 products that include intermediates based on oxo and acetyl chemistries, and performance chemicals.The PCI segment's 2006 sales revenue was approximately 55 percent olefin-based, 15 percent acetyl-based, 5 percent polymer-based,and 25 percent based on performance and other chemicals. Approximately 73 percent of the PCI segment's sales revenue is generatedin North America. Sales in all regions are generated through a mix of the Company’s direct sales force and a network of distributors.The Company's PCI segment is the largest marketer of acetic anhydride in the United States, an intermediate that is a criticalcomponent of analgesics and other pharmaceutical and agricultural products, and is the only U.S. producer of acetaldehyde, a keyintermediate in the production of vitamins and other specialty products. Eastman manufactures one of the world's broadest ranges ofproducts derived from oxo aldehydes. The PCI segment’s other intermediate products include plasticizers and glycols. Many of theintermediates products in the PCI segment are priced based on supply and demand of substitute and competing products. In order tomaintain a competitive position, the Company strives to operate with a low cost manufacturing base.
The PCI segment also manufactures performance chemicals, that are complex organic molecules such as diketene derivatives,specialty ketones, and specialty anhydrides for pharmaceutical, fiber, and food and beverage ingredients, which are typically used inspecialty market applications. These specialty products are typically priced based on the amount of value added rather than supply anddemand factors.
12
Source: EASTMAN CHEMICAL CO, 10-K, March 01, 2007

•��Strategy and Innovation
To build on and maintain its status as a low cost producer, the PCI segment continuously focuses on cost control, operationalefficiency, and capacity utilization to maximize earnings. Through the PCI segment, the Company maximizes the advantage of itshighly integrated and world-scale manufacturing facilities. For example, the Kingsport, Tennessee manufacturing facilities allow thePCI segment to produce acetic anhydride and other acetyl derivatives from coal rather than natural gas or other petroleum feedstocks.At the Longview, Texas facility, Eastman's PCI segment uses its proprietary oxo-technology in the world’s largest single-site, oxoaldehyde manufacturing facility to produce a wide range of alcohols, esters, and other derivative products utilizing propane and localethane supplies, as well as purchased propylene. These integrated facilities, combined with large scale production processes and acontinuous focus on additional process improvements, allow the PCI segment to remain cost competitive with, and for some productscost-advantaged over, its competitors.
The PCI segment selectively focuses on continuing to develop and access markets with high-growth potential for the Company’schemicals. The Company engages in customer-focused research and development initiatives in order to develop new PCI products andfind additional applications for existing products. The Company is currently focusing these efforts on applications in the personal caremarket and markets using plasticizers.
•��Customers and Markets
The PCI segment’s products are used in a variety of markets and end uses, including agrochemical, automotive, beverages, nutrition,pharmaceuticals, coatings, flooring, medical devices, toys, photographic and imaging, household products, polymers, textiles, andindustrials. The markets for products with market-based pricing in the PCI segment are cyclical. This cyclicality is caused by periodsof supply and demand imbalance, either when incremental capacity additions are not offset by corresponding increases in demand, orwhen demand exceeds existing supply. Demand, in turn, is based on general economic conditions, raw material and energy prices,consumer demand and other factors beyond the Company’s control. Eastman may be unable to increase or maintain the PCI segment'sgross margins in periods of economic stagnation or downturn, and future PCI segment results may fluctuate from period to period dueto these economic conditions. The Company believes many of these markets are being positively affected by the current olefinsupcycle. However, the strength of product-specific olefin derivative markets will vary widely based upon prevailing supply anddemand conditions.
An important trend within the PCI segment's markets is a tendency toward increased regionalization of key markets, especially foracetyls and olefins products, due to increased transportation costs. Additionally, the PCI segment is engaged in continuous effortsdirected toward optimizing product and customer mix. Approximately 80 percent of the PCI segment’s sales revenue in 2006 wasfrom 100 out of approximately 1,200 customers worldwide.
•��Competition
Historically, there have been significant barriers to entry for competitors with respect to a majority of the PCI segment's products,primarily due to the fact that the relevant technology has been held by a small number of companies. As this technology has becomemore readily available, competition from multinational chemical manufacturers has intensified. Eastman competes with these andother producers primarily based on price, as products are interchangeable, but also on technology, marketing and services. Eastman’smajor competitors in this segment include large multinational companies such as Dow, Celanese, BASF, and Exxon MobilCorporation. While some competitors in PCI's product markets may have greater financial resources than Eastman, the Companybelieves it maintains a strong competitive position due to the combination of its scale of operations, breadth of product line, level ofintegration, and technology leadership.
13
Source: EASTMAN CHEMICAL CO, 10-K, March 01, 2007

PERFORMANCE POLYMERS SEGMENT
•��Overview
In 2006, the Performance Polymers segment had revenues of $2.6 billion, which represented 36 percent of the Company’s total sales.The segment consisted of two principal product lines, PET and PE.
In fourth quarter 2006, Eastman concluded the sale of its PE business. The PE product lines were manufactured entirely in the UnitedStates and had a relatively small market share. The low density polyethylene and linear low density polyethylene product lines of thePE business accounted for approximately 25 percent of the Performance Polymers segment’s sales revenue in 2006.
The PET product line competes to a large degree on price in a capital intensive industry. Profitability is achieved by attaining low costpositions through technology innovation, manufacturing scale, capacity utilization, access to reliable and competitive utilities, energyand raw materials, efficient manufacturing processes and distribution.
The Company's PET production is vertically integrated back to the raw material paraxylene for a substantial majority of its capacity.The Performance Polymers segment's PET product line for the packaging market is the world’s largest based on capacity share; themost global based on manufacturing sites; and the broadest based on formula diversity. PET is used in a wide variety of packagingproducts including those for carbonated soft drinks, water, juice, personal care items, household cleaners, beer and food containers.The Performance Polymers segment has PET manufacturing sites in the United States, Mexico, Argentina, Spain, England, and theNetherlands. The Performance Polymers segment competes primarily in North America, Latin America, and Europe. In 2007, the Company will transform the Performance Polymers segment. Through innovation and strategic actions, Eastman expectsto substantially improve the operating margin of its PET polymers business to approximately 10 percent by the second half of 2008. Through the Company's new facility utilizing IntegRex technology in South Carolina, the Company expects to increase PETproduction through a combination of new capacity and debottlenecking, partially offset by rationalization of higher cost assets. Thenew facility using IntegRex technology will be in full operation in the first quarter of 2007, resulting in 33 percent of the Company'sNorth American PET capacity being IntegRex-based capacity. The segment is also taking strategic actions to addressunder-performing PET assets outside the U.S, including entering into an agreement to sell the San Roque, Spain manufacturingfacility. Additionally, the Performance Polymers segment is evaluating the possible construction of a second PET manufacturingfacility fully utilizing IntegRex technology. •��Products
Ø PETPET is used in beverage and food packaging and other applications such as custom-care and cosmetics packaging, health care andpharmaceutical uses, household products, and industrial packaging applications. PET offers fast and easy processing, superbclarity, excellent colorability and color consistency, durability and strength, impact and chemical resistance, and high heat stability.Packages made from PET are characterized by their light weight, high strength, durability, clarity, low cost, safety, andrecyclability. PET accounted for 75 percent of the sales revenue in the Performance Polymers segment in 2006.
14
Source: EASTMAN CHEMICAL CO, 10-K, March 01, 2007

•��Strategy and Innovation
Ø GrowthThe Performance Polymers segment intends to capitalize on the growth in the PET industry with timely and efficient capacityadditions including debottlenecking existing production processes, asset expansions, new assets, contract-manufacturingarrangements, and manufacturing alliances. This growth strategy will rely on continuous process technology improvements fromthe efficient use of research and development, as well as the rationalization of smaller scale, higher cost PET assets, which couldbe redirected to the manufacture of copolyester products.
Production began in November 2006 at the Company's new PET manufacturing facility utilizing IntegRex technology in Columbia,South Carolina. Delivering ParaStar next generation PET resins, the facility is expected to be at its full operational capacity of 350thousand metric tons during the first quarter of 2007. The Company is also evaluating the possible construction of a fullyintegrated IntegRex facility in the United States or elsewhere.
Ø InnovationThe Performance Polymers segment expects to continue to provide customers with innovative new products and incrementalimprovements in existing products. Eastman currently maintains the industry’s broadest product offering for PET polymersincluding ParaStar next generation PET resins for carbonated soft drink packaging enabled by IntegRex technology, Aqua polymerfor the water bottle market, Heatwave polymer for hotfill markets and Vitiva polymer for ultraviolet light sensitive applications.
Ø Research and Development
Eastman directs its research and development programs for the Performance Polymers segment toward three key objectives:
•��Lowering manufacturing costs through process technology innovations and process improvement efforts;
•��Developing new products and services in PET polymers that both meet customers' fitness for use requirements and areprotective of the environment through applications research and customer feedback; and
•��Enhancing product quality by improvement in manufacturing technology and processes.
The Company's Performance Polymer's research and development efforts have resulted in significant improvements inmanufacturing process efficiencies and are continuing to yield sustainable competitive advantage. In 2004, after two years ofsignificant, concentrated research and development efforts, Eastman announced its new IntegRex technology, a breakthroughinnovation in the integrated manufacturing of paraxylene to PET resin, specifically designed for packaging applications. During2005, research and development efforts further enhanced IntegRex technology allowing for a debottlenecking of the new plant toprovide an additional 100 thousand metric tons by the middle of 2008 for a total capacity of 450 thousand metric tons. InNovember 2006, the Company announced it was evaluating a second world-class, fully integrated facility utilizing Integrextechnology.
Enabled by IntegRex technology, ParaStar next generation PET resins offer Eastman's customers significant advantages in theperformance and delivered cost of their packages, including higher clarity and lower energy use in conversion from pellets tocontainers.
15
Source: EASTMAN CHEMICAL CO, 10-K, March 01, 2007

•��Customers and Markets
The largest 43 PET customers within the Performance Polymers segment accounted for more than 80 percent of the segment’scontinuing product lines' total sales revenue in 2006. These customers are primarily PET container suppliers to large volume beveragemarkets such as carbonated soft drinks, water, and juice, with strong participation in custom areas such as food, liquor, sport and fruitbeverages, health and beauty aids, and household products. In 2006, the worldwide market for PET, including containers, film andsheet, was approximately 11 million metric tons. Demand for PET has grown steadily over the past several years, driven by itspopularity for recyclable, single-serve containers and as a substitute for glass and aluminum. PET has already made significant inroadsin soft drink and water bottles, and producers are currently targeting markets such as hot-fill soups and sauces and containers for beer.Industry analysts report that PET consumption grew worldwide from 1.0 million metric tons in 1989 to approximately 11 millionmetric tons in 2006, a compound annual growth rate of 15 percent. Global demand for PET is expected to grow approximately 6 to 8percent annually over the next several years.
•��Competition
Major competitors for the Performance Polymers segment include DAK Americas, Equipolymers, Far Eastern Textiles Ltd., Invista,Mossi & Ghisolfi Group, Nan Ya Plastics Corporation, Reliance Industries Ltd., and Wellman Inc.
The strong growth in demand for PET, coupled with ease of access to conventional manufacturing technology, has resulted in thepresence of over 100 significant resin producers in this market in 2006, up from fewer than 20 in 1995. The Performance Polymerssegment is a global competitor with manufacturing sites in North America, Latin America and Western Europe. The level ofcompetition, however, varies by region. Competition is primarily on the basis of price with product performance, quality, service, andreliability also being competitive factors.
Industry pricing is strongly affected by raw material costs and capacity utilization. PET global supply has exceeded demand since1997 as a result of capacity being introduced into the market at a rate exceeding that of demand growth. While the demand for PETcontinues to increase steadily, excess capacity, particularly in Asia, remains. Excess Asian capacity and related exports are expected tocontinue to have an adverse impact on PET pricing worldwide.
SP SEGMENT
•��Overview
The SP segment produces highly specialized copolyesters and cellulosic plastics that possess differentiated performance properties forvalue-added end uses such as appliances, store fixtures and displays, building and construction, electronic packaging, medical devicesand packaging, graphic arts, general purpose packaging, personal care and cosmetics packaging, food and beverage packaging,performance films, tape and labels, fibers/nonwovens, photographic and optical films, and liquid crystal displays. In 2006, the SPsegment had sales revenue of $818 million, which represented just over 11 percent of Eastman’s total sales.
The SP segment competes in the market for plastics that meet specific performance criteria, typically determined on anapplication-by-application basis. Product development in the SP segment is dependent upon Eastman’s ability to design plasticsproducts that achieve performance characteristics specified by its customers, while providing a better value proposition thanalternative materials such as polycarbonate and acrylic. Increases in market share are gained through the development of newapplications, substitution of plastic for other materials, and, displacement of other plastic resins in existing applications. The SPsegment produces polyesters, specialty copolyesters, cellulose esters, and cellulosic plastics. The Company estimates that the marketgrowth for copolyesters will continue to be higher than general economic growth due to continued material innovations anddisplacement opportunities. Eastman believes that cellulosic materials will grow at the growth rate of the economy in general, drivenby the strong demand for cellulose esters in liquid crystal displays more than offsetting the decline in legacy photographic markets.
16
Source: EASTMAN CHEMICAL CO, 10-K, March 01, 2007

Eastman’s specialty copolyesters, which generally are based on Eastman's market leading supply of cyclohexane dimethanol("CHDM") modified polymers, typically fill a market position between polycarbonates and acrylics. Polycarbonates traditionally havehad some superior performance characteristics, while acrylics have been less expensive. Specialty copolyesters combine superiorperformance with competitive pricing and are being substituted for both polycarbonates and acrylics based on their relativeperformance and pricing.
The SP segment also includes cellulosic materials, which have historically been a steady business with strong operating margins forthe Company, and includes what Eastman believes is a market-leading position in North American cellulose esters for tape and filmproducts and cellulose plastics for molding applications. Eastman has recently commercialized a new family of materials, Visualizecellulose esters, for the liquid crystal displays market.
Eastman has the ability within its SP segment to modify its polymers and plastics to control and customize their final properties,creating numerous opportunities for new application development, including the expertise to develop new materials and newapplications starting from the molecular level in the research laboratory to the final designed application in the customer’s plant. Inaddition, the SP segment has a long history of manufacturing excellence with strong process improvement programs providingcontinuing cost reduction. Manufacturing process models and information technology systems support global manufacturing sites andprovide monitoring and information transfer capability that speed up the innovation process.
• Products
Ø Engineering and Specialty PolymersEngineering and specialty polymers accounted for approximately 50 percent of the SP segment’s 2006 sales revenue. Thesepolymers include a broad line of polyesters, copolyesters, alloys, cellulose flake, and cellulosic plastics that are sold to a diverseand highly fragmented customer base in numerous market segments on a global basis. Sales in all regions are generated through amix of the Company’s direct sales force and a network of distributors. Engineering and specialty polymers products are sold intothree sectors: durable goods (principally components used in appliances); medical goods (disposable medical devices, health careequipment and instruments, and pharmaceutical packaging); and personal care and consumer goods (housewares, cosmetics,eyewear, tools, toys, and food and beverage packaging).
Engineering and specialty polymers products are heavily specification-driven. The Company works with OEM companies toenable product designers to use polymers for a specified use in their products. Although the average life cycle of many of theseproducts is shrinking over time, the Company works to identify uses for the polymers in products that will have multi-year lives. Inworking with OEM companies on new consumer product designs, new polymer products are often developed for use in a particulartype of end-use product.
Ø Specialty Film and SheetSales of specialty film and sheet products represented approximately 30 percent of the SP segment’s 2006 revenue. The keyend-use markets for specialty film and sheet are packaging and in-store fixtures and displays. Direct customers are film and sheetproducers, but marketing activities focus downstream through designers, specifiers, OEMs and brand owners in targeted end-usemarkets.
In the packaging market, specialty film and sheet is sold to end-use markets including medical and electronic component trays,shrink label films, general purpose packaging, and multilayer films. Eastman continues to innovate materials solutions for thepackaging market which include high melt strength copolyesters for handleware applications and modified copolyesters used toproduce shrink packaging labels. Competitive materials in these end-use markets are typically PET polymers, high densitypolyethylene, polyvinyl chloride ("PVC") and oriented polystyrene. Eastman’s primary brands for these markets are Eastar andEmbrace copolyesters.
In the in-store fixture and display market, Spectar copolyester is marketed primarily for point of purchase displays includingindoor sign and store fixtures. Eastar copolyester is marketed into the graphics market. Copolyester use in these end-use markets isexpected to grow above display market rates as a result of new business growth. Competitive materials in these end-use marketsare polymethylmethacrylate and polycarbonate.
17
Source: EASTMAN CHEMICAL CO, 10-K, March 01, 2007

Ø Optical Films and FibersPackaging, film and fiber products, which represented approximately 20 percent of the SP segment’s 2006 revenue, include a rangeof specialty polymer products for markets such as photographic film, optical film, fibers/nonwovens, tapes/labels and liquid crystaldisplays. Customers are typically manufacturers of film and fiber products, employing a range of processing technologies,including film melt extrusion, solvent casting, and fiber extrusion. These films and fibers products are further converted to producevalue-added products, such as photographic film, liquid crystal displays film, adhesive tape, or nonwoven articles, which are soldas branded items. Products include cellulose esters, copolyesters, specialty polyesters and concentrates/additives. Sales of productsthat are used as raw materials in traditional photographic markets continue to be under pressure due to the conversion of traditionalphotographic technology to digital imaging. The SP segment has commercialized a new family of materials, Visualize celluloseesters, for the liquid crystal displays market.
•��Strategy and Innovation
The SP segment is focused on delivering consistent gross margins and reinvesting for continued growth. Over the past three years, theSP segment has divested certain non-core businesses, shut-down certain non-integrated manufacturing operations, and expandedcertain integrated facilities. The Company continues to leverage the advantages of being an integrated polyester manufacturer and willcontinue to pursue opportunities within the integrated polyester stream. The SP segment is taking advantage of the opportunity toutilize rationalized PET assets to reduce copolyester conversion costs and enhance its ability to market its products against competitivematerials. This opportunity is expected to capture the synergies of the Performance Polymers segment's integrated structure and the SPsegment's ability to develop higher value markets. These synergies should enable the SP segment to reduce costs and expandproduction, increase the scale necessary to substitute for competitive materials, and focus on targeted growth markets. The SP segmentcontinues to pursue growth by investing in marketing, research and development, and manufacturing to meet the needs of the globalmarketplace. For example, the segment is beginning a capital project to increase copolyester capacity at Eastman's South Carolina sitein order to meet expected growth in global demand. The SP segment is also expanding its Kingsport-based CHDM capacity to provideadditional intermediates to support global market growth for copolyester products. The SP segment is also investigating options toincrease capacity for its cellulose ester products to support continued demand in key markets such as liquid crystal displays.
Eastman has a broad portfolio of key monomers that can be combined in various ways to yield a range of polymers with widelyvarying properties for different applications. Development of proprietary technology is currently underway to enable the SP segmentto produce a new family of products that would allow entry into applications that have been beyond the reach of the current portfolioof copolyester products. This new copolyester innovation is expected to offer a combination of chemical and temperature resistancethat should enable the SP segment to create new material solutions in markets and applications that the SP segment's currentcopolyesters have insufficient properties to meet. These new applications are estimated to represent 1.5 billion pounds of opportunitiesin markets such as medical, building and construction, durables and personal care. The SP segment anticipates having commercialproduct available for these new applications by the end of 2007.
The Company competes in market niches requiring polymers with combinations of clarity, toughness, and chemical resistance. Theliquid crystal display market is a developing growth market for the SP segment. The Company is investing in the development ofcopolyester and cellulosic based product solutions for this high-growth market, with the objective of becoming a strategic raw materialsupplier in the liquid crystal displays market. The SP segment's management anticipates continued strong growth of Visualizecellulose esters.
The SP segment develops product enhancements in order to respond to specific market needs, and expects this to result in increasedmarket penetration for existing products. Likewise, the introduction of new products will provide access to previously underservedmarkets. In addition, the SP segment is focusing on global growth by investing resources to provide product solutions to customers inpreviously underserved regional markets. The SP segment model of innovation leverages a unique and growing portfolio of cellulosicsand specialty copolyesters, such as Visualize cellulose esters for liquid crystal displays, Embrace copolyesters for shrink films, andEastar copolyesters for cosmetics packaging and clear handleware containers.
18
Source: EASTMAN CHEMICAL CO, 10-K, March 01, 2007

The Company is a major supplier of resins to the specialty film and sheet markets. With Eastman serving less than 10 percent of theglobal specialty film and sheet end-use markets, substantial growth opportunities exist for Eastman. The growth strategy is topenetrate new market segments or geographies and offer a substitute for other materials by providing an improved value proposal ordesign flexibility that enhances the growth potential of the Company’s customers. One example is Eastman's technology forEncapsulated Image Layer Technology ("EILT"). EILT deploys patented technology that allows licensees to construct decorativelaminate sheeting using Eastman copolyesters for high value architectural design applications.
•��Customers and Markets
The customer base in the SP segment is broad and diverse, consisting of over 700 companies worldwide in a variety of industries.Approximately 80 percent of the SP segment’s 2006 revenue was attributable to approximately 70 customers. The SP segment seeksto develop mutually beneficial relationships with its customers throughout various stages of product life cycles. By doing so, it isbetter able to understand its customers’ needs as those customers develop new products, and more effectively bring new solutions tomarket.
•��Competition
Competition in the SP segment varies as a function of where the products are in their life cycle. For example, the SP segment'sproducts in the introduction phase of the life cycle compete mainly on the basis of performance. As products begin to advance in thelife cycle, and substitute products come into existence, the basis of competition begins to shift, taking into account factors such asprice, customer service, and brand loyalty. At maturity, where one or more competitors may have equivalent products in the market,competition is based primarily on price. Many large, well-recognized manufacturers produce substitute products of different materials,some of which may offer better performance characteristics than those of the Company's products, and others of which may be offeredat a lower price.
The SP segment has a full array of products moving across the life cycle as described above. For example, two commonly usedplastics materials in the heavy gauge sheet market are acrylic and polycarbonate. In general, acrylics are lower in cost, whilepolycarbonates provide higher performance at a higher cost. Eastman’s products capture portions of both markets. Customers of theSP segment can select from products that offer improved performance over acrylics at a slightly higher cost, or products that are lowercost than polycarbonates while still possessing excellent performance properties. In this way, the SP segment is able to meet theindustry need for low-cost, high performance plastics materials and maintain a significant advantage over its competitors. With regardto engineering and specialty polymers products, the Company competes in market areas requiring polymers with combinations ofclarity, toughness, and chemical resistance. Eastman’s primary competitors for engineering and specialty polymers are companiessuch as Bayer AG, Lanxess AG, Dow, GE Plastics, Nova Chemicals Corporation and others, including polycarbonate, acrylic andclear acrylonitrile butadiene styrene producers in regions outside North America. Specialty film and sheet competitors also includepolymer companies, such as GE Plastics, Bayer AG, Dow, Cyro Industries, Ineos, Atoglas, SK Chemical Industries, and Selenis,which sell copolyesters, polycarbonate, acrylic, and/or polyvinyl chloride resins. Competition for packaging, film and fiber products isprimarily from other producers of polyester and producers of cellulose ester polymers such as Acetati SpA and Daicel. Competitionwith other polymers such as acrylic, PVC, polystyrene, polypropylene and polycarbonate is also significant in several markets andapplications. Channels to customers include corporate accounts, direct sales, e-commerce, and distributors.
The SP segment believes that it maintains competitive advantages over its competitors throughout the product life cycle. At productintroduction, the segment’s breadth of offerings combined with its research and development capabilities and customer serviceorientation enable it to quickly bring a wide variety of products to market. As products enter the growth phase of the life cycle, the SPsegment is able to continue to leverage its product breadth by receiving revenues from multiple sources, as well as retaining customersfrom long-term relationships. As products become price sensitive, the SP segment can take advantage of Eastman's scale of operationsand vertical integration to maintain a superior product conversion cost position.
19
Source: EASTMAN CHEMICAL CO, 10-K, March 01, 2007

The SP segment believes it has competitive advantages in copolyester and cellulose esters plastics. However, new competitors havebegun selling copolyester products in the past few years. These new competitors cannot yet produce the wide variety of specialtycopolyesters offered by the SP segment or offer the same level of technical assistance. Additionally, the Company is committed toinvesting for growth in SP product lines to support continued market growth and maintaining the cost advantages obtained from itsscale of operations and manufacturing expertise. There can be no assurance, however, that the SP segment will be able to maintain thiscompetitive advantage and if it is unable to do so, its results of operations could be adversely affected.
EASTMAN CHEMICAL COMPANY GENERAL INFORMATION
Sales, Marketing, and Distribution
The Company markets products primarily through a global sales organization, which has a presence in the United States and in over35 other countries around the world. Eastman has a number of broad product lines which require a sales and marketing strategy that istailored to specific customers in order to deliver high quality products and high levels of service to all of its customers worldwide.Technical expertise and process knowledge are critical in determining the application of products for a particular customer. Through ahighly skilled and specialized sales force that is capable of providing customized business solutions for each of its five operatingsegments, Eastman is able to establish long-term customer relationships and strives to become the preferred supplier of specialtychemicals and plastics.
The Company's products are marketed through a variety of selling channels, with the majority of sales being direct and the balancesold primarily through indirect channels such as distributors. Non-U.S. sales tend to be made more frequently through distributors thanU.S. sales. The Company's customers throughout the world have the choice of obtaining products and services through Eastman'swebsite, www.eastman.com, through any of its global customer service centers, or through any of Eastman's direct sales force orindependent distributors. Customers who choose to use the Company’s website can conduct a wide range of business transactions suchas ordering online, accessing account and order status, and obtaining product and technical data. Eastman is an industry leader in theimplementation and utilization of e-business technology for marketing and selling products to customers and was one of the firstchemical companies to offer this capability. Eastman views this as an opportunity to increase supply chain efficiency by having anenterprise resource-planning platform with connectivity to customers. These sales and marketing capabilities combine to reduce costsand provide a platform for growth opportunities for the Company by providing potential customers new methods to access Eastman’sproducts.
The Company’s products are shipped to customers directly from Eastman's manufacturing plants as well as from distribution centersworldwide, with the method of shipment generally determined by the customer. Sources and Availability of Raw Materials and Energy
Eastman purchases a substantial portion, estimated to be approximately 80 percent, of its key raw materials and energy throughlong-term contracts, generally of three to five years initial duration with renewal or cancellation options for each party. Most of thoseagreements do not require the Company to purchase materials or energy if its operations are reduced or idle. The cost of raw materialsand energy is generally based on market price at the time of purchase, although derivative financial instruments, valued at quotedmarket prices, have been utilized to mitigate the impact of short-term market price fluctuations. Key raw materials and purchasedenergy include propane, ethane, paraxylene, ethylene glycol, PTA, natural gas, coal, cellulose, methanol, electricity, and a widevariety of precursors for specialty organic chemicals. The Company has multiple suppliers for most key raw materials and energy anduses quality management principles, such as the establishment of long-term relationships with suppliers and on-going performanceassessment and benchmarking, as part of the supplier selection process. When appropriate, the Company purchases raw materials froma single source supplier to maximize quality and cost improvements, and has developed contingency plans that would minimize theimpact of any supply disruptions from single source suppliers.
20
Source: EASTMAN CHEMICAL CO, 10-K, March 01, 2007

While temporary shortages of raw materials and energy may occasionally occur, these items are generally sufficiently available tocover current and projected requirements. However, their continuous availability and price are subject to unscheduled plantinterruptions occurring during periods of high demand, or due to domestic or world market and political conditions, changes ingovernment regulation, natural disasters, war or other outbreak of hostilities. Eastman’s operations or products have been in the pastand may be in the future, at times, adversely affected by these factors. The Company’s cost of raw materials and energy as a percent oftotal cost of operations was estimated to be approximately 70 percent for 2006, compared with 65 percent in 2005 and 55 percent in2004.
Capital Expenditures
Capital expenditures were $389 million, $343 million, and $248 million for 2006, 2005 and 2004, respectively. The Company expectsthat 2007 capital spending will be up to $450 million which will exceed estimated 2007 depreciation and amortization ofapproximately $350 million, including accelerated depreciation of approximately $50 million, as it funds targeted growth efforts.
Employees
Eastman employs approximately 11,000 men and women worldwide. Approximately 7 percent of the total worldwide labor force isrepresented by unions, mostly outside the United States.
Customers
Eastman has an extensive customer base and, while it is not dependent on any one customer, loss of certain top customers couldadversely affect the Company until such business is replaced. The top 100 customers accounted for approximately 65 percent of theCompany's 2006 sales revenue.
Intellectual Property and Trademarks
While the Company’s intellectual property portfolio is an important Company asset which it expands and vigorously protects globallythrough a combination of patents that expire at various times, trademarks, copyrights, and trade secrets, neither its business as a wholenor any particular segment is materially dependent upon any one particular patent, trademark, copyright, or trade secret. As a producerof a broad and diverse portfolio of both specialty and commodity chemicals, plastics, and fibers, Eastman owns over 850 active UnitedStates patents and more than 1,500 active foreign patents, expiring at various times over several years, and also owns over 3,000active worldwide trademarks. The Company’s intellectual property relates to a wide variety of products and processes. With tworecent significant research and development innovations, Eastman continues to actively protect its intellectual property. In support ofthe development of the IntegRex technology, the Company has filed over 140 patent applications. In support of the development of thecopolyester innovation products, the Company has filed over 50 patent applications. Eastman can not assure that a patent will begranted from every application filed. As the laws of many foreign countries do not protect intellectual property to the same extent asthe laws of the United States, Eastman cannot assure that it will be able to adequately protect its intellectual property assets.
Research and Development
For 2006, 2005 and 2004, Eastman’s research and development expenses totaled $167 million, $162 million and $154 million,respectively. Research and development expenses are expected to decrease slightly in 2007 due to divestitures, partially offset byincreased spending on growth initiatives.
Environmental
Eastman is subject to laws, regulations, and legal requirements relating to the use, storage, handling, generation, transportation,emission, discharge, disposal and remediation of, and exposure to, hazardous and non-hazardous substances and wastes in all of thecountries in which it does business. These health, safety and environmental considerations are a priority in the Company’s planningfor all existing and new products and processes. The Health, Safety, Environmental and Security Committee of Eastman’s Board ofDirectors reviews the Company's policies and practices concerning health, safety and the environment and its processes for complyingwith related laws and regulations, and monitors related matters.
21
Source: EASTMAN CHEMICAL CO, 10-K, March 01, 2007

The Company’s policy is to operate its plants and facilities in a manner that protects the environment and the health and safety of itsemployees and the public. The Company intends to continue to make expenditures for environmental protection and improvements ina timely manner consistent with its policies and with the technology available. In some cases, applicable environmental regulationssuch as those adopted under the U.S. Clean Air Act and Resource Conservation and Recovery Act, and related actions of regulatoryagencies, determine the timing and amount of environmental costs incurred by the Company.
The Company accrues environmental costs when it is probable that the Company has incurred a liability and the amount can bereasonably estimated. In some instances, the amount cannot be reasonably estimated due to insufficient data, particularly in the natureand timing of the future performance. In these cases, the liability is monitored until such time that sufficient data exists. With respectto a contaminated site, the amount accrued reflects the Company’s assumptions about remedial requirements at the site, the nature ofthe remedy, the outcome of discussions with regulatory agencies and other potentially responsible parties at multi-party sites, and thenumber and financial viability of other potentially responsible parties. Changes in the estimates on which the accruals are based,unanticipated government enforcement action, or changes in health, safety, environmental, chemical control regulations, and testingrequirements could result in higher or lower costs.
The Company's cash expenditures related to environmental protection and improvement were estimated to be approximately $215million, $198 million and $184 million in 2006, 2005 and 2004, respectively. These amounts pertain primarily to operating costsassociated with environmental protection equipment and facilities, but also include expenditures for construction and development.The Company does not expect future environmental capital expenditures arising from requirements of recently promulgatedenvironmental laws and regulations to materially increase the Company's planned level of annual capital expenditures forenvironmental control facilities.
Other matters concerning health, safety, and the environment are discussed in Management's Discussion and Analysis of FinancialCondition and Results of Operations in Part II Item 7 and in Notes 1, "Significant Accounting Policies", and 12, "EnvironmentalMatters", to the Company’s consolidated financial statements in Part II, Item 8 of this 2006 Annual Report on Form 10-K.
Backlog
On January 1, 2007, Eastman’s backlog of firm sales orders was estimated to be approximately $290 million compared withapproximately $295 million at January 1, 2006. All orders are expected to be filled in 2007. The Company manages its inventorylevels to control the backlog of products depending on customers' needs. In areas where the Company is the single source of supply, orcompetitive forces or customers' needs dictate, the Company may carry additional inventory to meet customer requirements.
Financial Information About Geographic Areas
For revenues and long-lived assets by geographic areas, see Note 21, "Segment Information", to the Company’s consolidated financialstatements in Part II, Item 8 of this 2006 Annual Report on Form 10-K.
Available Information - SEC Filings and Corporate Governance Materials
The Company makes available free of charge, through the "Investors - SEC Filings" section of its Internet website(www.eastman.com), its annual reports on Form 10-K, quarterly reports on Form 10-Q, current reports on Form 8-K, and amendmentsto those reports filed or furnished pursuant to Section 13(a) or 15(d) of the Securities Exchange Act of 1934, as soon as reasonablypracticable after electronically filing such material with, or furnishing it to, the Securities and Exchange Commission (the "SEC").Once filed with the SEC, such documents may be read and/or copied at the SEC’s Public Reference Room at 100 F Street N.E.,Washington, D.C. 20549. Information on the operation of the Public Reference Room may be obtained by calling the SEC at1-800-SEC-0330. In addition, the SEC maintains an Internet site that contains reports, proxy and information statements, and otherinformation regarding issuers, including Eastman Chemical Company, that electronically file with the SEC at http://www.sec.gov.
22
Source: EASTMAN CHEMICAL CO, 10-K, March 01, 2007

The Company also makes available free of charge, through the "Investors - Corporate Governance" section of its internet website(www.eastman.com), the Corporate Governance Guidelines of its Board of Directors, the charters of each of the committees of theboard, and codes of ethics and business conduct for directors, officers and employees. Such materials are also available in print uponthe written request of any stockholder to Eastman Chemical Company, P.O. Box 431, Kingsport, Tennessee 37662-5280, Attention:Investor Relations.
Stockholder Information
Corporate Offices Address: See Cover Page to this Form 10-KTelephone: 877-EMN-INFO (877-366-4636)Corporate Website: www.eastman.com
Annual Meeting:Toy F. Reid Employee CenterKingsport, TennesseeThursday, May 3, 200711:30 a.m. (ET)
Stock Exchange Listing:Eastman Chemical Company common stock is listed and traded on the New York Stock Exchange under the ticker symbol "EMN."Most newspaper tables list the Company's stock as "EmanChem."
Stock Transfer Agent and Registrar:Inquiries and changes to stockholder accounts should be directed to our transfer agent:American Stock Transfer & Trust Company59 Maiden LaneNew York, NY 10038In the United States: 800-937-5449Outside the United States: (1) 212-936-5100 or (1) 718-921-8200Website: //www.amstock.com
New York Stock Exchange and Securities and Exchange Commission Certifications
In 2006, the Company submitted to the New York Stock Exchange (the "NYSE") the certification of the Chief Executive Officer thathe was not aware of any violation by Eastman Chemical Company of the NYSE's corporate governance listing standards as requiredby Section 303A.12(a) of the New York Stock Exchange Listed Company Manual. In addition, the Company has filed with the SEC,as exhibits to this Form 10-K for the year ended December 31, 2006, the Chief Executive Officer's and Chief Financial Officer'scertifications regarding the quality of the Company's public disclosure, disclosure controls and procedures, and internal controls overfinancial reporting as required by Section 302 of the Sarbanes-Oxley Act of 2002 and related SEC rules.
ITEM 1A. RISK FACTORS
For identification and discussion of the most significant risks applicable to the Company and its business, see Part II - Item 7 -"Management's Discussion and Analysis of Financial Condition and Results of Operations - Forward-Looking Statements and RiskFactors" of this 2006 Annual Report on Form 10-K.
ITEM 1B. UNRESOLVED STAFF COMMENTS
None.
23
Source: EASTMAN CHEMICAL CO, 10-K, March 01, 2007

EXECUTIVE OFFICERS OF THE COMPANY
Certain information about the Company's executive officers is provided below:
J. Brian Ferguson, age 52, is Chairman of the Board and Chief Executive Officer. Mr. Ferguson joined the Company in 1977. He wasnamed Vice President, Industry and Federal Affairs in 1994, became Managing Director, Greater China in 1996, was named President,Eastman Chemical Asia Pacific in 1998, became President, Polymers Group in 1999, became President, Chemicals Group in 2001,and was elected to his current position in 2002.
James P. Rogers, age 55, is President of Eastman Chemical Company and Chemicals & Fibers Business Group Head. Mr. Rogers wasappointed Executive Vice President of the Company and President of Eastman Division effective November 2003. Mr. Rogers joinedthe Company in 1999 as Senior Vice President and Chief Financial Officer and in 2002, was also appointed Chief Operations Officerof Eastman Division. He was appointed to his current position in 2006. Mr. Rogers served previously as Executive Vice President andChief Financial Officer of GAF Materials Corporation ("GAF"). He also served as Executive Vice President, Finance, of InternationalSpecialty Products, Inc., which was spun off from GAF in 1997. Gregory O. Nelson, age 55, is Executive Vice President and Polymers Business Group Head. Dr. Nelson joined Eastman in 1982 as aresearch chemist and held a number of positions in the research and development organization. He became Director, PolymersResearch Division in 1995 and was named Vice President, Polymers Technology in 1997. He was appointed as Chief TechnologyOfficer in 2001 and named Senior Vice President in 2002. He was appointed to his present position in 2006.
Mark Costa, age 40, is Senior Vice President, Corporate Strategy & Marketing. Prior to joining Eastman on June 1, 2006, Mr. Costawas a senior partner within Monitor Group's integrated North American and global client service networks. He joined Monitor in 1988and his experience included corporate and business unit strategies, asset portfolio strategies, innovation and marketing, and channelstrategies across a wide range of industries, including specialty and commodity chemicals, electricity, natural gas and truck/automanufacturing. Theresa K. Lee, age 54, is Senior Vice President, Chief Legal Officer and Corporate Secretary. Ms. Lee joined Eastman as a staffattorney in 1987, served as Assistant General Counsel for the health, safety, and environmental legal staff from 1993 to 1995, andserved as Assistant General Counsel for the corporate legal staff from 1995 until her appointment as Vice President, Associate GeneralCounsel and Secretary in 1997. She became Vice President, General Counsel, and Corporate Secretary of Eastman in 2000 and wasappointed to her current position in 2002.
Richard A. Lorraine, age 61, joined Eastman in November 2003 as Senior Vice President and Chief Financial Officer. Mr. Lorraineserved as Executive Vice President and Chief Financial Officer of Occidental Chemical Corporation from 1995 until 2003, and at ITTAutomotive Group as President of the Aftermarket Group from 1990 to 1995 and Vice President and Chief Financial Officer from1985 to 1990. Mr. Lorraine started his career with Westinghouse Electric Corporation, where he held various financial positions.
Ronald C. Lindsay, age 48, is Senior Vice President and Chief Technology Officer. He joined Eastman in 1980 and held a number ofpositions in manufacturing and business organizations. In 2003, Mr. Lindsay was appointed Vice President and General Manager ofthe Intermediates Business Organization and in 2005 he became Vice President, Performance Chemicals Business. He was appointedto his current position in April 2006.
Norris P. Sneed, age 51, is Senior Vice President, Human Resources, Communications and Public Affairs. Mr. Sneed joined theCompany in 1979 as a chemical engineer. In 1989, he was assigned to Eastman’s Arkansas Operations where he was superintendentfor different manufacturing and new business development departments. In 1997, he served as assistant to the Chief Executive Officer.He was named managing director for Eastman’s Argentina operations in 1999, Vice President of Organization Effectiveness in 2001,and was appointed to his current position in June 2003.
Curtis E. Espeland, age 42, is Vice President, Finance, and Chief Accounting Officer. Mr. Espeland joined Eastman in 1996, and hasserved in various financial management positions, including Controller; Director of Corporate Planning and Forecasting; Director ofFinancial Services, Asia Pacific; and Director of Internal Auditing. He has served as the Company's Chief Accounting Officer sinceDecember 2002. Prior to joining Eastman, Mr. Espeland was an audit and business advisory manager with Arthur Andersen LLP.
24
Source: EASTMAN CHEMICAL CO, 10-K, March 01, 2007

ITEM 2. PROPERTIES
PROPERTIES
At December 31, 2006, Eastman operated 16 manufacturing sites in 10 countries. Utilization of these facilities may vary with productmix and economic, seasonal, and other business conditions, but, except as indicated below, none of the principal plants aresubstantially idle. The Company's plants, including approved expansions, generally have sufficient capacity for existing needs andexpected near-term growth. These plants are generally well maintained, in good operating condition, and suitable and adequate fortheir use. Unless otherwise indicated, all of the properties are owned. The locations and general character of the major manufacturingfacilities are:
Segment using manufacturing facility Location
CASPI
PCI
SP
Performance
Polymers
Fibers USA Jefferson, Pennsylvania x Columbia, South Carolina x x Kingsport, Tennessee x x x x xLongview, Texas x x Franklin, Virginia* x Europe Workington, England x xMiddelburg, the Netherlands x Rotterdam, the Netherlands* x San Roque, Spain*** x Llangefni, Wales x Asia Pacific Kuantan, Malaysia* x Jurong Island, Singapore* x x Zibo City, China** x x Latin AmericaZarate, Argentina
x
Cosoleacaque, Mexico x Uruapan, Mexico x
* indicates a location that Eastman leases from a third party.** Eastman holds a 51 percent share in the joint venture Qilu Eastman Specialty Chemical Ltd.*** In first quarter 2007, the Company entered into an agreement to sell this manufacturing site.
In addition, Eastman has a 50 percent interest in Primester, a joint venture that manufactures cellulose acetate at Eastman's Kingsport,Tennessee plant. The production of cellulose acetate is an intermediate step in the manufacture of acetate tow and other celluloseacetate based products. The Company also has a 50 percent interest in a manufacturing facility in Nanjing, China. The Nanjing facilityproduces Eastotac hydrocarbon tackifying resins for pressure-sensitive adhesives, caulks, and sealants. Eastotac hydrocarbon resinsare also used to produce hot melt adhesives for packaging applications in addition to glue sticks, tapes, labels, and other adhesiveapplications.
Eastman has distribution facilities at all of its plant sites. In addition, the Company owns or leases over 100 stand-alone distributionfacilities in the United States and 17 other countries. Corporate headquarters are in Kingsport, Tennessee. The Company's regionalheadquarters are in Miami, Florida; Capelle aan den Ijssel, the Netherlands; Zug, Switzerland; Singapore; and Kingsport, Tennessee.Technical service is provided to the Company's customers from technical service centers in Kingsport, Tennessee; Kirkby, England;Shanghai, China and Singapore. Customer service centers are located in Kingsport, Tennessee; Capelle aan den Ijssel, theNetherlands; Miami, Florida; and Singapore.
A summary of properties, classified by type, is included in Note 3, "Properties and Accumulated Depreciation", to the Company’sconsolidated financial statements in Part II, Item 8 of this 2006 Annual Report on Form 10K.
25
Source: EASTMAN CHEMICAL CO, 10-K, March 01, 2007

ITEM 3. LEGAL PROCEEDINGS
General
From time to time, the Company and its operations are parties to, or targets of, lawsuits, claims, investigations and proceedings,including product liability, personal injury, asbestos, patent and intellectual property, commercial, contract, environmental, antitrust,health and safety, and employment matters, which are being handled and defended in the ordinary course of business. While theCompany is unable to predict the outcome of these matters, it does not believe, based upon currently available facts, that the ultimateresolution of any such pending matters, including the sorbates litigation and the asbestos litigation (described below), will have amaterial adverse effect on its overall financial condition, results of operations or cash flows. However, adverse developments couldnegatively impact earnings or cash flows in a particular future period.
Sorbates Litigation
Two civil cases relating to sorbates remain. In each case, the Company prevailed at the trial court, and in each case, the plaintiffappealed the trial court's decision. In one case, the appeal is still pending. In the other case, the court of appeals overturned the trialcourt's decision and ruled that the plaintiff could amend and re-file its complaint with the trial court. The Company has appealed thiscourt of appeals decision to the state supreme court. In each case the Company intends to continue to vigorously defend its position. Asbestos Litigation
Over the years, Eastman has been named as a defendant, along with numerous other defendants, in lawsuits in various state courts inwhich plaintiffs have alleged injury due to exposure to asbestos at Eastman’s manufacturing sites. More recently, certain plaintiffshave claimed exposure to an asbestos-containing plastic, which Eastman manufactured in limited amounts between the mid-1960’sand the early 1970’s.
To date, the Company has obtained dismissals or settlements of its asbestos-related lawsuits with no material effect on its financialcondition, results of operations or cash flows, and over the past several years, has substantially reduced its number of pendingasbestos-related claims. The Company has also obtained insurance coverage that applies to a portion of certain of the Company’sdefense costs and payments of settlements or judgments in connection with asbestos-related lawsuits.
Based on an ongoing evaluation, the Company believes that the resolution of its pending asbestos claims will not have a materialimpact on the Company’s financial condition, results of operations, or cash flows, although these matters could result in the Companybeing subject to monetary damages, costs or expenses, and charges against earnings in particular periods.
Middelburg (Netherlands) Environmental Proceeding
In June 2005, Eastman Chemical Middelburg, B.V., a wholly owned subsidiary of the Company, (the "Subsidiary") received asummons from the Middelburg (Netherlands) District Court Office to appear before the economic magistrate of that District andrespond to allegations that the Subsidiary's manufacturing facility in Middelburg has exceeded certain conditions in the permit thatallows the facility to discharge wastewater into the municipal wastewater treatment system. The summons proposed penalties inexcess of $100,000 as a result of the alleged violations. A hearing in this matter took place on July 28, 2005, at which time themagistrate bifurcated the proceeding into two phases: a compliance phase and an economic benefit phase. With respect to thecompliance phase, the magistrate levied a fine of less than $100,000. With respect to the economic benefit phase, where the prosecutorproposed a penalty in excess of $100,000, the district court in November 2006 assessed against the Subsidiary a penalty of less than$100,000. The prosecutor has appealed this ruling, and the appeal is pending. This disclosure is made pursuant to SEC RegulationS-K, Item 103, Instruction 5.C., which requires disclosure of administrative proceedings commenced under environmental laws thatinvolve governmental authorities as parties and potential monetary sanctions in excess of $100,000. The Company believes that theultimate resolution of this proceeding will not have a material impact on the Company’s financial condition, results of operations, orcash flows.
26
Source: EASTMAN CHEMICAL CO, 10-K, March 01, 2007

Jefferson (Pennsylvania) Environmental Proceeding
In December 2005, Eastman Chemical Resins, Inc., a wholly-owned subsidiary of the Company (the "ECR Subsidiary"), received aNotice of Violation ("NOV") from the United States Environmental Protection Agency's Region III Office ("EPA") alleging that theECR Subsidiary's West Elizabeth, Jefferson Borough, Allegheny County, Pennsylvania manufacturing operation (the "JeffersonFacility") violated certain federally enforceable local air quality regulations and certain provisions in a number of air quality-relatedpermits. The NOV did not assess a civil penalty and EPA has to date not proposed any specific civil penalty amount. In October 2006,EPA referred the matter to the United States Department of Justice's Environmental Enforcement Section ("DOJ"). Companyrepresentatives met with EPA and DOJ in November, 2006 and subsequent to that meeting the Company determined that it is notreasonably likely that any civil penalty assessed by the EPA and DOJ will be less than $100,000. While the Company intends tovigorously defend against these allegations, this disclosure is made pursuant to SEC Regulation S-K, Item 103, Instruction 5.C., whichrequires disclosure of administrative proceedings commenced under environmental laws that involve governmental authorities asparties and potential monetary sanctions in excess of $100,000. The Company believes that the ultimate resolution of this proceedingwill not have a material impact on the Company's financial condition, results of operations, or cash flows.
ITEM 4. SUBMISSION OF MATTERS TO A VOTE OF SECURITY HOLDERS
There were no matters submitted to a vote of the Company's stockholders during the fourth quarter of 2006.
27
Source: EASTMAN CHEMICAL CO, 10-K, March 01, 2007

PART II
ITEM 5. MARKET FOR THE REGISTRANT'S COMMON STOCK, RELATED STOCKHOLDER MATTERS ANDISSUER PURCHASES OF EQUITY SECURITIES
(a) Eastman Chemical Company's ("Eastman" or the "Company") common stock is traded on the New York Stock Exchange("NYSE") under the symbol "EMN". The following table presents the high and low sales prices of the common stock on the NYSEand the cash dividends per share declared by the Company's Board of Directors for each quarterly period of 2006 and 2005.
High
Low
CashDividendsDeclared
2006 First Quarter $
53.83 $
47.30 $
0.44 Second Quarter 58.15 50.00 0.44 Third Quarter 54.69 48.72 0.44 Fourth Quarter 61.29 53.62 0.44
2005 First Quarter $
61.80 $
50.48 $
0.44 Second Quarter 60.80 47.40 0.44 Third Quarter 58.38 44.10 0.44 Fourth Quarter 56.77 45.34 0.44
As of December 31, 2006, there were 83,637,623 shares of the Company's common stock issued and outstanding, which shares wereheld by 29,190 stockholders of record. These shares include 106,771 shares held by the Company's charitable foundation. TheCompany has declared a cash dividend of $0.44 per share during the first quarter of 2007. Quarterly dividends on common stock, ifdeclared by the Company's Board of Directors, are usually paid on or about the first business day of the month following the end ofeach quarter. The payment of dividends is a business decision made by the Board of Directors from time to time based on theCompany's earnings, financial position and prospects, and such other considerations as the Board considers relevant. Accordingly,while management currently expects that the Company will continue to pay the quarterly cash dividend, its dividend practice maychange at any time.
During the fourth quarter of 2006, the Board of Directors of the Company redeemed all of the outstanding preferred stock purchaserights issuable pursuant to the Stockholder Protection Rights Agreement and terminated the Stockholder Protection Rights Agreement. See Part III, Item 12 — “Security Ownership of Certain Beneficial Owners and Management and Related StockholderMatters—Securities Authorized for Issuance Under Equity Compensation Plans” of this 2006 Annual Report on Form 10-K for theInformation required by Item 201(d) of Regulation S-K.
(b) Not applicable
28
Source: EASTMAN CHEMICAL CO, 10-K, March 01, 2007

(c) Purchases of Equity Securities by the Issuer and Affiliated Purchasers
Period
Total Numberof Shares
Purchased(1)
Average PricePaid Per Share
(2)
Total Number ofShares Purchased as
Part of PubliclyAnnounced Plans
or Programs(3)
ApproximateDollar
Value (in Millions)that May Yet BePurchased Under
the Plans orPrograms
(3)October 1- 31, 2006 59,526 $ 60.48 0 November 1-30, 2006 44,517 $ 58.87 0 December 1-31, 2006 8,107 $ 58.03 0 Total 112,150 0 $ 288
(1) Shares surrendered to the Company by employees to satisfy individual tax withholding obligations upon vesting of previouslyissued shares of restricted common stock and shares surrendered by employees as payment to the Company of the purchaseprice for shares of common stock under the terms of previously granted stock options. Shares are not part of any Companyrepurchase plan.
(2) Average price paid per share reflects the weighted average of the closing price of Eastman common stock on the business daysthe shares were surrendered by the employee stockholders.
(3) The Company was authorized by the Board of Directors on February 4, 1999 to repurchase up to $400 million of its commonstock. Common share repurchases under this authorization in 1999, 2000 and 2001 were $51 million, $57 million and $4million, respectively. The Company has not repurchased any common shares under this authorization after 2001. On February20, 2007, the Board of Directors cancelled its prior authorization for stock repurchases dated February 4, 1999 and approved anew authorization for the repurchase of up to $300 million of the Company's outstanding common stock at such times, in suchamounts, and on such terms, as determined to be in the best interests of the Company. Repurchased shares may be used forsuch purposes or otherwise applied in such a manner as determined to be in the best interests of the Company. For additionalinformation, see Note 14, "Stockholders' Equity", to the Company’s consolidated financial statements in Part II, Item 8 of this2006 Annual Report on Form 10-K.
29
Source: EASTMAN CHEMICAL CO, 10-K, March 01, 2007

ITEM 6. SELECTED FINANCIAL DATA
Summary of Operating Data (Dollars in millions, except per shareamounts)
2006 2005 2004 2003 2002
Sales $ 7,450 $ 7,059 $ 6,580 $ 5,800 $ 5,320Operating earnings (loss) 640 757 175 (267) 208Earnings (loss) before cumulative effect
of change in accounting principles
409
557
170
(273)
79Cumulative effect of change in
accounting principles, net -- -- -- 3 (18)Net earnings (loss) $ 409 $ 557 $ 170 $ (270) $ 61 Basic
Earnings (loss) per share before cumulative effect of change in accounting principles $ 4.98 $ 6.90 $ 2.20 $ (3.54) $ 1.02
Cumulative effect of change in accounting principles, net -- -- -- 0.04 (0.23)
Net earnings (loss) per share $ 4.98 $ 6.90 $ 2.20 $ (3.50) $ 0.79 Diluted
Earnings (loss) per share before cumulative effect of change in accounting principles $ 4.91 $ 6.81 $ 2.18 $ (3.54) $ 1.02
Cumulative effect of change in accounting principles, net -- -- -- 0.04 (0.23)
Net earnings (loss) per share $ 4.91 $ 6.81 $ 2.18 $ (3.50) $ 0.79 Statement of Financial Position Data Current assets $ 2,422 $ 1,924 $ 1,768 $ 2,010 $ 1,547Net properties 3,069 3,162 3,192 3,419 3,753Total assets 6,173 5,773 5,839 6,244 6,287Current liabilities 1,059 1,051 1,099 1,477 1,247Long-term borrowings 1,589 1,621 2,061 2,089 2,054Total liabilities 4,144 4,161 4,655 5,201 5,016Total stockholders’ equity 2,029 1,612 1,184 1,043 1,271Dividends declared per share 1.76 1.76 1.76 1.76 1.76
Effective January 1, 2003, the Company’s method of accounting for environmental closure and post-closure costs changed as a resultof the adoption of Statement of Accounting Standards ("SFAS") No. 143, “Accounting for Asset Retirement Obligations.” If theprovisions of SFAS No. 143 had been in effect in prior years, the impact on the Company’s financial results would have beenimmaterial. For additional information see Note 12, "Environmental Matters", to the Company’s consolidated financial statements inPart II, Item 8 of the 2005 Annual Report on Form 10-K.
On July 31, 2004, the Company completed the sale of certain businesses, product lines and related assets within the Coatings,Adhesives, Specialty Polymers and Inks ("CASPI") segment. For more information regarding the impact of this divestiture onfinancial results, refer to the CASPI segment discussion of Part II, Item 7 - "Management Discussion and Analysis" of this 2006Annual Report on Form 10-K.
In second quarter 2005, the Company completed the sale of its equity investment in Genencor International, Inc. ("Genencor"). Formore information, refer to Note 5, "Equity Investments and Other Noncurrent Assets and Liabilities", to the Company's consolidatedfinancial statements in Part II, Item 8 of this 2006 Annual Report on Form 10-K.
30
Source: EASTMAN CHEMICAL CO, 10-K, March 01, 2007

In second quarter 2005, the Company completed the early repayment of $500 million of its outstanding long-term bonds. For moreinformation, refer to Note 8, "Early Extinguishment of Debt", to the Company's consolidated financial statements in Part II, Item 8 ofthis 2006 Annual Report on Form 10-K.
In fourth quarter 2006, the Company completed the sale of its Batesville, Arkansas manufacturing facility and related assets andspecialty organic chemicals product lines in the Performance Chemicals and Intermediates segment and the sale of its polyethyleneand Epolene polymer businesses and related assets located at the Longview, Texas site and the Company's ethylene pipeline. Thepolyethylene assets and product lines were in the Performance Polymers segment, while the Epolene assets and product lines were inthe CASPI segment. For more information regarding the impact of these divestitures on financial results, refer to the segmentdiscussions of Part II, Item 7 - "Management Discussion and Analysis" and Part II, Item 8 - "Notes the Audited ConsolidatedFinancial Statements" - Note 24, "Divestitures" of this 2006 Annual Report on Form 10-K.
31
Source: EASTMAN CHEMICAL CO, 10-K, March 01, 2007

ITEM 7. MANAGEMENT'S DISCUSSION AND ANALYSIS OF FINANCIAL CONDITION AND RESULTS OFOPERATIONS
ITEM Page Critical Accounting Policies 33 2006 Overview 36 Results of Operations
Summary of Consolidated Results - 2006 Compared with 2005 37Summary by Operating Segment 40Summary by Customer Location - 2006 Compared with 2005 46Summary of Consolidated Results - 2005 Compared with 2004 47Summary by Operating Segment 50Summary by Customer Location - 2005 Compared with 2004 53
Liquidity, Capital Resources, and Other Financial Information 54 Environmental 59 Inflation 60 Recently Issued Accounting Standards 60 Outlook 62 Forward-Looking Statements and Risk Factors 63
This Management's Discussion and Analysis of Financial Condition and Results of Operations is based upon the consolidatedfinancial statements for Eastman Chemical Company ("Eastman" or the "Company"), which have been prepared in accordance withaccounting principles generally accepted in the United States, and should be read in conjunction with the Company's consolidatedfinancial statements included elsewhere in this Annual Report on Form 10-K. All references to earnings per share contained in thisreport are diluted earnings per share unless otherwise noted.
32
Source: EASTMAN CHEMICAL CO, 10-K, March 01, 2007

MANAGEMENT'S DISCUSSION AND ANALYSIS OF FINANCIAL
CONDITION AND RESULTS OF OPERATIONS CRITICAL ACCOUNTING POLICIES
In preparing the consolidated financial statements in conformity with accounting principles generally accepted in the United States,the Company’s management must make decisions which impact the reported amounts and the related disclosures. Such decisionsinclude the selection of the appropriate accounting principles to be applied and assumptions on which to base estimates and judgmentsthat affect the reported amounts of assets, liabilities, revenues and expenses, and related disclosure of contingent assets and liabilities.On an on-going basis, the Company evaluates its estimates, including those related to allowances for doubtful accounts, impairedassets, environmental costs, U.S. pension and other post-employment benefits, litigation and contingent liabilities, and income taxes.The Company bases its estimates on historical experience and on various other assumptions that are believed to be reasonable underthe circumstances, the results of which form the basis for making judgments about the carrying values of assets and liabilities that arenot readily apparent from other sources. Actual results may differ from these estimates under different assumptions or conditions. TheCompany’s management believes the critical accounting policies described below are the most important to the fair presentation of theCompany’s financial condition and results. These policies require management’s more significant judgments and estimates in thepreparation of the Company’s consolidated financial statements.
Allowances for Doubtful Accounts
The Company maintains allowances for doubtful accounts for estimated losses resulting from the inability of its customers to makerequired payments. The Company believes, based on historical results, the likelihood of actual write-offs having a material impact onfinancial results or earnings per share is low. However, if one of the Company’s key customers were to file for bankruptcy, orotherwise be unable to make its required payments, or there was a significant continued slowdown in the economy, the Companycould be forced to increase its allowances. This could result in a material charge to earnings. For trade receivables of $698 million and$595 million at December 31, 2006 and 2005, respectively, the Company’s allowances were $16 million and $20 million,respectively.
Impairment of Long-Lived Assets
The Company evaluates the carrying value of long-lived assets, including definite-lived intangible assets, when events or changes incircumstances indicate that the carrying value may not be recoverable. Such events and circumstances include, but are not limited to,significant decreases in the market value of the asset, adverse change in the extent or manner in which the asset is being used,significant changes in business climate, or current or projected cash flow losses associated with the use of the assets. The carryingvalue of a long-lived asset is considered impaired when the total projected undiscounted cash flows from such asset is separatelyidentifiable and is less than its carrying value. In that event, a loss is recognized based on the amount by which the carrying valueexceeds the fair value of the long-lived asset. For long-lived assets to be held and used, fair value of fixed (tangible) assets anddefinite-lived intangible assets is determined primarily using either the projected cash flows discounted at a rate commensurate withthe risk involved or an appraisal. For long-lived assets to be disposed of by sale or other than by sale, fair value is determined in asimilar manner, except that fair values are reduced for disposal costs.
The provisions of Statement of Financial Accounting Standards ("SFAS") No. 142 "Goodwill and Other Intangible Assets," requirethat goodwill and indefinite-lived intangible assets be tested at least annually for impairment and require reporting units to beidentified for the purpose of assessing potential future impairments of goodwill. The carrying value of goodwill and indefinite livedintangibles is considered impaired when their fair value, as established by appraisal or based on undiscounted future cash flows ofcertain related products, is less than their carrying value. The Company conducts its annual testing of goodwill and indefinite-livedintangible assets for impairment in the third quarter of each year, unless events warrant more frequent testing.
33
Source: EASTMAN CHEMICAL CO, 10-K, March 01, 2007

MANAGEMENT'S DISCUSSION AND ANALYSIS OF FINANCIAL
CONDITION AND RESULTS OF OPERATIONS
As the Company’s assumptions related to long-lived assets are subject to change, additional write-downs may be required in thefuture. If estimates of fair value less costs to sell are revised, the carrying amount of the related asset is adjusted, resulting in a chargeto earnings. The Company recorded fixed (tangible) asset impairments of $55 million and definite-lived intangible asset impairmentsof $1 million during 2006. The Company recorded fixed (tangible) asset impairments of $9 million and definite-lived intangible assetimpairments of $3 million during 2005.
Environmental Costs
The Company accrues environmental remediation costs when it is probable that the Company has incurred a liability at acontaminated site and the amount can be reasonably estimated. When a single amount cannot be reasonably estimated but the cost canbe estimated within a range, the Company accrues the minimum amount. This undiscounted accrued amount reflects the Company’sassumptions about remediation requirements at the contaminated site, the nature of the remedy, the outcome of discussions withregulatory agencies and other potentially responsible parties at multi-party sites, and the number and financial viability of otherpotentially responsible parties. Changes in the estimates on which the accruals are based, unanticipated government enforcementaction, or changes in health, safety, environmental, and chemical control regulations and testing requirements could result in higher orlower costs. Estimated future environmental expenditures for remediation costs range from the minimum or best estimate of $18million to the maximum of $32 million at December 31, 2006.
In accordance with SFAS No. 143, "Accounting for Asset Retirement Obligations," the Company also establishes reserves forclosure/postclosure costs associated with the environmental and other assets it maintains. Environmental assets, as defined in SFASNo. 143, include but are not limited to waste management units, such as landfills, water treatment facilities, and ash ponds. Whenthese types of assets are constructed or installed, a reserve is established for the future costs anticipated to be associated with theretirement or closure of the asset based on an expected life of the environmental assets and the applicable regulatory closurerequirements. These future expenses are charged into earnings over the estimated useful life of the assets. Currently, the Companyestimates the useful life of each individual asset is up to 50 years. If the Company changes its estimate of the asset retirementobligation costs or its estimate of the useful lives of these assets, expenses to be charged into earnings could increase or decrease.
In accordance with Interpretation No. 47, “Accounting for Conditional Asset Retirement Obligations” ("FIN 47"), the Company alsomonitors conditional obligations and will record reserves associated with them when and to the extent that more detailed informationbecomes available concerning applicable retirement costs.
The Company’s reserve for environmental contingencies was $47 million and $51 million at December 31, 2006 and 2005,respectively, representing the minimum or best estimate for remediation costs and, for asset retirement obligation costs, the bestestimate of the amount accrued to date over the regulated assets' estimated useful lives.
United States Pension and Other Post-employment Benefits
The Company maintains defined benefit pension plans that provide eligible employees with retirement benefits. Additionally, Eastmanprovides life insurance and health care benefits for eligible retirees and health care benefits for retirees’ eligible survivors. The costsand obligations related to these benefits reflect the Company’s assumptions related to general economic conditions (particularlyinterest rates) and expected return on plan assets. At December 31, 2006, the Company assumed a discount rate of 5.86 percent and anexpected return on assets of 9 percent. The cost of providing plan benefits also depends on demographic assumptions includingretirements, mortality, turnover, and plan participation.
34
Source: EASTMAN CHEMICAL CO, 10-K, March 01, 2007

MANAGEMENT'S DISCUSSION AND ANALYSIS OF FINANCIAL
CONDITION AND RESULTS OF OPERATIONS
The following table illustrates the sensitivity to a change in the expected return on assets and assumed discount rate for U.S. pensionplan and other postretirement welfare plans:
Change inAssumption
Impact on2007 Pre-tax U.S.Benefits Expense
Impact onDecember 31, 2006
Projected Benefit Obligationfor U.S. Pension Plan
Impact onDecember 31, 2006
Benefit Obligation for OtherU.S. Postretirement Plans
25 basis point
decrease in discountrate
+$5 Million
+$49 Million
+$21 Million
25 basis pointincrease in discount
rate
-$5 Million
-$46 Million
-$21 Million
25 basis pointdecrease in expected return
on assets
+$3 Million
No Impact
N/A
25 basis pointincrease in expected
return on assets
-$3 Million
No Impact
N/A
The expected return on assets and assumed discount rate used to calculate the Company’s pension and other post-employment benefitobligations are established each December 31. The expected return on assets is based upon the long-term expected returns in themarkets in which the pension trust invests its funds, primarily the domestic, international, and private equities markets. The actualreturn on assets has exceeded the expected return for the last 3 years. The assumed discount rate is based upon a portfolio ofhigh-grade corporate bonds, which are used to develop a yield curve. This yield curve is applied to the expected durations of thepension and post-employment benefit obligations. A 1 percent increase or decrease in the health care trend would have had nomaterial impact.
If actual experience differs from these assumptions, the difference is recorded as an unrecognized actuarial gain (loss) and thenamortized into earnings over a period of time, which may cause the expense related to providing these benefits to increase or decrease.The charges applied to earnings in 2006, 2005, and 2004 due to the amortization of these unrecognized actuarial losses, largely due toactual experience versus assumptions of discount rates, were $54 million, $56 million, and $44 million, respectively.
The Company does not anticipate that a change in pension and other post-employment obligations caused by a change in the assumeddiscount rate will impact the cash contributions to be made to the pension plans during 2007. However, an after-tax charge or creditwill be recorded directly to accumulated other comprehensive income (loss), a component of stockholders’ equity, as of December 31,2007 for the impact on the pension’s projected benefit obligation of the change in interest rates, if any. While the amount of thechange in these obligations does not correspond directly to cash funding requirements, it is an indication of the amount the Companywill be required to contribute to the plans in future years. The amount and timing of such cash contributions is dependent upon interestrates, actual returns on plan assets, retirement, attrition rates of employees, and other factors. For further information regardingpension and other post-employment obligations, see Note 10, "Retirement Plans", to the Company’s consolidated financial statementsin Part II, Item 8 of this 2006 Annual Report on Form 10-K.
35
Source: EASTMAN CHEMICAL CO, 10-K, March 01, 2007

MANAGEMENT'S DISCUSSION AND ANALYSIS OF FINANCIAL
CONDITION AND RESULTS OF OPERATIONS
Litigation and Contingent Liabilities
From time to time, the Company and its operations are parties to or targets of lawsuits, claims, investigations and proceedings,including product liability, personal injury, asbestos, patent and intellectual property, commercial, contract, environmental, antitrust,health and safety, and employment matters, which are handled and defended in the ordinary course of business. The Company accruesa liability for such matters when it is probable that a liability has been incurred and the amount can be reasonably estimated. When asingle amount cannot be reasonably estimated but the cost can be estimated within a range, the Company accrues the minimumamount. The Company expenses legal costs, including those expected to be incurred in connection with a loss contingency, asincurred. The Company believes the amounts reserved are adequate for such pending matters; however, results of operations could beaffected by significant litigation adverse to the Company.
Income Taxes
The Company records deferred tax assets and liabilities based on temporary differences between the financial reporting and tax basesof assets and liabilities, applying enacted tax rates expected to be in effect for the year in which the differences are expected toreverse. The ability to realize the deferred tax assets is evaluated through the forecasting of taxable income using historical andprojected future operating results, the reversal of existing temporary differences, and the availability of tax planning strategies.Valuation allowances are recorded to reduce deferred tax assets when it is more likely than not that a tax benefit will not be realized.In the event that the actual outcome of future tax consequences differs from our estimates and assumptions, the resulting change to theprovision for income taxes could have a material adverse impact on the consolidated results of operations and statement of financialposition. As of December 31, 2006, a valuation allowance of $130 million has been provided against the deferred tax assets.
2006 OVERVIEW
The Company generated sales revenue of $7.5 billion for full year 2006, which was the highest in the Company's history and a 6percent increase over 2005. Operating earnings were $640 million in 2006, a decline of $117 million compared with 2005. Theseresults reflect continued strong earnings from the Company's broad base of businesses, with the decline substantially due to lowerresults in the Performance Polymers segment. During 2006, the Company was impacted by $400 million higher raw material andenergy costs. Most of the Company's businesses were able to offset these costs with higher selling prices, higher volumes and loweroperating costs. However, the Performance Polymers segment had lower selling prices, particularly for polyethylene terephthalate("PET") polymers, in spite of higher raw material costs, due to lower industry capacity utilization rates.
The Company continued to evaluate its portfolio of businesses and product lines to better focus on its core strengths and improveoverall profitability. As a result of the strategic decisions made, operating earnings were negatively impacted by $10 million ofaccelerated depreciation and $101 million in asset impairment and restructuring charges. These charges were partially offset by $68million of other operating income from the sale of its polyethylene ("PE") business and related assets and the sale of its Batesville,Arkansas manufacturing facility and related assets. In 2006, these divested product lines had sales revenue of $811 million andoperating earnings of $124 million. Operating earnings in 2005 included asset impairments and restructuring charges were $33 millionand other operating income was $2 million.
36
Source: EASTMAN CHEMICAL CO, 10-K, March 01, 2007

MANAGEMENT'S DISCUSSION AND ANALYSIS OF FINANCIAL
CONDITION AND RESULTS OF OPERATIONS
In addition to achieving the above results, Eastman continued to progress on its overall growth objectives and announced its plans toimprove the performance of its PET polymer product lines in the Performance Polymers segment. These efforts included:
•��the start-up of the Company's 350 thousand metric tons new PET facility using IntegRex technology in Columbia, SouthCarolina which is expected to be at full production by the end of the first quarter of 2007;
•��plans to debottleneck the IntegRex technology facility for an additional 100 thousand metric tons of capacity, to be completedin early 2008;
•��rationalizing 350 thousand metric tons of existing capacity in North America, to be completed by mid-2008;•��plans to expand its acetate tow capacity in Workington, England in the Fibers segment;•��continuing development of a new family of copolyesters in the Specialty Plastics ("SP") segment to be commercialized in
2007; and•��furthering the advancement of its coal gasification efforts.
The Company is also considering various strategic options for its underperforming PET manufacturing facilities outside the UnitedStates that could lead to further restructuring, divestiture, or consolidation of product lines in the Performance Polymers segment toimprove profitability. In first quarter 2007, the Company entered into an agreement to sell the San Roque, Spain manufacturingfacility.
Net earnings for 2006 were $409 million versus 2005 net earnings of $557 million. Included in 2005 results were a $111 million gain,net of tax, on the sale of the Company's equity investment in Genencor International, Inc. ("Genencor") and early debt retirement costsof $28 million, net of tax.
The Company generated $609 million in cash from operating activities during 2006, a decrease of $160 million compared to 2005.The decline was due primarily to higher net earnings in 2005 compared with 2006 and an increase of $128 million in working capitalin 2006, partially offset by lower pension contributions in the current year.
RESULTS OF OPERATIONS
SUMMARY OF CONSOLIDATED RESULTS - 2006 COMPARED WITH 2005
The Company’s results of operations as presented in the Company’s consolidated financial statements in Part II, Item 8 of this 2006Annual Report on Form 10-K are summarized and analyzed below:
VolumeEffect
PriceEffect
Product
MixEffect
ExchangeRate
Effect
(Dollars in millions) 2006 2005 Change
Sales $ 7,450 $ 7,059 6 % 2 % 5 % (1) % -- %
Sales revenue for 2006 increased compared with 2005 primarily due to higher selling prices in response to both higher raw materialand energy costs and continued strong economic conditions.
(Dollars in millions) 2006 2005 Change Gross Profit $ 1,277 $ 1,404 (9) %
As a percentage of sales 17.1% 19.9%
37
Source: EASTMAN CHEMICAL CO, 10-K, March 01, 2007

MANAGEMENT'S DISCUSSION AND ANALYSIS OF FINANCIAL
CONDITION AND RESULTS OF OPERATIONS
Gross profit and gross profit as a percentage of sales for 2006 decreased, particularly in the Performance Polymers segment, comparedwith 2005 primarily due to increased raw material and energy costs and operational disruptions that were partially offset by higherselling prices. In 2006, raw material and energy costs increased by approximately $400 million compared to the prior year, comparedto a selling price increase of $323 million. In addition, 2006 included $10 million of accelerated depreciation related to previouslydisclosed restructuring decisions in association with cracking units in Longview, Texas, and higher cost PET polymer assets inColumbia, South Carolina, which are scheduled for shutdown. In 2007, accelerated depreciation will be approximately $50 millionrelated to these assets.
(Dollars in millions) 2006 2005 Change Selling, General and Administrative Expenses("SG&A") $
437$
454 (4) %
Research and Development Expenses ("R&D") 167 162 3 % $ 604 $ 616 (2) %
As a percentage of sales 8.1% 8.7%
SG&A expenses in 2006 decreased compared to 2005 primarily due to lower incentive compensation expense in 2006, which includedcompensation expense recorded under SFAS No. 123 Revised December 2004 ("SFAS No. 123(R)"), "Share-Based Payment". Formore information concerning SFAS No. 123(R), see Note 15, "Share Based Compensation Plans and Awards", to the Company’sconsolidated financial statements in Part II, Item 8 of this 2006 Annual Report on Form 10-K.
R&D expenses for 2006 increased compared with 2005 primarily due to increased spending on growth initiatives, particularly in theSP segment, which more than offset lower expenses in the Performance Polymers segment.
Asset Impairments and Restructuring Charges, Net
Asset impairments and restructuring charges totaled $101 million and $33 million during 2006 and 2005, respectively. The Companycontinues to review its portfolio of products and businesses, which could result in further restructuring, divestiture, and consolidation.For more information regarding asset impairments and restructuring charges, see Note 16, "Asset Impairments and RestructuringCharges, Net", to the Company’s consolidated financial statements in Part II, Item 8 of this 2006 Annual Report on Form 10-K.
Other Operating Income
Other operating income for 2006 reflects a gain of $75 million on the sale of the Company's PE and Epolene polymer businesses,related assets, and the Company's ethylene pipeline and charges of approximately $7 million related to the sale of the Company'sBatesville, Arkansas manufacturing facility and its related assets and product lines. For more information concerning divestitures, seeNote 24, "Divestitures", to the Company’s consolidated financial statements in Part II, Item 8 of this 2006 Annual Report on Form10-K.
Other operating income for 2005 reflects a $2 million gain related to the 2004 divestiture of certain businesses and product lineswithin the Coatings, Adhesives, Specialty Polymers and Inks ("CASPI") segment.
38
Source: EASTMAN CHEMICAL CO, 10-K, March 01, 2007

MANAGEMENT'S DISCUSSION AND ANALYSIS OF FINANCIAL
CONDITION AND RESULTS OF OPERATIONS
Interest Expense, Net
(Dollars in millions) 2006 2005 Change Gross interest costs $ 112 $ 118 Less: capitalized interest 7 5 Interest expense 105 113 (7) %Interest income 25 13 Interest expense, net $ 80 $ 100 (20) %
Lower gross interest costs for 2006 compared to 2005 reflected lower average borrowings that more than offset higher average interestrates. Higher interest income for 2006 compared to 2005 reflected higher invested cash balances as well as higher average interest rates,resulting in lower net interest expense.
For 2007, the Company expects net interest expense to decrease compared with 2006 primarily due to higher interest income, drivenby higher invested cash balances.
Income from Equity Investment in Genencor
For 2005, income from equity investment in Genencor includes the Company's portion of earnings from its equity investment inGenencor. In second quarter 2005, the Company completed the sale of its equity interest in Genencor for net cash proceeds ofapproximately $417 million. The book value of the investment prior to sale was $246 million resulting in a pre-tax gain on the sale of$171 million.
Early Debt Extinguishment Costs
In the second quarter 2005, the Company completed the early repayment of $500 million of its outstanding long-term debt for $544million in cash and recorded a charge of $46 million for early debt extinguishment costs including $2 million in unamortized bondissuance costs. The book value of the purchased debt was $500 million.
Other (Income) Charges, net
(Dollars in millions) 2006 2005 Change Other income $ (24) $ (11) $ (13)Other charges 8 12 (4)Other (income) charges, net $ (16) $ 1 $ (15)
Included in other income are the Company’s portion of net earnings from its equity investments (excluding Genencor); gains on thesale of certain technology business venture investments, royalty income, net gains on foreign exchange transactions and othernon-operating income, related to Holston Defense Corporation ("HDC"). Included in other charges are net losses on foreign exchangetransactions, the Company’s portion of losses from its equity investments (excluding Genencor); write-downs to fair value of certaintechnology business venture investments due to other than temporary declines in value and fees on securitized receivables.
39
Source: EASTMAN CHEMICAL CO, 10-K, March 01, 2007

MANAGEMENT'S DISCUSSION AND ANALYSIS OF FINANCIAL
CONDITION AND RESULTS OF OPERATIONS
Included in 2006 other income is a $12 million gain related to a favorable award from the U.S. Department of the Army regarding arequest for reimbursement for post-employment benefits being provided to retirees of HDC, a wholly owned subsidiary. This gainreflected a portion of the unrecognized gain resulting from the award that will be amortized into earnings over future periods. Foradditional information, see Note 10, "Retirement Plans", to the Company’s consolidated financial statements in Part II, Item 8 of this2006 Annual Report on Form 10-K. Provision for Income Taxes
(Dollars in millions) 2006 2005 Change Provision for income taxes $ 167 $ 226 (26) %
Effective tax rate 29 % 29 %
The 2006 effective tax rate reflects the Company's tax rate on reported operating earnings before income tax, excluding discrete items,of 33 percent. The effective tax rate was impacted by $25 million of deferred tax benefit resulting from the reversal of capital losscarryforward valuation reserves and $11 million of deferred tax benefit resulting from the reversal of foreign net operating lossvaluation reserves.
The 2005 effective tax rate reflects the Company's tax rate on reported operating earnings before income tax, excluding discrete items,of 35 percent. The effective tax rate was impacted by $13 million of deferred tax benefit resulting from the reversal of capital losscarryforward valuation reserves, $14 million of tax benefit resulting from the change in reserves for tax contingencies due to thefavorable resolution of prior periods' tax contingencies and a $11 million charge resulting from the repatriation of $321 million offoreign earnings and capital pursuant to provisions of the American Jobs Creation Act of 2004.
The Company expects its effective tax rate in 2007 will be approximately 35 percent.
Net Earnings (Dollars in millions, except per share amounts) 2006 2005 Net earnings $ 409 $ 557Earnings per share
Basic $ 4.98 $ 6.90Diluted 4.91 6.81
SUMMARY BY OPERATING SEGMENT
The Company’s products and operations are managed and reported in five reportable operating segments, consisting of the CASPIsegment, the Fibers segment, the Performance Chemicals and Intermediates ("PCI") segment, the Performance Polymers segment andthe SP segment. The Company's segments were previously aligned in a divisional structure that provided for goods and services to betransferred between divisions at predetermined prices that may have been in excess of cost, which resulted in the recognition ofintersegment sales revenue and operating earnings. Such interdivisional transactions were eliminated in the Company's consolidatedfinancial statements. In first quarter 2006, the Company realigned its organizational structure to support its growth strategy and tobetter reflect the integrated nature of the Company's assets. A result of the realigned organizational structure is that goods and servicesare transferred among the segments at cost. As part of this change, the Company's segment results have been restated to eliminate theimpact of interdivisional sales revenue and operating earnings. For additional information and analysis of the results of the Company’soperating segments, see Note 21, "Segment Information", to the Company’s consolidated financial statements in Part II, Item 8 of this2006 Annual Report on Form 10-K and Exhibits 99.01to this Annual Report. In the first quarter of 2006, management determined that the Developing Businesses ("DB") segment is not of continuing significancefor financial reporting purposes. As a result, revenues and costs previously included in the DB segment and R&D expenses notidentifiable to an operating segment are not included in segment operating results for either of the periods presented and are shown inNote 21, "Segment Information", to the Company's consolidated financial statements in Part II, Item 8 of this 2006 Annual Report onForm 10-K as "other" revenues and operating losses.
40
Source: EASTMAN CHEMICAL CO, 10-K, March 01, 2007

MANAGEMENT'S DISCUSSION AND ANALYSIS OF FINANCIAL
CONDITION AND RESULTS OF OPERATIONS
In fourth quarter 2006, certain product lines were transferred from the PCI segment to the Performance Polymers segment. During2005 and 2004, these amounts were included within the PCI segment. Accordingly, the prior year's amounts for sales and operatingearnings have been adjusted to retrospectively apply these changes to all periods presented.
CASPI Segment Change
(Dollars in millions) 2006 2005 $ %
Sales $ 1,421 $ 1,299 $ 122 9 % Volume effect 6 -- % Price effect 115 9 % Product mix effect 4 -- % Exchange rate effect (3) -- %
Operating earnings 229 228 1 -- %
Asset impairments and restructuring charges, net 13 4 9
Other operating income -- (2) 2
Sales revenue increased $122 million in 2006 compared to 2005 due to an increase in selling prices in response to higher raw materialand energy costs.
Operating earnings increased $1 million for 2006 compared to 2005 including increased asset impairments and restructuring charges.Asset impairments and restructuring charges of $13 million for 2006 related to previously closed manufacturing facilities andseverance related to a voluntary reduction in force. Asset impairments and restructuring charges of $4 million for 2005 relatedprimarily to previously closed manufacturing facilities. These charges are more fully described in Note 16, "Impairments andRestructuring Charges", to the Company’s consolidated financial statements in Part II, Item 8 of this 2006 Annual Report on Form10-K. Excluding these items, operating earnings increased due to an increase in selling prices that more than offset higher raw materialand energy costs, and favorable product mix that resulted from higher sales volume for specialty coatings.
In November 2006, the Company sold the CASPI segment's Epolene polymer businesses and related assets. CASPI sales revenue andoperating earnings attributed to the divested businesses were $65 million and $3 million, respectively, for 2006.
41
Source: EASTMAN CHEMICAL CO, 10-K, March 01, 2007

MANAGEMENT'S DISCUSSION AND ANALYSIS OF FINANCIAL
CONDITION AND RESULTS OF OPERATIONS
Fibers Segment Change
(Dollars in millions) 2006 2005 $ %
Sales $ 910 $ 869 $ 41 5 % Volume effect 17 2 % Price effect 55 6 % Product mix effect (31) (3) % Exchange rate effect -- -- %
Operating earnings 226 216 10 5 %
Asset impairments and restructuring charges, net 2 -- 2
Sales revenue increased $41 million in 2006 compared to 2005 primarily due to higher selling prices and higher sales volume thatwere partially offset by an unfavorable shift in product mix. The higher selling prices were in response to higher raw material andenergy costs as well as continued strong demand for and limited supply of acetate yarn and acetyl chemical products. The increasedsales volume and shift in product mix were due to strong demand for acetyl chemical products attributed to strengthened global acetatetow demand.
Operating earnings for 2006 compared to 2005 increased $10 million as higher selling prices and increased sales volume more thanoffset higher raw material and energy costs. Asset impairment and restructuring charges of $2 million in 2006 related primarily toseverance due to a voluntary reduction in force.
The Company believes that acetate tow has modest growth potential in future years and has been evaluating growth options in Europeand Asia. In the third quarter 2006, the Company announced plans to add capacity and expand production of Estron acetate tow inEurope at its Workington, England facility. The Company continues to evaluate options for growth in Asia.
42
Source: EASTMAN CHEMICAL CO, 10-K, March 01, 2007

MANAGEMENT'S DISCUSSION AND ANALYSIS OF FINANCIAL
CONDITION AND RESULTS OF OPERATIONS
PCI Segment Change
(Dollars in millions) 2006 2005 $ %
Sales $ 1,659 $ 1,560 $ 99 6 % Volume effect 1 -- % Price effect 118 7 % Product mix effect (19) (1) % Exchange rate effect (1) -- %
Operating earnings 132 143 (11) (8) %
Accelerated depreciation included in cost of goods sold 2 -- 2
Asset impairments and restructuring charges, net 20 11 9
Other operating charges 7 -- 7 Sales revenue for 2006 compared to 2005 increased $99 million primarily due to higher selling prices, particularly in the intermediatesproduct lines, in response to increases in raw material and energy costs.
Operating earnings for 2006 included asset impairments and restructuring charges of $20 million primarily related to the divestiture ofthe PCI segment's Batesville, Arkansas manufacturing facility and related assets and specialty organic chemicals product linescompleted in the fourth quarter 2006 and to severance related to a voluntary reduction in force. The 2006 operating earnings alsoincluded $2 million of accelerated depreciation for cracking units at the Company's Longview, Texas facility and $7 million of otheroperating charges related to the above mentioned divestiture. Excluding those items, operating earnings increased compared with 2005as higher selling prices more than offset higher raw material and energy costs. PCI sales revenue and operating loss attributed to thedivested product lines were $111 million and $15 million, respectively, for 2006. The 2005 operating earnings included $11 million inasset impairments and restructuring charges for previously impaired sites and $10 million of operating earnings from the achievementof certain milestones under an acetyls technology licensing agreement.
In addition, as part of the transition agreement pertaining to the PE divestiture, the Company will supply ethylene to the buyer. Thesupply of ethylene to the buyer, which was formerly used internally, will be reported in the PCI segment. The Company also expectsto begin a staged phase-out of older cracking units in 2007, with timing dependent in part on market conditions.
43
Source: EASTMAN CHEMICAL CO, 10-K, March 01, 2007

Performance Polymers Segment Change(Dollars in millions) 2006 2005 $ % Total sales $ 2,642 $ 2,586 $ 56 2 %Sales - divested product lines 635 618 17 3 %Sales - continuing product lines 2,007 1,968 39 2 % Volume effect 41 1 % Price effect 2 -- % Product mix effect 8 1 % Exchange rate effect 5 -- % Total operating earnings 54 176 (122) (69) %Operating earnings - divested product lines (1) 136 75 61 81 %Operating earnings - continuing product lines (82) 101 (183) > (100)% Accelerated depreciation included in cost of goods sold 7 -- 7 Accelerated depreciation - divested product lines (1) -- -- -- Accelerated depreciation - continuing product lines 7 -- 7 Asset impairments and restructuring charges, net 46 -- 46 Asset impairments and restructuring charges, net - divested
product lines (1) -- -- -- Asset impairments and restructuring charges, net -
continuing product lines 46 -- 46 Other operating income (75) -- (75) Other operating income - divested product lines (1) (75) -- (75) Other operating income - continuing product lines -- -- --
(1) Includes allocated costs consistent with the Company’s historical practices, some of which may remain and could be reallocated tothe remainder of the segment and other segments.
In fourth quarter 2006, the Company completed the divestiture of the Performance Polymer segment's PE businesses and related assetslocated at the Longview, Texas site and the Company's ethylene pipeline.
Sales revenue increased $56 million for 2006 compared to 2005 primarily due to higher sales volume, particularly for PET polymersin Latin America, mostly offset by lower sales volume for PET polymers in North America attributed to lower industry capacityutilization rates. Excluding the divested product lines, sales revenue increased $39 million.
44
Source: EASTMAN CHEMICAL CO, 10-K, March 01, 2007

MANAGEMENT'S DISCUSSION AND ANALYSIS OF FINANCIAL
CONDITION AND RESULTS OF OPERATIONS
Operating earnings decreased $122 million for 2006 compared to 2005 primarily due to higher and continued volatile raw material andenergy costs, lower selling prices for PET polymers globally, increased asset impairments and restructuring charges and increasedaccelerated depreciation more than offsetting other operating income and increased sales volume. Asset impairments and restructuringcharges of $46 million for 2006 were primarily related to the shutdown of a research and development Kingsport, Tennessee pilotplant, discontinued production of cyclohexane dimethanol ("CHDM") modified polymers in San Roque, Spain and severance relatedto a reduction in force in the U.S. and Spain. CHDM, an internal intermediate product primarily used in copolyester and PETproduction, was discontinued in San Roque, Spain to gain operational efficiencies at other facilities. These charges are more fullydescribed in Note 16, "Impairments and Restructuring Charges", to the Company's consolidated financial statements in Part II, Item 8of this 2006 Annual Report on Form 10-K. Accelerated depreciation of $7 million for 2006 related to previously disclosedrestructuring decisions in association with cracking units in Longview, Texas, and higher cost PET polymer intermediates assets inColumbia, South Carolina, which are scheduled for shutdown. Other operating income for 2006 reflects a gain of $75 million on theabove mentioned divestiture. Excluding the divested product lines, operating earnings decreased $183 million.
Production began in November 2006 at the Company's new PET manufacturing facility utilizing IntegRex technology in Columbia,South Carolina. Manufacturing ParaStar next generation PET resins, the Company expects the facility to be at its full operationalcapacity of 350 thousand metric tons during the first quarter of 2007. The Company is evaluating the construction of a PET facilityusing the full IntegRex technology in the U.S. or elsewhere and utilizing further refinements to IntegRex technology.
The Company is continuing to evaluate its strategic and operational options related to certain underperforming PET assets to improveprofitability of the segment. In first quarter 2007, the Company entered into an agreement to sell the San Roque, Spain manufacturingfacility.
SP Segment Change(Dollars in millions) 2006 2005 $ % Sales $ 818 $ 718 $ 100 14 % Volume effect 81 11 % Price effect 34 5 % Product mix effect (11) (1) % Exchange rate effect (4) (1) % Operating earnings 46 64 (18) (28) % Accelerated depreciation 1 -- 1 Asset impairments and restructuring charges, net 16 -- 16
Sales revenue for 2006 increased $100 million compared to 2005 due primarily to increased sales volume and higher selling prices.The increased sales volume was primarily attributed to continued market development efforts, particularly in copolyester productlines. Selling prices increased to offset higher raw material and energy costs with increases limited by competitive industry dynamics.
45
Source: EASTMAN CHEMICAL CO, 10-K, March 01, 2007

MANAGEMENT'S DISCUSSION AND ANALYSIS OF FINANCIAL
CONDITION AND RESULTS OF OPERATIONS
Operating earnings for 2006 declined $18 million compared with 2005 primarily due to asset impairment and restructuring charges,increased expenditures related to growth initiatives and higher raw material and energy costs slightly more than offsetting increasedsales volume and higher selling prices. Asset impairment and restructuring charges of $16 million in 2006 were related to thediscontinued production of CHDM, an internal intermediate product primarily used in copolyester and PET production, in San Roque,Spain to gain operational efficiencies at other facilities. Accelerated depreciation of $1 million for 2006 related primarily to SouthCarolina operations.
SUMMARY BY CUSTOMER LOCATION - 2006 COMPARED WITH 2005
Sales Revenue
(Dollars in millions)
2006
2005
Change
VolumeEffect
PriceEffect
Product
MixEffect
ExchangeRate
Effect
United States andCanada $
4,223 $
4,098
3 %
(1) %
5 %
(1) %
-- %
Europe, Middle East,and Africa
1,436
1,344
7 % 3 % 4 % -- % -- %
Asia Pacific 941 930 1 % (4) % 8 % (2) % (1) %Latin America 850 687 24 % 25 % (2) % 1 % -- %
$ 7,450 $ 7,059 6 % 2 % 5 % (1) % -- %
Sales revenue in the United States and Canada increased primarily due to higher selling prices, particularly in the PCI segment, whichhad a $78 million positive impact on sales revenue. The higher selling prices were primarily in response to increases in raw materialand energy costs.
Sales revenue in Europe, the Middle East and Africa increased primarily due to higher selling prices, particularly in the CASPIsegment, and higher volumes particularly in the Performance Polymer segment. The higher selling prices were primarily in responseto increases in raw material and energy costs.
Sales revenue in Asia Pacific increased primarily due to higher selling prices, partially offset by lower sales volume and changes inmix. Higher selling prices, particularly in the Fibers segment, had a $76 million positive impact on sales revenue. Lower sales volumeand negative mix, particularly for the Fibers segment, had a $61 million negative impact on sales revenue.
Sales revenue in Latin America increased primarily due to higher sales volume, particularly in the Performance Polymers segment.
With a substantial portion of sales to customers outside the United States, Eastman is subject to the risks associated with operating ininternational markets. To mitigate its exchange rate risks, the Company frequently seeks to negotiate payment terms in U.S. dollarsand euros. In addition, where it deems such actions advisable, the Company engages in foreign currency hedging transactions andrequires letters of credit and prepayment for shipments where its assessment of individual customer and country risks indicates theiruse is appropriate. For more information on these practices see Note 9 to the Company’s consolidated financial statements in Part II,Item 8 of this 2006 Annual Report on Form 10-K and Part II, Item 7A--"Quantitative and Qualitative Disclosures About Market Risk."
46
Source: EASTMAN CHEMICAL CO, 10-K, March 01, 2007

MANAGEMENT'S DISCUSSION AND ANALYSIS OF FINANCIAL
CONDITION AND RESULTS OF OPERATIONS
SUMMARY OF CONSOLIDATED RESULTS - 2005 COMPARED WITH 2004
VolumeEffect
PriceEffect
Product
MixEffect
ExchangeRate
Effect
(Dollars in millions) 2005 2004 Change
Sales $ 7,059 $ 6,580 7 % (7) % 15 % (1) % -- %
Sales revenue for 2005 increased compared with 2004 primarily due to increased selling prices of approximately $1 billion throughoutthe Company that more than offset a decrease in volume resulting from divested businesses and product lines in 2004. The increase inselling prices was primarily in response to an increase in raw material and energy costs and the Company’s efforts to improveprofitability.
(Dollars in millions) 2005 2004 Change Gross Profit $ 1,404 $ 978 44 %
As a percentage of sales 19.9 % 14.9 %
Gross profit for 2005 increased compared with 2004 primarily due to the following factors:
•��increased selling prices across all segments, primarily in response to higher raw material and energy costs which increased morethan $500 million;
•��a continued focus on more profitable businesses and product lines; and•��cost reduction programs.
The above items more than offset higher raw material and energy costs primarily attributable to paraxylene, propane, natural gas, coaland ethylene glycol.
(Dollars in millions) 2005 2004 Change Selling, General and Administrative Expenses $ 454 $ 450 1 %Research and Development Expenses 162 154 5 % $ 616 $ 604 2 %
As a percentage of sales 8.7% 9.2%
SG&A costs for 2005 increased slightly compared with 2004 due primarily to higher incentive compensation expense resulting fromimproved Company performance and higher bad debt expense, which more than offset decreases resulting from the previousdivestiture of certain businesses and product lines within the CASPI segment and the shutdown of operations at Cendian.
R&D expenses for 2005 increased compared with 2004 primarily due to expenditures on growth initiatives in the SP segment andcorporate R&D, which more than offset decreases resulting from the previous divestiture of certain businesses and product lineswithin the CASPI segment.
Impairments and Restructuring Charges, Net
Impairments and restructuring charges totaled $33 million during 2005, consisting of non-cash asset impairments of $12 million andrestructuring charges of $21 million. During 2004, these charges totaled $206 million, consisting of non-cash asset impairments of$140 million and restructuring charges of $66 million. For more information regarding asset impairments and restructuring charges,see Note 16, "Impairments and Restructuring Charges", to the Company’s consolidated financial statements in Part II, Item 8 of this2006 Annual Report on Form 10-K.
47
Source: EASTMAN CHEMICAL CO, 10-K, March 01, 2007

MANAGEMENT'S DISCUSSION AND ANALYSIS OF FINANCIAL
CONDITION AND RESULTS OF OPERATIONS
Other Operating Income
Other operating income of $2 million for 2005 included a $2 million gain associated with a change in estimates for contingenciesrelated to the 2004 divestiture of certain businesses and product lines within the CASPI segment. Other operating income of $7million in 2004 resulted from the sale of Ariel Research Corporation ("Ariel").
Operating Earnings
(Dollars in millions, except per share amounts) 2005 2004 Change Operating earnings $ 757 $ 175 $ >100%
Operating earnings for 2005 increased $582 million. Key factors in the improved results, aided by strong economic growth, were:
•��increased selling prices throughout the Company of approximately $1 billion in response to increasing raw material andenergy costs;
•��lower asset impairment and restructuring charges of $33 million in 2005 compared to $206 million in 2004;•��completion of previously announced restructuring, divestiture and consolidation actions in 2004;•��a continued focus on more profitable businesses and product lines across the Company's portfolio of businesses, including
acetyl, olefins, and polyester stream optimization; and•��continued cost reduction efforts.
The above items more than offset an estimated $500 million increase in raw materials and energy costs and $33 million in assetimpairments and restructuring charges.
Interest Expense, Net
(Dollars in millions) 2005 2004 Change Gross interest costs $ 118 $ 126 Less: capitalized interest 5 3 Interest expense 113 123 (9) %Interest income 13 8 Interest expense, net $ 100 $ 115 (14) %
Lower gross interest costs for 2005 compared to 2004 reflected lower average debt levels primarily due to the early extinguishment ofdebt in second quarter 2005, partially offset by higher average interest rates.
Higher interest income for 2005 compared to 2004 reflected higher invested cash balances as well as higher average interest rates,resulting in lower net interest expense.
Income from Equity Investment in Genencor
Income from equity investment in Genencor includes the Company's portion of earnings from its equity investment in Genencor. Insecond quarter 2005, the Company completed the sale of its equity interest in Genencor for net cash proceeds of approximately $417million. The book value of the investment prior to sale was $246 million resulting in a pre-tax gain on the sale of $171 million.
48
Source: EASTMAN CHEMICAL CO, 10-K, March 01, 2007

MANAGEMENT'S DISCUSSION AND ANALYSIS OF FINANCIAL
CONDITION AND RESULTS OF OPERATIONS
Early Debt Extinguishment Costs
In the second quarter 2005, the Company completed the early repayment of $500 million of its outstanding long-term debt for $544million in cash and recorded a charge of $46 million for early debt extinguishment costs including $2 million in unamortized bondissuance costs. The book value of the purchased debt was $500 million.
Other (Income) Charges, net
(Dollars in millions) 2005 2004 ChangeOther income $ (11) $ (10) $ (1)Other charges 12 20 (8)Other (income) charges, net $ 1 $ 10 $ (9)
Included in other income are the Company’s portion of earnings from its equity investments (excluding Genencor); gains on the saleof certain technology business venture investments, royalty income and net gains on foreign exchange transactions. Included in othercharges are net losses on foreign exchange transactions, the Company’s portion of losses from its equity investments (excludingGenencor); write-downs to fair value of certain technology business venture investments due to other than temporary declines in valueand fees on securitized receivables.
Provision (Benefit) for Income Taxes
(Dollars in millions) 2005 2004 Change Provision (benefit) for income taxes $ 226 $ (106) > 100 %Effective tax rate 29% N/A
The 2005 effective tax rate was impacted by $13 million of deferred tax benefit resulting from the reversal of capital loss carryforwardvaluation reserves, $14 million of tax benefit resulting from the change in reserves for tax contingencies due to the favorableresolution of prior periods' tax contingencies and a $11 million charge resulting from the repatriation of $321 million of foreignearnings and capital pursuant to provisions of the American Jobs Creation Act of 2004. Excluding discrete items, the effective tax ratewould have been 35 percent.
The 2004 effective tax rate was impacted by $90 million of deferred tax benefits resulting from the expected utilization of a capitalloss resulting from the sale of certain businesses and product lines and related assets in the CASPI segment and $26 million of taxbenefit resulting from the favorable resolution of a prior year capital loss refund claim. In addition, the effective tax rate for 2004 wasimpacted by the treatment of asset impairments and restructuring charges resulting in lower expected tax benefits in certainjurisdictions.
Net Earnings
(Dollars in millions, except per share amounts) 2005 2004 Net earnings $ 557 $ 170Earnings per share
Basic $ 6.90 $ 2.20Diluted 6.81 2.18
49
Source: EASTMAN CHEMICAL CO, 10-K, March 01, 2007

MANAGEMENT'S DISCUSSION AND ANALYSIS OF FINANCIAL
CONDITION AND RESULTS OF OPERATIONS
SUMMARY BY OPERATING SEGMENT
CASPI Segment
All Product Lines Continuing Product Lines(1) Change Change(Dollars in millions) 2005 2004 $ % 2004 $ % Sales $ 1,299 $ 1,554 $ (255) (16) % $ 1,113 $ 186 17 % Volume effect (464) (30) % (23) (2) % Price effect 192 13 % 192 18 % Product mix effect 13 1 % 13 1% Exchange rate effect 4 -- % 4 -- % Operating earnings 228 64 164 >100 % 152 76 50 % Asset impairments andrestructuring charges, net
4 81 (77) 9 (5)
Other operating income 2 -- 2 >100 % -- 2 >100 %
(1) These businesses and product lines exclude acrylate ester monomers, composites (unsaturated polyester resins), inks and graphicarts raw materials, liquid resins, powder resins and textile chemicals divested on July 31, 2004 as well as other restructuring,divestiture and consolidation activities that the Company has completed related to these businesses and product lines.
The decrease in sales revenue of $255 million was due to lower sales volume resulting from the aforementioned sale of certainbusinesses and product lines within the segment. Sales revenue for continuing product lines increased $186 million, with selling pricespositively impacting revenues 18 percent, driven by cyclical commodity products.
The increase in operating earnings was the result of increased selling prices that more than offset higher raw material costs; lowerasset impairment and restructuring charges; an increased focus on more profitable businesses and product lines, including theaforementioned sale of certain businesses and product lines within the segment; improved gross profit margins, particularly forcyclical commodity product lines; and the impact of cost reduction efforts.
Operating earnings for 2005 and 2004 were reduced by asset impairments and restructuring charges totaling approximately $4 millionand $81 million, respectively. These charges are more fully described in Note 16, "Asset Impairments and Restructuring Charges,Net", in the Company’s consolidated financial statements in Part II, Item 8 of this 2006 Annual Report on Form 10-K. Operatingearnings for 2005 included $2 million of other operating income related to a change in estimates for contingencies associated with theaforementioned sale of certain businesses and product lines within the segment.
50
Source: EASTMAN CHEMICAL CO, 10-K, March 01, 2007
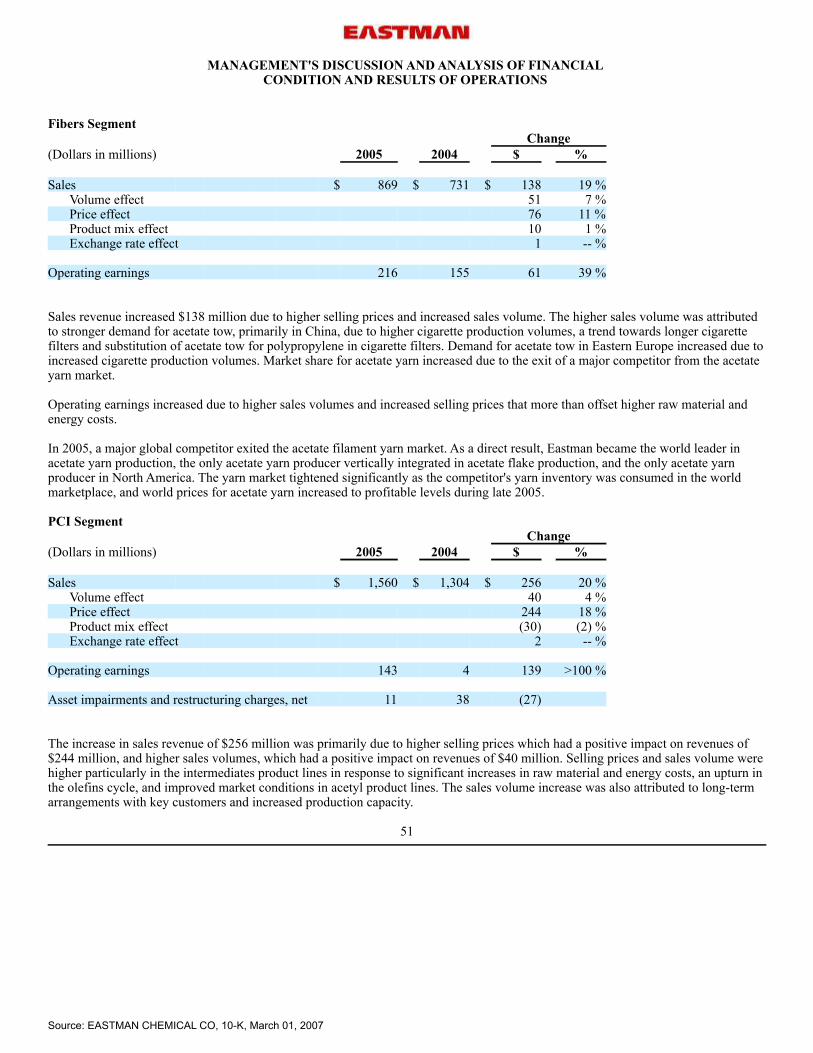
MANAGEMENT'S DISCUSSION AND ANALYSIS OF FINANCIAL
CONDITION AND RESULTS OF OPERATIONS
Fibers Segment Change(Dollars in millions) 2005 2004 $ % Sales $ 869 $ 731 $ 138 19 % Volume effect 51 7 % Price effect 76 11 % Product mix effect 10 1 % Exchange rate effect 1 -- % Operating earnings 216 155 61 39 %
Sales revenue increased $138 million due to higher selling prices and increased sales volume. The higher sales volume was attributedto stronger demand for acetate tow, primarily in China, due to higher cigarette production volumes, a trend towards longer cigarettefilters and substitution of acetate tow for polypropylene in cigarette filters. Demand for acetate tow in Eastern Europe increased due toincreased cigarette production volumes. Market share for acetate yarn increased due to the exit of a major competitor from the acetateyarn market.
Operating earnings increased due to higher sales volumes and increased selling prices that more than offset higher raw material andenergy costs.
In 2005, a major global competitor exited the acetate filament yarn market. As a direct result, Eastman became the world leader inacetate yarn production, the only acetate yarn producer vertically integrated in acetate flake production, and the only acetate yarnproducer in North America. The yarn market tightened significantly as the competitor's yarn inventory was consumed in the worldmarketplace, and world prices for acetate yarn increased to profitable levels during late 2005.
PCI Segment Change(Dollars in millions) 2005 2004 $ % Sales $ 1,560 $ 1,304 $ 256 20 % Volume effect 40 4 % Price effect 244 18 % Product mix effect (30) (2) % Exchange rate effect 2 -- % Operating earnings 143 4 139 >100 % Asset impairments and restructuring charges, net 11 38 (27)
The increase in sales revenue of $256 million was primarily due to higher selling prices which had a positive impact on revenues of$244 million, and higher sales volumes, which had a positive impact on revenues of $40 million. Selling prices and sales volume werehigher particularly in the intermediates product lines in response to significant increases in raw material and energy costs, an upturn inthe olefins cycle, and improved market conditions in acetyl product lines. The sales volume increase was also attributed to long-termarrangements with key customers and increased production capacity.
51
Source: EASTMAN CHEMICAL CO, 10-K, March 01, 2007

MANAGEMENT'S DISCUSSION AND ANALYSIS OF FINANCIAL
CONDITION AND RESULTS OF OPERATIONS
The increase in operating earnings of $139 million was primarily due to increases in selling prices and ongoing cost reduction effortsthat more than offset higher raw material and energy costs. Operating earnings for 2005 included $10 million of operating earningsfrom the achievement of certain milestones under an acetyls technology licensing agreement. Operating earnings for 2005 alsoincluded $11 million in asset impairments and restructuring charges for previously impaired sites. Operating earnings for 2004included $38 million in asset impairments related to assets at the Company's Batesville, Arkansas and Longview, Texas facilities, aswell as severance charges.
Performance Polymers Segment Change(Dollars in millions) 2005 2004 $ % Total sales $ 2,586 $ 2,226 $ 360 16 %Sales - divested product lines 618 511 107 21 %Sales - continuing product lines 1,968 1,715 253 15 % Volume effect (73) (4) % Price effect 424 19 % Product mix effect (4) -- % Exchange rate effect 13 1 % Total operating earnings 176 25 151 > 100 %Operating earnings - divested product lines (1) 75 33 42 > 100 %Operating earnings - continuing product lines 101 (8) 109 > 100 % Asset impairments and restructuring charges, net -- 13 (13)
(1) Includes allocated costs consistent with the Company’s historical practices, some of which may remain and could be reallocatedto the remainder of the segment and other segments.
In December 2006, the Company completed the sale of the Performance Polymer segment's PE businesses and related assets located atthe Longview, Texas site and the Company's ethylene pipeline.
The increase in sales revenue of $360 million was primarily due to increased selling prices, which had a positive impact of $424million. The increased selling prices were mainly the result of efforts to offset higher raw material and energy costs. The lower salesvolume was attributed to several factors: the effects of higher and volatile raw material and energy costs in North America due to theGulf Coast hurricanes, including the impact of lower raw material costs for Asian producers of PET polymers to North America andcustomers working down inventories; and low PET polymers industry operating rates in Europe and Latin America due to acombination of lower than expected demand and overcapacity in southern and eastern Europe and Asian imports in South America.Excluding the divested product lines, sales revenue increased $253 million.
Operating earnings increased as higher selling prices and reduced costs attributed to ongoing cost reduction efforts more than offsethigher raw material and energy costs, resulting in improved margins, primarily in the PE markets and North American PET markets,prior to the Gulf Coast hurricanes. Operating earnings for 2004 were also reduced by asset impairments and restructuring charges of$13 million related to severance. Excluding the divested product lines, operating earnings increased $109 million.
52
Source: EASTMAN CHEMICAL CO, 10-K, March 01, 2007

MANAGEMENT'S DISCUSSION AND ANALYSIS OF FINANCIAL
CONDITION AND RESULTS OF OPERATIONS
SP Segment Change(Dollars in millions) 2005 2004 $ % Sales $ 718 $ 644 $ 74 12 % Volume effect (2) -- % Price effect 75 12 % Product mix effect (1) -- % Exchange rate effect 2 -- % Operating earnings 64 13 51 >100 % Asset impairments and restructuring charges, net -- 53 (53) Sales revenue increased $74 million due to higher selling prices, which had a positive impact of $75 million. Despite higher salesvolume for copolyester product lines, particularly for consumer and medical goods, overall sales volume declined primarily due to thelower sales volume of acetate used in photographic film.
Operating earnings increased by $51 million compared to 2004 due to lower asset impairments and restructuring charges, higherselling prices, improved product mix, and ongoing cost reduction efforts partially offset by higher raw material and energy costs, andexpenditures related to growth initiatives. Operating earnings for 2004 included asset impairments and restructuring charges of $53million related primarily to the closure of the Hartlepool, United Kingdom manufacturing facility, as well as severance charges.
SUMMARY BY CUSTOMER LOCATION - 2005 COMPARED WITH 2004
Sales Revenue
(Dollars in millions)
2005
2004
Change
VolumeEffect
PriceEffect
Product
Mix Effect
ExchangeRate
Effect
United States and Canada $
4,098 $
3,723
10 %
(5) %
19 %
(4) %
-- %Europe, Middle East, and
Africa
1,344
1,467
(8) % (15) % 5 % 1 % 1 %Asia Pacific 930 785 18 % 4 % 12 % 2 % -- %Latin America 687 605 14 % (8) % 20 % 1 % 1%
$ 7,059 $ 6,580 7 % (7) % 15 % (1) % -- %
Sales revenue in the United States and Canada increased primarily due to higher selling prices, particularly for the Polymers, PCI, andCASPI segments, which had a $723 million positive impact on sales revenue. The higher selling prices mostly related to sales of PETpolymers, PE, intermediates chemicals, and other cyclical commodity product lines and were primarily in response to increases in rawmaterial and energy costs and high industry-wide capacity utilization. Lower overall sales volumes had a $208 million negative impacton sales revenue and were primarily due to the impact of the restructuring, divestiture, and consolidation activities in the CASPIsegment, partially offset by significantly higher sales volumes in the PCI segment. The Cendian shutdown was reflected in productmix which had a $140 million negative impact on sales revenue.
53
Source: EASTMAN CHEMICAL CO, 10-K, March 01, 2007

MANAGEMENT'S DISCUSSION AND ANALYSIS OF FINANCIAL
CONDITION AND RESULTS OF OPERATIONS
Sales revenue in Europe, the Middle East and Africa decreased primarily due to lower sales volumes, mainly the result of the impactof the restructuring, divestiture, and consolidation activities in the CASPI segment, which had a $224 million negative impact on salesrevenue. Higher selling prices, particularly for PET polymers, had a $77 million positive impact on sales revenue.
Sales revenue in Asia Pacific increased primarily due to higher overall selling prices across all segments which had a $92 millionpositive impact on sales revenue. Higher sales volumes, particularly for the Fibers segment, had a $34 million positive impact on salesrevenue. Sales revenue in Latin America increased primarily due to higher selling prices, partially offset by lower sales volume. Higher sellingprices, particularly for PET polymers, had a $119 million positive impact on sales revenue. Lower sales volume, particularly for PETpolymers and PE, had a $49 million negative impact on sales revenue.
LIQUIDITY, CAPITAL RESOURCES, AND OTHER FINANCIAL INFORMATION
Cash Flows
(Dollars in millions) 2006 2005 2004 Net cash provided by (used in): Operating activities $ 609 $ 769 $ 494Investing activities (94) (18) (148)Financing activities (101) (547) (579)Effect of exchange rate changes on cash and cashequivalents
1
(5)
--
Net change in cash and cash equivalents $ 415 $ 199 $ (233) Cash and cash equivalents at end of period $ 939 $ 524 $ 325
Cash provided by operating activities decreased $160 million in 2006 compared with 2005 primarily due to an increase in workingcapital requirements and a decrease in earnings, partially offset by lower current year cash contributions to its U.S. defined benefitpension plan. In 2006, the Company's working capital requirements increased, primarily due to a higher mix of sales in Latin Americaand Europe, where customer credit terms are longer as compared to North America. The Company contributed $75 million and $165million to its U.S. defined benefit pension plan in 2006 and 2005, respectively.
Cash provided by operating activities increased $275 million in 2005 compared with 2004 primarily as a result of a significantincrease in earnings and a decrease in working capital requirements, partially offset by $165 million in contributions to its U.S.defined benefit pension plan. The decrease in working capital requirements related primarily to accounts receivable, largely the resultof improved collection performance which more than offset the increase in sales, partially offset by an increase in inventories. TheCompany made $3 million in contributions to its U.S. defined benefit pension plan in 2004.
Cash used in investing activities totaled $94 million and $18 million in 2006 and 2005, respectively. In 2006, the Company received$74 million in proceeds from the sale of its Batesville, Arkansas manufacturing facility and related assets and the specialty organicchemicals product lines and $235 million in proceeds from the sale of PE and Epolene polymer businesses and related assets located atthe Longview, Texas site and the Company's ethylene pipeline. For more information concerning divestitures, see Note 24,"Divestitures", to the Company’s consolidated financial statements in Part II, Item 8 of this 2006 Annual Report on Form 10-K. In2005, the Company received $417 million net cash proceeds from the sale of its equity investment in Genencor. Capital spending of$389 million and $343 million in 2006 and 2005, respectively, included expenditures related to the construction of the new PETfacility utilizing IntegRex technology.
54
Source: EASTMAN CHEMICAL CO, 10-K, March 01, 2007

MANAGEMENT'S DISCUSSION AND ANALYSIS OF FINANCIAL
CONDITION AND RESULTS OF OPERATIONS
Cash used in investing activities decreased $130 million in 2005 compared with 2004 largely due to $417 million in net proceeds fromthe sale of the Company's investment in Genencor in the second quarter 2005. In addition, in the second quarter 2005, the Companyreceived payment for the $50 million note it received in the sale of certain businesses and product lines in the CASPI segment. In2004, the Company received $115 million in net cash proceeds associated with such sale, as well as $12 million in proceeds from thesale of Ariel. In the fourth quarter 2005, the Company provided a line of credit up to $125 million to Primester, a joint venture inwhich Eastman has a 50 percent interest, which Primester fully utilized to repay its third-party borrowings, which had previously beenguaranteed by Eastman. In addition, the Company used an additional $95 million for additions to properties and equipment in 2005 ascompared with 2004.
Cash used in financing activities in 2006 totaled $101 million and included a decrease in credit facility and other borrowings,including bank overdrafts, of $50 million, offset by cash received from stock option exercises of $83 million.
Cash used in financing activities in 2005 totaled $547 million and included the Company's early repayment of $500 million of itsoutstanding long-term debt, and a decrease in credit facility and other borrowings, including bank overdrafts, of $150 million, offsetby cash received from stock option exercises of $98 million. See Note 8, "Early Extinguishment of Debt", to the Company’sconsolidated financial statements in Part II, Item 8 of this 2006 Annual Report on Form 10-K for information regarding the earlyextinguishment of debt. In addition, the Company borrowed $191 million from a new credit facility in the fourth quarter 2005, theproceeds of which provided a significant part of the funding for the repatriation of undistributed foreign earnings under the provisionsof the American Jobs Creation Act.
Cash used in financing activities in 2004 totaled $579 million and reflects the January 2004 repayment of $500 million of 6 3/8%notes and a decrease in commercial paper, credit facility, and other borrowings, including bank overdrafts, of $19 million, offset bycash from stock option exercises of $77 million.
The payment of dividends is also reflected in financing activities in all periods.
Liquidity
At December 31, 2006, the Company had credit facilities with various U.S. and foreign banks totaling approximately $885 million.These credit facilities consist of a $700 million revolving credit facility (the "Credit Facility") expiring in April 2011, as well as a 140million Euro credit facility ("Euro Facility") which expires in December 2011. Both credit facilities have options for two one-yearextensions, and the first extension option for the Euro Facility has been exercised. Borrowings under these credit facilities are subjectto interest at varying spreads above quoted market rates. These credit facilities require facility fees on the total commitment that arebased on Eastman’s credit rating. In addition, these credit facilities contain a number of covenants and events of default, including themaintenance of certain financial ratios. At December 31, 2006, the Company’s credit facility borrowings totaled $185 million atan effective interest rate of 4.00 percent. At December 31, 2005, the Company's credit facility borrowings were $214 million at aweighted-average interest rate of 3.01 percent. The Credit Facility provides liquidity support for commercial paper borrowings and general corporate purposes. Accordingly, anyoutstanding commercial paper borrowings reduce borrowings available under the Credit Facility. Since the Credit Facility expires inApril 2011, any commercial paper borrowings supported by the Credit Facility are classified as long-term borrowings because theCompany has the ability to refinance such borrowings on a long-term basis.
For more information regarding interest rates, see Note 7, "Borrowings", to the Company’s consolidated financial statements in PartII, Item 8 of this 2006 Annual Report on Form 10-K.
55
Source: EASTMAN CHEMICAL CO, 10-K, March 01, 2007

MANAGEMENT'S DISCUSSION AND ANALYSIS OF FINANCIAL
CONDITION AND RESULTS OF OPERATIONS
The Company has effective shelf registration statements filed with the Securities and Exchange Commission to issue a combined $1.1billion of debt or equity securities.
In the second quarter 2005, Eastman completed the sale of its equity interest in Genencor for approximately $417 million in net cashproceeds after tax. This action, combined with strong operating results, allowed the Company to complete the early repayment of $500million of its outstanding debt in second quarter 2005, further strengthening its financial position.
During 2006, the Company contributed $75 million to its U.S. defined benefit pension plan. In first quarter 2007, the Companycompleted a planned $100 million contribution to its U.S. defined benefit pension plan.
Cash flows from operations and the sources of capital described above are expected to be available and sufficient to meet foreseeablecash flow requirements. However, the Company’s cash flows from operations can be affected by numerous factors including risksassociated with global operations, raw material availability and cost, demand for and pricing of Eastman’s products, capacityutilization, and other factors described under "Forward-Looking Statements and Risk Factors" below. The Company believesmaintaining a financial profile consistent with an investment grade company is important to its long term strategic and financialflexibility.
Capital Expenditures
Capital expenditures were $389 million, $343 million, and $248 million for 2006, 2005, and 2004, respectively. The increase of $46million in 2006 compared with 2005 was primarily due to spending on the expansion of CHDM capacity, as well as other growthinitiatives. The Company expects that 2007 capital spending will be up to $450 million which will exceed estimated 2007 depreciationand amortization of approximately $350 million, including accelerated depreciation of $50 million. In 2007, the Company willcontinue to pursue projects including an acetate tow expansion in England, a copolyester intermediates expansion, makeenhancements to benefit the PET facilities in South Carolina, utilizing IntegRex technology, and other growth initiatives.
Other Commitments
At December 31, 2006, the Company’s obligations related to notes and debentures totaled approximately $1.4 billion to be paid over aperiod of approximately 20 years. Other borrowings, related primarily to credit facility borrowings, totaled approximately $200million.
The Company had various purchase obligations at December 31, 2006 totaling approximately $2.1 billion over a period ofapproximately 15 years for materials, supplies and energy incident to the ordinary conduct of business. The Company also had variouslease commitments for property and equipment under cancelable, noncancelable, and month-to-month operating leases totalingapproximately $200 million over a period of several years. Of the total lease commitments, approximately 12 percent relate tomachinery and equipment, including computer and communications equipment and production equipment; approximately 50 percentrelate to real property, including office space, storage facilities and land; and approximately 38 percent relate to railcars.
In addition, the Company had other liabilities at December 31, 2006 totaling approximately $1.4 billion related primarily to pension,retiree medical, other post-employment obligations and environmental reserves.
56
Source: EASTMAN CHEMICAL CO, 10-K, March 01, 2007

MANAGEMENT'S DISCUSSION AND ANALYSIS OF FINANCIAL
CONDITION AND RESULTS OF OPERATIONS
The obligations described above are summarized in the following table:
(Dollars inMillions)
Payments Due from
Period
Notes andDebentures
Credit FacilityBorrowingsand Other
InterestPayable
PurchaseObligations
OperatingLeases
OtherLiabilities
(a)
Total
2007 $ -- $ 3 $ 107 $ 373 $ 45 $ 158 $ 6862008 72 -- 106 363 30 71 6422009 -- 13 106 349 25 67 5602010 -- -- 104 312 20 66 5022011 2 185 104 199 17 61 5682012 and
beyond
1,317
--
1,052
507 64 955 3,895Total $ 1,391 $ 201 $ 1,579 $ 2,103 $ 201 $ 1,378 $ 6,853
(a) Amounts represent the current estimated cash payments to be made by the Company primarily for pension and otherpost-employment benefits in the periods indicated. The amount and timing of such payments is dependent upon interest rates, healthcare trends, actual returns on plan assets, retirement and attrition rates of employees, continuation or modification of the benefit plans,and other factors. Such factors can significantly impact the amount and timing of any future contributions by the Company.
Purchase obligations increased approximately $360 million at December 31, 2006 compared to December 31, 2005 due primarily toincreased raw material prices.
Off Balance Sheet and Other Financing Arrangements
If certain operating leases are terminated by the Company, it guarantees a portion of the residual value loss, if any, incurred by thelessors in disposing of the related assets. Under these operating leases, the residual value guarantees at December 31, 2006 totaled$113 million and consisted primarily of leases for railcars, company aircraft, and other equipment. Leases with guarantee amountstotaling $2 million, $27 million, and $84 million will expire in 2007, 2008, and 2012, respectively. The Company believes, based oncurrent facts and circumstances, that the likelihood of a material payment pursuant to such guarantees is remote.
As described in Note 5, "Equity Investments and Other Noncurrent Assets and Liabilities", to the Company’s consolidated financialstatements in Part II, Item 8 of this 2006 Annual Report on Form 10-K, Eastman has a 50 percent interest in and serves as theoperating partner in Primester, a joint venture which manufactures cellulose acetate at the Company's Kingsport, Tennessee plant.During fourth quarter 2005, the Company provided a line of credit to the joint venture of up to $125 million, which Primester fullyutilized to pay the principal amount of the joint venture's third-party borrowings, previously guaranteed by Eastman.
57
Source: EASTMAN CHEMICAL CO, 10-K, March 01, 2007

MANAGEMENT'S DISCUSSION AND ANALYSIS OF FINANCIAL
CONDITION AND RESULTS OF OPERATIONS
As described in Note 11, "Commitments", to the Company’s consolidated financial statements in Part II, Item 8 of this 2006 AnnualReport on Form 10-K, Eastman entered into an agreement in 1999 that allows it to generate cash by reducing its working capitalthrough the sale of undivided interests in certain domestic trade accounts receivable under a planned continuous sale program to athird party. Under this agreement, receivables sold to the third party totaled $200 million at December 31, 2006 and 2005. Undividedinterests in designated receivable pools were sold to the purchaser with recourse limited to the purchased interest in the receivablepools.
The Company did not have any other material relationships with unconsolidated entities or financial partnerships, including specialpurpose entities, for the purpose of facilitating off-balance sheet arrangements with contractually narrow or limited purposes. Thus,Eastman is not materially exposed to any financing, liquidity, market, or credit risk related to the above or any other suchrelationships.
The Company has evaluated material relationships including the guarantees related to the third-party borrowings of joint venturesdescribed above and has concluded that the entities are not Variable Interest Entities (“VIEs”) or, in the case of Primester, theCompany is not the primary beneficiary of the VIE. As such, in accordance with Financial Accounting Standards Board ("FASB")Interpretation Number 46, "Consolidation of Variable Interest Entities" ("FIN 46R"), the Company is not required to consolidate theseentities. In addition, the Company has evaluated long-term purchase obligations with two entities that may be VIEs at December 31,2006. These potential VIEs are joint ventures from which the Company has purchased raw materials and utilities for several years andpurchases approximately $60 million of raw materials and utilities on an annual basis. The Company has no equity interest in theseentities and has confirmed that one party to each of these joint ventures does consolidate the potential VIE. However, due tocompetitive and other reasons, the Company has not been able to obtain the necessary financial information to determine whether theentities are VIEs, and if one or both are VIEs, whether or not the Company is the primary beneficiary.
Guarantees and claims also arise during the ordinary course of business from relationships with suppliers, customers, andnon-consolidated affiliates when the Company undertakes an obligation to guarantee the performance of others if specified triggeringevents occur. Non-performance under a contract could trigger an obligation of the Company. These potential claims include actionsbased upon alleged exposures to products, intellectual property and environmental matters, and other indemnifications. The ultimateeffect on future financial results is not subject to reasonable estimation because considerable uncertainty exists as to the final outcomeof these claims. However, while the ultimate liabilities resulting from such claims may be significant to results of operations in theperiod recognized, management does not anticipate they will have a material adverse effect on the Company's consolidated financialposition or liquidity.
See Note 10, "Retirement Plans", to the Company's consolidated financial statements in Part II, Item 8 of this 2006 Annual Report onForm 10-K for off-balance sheet post-employment benefit obligations.
Treasury Stock Transactions
The Company was authorized to repurchase up to $400 million of its common stock. No shares of Eastman common stock wererepurchased by the Company during 2006, 2005 or 2004 under a Company repurchase plan. A total of 2,746,869 shares of commonstock at a cost of approximately $112 million, or an average price of approximately $41 per share, have been repurchased under theauthorization. Repurchased shares may be used to meet common stock requirements for compensation and benefit plans and othercorporate purposes.
On February 20, 2007, the Board of Directors cancelled its prior authorization for stock repurchases dated February 4, 1999 andapproved a new authorization for the repurchase of up to $300 million of the Company's outstanding common stock at such times, insuch amounts, and on such terms, as determined to be in the best interests of the Company. Repurchased shares may be used for suchpurposes or otherwise applied in such a manner as determined to be in the best interests of the Company.
58
Source: EASTMAN CHEMICAL CO, 10-K, March 01, 2007

MANAGEMENT'S DISCUSSION AND ANALYSIS OF FINANCIAL
CONDITION AND RESULTS OF OPERATIONS
Dividends
The Company declared quarterly cash dividends of $0.44 per share for a total of $1.76 per share in 2006, 2005, and 2004, respectively.
Preferred Stock Purchase Rights
During the fourth quarter of 2006, the Board of Directors of the Company redeemed all of the outstanding preferred stock purchaserights issuable pursuant to the Stockholder Protection Rights Agreement and terminated the Stockholder Protection Rights Agreement.The payment of $0.01 per share of common stock was made January 2, 2007.
ENVIRONMENTAL
Certain Eastman manufacturing sites generate hazardous and nonhazardous wastes of which the treatment, storage, transportation, anddisposal are regulated by various governmental agencies. In connection with the cleanup of various hazardous waste sites, theCompany, along with many other entities, has been designated a potentially responsible party ("PRP") by the U.S. EnvironmentalProtection Agency under the Comprehensive Environmental Response, Compensation and Liability Act, which potentially subjectsPRPs to joint and several liability for such cleanup costs. In addition, the Company will be required to incur costs for environmentalremediation and closure and postclosure under the Federal Resource Conservation and Recovery Act. Adequate reserves forenvironmental contingencies have been established in accordance with Eastman’s policies as described in Note 1, "SignificantAccounting Policies", to the Company’s consolidated financial statements in Part II, Item 8 of this 2006 Annual Report on Form 10-K.Because of expected sharing of costs, the availability of legal defenses, and the Company’s preliminary assessment of actions that maybe required, it does not believe its liability for these environmental matters, individually or in the aggregate, will be material to theCompany’s consolidated financial position, results of operations, or cash flows.
The Company accrues environmental remediation costs when it is probable that the Company has incurred a liability at acontaminated site and the amount can be reasonably estimated. When a single amount cannot be reasonably estimated but the cost canbe estimated within a range, the Company accrues the minimum amount. This undiscounted accrued amount reflects the Company’sassumptions about remediation requirements at the contaminated site, the nature of the remedy, the outcome of discussions withregulatory agencies and other potentially responsible parties at multi-party sites, and the number and financial viability of otherpotentially responsible parties. Changes in the estimates on which the accruals are based, unanticipated government enforcementaction, or changes in health, safety, environmental, and chemical control regulations and testing requirements could result in higher orlower costs. Estimated future environmental expenditures for remediation costs range from the minimum or best estimate of $18million to the maximum of $32 million at December 31, 2006.
In addition to remediation activities, the Company establishes reserves for closure/postclosure costs associated with the environmentalassets it maintains. Environmental assets include but are not limited to waste management units, such as landfills, water treatmentfacilities, and ash ponds. When these types of assets are constructed or installed, a reserve is established for the anticipated future costsassociated with the closure of the asset based on its expected life and the applicable regulatory closure requirements. These futureexpenses are charged into earnings over the estimated useful life of the assets.
59
Source: EASTMAN CHEMICAL CO, 10-K, March 01, 2007

MANAGEMENT'S DISCUSSION AND ANALYSIS OF FINANCIAL
CONDITION AND RESULTS OF OPERATIONS
In March 2005, the FASB issued Interpretation No 47, "Accounting for Conditional Asset Retirement Obligations" (" FIN 47"), whichwas effective for the Company on December 31, 2005. FIN 47 requires an entity to recognize a liability for a conditional assetretirement obligation when incurred if the liability can be reasonably estimated. The Interpretation also clarifies that the termConditional Asset Retirement Obligation ("CARO") refers to a legal obligation to perform an asset retirement activity in which thetiming and/or method of settlement are conditional on a future event that may or may not be within the control of the entity. FIN 47also clarifies when an entity would have sufficient information to reasonably estimate the fair value of an asset retirement obligation.The Company performed a thorough examination of various asset categories. Although it may have CAROs at certain of its facilities,including, but not limited to, the potential for asbestos abatement activities, the Company is unable to determine potential settlementdates to be used in fair value calculations for estimating these obligations as a result of an absence of plans or expectations toundertake a major renovation or demolition project that would require the removal of asbestos. The Company continues to monitorthese conditional obligations, as well as any new ones that may develop, and will record reserves associated with them when and tothe extent that more detailed information becomes available concerning applicable retirement costs. The recorded obligations did nothave a material impact on its consolidated financial position, results of operations and cash flows.
Reserves related to environmental assets accounted for approximately 60 percent of the total environmental reserve at December 31,2006. Currently, the Company’s environmental assets are expected to be no longer useable at different times over the next 50 years. Ifthe Company were to invest in numerous new environmental assets, or, these assets were to require closure a significant number ofyears before the Company anticipated they would, the amortization on them would increase, and could have a material negativeimpact on the Company’s financial condition and results of operations. The Company views the likelihood of this occurrence to beremote, and does not anticipate, based on its past experience with this type of planned remediation, that an additional accrual related toenvironmental assets will be necessary.
INFLATION
In recent years, general economic inflation has not had a material adverse impact on Eastman's costs. The cost of raw materials isgenerally based on market price, although derivative financial instruments were utilized, as appropriate, to mitigate short-term marketprice fluctuations. For additional information see Note 9, "Fair Value of Financial Instruments", to the Company’s consolidatedfinancial statements in Part II, Item 8 of this 2006 Annual Report on Form 10-K.
RECENTLY ISSUED ACCOUNTING STANDARDS
In February 2006, the FASB issued SFAS No. 155, “Accounting for Certain Hybrid Financial Instruments,” an amendment of SFASNo. 133, "Accounting for Derivative Instruments and Hedging Activities," and SFAS No. 140, "Accounting for Transfers andServicing of Financial Assets and Extinguishment of Liabilities." SFAS No. 155 simplifies accounting for certain hybrid instrumentsunder SFAS No. 133 by permitting fair value remeasurement for financial instruments containing an embedded derivative thatotherwise would require bifurcation. SFAS No. 155 eliminates both the previous restriction under SFAS No. 140 on passive derivativeinstruments that a qualifying special-purpose entity may hold and SFAS No. 133 Implementation Issue No. D1, “Application ofStatement 133 to Beneficial Interests in Securitized Financial Assets,” which provides that beneficial interests are not subject to theprovisions of SFAS No. 133. SFAS No. 155 also establishes a requirement to evaluate interests in securitized financial assets toidentify interests that are freestanding derivatives or that are hybrid financial instruments that contain an embedded derivativerequiring bifurcation, and clarifies that concentrations of credit risk in the form of subordination are not imbedded derivatives. SFASNo. 155 is effective for all financial instruments acquired, issued, or subject to a remeasurement event occurring after the beginning ofan entity’s fiscal year that begins after September 15, 2006. The Company has evaluated the effect of SFAS No. 155 and determinedthat it does not expect a material impact from the adoption to its consolidated financial position, liquidity, or results from operations.
60
Source: EASTMAN CHEMICAL CO, 10-K, March 01, 2007

MANAGEMENT'S DISCUSSION AND ANALYSIS OF FINANCIAL
CONDITION AND RESULTS OF OPERATIONS
In March 2006, the FASB issued SFAS No. 156, “Accounting for Servicing of Financial Assets,” an amendment of SFAS No. 140.SFAS No. 156 permits entities to choose to either subsequently measure servicing rights at fair value and report changes in fair valuein earnings or amortize servicing rights in proportion to and over the estimated net servicing income or loss and assess to rights forimpairment or the need for an increased obligation. SFAS No. 156 also clarifies when a servicer should separately recognize servicingassets and liabilities; requires all separately recognized assets and liabilities to be initially measured at fair value, if practicable;permits a one-time reclassification of available-for-sales securities to trading securities by an entity with recognized servicing rightsand requires additional disclosures for all separately recognized servicing assets and liabilities. SFAS No. 156 is effective as of thebeginning of an entity’s fiscal year that begins after September 15, 2006. The Company has evaluated the effect of SFAS No. 156 anddetermined that it does not expect a material impact from the adoption to its consolidated financial position, liquidity, or results fromoperations.
In July 2006, the FASB issued Interpretation No. 48 ("FIN 48"), "Accounting for Uncertainty in Income Taxes—an Interpretation ofSFAS 109 "Accounting for Income Taxes". FIN 48 prescribes a comprehensive model for how a company should recognize, measure,present, and disclose in its financial statements uncertain tax positions that a company has taken or expects to take on a tax return.Under FIN 48, the financial statements will reflect expected future tax consequences of such positions presuming the taxingauthorities' full knowledge of the position and all relevant facts, but without considering time values. FIN 48 also revises disclosurerequirements and introduces a prescriptive, annual, tabular roll-forward of the unrecognized tax benefits. FIN 48 is effective for fiscalyears beginning after December 15, 2006. The Company does not expect the adoption of FIN 48 to have a material effect on itsconsolidated financial position, liquidity, or results of operations.
In September 2006, the FASB issued SFAS No. 157, "Fair Value Measurements," which addresses the measurement of fair value bycompanies when they are required to use a fair value measure for recognition or disclosure purposes under GAAP. SFAS No. 157provides a common definition of fair value to be used throughout GAAP which is intended to make the measurement of fair valuemore consistent and comparable and improve disclosures about those measures. SFAS No. 157 will be effective for an entity'sfinancial statements issued for fiscal years beginning after November 15, 2007. The Company is currently evaluating the effect SFASNo. 157 will have on its consolidated financial position, liquidity, or results of operations.
In September 2006, the FASB issued Staff Position No. AUG AIR-1 ("FSP No. AUG AIR-1") which addresses the accounting forplanned major maintenance activities. FSP No. AUG AIR-1 amends certain provisions in the American Institute of Certified PublicAccountants ("AICPA") Industry Audit Guide and APB Opinion No. 28, "Interim Financial Reporting". Four alternative methods ofaccounting for planned major maintenance activities were permitted: direct expense, built-in overhaul, deferral, and accrual("accrue-in-advance"). This FSP prohibits the use of the accrue-in-advance method of accounting for planned major maintenanceactivities because it results in the recognition of a liability in a period prior to the occurrence of the transaction or event obligating theentity. FSP No. AUG AIR-1 is effective for an entity's financial statements issued for fiscal years beginning after December 15, 2006.The Company does not utilize the accrue-in-advance method of accounting and therefore expects this FSP to have no impact on itsconsolidated financial position, liquidity, or results of operations.
In February, 2007, the FASB issued SFAS No. 159, "The Fair Value Option for Financial Assets and Financial Liabilities—Includingan amendment of FASB Statement No. 115." SFAS No. 159 permits companies to choose to measure many financial instruments andcertain other items at fair value at specified election dates. Upon adoption, an entity shall report unrealized gains and losses on itemsfor which the fair value option has been elected in earnings at each subsequent reporting date. Most of the provisions apply only toentities that elect the fair value option. However, the amendment to SFAS No. 115, "Accounting for Certain Investments in Debt andEquity Securities," applies to all entities with available for sale and trading securities. SFAS No. 159 will be effective as of thebeginning of an entity's first fiscal year that begins after November 15, 2007. The Company is currently evaluating the effect SFASNo. 159 will have on its consolidated financial position, liquidity, or results of operations.
61
Source: EASTMAN CHEMICAL CO, 10-K, March 01, 2007

MANAGEMENT'S DISCUSSION AND ANALYSIS OF FINANCIAL
CONDITION AND RESULTS OF OPERATIONSOUTLOOK
For 2007, the Company expects:
•��strong volumes will be maintained due to continued economic strength, continued substitution of Eastman products for othermaterials, and new applications for existing products;
•��the volatility of raw material and energy costs will continue and the Company will continue to pursue pricing strategies andongoing cost control initiatives to offset the effects on gross profit;
•��a staged phase-out of older cracking units and a planned shutdown of higher cost PET assets in South Carolina willcontinue in 2007, resulting in accelerated depreciation in 2007 of approximately $50 million;
•��to increase volumes in the PCI segment due to the transition agreement pertaining to the polyethylene divestiture; the Companywill supply ethylene to the buyer, allowing both companies to optimize the value of their respective olefin businesses undervarious market conditions;
•��to contribute $100 million to the Company’s U.S. defined benefit pension plan, all of which was contributed in the first quarter of
2007;
•��net interest expense to decrease compared with 2006 primarily due to higher interest income, driven by higher invested cashbalances;
•��the effective tax rate to be approximately 35 percent;
•��that acetate tow will have modest growth potential in future years and; therefore, expects to continue to evaluate growth options inAsia;
•��to aggressively take action to improve the performance of its PET product lines in the Performance Polymers segment, includingstarting up the Company's new PET facility utilizing IntegRex technology in Columbia, South Carolina, debottlenecking the newPET facility utilizing IntegRex technology for an additional 100 thousand metric tons of capacity, rationalizing 350 thousandmetric tons of existing capacity in North America, entering into an agreement to sell the Spain PET manufacturing facility, andconsidering other strategic options for its underperforming PET manufacturing facilities outside the United States, which may leadto further restructuring and asset impairment charges;
•��capital expenditures to increase to up to $450 million and exceed estimated depreciation and amortization of approximately $350
million, including accelerated depreciation of $50 million; in 2007, the Company plans to pursue expansion of acetate tow andcopolyester intermediates, make enhancements to benefit the PET facilities in South Carolina, utilizing IntegRex technology, andpursue growth initiatives; and
•��priorities for use of available cash will be to pay the quarterly cash dividend, fund targeted growth initiatives and defined benefit
pension plans, and repurchase shares. See “Forward-Looking Statements and Risk Factors" below.
62
Source: EASTMAN CHEMICAL CO, 10-K, March 01, 2007

MANAGEMENT'S DISCUSSION AND ANALYSIS OF FINANCIAL
CONDITION AND RESULTS OF OPERATIONS
FORWARD-LOOKING STATEMENTS AND RISK FACTORS The expectations under "Outlook" and certain other statements in this Annual Report on Form 10-K may be forward-looking in natureas defined in the Private Securities Litigation Reform Act of 1995. These statements and other written and oral forward-lookingstatements made by the Company from time to time may relate to, among other things, such matters as planned and expected capacityincreases and utilization; anticipated capital spending; expected depreciation and amortization; environmental matters; legalproceedings; exposure to, and effects of hedging of, raw material and energy costs, foreign currencies and interest rates; global andregional economic, political, and business conditions; competition; growth opportunities; supply and demand, volume, price, cost,margin, and sales; earnings, cash flow, dividends and other expected financial results and conditions; expectations, strategies, andplans for individual assets and products, businesses and segments as well as for the whole of Eastman Chemical Company; cashrequirements and uses of available cash; financing plans; pension expenses and funding; credit ratings; anticipated restructuring,divestiture, and consolidation activities; cost reduction and control efforts and targets; integration of acquired businesses; strategicinitiatives and development, production, commercialization, and acceptance of new products, services and technologies and relatedcosts; asset, business and product portfolio changes; and expected tax rates and net interest costs.
These plans and expectations are based upon certain underlying assumptions, including those mentioned with the specific statements.Such assumptions are in turn based upon internal estimates and analyses of current market conditions and trends, management plansand strategies, economic conditions and other factors. These plans and expectations and the assumptions underlying them arenecessarily subject to risks and uncertainties inherent in projecting future conditions and results. Actual results could differ materiallyfrom expectations expressed in the forward-looking statements if one or more of the underlying assumptions and expectations provesto be inaccurate or is unrealized. In addition to the factors described in this report, the following are some of the important factors thatcould cause the Company's actual results to differ materially from those in any such forward-looking statements:
•��The Company is reliant on certain strategic raw materials and energy commodities for its operations and utilizes risk managementtools, including hedging, as appropriate, to mitigate short-term market fluctuations in raw material and energy costs. There can beno assurance, however, that such measures will result in cost savings or that all market fluctuation exposure will be eliminated. Inaddition, natural disasters, changes in laws or regulations, war or other outbreak of hostilities or terrorism or other political factorsin any of the countries or regions in which the Company operates or does business or in countries or regions that are key suppliersof strategic raw materials and energy commodities, or breakdown or degradation of transportation infrastructure used for deliveryof strategic raw materials and energy commodities, could affect availability and costs of raw materials and energy commodities.
•��While temporary shortages of raw materials and energy may occasionally occur, these items have historically been sufficientlyavailable to cover current and projected requirements. However, their continuous availability and price are impacted by naturaldisasters, plant interruptions occurring during periods of high demand, domestic and world market and political conditions,changes in government regulation, war or other outbreak of hostilities or terrorism, and breakdown or degradation oftransportation infrastructure. Eastman’s operations or products may, at times, be adversely affected by these factors.
63
Source: EASTMAN CHEMICAL CO, 10-K, March 01, 2007

MANAGEMENT'S DISCUSSION AND ANALYSIS OF FINANCIAL
CONDITION AND RESULTS OF OPERATIONS •��The Company's competitive position in the markets in which it participates is, in part, subject to external factors in addition to
those that the Company can impact. Natural disasters, pandemic illnesses, changes in laws or regulations, war or other outbreak ofhostilities or terrorism, or other political factors in any of the countries or regions in which the Company operates or does businessor in countries or regions that are key suppliers of strategic raw materials, and breakdown or degradation of transportationinfrastructure used for delivery of raw materials and energy supplies to the Company and for delivery of the Company's productsto customers, could negatively impact the Company’s competitive position and its ability to maintain market share. For example,supply and demand for certain of the Company's products is driven by end-use markets and worldwide capacities which, in turn,impact demand for and pricing of the Company's products.
•��Limitation of the Company's available manufacturing capacity due to significant disruption in its manufacturing operations,including natural disasters, pandemic illnesses, changes in laws or regulations, war or other outbreak of hostilities or terrorism orother political factors in any of the countries or regions in which the Company operates or does business, or breakdown ordegradation of transportation infrastructure used for delivery of raw materials and energy supplies to the Company and fordelivery of the Company's products to customers, could have a material adverse affect on sales revenue, costs and results ofoperations and financial condition.
•��The Company has an extensive customer base; however, loss of, or material financial weakness of, certain of the largest customerscould adversely affect the Company's financial condition and results of operations until such business is replaced and noassurances can be made that the Company would be able to regain or replace any lost customers.
•��The Company's competitive position has recently been adversely impacted by low cost competitors in certain regions andcustomers developing internal or alternative sources of supply.
•��The Company has efforts underway to exploit growth opportunities in certain core businesses by developing new products andtechnologies, expanding into new markets, and tailoring product offerings to customer needs. Current examples include IntegRextechnology and new PET polymers products and copolyester product innovations There can be no assurance that such efforts willresult in financially successful commercialization of such products or acceptance by existing or new customers or new markets orthat large capital projects for such growth efforts can be completed within the time or at the costs projected due, among otherthings, to demand for and availability of construction materials and labor.
•��The Company has made, and intends to continue making, strategic investments, including IntegRex technology and coalgasification, and has entered, and expects to continue to enter, into strategic alliances in technology, services businesses, and otherventures in order to build, diversify, and strengthen certain Eastman capabilities, improve Eastman's raw materials and energy costand supply position, and maintain high utilization of manufacturing assets. There can be no assurance that such investments andalliances will achieve their underlying strategic business objectives or that they will be beneficial to the Company's results ofoperations or that large capital projects for such growth efforts can be completed within the time or at the costs projected due,among other things, to demand for and availability of construction materials and labor.
•��In addition to productivity and cost reduction initiatives, the Company is striving to improve margins on its products through priceincreases where warranted and accepted by the market; however, the company's earnings could be negatively impacted shouldsuch increases be unrealized, not be sufficient to cover increased raw material and energy costs, or have a negative impact ondemand and volume. There can be no assurances that price increases will be realized or will be realized within the company'santicipated timeframe.
64
Source: EASTMAN CHEMICAL CO, 10-K, March 01, 2007
MANAGEMENT'S DISCUSSION AND ANALYSIS OF FINANCIAL
CONDITION AND RESULTS OF OPERATIONS •��The Company has undertaken and expects to continue to undertake productivity and cost reduction initiatives and organizational
restructurings to improve performance and generate cost savings. There can be no assurance that these will be completed asplanned or beneficial or that estimated cost savings from such activities will be realized.
•��The Company's facilities and businesses are subject to complex health, safety and environmental laws and regulations, whichrequire and will continue to require significant expenditures to remain in compliance with such laws and regulations currently andin the future. The Company's accruals for such costs and associated liabilities are subject to changes in estimates on which theaccruals are based. The amount accrued reflects the Company’s assumptions about remediation requirements at the contaminatedsite, the nature of the remedy, the outcome of discussions with regulatory agencies and other potentially responsible parties atmulti-party sites, and the number and financial viability of other potentially responsible parties. Changes in the estimates on whichthe accruals are based, unanticipated government enforcement action, or changes in health, safety, environmental, chemicalcontrol regulations and testing requirements could result in higher or lower costs.
•��The Company and its operations from time to time are parties to or targets of lawsuits, claims, investigations, and proceedings,including product liability, personal injury, asbestos, patent and intellectual property, commercial, contract, environmental,antitrust, health and safety, and employment matters, which are handled and defended in the ordinary course of business. TheCompany believes amounts reserved are adequate for such pending matters; however, results of operations could be affected bysignificant litigation adverse to the Company.
•��The Company has deferred tax assets related to capital and operating losses. The Company establishes valuation allowances toreduce these deferred tax assets to an amount that is more likely than not to be realized. The Company’s ability to utilize thesedeferred tax assets depends on projected future operating results, the reversal of existing temporary differences, and theavailability of tax planning strategies. Realization of these assets is expected to occur over an extended period of time. As a result,changes in tax laws, assumptions with respect to future taxable income, and tax planning strategies could result in adjustments tothese assets.
•��Due to the Company's global sales, earnings, and asset profile, it is exposed to volatility in foreign currency exchange rates andinterest rates. The Company may use derivative financial instruments, including swaps, options and forwards, to mitigate theimpact of changes in exchange rates and interest rates on its financial results. However, there can be no assurance that these effortswill be successful and operating results could be affected by significant adverse changes in currency exchange rates or interestrates.
The foregoing list of important factors does not include all such factors nor necessarily present them in order of importance. Thisdisclosure, including that under "Outlook" and "Forward-Looking Statements and Risk Factors," and other forward-looking statementsand related disclosures made by the Company in this Annual Report on Form 10-K and elsewhere from time to time, representsmanagement's best judgment as of the date the information is given. The Company does not undertake responsibility for updating anyof such information, whether as a result of new information, future events, or otherwise, except as required by law. Investors areadvised, however, to consult any further public Company disclosures (such as in filings with the Securities and Exchange Commissionor in Company press releases) on related subjects.
65
Source: EASTMAN CHEMICAL CO, 10-K, March 01, 2007

ITEM 7A. QUANTITATIVE AND QUALITATIVE DISCLOSURES ABOUT MARKET RISK
The Company is exposed to changes in financial market conditions in the normal course of its business due to its use of certainfinancial instruments as well as transacting in various foreign currencies and funding foreign operations. To mitigate the Company'sexposure to these market risks, Eastman has established policies, procedures, and internal processes governing its management offinancial market risks and the use of financial instruments to manage its exposure to such risks.
The Company determines its market risk utilizing sensitivity analysis, which measures the potential losses in fair value resulting fromone or more selected hypothetical changes in interest rates, foreign currency exchange rates, and/or commodity prices.
The Company is exposed to changes in interest rates primarily as a result of its borrowing activities, which include long-termborrowings used to maintain liquidity and to fund its business operations and capital requirements. Currently, these borrowings arepredominately U.S. dollar denominated. The nature and amount of the Company's long-term and short-term debt may vary as a resultof future business requirements, market conditions, and other factors. For purposes of calculating the market risks associated with thefair value of interest-rate-sensitive instruments, the Company uses a one percent absolute shift in interest rates. For 2006 and 2005, themarket risks associated with the fair value of interest-rate-sensitive instruments, assuming an instantaneous absolute shift in interestrates of 1 percent were approximately $126 million and $134 million, respectively. This exposure is primarily related to long-termdebt with fixed interest rates.
The Company's operating cash flows and borrowings denominated in foreign currencies are exposed to changes in foreign currencyexchange rates. The Company continually evaluates its foreign currency exposure based on current market conditions and thelocations in which the Company conducts business. In order to mitigate the effect of foreign currency risk, the Company enters intocurrency options to hedge probable anticipated but not yet committed export sales and purchase transactions expected within no morethan five years and denominated in foreign currencies and forward exchange contracts to hedge certain firm commitmentsdenominated in foreign currencies. The gains and losses on these contracts offset changes in the value of related exposures. It is theCompany's policy to enter into foreign currency transactions only to the extent considered necessary to meet its objectives as statedabove. The Company does not enter into foreign currency transactions for speculative purposes. For 2006, the market risks associatedwith borrowings denominated in foreign currencies assuming a 10 percent adverse move in the U.S. dollar relative to each foreigncurrency was approximately $20 million and an additional $2.0 million for each additional one percentage point adverse change inforeign currency rates. Furthermore, since the Company utilizes currency-sensitive derivative instruments for hedging anticipatedforeign currency transactions, a loss in fair value for those instruments is generally offset by increases in the value of the underlyinganticipated transactions.
The Company is exposed to fluctuations in market prices for certain of its major raw materials and energy. To mitigate short-termfluctuations in market prices for certain commodities, principally propane and natural gas, the Company enters into forwards andoptions contracts. For 2006 and 2005, the market risks associated with forwards and options for feedstock and natural gas assuming aninstantaneous parallel shift in the underlying commodity price of 10 percent were $6 million and $2 million, respectively, and anadditional $0.5 million for each one percentage point move in closing prices thereafter for both periods.
66
Source: EASTMAN CHEMICAL CO, 10-K, March 01, 2007

ITEM 8. FINANCIAL STATEMENTS AND SUPPLEMENTARY DATA
ITEM Page Management's Responsibility for Financial Statements 68 Report of Independent Registered Public Accounting Firm 69 Consolidated Statements of Earnings, Comprehensive Income and Retained Earnings 71 Consolidated Statements of Financial Position 72 Consolidated Statements of Cash Flows 73 Notes to Consolidated Financial Statements
Note 1. Significant Accounting Policies 74Note 2. Inventories 80Note 3. Properties and Accumulated Depreciation 80Note 4. Goodwill and Other Intangible Assets 81Note 5. Equity Investments and Other Noncurrent Assets and Liabilities 81Note 6. Payables and Other Current Liabilities 82Note 7. Borrowings 82Note 8. Early Extinguishment of Debt 83Note 9. Fair Value of Financial Instruments 83Note 10. Retirement Plans 85Note 11. Commitments 92Note 12. Environmental Matters 94Note 13. Legal Matters 95Note 14. Stockholders' Equity 96Note 15. Share-Based Compensation Plans and Awards 98Note 16. Asset Impairments and Restructuring Charges, Net 103Note 17. Other Operating Income 106Note 18. Other (Income) Charges, Net 107Note 19. Income Taxes 107Note 20. Supplemental Cash Flow Information 110Note 21. Segment Information 110Note 22. Quarterly Sales and Earnings Data - Unaudited 114Note 23. Recently Issued Accounting Standards 115Note 24. Divestitures 116Note 25. Reserve Rollforward 117Note 26. Subsequent Events 118
67
Source: EASTMAN CHEMICAL CO, 10-K, March 01, 2007

MANAGEMENT'S RESPONSIBILITY FOR FINANCIAL STATEMENTS
Management is responsible for the preparation and integrity of the accompanying consolidated financial statements of Eastmanappearing on pages 71 through 118 Eastman has prepared these consolidated financial statements in accordance with accountingprinciples generally accepted in the United States, and the statements of necessity include some amounts that are based onmanagement's best estimates and judgments.
Eastman's accounting systems include extensive internal controls designed to provide reasonable assurance of the reliability of itsfinancial records and the proper safeguarding and use of its assets. Such controls are based on established policies and procedures, areimplemented by trained, skilled personnel with an appropriate segregation of duties, and are monitored through a comprehensiveinternal audit program. The Company's policies and procedures prescribe that the Company and all employees are to maintain thehighest ethical standards and that its business practices throughout the world are to be conducted in a manner that is above reproach.
The consolidated financial statements have been audited by PricewaterhouseCoopers LLP, an independent registered publicaccounting firm, who were responsible for conducting their audit in accordance with the standards of the Public Company AccountingOversight Board (United States). Their report is included herein.
The Board of Directors exercises its responsibility for these financial statements through its Audit Committee, which consists entirelyof non-management Board members. The independent registered public accounting firm and internal auditors have full and free accessto the Audit Committee. The Audit Committee meets periodically with PricewaterhouseCoopers LLP and Eastman's director ofinternal auditing, both privately and with management present, to discuss accounting, auditing, policies and procedures, internalcontrols, and financial reporting matters.
/s/ J. Brian Ferguson /s/ Richard A. LorraineJ. Brian Ferguson Richard A. Lorraine
Chairman of the Board and Senior Vice President andChief Executive Officer Chief Financial Officer
February 28, 2007
68
Source: EASTMAN CHEMICAL CO, 10-K, March 01, 2007

REPORT OF INDEPENDENT REGISTERED PUBLIC ACCOUNTING FIRM
To the Board of Directors and Stockholders ofEastman Chemical Company:
We have completed integrated audits of Eastman Chemical Company’s consolidated financial statements and of its internal controlover financial reporting as of December 31, 2006, in accordance with the standards of the Public Company Accounting OversightBoard (United States). Our opinions, based on our audits, are presented below.
Consolidated financial statements
In our opinion, the consolidated financial statements listed in the index appearing under Item 15(a)(1) present fairly, in all materialrespects, the financial position of Eastman Chemical Company and its subsidiaries at December 31, 2006 and 2005, and the results oftheir operations and their cash flows for each of the three years in the period ended December 31, 2006 in conformity with accountingprinciples generally accepted in the United States of America. These financial statements are the responsibility of the Company’smanagement. Our responsibility is to express an opinion on these financial statements based on our audits. We conducted our audits ofthese statements in accordance with the standards of the Public Company Accounting Oversight Board (United States). Thosestandards require that we plan and perform the audit to obtain reasonable assurance about whether the financial statements are free ofmaterial misstatement. An audit of financial statements includes examining, on a test basis, evidence supporting the amounts anddisclosures in the financial statements, assessing the accounting principles used and significant estimates made by management, andevaluating the overall financial statement presentation. We believe that our audits provide a reasonable basis for our opinion.
As discussed in Note 10 to the consolidated financial statements, the Company changed the manner in which it accounts fordefined-benefit pension and other postretirement plans as of December 31, 2006 and as discussed in Note 15 to the consolidatedfinancial statements, the Company changed the manner in which it accounts for share-based payment as of January 1, 2006.
Internal control over financial reporting
Also, in our opinion, management’s assessment, included in Management’s Report on Internal Control Over Financial Reportingappearing under Item 9A, that the Company maintained effective internal control over financial reporting as of December 31, 2006based on criteria established in Internal Control - Integrated Framework issued by the Committee of Sponsoring Organizations of theTreadway Commission (COSO), is fairly stated, in all material respects, based on those criteria. Furthermore, in our opinion, theCompany maintained, in all material respects, effective internal control over financial reporting as of December 31, 2006, based oncriteria established in Internal Control - Integrated Framework issued by the COSO. The Company’s management is responsible formaintaining effective internal control over financial reporting and for its assessment of the effectiveness of internal control overfinancial reporting. Our responsibility is to express opinions on management’s assessment and on the effectiveness of the Company’sinternal control over financial reporting based on our audit. We conducted our audit of internal control over financial reporting inaccordance with the standards of the Public Company Accounting Oversight Board (United States). Those standards require that weplan and perform the audit to obtain reasonable assurance about whether effective internal control over financial reporting wasmaintained in all material respects. An audit of internal control over financial reporting includes obtaining an understanding of internalcontrol over financial reporting, evaluating management’s assessment, testing and evaluating the design and operating effectiveness ofinternal control, and performing such other procedures as we consider necessary in the circumstances. We believe that our auditprovides a reasonable basis for our opinions.
69
Source: EASTMAN CHEMICAL CO, 10-K, March 01, 2007

A company’s internal control over financial reporting is a process designed to provide reasonable assurance regarding the reliability offinancial reporting and the preparation of financial statements for external purposes in accordance with generally accepted accountingprinciples. A company’s internal control over financial reporting includes those policies and procedures that (i) pertain to themaintenance of records that, in reasonable detail, accurately and fairly reflect the transactions and dispositions of the assets of thecompany; (ii) provide reasonable assurance that transactions are recorded as necessary to permit preparation of financial statements inaccordance with generally accepted accounting principles, and that receipts and expenditures of the company are being made only inaccordance with authorizations of management and directors of the company; and (iii) provide reasonable assurance regardingprevention or timely detection of unauthorized acquisition, use, or disposition of the company’s assets that could have a material effecton the financial statements.
Because of its inherent limitations, internal control over financial reporting may not prevent or detect misstatements. Also, projectionsof any evaluation of effectiveness to future periods are subject to the risk that controls may become inadequate because of changes inconditions, or that the degree of compliance with the policies or procedures may deteriorate.
/s/ PricewaterhouseCoopers LLP PricewaterhouseCoopers LLPPhiladelphia, PennsylvaniaFebruary 28, 2007
70
Source: EASTMAN CHEMICAL CO, 10-K, March 01, 2007

CONSOLIDATED STATEMENTS OF EARNINGS,COMPREHENSIVE INCOME and RETAINED EARNINGS
For years ended December 31,(Dollars in millions, except per share amounts) 2006 2005 2004 Sales $ 7,450 $ 7,059 $ 6,580Cost of sales 6,173 5,655 5,602Gross profit 1,277 1,404 978 Selling, general and administrative expenses 437 454 450Research and development expenses 167 162 154Asset impairments and restructuring charges, net 101 33 206Other operating income (68) (2) (7)Operating earnings 640 757 175 Interest expense, net 80 100 115Income from equity investment in Genencor -- (173) (14)Early debt extinguishment costs -- 46 --Other (income) charges, net (16) 1 10Earnings before income taxes 576 783 64Provision (benefit) for income taxes 167 226 (106)
Net earnings $ 409 $ 557 $ 170 Earnings per share
Basic $ 4.98 $ 6.90 $ 2.20
Diluted $ 4.91 $ 6.81 $ 2.18 Comprehensive Income Net earnings $ 409 $ 557 $ 170Other comprehensive income (loss)
Change in cumulative translation adjustment 60 (94) 36Change in pension liability, net of tax 48 (7) (6)Change in unrealized gains (losses) on derivative instruments, netof tax (1) 3 (12)Change in unrealized gains on investments, net of tax -- 1 --
Total other comprehensive income (loss) 107 (97) 18Comprehensive income $ 516 $ 460 $ 188 Retained Earnings Retained earnings at beginning of period $ 1,923 $ 1,509 $ 1,476Net earnings 409 557 170Cash dividends declared (146) (143) (137)Retained earnings at end of period $ 2,186 $ 1,923 $ 1,509
The accompanying notes are an integral part of these consolidated financial statements.
71
Source: EASTMAN CHEMICAL CO, 10-K, March 01, 2007

CONSOLIDATED STATEMENTS OF FINANCIAL POSITION
(Dollars in millions, except per share amounts) December 31,Assets 2006 2005Current assets
Cash and cash equivalents $ 939 $ 524Trade receivables, net of allowance of $16 and $20 682 575Miscellaneous receivables 72 81Inventories 682 671Other current assets 47 73Total current assets 2,422 1,924
Properties
Properties and equipment at cost 8,844 9,597Less: Accumulated depreciation 5,775 6,435
Net properties 3,069 3,162 Goodwill 314 312Other noncurrent assets 368 375Total assets $ 6,173 $ 5,773 Liabilities and Stockholders’ Equity Current liabilities
Payables and other current liabilities $ 1,056 $ 1,047Borrowings due within one year 3 4
Total current liabilities 1,059 1,051 Long-term borrowings 1,589 1,621Deferred income tax liabilities 269 317Post-employment obligations 1,084 1,017Other long-term liabilities 143 155
Total liabilities 4,144 4,161 Commitments and contingencies Stockholders’ equity
Common stock ($0.01 par value- 350,000,000 shares authorized; sharesissued - 91,579,294 and 89,566,115 at December 31, 2006 and 2005,respectively)
1 1Additional paid-in capital 448 320Retained earnings 2,186 1,923Accumulated other comprehensive loss (174) (200)
2,461 2,044Less: Treasury stock at cost (8,048,442 and 8,034,901 shares at
December 31, 2006 and 2005, respectively)
432 432 Total stockholders’ equity 2,029 1,612 Total liabilities and stockholders’ equity $ 6,173 $ 5,773
The accompanying notes are an integral part of these consolidated financial statements.
72
Source: EASTMAN CHEMICAL CO, 10-K, March 01, 2007

CONSOLIDATED STATEMENTS OF CASH FLOWS
For years ended December 31,(Dollars in millions) 2006 2005 2004 Cash flows from operating activities
Net earnings $ 409 $ 557 $ 170 Adjustments to reconcile net earnings to net cash provided by
operating activities:
Depreciation and amortization 308 304 322Asset impairments 62 12 140Gains on sale of assets (74) -- (8)Income from equity investment in Genencor -- (173) (14)Early debt extinguishment costs -- 46 --Provision (benefit) for deferred income taxes 7 115 (136)
Changes in operating assets and liabilities, net of effect ofacquisitions and divestitures:
(Increase) decrease in trade receivables (82) 60 (133)(Increase) decrease in inventories (99) (110) 18Increase (decrease) in trade payables 53 71 49Increase (decrease) in liabilities for employee benefits and
incentive pay
(44) (63) 71Other items, net 69 (50) 15
Net cash provided by operating activities 609 769 494
Cash flows from investing activities
Additions to properties and equipment (389) (343) (248)Proceeds from sale of assets 322 50 127Proceeds from sale of equity investment in Genencor, net -- 417 --Loan to joint venture -- (125) --Additions to capitalized software (16) (11) (14)Other items, net (11) (6) (13)
Net cash used in investing activities (94) (18) (148)
Cash flows from financing activities
Net decrease in commercial paper, credit facility, and otherborrowings
(50) (150) (19)
Proceeds from long-term borrowings -- 189 --Repayment of long-term borrowings -- (544) (500)Dividends paid to stockholders (144) (142) (137)Proceeds from stock option exercises and other items 93 100 77
Net cash used in financing activities (101) (547) (579)
Effect of exchange rate changes on cash and cash equivalents 1 (5) -- Net change in cash and cash equivalents 415 199 (233) Cash and cash equivalents at beginning of period 524 325 558 Cash and cash equivalents at end of period $ 939 $ 524 $ 325
The accompanying notes are an integral part of these consolidated financial statements.
74
Source: EASTMAN CHEMICAL CO, 10-K, March 01, 2007

NOTES TO THE AUDITED CONSOLIDATED FINANCIAL STATEMENTS
1. SIGNIFICANT ACCOUNTING POLICIES
Financial Statement Presentation
The consolidated financial statements of Eastman Chemical Company and subsidiaries ("Eastman" or the "Company") are prepared inconformity with accounting principles generally accepted in the United States and of necessity include some amounts that are basedupon management estimates and judgments. Future actual results could differ from such current estimates. The consolidated financialstatements include assets, liabilities, revenues, and expenses of all majority-owned subsidiaries and joint ventures. Eastman accountsfor other joint ventures and investments in minority-owned companies where it exercises significant influence on the equity basis.Intercompany transactions and balances are eliminated in consolidation.
Cash and Cash Equivalents
Cash and cash equivalents include cash, time deposits, and readily marketable securities with maturities of three months or less at thepurchase date.
Accounts Receivable and Allowance for Doubtful Accounts
Trade accounts receivable are recorded at the invoiced amount and do not bear interest. The Company maintains allowances fordoubtful accounts for estimated losses resulting from the inability of its customers to make required payments. The allowances arebased on the number of days an individual receivable is delinquent and management’s regular assessment of the financial condition ofthe Company’s customers. The Company considers that a receivable is delinquent if it is unpaid after the terms of the related invoicehave expired. The Company evaluates the allowance based on a monthly assessment of the aged receivables. Write-offs are recordedat the time a customer receivable is deemed uncollectible.
Inventories
Inventories are valued at the lower of cost or market. The Company determines the cost of most raw materials, work in process, andfinished goods inventories in the United States by the last-in, first-out ("LIFO") method. The cost of all other inventories, includinginventories outside the United States, is determined by the average cost method, which approximates the first-in, first-out ("FIFO")method. The Company writes-down its inventories for estimated obsolescence or unmarketable inventory equal to the differencebetween the carrying value of inventory and the estimated market value based upon assumptions about future demand and marketconditions.
Properties
The Company records properties at cost. Maintenance and repairs are charged to earnings; replacements and betterments arecapitalized. When Eastman retires or otherwise disposes of assets, it removes the cost of such assets and related accumulateddepreciation from the accounts. The Company records any profit or loss on retirement or other disposition in earnings. Assetimpairments are reflected as increases in accumulated depreciation.
Depreciation
Depreciation expense is calculated based on historical cost and the estimated useful lives of the assets (buildings and buildingequipment 20 to 50 years; machinery and equipment 3 to 33 years), generally using the straight-line method. Accelerated depreciationis reported when the estimated useful life is shortened and continues to be reported in Cost of Goods Sold.
74
Source: EASTMAN CHEMICAL CO, 10-K, March 01, 2007

NOTES TO THE AUDITED CONSOLIDATED FINANCIAL STATEMENTS
Computer Software Costs
Capitalized software costs are amortized primarily on a straight-line basis over three years, the expected useful life of such assets,beginning when the software project is substantially complete and placed in service. Capitalized software in 2006, 2005 and 2004 wasapproximately $17 million, $11 million, and $14 million, respectively. During those same periods, approximately $13 million, $16million, and $18 million, respectively, of previously capitalized costs were amortized. At December 31, 2006 and 2005, theunamortized capitalized software costs were $28 million and $24 million, respectively. Capitalized software costs are reflected inother noncurrent assets.
Impairment of Long Lived Assets
The Company evaluates the carrying value of long-lived assets, including definite-lived intangible assets, when events or changes incircumstances indicate that the carrying value may not be recoverable. Such events and circumstances include, but are not limited to,significant decreases in the market value of the asset, adverse change in the extent or manner in which the asset is being used,significant changes in business climate, or current or projected cash flow losses associated with the use of the assets. The carryingvalue of a long-lived asset is considered impaired when the total projected undiscounted cash flows from such asset is separatelyidentifiable and is less than its carrying value. In that event, a loss is recognized based on the amount by which the carrying valueexceeds the fair value of the long-lived asset. For long-lived assets to be held and used, fair value of fixed (tangible) assets anddefinite-lived intangible assets is determined primarily using either the projected cash flows discounted at a rate commensurate withthe risk involved or an appraisal. For long-lived assets to be disposed of by sale or other than by sale, fair value is determined in asimilar manner, except that fair values are reduced for disposal costs.
The provisions of Statement of Financial Accounting Standards ("SFAS") No. 142 "Goodwill and Other Intangible Assets," requirethat goodwill and indefinite-lived intangible assets be tested at least annually for impairment and require reporting units to beidentified for the purpose of assessing potential future impairments of goodwill. The carrying value of goodwill and indefinite livedintangibles is considered impaired when their fair value, as established by appraisal or based on undiscounted future cash flows ofcertain related products, is less than their carrying value. The Company conducts its annual testing of goodwill and indefinite-livedintangible assets for impairment in the third quarter of each year, unless events warrant more frequent testing.
Investments
The consolidated financial statements include the accounts in which the Company is a primary beneficiary of a variable interest entity,if applicable, or the accounts of the Company and all its subsidiaries in which a controlling interest is maintained. For thoseconsolidated subsidiaries in which the Company’s ownership is less than 100 percent, the interests of the other stockholders areincluded in other long-term liabilities.
Investments in affiliates over which the Company has significant influence but not a controlling interest are carried on the equitybasis. Under the equity method of accounting, these investments are included in other noncurrent assets. The Company includes itsshare of earnings and losses of such investments in other income and charges and its share of other comprehensive income (loss) in theappropriate component of other accumulated comprehensive income (loss) in stockholders’ equity.
Marketable securities held by the Company, currently common or preferred stock, are deemed by management to be available-for-saleand are reported at fair value, with net unrealized gains or losses reported as a component of other accumulated comprehensiveincome (loss) in stockholders' equity. Realized gains and losses are included in earnings and are derived using the specificidentification method for determining the cost of securities. The Company includes these investments in other noncurrent assets.
75
Source: EASTMAN CHEMICAL CO, 10-K, March 01, 2007

NOTES TO THE AUDITED CONSOLIDATED FINANCIAL STATEMENTS
Other equity investments, for which fair values are not readily determinable, are carried at historical cost and are included in othernoncurrent assets.
The Company records an investment impairment charge when it believes an investment, accounted for by the Company as amarketable security or recorded at historical cost, has experienced a decline in value that is other than temporary.
Pension and Other Post-employment Benefits
The Company maintains defined benefit plans that provide eligible employees with retirement benefits. Additionally, Eastmanprovides life insurance and health care benefits for eligible retirees and health care benefits for retirees’ eligible survivors. The costsand obligations related to these benefits reflect the Company’s assumptions related to general economic conditions (particularlyinterest rates), expected return on plan assets, rate of compensation increase for employees, and health care cost trends. The cost ofproviding plan benefits depends on demographic assumptions including retirements, mortality, turnover, and plan participation.
In September 2006, the Financial Accounting Standards Board ("FASB") issued SFAS No. 158, "Employer's Accounting for DefinedBenefit Pension and Other Postretirement Plans", which changes the accounting for pension and other postretirement benefit plans.This Standard was adopted by Eastman for the year ended December 31, 2006. For additional information, see Note 10, "RetirementPlans".
Environmental Costs
The Company accrues environmental remediation costs when it is probable that the Company has incurred a liability at acontaminated site and the amount can be reasonably estimated. When a single amount cannot be reasonably estimated but the cost canbe estimated within a range, the Company accrues the minimum amount. This undiscounted accrued amount reflects the Company’sassumptions about remediation requirements at the contaminated site, the nature of the remedy, the outcome of discussions withregulatory agencies and other potentially responsible parties at multi-party sites, and the number and financial viability of otherpotentially responsible parties. Changes in the estimates on which the accruals are based, unanticipated government enforcementaction, or changes in health, safety, environmental, and chemical control regulations and testing requirements could result in higher orlower costs.
The Company also establishes reserves for closure/postclosure costs associated with the environmental and other assets it maintains.Environmental assets include but are not limited to waste management units, such as landfills, water treatment facilities, and ashponds. When these types of assets are constructed or installed, a reserve is established for the future costs anticipated to be associatedwith the closure of the site based on an expected life of the environmental assets and the applicable regulatory closure requirements.These expenses are charged into earnings over the estimated useful life of the assets. Currently, the Company estimates the useful lifeof each individual asset up to 50 years. If the Company changes its estimate of the asset retirement obligation costs or its estimate ofthe useful lives of these assets, the expenses to be charged into earnings could increase or decrease.
In accordance with Interpretation No. 47, “Accounting for Conditional Asset Retirement Obligations” ("FIN 47"), the Company alsomonitors conditional obligations and will record reserves associated with them when and to the extent that more detailed informationbecomes available concerning applicable retirement costs.
76
Source: EASTMAN CHEMICAL CO, 10-K, March 01, 2007

NOTES TO THE AUDITED CONSOLIDATED FINANCIAL STATEMENTS
Accruals for environmental liabilities are included in other long-term liabilities and exclude claims for recoveries from insurancecompanies or other third parties. Environmental costs are capitalized if they extend the life of the related property, increase itscapacity, and/or mitigate or prevent future contamination. The cost of operating and maintaining environmental control facilities ischarged to expense.
The Company's cash expenditures related to environmental protection and improvement were estimated to be approximately $215million, $198 million and $184 million in 2006, 2005 and 2004, respectively. These amounts pertain primarily to operating costsassociated with environmental protection equipment and facilities, but also include expenditures for construction and development.The Company does not expect future environmental capital expenditures arising from requirements of recently promulgatedenvironmental laws and regulations to materially increase the Company's planned level of annual capital expenditures forenvironmental control facilities.
For additional information see Note 12, "Environmental Matters" and Note 25, "Reserve Rollforwards".
Derivative Financial Instruments
Derivative financial instruments are used by the Company in the management of its exposures to fluctuations in foreign currency, rawmaterials and energy costs, and interest rates. Such instruments are used to mitigate the risk that changes in exchange rates or rawmaterials and energy costs will adversely affect the eventual dollar cash flows resulting from the hedged transactions.
The Company enters into currency options forwards to hedge probable anticipated, but not yet probable committed, export sales andpurchase transactions expected within no more than five years and denominated in foreign currencies (principally the Euro, Britishpound, the Japanese yen and the Canadian dollar) and forward exchange contracts to hedge certain firm commitments denominated inforeign currencies. To mitigate short-term fluctuations in market prices for propane and natural gas (major raw materials and energyused in the manufacturing process), the Company enters into forwards and options contracts. From time to time, the Company alsoutilizes interest rate derivative instruments, primarily swaps, to hedge the Company's exposure to movements in interest rates.
The Company's qualifying forwards and options contracts are accounted for as hedges because the derivative instruments aredesignated and effective as hedges and reduce the Company's exposure to identified risks. Gains and losses resulting from effectivehedges of existing assets, liabilities, firm commitments, or anticipated transactions are deferred and recognized when the offsettinggains and losses are recognized on the related hedged items and are reported as a component of operating earnings.
Deferred currency option premiums are generally included in other assets. The related obligation for payment is generally included inother liabilities and is paid in the period in which the options are exercised or expire.
Litigation and Contingent Liabilities
The Company and its operations from time to time are parties to or targets of lawsuits, claims, investigations, and proceedings,including product liability, personal injury, asbestos, patent and intellectual property, commercial, contract, environmental, antitrust,health and safety, and employment matters, which are handled and defended in the ordinary course of business. The Company accruesa liability for such matters when it is probable that a liability has been incurred and the amount can be reasonably estimated. When asingle amount cannot be reasonably estimated but the cost can be estimated within a range, the Company accrues the minimumamount. The Company expenses legal costs, including those expected to be incurred in connection with a loss contingency, asincurred.
77
Source: EASTMAN CHEMICAL CO, 10-K, March 01, 2007

NOTES TO THE AUDITED CONSOLIDATED FINANCIAL STATEMENTS
Revenue Recognition and Customer Incentives
The Company recognizes revenue when persuasive evidence of an arrangement exists, delivery has occurred or services have beenrendered, the price to the customer is fixed or determinable, and collectability is reasonably assured.
The Company records estimated obligations for customer programs and incentive offerings, which consist primarily of revenue orvolume-based amounts that a customer must achieve over a specified period of time, as a reduction of revenue to each underlyingrevenue transaction as the customer progresses toward reaching goals specified in incentive agreements. These estimates are based ona combination of forecast of customer sales and actual sales volumes and revenues against established goals, the customer’s currentlevel of purchases, and Eastman’s knowledge of customer purchasing habits, and industry pricing practice. The incentive payment ratemay be variable, based upon the customer reaching higher sales volume or revenue levels over a specified period of time in order toreceive an agreed upon incentive payment.
Shipping and Handling Fees and Costs
Shipping and handling fees related to sales transactions are billed to customers and are recorded as sales revenue. Shipping andhandling costs incurred are recorded in cost of sales.
Restructuring of Operations
The Company records restructuring charges incurred in connection with consolidation of operations, exited business lines, orshutdowns of specific sites that are expected to be substantially completed within a reasonable amount of time.
Share-based Compensation
Effective January 1, 2006, the Company implemented SFAS No. 123(Revised 2004), "Share-Based Payment" ("SFAS No. 123(R)")and related interpretations and began recognizing compensation expense in the financial statements for stock options based upon thegrant-date fair value over the substantive vesting period. Prior to January 1, 2006, the Company applied Accounting Principles Board("APB") Opinion No. 25, "Accounting for Stock Issued to Employees" and related interpretations, as permitted under SFAS No. 123,"Accounting for Stock-Based Compensation." Under APB Opinion No. 25, no compensation expense was recognized in the financialstatements for employee stock options granted at an exercise price equal to the market value of the underlying common stock at thedate of grant. For additional information, see Note 15, "Share-Based Compensation Plans."
78
Source: EASTMAN CHEMICAL CO, 10-K, March 01, 2007
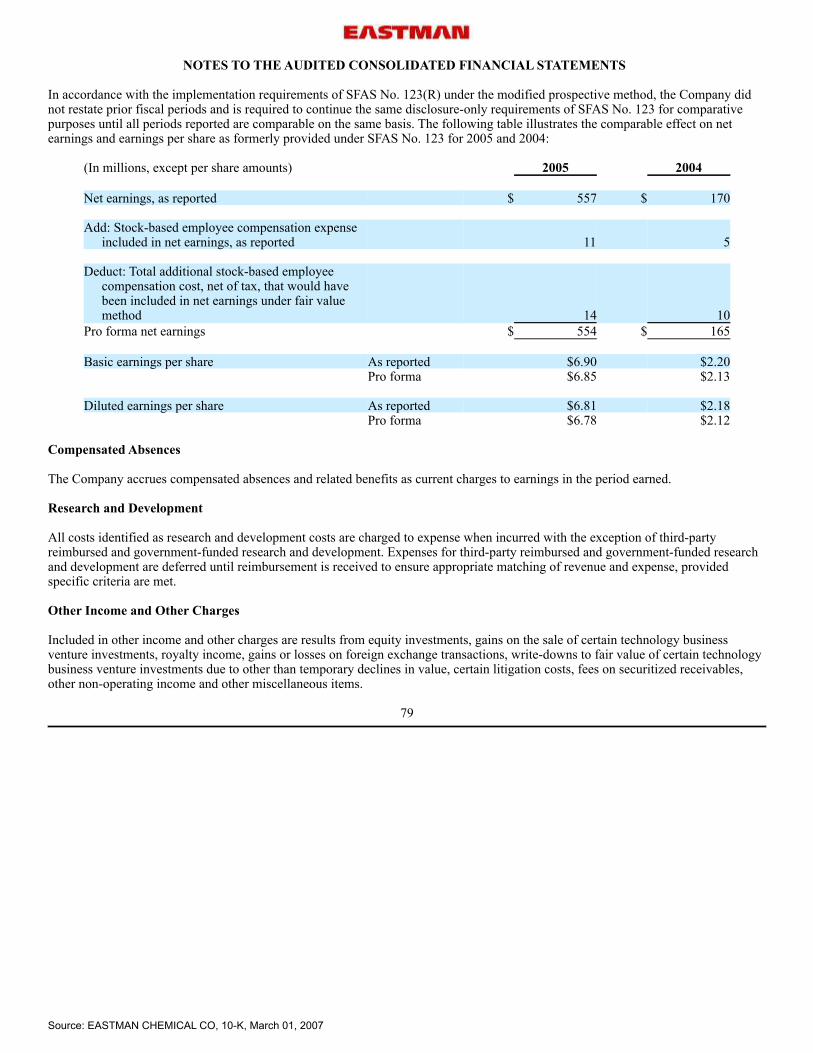
NOTES TO THE AUDITED CONSOLIDATED FINANCIAL STATEMENTS
In accordance with the implementation requirements of SFAS No. 123(R) under the modified prospective method, the Company didnot restate prior fiscal periods and is required to continue the same disclosure-only requirements of SFAS No. 123 for comparativepurposes until all periods reported are comparable on the same basis. The following table illustrates the comparable effect on netearnings and earnings per share as formerly provided under SFAS No. 123 for 2005 and 2004:
(In millions, except per share amounts) 2005 2004 Net earnings, as reported $ 557 $ 170 Add: Stock-based employee compensation expense
included in net earnings, as reported
11 5 Deduct: Total additional stock-based employee
compensation cost, net of tax, that would havebeen included in net earnings under fair valuemethod
14 10Pro forma net earnings $ 554 $ 165 Basic earnings per share As reported $6.90 $2.20 Pro forma $6.85 $2.13 Diluted earnings per share As reported $6.81 $2.18 Pro forma $6.78 $2.12
Compensated Absences
The Company accrues compensated absences and related benefits as current charges to earnings in the period earned.
Research and Development
All costs identified as research and development costs are charged to expense when incurred with the exception of third-partyreimbursed and government-funded research and development. Expenses for third-party reimbursed and government-funded researchand development are deferred until reimbursement is received to ensure appropriate matching of revenue and expense, providedspecific criteria are met.
Other Income and Other Charges
Included in other income and other charges are results from equity investments, gains on the sale of certain technology businessventure investments, royalty income, gains or losses on foreign exchange transactions, write-downs to fair value of certain technologybusiness venture investments due to other than temporary declines in value, certain litigation costs, fees on securitized receivables,other non-operating income and other miscellaneous items.
79
Source: EASTMAN CHEMICAL CO, 10-K, March 01, 2007

NOTES TO THE AUDITED CONSOLIDATED FINANCIAL STATEMENTS
Income Taxes
The provision for income taxes has been determined using the asset and liability approach of accounting for income taxes. Under thisapproach, deferred taxes represent the future tax consequences expected to occur when the reported amounts of assets and liabilitiesare recovered or paid. The provision for income taxes represents income taxes paid or payable for the current year plus the change indeferred taxes during the year. Deferred taxes result from differences between the financial and tax bases of the Company’s assets andliabilities and are adjusted for changes in tax rates and tax laws when changes are enacted. Valuation allowances are recorded toreduce deferred tax assets when it is more likely than not that a tax benefit will not be realized. Provision has been made for incometaxes on unremitted earnings of subsidiaries and affiliates, except for subsidiaries in which earnings are deemed to be permanentlyreinvested.
Reclassifications
The Company has retrospectively applied certain 2005 and 2004 amounts to conform to the 2006 presentation. For additionalinformation, see Note 21, "Segment Information."
2. INVENTORIES
December 31,(Dollars in millions) 2006 2005 At FIFO or average cost (approximates current cost)
Finished goods $ 660 $ 664Work in process 206 207Raw materials and supplies 280 247
Total inventories 1,146 1,118LIFO Reserve (464) (447)
Total inventories $ 682 $ 671
Inventories valued on the LIFO method were approximately 65 percent of total inventories in each of the periods.
3. PROPERTIES AND ACCUMULATED DEPRECIATION
December 31,(Dollars in millions) 2006 2005Properties
Land $ 42 $ 42Buildings and building equipment 824 861Machinery and equipment 7,819 8,495Construction in progress 159 199
Properties and equipment at cost $ 8,844 $ 9,597Less: Accumulated depreciation 5,775 6,435 Net properties $ 3,069 $ 3,162
Cumulative construction-period interest of $311 million and $352 million, reduced by accumulated depreciation of $294 million and$287 million, is included in cost of properties at December 31, 2006 and 2005, respectively.
Interest capitalized during 2006, 2005 and 2004 was $7 million, $5 million, and $3 million, respectively.
80
Source: EASTMAN CHEMICAL CO, 10-K, March 01, 2007

NOTES TO THE AUDITED CONSOLIDATED FINANCIAL STATEMENTS
Depreciation expense was $294 million, $287 million, and $302 million for 2006, 2005 and 2004, respectively. The year 2006included $10 million of accelerated depreciation related to previously disclosed restructuring decisions in association with crackingunits in Longview, Texas, and higher cost polyethylene terephthalate ("PET") polymer intermediates assets in Columbia, SouthCarolina, which are scheduled for shutdown.
Deductions in 2006 include the sale of certain product lines and related assets in the Performance Chemicals and Intermediates("PCI"), the Performance Polymers and the Coatings, Adhesives, Specialty Polymers, and Inks ("CASPI") segments.
4. GOODWILL AND OTHER INTANGIBLE ASSETS
Intangible assets include developed technology, customer lists, patents and patent licenses, and trademarks with a net book value of$17 million in 2006 and $23 million in 2005. During 2006, the Company recorded approximately $6 million in intangible assetimpairments related to patents associated with abandoned businesses. Other intangible assets are included in other noncurrent assetson the balance sheet.
Changes in the carrying amount of goodwill follow:
(Dollars in millions)
CASPI
Segment Other
Segments
TotalEastmanChemical
Reported balance at December 31, 2004 $ 308 $ 6 $ 314
Currency translation adjustments (2) -- (2)Reported balance at December 31, 2005 306 6 312
Currency translation adjustments 2 -- 2Reported balance at December 31, 2006 $ 308 $ 6 $ 314
5. EQUITY INVESTMENTS AND OTHER NONCURRENT ASSETS AND LIABILTIES
Eastman has a 50 percent interest in and serves as the operating partner in Primester, a joint venture which manufactures celluloseacetate at Eastman's Kingsport, Tennessee plant. This investment is accounted for under the equity method. During fourth quarter2005, the Company provided a line of credit to the joint venture of up to $125 million, which Primester fully utilized to repay theprincipal amount of the joint venture's third-party borrowings, previously guaranteed by Eastman. The Company holds aninterest-bearing note receivable. Eastman's investment in the joint venture at December 31, 2006 and December 31, 2005 wasapproximately $87 million and $86 million, respectively, which was comprised of the recognized portion of the venture's accumulateddeficits and the line of credit of $125 million. Such amount was included in other noncurrent assets.
Eastman also owns a 50 percent interest in Nanjing Yangzi Eastman Chemical Ltd. (“Nanjing”), a company which manufacturesEastotac hydrocarbon tackifying resins for the adhesives market. This joint venture is accounted for under the equity method and isincluded in other noncurrent assets. At December 31, 2006 and 2005, the Company’s investment in Nanjing was approximately $5million.
On April 21, 2005, the Company completed the sale of its equity investment in Genencor International, Inc. ("Genencor") for cashproceeds of approximately $417 million, net of $2 million in fees. The book value of the investment prior to sale was $246 million,and the Company recorded a pre-tax gain on the sale of $171 million.
81
Source: EASTMAN CHEMICAL CO, 10-K, March 01, 2007

NOTES TO THE AUDITED CONSOLIDATED FINANCIAL STATEMENTS
6. PAYABLES AND OTHER CURRENT LIABILITIES
December 31,(Dollars in millions) 2006 2005 Trade creditors $ 581 $ 534A c c r u e d p a y r o l l s , v a c a t i o n , a n dvariable-incentive compensation 126 154Accrued taxes 59 49Post-employment obligations 63 134Interest payable 31 31Bank overdrafts 11 10Other 185 135
Total $ 1,056 $ 1,047
The current portion of post-employment obligations is an estimate of current year payments in excess of plan assets. 7. BORROWINGS
December 31,(Dollars in millions) 2006 2005 Borrowings consisted of:
3 1/4% notes due 2008 $ 72 $ 726.30% notes due 2018 182 1857% notes due 2012 141 1427 1/4% debentures due 2024 497 4977 5/8% debentures due 2024 200 2007.60% debentures due 2027 297 297Credit facility borrowings 185 214Other 18 18
Total borrowings 1,592 1,625Borrowings due within one year (3) (4)Long-term borrowings $ 1,589 $ 1,621
At December 31, 2006, the Company had credit facilities with various U.S. and foreign banks totaling approximately $885 million.These credit facilities consist of a $700 million revolving credit facility (the "Credit Facility") expiring in April 2011, as well as a 140million Euro credit facility ("Euro Facility") which expires in December 2011. Both credit facilities have options for two one-yearextensions, and the first extension option for the Euro Facility has been exercised. Borrowings under these credit facilities are subjectto interest at varying spreads above quoted market rates. These credit facilities require facility fees on the total commitment that arebased on Eastman’s credit rating. In addition, these credit facilities contain a number of covenants and events of default, including themaintenance of certain financial ratios. At December 31, 2006, the Company’s credit facility borrowings totaled $185 million at aneffective interest rate of 4.00 percent. At December 31, 2005, the Company's credit facility borrowings were $214 million at aweighted-average interest rate of 3.01 percent. The Credit Facility provides liquidity support for commercial paper borrowings and general corporate purposes. Accordingly, anyoutstanding commercial paper borrowings reduce borrowings available under the Credit Facility. Since the Credit Facility expires inApril 2011, any commercial paper borrowings supported by the Credit Facility are classified as long-term borrowings because theCompany has the ability to refinance such borrowings on a long-term basis.
82
Source: EASTMAN CHEMICAL CO, 10-K, March 01, 2007

NOTES TO THE AUDITED CONSOLIDATED FINANCIAL STATEMENTS
At December 31, 2006 and December 31, 2005, the Company had outstanding interest rate swaps associated with the entireoutstanding principle of the 7% notes due in 2012 and $150 million of the outstanding principle of the 6.30% notes due in 2018 toconvert the notes from fixed rate to variable rate borrowings. The average variable interest rate on the 7% notes was 7.89 percent and7.22 percent for December 31, 2006 and December 31, 2005, respectively. The average variable interest rate on the 6.30% notes was6.30 percent and 5.63 percent for December 31, 2006 and December 31, 2005, respectively.
8. EARLY EXTINGUISHMENT OF DEBT
In the second quarter 2005, the Company completed the early repayment of $500 million of its outstanding long-term bonds for $544million in cash, which resulted in a charge of $46 million for early debt extinguishment costs including $2 million in unamortizedbond issuance costs. The book value of the purchased debt was $500 million, as follows:
(Dollars in millions) Book Value 3 1/4% notes due 2008 $ 1786.30% notes due 2018 687% notes due 2012 254
Total $ 500
9. FAIR VALUE OF FINANCIAL INSTRUMENTS
December 31, 2006 December 31, 2005
(Dollars in millions) Recorded
Amount Fair Value Recorded
Amount Fair Value
Long-term borrowings $ 1,589 $ 1,715 $ 1,621 $ 1,770
The fair value for fixed-rate borrowings is based on current interest rates for comparable securities. The Company's floating-rateborrowings approximate fair value.
Hedging Programs
Financial instruments held as part of the hedging programs discussed below are recorded at fair value based upon comparable markettransactions as quoted by the broker. The Company is exposed to market risk, such as changes in currency exchange rates, raw material and energy costs and interest rates.The Company uses various derivative financial instruments pursuant to the Company's hedging policies to mitigate these market riskfactors and their effect on the cash flows of the underlying transactions. Designation is performed on a specific exposure basis tosupport hedge accounting. The changes in fair value of these hedging instruments are offset in part or in whole by correspondingchanges in the cash flows of the underlying exposures being hedged. The Company does not hold or issue derivative financialinstruments for trading purposes.
83
Source: EASTMAN CHEMICAL CO, 10-K, March 01, 2007
NOTES TO THE AUDITED CONSOLIDATED FINANCIAL STATEMENTS
Currency Rate Hedging The Company manufactures and sells its products in a number of countries throughout the world and, as a result, is exposed tomovements in foreign currency exchange rates. To manage the volatility relating to these exposures, the Company nets the exposureson a consolidated basis to take advantage of natural offsets. To manage the remaining exposure, the Company enters into currencyoptions forwards to hedge probable anticipated, but not yet probable committed, export sales and purchase transactions expectedwithin no more than five years and denominated in foreign currencies (principally the Euro, British pound, the Japanese yen and theCanadian dollar) and forward exchange contracts to hedge certain firm commitments denominated in foreign currencies. Thesecontracts are designated as cash flow hedges. The mark-to-market gains or losses on qualifying hedges are included in accumulatedother comprehensive income (loss) to the extent effective, and reclassified into sales in the period during which the hedged transactionaffects earnings.
Raw Material and Energy Hedging
Raw materials and energy sources used by the Company are subject to price volatility caused by weather, supply conditions, economicvariables and other unpredictable factors. To mitigate short-term fluctuations in market prices for propane and natural gas, theCompany enters into forwards and options contracts. These contracts are designated as cash flow hedges. The mark-to-market gains orlosses on qualifying hedges are included in accumulated other comprehensive income (loss) to the extent effective, and reclassifiedinto cost of sales in the period during which the hedged transaction affects earnings.
Interest Rate Hedging The Company's policy is to manage interest cost using a mix of fixed and variable rate debt. To manage this mix in a cost-efficientmanner, the Company enters into interest rate swaps in which the Company agrees to exchange the difference between fixed andvariable interest amounts calculated by reference to an agreed upon notional principal amount. These swaps are designated to hedgethe fair value of underlying debt obligations with the interest rate differential reflected as an adjustment to interest expense over thelife of the swaps. As these instruments are 100 percent effective, there is no impact on earnings due to hedge ineffectiveness.
From time to time, the Company also utilizes interest rate derivative instruments, primarily swaps, to hedge the Company’s exposureto movements in interest rates on anticipated debt offerings. These instruments are designated as cash flow hedges and are typically100 percent effective. As a result, there is no current impact on earnings due to hedge ineffectiveness. The mark-to-market gains orlosses on these hedges are included in accumulated other comprehensive income (loss) to the extent effective, and are reclassified intointerest expense over the period of the related debt instruments.
At December 31, 2006, mark-to-market losses from raw material, currency, energy and certain interest rate hedges that were includedin accumulated other comprehensive income (loss) totaled approximately $7 million. If realized, substantially all of these losses willbe reclassified into earnings during the next 12 months. The mark-to-market gains or losses on non-qualifying, excluded andineffective portions of hedges are immediately recognized in cost of sales or other income and charges. Such amounts had a negative$1 million impact on earnings during 2006. At December 31, 2005, mark-to-market losses from raw material, currency, energy and certain interest rate hedges that were includedin accumulated other comprehensive income (loss) totaled approximately $5 million. If realized, substantially all of these losses willbe reclassified into earnings during the next 12 months. The mark-to-market gains or losses on non-qualifying, excluded andineffective portions of hedges are immediately recognized in cost of sales or other income and charges. Such amounts had a negative$6 million impact on earnings during 2005.
84
Source: EASTMAN CHEMICAL CO, 10-K, March 01, 2007

NOTES TO THE AUDITED CONSOLIDATED FINANCIAL STATEMENTS
10. RETIREMENT PLANS
Eastman maintains defined benefit plans that provide eligible employees with retirement benefits. Prior to 2000, benefits werecalculated using a defined benefit formula based on age, years of service, and the employee’s final average compensation as defined inthe plans. Effective January 1, 2000, the Company's U.S. defined benefit pension plan, the Eastman Retirement Assistance Plan, wasamended. Employees' accrued pension benefits earned prior to January 1, 2000 are calculated based on previous plan provisions usingthe employee's age, years of service and final average compensation as defined in the plans. The amended defined benefit pension planuses a pension equity formula based on age, years of service and final average compensation to calculate an employee's retirementbenefits from January 1, 2000 forward. Benefits payable will be the combined pre-2000 and post-1999 benefits.
Benefits are paid to employees from trust funds. Contributions to the plan are made as permitted by laws and regulations. The pensiontrust fund does not directly own any of the Company’s common stock.
Pension coverage for employees of Eastman's international operations is provided, to the extent deemed appropriate, through separateplans. The Company systematically provides for obligations under such plans by depositing funds with trustees, under insurancepolicies or by book reserves.
Eastman has adopted the provisions of SFAS No. 158, "Employers' Accounting for Defined Benefit Pension and Other PostretirementPlans, an amendment of FASB Statement No. 87, 88, 106, and 132 (R)" ("SFAS No. 158"), as of December 31, 2006. The table belowsummarizes the incremental effects of SFAS No. 158 adoption on the individual line items in the Statement of Financial Position atDecember 31, 2006 for defined benefit retirement plans.
December 31, 2006
(Dollars in millions)
Pre-SFASNo. 158
Adjustment toinitially apply FAS
158
Post SFAS
No. 158 Adjustment Intangible Asset 21 (21) --Deferred tax asset 119 42 161Accrued pension liability (241) (105) (346)Accumulated OtherComprehensive Loss, netof tax
(207) (84) (291)
Below is a summary balance sheet of the change in plan assets during 2006 and 2005, the funded status of the plans, amountsrecognized in the Statements of Financial Position, and a summary of benefit costs.
85
Source: EASTMAN CHEMICAL CO, 10-K, March 01, 2007

NOTES TO THE AUDITED CONSOLIDATED FINANCIAL STATEMENTS
The assumptions used to develop the projected benefit obligation for the Company's significant defined benefit pension plans are alsoprovided in the following tables.
Summary Balance Sheet (Dollars in millions) 2006 2005 Change in projected benefit obligation: Benefit obligation, beginning of year $ 1,477 $ 1,382Service cost 44 43Interest cost 82 80Actuarial loss 12 77Plan amendments and other 71 7Effect of currency exchange 26 (23)Benefits paid (119) (89)Benefit obligation, end of year $ 1,593 $ 1,477 Change in plan assets: Fair value of plan assets, beginning of year $ 1,054 $ 878Actual return on plan assets 162 100Plan amendments and other 46 --Effect of currency exchange 17 (14)Company contributions 87 177Benefits paid (119) (87)Fair value of plan assets, end of year $ 1,247 $ 1,054 Funded Status at end of year $ (346) $ (423)Unrecognized actuarial loss 555Unrecognized prior service credit (46)Net amount recognized, end of year $ 86 Amounts recognized in the Statements of Financial Position consist of: Current liability $ (3) $ Noncurrent liability (343) Prepaid benefit cost 105Intangible assets 15Accrued benefit cost (19)Additional minimum liability (417)Accumulated other comprehensive loss 402Net amount recognized, end of year $ (346) $ 86
Amounts recognized in accumulated other comprehensive incomeconsist of:
Net actuarial loss (gain) $ 462 Prior service costs (credit) (10) Accumulated other comprehensive loss $ 452
The accumulated benefit obligation basis at the end of 2006 and 2005 was $1,489 million and $1,388 million, respectively.
86
Source: EASTMAN CHEMICAL CO, 10-K, March 01, 2007

NOTES TO THE AUDITED CONSOLIDATED FINANCIAL STATEMENTS
A summary of the components of net periodic benefit cost recognized for Eastman's significant defined benefit pension plans follows:
Summary of Benefit Costs and Other Amounts Recognizedin Other Comprehensive Income
(Dollars in millions) 2006 2005 2004 Components of net periodic benefit cost: Service cost $ 44 $ 43 $ 41Interest cost 82 80 82Expected return on assets (88) (79) (82)Curtailment charge -- -- 2Amortization of: Prior service credit (10) (9) (10)Actuarial loss 39 36 27Net periodic benefit cost $ 67 $ 71 $ 60 Other changes in plan assets and benefit obligationsrecognized in other comprehensive income
Actuarial loss $ 39 $ 36 $ 27Prior service credit (10) (10) (10)Total $ 29 $ 26 $ 17
2006 2005 2004 Weighted-average assumptions used to determine benefit
obligations for years ended December 31:
Discount rate 5.66% 5.51% 5.67%Expected return on assets 8.53% 8.59% 8.65%Rate of compensation increase 3.78% 3.75% 3.78%
Weighted-average assumptions used to determine net periodic
pension cost for years ended December 31:
Discount rate 5.51% 5.67% 6.18%Expected return on assets 8.59% 8.65% 8.88%Rate of compensation increase 3.75% 3.78% 3.77%
The fair value of plan assets for domestic plans at December 31, 2006 and 2005 was $1,052 million and $939 million, respectively,while the fair value of plan assets at December 31, 2006 and 2005 for non-U.S. plans was $195 million and $115 million, respectively.At December 31, 2006 and 2005, the expected long-term rate of return on the U.S. plan assets was 9 percent, while the expectedlong-term rate of return on non-U.S. plan assets was 5.24 percent and 5.75 percent at December 31, 2006 and 2005, respectively. Thetarget allocation for the Company’s U.S. pension plan for 2007 and the asset allocation at December 31, 2006 and 2005, by assetcategory, is as follows:
87
Source: EASTMAN CHEMICAL CO, 10-K, March 01, 2007

NOTES TO THE AUDITED CONSOLIDATED FINANCIAL STATEMENTS
Target Allocation for
2007Plan Assets at December
31, 2006Plan Assets at December
31, 2005Asset category Equity securities 69% 75% 78%Debt securities 10% 8% 9%Real estate 5% 5% 3%Other investments 16% 12% 10%
Total 100% 100% 100%
The asset allocation for the Company’s non-U.S. pension plans at December 31, 2006 and 2005, and the target allocation for 2007, byasset category, is as follows:
Target Allocation for
2007Plan Assets at December
31, 2006Plan Assets at December
31, 2005Asset category Equity securities 24% 24% 49%Debt securities 37% 37% 45%Real estate -- -- 5%Other investments 39% 39% 1%
Total 100% 100% 100%
The Company’s investment strategy for its defined benefit pension plans is to maximize long-term rate of return on plan assets withinan acceptable level of risk in order to minimize the cost of providing pension benefits. The investment policy establishes a targetallocation range for each asset class and the fund is managed within those ranges. The plans use a number of investment approachesincluding equity, real estate, and fixed income funds in which the underlying securities are marketable in order to achieve this targetallocation. The U.S. plan also invests in private equity and other funds.
The expected rate of return was determined by modeling the expected long-term rates of return for broad categories of investmentsheld by the plan against a number of various potential economic scenarios.
The Company funded its U.S. defined benefit plan for 2007 by $100 million in January 2007.
Benefits expected to be paid from pension plans are as follows:
(Dollars in millions) 2007 2008 2009 2010 2011 2012-2016US plan $90 $96 $96 $99 $103 $627International plans $6 $6 $6 $6 $6 $35
In July 2006, the Company announced plans to change the U.S. defined benefit plans such that employees hired on or after January 1,2007 will not be eligible for those plans. This change will not impact net periodic benefit cost in 2006 and will begin to impact thefinancial statements in first quarter 2007.
88
Source: EASTMAN CHEMICAL CO, 10-K, March 01, 2007

NOTES TO THE AUDITED CONSOLIDATED FINANCIAL STATEMENTS
DEFINED CONTRIBUTION PLANS
The Company sponsors a defined contribution employee stock ownership plan (the "ESOP"), a qualified plan under Section 401(a) ofthe Internal Revenue Code, which is a component of the Eastman Investment Plan and Employee Stock Ownership Plan("EIP/ESOP"). Eastman anticipates that it will make annual contributions for substantially all U.S. employees equal to 5 percent ofeligible compensation to the ESOP, or for employees who have five or more prior ESOP contributions, to either the Eastman StockFund or other investment funds within the EIP. Employees may diversify to other investment funds within the EIP from the ESOP atany time without restrictions. Allocated shares in the ESOP totaled 1,721,199; 1,980,906; and 2,210,590 shares as of December 31,2006, 2005 and 2004, respectively. Dividends on shares held by the EIP/ESOP are charged to retained earnings. All shares held by theEIP/ESOP are treated as outstanding in computing earnings per share.
In July 2006, the Company amended its EIP/ESOP to provide a company match of 50 percent of the first 7 percent of an employee'scompensation contributed to the plan for employees who are hired on or after January 1, 2007. Employees who are hired on or afterJanuary 1, 2007, will also be eligible for the 5 percent contribution to the ESOP as described above.
Charges for domestic contributions to the EIP/ESOP were $35 million, $33 million, and $34 million for 2006, 2005 and 2004,respectively.
POSTRETIREMENT WELFARE PLANS
Eastman provides life insurance and health care benefits for eligible retirees, and health care benefits for retirees' eligible survivors. Ingeneral, Eastman provides those benefits to retirees eligible under the Company's U.S. pension plans. Similar benefits are alsoprovided to retirees of Holston Defense Corporation (“HDC”), a wholly-owned subsidiary of the Company that, prior to January 1,1999, operated a government-owned ammunitions plant. HDC’s contract with the Department of Army (“DOA”) provided forreimbursement of allowable costs incurred by HDC including certain postretirement welfare costs, for as long as HDC operated theplant. After the contract was terminated at the end of 1998, the Army did not contribute further to these costs. The Company pursuedextraordinary relief from the DOA and was granted an award effective in the fourth quarter in the amount of $95 million. This awardwas for reimbursement of the described costs and other previously expensed post-retirement benefit costs. The Company beganrecognizing the impact of the reimbursement in fourth quarter 2006 by recording an unrecognized gain and amortizing the gain intoearnings over a period of time. Included in 2006 other income is a $12 million gain reflecting a portion of the unrecognized gainresulting from the award.
Eastman has adopted the provisions of SFAS No. 158 as of December 31, 2006 for its postretirement welfare plans with theimplementation having an immaterial impact.
89
Source: EASTMAN CHEMICAL CO, 10-K, March 01, 2007

NOTES TO THE AUDITED CONSOLIDATED FINANCIAL STATEMENTS
A few of the Company's non-U.S. operations have supplemental health benefit plans for certain retirees, the cost of which is notsignificant to the Company.
Below is a summary balance sheet of the change in plan assets during 2006 and 2005, the funded status of the plans, amountsrecognized in the Statements of Financial Position, and a summary of benefit costs.
Summary Balance Sheet (Dollars in millions) 2006 2005 Change in benefit obligation: Benefit obligation, beginning of year $ 779 $ 795
Service cost 8 8Interest cost 41 43Plan participants’ contributions 18 12Actuarial (gain) loss (57) (23)Benefits paid (58) (56)
Benefit obligation, end of year $ 731 $ 779 Change in plan assets: Fair value of plan assets, beginning of year $ 6 $ 13
Actual return on plan assets 1 --Company contributions 34 37Third party contributions 95 --Reserve for third party contributions (39) --Plan participants’ contributions 18 12Benefits paid (58) (56)
Fair value of plan assets, end of year $ 57 $ 6 Funded status $ (674) $ (773)
Unrecognized actuarial loss 325Unrecognized prior service credit (235)
Funded status at end of year $ (683) Amounts recognized in the Statements of Financial Position consistof:
Current liabilities $ (38) $ (34)Non-current liabilities (636) (649)Net amount recognized, end of year $ (674) $ (683) Amounts recognized in accumulated other comprehensive income Actuarial (gain) loss $ 206 Prior service (credit) cost (211) Accumulated other comprehensive income $ (5)
90
Source: EASTMAN CHEMICAL CO, 10-K, March 01, 2007

NOTES TO THE AUDITED CONSOLIDATED FINANCIAL STATEMENTS
The net periodic postretirement benefit cost follows:
Summary of Benefit Costs (Dollars in millions) 2006 2005 2004 Components of net periodic benefit cost: Service cost $ 8 $ 8 $ 7Interest cost 41 43 52Expected return on assets -- -- (1)Curtailment gain -- -- (3)Other (12) -- --Amortization of:
Prior service credit (22) (23) (15)Actuarial loss 15 20 17
Net periodic benefit cost $ 30 $ 48 $ 57
Weighted-average assumptions used to determine end of yearbenefit obligations: 2006 2005 2004 Discount rate 5.86% 5.62% 5.75%Rate of compensation increase 3.75% 3.75% 3.75%Health care cost trend
Initial 9.00% 8.00% 9.00%Decreasing to ultimate trend of 5.00% 5.00% 5.00%
in year 2011 2009 2009
Weighted-average assumptions used to determine end of yearnet benefit cost: 2006 2005 2004 Discount rate 5.62% 5.75% 6.25%Rate of compensation increase 3.75% 3.75% 3.75%Health care cost trend
Initial 8.00% 9.00% 10.00%Decreasing to ultimate trend of 5.00% 5.00% 5.00%
in year 2009 2009 2009
Benefits expected to be paid for post-employment obligations are as follows:
(Dollars in millions) 2007 2008 2009 2010 2011 2012-2016
U.S plans $43 $43 $43 $43 $44 $236
A 9 percent rate of increase in per capita cost of covered health care benefits is assumed for 2007. The rate is assumed to decreasegradually to 5 percent for 2011 and remain at that level thereafter. A 1 percent increase or decrease in health care trend would havehad no material impact on the 2006 service and interest costs or the 2006 benefit obligation, because the Company's contributions forbenefits are fixed.
91
Source: EASTMAN CHEMICAL CO, 10-K, March 01, 2007

NOTES TO THE AUDITED CONSOLIDATED FINANCIAL STATEMENTS
During the second quarter 2004, the Company announced an amendment to its U.S. health and dental benefit plans such that futurehealth and dental benefits to certain retirees will be fixed at a certain contribution amount, not to be increased. As a result, theCompany remeasured these plans as of June 1, 2004 resulting in a reduction of the Company’s benefit obligation by approximately$240 million. The discount rate used at the time of the remeasurement was adjusted from 6.25 percent at December 31, 2003 to 6.50percent at June 1, 2004 based on increases in interest rates.
In May, 2004, the FASB issued FASB Staff Position ("FSP") 106-2, providing final guidance on accounting for the MedicarePrescription Drug, Improvement, and Modernization Act of 2003 (the "Act"). Under the provisions of FSP 106-2, the Companydetermined that its health care plans were not actuarially equivalent to Medicare Part D. In January, 2005, the Centers for Medicareand Medicaid Services released final regulations implementing the Act. The Company has determined that, although its plans arebelieved to be actuarially equivalent and eligible for certain subsidies under the most recent regulations, implementation of theseregulations will have an immaterial impact on its overall financial condition, results of operations, and cash flows and therefore are notreflected in the above amounts.
In July 2006, the Company announced plans to change its U.S. life insurance and health care benefit plans such that employees hiredon or after January 1, 2007 will have access to post-retirement health care benefits only, while Eastman will not provide a companycontribution toward the premium cost of post-retirement benefits for those employees. This change will begin to impact the financialstatements in first quarter 2007.
11. COMMITMENTS
Purchase Obligations and Lease Commitments
At December 31, 2006, the Company had various purchase obligations totaling approximately $2.1 billion over a period ofapproximately 15 years for materials, supplies, and energy incident to the ordinary conduct of business. The Company also hadvarious lease commitments for property and equipment under cancelable, noncancelable, and month-to-month operating leasestotaling approximately $201 million over a period of several years. Of the total lease commitments, approximately 12 percent relate tomachinery and equipment, including computer and communications equipment and production equipment; approximately 50 percentrelate to real property, including office space, storage facilities and land; and approximately 38 percent relate to railcars. Rentalexpense, net of sublease income, was approximately $62 million, $64 million, and $65 million in 2006, 2005 and 2004, respectively.
The obligations described above are summarized in the following table:
(Dollars inMillions) Payments Due For
Period Notes and
Debentures
Credit FacilityBorrowingsand Other
InterestPayable
PurchaseObligations
OperatingLeases Total
2007 $ $ 3 $ 107 $ 373 $ 45 $ 5282008 72 -- 106 363 30 5712009 13 105 349 25 4922010 -- -- 104 312 20 4362011 2 185 104 199 17 5072012 and beyond 1,317 -- 1,053 507 64 2,941Total $ 1,391 $ 201 $ 1,579 $ 2,103 $ 201 $ 5,475
92
Source: EASTMAN CHEMICAL CO, 10-K, March 01, 2007

NOTES TO THE AUDITED CONSOLIDATED FINANCIAL STATEMENTS
Accounts Receivable Securitization Program
In 1999, the Company entered into an agreement that allows the Company to sell certain domestic accounts receivable under aplanned continuous sale program to a third party. The agreement permits the sale of undivided interests in domestic trade accountsreceivable. Receivables sold to the third party totaled $200 million at December 31, 2006 and December 31, 2005. Undivided interestsin designated receivable pools were sold to the purchaser with recourse limited to the purchased interest in the receivable pools.Average monthly proceeds from collections reinvested in the continuous sale program were approximately $321 million and $292million in 2006 and 2005, respectively.
Guarantees
In November 2002, the FASB issued Interpretation No. 45 (“FIN 45”), “Guarantor’s Accounting and Disclosure Requirements forGuarantees, Including Indirect Guarantees of Indebtedness of Others,” an interpretation of FASB Statements No. 5, 57, and 107 andRescission of FASB Interpretation No. 34.” FIN 45 clarifies the requirements of SFAS No. 5, “Accounting for Contingencies,”relating to the guarantor’s accounting for, and disclosure of, the issuance of certain types of guarantees. Disclosures about each groupof similar guarantees are provided below.
Residual Value Guarantees
If certain operating leases are terminated by the Company, it guarantees a portion of the residual value loss, if any, incurred by thelessors in disposing of the related assets. Under these operating leases, the residual value guarantees at December 31, 2006 totaled$113 million and consisted primarily of leases for railcars, company aircraft, and other equipment. Leases with guarantee amountstotaling $2 million, $27 million, and $84 million will expire in 2007, 2008, and 2012, respectively. The Company believes, based oncurrent facts and circumstances, that the likelihood of a material payment pursuant to such guarantees is remote.
Other Guarantees
Guarantees and claims also arise during the ordinary course of business from relationships with suppliers, customers andnon-consolidated affiliates when the Company undertakes an obligation to guarantee the performance of others if specified triggeringevents occur. Non-performance under a contract could trigger an obligation of the Company. These potential claims include actionsbased upon alleged exposures to products, intellectual property and environmental matters, and other indemnifications. The ultimateeffect on future financial results is not subject to reasonable estimation because considerable uncertainty exists as to the final outcomeof these claims. However, while the ultimate liabilities resulting from such claims may be significant to results of operations in theperiod recognized, management does not anticipate they will have a material adverse effect on the Company's consolidated financialposition or liquidity.
93
Source: EASTMAN CHEMICAL CO, 10-K, March 01, 2007

NOTES TO THE AUDITED CONSOLIDATED FINANCIAL STATEMENTS
Variable Interest Entities
The Company has evaluated material relationships including the guarantees related to the third-party borrowings of joint venturesdescribed above and has concluded that the entities are not Variable Interest Entities (“VIEs”) or, in the case of Primester, a jointventure that manufactures cellulose acetate at the Company's Kingsport, Tennessee plant, the Company is not the primary beneficiaryof the VIE. As such, in accordance with FASB Interpretation Number 46, "Consolidation of Variable Interest Entities" ("FIN 46R"),the Company is not required to consolidate these entities. In addition, the Company has evaluated long-term purchase obligations withtwo entities that may be VIEs at December 31, 2006. These potential VIEs are joint ventures from which the Company has purchasedraw materials and utilities for several years and purchases approximately $60 million of raw materials and utilities on an annual basis.The Company has no equity interest in these entities and has confirmed that one party to each of these joint ventures does consolidatethe potential VIE. However, due to competitive and other reasons, the Company has not been able to obtain the necessary financialinformation to determine whether the entities are VIEs, and if one or both are VIEs, whether or not the Company is the primarybeneficiary.
12. ENVIRONMENTAL MATTERS
Certain Eastman manufacturing sites generate hazardous and nonhazardous wastes, the treatment, storage, transportation, and disposalof which are regulated by various governmental agencies. In connection with the cleanup of various hazardous waste sites, theCompany, along with many other entities, has been designated a potentially responsible party ("PRP"), by the U.S. EnvironmentalProtection Agency under the Comprehensive Environmental Response, Compensation and Liability Act, which potentially subjectsPRPs to joint and several liability for such cleanup costs. In addition, the Company will be required to incur costs for environmentalremediation and closure and postclosure under the federal Resource Conservation and Recovery Act. Reserves for environmentalcontingencies have been established in accordance with Eastman’s policies described in Note 1, "Significant Accounting Policies".Because of expected sharing of costs, the availability of legal defenses, and the Company’s preliminary assessment of actions that maybe required, management does not believe that the Company's liability for these environmental matters, individually or in theaggregate, will be material to the Company’s consolidated financial position, results of operations or cash flows. The Company’sreserve for environmental contingencies was $47 million and $51 million at December 31, 2006 and 2005, respectively, representingthe minimum or best estimate for remediation costs and the best estimate accrued to date over the facilities' estimated useful lives forasset retirement obligation costs. Estimated future environmental expenditures for remediation costs range from the minimum or bestestimate of $18 million to the maximum of $32 million at December 31, 2006 and the minimum or best estimate of $21 million to themaximum of $42 million at December 31, 2005.
The following table summarizes the activity in the Company's accrued obligations for environmental matters for the years endedDecember 31, 2006 and 2005:
Accrued Obligations for Environmental Matters
(in millions) December 31, 2006 December 31, 2005 Beginning environmental liability $ 51 $ 56 Liabilities incurred in current period 7 1Liabilities settled in current period (14) (5)Accretion expense 2 2Revisions to estimated cash flow 1 (3) Ending environmental liability $ 47 $ 51
94
Source: EASTMAN CHEMICAL CO, 10-K, March 01, 2007

NOTES TO THE AUDITED CONSOLIDATED FINANCIAL STATEMENTS
As part of the divestitures of the Arkansas facility and the PE product lines, environmental liabilities of approximately $6 million weresettled.
For additional information, refer to Note 25, "Reserve Rollforwards".
13. LEGAL MATTERS
General
From time to time, the Company and its operations are parties to, or targets of, lawsuits, claims, investigations and proceedings,including product liability, personal injury, asbestos, patent and intellectual property, commercial, contract, environmental, antitrust,health and safety, and employment matters, which are being handled and defended in the ordinary course of business. While theCompany is unable to predict the outcome of these matters, it does not believe, based upon currently available facts, that the ultimateresolution of any such pending matters, including the sorbates litigation and the asbestos litigation (described below), will have amaterial adverse effect on its overall financial condition, results of operations or cash flows. However, adverse developments couldnegatively impact earnings or cash flows in a particular future period.
Sorbates Litigation
Two civil cases relating to sorbates remain. In each case, the Company prevailed at the trial court, and in each case, the plaintiffappealed the trial court's decision. In one case, the appeal is still pending. In the other case, the court of appeals overturned the trialcourt's decision and ruled that the plaintiff could amend and re-file its complaint with the trial court. The Company has appealed thiscourt of appeals decision to the state supreme court. In each case the Company intends to continue to vigorously defend its position. Asbestos Litigation
Over the years, Eastman has been named as a defendant, along with numerous other defendants, in lawsuits in various state courts inwhich plaintiffs have alleged injury due to exposure to asbestos at Eastman’s manufacturing sites. More recently, certain plaintiffshave claimed exposure to an asbestos-containing plastic, which Eastman manufactured in limited amounts between the mid-1960’sand the early 1970’s.
To date, the Company has obtained dismissals or settlements of its asbestos-related lawsuits with no material effect on its financialcondition, results of operations or cash flows, and over the past several years, has substantially reduced its number of pendingasbestos-related claims. The Company has also obtained insurance coverage that applies to a portion of certain of the Company’sdefense costs and payments of settlements or judgments in connection with asbestos-related lawsuits.
Based on an ongoing evaluation, the Company believes that the resolution of its pending asbestos claims will not have a materialimpact on the Company’s financial condition, results of operations, or cash flows, although these matters could result in the Companybeing subject to monetary damages, costs or expenses, and charges against earnings in particular periods.
95
Source: EASTMAN CHEMICAL CO, 10-K, March 01, 2007

NOTES TO THE AUDITED CONSOLIDATED FINANCIAL STATEMENTS
14. STOCKHOLDERS’ EQUITY
A reconciliation of the changes in stockholders’ equity for 2004, 2005, and 2006 is provided below:
(Dollars in millions)
CommonStock at Par
Value$
Paid-inCapital
$
RetainedEarnings
$
Accumulated OtherComprehensiveIncome (Loss)
$
TreasuryStock at Cost
$
TotalStockholders’
Equity$
Balance at January 1, 2004 1 122 1,476 (121) (435) 1,043 Net Earnings -- -- 170 -- -- 170Cash Dividends(2) -- -- (137) -- -- (137)Other Comprehensive Income -- -- -- 18 -- 18Stock Option Exercises and other
Items (1) -- 88 -- -- 2 90Balance at December 31, 2004 1 210 1,509 (103) (433) 1,184 Net Earnings -- -- 557 -- -- 557Cash Dividends(2) -- -- (143) -- -- (143)Other Comprehensive Loss -- -- -- (97) -- (97)Stock Option Exercises and other
Items (1) -- 110 -- -- 1 111Balance at December 31, 2005 1 320 1,923 (200) (432) 1,612 Net Earnings -- -- 409 -- -- 409Cash Dividends(2) -- -- (146) -- -- (146)Other Comprehensive Income -- -- -- 107 -- 107Effect of FAS 158 adoption -- -- -- (81) -- (81)Stock Option Exercises and other
Items (1)(3) -- 128 -- -- -- 128Balance at December 31, 2006 1 448 2,186 (174) (432) 2,029
(1) The tax benefits relating to the difference between the amounts deductible for federal income taxes over the amounts charged toincome for book value purposes have been credited to paid-in capital.
(2) Includes cash dividends paid and dividends declared but unpaid. Also includes the redemption of the outstanding preferred stockpurchase rights.
(3) Includes the fair value of equity share-based awards recognized under SFAS No. 123(R).
The Company is authorized to issue 400 million shares of all classes of stock, of which 50 million may be preferred stock, par value$0.01 per share, and 350 million may be common stock, par value $0.01 per share. The Company declared dividends of $1.76 pershare in each of 2006, 2005 and 2004.
The Company established a benefit security trust in 1997 to provide a degree of financial security for unfunded obligations undercertain plans and contributed to the trust a warrant to purchase up to 1 million shares of common stock of the Company for par value.The warrant, which remains outstanding, is exercisable by the trustee if the Company does not meet certain funding obligations, whichobligations would be triggered by certain occurrences, including a change in control or potential change in control, as defined, orfailure by the Company to meet its payment obligations under covered unfunded plans. Such warrant is excluded from thecomputation of diluted earnings per share because the conditions upon which the warrant becomes exercisable have not been met.
96
Source: EASTMAN CHEMICAL CO, 10-K, March 01, 2007

NOTES TO THE AUDITED CONSOLIDATED FINANCIAL STATEMENTS
The additions to paid-in capital for 2005 and 2004 are primarily the result of stock option exercises by employees. Effective January 1,2006, this includes exercises and recognition of compensation expense of equity awards determined under SFAS No. 123(R).
The Company was authorized to repurchase up to $400 million of its common stock under a February 4, 1999, authorization by theBoard of Directors. No shares of Eastman common stock were repurchased by the Company under this authorization during 2006,2005, and 2004. A total of 2,746,869 shares of common stock at a cost of approximately $112 million, or an average price ofapproximately $41 per share, have been repurchased under the authorization. Repurchased shares under this authorization may be usedto meet common stock requirements for compensation and benefit plans and other corporate purposes.
On February 20, 2007, the Board of Directors cancelled its prior authorization for stock repurchases and approved a new authorizationfor the repurchase of up to $300 million of the Company's outstanding common stock at such times, in such amounts, and on suchterms, as determined to be in the best interests of the Company. Repurchased shares may be used for such purposes or otherwiseapplied in such a manner as determined to be in the best interests of the Company. The Company's charitable foundation held the following shares of the Company's common stock at December 31 of each year and arereported in treasury stock: 106,771 shares for 2006 and 2005 and 122,725 shares for 2004.
During the fourth quarter of 2006, the Board of Directors of the Company redeemed all of the outstanding preferred stock purchaserights issuable pursuant to the Stockholder Protection Rights Agreement and terminated the Stockholder Protection Rights Agreement.The payment of $0.01 per share of common stock was recorded in dividends payable at December 31, 2006 and was paid January 2,2007.
For 2006, 2005, and 2004, the weighted average number of common shares outstanding used to compute basic earnings per share was82.1 million, 80.7 million, and 77.6 million, respectively, and for diluted earnings per share was 83.2 million, 81.8 million, and 78.3million, respectively, reflecting the effect of dilutive options outstanding. Excluded from the 2006 calculation were shares underlyingoptions to purchase 2,157,703 shares of common stock at a range of prices from $53.94 to $63.25, because the exercise price of theoptions was greater than the average market price of the underlying common shares. Excluded from the 2005 calculation were sharesunderlying options to purchase 878,442 shares of common stock at a range of prices from $54.25 to $67.50, because the exercise priceof the options was greater than the average market price of the underlying common shares. Excluded from the 2004 calculation wereshares underlying options to purchase 5,667,339 shares of common stock at a range of prices from $45.44 to $67.50, because theexercise price of the options was greater than the average market price of the underlying common shares.
Shares of common stock issued (1) 2006 2005 2004
Balance at beginning of year 89,566,115 87,257,499 85,296,460Issued for employee compensation and benefit
plans
2,013,326 2,308,616 1,961,039Balance at end of year 91,579,441 89,566,115 87,257,499
(1) Includes shares held in treasury.
97
Source: EASTMAN CHEMICAL CO, 10-K, March 01, 2007

NOTES TO THE AUDITED CONSOLIDATED FINANCIAL STATEMENTS
ACCUMULATED OTHER COMPREHENSIVE INCOME (LOSS)
(Dollars in millions)
CumulativeTranslationAdjustment
$
UnfundedAdditionalMinimumPensionLiability
$
UnrecognizedLoss and PriorService Cost,net of taxes
$
Unrealized Gains(Losses) on Cash
Flow Hedges$
UnrealizedLosses on
Investments$
Accumulated
OtherComprehensiveIncome (Loss)
$ Balance at December 31,
2004 155 (248) -- (8) (2) (103)Period change (94) (7) -- 3 1 (97)Balance at December 31,
2005 61 (255) -- (5) (1) (200)Period change 60 48 -- (1) -- 107Pre-SFAS No. 158 balance
at December 31, 2006 121 (207) -- (6) (1) (93)Adjustments to apply SFAS
No. 158 -- 207 (288) -- -- (81)Balance at December 31,
2006 121 -- (288) (6) (1) (174)
Except for cumulative translation adjustment, amounts of other comprehensive income (loss) are presented net of applicable taxes.Because cumulative translation adjustment is considered a component of permanently invested, unremitted earnings of subsidiariesoutside the United States, no taxes are provided on such amounts.
15. SHARE-BASED COMPENSATION PLANS AND AWARDS
2002 Omnibus Long-Term Compensation Plan
Eastman's 2002 Omnibus Long-Term Compensation Plan provides for grants to employees of nonqualified stock options, incentivestock options, tandem and freestanding stock appreciation rights (“SAR’s”), performance shares and various other stock andstock-based awards. The 2002 Omnibus Plan provides that options can be granted through May 2, 2007, for the purchase of Eastmancommon stock at an option price not less than 100 percent of the per share fair market value on the date of the stock option's grant.There is a maximum of 7.5 million shares of common stock available for option grants and other awards during the term of the 2002Omnibus Plan.
Director Long-Term Compensation Plan
Eastman's 2002 Director Long-Term Compensation Plan provides for grants of nonqualified stock options and restricted shares tononemployee members of the Board of Directors. Shares of restricted stock are granted upon the first day of the directors' initial termof service and nonqualified stock options and shares of restricted stock are granted each year following the annual meeting ofstockholders. The 2002 Director Plan provides that options can be granted through the later of May 1, 2007, or the date of the annualmeeting of stockholders in 2007 for the purchase of Eastman common stock at an option price not less than the stock's fair marketvalue on the date of the grant.
98
Source: EASTMAN CHEMICAL CO, 10-K, March 01, 2007

NOTES TO THE AUDITED CONSOLIDATED FINANCIAL STATEMENTS
Adoption of SFAS No. 123(R)
On January 1, 2006, the Company adopted SFAS No. 123(R). SFAS No. 123(R) replaces SFAS No. 123, "Accounting forStock-Based Compensation" and supersedes APB No. 25, "Accounting for Stock Issued to Employees" and amends SFAS No. 95,"Statement of Cash Flows". Prior to adoption, the Company implemented the disclosure-only requirements of SFAS No. 123 andcontinued to implement the requirements of APB No. 25 for financial statement reporting. Under the requirements of APB No. 25, theCompany was required to recognize compensation cost for share-based awards when the employee or non-employee director paid anamount to acquire the awarded shares that was less than the closing market price of the stock at the measurement date (typically thedate of grant). This requirement resulted in compensation expense recognition and reporting in the financial statements for mostshare-based awards (unrestricted stock awards, restricted stock awards, long-term performance stock awards and stock appreciationrights) except for stock options, substantially all of which were awarded at the closing market price of the Company's common stockon the date of grant. Effective with adoption of SFAS No. 123(R), compensation expense related to stock option awards arerecognized in the financial statements at their fair value. The Company adopted SFAS No. 123(R) using the modified prospective method that requires compensation expense of all employeeand non-employee director share-based compensation awards to be recognized in the financial statements based upon their grant datefair value over the requisite service or vesting period: a) based upon the requirements of SFAS No. 123(R) for all new awards grantedafter the effective date of implementation and b) based upon the requirements of SFAS No. 123 for all awards granted prior to theeffective date of SFAS No. 123(R) that remain unvested on the effective date. In November 2005, the FASB also issued FSP No. 123(R) - 3, "Transition Election Related to Accounting for the Tax Effects ofShare-Based Payment Awards." The FSP provides an elective alternative transition method to the prescribed method in SFAS No.123(R) for calculating the pool of excess tax benefits available to absorb tax deficiencies recognized subsequent to the adoption ofSFAS No. 123(R). The Company determined it did not have all the data necessary to compute the pool of excess tax benefits asdescribed in SFAS No 123(R) and has elected to follow the alternative method prescribed under SFAS No. 123(R) - 3. Based upon thealternative method, the Company does not have a pool of excess tax benefits at December 31, 2005 to offset tax shortfalls and,consequently, will record them as current period income tax expense. The Company is authorized by the Board of Directors under the 2002 Omnibus Long-Term Compensation Plan and 2002 DirectorLong-Term Compensation Plan to provide grants to employees and non-employee members of the Board of Directors. It has been theCompany's practice to issue new shares rather than treasury shares for equity awards that require payment by the issuance of commonstock and to withhold or accept back shares awarded necessary to cover the income taxes of employee participants. Shares ofnon-employee directors are not withheld or acquired for the withholding of their income taxes. Shares of unrestricted common stockowned by specified senior management level employees are accepted by the Company to pay for the exercise price of stock optionexercises in accordance with the terms and conditions of their awards. For 2006, 2005 and 2004, total share-based compensation expense (before tax) of approximately $29 million, $22 million and $16million, respectively, was recognized in selling, general and administrative expense in the consolidated statement of earnings,comprehensive income, and retained earnings for all share-based awards of which approximately $17 million, $5 million and $8million, respectively, related to stock options. SFAS No. 123(R) requires that compensation expense is recognized over thesubstantive vesting period, which may be a shorter time period than the stated vesting period. For example, SFAS No. 123(R) requirescompensation expense to be recognized by the retirement eligibility date for option participants who are retirement eligible on thegrant date or before the stated vesting period. Approximately $8 million of 2006 option compensation expense is recognized due toretirement eligibility preceding the requisite vesting period.
99
Source: EASTMAN CHEMICAL CO, 10-K, March 01, 2007

NOTES TO THE AUDITED CONSOLIDATED FINANCIAL STATEMENTS
Stock Option Awards
Option awards are granted to non-employee directors on an annual basis and to employees who meet certain eligibility requirements.A single annual option grant is usually awarded to eligible employees in the fourth quarter of each year, if and when granted by theCompensation and Management Development Committee of the Board of Directors, and occasional individual grants are awarded toeligible employees throughout the year. Option awards have an exercise price equal to the closing price of the Company's stock on thedate of grant. The term of options is ten years with vesting periods that vary up to three years. Vesting usually occurs ratably or at theend of the vesting period. SFAS No. 123(R) requires that stock option awards be valued at fair value determined by market price, ifactively traded in a public market or, if not, calculated using an option pricing financial model. The fair value of the Company'soptions cannot be determined by market value as they are not traded in an open market. Accordingly, a financial pricing model isutilized to determine fair value. The Company utilizes the Black Scholes Merton ("BSM") model which relies on certain assumptionsto estimate an option's fair value.
The weighted average assumptions used in the determination of fair value for stock options awarded in 2006, 2005 and 2004 areprovided in the table below:
Assumptions 2006 2005 2004 Expected volatility rate 21.40% 22.90% 28.00%Expected dividend yield 3.24% 3.29% 3.80%Average risk-free interest rate 4.62% 4.48% 3.46%Expected forfeiture rate 0.75% Actual ActualExpected term years 4.40 5.00 6.00
Prior to adoption of SFAS No. 123(R), the Company calculated the expected term of stock options of six years. Effective with thefourth quarter 2005 annual option award, the Company analyzed historical annual grant transactions over a ten year period comprisingexercises, post-vesting cancellations and expirations to determine the expected term. The Company expects to execute this analysiseach year preceding the annual option grant to ensure that all assumptions based upon internal data reflect the most reasonableexpectations for fair value determination. The weighted average expected term of 4.4 years for 2006 reflects the impact of this annualanalysis and the weighting of option swap and reload grants which may have much shorter expected terms than new option grants.
The volatility rate of grants is derived from historical Company common stock volatility over the same time period as the expectedterm. The Company uses a weekly high closing stock price based upon daily closing prices in the week. The volatility rate is derivedby mathematical formula utilizing the weekly high closing price data.
For the periods presented above, the expected dividend yield is derived by mathematical formula which uses the expected Companyannual dividend amount over the expected term divided by the fair market value of the Company's common stock at the grant date.
The average risk-free interest rate is derived from United States Department of Treasury published interest rates of daily yield curvesfor the same time period as the expected term.
Prior to adoption of SFAS No. 123(R), the Company did not estimate forfeitures and recognized them as they occurred for proformadisclosure of share-based compensation expense. With adoption of SFAS No. 123(R), estimated forfeitures must be considered inrecording share-based compensation expense. Estimated forfeiture rates vary with each type of award affected by several factors, oneof which is the varying composition and characteristics of the award participants. Estimated forfeitures for the Company's share-basedawards historically range from 0.75 percent to 10.0 percent with the estimated forfeitures for options at 0.75 percent.
100
Source: EASTMAN CHEMICAL CO, 10-K, March 01, 2007

NOTES TO THE AUDITED CONSOLIDATED FINANCIAL STATEMENTS
A summary of the activity of the Company's stock option awards for 2006, 2005 and 2004 are presented below:
2006 2005 2004
Options Weighted-Average
Exercise Price
Options Weighted-Average
Exercise Price
Options Weighted-Average
Exercise Price Outstanding atbeginning of year 6,616,800 $ 48 8,155,100 $ 47 10,338,100 $ 45
Granted 1,481,300 61 1,275,700 54 1,051,500 45Exercised (2,001,800) 45 (2,342,600) 43 (1,954,200) 41 Cancelled, forfeited or
expired (229,400)
56
(471,400)
64
(1,280,300)
44Outstanding at end of
year 5,866,900 $ 52
6,616,800 $ 48
8,155,100 $ 47 Options exercisable at
year-end
3,385,100
4,688,000
6,091,100
Available for grant at
end of year
1,244,900
2,954,500
4,503,500
The following table provides the remaining contractual term and weighted average exercise prices of stock options outstanding andexercisable at December 31, 2006:
Options Outstanding Options Exercisable
Range ofExercise Prices
Number
Outstanding at12/31/06
Weighted-AverageRemaining
Contractual Life(Years)
Weighted-Average
Exercise Price
Number
Exercisableat 12/31/06
Weighted-AverageExercise Price
$30-42 347,400 5.7 $ 31 344,000 $ 31$43-46 673,000 4.9 45 532,800 45$47-49 1,489,600 5.6 48 1,304,500 48$50-64 3,356,900 7.5 58 1,203,800 57
5,866,900 6.6 $ 52 3,385,100 $ 49
The range of exercise prices of options outstanding at December 31, 2006 is approximately $30 to $64 per share.
101
Source: EASTMAN CHEMICAL CO, 10-K, March 01, 2007

NOTES TO THE AUDITED CONSOLIDATED FINANCIAL STATEMENTS
The summary of option activity as of December 31, 2006 and changes during the year then ended is presented below:
Stock Options Number of Shares
WeightedAverage Exercise
Price
Weighted AverageRemaining
Contractual Life(years)
AggregateIntrinsic Value (1)
Outstanding at 12/31/2005 6,616,800 $ 48 Grants 1,481,300 $ 61 Exercises (2,001,800) $ 45 Cancelled/Forfeited/Expired (229,400) $ 56 Outstanding at 12/31/2006 5,866,900 $ 52 6.6 $ 42,227,341Exercisable at 12/31/2006 3,385,100 $ 49 4.8 $ 34,844,570
(1) Intrinsic value is the amount by which the market price of the stock at December 31, 2006 exceeds the exercise price of theoption.
The weighted average fair value of options granted during 2006, 2005 and 2004 were $10.57, $10.26 and $9.36, respectively. Thetotal intrinsic value of options exercised during the years ended December 31, 2006, 2005 and 2004, was $27 million, $33 million and$20 million, respectively. Cash proceeds received from option exercises in 2006 total $83 million with a related tax benefit of $10million. The total fair value of shares vested during the years ended December 31, 2006, 2005 and 2004 was $9 million, $9 millionand $15 million, respectively.
A summary of the status of the Company's nonvested options as of December 31, 2006 and changes during the year then ended ispresented below:
Nonvested Options Number of Options Weighted-Average Grant Date
Fair ValueNonvested at January 1, 2006 1,928,900 $ 9.80Granted 1,481,300 $ 10.57Vested (917,000) $ 8.78Forfeited (11,400) $ 9.33Nonvested Options at December 31, 2006 2,481,800 $ 10.39
For options unvested at December 31, 2006, approximately $15 million in compensation expense will be recognized over three years. Other Share-Based Compensation Awards In addition to stock option awards, the Company has long-term performance stock awards, restricted stock awards and stockappreciation rights. The long-term performance awards are based upon actual return on capital compared to a target return on capitaland total shareholder return compared to a peer group ranking by total shareholder return. The recognized compensation cost beforetax for these other share-based awards in the years ended December 31, 2006, 2005 and 2004 is approximately $12 million, $17million and $7 million, respectively. The unrecognized compensation expense before tax for these same awards at December 31, 2006is $13 million and will be recognized over a period of approximately three years.
102
Source: EASTMAN CHEMICAL CO, 10-K, March 01, 2007

NOTES TO THE AUDITED CONSOLIDATED FINANCIAL STATEMENTS
16. ASSET IMPAIRMENTS AND RESTRUCTURING CHARGES, NET
Impairments and restructuring charges totaled $101 million during 2006, consisting of non-cash asset impairments of $62 million andrestructuring charges of $39 million. Impairments and restructuring charges totaled $33 million during 2005, consisting of non-cashasset impairments of $12 million and restructuring charges of $21 million. Impairments and restructuring charges totaled $206 millionduring 2004, consisting of non-cash asset impairments of $140 million and restructuring charges of $66 million.
The following table summarizes the 2006, 2005 and 2004 charges:
(Dollars in millions) 2006 2005 2004CASPI: Fixed asset impairments $6 $-- $57Intangible asset impairments -- -- 6Severance charges 4 -- 12Site closure and restructuring costs 3 4 6
Fibers: Severance charges 2 -- --
PCI: Fixed asset impairments 10 8 27Severance charges 6 3 10Site closure and restructuring costs 4 -- 1
Performance Polymers: Fixed asset impairments 30 -- --Severance charges 16 -- 13Site closure and restructuring costs --
Specialty Plastics (“SP”): Fixed asset impairments 12 -- 41Severance charges 4 -- 10Site closure and restructuring costs -- -- 2
Other: Fixed asset impairments 3 1 9Intangible asset impairments 1 3 --Severance costs -- -- 8Site closure and restructuring costs -- 14 4
Total Eastman Chemical Company
Fixed asset impairments $ 61 $ 9 $ 134Intangible asset impairments 1 3 6Severance charges 32 3 53Site closure and restructuring costs 7 18 13
Total Eastman Chemical Company $ 101 $33 $ 206
103
Source: EASTMAN CHEMICAL CO, 10-K, March 01, 2007

NOTES TO THE AUDITED CONSOLIDATED FINANCIAL STATEMENTS
2006
In the fourth quarter 2006, the Company recorded asset impairments and restructuring charges of $78 million, consisting of non-cashimpairments of $42 million and restructuring charges of $36 million; and other operating income of $68 million. The assetimpairments consisted of approximately $20 million related to the previously reported shutdown of the cyclohexane dimethanol("CHDM") manufacturing assets in San Roque, Spain, utilized in the SP and the Performance Polymers segments and $22 millionprimarily related to the shutdown of a research and development pilot plant in the Performance Polymers segment. The decisions toshutdown the San Roque, Spain site to gain operational efficiencies at other facilities and to shutdown the research and developmentpilot plant were made in fourth quarter 2006. The restructuring charges consisted of $33 million of estimated severance primarilyrelated to work force reductions and $3 million of other charges.
In the third quarter 2006, asset impairments and restructuring charges totaled $13 million. During the third quarter 2006, the Companyclassified the Batesville, Arkansas manufacturing facility as an asset group held for sale and recorded a related $11 million impairmentcharge to reduce the recorded book value of the assets to the contracted sales price.
In the second quarter 2006, asset impairments and restructuring charges totaled $3 million, relating primarily to previously closedmanufacturing facilities. In the first quarter 2006, asset impairments and restructuring charges totaled $7 million, relating primarily to the divestiture of apreviously closed manufacturing facility.
2005
During 2005, the Company recorded $33 million in restructuring charges. These charges consist of approximately $8 million of fixedasset impairments related to the Company's PCI manufacturing facilities outside the United States, $14 million in restructuringcharges related to the shutdown of Cendian Corporation ("Cendian"), the Company's logistics subsidiary, $4 million of fixed andintangible asset impairments related to the Company's other category, $3 million in severance charges related to the separation ofapproximately 90 employees at the Company's Batesville, Arkansas manufacturing facility, and $4 million in site closure costs relatedto the previously announced closures of certain manufacturing facilities.
2004
In the fourth quarter 2004, the Company recorded restructuring charges of approximately $18 million, consisting of asset impairmentsof $9 million and site closure and other restructuring charges of $9 million. The non-cash asset impairments relate to the adjustment tofair value of assets at Cendian, impacting the other category, resulting from a decision to reintegrate Cendian’s logistics activities. Inaddition, the Company recognized restructuring charges of $9 million primarily related to actual and expected severance of Cendianand other employees, as well as site closure charges primarily related to previously announced manufacturing plant closures.
104
Source: EASTMAN CHEMICAL CO, 10-K, March 01, 2007

NOTES TO THE AUDITED CONSOLIDATED FINANCIAL STATEMENTS
In the third quarter 2004, the Company recognized restructuring charges of approximately $42 million, including asset impairments ofapproximately $28 million, for assets at the Company’s Batesville, Arkansas and Longview, Texas manufacturing facilities. Theseimpairments primarily related to certain fixed assets in the performance chemicals product lines in the PCI segment that managementdecided to rationalize due to increased foreign competition. Also in third quarter, the CASPI segment incurred approximately $2million in site closure charges primarily related to previously announced manufacturing plant closures, while the other categoryrecognized approximately $4 million in severance and restructuring charges related to the reorganization of Cendian. Severancecharges of $2 million, $3 million, $2 million, and $1 million were also recognized in the CASPI, PCI, SP, and Polymers segments,respectively. These charges resulted from the Company's voluntary termination program as well as ongoing cost reduction efforts.
In the second quarter 2004, the Company recognized $79 million in restructuring charges, including asset impairments of $62 millionrelated to assets held for sale. The assets were part of the Company’s sale of certain businesses and product lines within the CASPIsegment, which was completed July 31, 2004. Those product lines include: certain acrylic monomers; composites (unsaturatedpolyester resins); inks and graphic arts raw materials; liquid resins; powder resins; and textile chemicals. The charges reflectadjustment of the recorded values of these assets to the expected sales proceeds. Also in second quarter 2004, the Companyrecognized an additional $4 million of site closure costs related primarily to previously announced manufacturing plant closures.These charges had an impact of approximately $2 million each to the CASPI and SP segments. Severance charges of $5 million, $4million, $2 million, and $1 million were also recognized in the CASPI, PCI, SP, and Polymers segments, respectively, and $1 millionin the other category. These charges resulted from the Company's voluntary termination program as well as ongoing cost reductionefforts.
In the first quarter 2004, the Company recognized $67 million in restructuring charges, including approximately $40 million of assetimpairments and $5 million of severance charges primarily related to the closure of its copolyester manufacturing facility inHartlepool, United Kingdom. The decision to close the Hartlepool site, which manufactured products that are within the Company’sSP segment’s product lines, was made in order to consolidate production at other sites to create a more integrated and efficient globalmanufacturing structure. Accordingly, the carrying value of the manufacturing fixed assets was written down to fair value asestablished by appraisal and available market data. In addition, the Company recognized $1 million of fixed asset impairments and $1million of site closure costs related to additional impairments within the CASPI reorganization and changes in estimates for previouslyaccrued amounts. Severance charges of $4 million, $3 million, $1 million, and $11 million were also recognized in the CASPI, PCI,SP, and Polymers segments, respectively, and $1 million in the other category as a result of ongoing cost reduction efforts.
105
Source: EASTMAN CHEMICAL CO, 10-K, March 01, 2007

NOTES TO THE AUDITED CONSOLIDATED FINANCIAL STATEMENTS
The following table summarizes the charges and changes in estimates described above, other asset impairments and restructuringcharges, the non-cash reductions attributable to asset impairments, and the cash reductions in shutdown reserves for severance costsand site closure costs paid:
(Dollars in millions)
Balance atJanuary 1,
2004 Provision/
Adjustments Non-cash
Reductions Cash
Reductions
Balance atDecember 31,
2004 Noncash charges $ -- $ 140 $ (140) $ -- $ --Severance costs 10 53 -- (37) 26Site closure andrestructuring costs
5
13
--
(9)
9
Total $ 15 $ 206 $ (140) $ (46) $ 35 Balance at
January 1,2005
Provision/Adjustments
Non-cashReductions
CashReductions
Balance atDecember 31,
2005 Noncash charges $ -- $ 12 $ (12) $ -- $ --Severance costs 26 3 -- (26) 3Site closure andrestructuring costs
9
18
(1)
(19)
7
Total $ 35 $ 33 $ (13) $ (45) $ 10 Balance at
January 1,2006
Provision/Adjustments
Non-cashReductions
CashReductions
Balance atDecember 31,
2006 Noncash charges $ -- $ 62 $ (62) $ -- $ --Severance costs 3 32 -- (1) 34Site closure andrestructuring costs
7
7
--
--
14
Total $ 10 $ 101 $ (62) $ (1) $ 48
A majority of all severance and site closure costs are expected to be applied to the reserves within one year.
Actual and probable separations totaled approximately 400 employees during 2006. As of the end of 2006, no separations accrued forwere completed. Actual and probable separations totaled approximately 90 employees during 2005. As of the end of 2005,substantially all separations accrued for were completed. Actual and probable separations totaled approximately 1,200 employeesduring 2004. As of the end of 2004, substantially all separations accrued for were completed.
17. OTHER OPERATING INCOME
(Dollars in millions) 2006 2005 2004 Other operating income $ (68) $ (2) $ (7)
Other operating income for 2006 reflects a gain of $75 million on the sale of the Company's polyethylene ("PE") and Epolene polymerbusinesses, related assets, and the Company's ethylene pipeline and charges of approximately $7 million related to the sale of theCompany's Batesville, Arkansas manufacturing facility and related assets and product lines. For additional information, see Note 24,"Divestitures".
Other operating income for 2005 primarily reflects a gain associated with a change in estimates for contingencies related to the 2004divestiture of certain businesses and product lines within the CASPI segment.
106
Source: EASTMAN CHEMICAL CO, 10-K, March 01, 2007
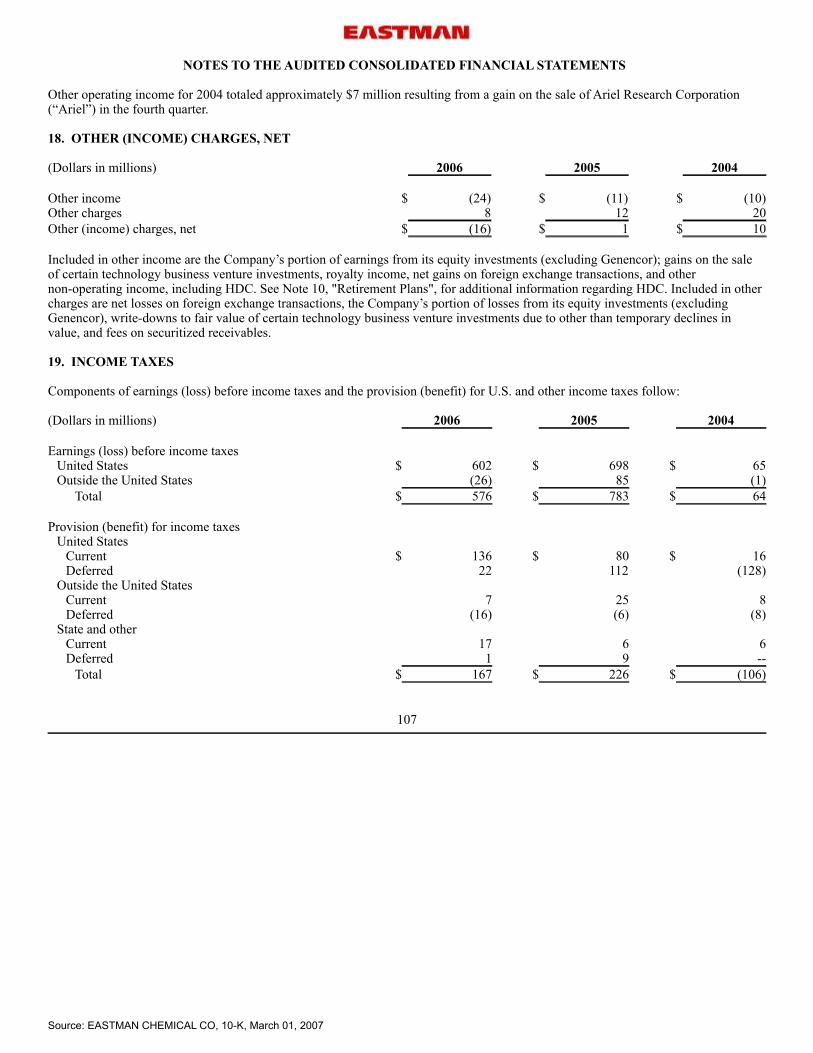
NOTES TO THE AUDITED CONSOLIDATED FINANCIAL STATEMENTS
Other operating income for 2004 totaled approximately $7 million resulting from a gain on the sale of Ariel Research Corporation(“Ariel”) in the fourth quarter.
18. OTHER (INCOME) CHARGES, NET
(Dollars in millions) 2006 2005 2004 Other income $ (24) $ (11) $ (10)Other charges 8 12 20Other (income) charges, net $ (16) $ 1 $ 10
Included in other income are the Company’s portion of earnings from its equity investments (excluding Genencor); gains on the saleof certain technology business venture investments, royalty income, net gains on foreign exchange transactions, and othernon-operating income, including HDC. See Note 10, "Retirement Plans", for additional information regarding HDC. Included in othercharges are net losses on foreign exchange transactions, the Company’s portion of losses from its equity investments (excludingGenencor), write-downs to fair value of certain technology business venture investments due to other than temporary declines invalue, and fees on securitized receivables.
19. INCOME TAXES
Components of earnings (loss) before income taxes and the provision (benefit) for U.S. and other income taxes follow:
(Dollars in millions) 2006 2005 2004 Earnings (loss) before income taxes
United States $ 602 $ 698 $ 65Outside the United States (26) 85 (1)
Total $ 576 $ 783 $ 64 Provision (benefit) for income taxes
United States Current $ 136 $ 80 $ 16Deferred 22 112 (128)
Outside the United States Current 7 25 8Deferred (16) (6) (8)
State and other Current 17 6 6Deferred 1 9 --
Total $ 167 $ 226 $ (106)
107
Source: EASTMAN CHEMICAL CO, 10-K, March 01, 2007

NOTES TO THE AUDITED CONSOLIDATED FINANCIAL STATEMENTS
The following represents the deferred tax charge (benefit) recorded as a component of accumulated other comprehensive income(loss) in stockholders’ equity.
(Dollars in millions) 2006 2005 2004 Minimum pension liability $ (9) $ 4 $ 2 Net unrealized gains (losses) on derivative instruments (1) (1) 7
Total $ (10) $ 3 $ 9
Differences between the provision (benefit) for income taxes and income taxes computed using the U.S. federal statutory income taxrate follow:
(Dollars in millions) 2006 2005 2004 Amount computed using the statutory rate $ 201 $ 275 $ 23State income taxes, net 12 5 (1)Foreign rate variance 4 (4) 4Extraterritorial income exclusion (9) (12) (10)Domestic manufacturing deduction (4) (5) --ESOP dividend payout (2) (2) (2)Capital loss benefits (25) (13) (116)Change in reserves for tax contingencies (3) (14) (2)Net operating loss benefits (11) -- --Donation of intangibles -- (12) (2)Other 4 8 --Provision (benefit) for income taxes $ 167 $ 226 $ (106)
The 2006 effective tax rate was impacted by a net of $25 million of deferred tax benefit resulting from the reversal of capital losscarryforward valuation reserves and $11 million of deferred tax benefit resulting from the reversal of foreign net operating lossvaluation reserves.
The 2005 effective tax rate was impacted by a $11 million tax charge resulting from the repatriation of $321 million of foreignearnings and capital pursuant to provisions of the American Jobs Creation Act of 2004 ("Jobs Act"). The Jobs Act created a temporaryincentive for U.S. corporations to repatriate accumulated income earned abroad by providing an 85 percent dividends receiveddeduction for certain dividends from controlled foreign corporations.
The 2004 effective tax rate was impacted by $90 million of deferred tax benefits resulting from the expected utilization of a capitalloss resulting from the sale of certain businesses and product lines and related assets in the CASPI segment and $26 million of taxbenefit resulting from the favorable resolution of a prior year capital loss refund claim.
108
Source: EASTMAN CHEMICAL CO, 10-K, March 01, 2007

NOTES TO THE AUDITED CONSOLIDATED FINANCIAL STATEMENTS
The significant components of deferred tax assets and liabilities follow:
December 31,(Dollars in millions) 2006 2005 Deferred tax assets
Post-employment obligations $ 416 $ 412Net operating loss carry forwards 115 130Capital loss carry forwards 47 93Other 136 123
Total deferred tax assets 714 758Less valuation allowance (130) (197)Deferred tax assets less valuation allowance $ 584 $ 561 Deferred tax liabilities
Depreciation $ ( 722) $ ( 692)Inventory reserves (50) (42)Other -- (66)
Total deferred tax liabilities $ (772) $ (800) Net deferred tax liabilities $ (188) $ (239) As recorded in the Consolidated Statements of Financial
Position:
Other current assets $ 11 $ 39Other noncurrent assets 83 45Payables and other current liabilities (13) (6)Deferred income tax liabilities (269) (317)
Net deferred tax liabilities $ (188) $ (239)
Unremitted earnings of subsidiaries outside the United States, considered to be reinvested indefinitely, totaled $275 million atDecember 31, 2006. It is not practicable to determine the deferred tax liability for temporary differences related to those unremittedearnings.
For certain consolidated foreign subsidiaries, income and losses directly flow through to taxable income in the United States. Theseentities are also subject to taxation in the foreign tax jurisdictions. Net operating loss carryforwards exist to offset future taxableincome in foreign tax jurisdictions and valuation allowances are provided to reduce deferred related tax assets if it is more likely thannot that this benefit will not be realized. Changes in the estimated realizable amount of deferred tax assets associated with netoperating losses for these entities could result in changes in the deferred tax asset valuation allowance in the foreign tax jurisdiction.At the same time, because these entities are also subject to tax in the United States, a deferred tax liability for the expected futuretaxable income will be established concurrently. Therefore, the impact of any reversal of valuation allowances on consolidated incometax expense will only be to the extent that there are differences between the United States statutory tax rate and the tax rate in theforeign jurisdiction. A valuation allowance of $74 million at December 31, 2006, has been provided against the deferred tax assetresulting from these operating loss carryforwards.
At December 31, 2006, foreign net operating loss carryforwards totaled $413 million. Of this total, $285 million will expire in 3 to 15years; and $128 million will never expire.
109
Source: EASTMAN CHEMICAL CO, 10-K, March 01, 2007

NOTES TO THE AUDITED CONSOLIDATED FINANCIAL STATEMENTS
Amounts due to and from tax authorities as recorded in the Consolidated Statements of Financial Position:
December 31,(Dollars in millions) 2006 2005 Payables and other current liabilities $ 25 $ 9Other long-term liabilities 20 32Total income taxes payable $ 45 $ 41
20. SUPPLEMENTAL CASH FLOW INFORMATION
(Dollars in millions) 2006 2005 2004 Cash paid for interest and income taxes is as follows:
Interest, net of amounts capitalized $ 105 $ 126 $ 135Income taxes paid (received) 157 138 (3)
Derivative financial instruments and related gains and losses are included in cash flows from operating activities.
Non-cash portion of earnings from the Company’s equity investments were $2 million and $15 million for 2005 and 2004,respectively. There were no non-cash portions of earnings from the Company's equity investments in 2006.
21. SEGMENT INFORMATION
The Company's products and operations are managed and reported in five reportable operating segments, consisting of the CASPIsegment, the Fibers segment, the PCI segment, the Performance Polymers segment and the SP segment. The Company's segmentswere previously aligned in a divisional structure that provided for goods and services to be transferred between divisions atpredetermined prices that may have been in excess of cost, which resulted in the recognition of intersegment sales revenue andoperating earnings. Such interdivisional transactions were eliminated in the Company's consolidated financial statements. In firstquarter 2006, the Company realigned its organizational structure to support its growth strategy and to better reflect the integratednature of the Company's assets. A result of the realigned organizational structure is that goods and services are transferred among thesegments at cost. As part of this change, the Company's segment results have been restated to eliminate the impact of interdivisionalsales revenue and operating earnings.
In the first quarter of 2006, management determined that the Developing Businesses ("DB") segment is not of continuing significancefor financial reporting purposes. As a result, revenues and costs previously included in the DB segment and research and developmentexpenses not identifiable to an operating segment are not included in segment operating results for either of the periods presented andare shown in the tables below as "other" revenues and operating losses.
The CASPI segment manufactures raw materials, additives and specialty polymers, primarily for the paints and coatings, inks, andadhesives markets. The CASPI segment's products consist of liquid vehicles, coatings additives, and hydrocarbon resins and rosinsand rosin esters. Liquid vehicles, such as ester, ketone and alcohol solvents, maintain the binders in liquid form for ease of application.Coatings additives, such as cellulosic polymers, Texanol ester alcohol and chlorinated polyolefins, enhance the rheological, filmformation and adhesion properties of paints, coatings and inks. Hydrocarbon resins and rosins and rosin esters are used in adhesive,ink, and polymers compounding applications. Additional products are developed in response to, or in anticipation of, new applicationswhere the Company believes significant value can be achieved. On November 30, 2006, the Company sold its Epolene polymerbusinesses and related assets located at the Longview, Texas site.
110
Source: EASTMAN CHEMICAL CO, 10-K, March 01, 2007

NOTES TO THE AUDITED CONSOLIDATED FINANCIAL STATEMENTS
The Fibers segment manufactures Estron acetate tow and Estrobond triacetin plasticizers which are used primarily in cigarette filters;Estron and Chromspun acetate yarns for use in apparel, home furnishings and industrial fabrics; acetate flake for use by other acetatetow producers; and acetyl chemicals.
The PCI segment manufactures diversified products that are used in a variety of markets and industrial and consumer applications,including chemicals for agricultural intermediates, fibers, food and beverage ingredients, photographic chemicals, pharmaceuticalintermediates, polymer compounding and chemical manufacturing intermediates. In fourth quarter 2006, the Company sold itsBatesville, Arkansas manufacturing facility and related assets and the specialty organic chemicals product lines. The Performance Polymers segment manufactures and supplies PET polymers for use primarily in beverage and food packaging,including carbonated soft drinks, water, juices, sports drinks, beer and food containers that are suitable for both conventional andmicrowave oven use. The Performance Polymers segment also manufactured low-density PE and linear low-density PE, which wereused primarily in extrusion coating, film and molding applications. These PE product lines were divested in fourth quarter, 2006 alongwith related assets and the Company's ethylene pipeline.
The SP segment’s key products include engineering and specialty polymers, specialty film and sheet products, and packaging film andfiber products. Included in these are highly specialized copolyesters and cellulosic plastics that possess unique performance propertiesfor value-added end uses such as appliances, store fixtures and displays, building and construction, electronic packaging, medicalpackaging, personal care and cosmetics, performance films, tape and labels, fiber, photographic and optical film, graphic arts, andgeneral packaging.
In fourth quarter 2006, certain product lines were transferred from the PCI segment to the Performance Polymers segment. During2005 and 2004, these amounts were included within the PCI segment. Accordingly, the prior year's amounts for sales and operatingearnings have been adjusted to retrospectively apply these changes to all periods presented.
(Dollars in millions) 2006
2005
2004
Sales by Segment CASPI $ 1,421 $ 1,299 $ 1,554Fibers 910 869 731PCI 1,659 1,560 1,304Performance Polymers 2,642 2,586 2,226SP 818 718 644
Total Sales by Segment 7,450 7,032 6,459Other -- 27 121 Total Sales $ 7,450 $ 7,059 $ 6,580
111
Source: EASTMAN CHEMICAL CO, 10-K, March 01, 2007
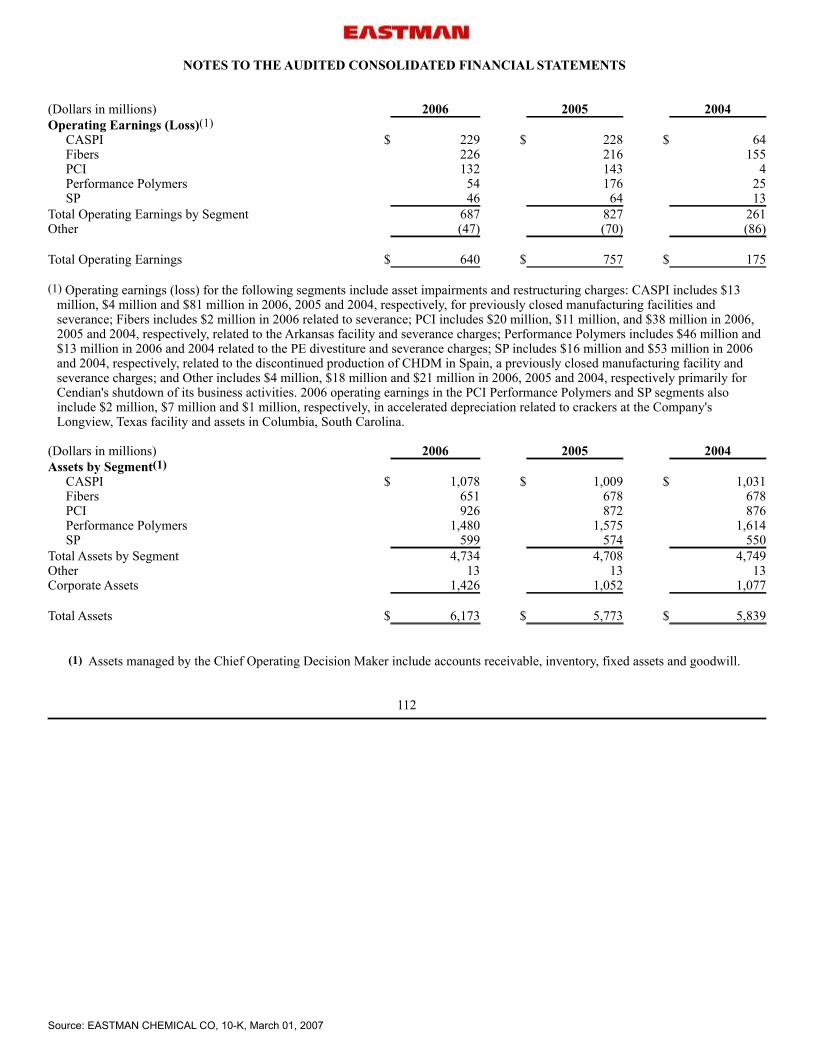
NOTES TO THE AUDITED CONSOLIDATED FINANCIAL STATEMENTS
(Dollars in millions) 2006 2005 2004Operating Earnings (Loss)(1)
CASPI $ 229 $ 228 $ 64Fibers 226 216 155PCI 132 143 4Performance Polymers 54 176 25SP 46 64 13
Total Operating Earnings by Segment 687 827 261Other (47) (70) (86) Total Operating Earnings $ 640 $ 757 $ 175
(1) Operating earnings (loss) for the following segments include asset impairments and restructuring charges: CASPI includes $13million, $4 million and $81 million in 2006, 2005 and 2004, respectively, for previously closed manufacturing facilities andseverance; Fibers includes $2 million in 2006 related to severance; PCI includes $20 million, $11 million, and $38 million in 2006,2005 and 2004, respectively, related to the Arkansas facility and severance charges; Performance Polymers includes $46 million and$13 million in 2006 and 2004 related to the PE divestiture and severance charges; SP includes $16 million and $53 million in 2006and 2004, respectively, related to the discontinued production of CHDM in Spain, a previously closed manufacturing facility andseverance charges; and Other includes $4 million, $18 million and $21 million in 2006, 2005 and 2004, respectively primarily forCendian's shutdown of its business activities. 2006 operating earnings in the PCI Performance Polymers and SP segments alsoinclude $2 million, $7 million and $1 million, respectively, in accelerated depreciation related to crackers at the Company'sLongview, Texas facility and assets in Columbia, South Carolina.
(Dollars in millions) 2006 2005 2004Assets by Segment(1)
CASPI $ 1,078 $ 1,009 $ 1,031Fibers 651 678 678PCI 926 872 876Performance Polymers 1,480 1,575 1,614SP 599 574 550
Total Assets by Segment 4,734 4,708 4,749Other 13 13 13Corporate Assets 1,426 1,052 1,077 Total Assets $ 6,173 $ 5,773 $ 5,839
(1) Assets managed by the Chief Operating Decision Maker include accounts receivable, inventory, fixed assets and goodwill.
112
Source: EASTMAN CHEMICAL CO, 10-K, March 01, 2007

NOTES TO THE AUDITED CONSOLIDATED FINANCIAL STATEMENTS
(Dollars in millions) 2006 2005 2004Depreciation Expense by Segment
CASPI $ 54 $ 55 $ 57Fibers 41 35 39PCI 59 76 87Performance Polymers 93 74 72SP 47 47 43
Total Depreciation Expense by Segment 294 287 298Other -- -- 4 Total Depreciation Expense $ 294 $ 287 $ 302
(Dollars in millions) 2006 2005 2004Capital Expenditures by Segment
CASPI $ 60 $ 46 $ 50Fibers 44 28 14PCI 66 63 65Performance Polymers 125 137 67SP 94 67 36
Total Capital Expenditures by Segment 389 341 232Other -- 2 16 Total Capital Expenditures $ 389 $ 343 $ 248
(Dollars in millions) 2006 2005 2004Geographic Information
Revenues United States $ 4,039 $ 3,886 $ 3,456All foreign countries 3,411 3,173 3,124
Total $ 7,450 $ 7,059 $ 6,580
Long-Lived Assets, Net United States $ 2,407 $ 2,508 $ 2,481All foreign countries 662 654 711
Total $ 3,069 $ 3,162 $ 3,192
113
Source: EASTMAN CHEMICAL CO, 10-K, March 01, 2007

NOTES TO THE AUDITED CONSOLIDATED FINANCIAL STATEMENTS
22. QUARTERLY SALES AND EARNINGS DATA - UNAUDITED
(Dollars in millions, except per share amounts)
FirstQuarter
SecondQuarter
ThirdQuarter
FourthQuarter(2)
2006 Sales $ 1,803 $ 1,929 $ 1,966 $ 1,752Gross profit 331 350 316 280Asset impairment and restructuring charges 7 3 13 78Net earnings 105 114 95 95 Net earnings per share (1)
Basic $ 1.28 $ 1.39 $ 1.16 $ 1.14Diluted $ 1.27 $ 1.37 $ 1.15 $ 1.12
(Dollars in millions, except per share amounts)
FirstQuarter
SecondQuarter
ThirdQuarter
FourthQuarter
2005 Sales $ 1,762 $ 1,752 $ 1,816 $ 1,729Gross profit 399 374 352 279Asset impairment and restructuring charges 9 10 4 10Net earnings (loss) 162 206 123 66 Net earnings (loss) per share (1)
Basic $ 2.04 $ 2.55 $ 1.51 $ 0.81Diluted $ 2.00 $ 2.51 $ 1.50 $ 0.81
(1) Each quarter is calculated as a discrete period; the sum of the four quarters may not equal the calculated full-year amount.(2) In fourth quarter, the Company completed the sale of its Batesville, Arkansas manufacturing site and related businesses and its PE
and Epolene polymer businesses, related assets and ethylene pipeline located at Longview, Texas.
114
Source: EASTMAN CHEMICAL CO, 10-K, March 01, 2007

NOTES TO THE AUDITED CONSOLIDATED FINANCIAL STATEMENTS
23. RECENTLY ISSUED ACCOUNTING STANDARDS
In February 2006, the FASB issued SFAS No. 155, “Accounting for Certain Hybrid Financial Instruments,” an amendment of SFASNo. 133, "Accounting for Derivative Instruments and Hedging Activities," and SFAS No. 140, "Accounting for Transfers andServicing of Financial Assets and Extinguishment of Liabilities." SFAS No. 155 simplifies accounting for certain hybrid instrumentsunder SFAS No. 133 by permitting fair value remeasurement for financial instruments containing an embedded derivative thatotherwise would require bifurcation. SFAS No. 155 eliminates both the previous restriction under SFAS No. 140 on passive derivativeinstruments that a qualifying special-purpose entity may hold and SFAS No. 133 Implementation Issue No. D1, “Application ofStatement 133 to Beneficial Interests in Securitized Financial Assets,” which provides that beneficial interests are not subject to theprovisions of SFAS No. 133. SFAS No. 155 also establishes a requirement to evaluate interests in securitized financial assets toidentify interests that are freestanding derivatives or that are hybrid financial instruments that contain an embedded derivativerequiring bifurcation, and clarifies that concentrations of credit risk in the form of subordination are not imbedded derivatives. SFASNo. 155 is effective for all financial instruments acquired, issued, or subject to a remeasurement event occurring after the beginning ofan entity’s fiscal year that begins after September 15, 2006. The Company has evaluated the effect of SFAS No. 155 and determinedthat it does not expect a material impact from the adoption to its consolidated financial position, liquidity, or results from operations
In March 2006, the FASB issued SFAS No. 156, “Accounting for Servicing of Financial Assets,” an amendment of SFAS No. 140.SFAS No. 156 permits entities to choose to either subsequently measure servicing rights at fair value and report changes in fair valuein earnings or amortize servicing rights in proportion to and over the estimated net servicing income or loss and assess to rights forimpairment or the need for an increased obligation. SFAS No. 156 also clarifies when a servicer should separately recognize servicingassets and liabilities; requires all separately recognized assets and liabilities to be initially measured at fair value, if practicable;permits a one-time reclassification of available-for-sales securities to trading securities by an entity with recognized servicing rightsand requires additional disclosures for all separately recognized servicing assets and liabilities. SFAS No. 156 is effective as of thebeginning of an entity’s fiscal year that begins after September 15, 2006. The Company has evaluated the effect of SFAS No. 156 anddetermined that it does not expect a material impact from the adoption to its consolidated financial position, liquidity, or results fromoperations.
In July 2006, the FASB issued Interpretation No. 48 ("FIN 48"), "Accounting for Uncertainty in Income Taxes—an Interpretation ofSFAS 109 "Accounting for Income Taxes". FIN 48 prescribes a comprehensive model for how a company should recognize, measure,present, and disclose in its financial statements uncertain tax positions that a company has taken or expects to take on a tax return.Under FIN 48, the financial statements will reflect expected future tax consequences of such positions presuming the taxingauthorities' full knowledge of the position and all relevant facts, but without considering time values. FIN 48 also revises disclosurerequirements and introduces a prescriptive, annual, tabular roll-forward of the unrecognized tax benefits. FIN 48 is effective for fiscalyears beginning after December 15, 2006. The Company does not expect the adoption of FIN 48 to have a material effect on itsconsolidated financial position, liquidity, or results of operations.
In September 2006, the FASB issued SFAS No. 157, "Fair Value Measurements," which addresses the measurement of fair value bycompanies when they are required to use a fair value measure for recognition or disclosure purposes under GAAP. SFAS No. 157provides a common definition of fair value to be used throughout GAAP which is intended to make the measurement of fair valuemore consistent and comparable and improve disclosures about those measures. SFAS No. 157 will be effective for an entity'sfinancial statements issued for fiscal years beginning after November 15, 2007. The Company is currently evaluating the effect SFASNo. 157 will have on its consolidated financial position, liquidity, or results of operations.
115
Source: EASTMAN CHEMICAL CO, 10-K, March 01, 2007

NOTES TO THE AUDITED CONSOLIDATED FINANCIAL STATEMENTS
In September 2006, the FASB issued Staff Position No. AUG AIR-1 ("FSP No. AUG AIR-1") which addresses the accounting forplanned major maintenance activities. FSP No. AUG AIR-1 amends certain provisions in the American Institute of Certified PublicAccountants ("AICPA") Industry Audit Guide and APB Opinion No. 28, "Interim Financial Reporting". Four alternative methods ofaccounting for planned major maintenance activities were permitted: direct expense, built-in overhaul, deferral, and accrual("accrue-in-advance"). This FSP prohibits the use of the accrue-in-advance method of accounting for planned major maintenanceactivities because it results in the recognition of a liability in a period prior to the occurrence of the transaction or event obligating theentity. FSP No. AUG AIR-1 is effective for an entity's financial statements issued for fiscal years beginning after December 15, 2006.The Company does not utilize the accrue-in-advance method of accounting and therefore expects this FSP to have no impact on itsconsolidated financial position, liquidity, or results of operations.
In February, 2007, the FASB issued SFAS No. 159, "The Fair Value Option for Financial Assets and Financial Liabilities—Includingan amendment of FASB Statement No. 115." SFAS No. 159 permits companies to choose to measure many financial instruments andcertain other items at fair value at specified election dates. Upon adoption, an entity shall report unrealized gains and losses on itemsfor which the fair value option has been elected in earnings at each subsequent reporting date. Most of the provisions apply only toentities that elect the fair value option. However, the amendment to SFAS No. 115, "Accounting for Certain Investments in Debt andEquity Securities," applies to all entities with available for sale and trading securities. SFAS No. 159 will be effective as of thebeginning of an entity's first fiscal year that begins after November 15, 2007. The Company is currently evaluating the effect SFASNo. 159 will have on its consolidated financial position, liquidity, or results of operations.
24. DIVESTITURE
Certain Businesses and Product Lines and Related Assets in CASPI, PCI, and Performance Polymers Segments On October 31, 2006, the Company sold its Batesville, Arkansas manufacturing facility and related assets and the specialty organicchemicals product lines in the PCI segment for net proceeds of approximately $74 million and an earn-out provision based onbiodiesel sales over the next three years. The Company also retained approximately $9 million of accounts receivable related to thesebusinesses and product lines. The final purchase price is subject to change based upon working capital adjustments. The Company willcontinue to produce certain products for the buyer under ongoing supply agreements and purchase certain products from the buyerunder ongoing purchase agreements with terms up to five years. In addition, the Company indemnified the buyer against certainliabilities primarily related to taxes, legal matters, environmental matters, and other representations and warranties. As of December31, 2006, the Company has recorded a $7 million loss related to this transaction. Changes in estimates will be reflected in futureperiods. On November 30, 2006, the Company sold its PE and Epolene polymer businesses and related assets located at the Longview, Texassite and the Company's ethylene pipeline in the CASPI and Performance Polymers segments for net proceeds of approximately $235million. The Company also retained approximately $83 million of accounts receivable related to these businesses and product lines.The final purchase price is subject to change based upon working capital adjustments. The Company will continue to produce certainproducts for the buyer under ongoing supply agreements and purchase certain products from the buyer under ongoing purchaseagreements with terms up to ninety-nine years. As part of these agreements, the Company also expects to begin a staged phase-out ofolder cracking units in 2007, with timing dependent in part on market conditions, resulting in accelerated depreciation andenvironmental closure obligations. In addition, the Company indemnified the buyer against certain liabilities primarily related to taxes,legal matters, environmental matters, and other representations and warranties. As of December 31, 2006, the Company has recorded again of $75 million related to this transaction. However, changes in estimates will be reflected in future periods.
116
Source: EASTMAN CHEMICAL CO, 10-K, March 01, 2007
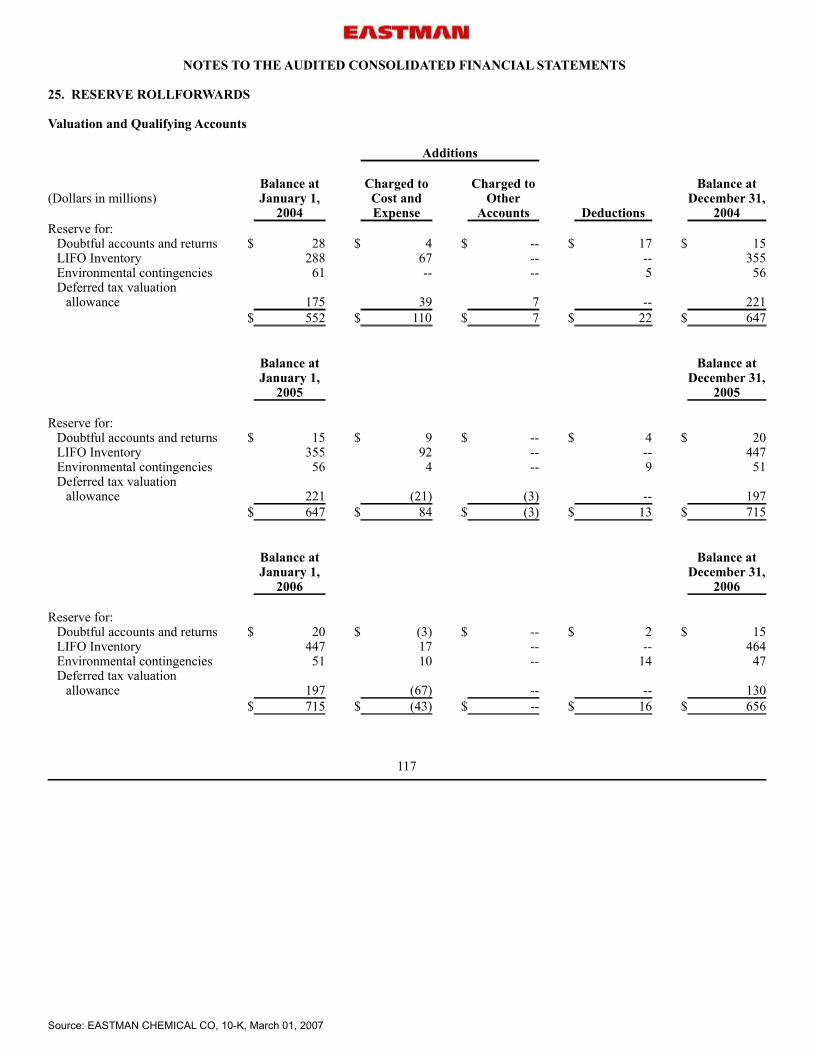
NOTES TO THE AUDITED CONSOLIDATED FINANCIAL STATEMENTS
25. RESERVE ROLLFORWARDS
Valuation and Qualifying Accounts
Additions (Dollars in millions)
Balance atJanuary 1,
2004
Charged toCost andExpense
Charged to
OtherAccounts
Deductions
Balance at
December 31,2004
Reserve for: Doubtful accounts and returns $ 28 $ 4 $ -- $ 17 $ 15LIFO Inventory 288 67 -- -- 355Environmental contingencies 61 -- -- 5 56Deferred tax valuation
allowance 175 39 7 -- 221 $ 552 $ 110 $ 7 $ 22 $ 647
Balance atJanuary 1,
2005
Balance at
December 31,2005
Reserve for:
Doubtful accounts and returns $ 15 $ 9 $ -- $ 4 $ 20LIFO Inventory 355 92 -- -- 447Environmental contingencies 56 4 -- 9 51Deferred tax valuation
allowance 221 (21) (3) -- 197 $ 647 $ 84 $ (3) $ 13 $ 715
Balance atJanuary 1,
2006
Balance at
December 31,2006
Reserve for:
Doubtful accounts and returns $ 20 $ (3) $ -- $ 2 $ 15LIFO Inventory 447 17 -- -- 464Environmental contingencies 51 10 -- 14 47Deferred tax valuation
allowance 197 (67) -- -- 130 $ 715 $ (43) $ -- $ 16 $ 656
117
Source: EASTMAN CHEMICAL CO, 10-K, March 01, 2007

NOTES TO THE AUDITED CONSOLIDATED FINANCIAL STATEMENTS
26. SUBSEQUENT EVENTS
In first quarter 2007, the Company entered into an agreement to sell the San Roque, Spain manufacturing facility. The agreementimpacts approximately $40 million of fixed assets and could lead to non-cash impairment charges in the first quarter of 2007. Inaddition, this agreement could result in restructuring charges, which would result in future cash expenditures. The restructuringcharges are not expected to exceed $10 million. Management expects the underlying costs of and charges related to this decision to bereported as asset impairment and restructuring charges during the first quarter of 2007.
118
Source: EASTMAN CHEMICAL CO, 10-K, March 01, 2007

ITEM 9. CHANGES IN AND DISAGREEMENTS WITH ACCOUNTANTS ON ACCOUNTING AND FINANCIALDISCLOSURE
None.
ITEM 9A. CONTROLS AND PROCEDURES
Disclosure Controls and ProceduresEastman Chemical Company ("Eastman" or "The Company") maintains a set of disclosure controls and procedures designed to ensurethat information required to be disclosed by the Company in reports that it files or submits under the Securities Exchange Act of 1934is recorded, processed, summarized, and reported, within the time periods specified in Securities and Exchange Commission rules andforms. An evaluation was carried out under the supervision and with the participation of the Company's management, including theChief Executive Officer ("CEO") and Chief Financial Officer ("CFO"), of the effectiveness of the Company’s disclosure controls andprocedures. Based on that evaluation, the CEO and CFO have concluded that the Company's disclosure controls and procedures areeffective as of December 31, 2006.
Management’s Report on Internal Control Over Financial ReportingManagement of the Company is responsible for establishing and maintaining adequate internal control over financial reporting. TheCompany’s internal control over financial reporting is a process designed under the supervision of the Company’s CEO and CFO toprovide reasonable assurance regarding the reliability of financial reporting and the preparation of the Company’s financial statementsfor external purposes in accordance with U.S. generally accepted accounting principles.
The Company’s internal control over financial reporting includes policies and procedures that:
Pertain to the maintenance of records that, in reasonable detail, accurately and fairly reflect transactions and dispositions of assetsof the Company;
Provide reasonable assurance that transactions are recorded as necessary to permit preparation of financial statements inaccordance with U.S. generally accepted accounting principles, and that receipts and expenditures of the Company are beingmade only in accordance with authorizations of management and the directors of the Company; and
Provide reasonable assurance regarding prevention or timely detection of unauthorized acquisition, use or disposition of theCompany’s assets that could have a material effect on the Company’s financial statements.
Management has assessed the effectiveness of its internal control over financial reporting as of December 31, 2006 based on theframework established in Internal Control - Integrated Framework issued by the Committee of Sponsoring Organizations of theTreadway Commission (“COSO”). Based on this assessment, management has determined that the Company’s internal control overfinancial reporting was effective as of December 31, 2006.
Management’s assessment of the effectiveness of the Company’s internal control over financial reporting as of December 31, 2006has been audited by PricewaterhouseCoopers LLP, an independent registered public accounting firm, as stated in their report whichappears herein.
Changes in Internal Control Over Financial ReportingThere has been no change in the Company’s internal control over financial reporting that occurred during the fourth quarter of 2006that has materially affected, or is reasonably likely to materially affect, the Company’s internal control over financial reporting. ITEM 9B. OTHER INFORMATION
None.
119
Source: EASTMAN CHEMICAL CO, 10-K, March 01, 2007

PART III
ITEM 10. DIRECTORS, EXECUTIVE OFFICERS AND CORPORATE GOVERNANCE
The material under the heading "Proposals to be Voted On at the Annual Meeting--Item 1--Election of Directors" to (but notincluding) the subheading "Information About the Board of Directors and Corporate Governance" and under the subheading "BoardCommittees--Audit Committee" (except for the material under the subheading "Board Committees--Audit Committee--AuditCommittee Report", which is not incorporated by reference herein)., each as included and to be filed in the 2007 Proxy Statement, isincorporated by reference herein in response to this Item. Certain information concerning executive officers of the Company is setforth under the heading "Executive Officers of the Company" in Part I of this Annual Report. The Company has adopted a Code of Ethics and Business Conduct applicable to the Chief Executive Officer, the Chief FinancialOfficer and the Controller of the Company. See “Part I - Item 1. Business - Available Information - SEC Filings and CorporateGovernance Materials”.
ITEM 11. EXECUTIVE COMPENSATION
The material under the heading "Proposals to be Voted On at the Annual Meeting--Item 1--Election of Directors—Board Committees- Compensation and Management Development Committee - Compensation Committee Report", under the subheading "DirectorCompensation" and under the heading "Executive Compensation", each as included and to be filed in the 2007 Proxy Statement, isincorporated by reference herein in response to this Item.
ITEM 12. SECURITY OWNERSHIP OF CERTAIN BENEFICIAL OWNERS AND MANAGEMENT AND RELATEDSTOCKHOLDER MATTERS
The material under the headings "Stock Ownership of Directors and Executive Officers--Common Stock" and "Principal Stockholders" as included and to be filed in the 2007 definitive Proxy Statement is incorporated by reference herein in response to this Item.
SECURITIES AUTHORIZED FOR ISSUANCE UNDER EQUITY COMPENSATION PLANS
Equity Compensation Plans Approved by Stockholders
Stockholders approved the Company’s 1994, 1997, and 2002 Omnibus Long-Term Compensation Plans; the 1994, 1999, and 2002Director Long-Term Compensation Plans; and the 1996 Non-Employee Director Stock Option Plan. Although stock and stock-basedawards are still outstanding under the 1994 and 1997 Omnibus Long-Term Compensation Plans, as well as the 1994 and 1999Director Long-Term Compensation Plans, no new shares are available under these plans for future grants.
Equity Compensation Plans Not Approved by Stockholders Stockholders have approved all compensation plans under which shares of Eastman common stock may be issued.
120
Source: EASTMAN CHEMICAL CO, 10-K, March 01, 2007

Summary Equity Compensation Plan Information Table
The following table sets forth certain information as of December 31, 2006 with respect to compensation plans under which shares ofEastman common stock may be issued.
Plan Category
Number of Securitiesto be Issued upon
Exercise ofOutstanding Options
(a)
Weighted-AverageExercise Price of
Outstanding Options(b)
Number of SecuritiesRemaining Available forFuture Issuance UnderEquity Compensation
Plans (Excluding Securitiesreflected in Column (a))
(c)
Equity compensation plans
approved by stockholders
5,866,900 (1) $52 1,244,900 (2) Equity compensation plans
not approved bystockholders
-- -- --
TOTAL 5,866,900 $52 1,244,900
(1) Represents shares of common stock issuable upon exercise of outstanding options granted under Eastman Chemical Company’s1994, 1997, and 2002 Omnibus Long-Term Compensation Plans; the 1994, 1999, and 2002 Director Long-Term CompensationPlans; and the 1996 Non-Employee Director Stock Option Plan.
(2) Shares of common stock available for future grants under the Company’s 2002 Omnibus Long-Term Compensation Plan, the2002 Director Long-Term Compensation Plan, and the 1996 Non-Employee Director Stock Option Plan.
ITEM 13. CERTAIN RELATIONSHIPS AND RELATED TRANSACTIONS, AND DIRECTOR INDEPENDENCE
The material under the heading "Proposals to be Voted On at the Annual Meeting--Item 1--Election of Directors ", subheadings"Director Independence " and "Transactions with Directors, Executive Officers, and Related Persons", each as included and to be filedin the 2007 Proxy Statement, is incorporated by reference herein in response to this Item.
ITEM 14. PRINCIPAL ACCOUNTING FEES AND SERVICES
The information concerning amounts billed for professional services rendered by the principal accountant and pre-approval of suchservices by the Audit Committee of the Company’s Board of Directors under the heading "Item 2 - Ratification of Appointment ofIndependent Accountants" as included and to be filed in the 2007 Proxy Statement is incorporated by reference herein in response tothis Item.
121
Source: EASTMAN CHEMICAL CO, 10-K, March 01, 2007

PART IV
ITEM 15. EXHIBITS AND FINANCIAL STATEMENT SCHEDULES
Page(a) 1. Consolidated Financial Statements: Management's Responsibility for Financial Statements 68 Report of Independent Registered Public Accounting Firm 69 Consolidated Statements of Earnings, Comprehensive
Income, and Retained Earnings
71 Consolidated Statements of Financial Position 72 Consolidated Statements of Cash Flows 73 Notes to Company’s Consolidated Financial Statements 74 2. Exhibits filed as part of this report are listed in the Exhibit
Index beginning at page 125 125
(b) The Exhibit Index and required Exhibits to this report are included
beginning at page 125
122
Source: EASTMAN CHEMICAL CO, 10-K, March 01, 2007
SIGNATURES
Pursuant to the requirements of Section 13 or 15(d) of the Securities Exchange Act of 1934, the registrant has duly caused this reportto be signed on its behalf by the undersigned, thereunto duly authorized.
Eastman Chemical Company By: /s/ J. Brian Ferguson J. Brian Ferguson Chairman of the Board and Chief Executive Officer Date: February 28, 2007
Pursuant to the requirements of the Securities Exchange Act of 1934, this report has been signed below by the following persons onbehalf of the registrant and in the capacities and on the dates indicated.
SIGNATURE TITLE DATE PRINCIPAL EXECUTIVE OFFICER: /s/ J. Brian Ferguson Chairman of the Board of Directors February 28, 2007
J. Brian Ferguson and Chief Executive Officer PRINCIPAL FINANCIAL OFFICER: /s/ Richard A. Lorraine Senior Vice President and February 28, 2007
Richard A. Lorraine Chief Financial Officer PRINCIPAL ACCOUNTING OFFICER: /s/ Curtis E. Espeland Vice President, Finance and February 28, 2007
Curtis E. Espeland Chief Accounting Officer
123
Source: EASTMAN CHEMICAL CO, 10-K, March 01, 2007

SIGNATURE TITLE DATE DIRECTORS:
/s/ Michael P. Connors Director February 28, 2007Michael P. Connors
/s/ Stephan R. Demeritt Director February 28, 2007
Stephen R. Demeritt
/s/ Donald W. Griffin Director February 28, 2007Donald W. Griffin
/s/ Robert M. Hernandez Director February 28, 2007
Robert M. Hernandez
/s/ Renee J. Hornbaker Director February 28, 2007Renẻe J. Hornbaker
/s/ Lewis M. Kling Director February 28, 2007
Lewis M. Kling
/s/ Howard L. Lance Director February 28, 2007Howard L. Lance
/s/ Thomas H. McLain Director February 28, 2007
Thomas H. McLain
/s/ David W. Raisbeck Director February 28, 2007David W. Raisbeck
/s/ Peter M. Wood Director February 28, 2007
Peter M. Wood
124
Source: EASTMAN CHEMICAL CO, 10-K, March 01, 2007

EXHIBIT INDEX Sequential
Exhibit
Page
Number
Description
Number
3.01 Amended and Restated Certificate of Incorporation of Eastman Chemical Company, as
amended (incorporated herein by reference to Exhibit 3.01 to Eastman Chemical Company'sQuarterly Report on Form 10-Q for the quarter ended June 30, 2001)
3.02 Amended and Restated Bylaws of Eastman Chemical Company, as amended October 4, 2006(incorporated herein by referenced to Exhibit 3.02 to Eastman Chemical Company’s QuarterlyReport on Form 10-Q for the quarter ended September 30, 2006 (the “September 30, 200610-Q”)
4.01 Form of Eastman Chemical Company common stock certificate as amended February 1, 2001(incorporated herein by reference to Exhibit 4.01 to Eastman Chemical Company’s QuarterlyReport on Form 10-Q for the quarter ended March 31, 2001)
4.02 Indenture, dated as of January 10, 1994, between Eastman Chemical Company and The Bankof New York, as Trustee (the "Indenture") (incorporated herein by reference to Exhibit 4(a) toEastman Chemical Company's Current Report on Form 8-K dated January 10, 1994 (the"8-K"))
4.03 Form of 7 1/4% Debentures due January 15, 2024 (incorporated herein by reference to Exhibit4(d) to the 8-K)
4.04 Officers’ Certificate pursuant to Sections 201 and 301 of the Indenture (incorporated herein by
reference to Exhibit 4(a) to Eastman Chemical Company's Current Report on Form 8-K datedJune 8, 1994 (the "June 8-K"))
4.05 Form of 7 5/8% Debentures due June 15, 2024 (incorporated herein by reference to Exhibit4(b) to the June 8-K)
4.06 Form of 7.60% Debentures due February 1, 2027 (incorporated herein by reference to Exhibit
4.08 to Eastman Chemical Company's Annual Report on Form 10-K for the year endedDecember 31, 1996 (the "1996 10-K"))
4.07 Form of 7% Notes due April 15, 2012 (incorporated herein by reference to Exhibit 4.09 toEastman Chemical Company's Quarterly Report on Form 10-Q for the quarter ended March31, 2002)
4.08 Officer's Certificate pursuant to Sections 201 and 301 of the Indenture related to 7.60%Debentures due February 1, 2027 (incorporated herein by reference to Exhibit 4.09 to the 199610-K)
4.09 $200,000,000 Accounts Receivable Securitization agreement dated April 13, 1999 (amendedApril 11, 2000), between the Company and Bank One, N.A., as agent. Pursuant to Item601(b)(4)(iii) of Regulation S-K, in lieu of filing a copy of such agreement, the Companyagrees to furnish a copy of such agreement to the Commission upon request
4.10 Amended and Restated Credit Agreement, dated as of April 3, 2006 (the "Credit Agreement")among Eastman Chemical Company, the Lenders named therein, and Citigroup GlobalMarkets , Inc. and J. P. Morgan Securities Inc., as joint lead arrangers (incorporated herein byreference to Exhibit 4.11 to Eastman Chemical Company's Quarterly Report on Form 10-Q forthe quarter ended June 30, 2006)
125
Source: EASTMAN CHEMICAL CO, 10-K, March 01, 2007

EXHIBIT INDEX SequentialExhibit
Page
Number
Description
Number
4.11 Form of 3 ¼% Notes due June 16, 2008 (incorporated herein by reference toExhibit 4.13 to Eastman Chemical Company’s Quarterly Report on Form 10-Qfor the quarter ended June 30, 2003)
4.12 Form of 6.30% Notes due 2018 (incorporated herein by reference to Exhibit
4.14 to Eastman Chemical Company’s Quarterly Report on Form 10-Q for thequarter ended September 30, 2003)
10.01* 1996 Non-Employee Director Stock Option Plan (incorporated herein by
reference to Exhibit 10.02 to Eastman Chemical Company's Quarterly Reporton Form 10-Q for the quarter ended September 30, 1996)
10.02* Employment Agreement between Eastman Chemical Company and James P.
Rogers (incorporated herein by reference to Exhibit 10.02 to EastmanChemical Company's Quarterly Report on Form 10-Q for the quarter endedSeptember 30, 1999)
10.03* Eastman Excess Retirement Income Plan, amended and restated effective
January 1, 2002 (incorporated herein by reference to Exhibit 10.10 to EastmanChemical Company's Annual Report on Form 10-K for the year endedDecember 31, 2001, (the "2001 10-K"))
10.04* Form of Executive Severance Agreements (incorporated herein by reference to
Exhibit 99.01 to Eastman Chemical Company's Current Report on Form 8-Kdated December 5, 2005)
10.05* Eastman Unfunded Retirement Income Plan, amended and restated effective
January 1, 2002 (incorporated herein by reference to Exhibit 10.11 to the 200110-K)
10.06* 2002 Omnibus Long-Term Compensation Plan (incorporated herein by
reference to Appendix A to Eastman Chemical Company’s 2002 AnnualMeeting Proxy Statement)
10.07* 2002 Director Long-Term Compensation Plan, as amended (incorporated
herein by reference to Appendix A to Eastman Chemical Company’s 2002Annual Meeting Proxy Statement)
10.08* Amended and Restated Eastman Chemical Company Benefit Security Trust
dated January 2, 2002 (incorporated herein by reference to Exhibit 10.04 toEastman Chemical Company's Quarterly Report on Form 10-Q for the quarterended September 30, 2002, (the "September 30, 2002 10-Q")
10.09* Amended and Restated Warrant to Purchase Shares of Common Stock of
Eastman Chemical Company, dated January 2, 2002 (incorporated herein byreference to Exhibit 10.02 to the September 30, 2002 10-Q)
10.10* Amended and Restated Registration Rights Agreement, dated January 2, 2002
(incorporated herein by reference to Exhibit 10.03 to the September 30, 200210-Q)
10.11* Notice of Restricted Stock Granted October 7, 2002 (incorporated herein by
reference to Exhibit 10.01 to the September 30, 2002 10-Q)
126
Source: EASTMAN CHEMICAL CO, 10-K, March 01, 2007

EXHIBIT INDEX Sequential
Exhibit
Page
Number
Description
Number
10.12* Amended and Restated Eastman Executive Deferred Compensation Plan
(incorporated herein by referenced to Exhibit 10.05 to Eastman ChemicalCompany’s Annual Report on Form 10-K for the year ended December 31,2002)
10.13* Amended Director Deferred Compensation Plan (incorporated herein by
reference to Exhibit 10.02 to Eastman Chemical Company’s Annual Report onForm 10-K for the year ended December 31, 2002)
10.14* Eastman Unit Performance Plan as amended and restated January 1, 2004
(incorporated herein by reference to Exhibit 10.09 to Eastman ChemicalCompany's Annual Report on Form 10-K for the year ended December 31,2003 (the "2003 10-K"))
10.15* Form of Indemnification Agreements with Directors and Executive Officers
(incorporated herein by reference to Exhibit 10.25 to the 2003 10-K)
10.16* Form of Performance Share Awards to Executive Officers (2004-2006
Performance Period) (incorporated herein by reference to Exhibit 10.33 to the2003 10-K)
10.17* Form of Performance Share Awards to Executive Officers (2005 - 2007
Performance Period) (incorporated herein by reference to Exhibit 10.02 to theSeptember 30, 2004 10-Q)
10.18* Form of Performance Share Awards to Executive Officers (2006 - 2008
Performance Period) (incorporated herein by reference to Exhibit 10.04 toEastman Chemical Company's Quarterly Report on Form 10-Q for the quarterended September 30, 2005)
10.19* Unit Performance Plan ("UPP") performance measures and goals, specific
target objectives with respect to such performance goals, the method forcomputing the amount of the UPP award allocated to the award pool if theperformance goals are attained, and the eligibility criteria for employeeparticipation in the UPP, for the 2006 performance year (incorporated herein byreference to Eastman Chemical Company’s Current Report on Form 8-K datedDecember 6, 2005)
10.20* Employment Agreement between Eastman Chemical Company and Mark J.Costa dated May 4, 2006 (incorporated herein by reference to Exhibit 10.01 toEastman Chemical Company's Quarterly Report on Form 10-Q for the quarterended June 30, 2006 (the "June 30, 2006 10-Q")
10.21* Notice of Restricted Stock Awarded to Mark J. Costa on June 1, 2006(incorporated herein by reference to Exhibit 10.02 to the June 30, 2006 10-Q)
10.22* Notice of Stock Option Granted to Mark J. Costa on June 1, 2006 (incorporated
herein by reference to Exhibit 10.03 to the June 30, 2006 10-Q)
10.23* Form of Award Notice for Stock Options Granted to Executive Officers(incorporated herein by reference to Exhibit 10.01 to the September 30, 200610-Q)
10.24* Form of Award Notice for Stock Option Granted to Mark J. Costa, SeniorVice-President, Corporate Strategy and Marketing (incorporated herein byreference to Exhibit 10.02 to the September 30, 2006 10-Q)
127
Source: EASTMAN CHEMICAL CO, 10-K, March 01, 2007

Source: EASTMAN CHEMICAL CO, 10-K, March 01, 2007

EXHIBIT INDEX SequentialExhibit
Page
Number
Description
Number
10.25* Form of Performance Share Awards to Executive Officers (2007 - 2009Performance Period) (incorporated herein by reference to Exhibit 10.03 to theSeptember 30, 2006 10-Q)
10.26* Form of Performance Share Award to Mark J. Costa, Senior Vice-President,
Corporate Strategy and Marketing (2007-2009 Performance Period)(incorporated herein by reference to Exhibit 10.04 to the September 30, 200610-Q)
10.27* Unit Performance Plan ("UPP") performance measures and goals, specific targetobjectives with respect to such performance goals, the method for computing theamount of the UPP award allocated to the award pool if the performance goalsare attained, and the eligibility criteria for employee participation in the UPP, forthe 2007 performance year (incorporated herein by reference to EastmanChemical Company’s Current Report on Form 8-K dated December 7, 2006)
12.01 Statement re: Computation of Ratios of Earnings (Loss) to Fixed Charges 129
21.01 Subsidiaries of the Company 130 - 132
23.01 Consent of Independent Registered Public Accounting Firm 133
31.01 Rule 13a - 14(a) Certification by J. Brian Ferguson, Chairman of the Board andChief Executive Officer, for the year ended December 31, 2006
134
31.02 Rule 13a - 14(a) Certification by Richard A. Lorraine, Senior Vice President and
Chief Financial Officer, for the year ended December 31, 2006 135
32.01 Section 1350 Certification by J. Brian Ferguson, Chairman of the Board and
Chief Executive Officer, for the year ended December 31, 2006 136
32.02 Section 1350 Certification by Richard A. Lorraine, Senior Vice President and
Chief Financial Officer, for the year ended December 31, 2006
137
99.01 Eastman Chemical Company detail of sales revenue 138 * Management contract or compensatory plan or arrangement filed pursuant to Item 601(b) (10) (iii) of Regulation S-K.
128
Source: EASTMAN CHEMICAL CO, 10-K, March 01, 2007

EXHIBIT 12.01
EASTMAN CHEMICAL COMPANY AND SUBSIDIARIES
Computation of Ratios of Earnings (Loss) to Fixed Charges
Dollars in millions) 2006 2005 2004 2003 2002 Earnings (loss) before income taxes and
cumulative effect of change inaccounting principle $
576 $
783 $
64 $
(381) $
84Add:
Interest expense 105 113 123 130 128Appropriate portion of rental expense(1)
21 21 21 21 28
Amortization of capitalized interest 11 11 15 12 13Earnings (loss) as adjusted $ 713 $ 928 $ 223 $ (218) $ 253 Fixed charges:
Interest expense $ 105 $ 113 $ 123 $ 130 $ 128Appropriate portion of rental expense(1)
21 21 21 21 28
Capitalized interest 7 5 3 3 4Total fixed charges $ 133 $ 139 $ 147 $ 154 $ 160 Ratio of earnings (loss) to fixed charges 5.4x 6.7x 1.5x (A) 1.6x (1) For all periods presented, the interest component of rental expense is estimated to equal one-third of such expense. (A) Due to the net loss reported, the coverage ratio was less than 1x. To achieve a coverage ratio of 1x, additional pre-tax earnings of
$372 million would have been required for 2003.
129
Source: EASTMAN CHEMICAL CO, 10-K, March 01, 2007

Exhibit 21.01EASTMAN CHEMICAL COMPANY
SUBSIDIARIES
NAME OF SUBSIDIARY
JURISDICTION OF INCORPORATION
OR ORGANIZATION Altovar Ltd. United KingdomCendian Corporation DelawareCendian Argentina, S.R.L. ArgentinaCendian Asia Pacific Pte Ltd SingaporeCendian de Mexico, S. DE. R.L. DE C.V. MexicoCendian do Brasil Ltda BrazilCendian International, Inc. DelawareCendian Servicious, S. DE R.L. DE C.V. MexicoEastman Belgium B.V.B.A. Belgium (Kallo)Eastman Benelux B.V.B.A. Belgium (Kallo)Eastman Cayman Financial Services Limited Cayman IslandsEastman Chemical, Asia Pacific Pte. Ltd. SingaporeEastman Chemical (Malaysia) Sdn. Bhd. MalaysiaEastman Chemical B.V. NetherlandsEastman Chemical Barcelona, S.A. SpainEastman Chemical Canada, Inc. CanadaEastman Chemical Company Foundation, Inc. DelawareEastman Chemical Company Investments, Inc. DelawareEastman Chemical Deutschland GmbH GermanyEastman Chemical, Europe, Middle East, and Africa, Ltd DelawareEastman Chemical Financial Corporation DelawareEastman Chemical Finland Oy FinlandEastman Chemical Holding GmbH GermanyEastman Chemical Holdings, S.A. de C.V. MexicoEastman Chemical Italia S.r.l. ItalyEastman Chemical Japan Limited JapanEastman Chemical Korea Ltd. KoreaEastman Chemical Latin America, Inc. DelawareEastman Chemical Ltd. New YorkEastman Chemical Luxembourg S.a.r.l. LuxembourgEastman Chemical Middelburg, B.V. NetherlandsEastman Chemical Resins, Inc. DelawareEastman Chemical Singapore Pte. Ltd. SingaporeEastman Chemical Uruapan, S.A. de C.V. MexicoEastman Cogen Management L.L.C. Texas
130
Source: EASTMAN CHEMICAL CO, 10-K, March 01, 2007

Exhibit 21.01EASTMAN CHEMICAL COMPANY
SUBSIDIARIES
NAME OF SUBSIDIARY
JURISDICTION OFINCORPORATION
OR ORGANIZATION Eastman Cogeneration L.P. TexasEastman Company DelawareEastman Company UK Limited United KingdomEastman do Brasil Ltda. BrazilEastman Espana S. L. SpainEastman Gasification Services Company DelawareEastman International Management Company TennesseeEastman Malta Limited MaltaEastman Netherlands B.V. NetherlandsEastman Servicios Corporativos, S.A. de C.V. MexicoEastman Resins and Polymers (Canada) Company CanadaEastman (Shanghai) Chemical Commercial Co., Ltd. ChinaEastman (Shanghai) Chemical Trading Co., Ltd. ChinaEnterprise Genetics, Inc. NevadaGLC Associates NevadaHartlepet Limited United KingdomHolston Defense Corporation VirginiaJager Chemie France S.A.R.L. FranceKingsport Hotel, L.L.C. TennesseeLawter International Products, Pte. Ltd. SingaporeMcWhorter Holdings Ltd. United KingdomMustang Pipeline Company TexasNanjing Yangzi Eastman Chemical Ltd. ChinaPinto Pipeline Company of Texas TexasPrimester New YorkQilu Eastman Specialty Chemicals, Ltd ChinaShanghai Eastman Consulting Company Ltd ChinaVoridian (Gibraltar) Limited United KingdomVoridian (U.K.) United KingdomVoridian AG - now Eastman Chemical International AG SwitzerlandVoridian Argentina S.R.L. - now Eastman Chemical ArgentinaS.R.L.
Argentina
Voridian Canada Company - now Eastman Chemical CanadaDistribution Company
Nova Scotia
Voridian de Mexico, S.A. de C.V. - now Eastman de Mexico, S.A.de C.V.
Mexico
Voridian do Brasil Ltda. - now Eastman Chemical do Brasil Ltda Brazil - partnershipVoridian England Ltd. - now Eastman Chemical England Limited United Kingdom
131
Source: EASTMAN CHEMICAL CO, 10-K, March 01, 2007

Exhibit 21.01EASTMAN CHEMICAL COMPANY
SUBSIDIARIES
NAME OF SUBSIDIARY
JURISDICTION OFINCORPORATION
OR ORGANIZATION Voridian Espana S.A. - now Eastman Chemical Iberia, S.A. SpainVoridian Europoort B.V. - Eastman Chemical Europoort, B.V. NetherlandsVoridian Holdings S.L. - Eastman Chemical Holdings Spain, S.L. SpainVoridian Holdings U.K. Limited (the correct name was Voridian(U.K.), the current name is Eastman Chemical Regional UK
United Kingdom
Voridian Hong Kong Limited - now Eastman Chemical HKLimited
Hong Kong
Voridian International, Limited United KingdomVoridian Polymer Ltd. - now Eastman Chemical Workington Ltd. United KingdomVoridian Singapore Pte. Ltd. - now Eastman Chemical RegionalPte. Ltd.
Singapore
Voridian Spain L.L.C. - now Eastman Spain L.L.C. DelawareWorkington Investments Limited United Kingdom
132
Source: EASTMAN CHEMICAL CO, 10-K, March 01, 2007

EXHIBIT 23.01
EASTMAN CHEMICAL COMPANY AND SUBSIDIARIES
Consent of Independent Registered Public Accounting Firm
We hereby consent to the incorporation by reference in the Registration Statements on Form S-3 (No. 333-113693 and No.333-62597) and Form S-8 (No. 33-73808, No. 33-73810, No. 33-73812, No. 33-77844 and No. 333-124558) of Eastman ChemicalCompany of our report dated February 28, 2007, relating to the financial statements, management’s assessment of the effectiveness ofinternal control over financial reporting and the effectiveness of internal control over financial reporting, which appears in this Form10-K. /s/ PricewaterhouseCoopers, LLPPRICEWATERHOUSECOOPERS, LLPPhiladelphia, PennsylvaniaFebruary 28, 2007
133
Source: EASTMAN CHEMICAL CO, 10-K, March 01, 2007

Exhibit 31.01EASTMAN CHEMICAL COMPANY AND SUBSIDIARIES
Rule 13a - 14(a)/15d - 14(a) Certifications
I, J. Brian Ferguson, Chairman of the Board and Chief Executive Officer of Eastman Chemical Company, certify that: 1. I have reviewed this annual report on Form 10-K of Eastman Chemical Company; 2. Based on my knowledge, this report does not contain any untrue statement of a material fact or omit to state a material fact
necessary to make the statements made, in light of the circumstances under which such statements were made, not misleading withrespect to the period covered by this report;
3. Based on my knowledge, the financial statements, and other financial information included in this report, fairly present in all
material respects the financial condition, results of operations and cash flows of the registrant as of, and for, the periods presentedin this report;
4. The registrant's other certifying officer and I are responsible for establishing and maintaining disclosure controls and procedures (as
defined in Exchange Act Rules 13a-15(e) and 15d-15(e)) and internal control over financial reporting (as defined in Exchange ActRules 13a-15(f) and 15d-15(f)) for the registrant and have:
(a) Designed such disclosure controls and procedures, or caused such disclosure controls and procedures to be designed under our
supervision, to ensure that material information relating to the registrant, including its consolidated subsidiaries, is made knownto us by others within those entities, particularly during the period in which this report is being prepared;
(b) Designed such internal control over financial reporting, or caused such internal control over financial reporting to be designed
under our supervision, to provide reasonable assurance regarding the reliability of financial reporting and the preparation offinancial statements for external purposes in accordance with generally accepted accounting principles;
(c) Evaluated the effectiveness of the registrant's disclosure controls and procedures and presented in this report our conclusions
about the effectiveness of the disclosure controls and procedures, as of the end of the period covered by this report based onsuch evaluation; and
(d) Disclosed in this report any change in the registrant's internal control over financial reporting that occurred during the
registrant's most recent fiscal quarter (the registrant's fourth fiscal quarter in the case of an annual report) that has materiallyaffected, or is reasonably likely to materially affect, the registrant's internal control over financial reporting; and
5. The registrant's other certifying officer and I have disclosed, based on our most recent evaluation of internal control over financial
reporting, to the registrant's auditors and the audit committee of the registrant's board of directors (or persons performing theequivalent functions):
(a) All significant deficiencies and material weaknesses in the design or operation of internal control over financial reporting which
are reasonably likely to adversely affect the registrant's ability to record, process, summarize and report financial information;and
(b) Any fraud, whether or not material, that involves management or other employees who have a significant role in the registrant's
internal control over financial reporting. Date: February 28, 2007 /s/ J. Brian Ferguson_________________________J. Brian FergusonChairman of the Board and Chief Executive Officer
134
Source: EASTMAN CHEMICAL CO, 10-K, March 01, 2007

Exhibit 31.02EASTMAN CHEMICAL COMPANY AND SUBSIDIARIES
Rule 13a - 14(a)/15d - 14(a) Certifications
I, Richard A. Lorraine, Senior Vice President and Chief Financial Officer of Eastman Chemical Company, certify that: 1. I have reviewed this annual report on Form 10-K of Eastman Chemical Company; 2. Based on my knowledge, this report does not contain any untrue statement of a material fact or omit to state a material fact
necessary to make the statements made, in light of the circumstances under which such statements were made, not misleading withrespect to the period covered by this report;
3. Based on my knowledge, the financial statements, and other financial information included in this report, fairly present in all
material respects the financial condition, results of operations and cash flows of the registrant as of, and for, the periods presentedin this report;
4. The registrant's other certifying officer and I are responsible for establishing and maintaining disclosure controls and procedures (as
defined in Exchange Act Rules 13a-15(e) and 15d-15(e)) and internal control over financial reporting (as defined in Exchange ActRules 13a-15(f) and 15d-15(f)) for the registrant and have:
(a) Designed such disclosure controls and procedures, or caused such disclosure controls and procedures to be designed under our
supervision, to ensure that material information relating to the registrant, including its consolidated subsidiaries, is made knownto us by others within those entities, particularly during the period in which this report is being prepared;
(b) Designed such internal control over financial reporting, or caused such internal control over financial reporting to be designed
under our supervision, to provide reasonable assurance regarding the reliability of financial reporting and the preparation offinancial statements for external purposes in accordance with generally accepted accounting principles;
(c) Evaluated the effectiveness of the registrant's disclosure controls and procedures and presented in this report our conclusions
about the effectiveness of the disclosure controls and procedures, as of the end of the period covered by this report based onsuch evaluation; and
(d) Disclosed in this report any change in the registrant's internal control over financial reporting that occurred during the
registrant's most recent fiscal quarter (the registrant's fourth fiscal quarter in the case of an annual report) that has materiallyaffected, or is reasonably likely to materially affect, the registrant's internal control over financial reporting; and
5. The registrant's other certifying officer and I have disclosed, based on our most recent evaluation of internal control over financial
reporting, to the registrant's auditors and the audit committee of the registrant's board of directors (or persons performing theequivalent functions):
(a) All significant deficiencies and material weaknesses in the design or operation of internal control over financial reporting which
are reasonably likely to adversely affect the registrant's ability to record, process, summarize and report financial information;and
(b) Any fraud, whether or not material, that involves management or other employees who have a significant role in the registrant's
internal control over financial reporting. Date: February 28, 2007 /s/ Richard A. Lorraine_____________________Richard A. Lorraine Senior Vice President and Chief Financial Officer
135
Source: EASTMAN CHEMICAL CO, 10-K, March 01, 2007

Exhibit 32.01
EASTMAN CHEMICAL COMPANY AND SUBSIDIARIESSection 1350 Certifications
In connection with the Annual Report of Eastman Chemical Company (the "Company") on Form 10-K for the year ending December31, 2006, as filed with the Securities and Exchange Commission on the date hereof (the "Report"), each of the undersigned officers ofthe Company certifies, pursuant to 18 U.S.C. § 1350, as adopted pursuant to § 906 of the Sarbanes-Oxley Act of 2002, that, to suchofficer's knowledge:
1. The Report fully complies with the requirements of section 13(a) or 15(d) of the Securities Exchange Act of 1934; and 2. The information contained in the Report fairly presents, in all material respects, the financial condition and results of operations of
the Company as of the dates and for the periods expressed in the Report. A signed original of this written statement required by Section 906 has been provided to Eastman Chemical Company and will beretained by Eastman Chemical Company and furnished to the Securities and Exchange Commission or its staff upon request.
Date: February 28, 2007
/s/ J. Brian Ferguson_________________________J. Brian FergusonChairman of the Board and Chief Executive Officer
The foregoing certification is being furnished solely pursuant to 18 U.S.C. §1350 and is not being filed as part of the Report or as aseparate disclosure document.
136
Source: EASTMAN CHEMICAL CO, 10-K, March 01, 2007

Source: EASTMAN CHEMICAL CO, 10-K, March 01, 2007

Exhibit 32.02
EASTMAN CHEMICAL COMPANY AND SUBSIDIARIES
Section 1350 Certifications
In connection with the Annual Report of Eastman Chemical Company (the "Company") on Form 10-K for the year ending December31, 2006, as filed with the Securities and Exchange Commission on the date hereof (the "Report"), each of the undersigned officers ofthe Company certifies, pursuant to 18 U.S.C. § 1350, as adopted pursuant to § 906 of the Sarbanes-Oxley Act of 2002, that, to suchofficer's knowledge:
1. The Report fully complies with the requirements of section 13(a) or 15(d) of the Securities Exchange Act of 1934; and 2. The information contained in the Report fairly presents, in all material respects, the financial condition and results of operations of
the Company as of the dates and for the periods expressed in the Report. A signed original of this written statement required by Section 906 has been provided to Eastman Chemical Company and will beretained by Eastman Chemical Company and furnished to the Securities and Exchange Commission or its staff upon request.
Date: February 28, 2007
/s/ Richard A. Lorraine_____________________Richard A. LorraineSenior Vice President and Chief Financial Officer
The foregoing certification is being furnished solely pursuant to 18 U.S.C. §1350 and is not being filed as part of the Report or as aseparate disclosure document.
137
Source: EASTMAN CHEMICAL CO, 10-K, March 01, 2007

Source: EASTMAN CHEMICAL CO, 10-K, March 01, 2007

Exhibit 99.01
EASTMAN CHEMICAL COMPANY DETAIL OF SALES REVENUE
FirstQuarter
SecondQuarter
ThirdQuarter
FourthQuarter
TwelveMonths
(Dollars in millions) 2006 2006 2006 2006 2006 Sales Revenue $ 1,803 $ 1,929 $ 1,966 $ 1,752 $ 7,450Less: product lines held for sale
Coatings, Adhesives, Special Polymers andInks (1) 18 17 18 12 65Performance Chemicals and Intermediates
(2) 30 29 38 14 111Performance Polymers (1) 180 168 169 118 635
Sales revenue - continuing product lines $ 1,575 $ 1,715 $ 1,741 $ 1,608 $ 6,639
FirstQuarter
SecondQuarter
ThirdQuarter
FourthQuarter
TwelveMonths
(Dollars in millions) 2005 2005 2005 2005 2005 Sales Revenue $ 1,762 $ 1,752 $ 1,816 $ 1,729 $ 7,059Less: product lines held for sale
Coatings, Adhesives, Special Polymers andInks (1) 16 17 15 16 64Performance Chemicals and Intermediates
(2) 26 27 22 29 104Performance Polymers (1) 141 137 164 176 618
Sales revenue - continuing product lines $ 1,579 $ 1,571 $ 1,615 $ 1,508 $ 6,273
(1) Polyethylene and Epolene polymer businesses and related assets of the Performance Polymers and Coatings, Adhesives, SpecialtyPolymers, and Inks ("CASPI") segments located at the Longview, Texas site and the Company's ethylene pipeline were sold infourth quarter 2006.
(2) The Company's Batesville, Arkansas manufacturing facility and related assets and the specialty organic chemicals product lines inthe Performance Chemicals and Intermediates ("PCI") segment were sold in fourth quarter 2006.
138
_______________________________________________Created by 10KWizard www.10KWizard.com
Source: EASTMAN CHEMICAL CO, 10-K, March 01, 2007