2006 ANNUAL REPORT · Prince Amyn Aga Khan John L. Marion Dimitri Mavrommatis Carlo Perrone Carroll...
120
2006 ANNUAL REPORT 2006 ANNUAL REPORT
Transcript of 2006 ANNUAL REPORT · Prince Amyn Aga Khan John L. Marion Dimitri Mavrommatis Carlo Perrone Carroll...

2 0 0 6 A N N U A L R E P O R T2 0 0 6 A N N U A L R E P O R T

2006 was another record year for Sotheby’s with the highest revenues, operating income and
EBITDA in our 263-year history. Revenues increased 29% over 2005, which had been our highest
revenues ever. Operating income rose 60% to $197.2 million; income from continuing operations was
$107.4 million, a 70% increase; adjusted EBITDA1 was $218.4 million, a 51% increase; and return on
equity was a remarkable 50%. It was a tremendous year.
These outstanding results, along with our profitability in 2004 and 2005,
enabled us to reinstitute a quarterly dividend of $0.10 a share after a six-year
hiatus, a very important indicator of the health of Sotheby’s and of our
future. We are very focused on profitability and to sharing our successes
with you, our shareholders.
In the ten years from 1996 to 2005, we sold 86 works at auction for $10
million or more. In 2006 alone we sold 20 such works, ranging from
Impressionist, Contemporary and American paintings to a Chinese bronze
Buddha to an American battle flag. This number too was a record for
Sotheby’s. The highlight was Pablo Picasso’s Dora Maar au Chat which
brought $95.2 million in our New York Impressionist and Modern art sale
in May, the year’s most expensive work sold
anywhere at auction and the second highest
auction price ever.
Impressionist and Modern Art continued to be our largest category by far
in 2006, with auction sales of $932.4 million, a significant 79% increase
from the prior year. Of the 20 works sold at auction for $10 million or more
in 2006, 12 were Impressionist paintings or sculptures. Contemporary Art
also had an impressive year with $647.0 million in auction sales, a 61%
increase over 2005.
Emerging markets dramatically increased their share over the past year.
Sales of worldwide Contemporary Asian Art brought $70.2 million, a
391% increase from the prior year and overall sales in Asia experienced
D E A R F E L L O W S H A R E H O L D E R S
60%
“A Picasso portrait sold for an extraordinary $95m (£52m) – the second highest price ever paid for a painting – at Sotheby’s in New York in a sale that generated more than $200m in under an hour.”M E R RY N S O M E R S E T W E B B
T H E LO N D O N S U N DAY T I M E S , 2 1 M AY 2 0 0 6
$15,036,736
A D J U S T E D I N C O M E F R O M
C O N T I N U I N G O P E R AT I O N S
120
100
80
60
40
20
0FY06FY05
$63.2
$107.4
FY04
$34.11
I N C R E A S E I N
O P E R AT I N G I N C O M E

continued growth with a total of $288.6 million in 2006, a 29% increase
from the prior year and up 151% over three years ago. Also, sales of
Russian Paintings and Works of Art were up 12% to $152.4 million.
In our return to profitability, our major clients have been the key driver to our
success. Consequently, we will be launching several important initiatives
for 2007 that will further enhance our client relationships. We are making
significant changes to our business, globally reorganizing the management of these important
relationships and adding significant tools and staff in those areas our major clients value most. As our
clients live and do business in many locations around the world, they want a 24/7 experience with us,
with constant access to account information and they expect a consistently high level of service from
us. We will fulfill their expectations.
This spring we will launch “mySothebys”, a major enhancement to our website that will revolutionize
the auction experience for our clients. It will enable clients to obtain 24/7 online services and account
information and have access to exciting new features such as paddle pre-registration, instant
magnification of lot images, a tracked lot list and immediate real time auction results. Additionally, we
will further build on our already sophisticated rich media experiences of video and podcasting by
introducing streaming video of our evening sales this May.
Also this spring, as part of our initiative to carefully extend our great
brand, we will be introducing two Sotheby’s branded credit cards, the
Sotheby’s World and World Elite Mastercard from GE Money, which
will provide unprecedented access to the world of art and fine living.
These cards will provide a benefits program unequalled anywhere that
will also support some of our great cultural institutions. We expect that
over time this credit card venture will be a profitable business
opportunity for Sotheby’s.
We have also looked carefully at new and existing markets to see where
we should devote more resources. To respond to promising global
opportunities, we are opening offices in Moscow and Beijing and are
$26,896,000
Worldwide, Contemporary Asian Artbrought an outstanding $70.2 millionwhich is 391% above the prior year’s total of $14.3 million.
R E T U R N O N E Q U I T Y
60
50
40
30
20
10
0FY06FY05
35.0%
50.2%
FY04
18.9%1

Michael I. SovernChairman
William F. RuprechtPresident and Chief Executive Officer
establishing a greater presence in the Middle East,
where we have been operating for many years, so that
we can better serve this increasingly important part of
the global art world. We are also making significant
investments in Paris, where Sotheby’s led the opening of
the French art market to international art auction houses.
In June, we successfully completed the acquisition of
Noortman Master Paintings, a pre-eminent dealer in
Old Master, Impressionist and Post-Impressionist
Paintings. Sadly, the principal of that business and a
legendary figure in the art world, Robert Noortman, passed away unexpectedly in January. We remain
committed to Noortman Master Paintings and to Robert’s vision for this gallery.
As of this date in March of 2007, the art market is robust and our auctions
around the world are up nearly 50% when compared to 2006. Our January Old
Master Paintings sale in New York brought its highest total ever at $111 million
and included a wonderful Rembrandt portrait which sold for $25.8 million. In
London, our week of Impressionist and Modern sales and Contemporary sales
in February brought $361.7 million, a 71% increase from the prior year and our
best London results ever.
We look forward to 2007 with great optimism. Our Company is strong, the art market is strong and
there are exciting opportunities ahead. And, as strong as ever is our commitment to deliver value to you,
our shareholders, and to our clients and employees. We extend our thanks and appreciation to you, to
our management, clients and employees and to our Board of Directors for your continuing support.
$25,800,000
Contemporary Art had an impressiveyear with $647.0 million in auctionsales, a 61% increase from 2005.
Note: All auction sales figures are the aggregate hammer price of property sold at auction, including buyer's premium.1 Represents or is calculated form a non-GAAP financial measure. See reconciliation to comparable GAAP amount on the last page.


BOARD OF DIRECTORS
Michael I. SovernChairman
The Duke of DevonshireDeputy Chairman
William F. RuprechtPresident and Chief Executive Officer
Robin G. WoodheadExecutive Vice President,Chief Executive, Europe and Asia
The Viscount BlakenhamFormer Chairman/CEO Pearson PLC
Steven B. DodgeChief Executive Officer,Windover Development Corporation
Allen QuestromFormer Chairman/CEO J.C. Penney, Inc.
Donald M. StewartVisiting ProfessorThe Harris School, University of Chicago
Robert S. TaubmanChairman, President and Chief ExecutiveOfficer, Taubman Centers, Inc.
Dennis M. WeiblingManaging Director, Rally Capital LLC
ADVISORY BOARD
Ambassador Walter J.P. CurleyChairman
Alexis GregoryDeputy Chairman
Dr. Alice Y.T. ChengHenry CornellMichel A. David-WeillUlla Dreyfus-BestCharles de GunzburgLodewijk J.R. de VinkTom FordAnn GettyPansy HoPrince Amyn Aga KhanJohn L. MarionDimitri MavrommatisCarlo PerroneCarroll PetrieCarol PriceDonna Patrizia Memmo dei Principi RuspoliRolf SachsThe Hon. Hilary Weston, C.M., O. Ont.
CORPORATE OFFICERS
Michael I. SovernChairman of the Board
William F. RuprechtPresident and Chief Executive Officer
The Duke of DevonshireDeputy Chairman
Robin WoodheadExecutive Vice President and Chief Executive ofSotheby’s International
Susan AlexanderExecutive Vice President, Worldwide Head of Human Resources
Michael L. GillisSenior Vice President, Controller and Chief Accounting Officer
Ann JacksonExecutive Vice President,Global Business Development
Jane LevineSenior Vice President, Director of Worldwide Compliance
Lynn MacDiarmidSenior Vice President, Worldwide Director of Taxes
Jonathan A. OlsoffAssistant Secretary
Diana PhillipsExecutive Vice President, Worldwide Director ofPress and Corporate Affairs
Donaldson C. PillsburyExecutive Vice President, Worldwide General Counsel and Secretary
Jan PräsensVice President, Treasurer
William S. SheridanExecutive Vice President, Chief Financial Officer
Dr. David B. UlmerSenior Vice President, Chief Technology and Strategy Officer
Bruno VinciguerraExecutive Vice President, Director of New Initiatives
Daryl WickstromSenior Vice President, Managing Director, Global Auction Division
S O T H E B Y ’ S S O T H E B Y ’ S W O R L D W I D E
M A N A G E M E N T
NORTH AND
SOUTH AMERICA
Warren P. Weitman, Jr.
Chairman
John L. Marion
Honorary Chairman
Richard C. Buckley
Managing Director,
North America Regional Auction Division
Daryl Wickstrom
Managing Director,
Global Auction Division
James G. Niven
David N. Redden
William W. Stahl, Jr.
George Wachter
Benjamin F. Doller
Vice Chairmen
William S. Cottingham
C. Hugh Hildesley
Tobias Meyer
Dara Mitchell
Charles S. Moffett
David Norman
Executive Vice Presidents
EUROPE
Henry Wyndham
Chairman
Robin G. Woodhead
Chief Executive,
Europe and Asia
George Bailey
Managing Director
Princess de Beauvau Craon
Melanie Clore
Tobias Meyer
The Hon James Stourton
Mario Tavella
Deputy Chairmen
SOTHEBY’S FINANCIAL
SERVICES, INC.
Mitchell Zuckerman
President

$36,976,000
Paul CézanneNature morte aux fruitset pot de gingembreSold in our NovemberImpressionist & ModernArt auction in New York
ADMINISTRATIVE OFFICES
Sotheby’s
1334 York Avenue
New York, NY 10021
212 606.7000
www.sothebys.com
TRANSFER AGENTS
Mellon Investor Services LLC
480 Washington Boulevard
Jersey City, NJ 07310
Tel: U.S. Holders: 800 303.3971
Tel: Non-U.S. Holders: 201 680.6578
www.melloninvestor.com
COMMON STOCK INFORMATION
Sotheby’s Stock is listed on
the New York Stock Exchange
(symbol: BID)
ANNUAL MEETING
The annual meeting of shareholders
will be held on
May 7, 2007
at 11:00 A.M. at Sotheby’s
1334 York Avenue
New York, NY 10021
SHAREHOLDER INFORMATION
All of the Company’s Filings with the Securities
and Exchange Commission may be obtained online at
http://www.shareholder.com/bid/edgar.cfm
or by writing to:
Investor Relations
Sotheby’s
1334 York Avenue
New York, NY 10021
Tel: 800 700.6321
U.K. Corporate Office:
Sotheby’s
34-35 New Bond Street
London W1A 2AA England
Tel: 011 44 207 293.6482
Sotheby’s latest financial information and
news is also available by fax, recording,
or mail by calling our Shareholder Direct
toll-free line 24 hours a day, 7 days a week
at 800 700.6321.
CERTIFIED PUBLIC ACCOUNTANTS
Deloitte & Touche LLP
Two World Financial Center
New York, NY 10281
S O T H E B Y ’ S S H A R E H O L D E R S ’ I N F O R M AT I O N
Year ended December 31, 2006 2005 2004
(THOUSANDS OF DOLLARS)
GAAP Income from Continuing Operations $ 107,359 $ 63,217 $ 62,397Adjustments, net of tax effects:
License fee revenue (a) — — (29,734)License fee expense (a) — — 1,424
Adjusted Income from Continuing Operations $ 107,359 $ 63,217 $ 34,087
Year ended December 31, 2006 2005
(THOUSANDS OF DOLLARS)
GAAP Income from Continuing Operations $ 107,359 $ 63,217 Adjustments:
Income tax expense related to continuing operations 60,050 28,594
Income tax expense related to earnings from equity investees 1,043 446
Net interest expense 27,148 27,738Depreciation and amortization expense 22,783 22,081Credit facility termination costs` — 3,069
Adjusted EBITDA $ 218,383 $145,145
$30,180,900
Amedeo ModiglianiJeanne Hebuterne auChapeauSold in our JuneImpressionist & Modern Artauction in London
$26,896,000
Edward HopperHotel WindowSold in our November AmericanPaintings auction in New York
$95,216,000
Pablo PicassoDora Maar au ChatSold in our May Impressionist& Modern Art auction in NewYork. World record for a workof art sold in auction during2006. ©2007 Estate of Pablo Picasso / Artists Rights Society (ARS), New York, NY
S O L D I N 2 0 0 7 shown in letter$25,800,000
Rembrandt, Portrait of St. James the GreaterSold in our January 2007 OldMasters auction in New York
$15,036,700
Gilt-bronze figure ofShakyamuni BuddhaSold in our OctoberVisions of Enlightenmentauction in Hong Kong
$2,928,000
Edward SteichenThe Pond MoonlightSold in our February Gilmanphotographs auction in NewYork. Record for the artist andfor a photograph sold at auction
$5,935,500
A Chinese jade-hilted swordSold in our April QianlongSovereign, Warrior, Patron auction in Hong Kong
$2,718,000
Pear-shaped diamondpendant weighing 34.21 caratsSold in our NovemberMagnificent Jewels auction in Geneva
$979,200
Zhang XiaogangBloodline Series: Comrade No. 120Sold in our March AsianContemporary Art auctionin New York© The Artist
$3,285,000
Ivan Aivazovsky The Varangians on the DnieprSold in our May RussianPaintings auction in New York
$12,336,000
An American RevolutionaryWar BattleflagSold in our June FourBattleflags of the Revolutionauction in New York
$5,389,200
David HockneyThe SplashSold in our JuneContemporary auction in London© David Hockney
$12,411,800
Edgar DegasLa sortie du bainSold in our JuneImpressionist & ModernArt auction in London
S O T H E B Y ’ S 2 0 0 6 H I G H L I G H T S
$15,696,000
Roy Lichtenstein Sinking SunSold in our May ContemporaryArt auction in New York© Estate of Roy Lichtenstein
C E R T I F I C AT I O N S
On May 24, 2006, Sotheby’s (the “Company”)filed with the New York Stock Exchange (the“NYSE”), the Chief Executive Officer certifi-cation confirming its compliance with theNYSE's corporate governance listing stan-dards as required by Section 303A.12(a) ofthe NYSE's Listed Company Manual. TheCompany also included as Exhibits 32.1 and32.2 to its 2006 Annual Report on Form 10-Kfiled with the Securities and ExchangeCommission, the certifications of the ChiefExecutive Officer and Chief Financial Officerpursuant to Section 906 of the Sarbanes-Oxley Act of 2002.
R E C O N C I L I AT I O N O F N O N - G A A P F I N A N C I A L M E A S U R E S
(a) Represents the one-time revenue and associated expenses relating to the license agreement entered into in conjunction with the sale of the Company’s real estate brokerage business
$15,024,000
Francis BaconVersion 2 Lying Figure withHypodermic SyringeSold in our NovemberContemporary Art auction inNew York. ©2007 Artists Rights Society (ARS), New York, NY / DACS, LONDON
The cover and narrative section of this Annual Report were printed with soy based inks on paper containing a minimum of10% post-consumer recovered fiber. This paper and printer are certified to Forest Stewardship Council (FSC) Standards,which promote environmentally appropriate, socially beneficial and economically viable management of the world’s forests.


UNITED STATESSECURITIES AND EXCHANGE COMMISSION
WASHINGTON, D.C. 20549
FORM 10-K(Mark One)
� ANNUAL REPORT PURSUANT TO SECTION 13 OR 15(d) OF THESECURITIES EXCHANGE ACT OF 1934FOR THE FISCAL YEAR ENDED DECEMBER 31, 2006.
OR� TRANSITION REPORT PURSUANT TO SECTION 13 OR 15(d) OF THE
SECURITIES EXCHANGE ACT OF 1934FOR THE TRANSITION PERIOD FROM TO , AND
COMMISSION FILE NUMBER 1-9750
SOTHEBY’S(Exact name of registrant as specified in its charter)
Delaware(State or other jurisdiction ofincorporation or organization)
1334 York AvenueNew York, New York
(Address of principal executive offices)
38-2478409(I.R.S. Employer
Identification No.)
10021(Zip Code)
(212) 606-7000(Registrant’s telephone number, including area code)
Securities registered pursuant to Section 12(b) of the Act:
Title of each className of each exchange
on which registered
Common Stock,$0.10 Par Value
New York Stock Exchange
Securities registered pursuant to Section 12(g) of the Act: None
Indicate by check mark if the registrant is a well-known seasoned issuer, as defined in Rule 405 of the Act.Yes � No �
Indicate by check mark if the registrant is not required to file reports pursuant to Section 13 or Section 15(d)of the Act. Yes � No �
Indicate by check mark whether the registrant (1) has filed all reports required to be filed by Section 13 or15(d) of the Act during the preceding 12 months (or for such shorter periods that the registrant was required tofile such reports), and (2) has been subject to such filing requirements for the past 90 days. Yes � No �
Indicate by check mark if disclosure of delinquent filers pursuant to Item 405 of Regulation S-K is notcontained herein, and will not be contained, to the best of registrant’s knowledge, in definitive proxy orinformation statements incorporated by reference in Part III of this Form 10-K or any amendment to thisForm 10-K. �
Indicate by check mark whether the registrant is a large accelerated filer, an accelerated filer,or a non-accelerated filer (as defined in Rule 12b-2 of the Act). Large accelerated filer �Accelerated filer � Non-accelerated filer �
Indicate by check mark whether the registrant is a shell company (as defined in Rule 12b-2 of the Act)Yes � No �
As of June 30, 2006, the aggregate market value of the 60,612,960 shares of Common Stock held by non-affiliates of the registrant was $1,591,090,200, based upon the closing price ($26.25) on the New York StockExchange composite tape on such date for the Common Stock.
As of February 20, 2007, there were outstanding 65,739,549 shares of Common Stock.
DOCUMENTS INCORPORATED BY REFERENCE
Portions of the registrant’s proxy statement for the 2007 annual meeting of shareholders are incorporated byreference into Part III of this Form 10-K.

TABLE OF CONTENTS
Page
PART I
Item 1. Description of Business . . . . . . . . . . . . . . . . . . . . . . . . . . . . . . . . . . . . . . . . . . . . . . . . . . . . . . . . . . . . 1Item 1A. Risk Factors . . . . . . . . . . . . . . . . . . . . . . . . . . . . . . . . . . . . . . . . . . . . . . . . . . . . . . . . . . . . . . . . . . . . . . . 7Item 1B. Unresolved Staff Comments . . . . . . . . . . . . . . . . . . . . . . . . . . . . . . . . . . . . . . . . . . . . . . . . . . . . . . . 9Item 2. Properties . . . . . . . . . . . . . . . . . . . . . . . . . . . . . . . . . . . . . . . . . . . . . . . . . . . . . . . . . . . . . . . . . . . . . . . . . . 9Item 3. Legal Proceedings. . . . . . . . . . . . . . . . . . . . . . . . . . . . . . . . . . . . . . . . . . . . . . . . . . . . . . . . . . . . . . . . . . 10Item 4. Submission of Matters to a Vote of Security Holders . . . . . . . . . . . . . . . . . . . . . . . . . . . . . . 10
PART II
Item 5. Market for the Registrant’s Common Equity and Related Shareholder Matters. . . . 11Item 6. Selected Financial Data . . . . . . . . . . . . . . . . . . . . . . . . . . . . . . . . . . . . . . . . . . . . . . . . . . . . . . . . . . . . 14Item 7. Management’s Discussion and Analysis of Financial Condition and Results of
Operations . . . . . . . . . . . . . . . . . . . . . . . . . . . . . . . . . . . . . . . . . . . . . . . . . . . . . . . . . . . . . . . . . . . . . . . 15Item 7A. Quantitative and Qualitative Disclosures About Market Risk . . . . . . . . . . . . . . . . . . . . . . 49Item 8. Financial Statements and Supplementary Data . . . . . . . . . . . . . . . . . . . . . . . . . . . . . . . . . . . . . 50
Report of Independent Registered Public Accounting Firm . . . . . . . . . . . . . . . . . . . 50Consolidated Income Statements . . . . . . . . . . . . . . . . . . . . . . . . . . . . . . . . . . . . . . . . . . . . . . 51Consolidated Balance Sheets . . . . . . . . . . . . . . . . . . . . . . . . . . . . . . . . . . . . . . . . . . . . . . . . . . 52Consolidated Statements of Cash Flows . . . . . . . . . . . . . . . . . . . . . . . . . . . . . . . . . . . . . . . 53Consolidated Statements of Changes in Shareholders’ Equity . . . . . . . . . . . . . . . . . 54Notes to Consolidated Financial Statements . . . . . . . . . . . . . . . . . . . . . . . . . . . . . . . . . . . 55
Item 9. Changes in and Disagreements with Accountants on Accounting and FinancialDisclosure . . . . . . . . . . . . . . . . . . . . . . . . . . . . . . . . . . . . . . . . . . . . . . . . . . . . . . . . . . . . . . . . . . . . . . . 98
Item 9A. Control and Procedures . . . . . . . . . . . . . . . . . . . . . . . . . . . . . . . . . . . . . . . . . . . . . . . . . . . . . . . . . . . . 98
PART III
Item 10. Directors and Executive Officers of Registrant . . . . . . . . . . . . . . . . . . . . . . . . . . . . . . . . . . . . 101Item 11. Executive Compensation . . . . . . . . . . . . . . . . . . . . . . . . . . . . . . . . . . . . . . . . . . . . . . . . . . . . . . . . . . . 101Item 12. Security Ownership of Certain Beneficial Owners and Management and
Related Stockholder Matters. . . . . . . . . . . . . . . . . . . . . . . . . . . . . . . . . . . . . . . . . . . . . . . . . . . . . 101Item 13. Certain Relationships and Related Transactions . . . . . . . . . . . . . . . . . . . . . . . . . . . . . . . . . . . 101Item 14. Principal Accountant Fees and Services . . . . . . . . . . . . . . . . . . . . . . . . . . . . . . . . . . . . . . . . . . . . 101
PART IV
Item 15. Exhibits, Financial Statement Schedules and Reports on Form 8-K . . . . . . . . . . . . . . . . 102
Schedule II. . . . . . . . . . . . . . . . . . . . . . . . . . . . . . . . . . . . . . . . . . . . . . . . . . . . . . . . . . . . . . . . . . . . . . . . . 106Signatures . . . . . . . . . . . . . . . . . . . . . . . . . . . . . . . . . . . . . . . . . . . . . . . . . . . . . . . . . . . . . . . . . . . . . . . . . . 107Exhibit Index . . . . . . . . . . . . . . . . . . . . . . . . . . . . . . . . . . . . . . . . . . . . . . . . . . . . . . . . . . . . . . . . . . . . . . 108

PART I
ITEM 1: DESCRIPTION OF BUSINESS
Company Overview
Sotheby’s (formerly Sotheby’s Holdings, Inc. and together with its subsidiaries, unless thecontext otherwise requires, the “Company”) is one of the world’s two largest auctioneers ofauthenticated fine art, antiques and decorative art, jewelry and collectibles. In addition toauctioneering, the Company’s Auction segment is engaged in a number of related activities,including the brokering of private purchases and sales of fine art, jewelry and collectibles. TheCompany also operates as a dealer in works of art through its Dealer segment, conducts art-relatedfinancing activities through its Finance segment and is engaged, to a lesser extent, in licensingactivities. A detailed explanation of the activities of each of the Company’s segments, as well as itslicensing activities is provided below.
The Company was initially incorporated in Michigan in August 1983. In October 1983, theCompany acquired Sotheby Parke Bernet Group Limited, which was then a publicly held companylisted on the International Stock Exchange of the United Kingdom and which, through itspredecessors, had been engaged in the auction business since 1744. In 1988, the Company issuedshares of Class A Limited Voting Common Stock, par value $0.10 per share (the “Class A Stock”),to the public, which were listed on the New York Stock Exchange (the “NYSE”).
In June 2006, the Company (then named Sotheby’s Holdings, Inc.) reincorporated into the Stateof Delaware (the “Reincorporation”). The Reincorporation and related proposals were approved bythe shareholders of Sotheby’s Holdings, Inc. at the annual meeting of shareholders on May 8, 2006.The Reincorporation was completed by means of a merger of Sotheby’s Holdings, Inc. with and intoSotheby’s Delaware, Inc., a Delaware corporation (“Sotheby’s Delaware”) and a wholly-ownedsubsidiary of Sotheby’s Holdings, Inc. incorporated for the purpose of effecting the Reincorporation,with Sotheby’s Delaware being the surviving corporation. Sotheby’s Delaware was renamed“Sotheby’s” upon completion of the merger.
In the merger, each outstanding share of Class A Stock was converted into one share ofCommon Stock of Sotheby’s Delaware (“Sotheby’s Delaware Stock”). As a result, holders ofClass A Stock became holders of Sotheby’s Delaware Stock, and their rights as holders thereof arenow governed by the General Corporation Law of the State of Delaware and the Certificate ofIncorporation and By-Laws of Sotheby’s Delaware.
The Reincorporation was accounted for as a reverse merger, whereby, for accounting purposes,Sotheby’s Holdings, Inc. is considered the acquiror and the surviving corporation is treated as thesuccessor to the historical operations of Sotheby’s Holdings, Inc. Accordingly, the historical financialstatements of Sotheby’s Holdings, Inc. which were previously reported to the SEC on Forms 10-Kand 10-Q, among other forms, are treated as the financial statements of the surviving corporation.
The Reincorporation did not result in any change in the business or principal facilities ofSotheby’s Holdings, Inc. Additionally, Sotheby’s Holdings, Inc. management and board of directorscontinued as the management and board of directors of Sotheby’s Delaware and Sotheby’s Delawarestock continued to trade on the NYSE under the symbol “BID.”
Auction Segment
Description of Business
The purchase and sale of works of art in the international art market are primarily effectedthrough numerous dealers, the major auction houses, smaller auction houses and also directlybetween collectors. Although dealers and smaller auction houses generally do not report sales figurespublicly, the Company believes that dealers account for the majority of the volume of transactions inthe international art market.
1

The Company and Christie’s International, PLC (“Christie’s”), a privately held auction house,are the two largest art auction houses in the world.
The Company auctions a wide variety of property, including fine art, antiques and decorativeart, jewelry and collectibles. Most of the objects auctioned by the Company are unique items, andtheir value, therefore, can only be estimated prior to sale. The Company’s principal role as anauctioneer is to identify, evaluate and appraise works of art through its international staff ofspecialists; to stimulate purchaser interest through professional marketing techniques; and to matchsellers and buyers through the auction process.
In its role as auctioneer, the Company functions as an agent accepting property on consignmentfrom its selling clients. The Company sells property as agent of the consignor, billing the buyer forproperty purchased, receiving payment from the buyer and remitting to the consignor the consignor’sportion of the buyer’s payment after deducting the Company’s commissions, expenses and applicabletaxes and royalties. The Company’s auction commission revenues include those earned from thebuyer (“buyer’s premium revenue”) and those earned from the consignor (“seller’s commissionrevenue”), both of which are calculated as a percentage of the hammer price of property sold atauction. For the years ended December 31, 2006, 2005 and 2004, auction commission revenuesaccounted for 83%, 86% and 77%, respectively, of the Company’s consolidated revenues.
In certain situations, under negotiated contractual arrangements or when the buyer takespossession of the property purchased at auction before payment is made, the Company is liable tothe consignor for the net sale proceeds. (See Note E of Notes to Consolidated Financial Statementsunder Item 8, “Financial Statements and Supplementary Data.”)
From time to time in the ordinary course of business, the Company will guarantee to consignorsa minimum price in connection with the sale of property at auction (an “auction guarantee”). TheCompany must perform under its auction guarantee in the event that the property sells for less thanthe minimum price, in which event the Company must fund the difference between the sale price atauction and the amount of the auction guarantee. If the property does not sell, the amount of theguarantee must be paid, but the Company has the right to recover such amount through the futuresale of the property. In certain instances, the sale proceeds ultimately realized by the Companyexceed the amount of any prior losses recognized on the auction guarantee. Additionally, theCompany is generally entitled to a share of a negotiated amount of excess proceeds if the propertyunder the auction guarantee sells above a minimum price. In addition, the Company is obligatedunder the terms of certain auction guarantees to advance a portion of the guaranteed amount priorto the auction. In certain situations, the Company reduces its financial exposure under auctionguarantees through auction commission sharing arrangements with partners. Partners may also assistthe Company in valuing and marketing the property to be sold at auction. (See Note P of Notes toConsolidated Financial Statements under Item 8, “Financial Statements and Supplementary Data.”)
In addition to auctioneering, the Auction segment is engaged in a number of related activities,including the brokering of private purchases and sales of fine art, jewelry and collectibles.
The worldwide art auction market has two principal selling seasons, spring and autumn. TheAuction segment’s business is seasonal, with peak revenues and operating income generally occurringin the second and fourth quarters of each year. Consequently, first and third quarter results of theAuction segment historically reflect lower Net Auction Sales (as defined below in Item 6, “SelectedFinancial Data”) when compared to the second and fourth quarters and a loss from continuingoperations due to the fixed nature of many of the Company’s operating expenses. (See Item 7,“Management’s Discussion and Analysis of Financial Condition and Results of Operations,” andNote Y of Notes to Consolidated Financial Statements under Item 8, “Financial Statements andSupplementary Data.”)
(See “Strategic Initiatives” under Item 7, “Management’s Discussion and Analysis of FinancialCondition and Results of Operations.”)
2

The Auction Market and Competition
Competition in the international art market is intense. A fundamental challenge facing anyauctioneer or dealer is to obtain high quality and valuable property for sale either as agent or asprincipal. The Company’s primary auction competitor is Christie’s and the Company also facescompetition from a variety of dealers across all collecting categories.
The owner of a work of art wishing to sell it has four principal options: (1) sale or consignmentto, or private sale by, an art dealer; (2) consignment to, or private sale by, an auction house;(3) private sale to a collector or museum without the use of an intermediary; or (4) for certaincategories of property (in particular, collectibles) consignment to, or private sale through, aninternet-based service. The more valuable the property, the more likely it is that the owner willconsider more than one option and will solicit proposals from more than one potential purchaser oragent, particularly if the seller is a fiduciary representing an estate or trust. A complex array offactors may influence the seller’s decision. These factors, which are not ranked in any particularorder, include:
• The level and breadth of expertise of the dealer or auction house with respect to theproperty;
• The extent of the prior relationship, if any, between the dealer or auction house and its staffand the seller;
• The reputation and historic level of achievement by the dealer or auction house in attaininghigh sale prices in the property’s specialized category;
• The desire for privacy on the part of clients;
• The amount of cash offered by a dealer, auction house or other purchaser to purchase theproperty outright, which is greatly influenced by the amount and cost of capital resourcesavailable to such parties;
• The level of auction guarantees or the terms of other financial options offered by auctionhouses;
• The level of pre-sale estimates offered by auction houses;
• The desirability of a public auction in order to achieve the maximum possible price(a particular concern for fiduciary sellers, such as trustees and executors);
• The amount of commission charged by dealers or auction houses to sell a work onconsignment;
• The cost, style and extent of presale marketing and promotion to be undertaken by a dealeror auction house;
• Recommendations by third parties consulted by the seller;
• The desire of clients to conduct business with a publicly traded company; and
• The availability and extent of related services, such as tax or insurance appraisals and short-term financing.
It is not possible to measure with any particular accuracy the entire international art market orto reach any conclusions regarding overall competition because dealers and auction firms frequentlydo not publicly report annual totals for auction sales, revenues or profits, and the amounts reportedmay not be verifiable.
Auction Regulation
Regulation of the auction business varies from jurisdiction to jurisdiction. In many jurisdictions,the Company is subject to laws and regulations that are not directed solely toward the auctionbusiness, including, but not limited to, import and export regulations, antitrust laws, cultural propertyownership laws, data protection and privacy laws, anti-money laundering laws and value added salestaxes. In addition, the Company is subject to local auction regulations, such as New York CityAuction Regulations Subchapter M of Title 6 §§ 2-121–2-125, et. seq. Such regulations do not impose
3

a material impediment to the worldwide business of the Company but do affect the marketgenerally, and a material adverse change in such regulations could affect the business. In addition,the failure to comply with such local laws and regulations could subject the Company to civil and/orcriminal penalties in such jurisdictions. The Company has a Compliance Department which, amongstother activities, develops and updates compliance policies and audits, monitors, and provides trainingto Company employees on compliance with many of these laws and regulations.
Finance Segment
Description of Business
The Company’s Finance segment provides certain collectors and dealers with financing,generally secured by works of art that the Company either has in its possession or permits theborrower to possess. Clients who borrow from the Finance segment are often unable to borrow onconventional terms from traditional lenders and are typically not highly interest rate sensitive. TheCompany’s financing activities are conducted through its wholly-owned subsidiaries.
The majority of the Company’s secured loans are made at loan to value ratios (principal loanamount divided by the low auction estimate of the collateral) of 50% or lower. However, theCompany will also lend at loan to value ratios higher than 50%. The Finance segment’s loans arepredominantly variable interest rate loans.
The Company generally makes two types of secured loans: (1) advances secured by consignedproperty to borrowers who are contractually committed, in the near term, to sell the property atauction (a “consignor advance”); and (2) general purpose term loans to collectors or dealers securedby property not presently intended for sale (a “term loan”). The consignor advance allows aconsignor to receive funds shortly after consignment for an auction that will occur several weeks ormonths in the future, while preserving for the benefit of the consignor the potential of the auctionprocess. Term loans allow the Company to establish or enhance mutually beneficial relationshipswith dealers and collectors and sometimes result in auction consignments. Secured loans aregenerally made with full recourse against the borrower. In certain instances, however, secured loansare made with recourse limited to the works of art pledged as security for the loan. To the extentthat the Company is looking wholly or partially to the collateral for repayment of its loans,repayment can be adversely impacted by a decline in the art market in general or in the value ofthe particular collateral. In addition, in situations where the borrower becomes subject to bankruptcyor insolvency laws, the Company’s ability to realize on its collateral may be limited or delayed bythe application of such laws.
Under certain circumstances, the Company also makes unsecured loans to collectors and dealers.In certain of these situations, the Company finances the purchase of works of art by certain artdealers through unsecured loans. The property purchased pursuant to such unsecured loans is soldprivately or at auction with any profit or loss shared by the Company and the dealer. Interestincome related to such unsecured loans is reflected in the results of the Finance segment, while theCompany’s share of any profit or loss is reflected in the results of the Dealer segment.
(See Notes B and E of Notes to Consolidated Financial Statements under Item 8, “FinancialStatements and Supplementary Data.”)
The Company funds its financing activities generally through operating cash flows supplementedby credit facility borrowings. (See Item 7, “Management’s Discussion and Analysis of FinancialCondition and Results of Operations—Liquidity and Capital Resources,” and Note J of Notes toConsolidated Financial Statements under Item 8, “Financial Statements and Supplementary Data.”)
The Finance Market and Competition
A considerable number of traditional lending sources offer conventional loans at a lower cost toborrowers than the average cost of those offered by the Company. Additionally, many traditionallenders offer borrowers a variety of integrated financial services such as wealth managementservices, which are not offered by the Company. Few lenders, however, are willing to accept works
4

of art as sole collateral as they do not possess the ability both to appraise and to sell works of artwithin a vertically integrated organization. The Company believes that through a combination of itsart expertise and skills in international law and finance, it has the ability to tailor attractivefinancing packages for clients who wish to obtain liquidity from their art assets.
Dealer Segment
Description of Business
On June 7, 2006, the Company and Arcimboldo S.A., a private limited liability companyincorporated under the laws of Luxembourg, entered into a sale and purchase agreement, pursuantto which the Company acquired all the issued and outstanding shares of capital stock of NoortmanMaster Paintings B.V. (or “NMP”), a company incorporated under the laws of the Netherlands andone of the world’s leading art dealers specializing in Dutch and Flemish Old Master Paintings, aswell as French Impressionist and Post-Impressionist paintings. NMP is based in Maastricht, theNetherlands. As an art dealer, NMP sells works of art directly to private collectors and museumsand, from time-to-time, acts as a broker in private purchases and sales of art. NMP’s results areincluded in the Company’s Consolidated Income Statements beginning on June 1, 2006 and are notmaterial to the periods covered by this report.
In the fourth quarter of 2006, due to the acquisition of NMP and the resulting increase in theCompany’s Dealer activities, certain activities which were previously managed and reported as partof the Auction segment were realigned with NMP and aggregated into a newly established Dealersegment under the oversight of an executive committee responsible for managing the Company’sportfolio of Dealer activities. Such activities principally include:
• The investment in and resale of art and other collectibles directly by the Company.
• The investment in art through unsecured loans made by the Company to unaffiliated artdealers. (See Note E of Notes to Consolidated Financial Statements under Item 8, “FinancialStatements and Supplementary Data.”)
• The activities of certain equity investees, including Acquavella Modern Art (“AMA”). (SeeNote F of Notes to Consolidated Financial Statements under Item 8, “Financial Statementsand Supplementary Data.”)
• The purchase and resale of art through an art dealer whose results are required to beconsolidated with the Company’s results under generally accepted accounting principles. TheCompany has no equity investment in this entity. (See Note R of Notes to ConsolidatedFinancial Statements under Item 8, “Financial Statements and Supplementary Data.”)
Robert Noortman, Managing Director of NMP, died unexpectedly on January 14, 2007. NMP iscontinuing under the leadership of Mr. Noortman’s son, William. (See “Acquisition” below and NoteC of Notes to Consolidated Financial Statements under Item 8, “Financial Statements andSupplementary Data,” for more discussion of the acquisition and the impact of Mr. Noortman’sdeath.)
The Dealer Market and Competition
The Dealer segment operates in the same market as the Auction segment and is impacted tovarying degrees by many of the same competitive factors (as discussed above under “The AuctionMarket and Competition”). The most prominent competitive factors impacting the Dealer segment,which are not ranked in any particular order, include: (i) relationships and personal interactionbetween the buyer or seller and the dealer; (ii) the level of specialized expertise of the dealer; and(iii) the ability of the dealer to finance purchases of art.
5

Discontinued Operations
In the fourth quarter of 2003, the Company committed to a plan to sell its domestic real estatebrokerage business, Sotheby’s International Realty, Inc. (“SIR”), as well as most of its real estatebrokerage offices outside of the U.S. As a result, such operations qualified for treatment asdiscontinued operations in the fourth quarter of 2003.
On February 17, 2004, the Company consummated the sale of SIR to a subsidiary of RealogyCorporation (“Realogy”), formerly Cendant Corporation. In conjunction with the sale, the Companyentered into an agreement with Realogy to license the Sotheby’s International Realty trademark andcertain related trademarks for an initial 50-year term with a 50-year renewal option (the “RealogyLicense Agreement”). Initially, the Realogy License Agreement was applicable to the U.S., Canada,Israel, Mexico and certain Caribbean countries.
Also in conjunction with the sale, Realogy received options to acquire most of the other non-U.S. offices of the Company’s real estate brokerage business and to expand the Realogy LicenseAgreement to cover the related trademarks in other countries outside the U.S., excluding Australiaand New Zealand (the “International Options”). The International Options were exercised byRealogy and the Realogy License Agreement was amended to cover New Zealand during 2004. As aresult, such operations qualified for treatment as discontinued operations in 2004.
In the fourth quarter of 2004, the Company committed to a plan to discontinue its real estatebrokerage business in Australia and license the Sotheby’s International Realty trademark and certainrelated trademarks in Australia. The Company had expected to consummate a license agreementrelated to such trademarks some time in 2006, but such an agreement could not be reached on termsacceptable to the Company. As a result, in the second quarter of 2006, management decided tocontinue operating the Company’s real estate brokerage business in Australia. Accordingly, theoperating results of this business, which had previously been reported as discontinued operations inthe Consolidated Income Statements since the fourth quarter of 2004, have been reclassified into theCompany’s results from continuing operations for all periods presented. The Australia real estatebrokerage business, which is the only remaining component of the Company’s former Real Estatesegment, is not material to the Company’s results of operations, financial condition or liquidity.
(See Note T of Notes to Consolidated Financial Statements under Item 8, “Financial Statementsand Supplementary Data,” for additional information on Discontinued Operations.)
Licensing
As discussed under “Discontinued Operations” above, in conjunction with the sale of SIR, theCompany entered into an agreement with Realogy to license the SIR trademark and certain relatedtrademarks. The Realogy License Agreement provides for an ongoing license fee during its termbased on the volume of commerce transacted under the licensed trademarks. In 2006 and 2005, theCompany earned $2.6 million and $1.3 million, respectively, in license fee revenue related to theRealogy License Agreement. The Company continues to consider additional opportunities to licensethe Sotheby’s brand in businesses where appropriate.
Financial and Geographical Information about Segments
See Note D of Notes to Consolidated Financial Statements under Item 8, “Financial Statementsand Supplementary Data,” for financial and geographical information about the Company’ssegments.
Personnel
As of December 31, 2006, the Company had 1,497 employees with 551 located in NorthAmerica; 567 in the U.K.; 279 in Continental Europe and 100 in Asia. The Company regards itsrelations with its employees as good. The table below provides a breakdown of the Company’semployees as of December 31, 2006 and 2005.
6

December 31 2006 2005
Auction segment . . . . . . . . . . . . . . . . . . . . . . . . . . . . . . . . . . . . . . . . . . . . . . . . . . . . 1,351 1,315Finance segment . . . . . . . . . . . . . . . . . . . . . . . . . . . . . . . . . . . . . . . . . . . . . . . . . . . . 7 7Dealer segment . . . . . . . . . . . . . . . . . . . . . . . . . . . . . . . . . . . . . . . . . . . . . . . . . . . . . 8 1All Other . . . . . . . . . . . . . . . . . . . . . . . . . . . . . . . . . . . . . . . . . . . . . . . . . . . . . . . . . . . 131 120
Total . . . . . . . . . . . . . . . . . . . . . . . . . . . . . . . . . . . . . . . . . . . . . . . . . . . . . . . . . . . 1,497 1,443
Employees classified within “All Other” principally relate to the Company’s central corporateand information technology departments.
(See “Strategic Initiatives” under Item 7, “Management’s Discussion and Analysis of FinancialCondition and Results of Operations.”)
Technology
Over the past several years, the Company has made substantial investments in informationtechnology designed to improve client service. A new portfolio of enterprise systems anchored bySAP has been deployed across the organization, which has enhanced the quality of information andprocessing of sales and inventory tracking, as well as data management. A number of new web sitedevelopments are underway that are targeted at providing clients with real-time access to theiraccount data and balances, as well as information on current and historical transactions, auctiontracking services and enhanced media content. The Company’s goal is to enhance the servicesprovided to its clients in order to maximize the value from these investments.
(See “Strategic Initiatives” under Item 7, “Management’s Discussion and Analysis of FinancialCondition and Results of Operations.”)
Website Address
The Company makes available free of charge its annual report on Form 10-K, quarterly reportson Form 10-Q and current reports on Form 8-K through a hyperlink from its website,www.sothebys.com, to www.shareholder.com/bid/edgar.cfm, a website maintained by an unaffiliatedthird-party service. Such reports are made available on the same day that they are electronicallyfiled with or furnished to the Securities and Exchange Commission (the “SEC”).
ITEM 1A: RISK FACTORS
Operating results for the Company, as well as the Company’s liquidity, are significantlyinfluenced by a number of risk factors, many of which are not within the Company’s control. Thesefactors, which are not ranked in any particular order, include:
The overall strength of the international economy and financial markets
The art market in which the Company operates is influenced over time by the overall strengthof the international economy and financial markets, although this correlation may not beimmediately evident in the short-term. The Company’s business can be particularly influenced by theeconomies of the U.S., the U.K., and the major countries or territories of Continental Europe andAsia (principally China and Japan).
Interest rates
Fluctuations in interest rates influence the Company’s cost of funds for borrowings under itscredit facility that may be required to finance working capital needs and, in particular, the Financesegment’s client loan portfolio.
7

Government laws and regulations
Many of the Company’s activities are subject to laws and regulations including, but not limitedto, import and export regulations, cultural property ownership laws, data protection and privacylaws, anti-money laundering laws, antitrust laws and value added sales taxes. In addition, theCompany is subject to local auction regulations, such as New York City Auction RegulationsSubchapter M of Title 6 §§ 2-121–2-125, et. seq. Such regulations do not impose a materialimpediment to the worldwide business of the Company but do affect the market generally, and amaterial adverse change in such regulations could affect the business. Additionally, export andimport laws and cultural property ownership laws could affect the availability of certain kinds ofproperty for sale at the Company’s principal auction locations or could increase the cost of movingproperty to such locations.
Political conditions and world events
Global political conditions and world events may affect the Company’s business through theireffect on the economies of various countries, as well as on the decision of buyers and sellers topurchase and sell art in the wake of economic uncertainty. Global political conditions may alsoinfluence the enactment of legislation that could adversely affect the Company’s business.
Foreign currency exchange rate movements
The Company has operations throughout the world, with approximately 53% of its revenuescoming from outside of the U.S. in 2006. Accordingly, fluctuations in exchange rates can have asignificant impact on the Company’s results of operations.
Seasonality of the Company’s auction business
The worldwide art auction market has two principal selling seasons, spring and autumn. TheCompany’s revenues and operating income may be affected as described under “Seasonality” inItem 7, “Management’s Discussion and Analysis of Financial Condition and Results of Operations.”
Competition
Competition in the art market is intense, including competition both with other auctioneers andwith art dealers. See “Auction Segment—The Art Market and Competition” under Item 1,“Description of Business,” for a discussion of the factors that may affect the Company’s ability tocompete successfully in its business.
The amount and quality of property being consigned to art auction houses
The amount and quality of property being consigned to art auction houses is influenced by anumber of factors not within the Company’s control. Many major consignments, and specificallysingle-owner sale consignments, often become available as a result of the death or financial ormarital difficulties of the owner, all of which are unpredictable. This, plus the ability of theCompany to sell such property, can cause auction and related revenues to be highly variable fromperiod to period.
The demand for fine arts, decorative arts, and collectibles
The demand for fine arts, decorative arts, and collectibles is influenced not only by overalleconomic conditions, but also by changing trends in the art market as to which kinds of propertyand the works of which artists are most sought after and by the collecting preferences of individualcollectors, all of which can be unpredictable.
8

Qualified personnel
The Company’s business is largely a service business in which the ability of its employees todevelop and maintain relationships with potential sellers and buyers of works of art is essential tothe Company’s success. Moreover, the Company’s business is both complex and unique, making itimportant to retain key specialists and members of management. Accordingly, the Company’sbusiness is highly dependent upon its success in attracting and retaining qualified personnel.
Demand for art-related financing
The Company’s Finance segment is dependent on the demand for art-related financing, whichcan be significantly influenced by overall economic conditions and by the often unpredictablefinancial requirements of owners of major art collections.
Strategic Initiatives
As discussed in more detail below within “Strategic Initiatives” under Item 7, “Management’sDiscussion and Analysis of Financial Condition and Results of Operations,” management isundertaking certain strategic initiatives designed to refocus the Company’s business portfolio. TheCompany’s future operating results are dependent in part on the success of management inimplementing the Company’s strategic plans.
Value of artworks
The art market is not a highly liquid trading market, as a result of which the valuation ofartworks is inherently subjective and the realizable value of artworks often varies over time.Accordingly, the Company is at risk both as to the value of art held as inventory and as to thevalue of artworks pledged as collateral for Finance segment loans.
U.K. Pension Plan
Future costs related to the Company’s U.K. defined benefit pension plan are heavily influencedby changes in interest rates and investment performance in the debt and equity markets, both ofwhich are unpredictable. (See “Salaries and Related Costs—Employee Benefits” under Item 7,“Management’s Discussion and Analysis of Financial Condition and Results of Operations.”)
Income taxes
The Company operates in many tax jurisdictions throughout the world. Variations in taxableincome in the various jurisdictions in which the Company does business can have a significantimpact on its effective tax rate.
ITEM 1B: UNRESOLVED STAFF COMMENTS
None.
ITEM 2: PROPERTIES
The Company’s North American Auction, Dealer and Finance operations, as well as itscorporate offices, are headquartered at 1334 York Avenue, New York, New York (the “YorkProperty”). The York Property is home to the Company’s sole North American salesroom and itsprincipal North American exhibition space. The Company completed the construction of the six-story addition to and renovation of the York Property in 2001, which expanded the Company’sauction, warehouse and office space in New York City and enabled the Company to consolidatemany of its New York City operations. On February 7, 2003, the Company sold the York Propertyand entered into an agreement to lease it back from the buyer for an initial 20-year term, withoptions to extend the lease for two additional 10-year terms. According to the terms of the lease, ifthe landlord desires to sell the York Property, notice shall be given to the Company by the landlord
9

of such proposed sale and a statement of the proposed purchase price and the proposed closing datefor the transaction (the “Landlord’s Offer”). Upon receipt of such notice, the Company has thirtydays to accept or reject the Landlord’s Offer. If accepted, the Company would purchase the YorkProperty at the proposed purchase price. In February 2007, the Company was advised that thelandlord of the York Property intends to market and sell the York Property. Management iscurrently assessing its rights and options with respect to the York Property. The Company alsoleases office and exhibition space in several other major cities throughout the U.S.
The Company’s U.K. operations (primarily Auction) are centered at New Bond Street, London,where the main salesrooms, exhibition space and administrative offices of Sotheby’s U.K. arelocated. The Company owns a portion of the New Bond Street premises (approximately 35%), andthe remaining portion is leased under short and long-term leases (approximately 65%). The leaserelated to a small portion of the New Bond Street complex is due to expire in September 2007 and,as a result, the Company will lose exhibition and office space. To partially compensate for this lossof space, the Company has begun a refurbishment of the New Bond Street premises. Thisrefurbishment is expected to cost approximately $11 million, of which approximately $4 million hasbeen spent through December 31, 2006. The refurbishment of the New Bond Street premises isexpected to be completed in September 2007.
In the U.K., the Company also leases space for its specially dedicated middle market auctionsalesroom at Olympia, a building located in Kensington, West London. In addition, the Companyleases warehouse space at King’s House in West London and owns land and a building atBillingshurst, West Sussex (the “Sussex Property”), which previously housed an auction salesroom.The Company has entered into an agreement for the sale of vacated parts of the Sussex Property.The Company has received planning permission for redevelopment of the land for sale; however,consummation of the sale is conditional upon the completion of a statutory review period.Management anticipates that the sale of the Sussex Property will be completed in March 2007. (SeeNote O of Notes to Consolidated Financial Statements under Item 8, “Financial Statements andSupplementary Data.”)
The Company also leases space primarily for Auction operations in various locations throughoutContinental Europe, including salesrooms in Amsterdam, The Netherlands; Geneva and Zurich,Switzerland; Milan, Italy; and Paris, France; in Asia, including Hong Kong and Singapore; and inAustralia. Additionally, the Company owns land and a building in Maastricht, The Netherlands,which houses Noortman Master Paintings, an art dealer acquired by the Company in June 2006 (see“Acquisition” under Item 7, “Management’s Discussion and Analysis of Financial Condition andResults of Operations” and Note C of Notes to Consolidated Financial Statements under Items 8,“Financial Statements and Supplementary Data”).
In management’s opinion, the Company’s worldwide premises are adequate for the currentconduct of its business. However, management continually analyzes its worldwide premises for bothits current and future business needs as part of its ongoing efforts to manage infrastructure andother overhead costs. Where appropriate, management will continue to make any necessary changesto address the Company’s premises requirements. (See “Strategic Initiatives” under Item 7,“Management’s Discussion and Analysis of Financial Condition and Results of Operations.”)
ITEM 3: LEGAL PROCEEDINGS
The Company becomes involved, from time to time, in various claims and lawsuits incidental tothe ordinary course of its business. Management does not believe that the outcome of any of thesepending claims or proceedings will have a material adverse effect on the Company’s business, resultsof operations, financial condition and/or liquidity. (See statement on Forward Looking Statements.)
ITEM 4: SUBMISSION TO A VOTE OF SECURITY HOLDERS
No matters were submitted to a vote of the Company’s shareholders during the fourth quarterof 2006.
10
PART II
ITEM 5: MARKET FOR THE REGISTRANT’S COMMON EQUITY AND RELATEDSHAREHOLDER MATTERS
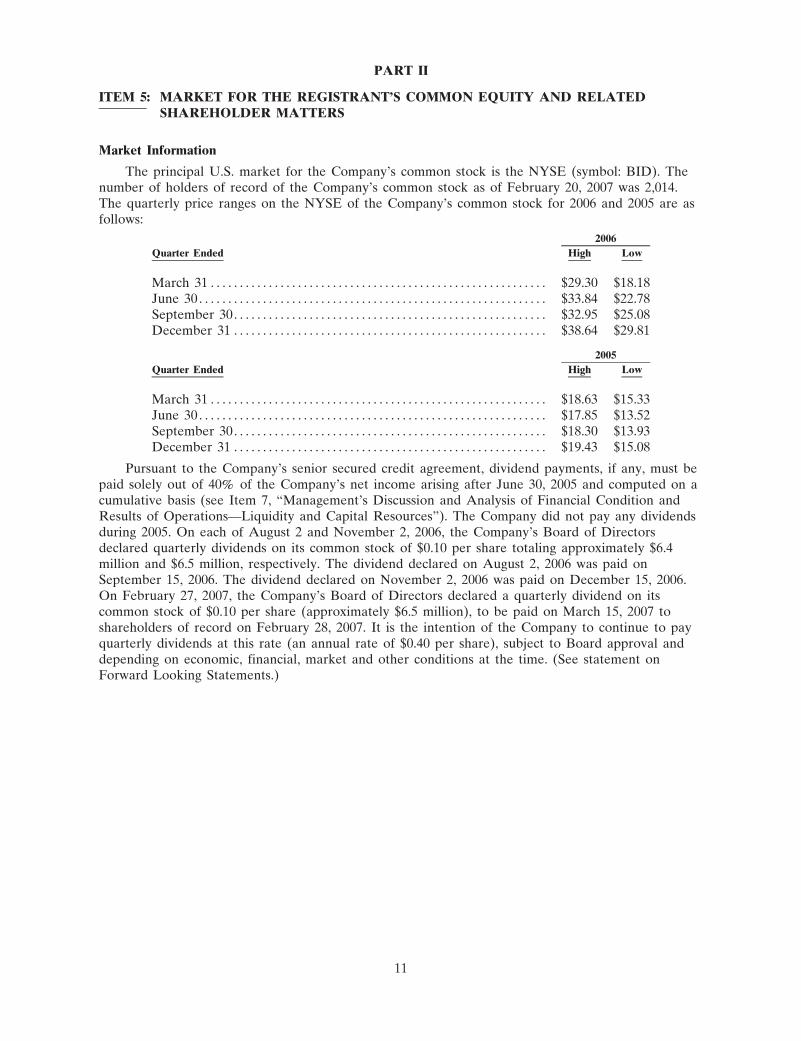
Market Information
The principal U.S. market for the Company’s common stock is the NYSE (symbol: BID). Thenumber of holders of record of the Company’s common stock as of February 20, 2007 was 2,014.The quarterly price ranges on the NYSE of the Company’s common stock for 2006 and 2005 are asfollows:
Quarter Ended High Low
2006
March 31 . . . . . . . . . . . . . . . . . . . . . . . . . . . . . . . . . . . . . . . . . . . . . . . . . . . . . . . . . . $29.30 $18.18June 30 . . . . . . . . . . . . . . . . . . . . . . . . . . . . . . . . . . . . . . . . . . . . . . . . . . . . . . . . . . . . $33.84 $22.78September 30. . . . . . . . . . . . . . . . . . . . . . . . . . . . . . . . . . . . . . . . . . . . . . . . . . . . . . $32.95 $25.08December 31 . . . . . . . . . . . . . . . . . . . . . . . . . . . . . . . . . . . . . . . . . . . . . . . . . . . . . . $38.64 $29.81
Quarter Ended High Low
2005
March 31 . . . . . . . . . . . . . . . . . . . . . . . . . . . . . . . . . . . . . . . . . . . . . . . . . . . . . . . . . . $18.63 $15.33June 30 . . . . . . . . . . . . . . . . . . . . . . . . . . . . . . . . . . . . . . . . . . . . . . . . . . . . . . . . . . . . $17.85 $13.52September 30. . . . . . . . . . . . . . . . . . . . . . . . . . . . . . . . . . . . . . . . . . . . . . . . . . . . . . $18.30 $13.93December 31 . . . . . . . . . . . . . . . . . . . . . . . . . . . . . . . . . . . . . . . . . . . . . . . . . . . . . . $19.43 $15.08
Pursuant to the Company’s senior secured credit agreement, dividend payments, if any, must bepaid solely out of 40% of the Company’s net income arising after June 30, 2005 and computed on acumulative basis (see Item 7, “Management’s Discussion and Analysis of Financial Condition andResults of Operations—Liquidity and Capital Resources”). The Company did not pay any dividendsduring 2005. On each of August 2 and November 2, 2006, the Company’s Board of Directorsdeclared quarterly dividends on its common stock of $0.10 per share totaling approximately $6.4million and $6.5 million, respectively. The dividend declared on August 2, 2006 was paid onSeptember 15, 2006. The dividend declared on November 2, 2006 was paid on December 15, 2006.On February 27, 2007, the Company’s Board of Directors declared a quarterly dividend on itscommon stock of $0.10 per share (approximately $6.5 million), to be paid on March 15, 2007 toshareholders of record on February 28, 2007. It is the intention of the Company to continue to payquarterly dividends at this rate (an annual rate of $0.40 per share), subject to Board approval anddepending on economic, financial, market and other conditions at the time. (See statement onForward Looking Statements.)
11

Equity Compensation Plans
The following table provides information as of December 31, 2006 with respect to shares of theCompany’s common stock that may be issued under its existing equity compensation plans, includingthe Sotheby’s 1997 Stock Option Plan (the “1997 Stock Option Plan”), the Sotheby’s Amended andRestated Restricted Stock Plan (the “Restricted Stock Plan”) and the Sotheby’s Stock CompensationPlan for Non-Employee Directors (the “Directors Stock Plan”):
(A) (B) (C)
Plan Category (1)
Number ofSecurities to be
Issued UponExercise ofOutstanding
Options,Warrants and
Rights (2)
Weighted AverageExercise Price of
OutstandingOptions, Warrants
and Rights (3)
Number of SecuritiesRemaining Avaliable forFuture Issuance UnderEquity Compensation
Plans (4)
(In thousands, except per share data)
Equity compensation plans approved byshareholders . . . . . . . . . . . . . . . . . . . . . . . . . . . . . . . . . 4,300 $15.65 4,389
Equity compensation plans not approved byshareholders . . . . . . . . . . . . . . . . . . . . . . . . . . . . . . . . . — — —
Total . . . . . . . . . . . . . . . . . . . . . . . . . . . . . . . . . . . . . . 4,300 $15.65 4,389
(1) See Note M of Notes to Consolidated Financial Statements under Item 8, “Financial Statementsand Supplementary Data,” for a description of the material features of and additionalinformation related to the equity compensation plans.
(2) Includes 2,080,782 shares of common stock awarded under the Restricted Stock Plan on whichthe restrictions have not yet lapsed.
(3) The weighted-average exercise price does not take into account 2,080,782 shares of commonstock awarded under the Restricted Stock Plan, which have no exercise price.
(4) Includes 3,879,805 shares of common stock available for future issuance under the RestrictedStock Plan.
Issuance of Unregistered Securities
On August 4, 2006, September 15, 2006, November 6, 2006 and December 15, 2006, theCompany issued 1,325, 210, 1,666 and 195 shares of its common stock or deferred stock units,respectively, to certain directors pursuant to the Company’s stock compensation plan for its non-employee directors as partial compensation for Board service. Upon terminating Board service, adeferred stock unit holder will receive one share of Company common stock in exchange for eachunit held. The Company issued these securities pursuant to a registration exemption under Section4(2) of the Securities Act of 1933, as amended, relying on the directors’ control person andaccredited investor status by virtue of their being directors.
12

Performance Graph
The following graph compares the Company’s cumulative total shareholder return on itscommon stock (for the five year period from December 31, 2001 to December 31, 2006) with thecumulative return of the Standard & Poor’s MidCap 400 Stock Index (“S&P MidCap 400”) and theCompany’s Peer Group (“the Peer Group”). The Peer Group consists of Nordstrom, Inc., SaksHoldings, Inc., Tiffany & Co. and Movado, Inc.
The Company believes the members of this Peer Group to be purveyors of luxury goodsappealing to a segment of the population consistent with the Company’s own clientele as no otherauction house of comparable market share or capitalization is publicly traded.
The graph reflects an investment of $100 in the Company’s common stock, the S&P MidCap400, which includes the Company, and the Company’s Peer Group, respectively, on December 31,2001, and a reinvestment of dividends at the average of the closing stock prices at the beginning andend of each quarter.
Comparison of Five-Year Cumulative Total Return AmongSotheby’s, the Peer Group Index and the S&P MidCap 400
as of December 31, 2006
$0
$50
$100
$150
$200
$250
12/31/01 12/31/02 12/31/03 12/31/04 12/31/05 12/31/06
Sotheby's Peer Group S&P MidCap 400
$350
$300
12/31/2001 12/31/2002 12/31/2003 12/31/2004 12/31/2005 12/31/2006
Sotheby’s . . . . . . . . . . . . . . . . . . . . . . . . . . . . $100.00 $ 54.18 $ 82.24 $109.33 $110.54 $187.99Peer Group. . . . . . . . . . . . . . . . . . . . . . . . . . $100.00 $131.66 $214.82 $228.70 $238.96 $319.64S&P MidCap 400. . . . . . . . . . . . . . . . . . . . $100.00 $ 85.49 $115.65 $134.43 $151.07 $166.65
13

ITEM 6: SELECTED FINANCIAL DATA
The following table provides selected financial data for the Company (in thousands of dollars,except per share data).
Year Ended December 31 2006 2005 2004 2003 2002
Net Auction Sales (1). . . . . . $3,234,526 $2,361,830 $2,334,937 $1,455,970 $1,552,703Income statement data:Auction and related
revenues . . . . . . . . . . . . . . . . . $ 631,344 $ 496,899 $ 439,526 $ 307,608 $ 293,565Finance revenues . . . . . . . . . . 15,864 8,302 5,907 5,310 5,997Dealer revenues . . . . . . . . . . . 12,776 5,131 3,604 1,382 3,179License fee revenues. . . . . . . 2,922 1,404 45,745 — —Other revenues . . . . . . . . . . . . 1,903 2,117 2,274 3,288 5,126
Total revenues. . . . . . . . . . . $ 664,809 $ 513,853 $ 497,056 $ 317,588 $ 307,867
Net interest expense . . . . . . . $ (27,148) $ (27,738) $ (30,267) $ (30,333) $ (20,174)Income (loss) from
continuing operations . . . . $ 107,359 $ 63,217(2) $ 62,397(3) $ (26,260)(4)(6) $ (59,582)(5)(6)
Net income (loss) . . . . . . . . . . $ 107,049 $ 61,602(2) $ 86,679(3) $ (20,848)(4)(6) $ (55,252)(5)(6)
Basic income (loss) pershare from continuingoperations . . . . . . . . . . . . . . . $ 1.78 $ 1.04(2) $ 1.01(3) $ (0.43)(4)(6) $ (0.97)(5)(6)
Basic earnings (loss) pershare . . . . . . . . . . . . . . . . . . . . $ 1.77 $ 1.01(2) $ 1.40(3) $ (0.34)(4)(6) $ (0.90)(5)(6)
Diluted income (loss) pershare from continuingoperations . . . . . . . . . . . . . . . $ 1.73 $ 1.02(2) $ 1.00(3) $ (0.43)(4)(6) $ (0.97)(5)(6)
Diluted earnings (loss) pershare . . . . . . . . . . . . . . . . . . . . $ 1.72 $ 1.00(2) $ 1.38(3) $ (0.34)(4)(6) $ (0.90)(5)(6)
Cash dividends declaredper share . . . . . . . . . . . . . . . . $ 0.20 $ — $ — $ — $ —
Balance sheet data:Working capital . . . . . . . . . . . . $ 258,636 $ 141,711 $ 212,318 $ 82,404 $ 9,544Total assets . . . . . . . . . . . . . . . . $1,477,165 $1,060,752 $1,224,812 $ 903,346 $ 869,812Credit facility borrowings . . $ — $ 34,542 $ — $ 20,000 $ 100,000Long-term debt (net) . . . . . . $ 99,791 $ 99,701 $ 99,617 $ 99,539 $ 99,466York Property capital
lease obligation . . . . . . . . . . $ 170,605 $ 172,044 $ 172,169 $ 172,282 $ —Shareholders’ equity . . . . . . . $ 301,687 $ 126,276(7) $ 235,385 $ 124,654 $ 134,475
(1) Represents the hammer (sale) price of property sold at auction.
(2) Amounts for the year ended December 31, 2005 include (on a pre-tax basis) $3.1 million incredit facility termination costs and antitrust related charges of $1.1 million.
(3) Amounts for the year ended December 31, 2004 include (on a pre-tax basis) one-time LicenseFee Revenues of $45.6 million, Retention Costs of $0.3 million, Net Restructuring Charges of$0.1 million and antitrust related charges of $1.9 million.
(4) Amounts for the year ended December 31, 2003 include (on a pre-tax basis) Retention Costs of$8.5 million, Net Restructuring Charges of $5 million and antitrust related charges of $3.1million.
(5) Amounts for the year ended December 31, 2002 include (on a pre-tax basis) Retention Costs of$22.6 million, Net Restructuring Charges of $2 million and antitrust related charges of $41million.
(6) As restated, see “Review of Stock Option Granting Practices” under Item 7, “Management’sDiscussion and Analysis of Financial Condition and Results of Operations.”
(7) The significant decrease in shareholders’ equity between 2004 and 2005 is principally due to theimpact of the recapitalization transaction discussed in Note U of Notes to Consolidated FinancialStatements under Item 8, “Financial Statements and Supplementary Data.”
14

ITEM 7: MANAGEMENT’S DISCUSSION AND ANALYSIS OF FINANCIAL CONDITIONAND RESULTS OF OPERATIONS
Seasonality
The worldwide art auction market has two principal selling seasons, spring and autumn. TheCompany’s auction business is seasonal, with peak revenues and operating income generallyoccurring in the second and fourth quarters of each year. Consequently, first and third quarterresults of the Auction segment historically reflect lower Net Auction Sales (as defined below under“Key Performance Indicators”) when compared to the second and fourth quarters and a loss fromcontinuing operations due to the fixed nature of many of the Company’s operating expenses. (SeeNote Y of Notes to Consolidated Financial Statements under Item 8, “Financial Statements andSupplementary Data,” for information on the Company’s quarterly results for the years endedDecember 31, 2006 and 2005.)
Critical Accounting Estimates
The preparation of financial statements and related disclosures in conformity with GAAP (asdefined below under “Use of Non-GAAP Financial Measures”) requires management to makejudgments, assumptions and estimates that affect the amounts reported in the Consolidated FinancialStatements and accompanying notes. Actual results may ultimately differ from management’s originalestimates as future events and circumstances sometimes do not develop as expected. Note B ofNotes to Consolidated Financial Statements describes the significant accounting policies and methodsused in the preparation of the Consolidated Financial Statements. In addition, management believesthat the following are the most critical accounting estimates, which are not ranked in any particularorder, which may affect the Company’s financial condition and/or results of operations.
(1) Value of artworks—The art market is not a highly liquid trading market. As a result, thevaluation of artworks is inherently subjective and the realizable value of artworks often variesover time. Accordingly, the Company is at risk as to the value of art held as inventory by itsDealer and Auction segments, the value of its investment in AMA and as to the value ofartworks pledged as collateral for Finance segment loans.
If there was a decline in the estimated realizable value of the artworks held in inventory by theCompany or the inventory held by AMA, management would be required to evaluate whetherto record losses in the Auction and/or Dealer segments to reduce the carrying values of itsinventory and/or investment in AMA.
Additionally, to the extent that the Company is looking wholly or partially to the artworkspledged as collateral for repayment of Finance segment loans, repayment can be adverselyimpacted by a decline in the estimated realizable value of the collateral. Managementreevaluates the value of the collateral for specific loans when it becomes aware of a situationwhere the estimated realizable value of the collateral may be less than the loan balance, andwith respect to which the under-collateralized amount may not be collectible from theborrower. In the event that the estimated realizable value of the artworks pledged as collateraldeclines and becomes less than the corresponding loan balances, the Company would berequired to assess whether it is necessary to record losses in the Finance segment to reduce thecarrying value of specific loans, after taking into account the ability of borrowers to repay theloans.
Due to the inherent subjectivity involved in estimating the value of artworks, management’sjudgments about the estimated realizable value of art held by its Dealer and Auction segments,the value of its investment in AMA and the value of artworks pledged as collateral for Financesegment loans may prove, with the benefit of hindsight, to be inaccurate.
(See Notes B and E of Notes to Consolidated Financial Statements under Item 8, “FinancialStatements and Supplementary Data.”)
15
(2) Pension Benefits—The pension obligations related to the Company’s U.K. defined benefitpension plan (the “U.K. Pension Plan”) are developed from an actuarial valuation. Inherent inthis valuation are key assumptions and estimates, including the discount rate, expected long-term return on plan assets, future compensation increases, and other factors, which are updatedon an annual basis. In determining these assumptions and estimates, management considerscurrent market conditions, market indices and other relevant data.
The discount rate assumption represents the approximate weighted average rate at which theCompany’s pension obligations could be effectively settled and is based on a hypotheticalportfolio of high-quality corporate bonds with maturity dates approximating the length of timeremaining until individual benefit payment dates. The discount rate used to calculate the $6.7million in net annual pension cost related to the U.K. Pension Plan for the year endedDecember 31, 2006 was 4.9%. A hypothetical increase or decrease of 0.1% in this assumption(i.e., from 4.9% to 5% or from 4.9% to 4.8%) would result in a decrease or increase in netpension cost of approximately $0.6 million. As of the date of the most recent plan actuarialvaluation, the discount rate used to calculate the $344 million projected benefit obligationrelated to the U.K. Pension Plan was 4.8%. A hypothetical increase or decrease of 0.1% in thisassumption (i.e., from 4.8% to 4.9% or from 4.8% to 4.7%) would result in a decrease orincrease in the projected benefit obligation of approximately $8 million.
The assumption for the expected long-term return on plan assets is based on expected futureappreciation, as well as dividend and interest yields available in equity and bond markets as ofthe plan’s measurement date and weighted according to the composition of invested plan assets.The long-term return on plan assets used to calculate the $6.7 million in net pension costrelated to the U.K. Pension Plan for the year ended December 31, 2006 was 7.25% per year.A hypothetical increase or decrease of 0.25% in this assumption (i.e., from 7.25% to 7.5% orfrom 7.25% to 7%) would result in a decrease or increase in net annual pension cost ofapproximately $0.6 million.
The assumption for future compensation increases is established after considering historicalsalary data for U.K. employees and current economic data for inflation, as well asmanagement’s expectations for future salary growth. The assumption for future compensationincreases used to calculate the $6.7 million in net annual pension cost related to the U.K.Pension Plan for the year ended December 31, 2006 was 4.5% per annum. A hypotheticalincrease or decrease of 0.25% in this assumption (i.e., from 4.5% to 4.75% or from 4.5% to4.25%) would result in an increase or decrease in net pension cost of approximately $0.6million. As of the date of the most recent plan actuarial valuation, the assumption for futurecompensation increases used to calculate the $344 million projected benefit obligation related tothe U.K. Pension Plan was 4.75% per year. A hypothetical increase or decrease of 0.25% inthis assumption (i.e., from 4.75% to 5% or from 4.75% to 4.5%) would result in an increase ordecrease in the projected benefit obligation of approximately $2.9 million.
As of the date of the most recent plan actuarial valuation, pre-tax actuarial losses related tothe U.K. Pension Plan totaled approximately $91 million ($63.7 million, after tax). These lossesaccumulated over several years as a result of differences in actual experience compared toprojected experience, and were specifically influenced by a general trend of lower discountrates, driven by the U.K. interest rate environment, as well as the adoption of updatedmortality tables reflecting more recent data on longer life expectancies. These losses, which arereflected in the Consolidated Balance Sheets on an after-tax basis within accumulated othercomprehensive loss and not yet recognized in net annual pension cost, are being systematicallyrecognized as an increase in future net pension cost in accordance with Statement of FinancialAccounting Standards (“SFAS”) No. 87, “Employers’ Accounting for Pensions,” and SFASNo. 158, “Employers’ Accounting for Defined Benefit Pension and Other Postretirement Plans,an amendment of FASB Statements No. 87, 88, 106, and 132(R).” Such pre-tax losses in excessof 10% of the greater of the market-related value of plan assets or the plan’s projected benefitobligation are recognized over a period of approximately 14 years, which represents the averageremaining service period of active employees expected to receive benefits under the plan.Management projects that, in 2007, the amortization of such pre-tax losses will increase by
16

approximately $2.6 million when compared to 2006 (from $3.4 million to $6 million),significantly contributing to the $4 million expected overall increase in costs related to the U.K.Pension Plan. In accordance with SFAS No. 87, the market-related value of plan assets wasderived using a method that adjusts for 20% of the last five years’ actual gains and losses.
(See Note N of Notes to Consolidated Financial Statements under Item 8, “FinancialStatements and Supplementary Data,” for additional information related to the U.K. PensionPlan, as well as the Company’s other material pension arrangements.)
(3) Settlement Liabilities—In conjunction with the settlement of certain civil litigation related to theinvestigation by the Antitrust Division of the U.S. Department of Justice (the “DOJ”), in May2003 the Company issued to the class of plaintiffs vendor’s commission discount certificates(“Discount Certificates”) with a face value of $62.5 million. The Discount Certificates are fullyredeemable in connection with any auction conducted by the Company or Christie’s in the U.S.or in the U.K. and may be used to satisfy consignment charges involving vendor’s commission,risk of loss and/or catalogue illustration. The court determined that the $62.5 million face valueof the Discount Certificates had a fair market value of not less than $50 million, whichrepresents the amount recorded by the Company as settlement liabilities in the third quarter of2000. The Discount Certificates will expire on May 14, 2008 and cannot be redeemedsubsequent to that date; however, any unused Discount Certificates may be redeemed for cashat their face value at any time between May 15, 2007 and May 14, 2008.
As of December 31, 2006, the outstanding face value of unused Discount Certificates that theCompany could be required to redeem was $46.7 million and the carrying value of suchDiscount Certificates reflected within Current Liabilities in the Consolidated Balance Sheetswas approximately $45.8 million. The classification of the remaining liability for the DiscountCertificates within Current Liabilities is based on management’s estimate of future DiscountCertificate redemptions and reflects the fact that unused Discount Certificates may beredeemed for cash starting on May 15, 2007. However, due to the unpredictability of DiscountCertificate redemption activity, actual future redemptions could be materially less thanmanagement’s estimate, which would result in the reversal of any remaining liability prior to orupon the expiration of the Discount Certificates on May 14, 2008.
(See Note Q of Notes to Consolidated Financial Statements under Item 8, “FinancialStatements and Supplementary Data.”)
(4) Income Taxes—At December 31, 2006, the Company had net deferred tax assets of $74.8million primarily resulting from net operating loss and credit carryforwards and deductibletemporary differences, which will reduce taxable income in future periods over a number ofyears. Included in this net deferred tax asset is a valuation allowance of $29.1 million to reducethe Company’s deferred tax assets to the amount that is more likely than not to be realized. Inassessing the need for the valuation allowance management considers, among other things, itsprojections of future taxable income and ongoing prudent and feasible tax planning strategies.If the Company’s projections of future taxable income and other positive evidence consideredin evaluating the need for a valuation allowance prove, with the benefit of hindsight, to beinaccurate, it will be more difficult to support the realization of these deferred tax assets. As aresult, an additional valuation allowance may be required, which would have an adverse impacton the Company’s results. Conversely, should management determine that it would be able torealize its deferred tax assets in the future in excess of its net recorded amount, an adjustmentto the deferred tax asset would have a favorable impact on the Company’s results in the periodsuch determination was made.
Additionally, tax contingencies are recorded to address potential exposures involving taxpositions that the Company has taken that could be challenged by taxing authorities. Thesepotential exposures result from the varying applications of statutes, rules, regulations andinterpretations. The Company’s tax contingencies contain assumptions based on pastexperiences and judgments about potential actions by taxing jurisdictions. The cost of theultimate resolution of these matters may be greater or less than the amount that the Companyhas provided.
17

(See Note K of Notes to Consolidated Financial Statements under Item 8, “FinancialStatements and Supplementary Data.”)
(5) Goodwill and Intangible Assets—Goodwill is not amortized, but is tested for impairment at thereporting unit level annually (October 31 for the Company) and between annual tests ifindicators of impairment exist. These indicators could include a significant change in theoutlook for the business, legal factors, lower than expected operating results, increasedcompetition, or the sale or disposition of a significant portion of a reporting unit. Applicationof the goodwill impairment test requires judgment, including the identification of reportingunits, assignment of assets and liabilities to reporting units, assignment of goodwill to reportingunits, and determination of the fair value of each reporting unit. The fair value of eachreporting unit is estimated using a discounted cash flow methodology. This requires significantjudgments including the estimation of future cash flows, which is dependent on internalforecasts. Changes in the estimates and assumptions used could materially affect thedetermination of fair value and/or goodwill impairment for each reporting unit.
Intangible assets other than goodwill are amortized over their estimated useful lives unless suchlives are deemed indefinite. If indicators of potential impairment exist, intangible assets withdefined useful lives are tested for impairment based on undiscounted cash flows and, ifimpaired, written down to fair value based on either discounted cash flows or appraised values.Intangible assets with indefinite lives are tested annually (October 31 for the Company) forimpairment and written down to fair value as required. Changes in the estimated fair values ofthe Company’s intangible assets could materially affect the determination of impairment.
(See Notes C, H and I of Notes to Consolidated Financial Statements under Item 8, “FinancialStatements and Supplementary Data.”)
Use of Non-GAAP Financial Measures
GAAP refers to generally accepted accounting principles in the United States of America.Included in Management’s Discussion and Analysis of Financial Condition and Results of Operations(“MD&A”) are financial measures presented in accordance with GAAP and also on a non-GAAPbasis.
Specifically, in MD&A, the Company makes reference to Adjusted EBITDA, which is definedas income from continuing operations excluding income tax expense, net interest expense anddepreciation and amortization expense, as well as costs associated with the termination of theCompany’s previous senior secured credit facility in 2005 and certain one-time license fee revenuesand transaction costs recognized in 2004. Management believes that Adjusted EBITDA provides auseful supplemental performance measure of the Company’s operations and financial performance.Management also believes that Adjusted EBITDA-based measures are used by many investors,equity analysts and rating agencies as a measure of the Company’s financial performance. It isimportant to note that Adjusted EBITDA may not be comparable to similarly titled measuresreported by other companies and should not be considered as an alternative to income fromcontinuing operations determined in accordance with GAAP.
Additionally, when material, the Company excludes the impact of changes in foreign currencyexchange rates when comparing current year results to the prior year. Consequently, such period-to-period comparisons are provided on a constant dollar basis by eliminating the impact of changes inforeign currency exchange rates from the prior year.
Management also utilizes these non-GAAP financial measures in analyzing its operating results.A reconciliation of these non-GAAP financial measures to the most directly comparable GAAPmeasures is presented in the “Overview” and “Impact of Foreign Currency Translations” sectionsunder “Results of Operations” below.
18

RESULTS OF OPERATIONS FOR THE YEARS ENDED DECEMBER 31, 2006 AND 2005
Note D (“Segment Reporting”) of Notes to Consolidated Financial Statements should be readin conjunction with this discussion.
Overview
The Company’s income from continuing operations before taxes for the year endedDecember 31, 2006 increased $74.8 million, or 82%, to $165.8 million, reflecting the continuingstrength of the international art market, as Net Auction Sales and Private Sales (both defined belowunder “Key Performance Indicators”) increased significantly from the prior year. The higher levelsof sale activity resulted in an increase in auction and related revenues of $134.4 million, or 27%.The higher level of revenues during the period was partially offset by an increase in operatingexpenses of $77.1 million, or 20%. Management currently anticipates a continuation of the stronginternational art market and is encouraged by the Company’s sales results to date in the first quarterof 2007. (See statement on Forward Looking Statements.)
The Company’s results from continuing operations for the years ended December 31, 2006 and2005 are summarized below (in thousands of dollars):
Year Ended December 31 2006 2005 $ Change % Change
Favorable/(Unfavorable)
Revenues:Auction and related revenues . . . . $ 631,344 $ 496,899 $134,445 27.1%Finance revenues. . . . . . . . . . . . . . . . . 15,864 8,302 7,562 91.1%Dealer revenues . . . . . . . . . . . . . . . . . . 12,776 5,131 7,645 *License fee revenues . . . . . . . . . . . . . 2,922 1,404 1,518 *Other revenues. . . . . . . . . . . . . . . . . . . 1,903 2,117 (214) (10.1%)
Total revenues. . . . . . . . . . . . . . . 664,809 513,853 150,956 29.4%Expenses. . . . . . . . . . . . . . . . . . . . . . . . . . . . . . 467,651 390,590 (77,061) (19.7%)
Operating income. . . . . . . . . . . . . . . . . . . . . 197,158 123,263 73,895 59.9%Net interest expense . . . . . . . . . . . . . . . . . . (27,148) (27,738) 590 2.1%Credit facility termination costs. . . . . . . — (3,069) 3,069 100.0%Other expense . . . . . . . . . . . . . . . . . . . . . . . . (4,227) (1,474) (2,753) *
Income from continuing operationsbefore taxes . . . . . . . . . . . . . . . . . . . . . . . . 165,783 90,982 74,801 82.2%
Equity in earnings of investees, netof taxes. . . . . . . . . . . . . . . . . . . . . . . . . . . . . 1,626 829 797 96.1%
Income tax expense. . . . . . . . . . . . . . . . . . . 60,050 28,594 (31,456) *
Income from continuing operations . . . $ 107,359 $ 63,217 $ 44,142 69.8%
Key performance indicators:Aggregate Auction Sales (a) . . . . . . . . . . $3,747,854 $2,752,185 $995,669 36.2%Net Auction Sales (b) . . . . . . . . . . . . . . . . $3,234,526 $2,361,830 $872,696 36.9%Private Sales (c) . . . . . . . . . . . . . . . . . . . . . . $ 327,884 $ 271,936 $ 55,948 20.6%Auction commission margin (d) . . . . . . 17.0% 18.7% N/A (8.8%)Average loan portfolio (e) . . . . . . . . . . . . $ 158,021 $ 102,605 $ 55,416 54.0%Adjusted EBITDA (f) . . . . . . . . . . . . . . . . $ 218,383 $ 145,145 $ 73,238 50.5%
Legend:
* Represents a change in excess of 100%.
(a) Represents the hammer (sale) price of property sold at auction plus buyer’s premium.
(b) Represents the hammer (sale) price of property sold at auction.
(c) Represents the total purchase price of property sold in private sales brokered by theCompany.
(d) Represents total auction commission revenues as a percentage of Net Auction Sales.
(e) Represents the average loan portfolio of the Company’s Finance segment.
(f) See “Use of Non-GAAP Financial Measures” above.
19

Please see below for a more detailed discussion of the significant factors impacting theCompany’s results from continuing operations for the year ended December 31, 2006.
The following is a reconciliation of Adjusted EBITDA (see “Use of Non-GAAP FinancialMeasures” above) to income from continuing operations for the years ended December 31, 2006 and2005 (in thousands of dollars):
Year Ended December 31 2006 2005
Adjusted EBITDA. . . . . . . . . . . . . . . . . . . . . . . . . . . . . . . . . . . . . . . . . . . . . . . . . . . . . $218,383 $145,145Income tax expense related to continuing operations . . . . . . . . . . . . . . (60,050) (28,594)Income tax expense related to earnings from equity investees . . . . . (1,043) (446)Net interest expense . . . . . . . . . . . . . . . . . . . . . . . . . . . . . . . . . . . . . . . . . . . . . . . (27,148) (27,738)Depreciation and amortization expense. . . . . . . . . . . . . . . . . . . . . . . . . . . . (22,783) (22,081)Credit facility termination costs . . . . . . . . . . . . . . . . . . . . . . . . . . . . . . . . . . . — (3,069)
Income from continuing operations . . . . . . . . . . . . . . . . . . . . . . . . . . . . . . . . $107,359 $ 63,217
Impact of Foreign Currency Translations
For the year ended December 31, 2006, income from continuing operations before taxesincreased $74.8 million, or 82%, to $165.8 million, when compared to the prior year. During 2006,the favorable impact of foreign currency translations on income from continuing operations beforetaxes was approximately $3.1 million. Excluding the favorable impact of foreign currencytranslations, income from continuing operations before taxes increased $71.7 million, or 79%, to$162.7 million for the year ended December 31, 2006 (see “Use of Non-GAAP Financial Measures”above). In 2006, the favorable impact of foreign currency translations on income from continuingoperations before taxes consists of the following (in thousands of dollars):
For the Year Ended December 31, 2006Favorable/
(Unfavorable)
Total revenues . . . . . . . . . . . . . . . . . . . . . . . . . . . . . . . . . . . . . . . . . . . . . . . . . . . . . . . . $ 7,237Total expenses . . . . . . . . . . . . . . . . . . . . . . . . . . . . . . . . . . . . . . . . . . . . . . . . . . . . . . . . (4,006)
Operating income . . . . . . . . . . . . . . . . . . . . . . . . . . . . . . . . . . . . . . . . . . . . . . . . . . . . . 3,231Net interest expense and other . . . . . . . . . . . . . . . . . . . . . . . . . . . . . . . . . . . . . . . . (85)
Income from continuing operations before taxes . . . . . . . . . . . . . . . . . . . . . . $ 3,146
Revenues
For the years ended December 31, 2006 and 2005, revenues from continuing operations consistof the following (in thousands of dollars):
Year Ended December 31 2006 2005 $ Change % Change
Favorable/(Unfavorable)
Auction and related revenues:Auction commission revenues . . . . . . . $551,230 $441,301 $109,929 24.9%Auction expense recoveries . . . . . . . . . . 17,467 19,312 (1,845) (9.6%)Private sale commissions. . . . . . . . . . . . . 25,790 20,600 5,190 25.2%Principal activities ** . . . . . . . . . . . . . . . . 13,640 (1,305) 14,945 *Catalogue subscription revenues . . . . . 8,753 9,690 (937) (9.7%)Other . . . . . . . . . . . . . . . . . . . . . . . . . . . . . . . . 14,464 7,301 7,163 98.1%
Total auction and relatedrevenues . . . . . . . . . . . . . . . . . . . . . . 631,344 496,899 134,445 27.1%
Other revenues:Finance revenues . . . . . . . . . . . . . . . . . . . . 15,864 8,302 7,562 91.1%Dealer revenues ** . . . . . . . . . . . . . . . . . . 12,776 5,131 7,645 *License fee revenues . . . . . . . . . . . . . . . . 2,922 1,404 1,518 *Other . . . . . . . . . . . . . . . . . . . . . . . . . . . . . . . . 1,903 2,117 (214) (10.1%)
Total other revenues . . . . . . . . . . . . 33,465 16,954 16,511 97.4%
Total revenues. . . . . . . . . . . . . . $664,809 $513,853 $150,956 29.4%
20

Legend:
* Represents a change in excess of 100%.
** In the fourth quarter of 2006, due to the acquisition of NMP (see “Acquisition” below) andthe resulting increase in the Company’s Dealer activities, certain activities which werepreviously managed and reported as part of the Auction segment were realigned with NMPand aggregated into a newly established Dealer segment under the oversight of an executivecommittee responsible for managing the Company’s portfolio of Dealer activities. Suchactivities principally include:
• The investment in and resale of art and other collectibles directly by the Company.
• The investment in art through unsecured loans made by the Company to unaffiliated artdealers. (See Note E of Notes to Consolidated Financial Statements under Item 8,“Financial Statements and Supplementary Data.”)
• The activities of certain equity investees, including AMA. (See Note F of Notes toConsolidated Financial Statements under Item 8, “Financial Statements andSupplementary Data.”)
• The purchase and resale of art through an art dealer whose results are required to beconsolidated with the Company’s results under generally accepted accounting principles.The Company has no equity investment in this entity. (See Note R of Notes toConsolidated Financial Statements under Item 8, “Financial Statements andSupplementary Data.”)
Accordingly, revenues related to such activities, which prior to this Form 10-K wereclassified as Auction and Related Revenues, are now reported as Dealer Revenues for allperiods presented.
Auction and Related Revenues
For the year ended December 31, 2006, auction and related revenues increased $134.4 million,or 27%, to $631.3 million, when compared to the prior year, primarily due to a $110 million, or25%, increase in auction commission revenues. To a much lesser extent, the increase in auction andrelated revenues is attributable to a higher level of principal activities and private sale commissions,as well as a $3 million fee earned during the fourth quarter of 2006 for facilitating a private saletransaction in which the Company was not the primary broker and for which there was nocomparable event in 2005. This fee is reflected in the table above within other auction and relatedrevenues. The significant factors impacting the increase in auction and related revenues for the yearended December 31, 2006 are explained in more detail below.
Auction Commission Revenues—For the year ended December 31, 2006, the higher level ofauction commission revenues is primarily attributable to a 37% increase in Net Auction Sales,partially offset by a 9% decrease in auction commission margin (from 18.7% to 17%). See “NetAuction Sales” and “Auction Commission Margin” below for a detailed discussion of these keyperformance indicators.
Net Auction Sales—For the year ended December 31, 2006, Net Auction Sales increased $872.7million, or 37%, to $3.2 billion, when compared to the prior year primarily due to a $558.6 million,or 72%, increase in Impressionist and Contemporary art sales in the Company’s New York andLondon salesrooms. These results are indicative of the continued strength of these markets, whichgreatly contributed to an increase in the average selling price of lots sold. The spring sales in NewYork were highlighted by the sale of Picasso’s Dora Maar with Cat for $85 million (hammer price),for which there was no comparably priced painting sold in the prior year. Also contributing to theimprovement versus the prior year is the broad strength of the art market, which yielded increasesacross several other collecting categories including:
• A $48.4 million increase in sales of 19th Century Paintings, most notably in London, withsmaller improvements in Zurich and Amsterdam.
21

• A $46.5 million, or 125%, increase in Asian art sales in New York, reflecting market growthin the areas of Chinese Contemporary art and Indian and Southeast Asian art.
• A $44 million increase in Net Auction Sales attributable to Sotheby’s Asia (which includesauction salesrooms in Hong Kong, Singapore and Australia), primarily due to a 166%improvement in sales of Chinese Contemporary art and a 37% increase in sales of jewelryand watches in Hong Kong.
• A $41.4 million, or 47%, increase in sales of Russian art in New York and London, reflectingthe continued growth of this market.
• A $34.9 million, or 36%, increase in sales of American Paintings due, in part, to theNovember 2006 sale of Edward Hopper’s Hotel Window for $26.9 million. There was nocomparable painting sold at auction in the prior year in this collecting category.
• A $28.7 million, or 17%, increase in sales of Old Master Paintings and Drawings, withfavorable sales results in New York ($43.3 million increase) and Milan ($9.8 million increase)partially offset by lower results from sales in London ($26.4 million decrease). In 2005, theJuly Old Master Paintings sale in London included the sale of Canaletto’s Venice, The GrandCanal, Looking Northeast From Palazzo Balbi To The Rialto Bridge for approximately $29million. There was no comparably priced painting offered in the July 2006 sales.
Auction Commission Margin—Auction commission margin represents total auction commissionrevenues as a percentage of Net Auction Sales. Typically, auction commission margins are higher forlower value works of art or collections, while higher valued property earns lower margins. Auctioncommission margins are adversely impacted by arrangements whereby, in certain limited situations,auction commissions are shared with the consignor or with the Company’s partners in auctionguarantees. In certain of these instances, the Company may share auction commissions with theconsignor as part of an auction guarantee in exchange for a portion of the hammer price in excessof a negotiated amount. Auction commissions shared with auction guarantee partners are the resultof management’s decision to reduce auction risk through sharing arrangements with such partners,whereby the Company reduces its financial exposure under an auction guarantee in exchange forsharing the auction commission.
For the year ended December 31, 2006, auction commission margin decreased 9% (from 18.7%to 17%) primarily due to a change in sales mix as a more significant portion of Net Auction Salesin 2006 were at the high-end of the Company’s business where auction commission margins aretraditionally lower. Also contributing to the deterioration in auction commission margin were certainsignificant consignments in the second and fourth quarters of 2006 that were sold subject tocommission sharing arrangements, whereby the Company shared the auction commissions inexchange for a portion of the hammer price in excess of a negotiated amount (see discussion ofPrincipal Activities below).
Effective January 12, 2007, the Company increased its buyer’s premium charged on certainauction sales. In salesrooms in the U.S., the buyer’s premium is now 20% on the first $500,000 ofthe hammer (sale) price and 12% of any remaining amount over $500,000. In foreign salesrooms,these U.S. dollar thresholds are translated into an appropriate fixed local currency amount.Previously, the buyer’s premium charged on auction sales was generally 20% of the hammer priceon the first $200,000 and 12% of any remaining amount over $200,000. It is expected that while thisincrease will impact only a very small percentage of lots the Company sells worldwide, it will furtherstrengthen the Company’s ability to compete in the marketplace. (See statement on ForwardLooking Statements.)
Principal Activities—Auction segment principal activities consist mainly of income or loss relatedto auction guarantees and gains or losses related to the sale of Auction segment inventory, as wellas any decreases in the carrying value of its inventory. Auction segment inventory consistsprincipally of objects obtained as a result of the failure of guaranteed property to sell at auction,and to a much lesser extent, objects obtained incidental to the auction process, primarily as a resultof defaults by purchasers after the consignor has been paid, and the honoring of purchasers’ claims.
22

For the year ended December 31, 2006, principal activities increased $14.9 million whencompared to the prior year, primarily due to significantly favorable guarantee experience in thesecond quarter of 2006 (see discussion of Auction Commission Margin above). As discussed above,in certain limited situations the Company may share auction commissions with the consignor as partof an auction guarantee in exchange for a portion of the hammer price in excess of the guaranteedamount. As a result, in periods impacted by such arrangements, such as in this period, auctioncommission revenues are best reviewed in the aggregate with principal activities to fully understandauction and related revenues for the period.
Also contributing to the increase in principal activities in 2006 is a $6.3 million gain recognizedon the sale of a painting that failed to sell at auction in 2004 and was acquired as a result of aguarantee, for which there was no comparable gain in 2005. As discussed in more detail below under“Off-Balance Sheet Arrangements,” when guaranteed property fails to sell at auction, the amount ofthe auction guarantee must be paid, but the Company has the right to recover such amount throughfuture sale of the property. In certain instances such as the sale described above, the sale proceedsultimately realized by the Company exceed the amount of any prior losses recognized on the auctionguarantee.
Private Sale Commissions—The level of private sale commissions earned by the Company in anyperiod is typically highly variable. For the year ended December 31, 2006, private sale commissionsincreased $5.2 million, or 25%, when compared to prior year. Most notably, 2006 results includerevenue associated with the private sale of the Collection of Dr. Martin Luther King, Jr. and privatesales conducted at the Chatsworth House, for which there were no comparable sales in the prioryear. The overall increase in private sale commissions reflects management’s continued commitmentto pursue private sales opportunities in the strong international art market.
Finance Revenues
For the year ended December 31, 2006, Finance revenues increased $7.6 million, or 91%, whencompared to the prior year. This substantial increase principally results from a 54% increase in theaverage loan portfolio balance during the year (from $102.6 million to $158 million). Also favorablyimpacting the comparison to the prior year are higher interest rates earned on the loan portfolioprimarily resulting from an increase in the Prime Rate. A significant portion of the increase in theaverage loan portfolio balance is the result of three term loans issued to the same borrower in thesecond and fourth quarters of 2005 and in the third quarter of 2006 totaling approximately $59million. These loans are due to be repaid in May 2007 (approximately $51 million) and February2008 (approximately $8 million). For the year ended December 31, 2006, these three loanscontributed approximately $3.4 million to the increase in Finance revenues for the period and, in theaggregate, comprise approximately 34% of the client loan portfolio at December 31, 2006. Thegrowth in the Finance segment’s client loan portfolio reflects the availability of capital to fund newloans and management’s marketing efforts in this area.
Dealer Revenues
Dealer Revenues consist of revenues earned from the sale of Dealer segment inventory and theCompany’s share of gains resulting from the sale of property purchased by art dealers throughunsecured loans from the Company. Dealer inventory consists principally of property held byNoortman Master Paintings B.V. and objects purchased for investment purposes.
Dealer revenues increased $7.6 million in 2006 when compared to the prior year mostly due toincremental revenues contributed by NMP, which was acquired by the Company in June 2006. Theserevenues are partially offset by $6.1 million in related cost of sales. Robert Noortman, ManagingDirector of NMP, died unexpectedly on January 14, 2007. NMP is continuing under the leadershipof Mr. Noortman’s son, William. (See “Acquisition” below and Note C of Notes to ConsolidatedFinancial Statements under Item 8, “Financial Statements and Supplementary Data,” for morediscussion of the acquisition and the impact of Mr. Noortman’s death.)
23

License Fee Revenues
For the year ended December 31, 2006, license fee revenues increased $1.5 million whencompared to the prior year. License fee revenues consist principally of fees earned in conjunctionwith a license agreement with Realogy Corporation (“Realogy”), formerly Cendant Corporation.Under this agreement, Realogy licenses the Sotheby’s International Realty trademark and certainrelated trademarks in exchange for an ongoing license fee based upon a percentage of the volume ofcommerce transacted under licensed trademarks.
Expenses
For the years ended December 31, 2006 and 2005, expenses from continuing operations consistof the following (in thousands of dollars):
Year Ended December 31 2006 2005 $ Change % Change
Favorable/(Unfavorable)
Direct costs of services . . . . . . . . . . . . . . . . . . . $ 74,120 $ 65,782 ($8,338) (12.7%)Dealer cost of sales . . . . . . . . . . . . . . . . . . . . . . 6,060 — (6,060) *Salaries and related costs . . . . . . . . . . . . . . . . . 226,410 187,753 (38,657) (20.6%)General and administrative expenses . . . . . 138,278 114,974 (23,304) (20.3%)Depreciation and amortization expense. . . 22,783 22,081 (702) (3.2%)
Total expenses . . . . . . . . . . . . . . . . . . . . . . . $467,651 $390,590 ($77,061) (19.7%)
Legend:
* Represents a change in excess of 100%.
Direct Costs of Services
Direct costs of services consists largely of catalogue production and distribution costs, as well assale marketing costs and corporate marketing expenses. The level of direct costs incurred in anyperiod is generally dependent upon the volume and composition of the Company’s auction offerings.For example, direct costs attributable to single-owner or other high-value collections are typicallyhigher than those associated with standard various-owner sales, mainly due to higher promotionalcosts for catalogues, special events and traveling exhibitions, as well as higher shipping expenses.
For the year ended December 31, 2006, direct costs of services increased $8.3 million, or 13%,when compared to the prior year. The increase in direct costs is consistent with the volume and typeof property offered and sold at auction during 2006. In particular, the increase reflects higher salepromotion and shipping costs related to the successful Impressionist and Contemporary art sales inNew York and London, in addition to $1 million of costs to promote a private sale exhibition at theChatsworth House in the U.K. Also contributing to the increase in direct costs are $1.5 million incorporate marketing expenses attributable to increased spending for client service programs, $0.9million attributable to the unfavorable impact of foreign currency translations and a $0.8 millionincrease in venue preparation costs for sales conducted at a new location in Hong Kong.
The overall increase in direct costs for the period is partially offset by costs incurred in 2005related to significant off-premises single-owner sales, for which there were no comparable events in2006. Specifically, in 2005, direct costs included approximately $4.8 million in costs related to theoff-premises single-owner auction sale of property from the Royal House of Hanover in Germany inOctober 2005 and $1.5 million in costs related to the sale of cars and memorabilia at Ferrariheadquarters in Maranello, Italy.
24

Salaries and Related Costs
For the years ended December 31, 2006 and 2005, salaries and related costs consisted of thefollowing (in thousands of dollars):
Year Ended December 31 2006 2005 $ Change % Change
Favorable/(Unfavorable)
Full-time salaries . . . . . . . . . . . . . . . . . . . . . . . . . $110,882 $101,287 ($9,595) (9.5%)Employee benefits . . . . . . . . . . . . . . . . . . . . . . . . 25,641 20,929 (4,712) (22.5%)Payroll taxes . . . . . . . . . . . . . . . . . . . . . . . . . . . . . 17,883 14,102 (3,781) (26.8%)Incentive bonus costs . . . . . . . . . . . . . . . . . . . . . 41,970 30,479 (11,491) (37.7%)Stock compensation expense . . . . . . . . . . . . . 13,335 3,716 (9,619) *Option Exchange . . . . . . . . . . . . . . . . . . . . . . . . . 2,484 4,553 2,069 45.4%Other ** . . . . . . . . . . . . . . . . . . . . . . . . . . . . . . . . . 14,215 12,687 (1,528) (12.0%)
Total salaries and related costs . . . . . . $226,410 $187,753 ($38,657) (20.6%)
Key Performance Indicator:Salaries and related costs as a % of
total revenues . . . . . . . . . . . . . . . . . . . . . 34.1% 36.5% N/A 6.8%
Legend:
* Represents a change in excess of 100%.
** Principally includes the cost of temporary labor and overtime.
In recent years, the Company’s overall compensation strategy has evolved towards havinggreater variability in pay, dependent upon the Company’s profitability. Also, the Company’s equitycompensation strategy has evolved towards a preference for restricted stock as opposed to stockoptions. These strategic shifts are reflected in the $38.7 million, or 21%, increase in salaries andrelated costs during 2006, as the significant drivers of this increase include higher levels of incentivebonus costs and restricted stock compensation expense due to the significant profitability of theCompany. In 2006, the level of salaries and related costs was also impacted by strategic headcountadditions in certain departments, as discussed in more detail below, which contributed to the 10%increase in full-time salaries. The comparison to the prior year is also unfavorably impacted byhigher employee benefits and payroll taxes. See discussion below for a more detailed explanation ofeach of these factors.
Incentive Bonus Costs—For the year ended December 31, 2006, incentive bonus costs increased$11.5 million, or 38%, when compared to the prior year, due to the Company’s strong financialperformance in 2006.
Stock Compensation Expense—For the year ended December 31, 2006, stock compensationexpense (excluding costs related to the Exchange Offer described below) increased $9.6 million whencompared to the prior year. This increase is attributable to stock compensation costs resulting fromcompensation arrangements with certain senior executives consummated in 2006 totaling $5.5 millionfor the year ended December 31, 2006, as well as incremental costs from other restricted stockawarded during 2006. Included in the stock compensation expense associated with these executivecompensation arrangements is $3.5 million related to shares of restricted stock granted in 2006 thatwill only vest and create value for the recipients at the end of a minimum employment period, andonly if certain objective performance or market-based criteria are satisfied. Additionally, for the yearended December 31, 2006, the Company recognized $1.4 million in stock compensation expense forstock options resulting from the adoption of SFAS No. 123R, “Share-Based Payment,” on January 1,2006. For the year ending December 31, 2007, stock compensation expense for stock options isexpected to total $0.2 million, a decrease of $1.2 million when compared to 2006. (See Note M ofNotes to Consolidated Financial Statements under Item 8, “Financial Statements and SupplementaryData,” for detailed information related to the adoption of SFAS No. 123R.)
For the year ending December 31, 2007, stock compensation expense (excluding costs related tothe Exchange Offer discussed below) is expected to increase approximately $11.1 million whencompared to 2006, principally due to restricted stock grants made in February 2007, as well the 2006restricted stock grants discussed above. A portion of this increase ($1.2 million) reflects the full-yearimpact of shares of restricted stock granted in 2006 to certain senior executives that will only vest
25

and create value for the recipients at the end of a minimum employment period, and only if certainobjective performance or market-based criteria are satisfied. (See statement on Forward LookingStatements.)
The chart below details the stock compensation for the years ended December 31, 2006 (actual),2007 (projected) and 2008 (projected) based upon restricted stock grants and employmentarrangements signed as of February 26, 2007.
Type of Grant2006
Actual2007
Projected2008
Projected
(Thousands of dollars)
2006 Executive Bonus Plan Grant * . . . . . . . . . . . . . . . . . . . . . . . . . . . $ 2,289 $ 1,249 $ 5112007 Executive Bonus Plan Grant * . . . . . . . . . . . . . . . . . . . . . . . . . . . — 3,270 1,7832006 Employment Arrangements . . . . . . . . . . . . . . . . . . . . . . . . . . . . . . 5,456 6,951 6,868All other grants and contractually committed stock
compensation. . . . . . . . . . . . . . . . . . . . . . . . . . . . . . . . . . . . . . . . . . . . . . . . 4,200 12,724 7,786Stock Option Expense. . . . . . . . . . . . . . . . . . . . . . . . . . . . . . . . . . . . . . . . . 1,390 192 25
Total Stock Compensation Expense. . . . . . . . . . . . . . . . . . . . . . . $13,335 $24,386 $16,973
Legend:
* Executive Bonus Plan grants are based on the Company’s financial performance in the yearprior to the date of grant. (See Note M of Notes to Consolidated Financial Statements underItem 8, “Financial Statements and Supplementary Data,” for additional information on theExecutive Bonus Plan.)
Note: The chart above does not include the potential issuance of performance-based restrictedstock under the Company’s Executive Bonus Plan in 2008 or any additional discretionary restrictedstock grants in 2007 or 2008. Any such awards of restricted stock would generate higher total stockcompensation expense than shown in the chart above. (See statement on Forward LookingStatements.)
Full-Time Salaries—For the year ended December 31, 2006, full-time salaries increased $9.6million, or 10%, when compared to the prior year. This increase is principally due to strategicheadcount additions in certain departments within the Auction segment which have experiencedmarket growth, including Contemporary Paintings, Impressionist Paintings, Russian Art and AsianArt, as well as limited salary increases throughout the Company. The overall increase in full-timesalaries is partially offset by $0.8 million of savings achieved in the second half of 2006 as a result ofthe outsourcing of the Company’s catalogue production operations in the U.K. in the first half of2006.
Payroll Taxes—For the year ended December 31, 2006, payroll taxes increased $3.8 million, or27%, when compared to the prior year, principally due to incremental taxes associated with asignificantly higher level of employee stock option exercises and the vesting of restricted stock sharesduring 2006. To a lesser extent, the increase in payroll taxes is also attributable to the increases infull-time salaries and incentive bonus costs discussed above.
Employee Benefit Costs—Employee benefit expenses include costs of the Company’s retirementplans, the costs of its health and welfare programs and, to a much lesser extent, severance costs. TheCompany’s material retirement plans include a defined benefit pension plan, covering mostemployees in the U.K., and defined contribution and deferred compensation plans for employees inthe U.S. The U.S. plans provide for a Company matching contribution of up to 6% of eachparticipant’s eligible compensation, as well as a discretionary annual Company contribution thatvaries depending on the Company’s profitability. Generally, the level of employee benefit costs isdependent upon movements in headcount and compensation levels, as well as the Company’sfinancial performance. Additionally, expenses related to the Company’s U.K. defined benefit pensionplan are significantly influenced by interest rates and investment performance in the debt and equitymarkets (see Part I, Item 1A, “Risk Factors”).
For the year ended December 31, 2006, employee benefit costs increased $4.7 million, or 23%,when compared to the prior year. The higher level of employee benefit costs is attributable to the
26

headcount, salary and incentive bonus cost increases discussed above in addition to the followingfactors:
• A $2.8 million increase in the cost of benefits for the Company’s U.K. employees. Included inthis amount is a $2.2 million, or 50%, increase in costs related to the U.K. Pension Plan (seeNote N of Notes to Consolidated Financial Statements under Item 8, “Financial Statementsand Supplementary Data”).
• A $0.9 million increase in severance costs, principally in Europe.
• A $0.7 million, or 41%, increase in profit sharing costs related to the Company’s U.S. definedcontribution and deferred compensation plans as a result of the Company’s strong financialperformance.
The overall increase in employee benefit costs in 2006 is partially offset by a $0.9 millionone-time charge recognized in 2005 for retirement benefits in Germany, for which there is nocomparable expense in the current period.
As discussed above under “Critical Accounting Estimates,” actuarial losses related to the U.K.Pension Plan were approximately $91 million ($63.7 million, after tax) as of the date of the mostrecent plan actuarial valuation (September 30, 2006). These losses accumulated over several years asa result of differences in actual experience compared to projected experience and were specificallyinfluenced by a general trend of lower discount rates, driven by the U.K. interest rate environment,as well as the adoption of updated mortality tables reflecting more recent data on longer lifeexpectancies. These losses, which are reflected in the Consolidated Balance Sheets on an after-taxbasis within accumulated other comprehensive loss and not yet recognized in net pension cost, arebeing systematically recognized as an increase in future net periodic pension cost in accordance withSFAS No. 87, “Employers’ Accounting for Pensions” and SFAS No. 158, “Employers’ Accountingfor Defined Benefit Pension and Other Postretirement Plans, an amendment of FASB StatementsNo. 87, 88, 106, and 132(R).” In 2007, management projects an increase of approximately $4 millionin costs related to the U.K. Pension Plan, principally due to higher amortization of suchunrecognized losses, as well as higher interest costs resulting from an increase in the projectedbenefit obligation. (See statement on Forward Looking Statements.)
Option Exchange Program—In February 2003, the Compensation Committee approved anexchange offer of cash or restricted stock for certain stock options held by eligible employees underthe 1997 Stock Option Plan (the “Exchange Offer”). The Exchange Offer was tendered during thefirst half of 2004.
For the year ended December 31, 2006, compensation expense related to the Exchange Offerdecreased $2.1 million, or 45%, when compared to the prior year as a result of lower stockcompensation expense related to the issuance of 1.1 million restricted shares in the Exchange Offer,which is being amortized over a graded four-year vesting period. The amortization of stockcompensation expense related to the Exchange Offer is expected to be approximately $1.2 millionand $0.2 million for the years ended December 31, 2007 and 2008, respectively. (See statement onForward Looking Statements.)
General and Administrative Expenses
For the year ended December 31, 2006, general and administrative expenses increased $23.3million, or 20%, when compared to the prior year. This increase is largely attributable to thefollowing factors:
• A $9.8 million, or 33%, increase in professional fees, which is partially attributable to $3.3million in costs associated with outsourcing the Company’s catalogue production operations inthe U.K. Also contributing to the increase are approximately $2.2 million in consulting feesrelated to strategic corporate initiatives, including several client service and marketinginitiatives; as well as $1.7 million in tax staffing fees.
• A $4.5 million, or 24%, increase in travel and entertainment costs principally due to thehigher level of travel for pursuing business opportunities during the period. Also contributingto the increase in travel and entertainment costs during the period are price increases forairfares and other travel costs.
27

• A $2.9 million benefit recorded in the fourth quarter of 2005 related to the reversal of certainsales tax estimates that were no longer necessary, for which there was no comparable event inthe current period.
• A $2.3 million, or 8%, increase in premises related costs principally due to increased rentalcosts in Europe ($0.9 million), moving expenses related to the refurbishment of theCompany’s New Bond Street building in London ($0.6 million) and increased cost for buildingrepairs and maintenance in the U.K. ($0.4 million).
• A $2.3 million increase in authenticity claims, goodwill gestures and other litigation-relatedcharges.
• $1.1 million in general and administrative costs related to Noortman Master Paintings, whichwas acquired in June 2006 and for which there are no comparable costs in the prior year.
• $1 million contingency reserve recorded in the fourth quarter of 2006 related to certain stateand local tax issues. (See Note O of Notes to Consolidated Financial Statements underItem 8, “Financial Statements and Supplementary Data.”)
• A $0.7 million charge related to the final settlement of the Canadian Competition Bureauinvestigation. (See Note Q of Notes to Consolidated Financial Statements under Item 8,“Financial Statements and Supplementary Data.”)
• Various smaller increases in other general and administrative expenses totaling approximately$2 million.
For the year ended December 31, 2006, the overall increase in general and administrativeexpenses was partially offset by the one-time benefit associated with the recovery of $2.4 million inadministrative expenses related to the settlement of the International Antitrust Litigation (seeNote Q of Notes to Consolidated Financial Statements under Item 8, “Financial Statements andSupplementary Data,” for information related to the original income statement classification of suchexpenses) and a $1 million reduction in insurance costs, reflecting management’s cost reductionefforts and lower overall premiums available in the insurance market.
Depreciation and Amortization Expense
For the year ended December 31, 2006, depreciation and amortization expense increased $0.7million, or 3%, to $22.8 million when compared to the prior year principally due to $1.7 million ofamortization expense related to intangible assets acquired in the acquisition of Noortman MasterPaintings (see “Acquisition” below and Notes C and I of Notes to Consolidated FinancialStatements under Item 8, “Financial Statements and Supplementary Financial Data”), partially offsetby lower depreciation expense as a result of the timing and rate of capital spending on depreciablefixed assets.
Net Interest Expense
Due to funding requirements for new client loans, as well as decreased cash balances resultingfrom funding the Transaction described under “Recapitalization” below, the Company hadsignificantly lower average cash balances and short-term investments and a higher level of averageoutstanding revolving credit facility borrowings during the nine months ended September 30, 2006,when compared to the same period in the prior year. As a result of these factors, for the ninemonths ended September 30, 2006, net interest expense increased $2.3 million, when compared tothe same period in 2005. However, during the fourth quarter of 2006, average cash balances andshort-term investments increased significantly and average outstanding credit facility borrowingsdecreased as a result of the strength of the Company’s auction sales, causing a $2.9 million decreasein net interest expense for the quarter. Overall, for the year ended December 31, 2006, net interestexpense decreased $0.6 million, or 2%, when compared to the prior year. (See Note J of Notes toConsolidated Financial Statements under Item 8, “Financial Statements and Supplementary Data,”for additional information related to interest expense.)
28

Credit Facility Termination Costs
As discussed in more detail in “Liquidity and Capital Resources” below, on September 7, 2005,in connection with the Transaction described under “Recapitalization” below, the Companyterminated its senior secured credit agreement with General Electric Capital Corporation (the “GECapital Credit Agreement”). As a result of the termination of the GE Capital Credit Agreement,the Company incurred a $1 million termination fee and wrote off approximately $2.1 million inarrangement fees and other direct costs related to the GE Capital Credit Agreement, which werepreviously being amortized over the term of the agreement. These charges are combined andreflected as a separate caption in the Consolidated Income Statement for the year endedDecember 31, 2005. There was no comparable event or charges impacting the Company’s results forthe year ended December 31, 2006. (See “Liquidity and Capital Resources” below and Note J ofNotes to Consolidated Financial Statements under Item 8, “Financial Statements and SupplementaryData,” for information related to the Company’s credit arrangements.)
Other Expense
For the year ended December 31, 2006, other expense increased $2.8 million to $4.2 millionprincipally due to net losses relating to the revaluation and settlement of certain forward exchangecontracts during the year. Such forward exchange contracts were principally used as cash flow hedgesof the Company’s exposure to foreign currency denominated future guarantee obligations. Thesecontracts are not designated as hedging instruments under SFAS No. 133, “Accounting forDerivative Instruments and Hedging Activities,” as amended, and are recorded in the ConsolidatedBalance Sheets at fair value, which is based on referenced market rates. (See Note B of Notes toConsolidated Financial Statements under Item 8, “Financial Statements and Supplementary Data,”for more information.)
Provision for Income Taxes
The effective tax rate related to continuing operations was approximately 36.2% in 2006,compared to approximately 31.4% in 2005. This increase is primarily the result of the benefitrecorded in 2005 related to the reversal of the valuation allowance associated with certain federaland foreign net operating loss carryforwards, higher income tax reserves related to certain U.S. andinternational issues (see Note O of Notes to Consolidated Financial Statements under Item 8,“Financial Statements and Supplementary Data”) and increased deemed income from overseassubsidiaries. These increases were partially offset by the utilization of foreign tax credits.
At December 31, 2006, the Company has deferred tax assets related to state tax losscarryforwards totaling $20.4 million that begin to expire in 2008. The Company has provided a fullvaluation allowance related to these deferred tax assets. In assessing the need for this valuationallowance management considers, among other things, its projections of future taxable income andongoing prudent and feasible tax planning strategies. In the event that the Company continues itsstrong performance and substantially exceeds its current financial projections of future taxableincome, a portion of, or the entire, valuation allowance related to state loss carryforwards may bereversed some time in 2007. (See “Critical Accounting Estimates” above and statement on ForwardLooking Statements below.)
On November 7, 2005, the Company’s Chief Executive Officer and Board of Directors approveda domestic reinvestment plan to repatriate up to $72.4 million of foreign earnings under theAmerican Jobs Creation Act of 2004 during 2005. These foreign earnings were previously consideredto be indefinitely reinvested outside of the U.S. The Company repatriated approximately $72.4million during 2005 and recorded income tax expense of $3.8 million. As of December 31, 2006,approximately $60.6 million of the repatriated funds have been used, primarily for capital asset costsand leased asset investments.
(See Item 1A, “Risk Factors” and Note K of Notes to Consolidated Financial Statements underItem 8, “Financial Statements and Supplementary Data.”)
Discontinued Operations
For information related to Discontinued Operations, see Note T of Notes to ConsolidatedFinancial Statements under Item 8, “Financial Statements and Supplementary Data.”
29

RESULTS OF OPERATIONS FOR THE YEARS ENDED DECEMBER 31, 2005 AND 2004
Note D (“Segment Reporting”) of Notes to Consolidated Financial Statements should be readin conjunction with this discussion.
Overview
The Company’s results for the year ended December 31, 2005 reflected the continued strengthof the international art market as Net Auction Sales and Private Sales (both defined below)remained strong. In 2005, income from continuing operations increased 1% to $63.2 million eventhough 2004 results included one-time license fee revenues of $45.6 million earned in conjunctionwith the consummation of the Realogy License Agreement (see “License Fee Revenues” below).The Company’s strong financial performance in 2005 was largely the result of a significantimprovement in auction commission margins.
The Company’s results from continuing operations for the years ended December 31, 2005 and2004 are summarized below (in thousands of dollars):
Favorable/(Unfavorable)
Year Ended December 31 2005 2004 $ Change % Change
Revenues:Auction and related revenues. . . . . . . . $ 496,899 $ 439,526 $ 57,373 13.1%Finance revenues . . . . . . . . . . . . . . . . . . . . 8,302 5,907 2,395 40.5%Dealer revenues . . . . . . . . . . . . . . . . . . . . . 5,131 3,604 1,527 42.4%License fee revenues. . . . . . . . . . . . . . . . . 1,404 45,745 (44,341) (96.9%)Other revenues . . . . . . . . . . . . . . . . . . . . . . 2,117 2,274 (157) (6.9%)
Total revenues . . . . . . . . . . . . . . . . . . 513,853 497,056 16,797 3.4%Expenses . . . . . . . . . . . . . . . . . . . . . . . . . . . . . . . . . 390,590 370,399 (20,191) (5.5%)
Operating income . . . . . . . . . . . . . . . . . . . . . . . . 123,263 126,657 (3,394) (2.7%)Net interest expense . . . . . . . . . . . . . . . . . . . . . (27,738) (30,267) 2,529 8.4%Credit facility termination costs . . . . . . . . . . (3,069) — (3,069) *Other (expense) income. . . . . . . . . . . . . . . . . . (1,474) 267 (1,741) *
Income from continuing operationsbefore taxes. . . . . . . . . . . . . . . . . . . . . . . . . . . . 90,982 96,657 (5,675) (5.9%)
Equity in earnings of investees, net oftaxes . . . . . . . . . . . . . . . . . . . . . . . . . . . . . . . . . . . 829 740 89 12.0%
Income tax expense . . . . . . . . . . . . . . . . . . . . . . 28,594 35,000 6,406 18.3%
Income from continuing operations . . . . . . $ 63,217 $ 62,397 $ 820 1.3%
Key performance indicators:Aggregate Auction Sales (a). . . . . . . . . $2,752,185 $2,694,544 $ 57,641 2.1%Net Auction Sales (b) . . . . . . . . . . . . . . . $2,361,830 $2,334,937 $ 26,893 1.2%Private Sales (c) . . . . . . . . . . . . . . . . . . . . . $ 271,936 $ 262,891 $ 9,045 3.4%Auction commission margin (d) . . . . . 18.7% 16.4% N/A 14.0%Average loan portfolio (e). . . . . . . . . . . $ 102,605 $ 82,519 $ 20,086 24.3%Adjusted EBITDA (f) . . . . . . . . . . . . . . . $ 145,145 $ 108,410 $ 36,735 33.9%
Legend:
* Represents a change in excess of 100%.
(a) Represents the hammer (sale) price of property sold at auction plus buyer’s premium.
(b) Represents the hammer (sale) price of property sold at auction.
(c) Represents the total purchase price of property sold in private sales brokered by theCompany.
(d) Represents total auction commission revenues as a percentage of Net Auction Sales.
(e) Represents the average loan portfolio of the Company’s Finance segment.
(f) See “Use of Non-GAAP Financial Measures” above and reconciliation to correspondingGAAP amount below.
30

Please see below for a more detailed discussion of the significant factors impacting theCompany’s results from continuing operations for the year ended December 31, 2005.
The following is a reconciliation of Adjusted EBITDA (see “Use of Non-GAAP FinancialMeasures” above) to income from continuing operations for the years ended December 31, 2005 and2004 (in thousands of dollars):
Year Ended December 31 2005 2004
Adjusted EBITDA. . . . . . . . . . . . . . . . . . . . . . . . . . . . . . . . . . . . . . . . . . . . . . . . . . . . . . $145,145 $108,410Income tax expense related to continuing operations . . . . . . . . . . . . . . . . . . . (28,594) (35,000)Income tax expense related to earnings from equity investees . . . . . . . . . . (446) (398)Net interest expense . . . . . . . . . . . . . . . . . . . . . . . . . . . . . . . . . . . . . . . . . . . . . . . . . . . . (27,738) (30,267)Depreciation and amortization expense . . . . . . . . . . . . . . . . . . . . . . . . . . . . . . . . . (22,081) (23,837)Credit facility termination costs . . . . . . . . . . . . . . . . . . . . . . . . . . . . . . . . . . . . . . . . . (3,069) —One-time Cendant license fee revenue . . . . . . . . . . . . . . . . . . . . . . . . . . . . . . . . . . — 45,650Realogy License Agreement transaction costs. . . . . . . . . . . . . . . . . . . . . . . . . . . — (2,161)
Income from continuing operations . . . . . . . . . . . . . . . . . . . . . . . . . . . . . . . . . . . . . $ 63,217 $ 62,397
Impact of Foreign Currency Translations
For the year ended December 31, 2005, income from continuing operations before taxesdecreased $5.7 million, or 6%, to $91 million, when compared to the prior year. During 2005, theunfavorable impact of foreign currency translations on income from continuing operations beforetaxes was approximately $2.4 million. Excluding the unfavorable impact of foreign currencytranslations, income from continuing operations before taxes decreased $3.3 million, or 3%, to $93.4million for the year ended December 31, 2005 (see “Use of Non-GAAP Financial Measures”above). In 2005, the unfavorable impact of foreign currency translations on income from continuingoperations before taxes consisted of the following (in thousands of dollars):
Year Ended December 31, 2005Favorable/
(Unfavorable)
Total revenues . . . . . . . . . . . . . . . . . . . . . . . . . . . . . . . . . . . . . . . . . . . . . . . . . . . . . . . . . . . . . . . . . . $(5,075)Total expenses . . . . . . . . . . . . . . . . . . . . . . . . . . . . . . . . . . . . . . . . . . . . . . . . . . . . . . . . . . . . . . . . . . 2,633
Operating income . . . . . . . . . . . . . . . . . . . . . . . . . . . . . . . . . . . . . . . . . . . . . . . . . . . . . . . . . . . . . . . (2,442)Net interest expense and other . . . . . . . . . . . . . . . . . . . . . . . . . . . . . . . . . . . . . . . . . . . . . . . . . . 16
Income from continuing operations before taxes . . . . . . . . . . . . . . . . . . . . . . . . . . . . . . . . $(2,426)
31

Revenues
For the years ended December 31, 2005 and 2004, revenues from continuing operationsconsisted of the following (in thousands of dollars):
Favorable/(Unfavorable)
Year Ended December 31 2005 2004 $ Change % Change
Auction and related revenues:Auction commission revenues . . . . . . . . . . . $441,301 $383,142 $ 58,159 15.2%Auction expense recoveries . . . . . . . . . . . . . 19,312 17,633 1,679 9.5%Private sale commissions . . . . . . . . . . . . . . . . 20,600 21,492 (892) (4.2%)Principal activities *. . . . . . . . . . . . . . . . . . . . . (1,305) (1,001) (304) (30.4%)Catalogue subscription revenues . . . . . . . . 9,690 9,700 (10) (0.1%)Other . . . . . . . . . . . . . . . . . . . . . . . . . . . . . . . . . . . 7,301 8,560 (1,259) (14.7%)
Total auction and related revenues . 496,899 439,526 57,373 13.1%
Other revenues:Finance revenues. . . . . . . . . . . . . . . . . . . . . . . . 8,302 5,907 2,395 40.5%Dealer revenues *. . . . . . . . . . . . . . . . . . . . . . . 5,131 3,604 1,527 42.4%License fee revenues . . . . . . . . . . . . . . . . . . . . 1,404 45,745 (44,341) (96.9%)Other . . . . . . . . . . . . . . . . . . . . . . . . . . . . . . . . . . . 2,117 2,274 (157) (6.9%)
Total other revenues . . . . . . . . . . . . . . . 16,954 57,530 (40,576) (70.5%)
Total revenues . . . . . . . . . . . . . . . . . $513,853 $497,056 $ 16,797 3.4%
Legend:
* In the fourth quarter of 2006, due to the acquisition of NMP (see “Acquisition” below) andthe resulting increase in the Company’s Dealer activities, certain activities which werepreviously managed and reported as part of the Auction segment were realigned with NMPand aggregated into a newly established Dealer segment under the oversight of an executivecommittee responsible for managing the Company’s portfolio of Dealer activities. Suchactivities principally include:
• The investment in and resale of art and other collectibles directly by the Company.
• The investment in art through unsecured loans made by the Company to unaffiliated artdealers. (See Note E of Notes to Consolidated Financial Statements under Item 8,“Financial Statements and Supplementary Data.”)
• The activities of certain equity investees including AMA. (See Note F of Notes toConsolidated Financial Statements under Item 8, “Financial Statements andSupplementary Data.”)
• The purchase and resale of art through an art dealer whose results are required to beconsolidated with the Company’s results under generally accepted accounting principles.The Company has no equity investment in this entity. (See Note R of Notes toConsolidated Financial Statements under Item 8, “Financial Statements andSupplementary Data.”)
Accordingly, revenues related to such activities, which prior to this Form 10-K were classifiedas Auction and Related Revenues, are now reported as Dealer Revenues for all periodspresented.
Auction and Related Revenues
For the year ended December 31, 2005, auction and related revenues increased $57.4 million, or13%, to $496.9 million, when compared to the prior year. This improvement was almost entirely dueto a $58.2 million, or 15%, increase in auction commission revenues. The significant factorscontributing to the improvement in auction commission revenues are explained in more detail below.
Auction Commission Revenues—The higher level of auction commission revenues during 2005was principally due to a 14% improvement in auction commission margin (from 16.4% to 18.7%)and, to a much lesser extent, a slight increase in Net Auction Sales. See “Auction Commission
32

Margin” and “Net Auction Sales” below for a detailed discussion of these key performanceindicators. The overall increase in auction commission revenues was partially offset by theunfavorable impact of foreign currency translations, which decreased auction commission revenuesby approximately $5 million during the year.
Auction Commission Margin—Auction commission margin represents total auction commissionrevenues as a percentage of Net Auction Sales. Typically, auction commission margins are higher forlower value works of art or collections, while higher valued property earns lower margins.
Effective January 1, 2005, the Company increased its buyer’s premium charged on certainauction sales. In salesrooms in the U.S., the buyer’s premium was increased to 20% of the hammer(sale) price on the first $200,000 and 12% of any remaining amount over $200,000. In foreignsalesrooms, these U.S. dollar thresholds were translated into an appropriate fixed local currencyamount upon the effective date of the change. Previously, the buyer’s premium charged on auctionsales was generally 20% of the hammer (sale) price on the first $100,000 and 12% of any remainingamount over $100,000.
As discussed above, for the year ended December 31, 2005, auction commission marginincreased 14% (from 16.4% to 18.7%) when compared to the prior year principally due to thefollowing factors:
• A $19.6 million decrease in shared auction commissions as certain significant consignments forproperty sold in 2004 were subject to commission sharing arrangements with third parties.These arrangements were primarily the result of the competitive environment for suchconsignments, as well as the Company’s decision to reduce its auction guarantee risk throughsharing arrangements with partners, whereby the Company reduced its financial exposureunder the auction guarantee in exchange for sharing the auction commission with the partner.
• A favorable change in sales mix as a more significant portion of Net Auction Sales in 2004were at the high-end of the Company’s business where auction commission margins aretraditionally lower.
• The increase in the buyer’s premium rate structure discussed above.
Net Auction Sales—For the year ended December 31, 2005, Net Auction Sales increased $26.9million, or 1%, to $2.4 billion, when compared to the prior year. This increase was attributable tothe following factors:
• A $57.3 million increase in various-owner sales of Contemporary art, reflecting the strength ofthis market.
• A $51.2 million, or 36%, increase in Net Auction Sales conducted by Sotheby’s Asia (whichincludes auction salerooms in Hong Kong, Singapore and Australia) primarily due to a higherlevel of Chinese Ceramics and Paintings sales, in addition to a $20 million improvement inAsian art sales in New York and London, both which reflect the continued growth of theChinese art market.
• A $42.4 million increase in Russian art sales, reflecting the rapid growth of that market.
• Net Auction Sales attributable to the November 2005 sale of property from the single-ownerdecorative arts collection of Lilly and Edmond J. Safra in New York ($41.9 million) and theOctober 2005 off-premises single-owner sale of property from the Royal House of Hanover inGermany ($41.4 million). Except for the historic May 2004 sale of property from theGreentree Foundation discussed below, there were no comparable single-owner sales in theprior year.
• Several increases in Net Auction Sales related to recurring sales, such as those for 19thCentury Paintings ($23 million improvement) and Jewelry in the U.S. and Europe ($20 millionimprovement).
These increases in Net Auction Sales in 2005 were largely offset as prior year results includethe May 2004 sale of property from the Greentree Foundation, which totaled $189.4 million and forwhich there was no comparable event in 2005. To a lesser extent, the comparison to the prior yearwas unfavorably influenced by a $46.7 million decrease in various-owner sales of Impressionist artprimarily due to several high-value works sold in the November 2004 Impressionist sale in NewYork for which there were no comparable works sold in the same sale in 2005. Also partially
33

offsetting the overall increase in Net Auction Sales versus the prior year was a $30 million decreasein various-owner American Paintings sales, which, in 2004, included the sale of John Singer Sargent’s“Group of Parasols (A Siesta)” for $21 million. There was no comparable picture sold at auction inthe 2005 American Paintings sales.
Private Sales Commissions—The level of private sales commissions earned by the Company inany period is typically variable. In 2005, private sales commissions remained at a historically highlevel totaling $20.6 million, representing a slight decrease compared to the prior year even though2004 results included private sales commissions related to the landmark private sale of the ForbesCollection of Faberge.
Finance Revenues
For the year ended December 31, 2005, Finance revenues increased $2.4 million, or 41%, whencompared to the prior year. This increase was principally due to a 24% increase in the average loanportfolio balance (from $82.5 million to $102.6 million), including two loans made to the sameborrower in the second and fourth quarters of 2005. This increase was due in part to the availabilityof capital to fund new loans and marketing efforts to increase client loan activity. The comparison of2005 Finance segment revenues to the prior year was unfavorably influenced by $1 million ininterest income recognized in the second quarter of 2004 as a result of the collection of a disputedclient loan, for which there was no comparable event in 2005.
License Fee Revenues
For the year ended December 31, 2005, license fee revenues decreased $44.3 million to $1.4million, when compared to the prior year as 2004 results include $45.6 million in one-time licensefee revenues earned in conjunction with the consummation of the Realogy License Agreement (seeNote T of Notes to Consolidated Financial Statements under Item 8, “Financial Statements andSupplementary Data”). In 2005, license fee revenues included $1.3 million in ongoing license feesearned as a result of Realogy’s continued use of the Company’s licensed trademarks.
Expenses
For the years ended December 31, 2005 and 2004, expenses from continuing operationsconsisted of the following (in thousands of dollars):
Favorable/(Unfavorable)
Year Ended December 31 2005 2004 $ Change % Change
Direct costs of services . . . . . . . . . . . . . . . . . . . . . . $ 65,782 $ 55,551 ($10,231) (18.4%)Salaries and related costs . . . . . . . . . . . . . . . . . . . . 187,753 177,717 (10,036) (5.6%)General and administrative expenses . . . . . . . . 114,974 112,863 (2,111) (1.9%)Depreciation and amortization expense . . . . . . 22,081 23,837 1,756 7.4%Retention costs . . . . . . . . . . . . . . . . . . . . . . . . . . . . . . — 285 285 100.0%Net restructuring charges . . . . . . . . . . . . . . . . . . . . — 146 146 100.0%
Total expenses . . . . . . . . . . . . . . . . . . . . . . . . . . $390,590 $370,399 ($20,191) (5.5%)
Direct Costs of Services
Direct costs of services consisted largely of catalogue production and distribution costs, as wellas sale marketing costs and corporate marketing expenses. The level of direct costs incurred in anyperiod is generally dependent upon the volume and composition of the Company’s auction offerings.For example, direct costs attributable to single-owner collections are typically higher than thoseassociated with various-owner sales, mainly due to higher promotional costs for catalogues, specialevents and traveling exhibitions.
For the year ended December 31, 2005, direct costs of services increased $10.2 million, or 18%,to $65.8 million when compared to the prior year, principally due to the higher number and type ofsingle-owner sales during the period. Specifically, in 2005, direct costs included expenses related tosignificant off-premises single-owner sales for which there were no comparable events in the prior
34

period, including the sale of property from the Royal House of Hanover in Germany ($4.8 million);the sale of cars and memorabilia at Ferrari headquarters in Maranello, Italy ($1.5 million) and theEaston Neston house sale in Northamptonshire, U.K. ($0.8 million). Also contributing to the higherlevel of direct costs in 2005 were increases of $2 million and $1.9 million related to sales conductedduring the period in Asia and the U.K. (excluding the Easton Neston sale discussed above),respectively. These increases were generally consistent with the higher level of Net Auction Salesachieved in those regions. The overall increase in direct costs was partially offset by the favorableimpact of foreign currency translations, which decreased direct costs by approximately $0.8 millionduring the year.
Salaries and Related Costs
For the years ended December 31, 2005 and 2004, salaries and related costs consisted of thefollowing (in thousands of dollars):
Favorable/(Unfavorable)
Year Ended December 31 2005 2004 $ Change % Change
Full-time salaries . . . . . . . . . . . . . . . . . . . . . . . . . . . . $101,287 $ 98,424 ($2,863) (2.9%)Employee benefits . . . . . . . . . . . . . . . . . . . . . . . . . . . 20,929 19,339 (1,590) (8.2%)Payroll taxes. . . . . . . . . . . . . . . . . . . . . . . . . . . . . . . . . 14,102 13,355 (747) (5.6%)Incentive bonus costs . . . . . . . . . . . . . . . . . . . . . . . . 30,479 25,909 (4,570) (17.6%)Stock compensation expense. . . . . . . . . . . . . . . . . 3,716 1,098 (2,618) *Option Exchange . . . . . . . . . . . . . . . . . . . . . . . . . . . . 4,553 7,688 3,135 40.8%Other **. . . . . . . . . . . . . . . . . . . . . . . . . . . . . . . . . . . . . 12,687 11,904 (783) (6.6%)
Total salaries and related costs. . . . . . . . . . $187,753 $177,717 ($10,036) (5.6%)
Key Performance Indicator:Salaries and related costs as a % of
total revenues. . . . . . . . . . . . . . . . . . . . . . . . . 36.5% 35.8% N/A 2.0%
Legend:
* Represents a change in excess of 100%.
** Principally includes the cost of temporary labor and overtime.
In recent years, the Company’s compensation strategy evolved towards having greater variabilityin pay, dependent upon the Company’s profitability. Also, the Company’s equity compensationstrategy evolved towards a preference for restricted stock as opposed to stock options. The $10million, or 6%, increase in salaries and related costs during 2005 reflected this change in strategy asthe significant drivers of this increase were higher levels of incentive bonus costs and restricted stockcompensation expense. Also contributing to the increase versus the prior year was a 3% increase infull-time salaries, principally due to limited salary and headcount increases in 2005, and increasedemployee benefit costs. The overall increase in salaries and related costs for the period was partiallyoffset by lower Option Exchange costs, as well as the favorable impact of foreign currencytranslations, which decreased salaries and related costs by approximately $1.3 million during theyear. See discussion below for a more detailed explanation of certain of these factors.
Incentive Bonus Costs—For the year ended December 31, 2005, incentive bonus costs increased$4.6 million, or 18%, to $30.5 million, when compared to the prior year. This increase wasattributable to the Company’s strong financial performance during 2005, even when compared to theprior year’s results from continuing operations which included one-time license fee revenues of $45.6million earned in conjunction with the consummation of the Realogy License Agreement (see“License Fee Revenues” above).
Stock Compensation Expense—For the year ended December 31, 2005, stock compensationexpense related to restricted stock shares granted pursuant to the Restricted Stock Plan (excludingshares issued in conjunction with the Exchange Offer discussed below) increased $2.6 million whencompared to the prior year. This increase was primarily due to the amortization of stockcompensation expense associated with restricted stock shares granted in 2005.
35

(See Note M of Notes to Consolidated Financial Statements under Item 8, “FinancialStatements and Supplementary Data,” for information related to the Restricted Stock Plan.)
Employee Benefits—For the year ended December 31, 2005, employee benefits increased $1.6million, or 8%, to $20.9 million, when compared to the prior year. The higher level of employeebenefits for the period was primarily due to a $1.7 million, or 61%, increase in costs related to the U.K.Pension Plan (see Note N of Notes to Consolidated Financial Statements under Item 8, “FinancialStatements and Supplementary Data”). To a lesser extent, the increase in employee benefits wasattributable to incremental profit-sharing costs of $0.8 million related to the Company’s U.S. pensionplans, reflecting the Company’s strong financial performance for 2005 (see “Incentive Bonus Costs”above), as well as increased other benefit costs attributable to limited salary and headcount increasesand market inflation for such costs. In the prior year, certain contributions to the Company’s U.S.pension plans were determined as a fixed percentage of an employee’s eligible compensation ratherthan via a profit-sharing formula. Also unfavorably impacting the comparison to the prior year was a$0.9 million one-time charge for retirement benefits in Germany. The overall increase in employeebenefit costs in 2005 was largely offset by a $2.8 million decrease in severance costs.
Option Exchange Program—In February 2003, the Compensation Committee approved anexchange offer of cash or restricted stock for certain stock options held by eligible employees underthe 1997 Stock Option Plan. The Exchange Offer was tendered during the first half of 2004. In 2005,compensation expense related to the Exchange Offer decreased $3.1 million, or 41%, to $4.6 million,as prior year results include $2.2 million of expense recognized in the first quarter of 2004representing the one-time cash payment made to employees upon acceptance of the Exchange Offeron March 31, 2004. The comparison to the prior period was also favorably influenced by loweramortization of stock compensation related to the issuance of 1.1 million restricted shares as a resultof the Exchange Offer, the expense relating to which is being amortized over a graded four-yearvesting period.
General and Administrative Expenses
For the year ended December 31, 2005, general and administrative expenses increased $2.1million, or 2%, to $115 million, when compared to the prior year. This increase was largelyattributable to the following factors:
• An insurance recovery of approximately $4 million, which reduced general and administrativeexpenses in the second quarter of 2004, for which there was no comparable event in 2005.
• A $2.7 million increase in travel and entertainment costs, principally due to the higher level oftravel for pursuing business opportunities during 2005, reflecting the strength of the art market.
• A $1.4 million increase in professional fees, primarily due to $1.1 million in incremental feesincurred as a result of outsourcing management of the Company’s catalogue productionoperations in the U.S. Outsourcing allowed the Company to achieve improved quality alongwith cost efficiencies and headcount reductions in this area.
• A $1.4 million increase in facility related expenses primarily as a result of higher costs forutilities and security.
• A $1.2 million increase in property taxes related to the Company’s headquarters building at1334 York Avenue in New York as a result of a tax reassessment that became effective onJuly 1, 2004.
• The recovery of $1 million in previously paid real estate taxes in the U.K. recorded in thethird quarter of 2004, for which there was no comparable event in 2005.
• $0.9 million in lease abandonment costs in the U.K. incurred in the fourth quarter of 2005,for which there was no comparable event in 2004.
The overall increase in general and administrative expenses for the year ended December 31,2005 was partially offset by the following factors:
• A $2.9 million benefit recorded in the fourth quarter of 2005 due to the reversal of certainsales tax estimates that were no longer necessary, for which there was no comparable event inthe prior year.
36

• A $2.4 million decrease in client goodwill gestures, authenticity claims and litigationsettlements primarily as a result of fewer and less costly occurrences of such matters in 2005.
• $2.2 million in transaction costs incurred in 2004 related to the consummation of theCompany’s agreement with Realogy to license the Sotheby’s International Realty trademark,for which there were no comparable fees incurred in 2005.
• A $1 million reduction in insurance costs, reflecting management’s cost reduction efforts andlower overall premiums available in the market.
• A $0.8 million decrease in settlement administration costs and legal fees associated withcertain civil antitrust litigation (see Note Q of Notes to Consolidated Financial Statementsunder Item 8, “Financial Statements and Supplementary Data”).
• The reversal of a $0.7 million legal accrual in the fourth quarter of 2005 as a result offavorable changes in circumstances, for which there was no comparable event in 2004.
• A $0.6 million decrease in computer costs principally as a result of the favorable renegotiationof a maintenance outsourcing agreement.
Depreciation and Amortization Expense
For the year ended December 31, 2005, depreciation and amortization expense decreased $1.8million, or 7%, to $22.1 million when compared to the prior year principally due to the timing andrate of capital spending on depreciable assets, as well as $0.3 million in accelerated depreciationexpense recognized in the third quarter of 2004 for assets retired as a result of the consolidation ofthe Company’s New York warehouse space into its headquarters building at 1334 York Avenue inNew York.
Net Interest Expense
For the year ended December 31, 2005, net interest expense decreased $2.5 million, or 8%, to$27.7 million, when compared to the prior year. This decrease was largely attributable to a $2.4million improvement in interest income resulting from higher average balances of cash and short-term investments, as well as higher interest rates due in part to a change in investment compositionduring the first nine months of the year. To a lesser extent, the decrease in net interest expenseversus the prior year was attributable to lower amortization of the discount associated with the DOJantitrust fine, which was being paid over a five-year period. The final payment of $15 million owedunder the fine was paid by the Company on February 6, 2006 and the liability to the DOJ wasextinguished (see Note Q of Notes to Consolidated Financial Statements under Item 8, “FinancialStatements and Supplementary Data”). The overall improvement in net interest expense in 2005 waspartially offset by an increase of $0.9 million in credit facility borrowing costs primarily as a result ofhigher average borrowings outstanding during the period largely due to the funding requirements fornew client loans, as well as decreased cash balances resulting from the Transaction described under“Recapitalization” below. (See “Liquidity and Capital Resources” below and Note J of Notes toConsolidated Financial Statements under Item 8, “Financial Statements and Supplementary Data”for information on the Company’s credit arrangements.)
Termination of GE Capital Credit Agreement
On September 7, 2005, in connection with the Transaction described below under“Recapitalization,” the Company terminated the GE Capital Credit Agreement. As a result of thetermination of the GE Capital Credit Agreement, the Company incurred a $1 million terminationfee and wrote off approximately $2.1 million in related arrangement fees, which were previouslybeing amortized over the term of the agreement. These charges were combined and reflected as aseparate caption in the Consolidated Income Statement for the year ended December 31, 2005. (See“Liquidity and Capital Resources” below and Note J of Notes to Consolidated Financial Statementsunder Item 8, “Financial Statements and Supplementary Data,” for information related to theCompany’s credit arrangements.)
37

Cumulative Effect of a Change in Accounting Principle
In March 2005, the FASB issued FIN No. 47, “Accounting for Conditional Asset RetirementObligations—an interpretation of FASB Statement No. 143.” FIN No. 47 requires an entity torecognize a liability for the fair value of a conditional asset retirement obligation if the fair valuecan be reasonably estimated. FIN No. 47 states that a conditional asset retirement obligation is alegal obligation to perform an asset retirement activity in which the timing or method of settlementare conditional upon a future event that may or may not be within the control of the entity. TheCompany adopted FIN No. 47 effective December 2005 and accordingly recorded an after-tax chargeof approximately $1.1 million ($1.6 million, pre-tax), or $0.02 per diluted share, as a cumulativeeffect of a change in accounting principle in the Consolidated Income Statement for the year endedDecember 31, 2005. This charge relates primarily to those lease agreements that require theCompany to restore the underlying facilities to their original condition at the end of the leases. TheCompany was uncertain of the timing of payment for these asset retirement obligations; therefore aliability was not previously recognized in the financial statements under GAAP. On a prospectivebasis, this accounting change requires recognition of these costs ratably over the lease term. Theadoption of FIN No. 47 initially resulted in a non-cash addition to fixed assets of $1 million with acorresponding increase in long-term liabilities. The assets as of December 31, 2005 were $0.2 million,consisting of gross assets of $1 million less accumulated depreciation of $0.8 million. The assetretirement obligation as of December 31, 2005 was $1.8 million, consisting of a liability of $1 millionand accretion expense of $0.8 million.
Provision for Income Taxes
The effective tax rate related to continuing operations was approximately 31.4% in 2005,compared to approximately 36.2% in 2004. The overall decrease in the effective tax rate in 2005from 2004 was primarily the result of a $7.1 million benefit arising from the release of valuationallowances in 2005 related to the Company’s U.S. Federal and certain foreign tax operating losscarryovers, as well as the tax rate differential between U.S. and foreign jurisdictions as more of theCompany’s earnings in 2005 arose overseas in jurisdictions with tax rates lower than in the U.S.These items were partially offset by the impact of the Company’s repatriation of earningsaccumulated outside the U.S. under its domestic reinvestment plan as discussed in more detailbelow, as well as increased passive income arising overseas.
In October 2004, the President signed the American Jobs Creation Act of 2004 (the “AJCA”).The AJCA creates a temporary incentive for companies to repatriate earnings accumulated outsidethe U.S. by allowing them to reduce taxable income by 85% of certain eligible dividends receivedfrom non-U.S. subsidiaries by the end of 2005 at an effective tax rate of 5.25%.
On November 7, 2005, the Company’s Chief Executive Officer and Board of Directors approveda domestic reinvestment plan to repatriate up to $72.4 million of foreign earnings under the AJCAduring the fourth quarter of 2005. These foreign earnings were previously considered to beindefinitely reinvested outside of the U.S. The Company repatriated approximately $72.4 during thefourth quarter of 2005 and accordingly, the Company recorded income tax expense of $3.8 million.
(See Item 1A, “Risk Factors,” and Note K of Notes to Consolidated Financial Statements underItem 8, “Financial Statements and Supplementary Data.”)
Discontinued Operations
For information related to Discontinued Operations, see Note T of Notes to ConsolidatedFinancial Statements under Item 8, “Financial Statements and Supplementary Data.”
38

FINANCIAL CONDITION AS OF DECEMBER 31, 2006
This discussion should be read in conjunction with the Company’s Consolidated Statements ofCash Flows (see Item 8, “Financial Statements and Supplementary Data”). For the year endedDecember 31, 2006, total cash and cash equivalents increased $96.1 million primarily due to thefactors discussed below.
Net cash provided by operations was $270.4 million for the year ended December 31, 2006largely due to a $148.8 million net increase in amounts owed to clients principally due to the timingand settlement of auction sales conducted in the fourth quarter of 2005 and throughout 2006. As aresult of this increase, the December 31, 2006 due to consignors balance is unusually high; however,a substantial portion of this balance will be paid out in the first quarter of 2007. Also contributingsignificantly to net cash provided by operations is net income of $107 million earned in 2006.
Net cash used by investing activities was $197.9 million for the year ended December 31, 2006largely due to a $126 million net increase in short-term investments and a $61.5 million net increasein client loans.
Net cash provided by financing activities was $21.2 million for the year ended December 31,2006 principally due to $67 million in proceeds received from the exercise of stock options and $14.9million in excess tax benefits resulting from such stock option exercises. These financing cash inflowsare partially offset by a $36.5 million net decrease in credit facility borrowings, $12.9 million ofdividend payments (see “Liquidity and Capital Resources” below) and the $9.5 million repayment ofacquiree bank debt (see Note C of Notes to Consolidated Financial Statements under Item 8,“Financial Statements and Supplementary Data”).
ADOPTION OF SFAS NO. 158
In September 2006, the Financial Accounting Standards Board (the “FASB”) issued SFAS No.158, “Employers’ Accounting for Defined Benefit Pension and Other Postretirement Plans—anamendment of FASB Statements No. 87, 88, 106, and 132(R).” Generally, SFAS No. 158 requires anemployer to recognize the over-funded or under-funded status of a defined benefit postretirementplan as an asset or liability in its balance sheet and to recognize changes in that funded status in theyear in which the changes occur through comprehensive income. SFAS No. 158 also requires themeasurement of defined benefit plan assets and obligations as of the date of the employer’s fiscalyear-end balance sheet (with limited exceptions). The requirement to recognize the funded status ofa defined benefit postretirement plan and the related disclosure requirements were effective for theCompany as of December 31, 2006 and, as a result, the Company adopted the recognition provisionsof SFAS No. 158 in the fourth quarter of 2006. The requirement to measure the plan assets andbenefit obligations as of the date of the balance sheet is effective for the Company as ofDecember 31, 2008.
(See Note N of Notes to Consolidated Financial Statements under Item 8, “Financial Statementsand Supplementary Data,” for detailed information on the impact of adopting SFAS No. 158.)
STAFF ACCOUNTING BULLETIN NO. 108
In September 2006, the SEC issued Staff Accounting Bulletin (“SAB”) No. 108, “Consideringthe Effects of Prior Year Misstatements when Quantifying Misstatements in Current Year FinancialStatements.” SAB No. 108 requires that registrants quantify errors using both a balance sheet andincome statement approach and evaluate whether either approach results in a misstated amount that,when all relevant quantitative and qualitative factors are considered, is material. The Companyadopted SAB No. 108 in the fourth quarter of 2006.
39

REVIEW OF STOCK OPTION GRANTING PRACTICES
In June through November 2006, at the request of the Company’s Chief Executive Officer,outside legal counsel conducted a review of the Company’s stock option granting practices from 1995through the present to determine whether any backdating of stock options had occurred. Thisrequest was not made because of any knowledge or belief that there were any improprieties in theCompany’s stock option granting practices, but because of the publicity that had been given to thissubject in relation to other companies. Counsel concluded and management concurred that there wasno evidence of intentional wrongdoing by any of the Company’s Named Executive Officers (asdefined by the SEC) or by any other director or employee of the Company. However, it wasconcluded that, in a number of instances in 2002 and in prior years, the Company had used anincorrect measurement date under Accounting Principles Board Opinion No. 25, “Accounting forStock Options” (“Opinion 25”), in accounting for certain of its stock option grants because on thedate of such grants, the number of shares that particular individuals were entitled to receive was notfinalized or the number of options allocated to certain recipients was changed after the awardapproval date. Based on the results of counsel’s review, management concluded that themeasurement dates for these awards should be revised.
The Company has determined that from the first quarter of 1996 through 2004, it had certainunrecorded non-cash stock compensation charges associated with its stock option plans. The amountof aggregate unrecorded non-cash stock compensation expense, which the Company should haverecorded in prior periods as a component of Salaries and Related Costs, is approximately $6 millionpre-tax and approximately $4 million after-tax. The Company determined, however, that the chargesfrom 1996 through 2004 were not material to its consolidated financial statements in any of theperiods to which such charges related.
Management has, however, concluded that the aggregate amount of unrecorded stockcompensation expense related to these stock options would be material, if recorded, to the fourthquarter of 2006. As a result, the Company has restated its financial statements for prior periods andrecorded an adjustment of approximately $3.8 million to Retained Earnings and Additional Paid-inCapital as of January 1, 2004, which is reflected in the accompanying Consolidated Statements ofChanges in Shareholders’ Equity. This adjustment represents the cumulative effect on an after taxbasis of the adjustment relating to the non-cash stock compensation charges discussed above relatedto years 1999 to 2003. The impact of these unrecorded amounts is presented in the chart below. Theimpact of the adjustments related to 2004 and years prior to 1999 is inconsequential. In addition,there was no impact on total cash flows from operating, investing or financing activities within theConsolidated Statements of Cash Flows for any of the years presented nor was there any impact onany interim periods within 2005 or 2006.
Year Ended December 31 1999 2000 2001 2002 2003 Total
(Thousands of dollars)
Stock compensation adjustment, pre-tax. . . . . . . . . . . . . $1,584 $1,924 $1,376 $776 $282 $5,942Tax effect . . . . . . . . . . . . . . . . . . . . . . . . . . . . . . . . . . . . . . . . . . . 586 608 590 279 90 2,153
Stock compensation adjustment, net of tax effect . . . $ 998 $1,316 $ 786 $497 $192 $3,789*
* Adjustment to December 31, 2004 beginning retained earnings.
RECAPITALIZATION
On September 7, 2005, the Company entered into a Transaction Agreement (the “Agreement”),with various affiliates of A. Alfred Taubman and his family (the “Shareholders”). Prior tocompletion of the transactions contemplated by the Agreement, the Shareholders were theCompany’s largest shareholders, holding in the aggregate 14,034,158 shares of the Company’s ClassB Stock, representing approximately 62.4% of the aggregate voting power of the Company’s capitalstock. Robert S. Taubman, A. Alfred Taubman’s son, is a director of the Company.
40
Pursuant to the Agreement, the Company agreed to an exchange of all 14,034,158 shares ofClass B Stock owned by the Shareholders for $168,409,896 in cash and 7.1 million shares of theCompany’s Class A Stock, (such exchange, the “Transaction”). (See “Mechanics of Effecting theTransaction; Funding” below.) Completion of the Transaction was not subject to any conditions andit was completed on September 7, 2005. Because the outstanding shares of Class B Stock constitutedless than fifty percent of the aggregate voting power of the Company’s outstanding common stockfollowing completion of the Transaction, pursuant to the Company’s Third Amended and RestatedArticles of Incorporation (the “Articles”), following completion of the Transaction each remainingoutstanding share of Class B Stock held by shareholders not a party to the Transaction wasautomatically converted into one share of Class A Stock without any action on the part of theholder thereof. Therefore, immediately following completion of the Transaction and such conversion,the Company had approximately 57.3 million shares of Class A Stock outstanding (of which theShareholders owned 7.1 million, or approximately 12.4%) and no shares of Class B Stockoutstanding.
The Company’s Board of Directors appointed a Special Committee to carefully examine alldetails of the Transaction. The Special Committee consisted of four disinterested Directors who,after careful deliberation and negotiation, and based on the advice of independent legal andfinancial advisors retained by the Special Committee, unanimously recommended that the Company’sBoard of Directors approve the Transaction.
As a result of the Transaction, the dual class super-voting share structure that had been in placesince the Company’s initial public offering in 1988 was eliminated; allowing for a corporategovernance structure that is more consistent with the best practices of public companies.
Mechanics of Effecting the Transaction; Funding—Under the terms of the Agreement, theTransaction was effected by means of: (1) the Shareholders voluntarily converting, on a one-for-onebasis pursuant to the Articles, 7.1 million shares of Class B Stock into shares of Class A Stock, and(2) the Company acquiring the remaining shares of Class B Stock owned by the Shareholders foraggregate cash consideration of $168,409,896. The Company funded the cash portion of theconsideration plus direct transaction and financing costs with then existing cash balances and $100million in borrowings under a new credit facility (see “Liquidity and Capital Resources” below andNote J of Notes to Consolidated Financial Statements under Item 8, “Financial Statements andSupplementary Data,” for information related to the Company’s credit arrangements).
The total cost to acquire the Class B Stock owned by the Shareholders of $177.2 million(including $8.8 million in direct transaction costs) was accounted for as a treasury stock transactionin the third quarter of 2005, with common stock and additional paid-in capital being reduced by$177.1 million. Additionally, the Company ascribed $100,000 of the cost to the Standstill and theRestrictions on Transfer (as described below) based on their fair value as determined by anindependent valuation expert. Such amount was expensed as incurred within other expense in theperiod of the Transaction.
Direct financing costs of $3.7 million attributable to the new credit facility are being amortizedon a straight-line basis over the term of the facility (see Note J of Notes to Consolidated FinancialStatements under Item 8, “Financial Statements and Supplementary Data”).
Standstill—In the Agreement, each Shareholder agreed to a customary standstill lasting until theearlier of (1) the fourth anniversary of the Transaction or (2) 30 days after the date on which (a)the Shareholders, together with their affiliates, own, in the aggregate, securities representing lessthan ten percent of the Company’s total outstanding voting power and (b) no affiliate of anyShareholder is a member of the Board of Directors of the Company (however, if such 30th daywould otherwise occur on or before the second anniversary of the Transaction, such 30th day wouldnot be deemed to occur until such second anniversary). The terms of the Standstill generally statethat, each Shareholder shall not (unless requested by the Company): (1) acquire or propose toacquire ownership of or the ability to vote any securities or other property of the Company or anyof its subsidiaries or (2) act to seek to control or influence the management, Board of Directors,shareholders, business, operations or policies of the Company.
41

Restrictions on Transfer—In the Agreement, each Shareholder agreed that, prior to the secondanniversary of the Transaction, such Shareholder would not transfer any shares of Class A Stock orany economic interest therein, except to an affiliate of such Shareholder in connection with tax orestate-planning transactions, or, to the extent permitted by law, for sales of shares of Class A Stockin any three month period, that when aggregated with sales by all other Shareholders in such period,would not exceed the greater of one percent of the outstanding shares of Class A Stock or theaverage weekly trading volume of the Class A Stock during the four weeks preceding such sale.
Registration Rights—In the Agreement, the Company agreed that, following the secondanniversary of the Transaction and on not more than two occasions, the Shareholders would havethe right to require the Company to file a registration statement under the federal securities lawsregistering the sale of all or a portion of the shares of Class A Stock owned by the Shareholdersthat are not otherwise freely tradable, provided that the market value of the securities proposed tobe sold exceeds specified thresholds. The Company has the right to defer the filing of suchregistration statement under certain circumstances. The Company also agreed to allow theShareholders to participate in any registration statement proposed to be effected by the Companyfollowing the second anniversary of the Transaction, subject to certain restrictions.
The Company agreed to pay all expenses incurred in connection with such registration, otherthan any underwriting discounts or commissions, and also agreed to indemnify each Shareholderfrom losses incurred as a result of material misstatements or omissions in such registration statement(other than those that are the responsibility of the Shareholders, losses incurred by the Company asa result of which would be subject to indemnification from the Shareholders).
REINCORPORATION
On June 30, 2006, Sotheby’s Holdings, Inc., a Michigan corporation (“Sotheby’s Michigan”),completed its reincorporation into the State of Delaware (the “Reincorporation”). TheReincorporation and related proposals were approved by the shareholders of Sotheby’s Michigan atthe annual meeting of shareholders on May 8, 2006. The Reincorporation was completed by meansof a merger of Sotheby’s Michigan with and into Sotheby’s Delaware, Inc., a Delaware corporation(“Sotheby’s Delaware”) and a wholly-owned subsidiary of Sotheby’s Michigan incorporated for thepurpose of effecting the Reincorporation, with Sotheby’s Delaware being the surviving corporation.Sotheby’s Delaware was renamed “Sotheby’s” upon completion of the merger.
In the merger, each outstanding share of Sotheby’s Michigan Class A Limited Voting CommonStock (“Sotheby’s Michigan Stock”) was converted into one share of Common Stock of Sotheby’sDelaware (“Sotheby’s Delaware Stock”). As a result, holders of Sotheby’s Michigan Stock are nowholders of Sotheby’s Delaware Stock, and their rights as holders thereof are governed by theGeneral Corporation Law of the State of Delaware and the Certificate of Incorporation and By-Laws of Sotheby’s Delaware.
The Reincorporation was accounted for as a reverse merger whereby, for accounting purposes,Sotheby’s Michigan is considered the acquiror and the surviving corporation is treated as thesuccessor to the historical operations of Sotheby’s Michigan. Accordingly, the historical financialstatements of Sotheby’s Michigan, which Sotheby’s Michigan previously reported to the SEC onForms 10-K and 10-Q, among other forms, are treated as the financial statements of the survivingcorporation.
The Reincorporation did not result in any change in the business or principal facilities ofSotheby’s Michigan. Upon completion of the merger, the address of Sotheby’s principal executiveoffices is 1334 York Avenue, New York, NY 10021. Sotheby’s Michigan’s management and board ofdirectors continue as the management and board of directors of Sotheby’s Delaware. Sotheby’sDelaware Stock will continue to trade on the New York Stock Exchange under the symbol “BID.”Shareholders are not required to exchange their existing stock certificates, which now represent anequivalent number of shares of Sotheby’s Delaware Stock.
42

ACQUISITION
On June 7, 2006, the Company and Arcimboldo S.A. (“Arcimboldo”), a private limited liabilitycompany incorporated under the laws of Luxembourg, entered into a sale and purchase agreement(the “Purchase Agreement”), pursuant to which the Company acquired all the issued andoutstanding shares of capital stock of Noortman Master Paintings B.V. (previously defined as“NMP”), a company incorporated under the laws of the Netherlands and a pre-eminent art dealer.The acquisition of NMP provides the Company with the opportunity to expand its dealer activities.NMP is based in Maastricht, the Netherlands. Robert C. Noortman, who was the Managing Directorof NMP and sole shareholder of Arcimboldo and also guaranteed the obligations of Arcimboldounder the Purchase Agreement, died unexpectedly on January 14, 2007. Following Mr. Noortman’sdeath, his guarantee under the Purchase Agreement remains binding on his estate. NMP iscontinuing under the leadership of Mr. Noortman’s son, William. NMP’s results are included in theCompany’s Consolidated Income Statements beginning on June 1, 2006.
Pursuant to the Purchase Agreement, the Company paid initial consideration (the “InitialConsideration”) in the form of 1,946,849 shares of Sotheby’s Class A Common Stock (“Sotheby’sShares”), which had a fair value of approximately $41.4 million. The fair value of the Sotheby’sShares issued as Initial Consideration is based on the actual number of shares issued using theclosing price of Sotheby’s Shares on the New York Stock Exchange of $25.30 per share on June 6,2006 reduced by $7.9 million to reflect the fair value of certain restrictions on the future transfer ofthe Initial Consideration, as discussed in more detail below. The fair value of these restrictions wasdetermined by an independent valuation expert. In addition to the Initial Consideration, theCompany acquired NMP subject to approximately $25.6 million of indebtedness, consisting of a€12.5 million ($16.1 million) long-term non-interest bearing note payable to Arcimboldo over aperiod of three years (as discussed in more detail below) and $9.5 million of bank debt that wasrepaid upon the closing of the transaction, as well as the settlement of an $11.7 million payable toSotheby’s. As of the date of acquisition, the present value of the note payable to Arcimboldo wasapproximately €11.3 million ($14.6 million). The €1.2 million ($1.5 million) discount on the notepayable is being amortized to interest expense over the three-year term. The first payment of€2.1 million ($2.6 million) under the note payable was made on July 26, 2006. The remainingpayments under the note payable are due according to the following schedule: €2 million($2.7 million) on June 7, 2007, €4.2 million ($5.5 million) on June 7, 2008 and €4.2 million($5.5 million) on June 7, 2009.
If NMP fails to achieve a minimum level of financial performance during the five yearsfollowing the closing of the transaction, up to 20% of the Initial Consideration will be transferredback to the Company.
An additional 486,712 Sotheby’s Shares (the “Additional Consideration”) have been issued andplaced in escrow, to be released only if NMP achieves certain targeted performance criteria specifiedin the Purchase Agreement during the five years following the closing of the transaction and if NMPachieves certain service criteria. Based on the closing price of Sotheby’s Shares on the New YorkStock Exchange of $38.99 per share on February 20, 2007, the Additional Consideration has a fairvalue of approximately $19 million. The Additional Consideration is being held in escrow pursuantto an escrow agreement dated June 7, 2006, among the parties to the Purchase Agreement andLaSalle Bank N.A.
The Purchase Agreement also provides for certain restrictions on the transfer of Sotheby’sShares received by Arcimboldo, as discussed above. Subject to certain limited exclusions,Arcimboldo may not transfer any of the Sotheby’s Shares that it received as Initial Consideration fora period of two years after the closing, and may not transfer 20% of the Sotheby’s Shares that itreceived as Initial Consideration for a period of five years after the closing.
The Company, Arcimboldo and Mr. Noortman also made customary warranties and covenantsin the Purchase Agreement, including certain post-closing business covenants of the Company andcertain non-competition and non-solicitation covenants of Arcimboldo and Mr. Noortman for aperiod of five years following closing. Mr. Noortman also entered into a seven-year employmentagreement with NMP, which ceased upon Mr. Noortman’s death.
43

In addition, the Company also has in place a key man life insurance policy of $20 millioncovering Mr. Noortman. The Company has filed the necessary claim forms to establish its rightsunder this policy.
As a result of Mr. Noortman’s death in January 2007, goodwill and intangible assets related toNMP are being tested for impairment. The Company anticipates that it will record an impairmentcharge in the first quarter of 2007 to reduce the carrying values of NMP’s goodwill and intangibleassets. The amount of such a charge could potentially be material depending on the outcome of theCompany’s assessment.
(See Note C of Notes to Consolidated Financial Statements under Item 8, “Financial Statementsand Supplementary Data,” for additional information related to the acquisition of NMP.)
CONTRACTUAL OBLIGATIONS AND COMMITMENTS
The following table summarizes the Company’s material contractual obligations andcommitments as of December 31, 2006:
Total 20072008 to
20092010 to
2011After2011
Payments Due by Period
(Thousands of dollars)
Long-term debt (1):Principal payments . . . . . . . . . . . . . . . . . . . . . . . . . . $100,000 $ — $100,000 $ — $ —Interest payments . . . . . . . . . . . . . . . . . . . . . . . . . . . 16,615 6,875 9,740 — —
Sub-total. . . . . . . . . . . . . . . . . . . . . . . . . . . . . . . . 116,615 6,875 109,740 — —
Other commitments:York Property capital lease (2) . . . . . . . . . . . . . 369,670 19,287 39,900 41,274 269,209Operating lease obligations (3). . . . . . . . . . . . . . 83,001 15,718 23,791 10,226 33,266Discount Certificates (4) . . . . . . . . . . . . . . . . . . . . 46,731 46,731 — — —Note payable to Arcimboldo (5) . . . . . . . . . . . . 13,705 2,741 10,964 — —Employment arrangements (6) . . . . . . . . . . . . . . 25,247 6,678 10,571 7,084 914
Sub-total. . . . . . . . . . . . . . . . . . . . . . . . . . . . . . . . 538,354 91,155 85,226 58,584 303,389
Total . . . . . . . . . . . . . . . . . . . . . . . . . . . . . . . $654,969 $98,030 $194,966 $58,584 $303,389
(1) Represents the aggregate outstanding principal and semi-annual interest payments due on theCompany’s long-term debt. (See “Liquidity and Capital Resources” below and Note J of Notesto Consolidated Financial Statements under Item 8, “Financial Statements and SupplementaryData,” for information related to the Company’s credit arrangements.)
(2) Represents the rental payments due under the capital lease obligation for the York Property, asdiscussed in Notes G and L of Notes to Consolidated Financial Statements under Item 8,“Financial Statements and Supplementary Data.”
(3) Represents rental payments due under the Company’s operating lease obligations. (See Note Lof Notes to Consolidated Financial Statements under Item 8, “Financial Statements andSupplementary Data.”)
(4) Represents the remaining outstanding face value of the Discount Certificates that weredistributed in conjunction with the settlement of certain civil litigation related to the antitrustinvestigation by the U.S. Department of Justice, which are fully redeemable in connection withany auction that is conducted by the Company or Christie’s in the U.S. or in the U.K. TheDiscount Certificates may be used to satisfy consignment charges involving vendor’s commission,risk of loss and/or catalogue illustration. The Discount Certificates will expire on May 14, 2008and cannot be redeemed subsequent to that date; however, any unused Discount Certificatesmay be redeemed for cash at their face value at any time between May 15, 2007 and May 14,2008. (See Note Q of Notes to Consolidated Financial Statements under Item 8, “FinancialStatements and Supplementary Data.”)
(5) See Note C of Notes to Consolidated Financial Statements under Item 8, “Financial Statementsand Supplementary Data.”
44

(6) Represents the remaining commitment for future salaries as of December 31, 2006 related toemployment arrangements with eight employees, excluding incentive bonuses, any participationin the Company’s Executive Bonus Plan and equity grants. (See Note O of Notes toConsolidated Financial Statements under Item 8, “Financial Statements and SupplementaryData.”)
OFF-BALANCE SHEET ARRANGEMENTS
Auction Guarantees
From time to time in the ordinary course of business, the Company will guarantee to consignorsa minimum price in connection with the sale of property at auction. The Company must performunder its auction guarantee in the event the property sells for less than the minimum price, in whichevent the Company must fund the difference between the sale price at auction and the amount ofthe auction guarantee. If the property does not sell, the amount of the auction guarantee must bepaid, but the Company has the right to recover such amount through future sale of the property. Incertain instances, the sale proceeds ultimately realized by the Company exceed the amount of anyprior losses recognized on the auction guarantee. Additionally, the Company is generally entitled toa share of the excess proceeds if the property under the auction guarantee sells above a minimumprice. In addition, the Company is obligated under the terms of certain auction guarantees toadvance a portion of the guaranteed amount prior to the auction. In certain situations, the Companyreduces its financial exposure under auction guarantees through auction commission sharingarrangements with partners. Partners may also assist the Company in valuing and marketing theproperty to be sold at auction.
As of December 31, 2006, the Company had outstanding auction guarantees totaling $116.5million, the property relating to which had a mid-estimate sales price (1) of $132.3 million. TheCompany’s financial exposure under these auction guarantees is reduced by $0.5 million as a resultof sharing arrangements with partners. Substantially all of the property related to such auctionguarantees is being offered at auctions in the first half of 2007. As of December 31, 2006, $36million of the guaranteed amount had been advanced by the Company and is recorded within notesreceivable and consignor advances in the Consolidated Balance Sheet (see Note E of Notes toConsolidated Financial Statements under Item 8, “Financial Statements and Supplementary Data”).As of December 31, 2006 and December 31, 2005, the carrying amount of the liability related to theCompany’s auction guarantees was approximately $1.5 million and $0.3 million, respectively, and wasreflected in the Consolidated Balance Sheets within accounts payable and accrued liabilities.
As of February 20, 2007, the Company had outstanding auction guarantees totaling $83.2million, the property relating to which had a mid-estimate sales price (1) of $90.6 million.Substantially all of the property related to such auction guarantees is being offered at auctions in thefirst nine months of 2007. As of February 20, 2007, $15.7 million of the guaranteed amount hadbeen advanced by the Company and will be recorded within notes receivable and consignoradvances.
(1) The mid-estimate sales price is calculated as the average of the low and high pre-saleauction estimates for the property under the auction guarantee. Pre-sale estimates are notalways accurate predictions of auction sale results.
Lending Commitments
In certain situations, the Company enters into legally binding arrangements to lend, primarily ona collateralized basis and subject to certain limitations and conditions, to potential consignors andother individuals who have collections of fine art or other objects. Unfunded commitments to extendadditional credit were $15 million and $16.7 million at December 31, 2006 and February 20, 2007,respectively.
45

DERIVATIVE FINANCIAL INSTRUMENTS
The Company utilizes forward exchange contracts to manage exposures related to foreigncurrency risks, which primarily arise from short-term foreign currency denominated intercompanybalances and, to a lesser extent, foreign currency denominated client receivable and payablebalances, as well as foreign currency denominated future guarantee obligations. Generally, exposuresrelated to such foreign currency risks are centrally managed by the Company’s global treasuryfunction. The Company’s objective for holding derivative instruments is to minimize foreign currencyrisks using the most effective methods to eliminate or reduce the impacts of these exposures.
The forward exchange contracts entered into by the Company are used mostly as cash flowhedges of the Company’s exposure to short-term foreign currency denominated intercompanybalances and, to a lesser extent, foreign currency denominated client receivable and payablebalances, as well as foreign currency denominated future guarantee obligations. Such forwardexchange contracts are typically short-term with settlement dates less than one year from theirinception. These contracts are not designated as hedging instruments under SFAS No. 133,“Accounting for Derivative Instruments and Hedging Activities,” as amended, and are recorded inthe Consolidated Balance Sheets at fair value, which is based on referenced market rates. Changesin the fair value of the Company’s forward exchange contracts are recognized currently in earnings.
At December 31, 2006, the Company had $140.8 million of notional value forward exchangecontracts outstanding. Notional amounts do not quantify risk or represent assets or liabilities of theCompany, but are used in the calculation of cash settlements under such contracts. The Company isexposed to credit-related losses in the event of nonperformance by the two counterparties to itsforward exchange contracts, but the Company does not expect any counterparties to fail to meettheir obligations given their high credit ratings.
As of December 31, 2006, the Consolidated Balance Sheets included a liability of $1.1 millionrecorded within accounts payable and accrued liabilities reflecting the fair value of the Company’soutstanding forward exchange contracts on that date. As of December 31, 2005, the ConsolidatedBalance Sheets included an asset of $0.1 million recorded within prepaid expenses and other currentassets reflecting the fair value of the Company’s outstanding forward exchange contracts on thatdate.
CONTINGENCIES
For information related to Contingencies, see Note O of Notes to Consolidated FinancialStatements under Item 8, “Financial Statements and Supplementary Data.”
LIQUIDITY AND CAPITAL RESOURCES
On September 7, 2005, in connection with the Transaction discussed above under“Recapitalization” above, the Company terminated its previous senior secured credit agreement andentered into a new senior secured credit agreement with an international syndicate of lendersarranged by Banc of America Securities LLC (“BofA”) and LaSalle Bank N.A. (the “BofA CreditAgreement”). The BofA Credit Agreement originally provided for borrowings of up to $250 millionthrough a revolving credit facility. On May 18, 2006, the Company amended the BofA CreditAgreement to provide for $50 million in additional commitments from its existing lenders, therebyincreasing the total borrowing capacity to $300 million. The amendment also permits the amount ofavailable borrowings to be increased by an additional $50 million to $350 million.
The amount of borrowings available at any time under the BofA Credit Agreement is limited toa borrowing base, which is generally equal to 100% of eligible loans made by the Company in theU.S. and the U.K. (i.e., notes receivable and consignor advances) plus 15% of the Company’s nettangible assets (calculated as total assets less current liabilities, goodwill, intangible assets,unamortized debt discount and eligible loans). As of December 31, 2006, there were no outstandingborrowings under the BofA Credit Agreement and the amount of unused borrowing capacityavailable and borrowing base under the BofA Credit Agreement was $275.2 million. As ofFebruary 20, 2007, there were no outstanding borrowings under the BofA Credit Agreement and theamount of unused borrowing capacity available under the BofA Credit Agreement was $282.6million.
The BofA Credit Agreement is available through September 7, 2010; provided that in the eventthat any of the $100 million in long-term debt securities (the “Notes”) issued by the Company in
46

February 1999 are still outstanding on July 1, 2008, then either: (a) the Company shall deposit cashin an amount equal to the aggregate outstanding principal amount of the Notes on such date into anaccount in the sole control and dominion of BofA for the benefit of the lenders and the holders ofthe Notes or (b) the Company shall have otherwise demonstrated its ability to redeem and pay infull the Notes; otherwise, the BofA Credit Agreement shall terminate and all amounts outstandingthereunder shall be due and payable in full on July 1, 2008. Management expects to be able todemonstrate its ability to redeem and repay the Notes in full on the required date. (See Note J ofNotes to Consolidated Financial Statements under Item 8, “Financial Statements and SupplementaryData,” for more information related to the Notes.)
Borrowings under the BofA Credit Agreement were used to finance in part the Transaction andrelated expenses and are also available to provide ongoing working capital and for other generalcorporate purposes of the Company. The Company’s obligations under the BofA Credit Agreementare secured by substantially all of the non-real estate assets of the Company, as well as the non-realestate assets of its subsidiaries in the U.S. and the U.K.
The BofA Credit Agreement contains financial covenants requiring the Company not to exceeda maximum level of capital expenditures and dividend payments (as discussed in more detail below)and to have a quarterly interest coverage ratio of not less than 2.0 and a quarterly leverage ratio ofnot more than: (i) 3.5 for quarters ending December 31, 2006 to September 30, 2007 and (ii) 3.0 forquarters ending December 31, 2007 and thereafter. The maximum level of annual capitalexpenditures permitted under the BofA Credit Agreement is $15 million through 2007 and $20million thereafter with any unused amounts carried forward to the following year. Dividendpayments, if any, must be paid solely out of 40% of the Company’s net income arising afterJune 30, 2005 and computed on a cumulative basis. The BofA Credit Agreement also has certainnon-financial covenants and restrictions. The Company is in compliance with its covenants.
On each of August 2 and November 2, 2006, the Company’s Board of Directors declaredquarterly dividends on its common stock of $0.10 per share totaling approximately $6.4 million and$6.5 million, respectively. The dividend declared on August 2, 2006 was paid on September 15, 2006.The dividend declared on November 2, 2006 was paid on December 15, 2006. On February 27, 2007,the Company’s Board of Directors declared a quarterly dividend on its common stock of $0.10 pershare (approximately $6.5 million), to be paid on March 15, 2007 to shareholders of record onFebruary 28, 2007. It is the intention of the Company to continue to pay quarterly dividends at thisrate (an annual rate of $0.40 per share), subject to Board approval and depending on economic,financial, market and other conditions at the time. (See statement on Forward Looking Statements.)
At the option of the Company, any borrowings under the BofA Credit Agreement generallybear interest at a rate equal to: (i) LIBOR plus 1.75%, or (ii) 0.5% plus the higher of the PrimeRate or the Federal Funds Rate plus 0.5%. For the years ended December 31, 2006 and 2005, theweighted average interest rates incurred by the Company on outstanding borrowings under the BofACredit Agreement were approximately 7% and 6.3%, respectively.
The Company paid underwriting, structuring and amendment fees of $2.8 million related to theBofA Credit Agreement, which are being amortized on a straight-line basis to interest expense overthe term of the facility.
The Company generally relies on operating cash flows supplemented by borrowings to meet itsliquidity requirements. The Company currently believes that operating cash flows, current cashbalances and borrowings available under the BofA Credit Agreement will be adequate to meet itspresently contemplated or anticipated short-term and long-term commitments, operating needs andcapital requirements through September 7, 2010.
The Company’s short-term operating needs and capital requirements include peak seasonalworking capital requirements, other short-term commitments to consignors, the funding of notesreceivable and consignor advances, the funding of capital expenditures and the payment of thequarterly dividend discussed above, as well as the short-term commitments to be funded prior toDecember 31, 2007 included in the table of contractual obligations above.
The Company’s long-term operating needs and capital requirements include peak seasonalworking capital requirements, the funding of notes receivable and consignor advances and thefunding of capital expenditures, as well as the funding of the Company’s presently anticipated long-term contractual obligations and commitments included in the table of contractual obligations abovethrough September 7, 2010.
47

On December 7, 2006, the Company adopted the Sotheby’s Deferred Compensation Plan (the“Deferred Compensation Plan”), effective January 1, 2007. The Deferred Compensation Planreplaced the Sotheby’s, Inc. 2005 Benefit Equalization Plan (the “2005 BEP”), which superseded anexisting Benefit Equalization Plan (the “BEP”), with a plan that incorporates best practice featuresof contemporary non-qualified plans. Employee deferrals and Company contributions to theDeferred Compensation Plan are informally funded into a rabbi trust which provides additionalbenefit security by sheltering assets in the event of a change-in-control of the Company and certainother situations. Plan liabilities are financed through the trust using Company-owned variable lifeinsurance, as well as other investments. The combined unfunded liability for the 2005 BEP and theBEP, which totaled $24.2 million as of December 31, 2006, was transferred into the DeferredCompensation Plan on January 1, 2007. The Company funded this amount into the rabbi trust onFebruary 8, 2007. (See Note N of Notes to Consolidated Financial Statements under Item 8,“Financial Statements and Supplementary Data,” for additional information related to the DeferredCompensation Plan.)
QUANTITATIVE AND QUALITATIVE DISCLOSURES ABOUT MARKET RISK
The Company continually evaluates its market risk associated with its financial instruments andforward exchange contracts during the course of its business. The Company’s financial instrumentsinclude cash and cash equivalents, restricted cash, short-term investments, notes receivable andconsignor advances, credit facility borrowings, long-term debt, the note payable to Arcimboldo (seeNote C of Notes to Consolidated Financial Statements under Item 8, “Financial Statements andSupplementary Data”) and the liability for the Discount Certificates issued in connection with thesettlement of certain civil antitrust litigation (see Note Q of Notes to Consolidated FinancialStatements under Item 8, “Financial Statements and Supplementary Data”).
The Company believes that its interest rate risk is minimal as a hypothetical 10% increase ordecrease in interest rates is immaterial to the Company’s cash flow, earnings and fair value relatedto financial instruments. (See statement on Forward Looking Statements.)
The Company utilizes forward exchange contracts to manage exposures related to foreigncurrency risks, which primarily arise from short-term foreign currency denominated intercompanybalances and, to a lesser extent, foreign currency denominated client receivable and payablebalances, as well as foreign currency denominated future guarantee obligations. At December 31,2006, the Company had $140.8 million of notional value forward exchange contracts outstanding.Notional amounts do not quantify risk or represent assets or liabilities of the Company, but are usedin the calculation of cash settlements under such contracts. The Company is exposed to credit-related losses in the event of nonperformance by the two counterparties to its forward exchangecontracts, but the Company does not expect any counterparties to fail to meet their obligationsgiven their high credit ratings. (See “Derivative Financial Instruments” above and Note B of Notesto Consolidated Financial Statements under Item 8, “Financial Statements and SupplementaryData.”)
At December 31, 2006, a hypothetical 10% strengthening or weakening of the U.S. dollarrelative to all other currencies would result in a decrease or increase in cash flow of approximately$19.9 million.
FUTURE IMPACT OF RECENTLY ISSUED ACCOUNTING STANDARDS
In July, 2006, the FASB issued FASB Interpretation (“FIN”) No. 48, “Accounting forUncertainty in Income Taxes—an interpretation of FASB Statement No. 109.,” which requires thatrealization of an uncertain income tax position must be “more likely than not” (i.e., greater than50% likelihood of receiving a benefit) before it can be recognized in the financial statements.Further, this interpretation prescribes the benefit to be recorded in the financial statements as theamount most likely to be realized assuming a review by tax authorities having all relevantinformation and applying current conventions; clarifies the financial statement classification of tax-related penalties and interest and sets forth new disclosures regarding unrecognized tax benefits. FINNo. 48 is effective for the Company in the first quarter of 2007. Management is evaluating theCompany’s tax positions and assessing the impact of adopting FIN No. 48.
48

In September 2006, the FASB issued SFAS No. 157, “Fair Value Measurements.” ThisStatement defines fair value, establishes a framework for measuring fair value, and expandsdisclosures about fair value measurements. SFAS No. 157 applies under other accountingpronouncements that require or permit fair value measurements. The provisions of SFAS No. 157are effective for financial statements issued by the Company starting in 2008. Management isevaluating the impact of adopting SFAS No. 157, if any, on the Company’s financial statements.
In February 2007, the FASB issued SFAS No. 159, “The Fair Value Option for Financial Assetsand Financial Liabilities—Including an amendment of FASB Statement No. 115.” SFAS No. 159permits entities to choose to measure many financial instruments and certain other items at fairvalue. Unrealized gains and losses on items for which the fair value option has been elected will berecognized in earnings at each subsequent reporting date. SFAS No. 159 is effective for theCompany as of January 1, 2008. Management is evaluating the impact of adopting SFAS No. 159, ifany, on the Company’s financial statements.
STRATEGIC INITIATIVES
In recent years, the Company’s focus on the high end of the art market has been an importantcontributor to its success. Accordingly, management is initiating significant organizational changes,globally reorganizing its management of client relationships and investing in those areas most valuedby its major clients. For example, a major corporate web site enhancement will provide clients withreal-time access to their account data and balances, as well as information on current and historicaltransactions, auction tracking services and enhanced media content.
In line with the Company’s strategy, in February 2007, management decided to refocus itsbusiness portfolio. Accordingly, the Company will discontinue auctions at Olympia in London, whichtraditionally has processed sales at a much lower price point than the rest of the Company. Inaddition, there will be staff reductions in lower end sales categories in New York, Amsterdam andMilan. The Company expects these decisions, which will be guided by local statutory consultationguidelines, to reduce headcount by approximately five percent globally and to result in first quarterseverance charges in the range of $2 million. In addition, this strategic initiative will significantlyreduce the quantity of lots offered for sale at auction, which will result in cost savings and operatingefficiencies. However, the Company will invest a portion of these savings in new staff, in order tobetter focus on client relationships and grow revenues, which management expects will more thanoffset the lost revenue on lower end sales categories. The Company anticipates implementing manyof these strategic changes during the first half of 2007, with the benefits beginning to be realized inthe second half of 2007 and increasingly in future years. Accordingly, there could be an unfavorableimpact on short-term operating results. (See statement on Forward Looking Statements.)
FORWARD LOOKING STATEMENTS
This Form 10-K contains certain forward looking statements; as such term is defined in Section21E of the Securities Exchange Act of 1934, as amended, relating to future events and the financialperformance of the Company. Such statements are only predictions and involve risks anduncertainties, resulting in the possibility that the actual events or performance will differ materiallyfrom such predictions. Major factors which the Company believes could cause the actual results todiffer materially from the predicted results in the forward looking statements include, but are notlimited to, the factors listed below under Part I, Item 1A, “Risk Factors,” which are not ranked inany particular order.
ITEM 7A: QUANTITATIVE AND QUALITATIVE DISCLOSURES ABOUT MARKET RISK
See the discussion under this caption contained in Item 7.
49

ITEM 8: FINANCIAL STATEMENTS AND SUPPLEMENTARY DATA
REPORT OF INDEPENDENT REGISTERED PUBLIC ACCOUNTING FIRM
To the Board of Directors and Shareholders ofSOTHEBY’S
New York, New York
We have audited the accompanying consolidated balance sheets of Sotheby’s and subsidiaries(the “Company”) as of December 31, 2006 and 2005, and the related consolidated statements ofincome, cash flows, and changes in shareholders’ equity for each of the three years in the periodended December 31, 2006. Our audits also included the financial statement schedule listed in theIndex at Item 15(d). These financial statements and financial statement schedule are theresponsibility of the Company’s management. Our responsibility is to express an opinion on thefinancial statements and financial statement schedule based on our audits.
We conducted our audits in accordance with the standards of the Public Company AccountingOversight Board (United States). Those standards require that we plan and perform the audit toobtain reasonable assurance about whether the financial statements are free of materialmisstatement. An audit includes examining, on a test basis, evidence supporting the amounts anddisclosures in the financial statements. An audit also includes assessing the accounting principlesused and significant estimates made by management, as well as evaluating the overall financialstatement presentation. We believe that our audits provide a reasonable basis for our opinion.
In our opinion, such consolidated financial statements present fairly, in all material respects, thefinancial position of Sotheby’s and subsidiaries as of December 31, 2006 and 2005, and the results oftheir operations and their cash flows for each of the three years in the period ended December 31,2006, in conformity with accounting principles generally accepted in the United States of America.Also, in our opinion, such financial statement schedule, when considered in relation to the basicconsolidated financial statements taken as a whole, presents fairly, in all material respects, theinformation set forth therein.
As discussed in Notes M and N to the consolidated financial statements, in 2006 the Companyadopted Statement of Financial Accounting Standards No. 123 (R), “Share-Based Payment,” asrevised effective January 1, 2006 and the recognition and disclosure provisions of Statement ofFinancial Accounting Standards No. 158, “Employers’ Accounting for Defined Benefit Pension andOther Postretirement Plans—an amendment of FASB Statements No. 87, 88, 106 and 132(R),”effective December 31, 2006. In addition, as discussed in Note B to the consolidated financialstatements, in 2005 the Company adopted FASB Interpretation No. 47, “Accounting for ConditionalAsset Retirement Obligations—an interpretation of FASB Statement No. 143,” effectiveDecember 31, 2005.
We have also audited, in accordance with the standards of the Public Company AccountingOversight Board (United States), the effectiveness of the Company’s internal control over financialreporting as of December 31, 2006, based on the criteria established in Internal Control—IntegratedFramework issued by the Committee of Sponsoring Organizations of the Treadway Commission andour report dated March 1, 2007 expressed an unqualified opinion on management’s assessment ofthe effectiveness of the Company’s internal control over financial reporting and an unqualifiedopinion on the effectiveness of the Company’s internal control over financial reporting.
/s/ DELOITTE & TOUCHE LLP
Deloitte & Touche LLPNew York, New YorkMarch 1, 2007
50

SOTHEBY’SCONSOLIDATED INCOME STATEMENTS(Thousands of dollars, except per share data)
Year Ended December 31 2006 2005 2004
Revenues:Auction and related revenues . . . . . . . . . . . . . . . . . . . . . . . . . . . . . . . . . . . $631,344 $496,899 $439,526Finance revenues . . . . . . . . . . . . . . . . . . . . . . . . . . . . . . . . . . . . . . . . . . . . . . . . 15,864 8,302 5,907Dealer revenues . . . . . . . . . . . . . . . . . . . . . . . . . . . . . . . . . . . . . . . . . . . . . . . . . 12,776 5,131 3,604License fee revenues . . . . . . . . . . . . . . . . . . . . . . . . . . . . . . . . . . . . . . . . . . . . 2,922 1,404 45,745Other revenues . . . . . . . . . . . . . . . . . . . . . . . . . . . . . . . . . . . . . . . . . . . . . . . . . . 1,903 2,117 2,274
Total revenues . . . . . . . . . . . . . . . . . . . . . . . . . . . . . . . . . . . . . . . . . . . . . . 664,809 513,853 497,056
Expenses:Direct costs of services . . . . . . . . . . . . . . . . . . . . . . . . . . . . . . . . . . . . . . . . . . 74,120 65,782 55,551Dealer cost of sales . . . . . . . . . . . . . . . . . . . . . . . . . . . . . . . . . . . . . . . . . . . . . 6,060 — —Salaries and related costs. . . . . . . . . . . . . . . . . . . . . . . . . . . . . . . . . . . . . . . . 226,410 187,753 177,717General and administrative expenses . . . . . . . . . . . . . . . . . . . . . . . . . . . . 138,278 114,974 112,863Depreciation and amortization expense . . . . . . . . . . . . . . . . . . . . . . . . . 22,783 22,081 23,837Retention costs . . . . . . . . . . . . . . . . . . . . . . . . . . . . . . . . . . . . . . . . . . . . . . . . . . — — 285Net restructuring charges . . . . . . . . . . . . . . . . . . . . . . . . . . . . . . . . . . . . . . . . — — 146
Total expenses . . . . . . . . . . . . . . . . . . . . . . . . . . . . . . . . . . . . . . . . . . . . . . 467,651 390,590 370,399
Operating income . . . . . . . . . . . . . . . . . . . . . . . . . . . . . . . . . . . . . . . . . . . . . . . . . . . . 197,158 123,263 126,657Interest income . . . . . . . . . . . . . . . . . . . . . . . . . . . . . . . . . . . . . . . . . . . . . . . . . . . . . . 5,891 5,683 3,284Interest expense . . . . . . . . . . . . . . . . . . . . . . . . . . . . . . . . . . . . . . . . . . . . . . . . . . . . . (33,039) (33,421) (33,551)Credit facility termination costs . . . . . . . . . . . . . . . . . . . . . . . . . . . . . . . . . . . . . . — (3,069) —Other (expense) income . . . . . . . . . . . . . . . . . . . . . . . . . . . . . . . . . . . . . . . . . . . . . (4,227) (1,474) 267
Income from continuing operations before taxes . . . . . . . . . . . . . . . . . . . . . 165,783 90,982 96,657Equity in earnings of investees, net of taxes . . . . . . . . . . . . . . . . . . . . . . . . . 1,626 829 740Income tax expense . . . . . . . . . . . . . . . . . . . . . . . . . . . . . . . . . . . . . . . . . . . . . . . . . . 60,050 28,594 35,000
Income from continuing operations . . . . . . . . . . . . . . . . . . . . . . . . . . . . . . . . . . 107,359 63,217 62,397
Discontinued operations:(Loss) income from discontinued operations before taxes . . . . . . . (504) (854) 38,798Income tax (benefit) expense. . . . . . . . . . . . . . . . . . . . . . . . . . . . . . . . . . . . (194) (369) 14,516
(Loss) income from discontinued operations. . . . . . . . . . . . . . . . . . . . . (310) (485) 24,282
Cumulative effect of a change in accounting principle, net of taxes . . — (1,130) —
Net income . . . . . . . . . . . . . . . . . . . . . . . . . . . . . . . . . . . . . . . . . . . . . . . . . . . . . . . . . . $107,049 $ 61,602 $ 86,679
Basic earnings per share:Earnings from continuing operations . . . . . . . . . . . . . . . . . . . . . . . . . . . . $ 1.78 $ 1.04 $ 1.01(Loss) earnings from discontinued operations . . . . . . . . . . . . . . . . . . . (0.01) (0.01) 0.39Cumulative effect of a change in accounting principle, net of
taxes . . . . . . . . . . . . . . . . . . . . . . . . . . . . . . . . . . . . . . . . . . . . . . . . . . . . . . . . . . — (0.02) —
Basic earnings per share . . . . . . . . . . . . . . . . . . . . . . . . . . . . . . . . . . . . . . . . . . . . . $ 1.77 $ 1.01 $ 1.40
Diluted earnings per share:Earnings from continuing operations . . . . . . . . . . . . . . . . . . . . . . . . . . . . $ 1.73 $ 1.02 $ 1.00(Loss) earnings from discontinued operations . . . . . . . . . . . . . . . . . . . (0.00) (0.01) 0.39Cumulative effect of a change in accounting principle, net of
taxes . . . . . . . . . . . . . . . . . . . . . . . . . . . . . . . . . . . . . . . . . . . . . . . . . . . . . . . . . . — (0.02) —
Diluted earnings per share . . . . . . . . . . . . . . . . . . . . . . . . . . . . . . . . . . . . . . . . . . . $ 1.72 $ 1.00 $ 1.38
Dividends per share. . . . . . . . . . . . . . . . . . . . . . . . . . . . . . . . . . . . . . . . . . . . . . . . . . $ 0.20 $ — $ —
51
See accompanying Notes to Consolidated Financial Statements
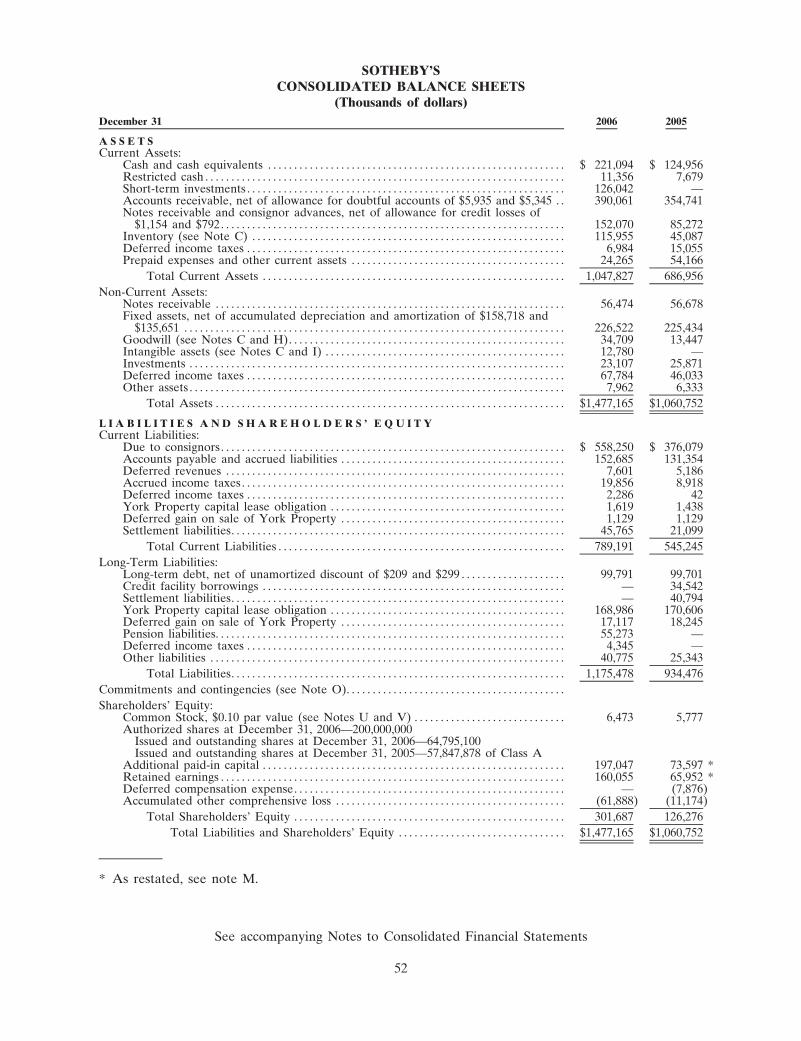
SOTHEBY’SCONSOLIDATED BALANCE SHEETS
(Thousands of dollars)
December 31 2006 2005
A S S E T SCurrent Assets:
Cash and cash equivalents . . . . . . . . . . . . . . . . . . . . . . . . . . . . . . . . . . . . . . . . . . . . . . . . . . . . . . . . . $ 221,094 $ 124,956Restricted cash . . . . . . . . . . . . . . . . . . . . . . . . . . . . . . . . . . . . . . . . . . . . . . . . . . . . . . . . . . . . . . . . . . . . . 11,356 7,679Short-term investments . . . . . . . . . . . . . . . . . . . . . . . . . . . . . . . . . . . . . . . . . . . . . . . . . . . . . . . . . . . . . 126,042 —Accounts receivable, net of allowance for doubtful accounts of $5,935 and $5,345 . . 390,061 354,741Notes receivable and consignor advances, net of allowance for credit losses of
$1,154 and $792. . . . . . . . . . . . . . . . . . . . . . . . . . . . . . . . . . . . . . . . . . . . . . . . . . . . . . . . . . . . . . . . . . 152,070 85,272Inventory (see Note C) . . . . . . . . . . . . . . . . . . . . . . . . . . . . . . . . . . . . . . . . . . . . . . . . . . . . . . . . . . . . 115,955 45,087Deferred income taxes . . . . . . . . . . . . . . . . . . . . . . . . . . . . . . . . . . . . . . . . . . . . . . . . . . . . . . . . . . . . . 6,984 15,055Prepaid expenses and other current assets . . . . . . . . . . . . . . . . . . . . . . . . . . . . . . . . . . . . . . . . . 24,265 54,166
Total Current Assets . . . . . . . . . . . . . . . . . . . . . . . . . . . . . . . . . . . . . . . . . . . . . . . . . . . . . . . . . . 1,047,827 686,956
Non-Current Assets:Notes receivable . . . . . . . . . . . . . . . . . . . . . . . . . . . . . . . . . . . . . . . . . . . . . . . . . . . . . . . . . . . . . . . . . . . 56,474 56,678Fixed assets, net of accumulated depreciation and amortization of $158,718 and
$135,651 . . . . . . . . . . . . . . . . . . . . . . . . . . . . . . . . . . . . . . . . . . . . . . . . . . . . . . . . . . . . . . . . . . . . . . . . . 226,522 225,434Goodwill (see Notes C and H). . . . . . . . . . . . . . . . . . . . . . . . . . . . . . . . . . . . . . . . . . . . . . . . . . . . . 34,709 13,447Intangible assets (see Notes C and I) . . . . . . . . . . . . . . . . . . . . . . . . . . . . . . . . . . . . . . . . . . . . . . 12,780 —Investments . . . . . . . . . . . . . . . . . . . . . . . . . . . . . . . . . . . . . . . . . . . . . . . . . . . . . . . . . . . . . . . . . . . . . . . . 23,107 25,871Deferred income taxes . . . . . . . . . . . . . . . . . . . . . . . . . . . . . . . . . . . . . . . . . . . . . . . . . . . . . . . . . . . . . 67,784 46,033Other assets . . . . . . . . . . . . . . . . . . . . . . . . . . . . . . . . . . . . . . . . . . . . . . . . . . . . . . . . . . . . . . . . . . . . . . . . 7,962 6,333
Total Assets . . . . . . . . . . . . . . . . . . . . . . . . . . . . . . . . . . . . . . . . . . . . . . . . . . . . . . . . . . . . . . . . . . . $1,477,165 $1,060,752
L I A B I L I T I E S A N D S H A R E H O L D E R S ’ E Q U I T YCurrent Liabilities:
Due to consignors. . . . . . . . . . . . . . . . . . . . . . . . . . . . . . . . . . . . . . . . . . . . . . . . . . . . . . . . . . . . . . . . . . $ 558,250 $ 376,079Accounts payable and accrued liabilities . . . . . . . . . . . . . . . . . . . . . . . . . . . . . . . . . . . . . . . . . . . 152,685 131,354Deferred revenues . . . . . . . . . . . . . . . . . . . . . . . . . . . . . . . . . . . . . . . . . . . . . . . . . . . . . . . . . . . . . . . . . 7,601 5,186Accrued income taxes. . . . . . . . . . . . . . . . . . . . . . . . . . . . . . . . . . . . . . . . . . . . . . . . . . . . . . . . . . . . . . 19,856 8,918Deferred income taxes . . . . . . . . . . . . . . . . . . . . . . . . . . . . . . . . . . . . . . . . . . . . . . . . . . . . . . . . . . . . . 2,286 42York Property capital lease obligation . . . . . . . . . . . . . . . . . . . . . . . . . . . . . . . . . . . . . . . . . . . . . 1,619 1,438Deferred gain on sale of York Property . . . . . . . . . . . . . . . . . . . . . . . . . . . . . . . . . . . . . . . . . . . 1,129 1,129Settlement liabilities. . . . . . . . . . . . . . . . . . . . . . . . . . . . . . . . . . . . . . . . . . . . . . . . . . . . . . . . . . . . . . . . 45,765 21,099
Total Current Liabilities . . . . . . . . . . . . . . . . . . . . . . . . . . . . . . . . . . . . . . . . . . . . . . . . . . . . . . . 789,191 545,245
Long-Term Liabilities:Long-term debt, net of unamortized discount of $209 and $299 . . . . . . . . . . . . . . . . . . . . 99,791 99,701Credit facility borrowings . . . . . . . . . . . . . . . . . . . . . . . . . . . . . . . . . . . . . . . . . . . . . . . . . . . . . . . . . . — 34,542Settlement liabilities. . . . . . . . . . . . . . . . . . . . . . . . . . . . . . . . . . . . . . . . . . . . . . . . . . . . . . . . . . . . . . . . — 40,794York Property capital lease obligation . . . . . . . . . . . . . . . . . . . . . . . . . . . . . . . . . . . . . . . . . . . . . 168,986 170,606Deferred gain on sale of York Property . . . . . . . . . . . . . . . . . . . . . . . . . . . . . . . . . . . . . . . . . . . 17,117 18,245Pension liabilities. . . . . . . . . . . . . . . . . . . . . . . . . . . . . . . . . . . . . . . . . . . . . . . . . . . . . . . . . . . . . . . . . . . 55,273 —Deferred income taxes . . . . . . . . . . . . . . . . . . . . . . . . . . . . . . . . . . . . . . . . . . . . . . . . . . . . . . . . . . . . . 4,345 —Other liabilities . . . . . . . . . . . . . . . . . . . . . . . . . . . . . . . . . . . . . . . . . . . . . . . . . . . . . . . . . . . . . . . . . . . . 40,775 25,343
Total Liabilities. . . . . . . . . . . . . . . . . . . . . . . . . . . . . . . . . . . . . . . . . . . . . . . . . . . . . . . . . . . . . . . . 1,175,478 934,476
Commitments and contingencies (see Note O). . . . . . . . . . . . . . . . . . . . . . . . . . . . . . . . . . . . . . . . . .
Shareholders’ Equity:Common Stock, $0.10 par value (see Notes U and V) . . . . . . . . . . . . . . . . . . . . . . . . . . . . . 6,473 5,777Authorized shares at December 31, 2006—200,000,000
Issued and outstanding shares at December 31, 2006—64,795,100Issued and outstanding shares at December 31, 2005—57,847,878 of Class A
Additional paid-in capital . . . . . . . . . . . . . . . . . . . . . . . . . . . . . . . . . . . . . . . . . . . . . . . . . . . . . . . . . . 197,047 73,597 *Retained earnings . . . . . . . . . . . . . . . . . . . . . . . . . . . . . . . . . . . . . . . . . . . . . . . . . . . . . . . . . . . . . . . . . . 160,055 65,952 *Deferred compensation expense. . . . . . . . . . . . . . . . . . . . . . . . . . . . . . . . . . . . . . . . . . . . . . . . . . . . — (7,876)Accumulated other comprehensive loss . . . . . . . . . . . . . . . . . . . . . . . . . . . . . . . . . . . . . . . . . . . . (61,888) (11,174)
Total Shareholders’ Equity . . . . . . . . . . . . . . . . . . . . . . . . . . . . . . . . . . . . . . . . . . . . . . . . . . . . 301,687 126,276
Total Liabilities and Shareholders’ Equity . . . . . . . . . . . . . . . . . . . . . . . . . . . . . . . . $1,477,165 $1,060,752
* As restated, see note M.
52
See accompanying Notes to Consolidated Financial Statements

SOTHEBY’SCONSOLIDATED STATEMENTS OF CASH FLOWS
(Thousands of dollars)
Year Ended December 31 2006 2005 2004
Operating Activities:Net income* . . . . . . . . . . . . . . . . . . . . . . . . . . . . . . . . . . . . . . . . . . . . . . . . . . . . . . . . . . . . . . . . . . . . . . . . . . . . . . $ 107,049 $ 61,602 $ 86,679Adjustments to reconcile net income to net cash provided by operating activities:
Depreciation and amortization expense . . . . . . . . . . . . . . . . . . . . . . . . . . . . . . . . . . . . . . . . . . . . . . . 22,783 22,081 23,837Gain on sale of discontinued operations . . . . . . . . . . . . . . . . . . . . . . . . . . . . . . . . . . . . . . . . . . . . . . — — (32,005)Equity in earnings of investees . . . . . . . . . . . . . . . . . . . . . . . . . . . . . . . . . . . . . . . . . . . . . . . . . . . . . . . (1,626) (829) (740)Deferred income tax expense . . . . . . . . . . . . . . . . . . . . . . . . . . . . . . . . . . . . . . . . . . . . . . . . . . . . . . . . . 23,347 8,757 23,215Stock compensation expense. . . . . . . . . . . . . . . . . . . . . . . . . . . . . . . . . . . . . . . . . . . . . . . . . . . . . . . . . . 15,830 8,269 6,646Defined benefit pension expense . . . . . . . . . . . . . . . . . . . . . . . . . . . . . . . . . . . . . . . . . . . . . . . . . . . . . 6,897 5,332 2,757Cumulative effect of a change in accounting principle . . . . . . . . . . . . . . . . . . . . . . . . . . . . . . . . — 1,130 —Asset provisions . . . . . . . . . . . . . . . . . . . . . . . . . . . . . . . . . . . . . . . . . . . . . . . . . . . . . . . . . . . . . . . . . . . . . . 4,320 3,667 4,033Write-off of fees and direct costs related to terminated credit agreement
(see Note J) . . . . . . . . . . . . . . . . . . . . . . . . . . . . . . . . . . . . . . . . . . . . . . . . . . . . . . . . . . . . . . . . . . . . . . . . — 2,069 —Amortization of discount related to antitrust matters . . . . . . . . . . . . . . . . . . . . . . . . . . . . . . . . . 2,679 3,988 4,885Excess tax benefits from stock-based compensation. . . . . . . . . . . . . . . . . . . . . . . . . . . . . . . . . . . (14,871) — —Other . . . . . . . . . . . . . . . . . . . . . . . . . . . . . . . . . . . . . . . . . . . . . . . . . . . . . . . . . . . . . . . . . . . . . . . . . . . . . . . . . 658 1,285 1,602
Changes in assets and liabilities (net of effects from acquisition—see Note C):(Increase) decrease in accounts receivable . . . . . . . . . . . . . . . . . . . . . . . . . . . . . . . . . . . . . . . . . . . . (21,653) 34,833 (172,482)Increase in inventory . . . . . . . . . . . . . . . . . . . . . . . . . . . . . . . . . . . . . . . . . . . . . . . . . . . . . . . . . . . . . . . . . (17,177) (14,526) (19,312)Increase in prepaid expenses and other current assets . . . . . . . . . . . . . . . . . . . . . . . . . . . . . . . . (8,896) (6,122) (17,518)Increase in other long-term assets . . . . . . . . . . . . . . . . . . . . . . . . . . . . . . . . . . . . . . . . . . . . . . . . . . . . (904) (2,863) (372)Funding of settlement liabilities . . . . . . . . . . . . . . . . . . . . . . . . . . . . . . . . . . . . . . . . . . . . . . . . . . . . . . (19,009) (18,214) (10,822)Increase (decrease) in due to consignors. . . . . . . . . . . . . . . . . . . . . . . . . . . . . . . . . . . . . . . . . . . . . . 170,458 (79,899) 208,655Decrease (increase) in income tax receivable and deferred income tax assets . . . . . . . . 5,105 865 (677)Increase (decrease) in accrued income taxes and deferred income tax liabilities . . . . . . 8,507 (3,297) 6,191(Decrease) increase in accounts payable and accrued liabilities and other liabilities . . (13,084) 30,658 28,218Adjustments related to discontinued operations . . . . . . . . . . . . . . . . . . . . . . . . . . . . . . . . . . . . . . — — 3,461
Net cash provided by operating activities . . . . . . . . . . . . . . . . . . . . . . . . . . . . . . . . . . . . . . . . 270,413 58,786 146,251
Investing Activities:Funding of notes receivable and consignor advances. . . . . . . . . . . . . . . . . . . . . . . . . . . . . . . . . . (280,735) (214,918) (145,663)Collections of notes receivable and consignor advances. . . . . . . . . . . . . . . . . . . . . . . . . . . . . . . 219,266 164,856 160,940Purchases of short-term investments . . . . . . . . . . . . . . . . . . . . . . . . . . . . . . . . . . . . . . . . . . . . . . . . . . (312,183) (323,163) (288,414)Proceeds from maturities of short-term investments . . . . . . . . . . . . . . . . . . . . . . . . . . . . . . . . . . 186,141 433,163 178,414Capital expenditures . . . . . . . . . . . . . . . . . . . . . . . . . . . . . . . . . . . . . . . . . . . . . . . . . . . . . . . . . . . . . . . . . . (12,719) (14,862) (13,468)Distributions from equity investees . . . . . . . . . . . . . . . . . . . . . . . . . . . . . . . . . . . . . . . . . . . . . . . . . . . 5,434 3,748 2,900(Increase) decrease in restricted cash . . . . . . . . . . . . . . . . . . . . . . . . . . . . . . . . . . . . . . . . . . . . . . . . . (3,061) 4,032 (4,489)Proceeds from sale of discontinued operations. . . . . . . . . . . . . . . . . . . . . . . . . . . . . . . . . . . . . . . . — — 53,863Investing activities related to discontinued operations . . . . . . . . . . . . . . . . . . . . . . . . . . . . . . . . — — 561
Net cash (used) provided by investing activities . . . . . . . . . . . . . . . . . . . . . . . . . . . . . . . . . . (197,857) 52,856 (55,356)
Financing Activities:Proceeds from revolving credit facility borrowings . . . . . . . . . . . . . . . . . . . . . . . . . . . . . . . . . . . . 398,673 174,542 65,000Repayments of revolving credit facility borrowings . . . . . . . . . . . . . . . . . . . . . . . . . . . . . . . . . . . (435,158) (140,000) (85,000)Repurchase of common stock. . . . . . . . . . . . . . . . . . . . . . . . . . . . . . . . . . . . . . . . . . . . . . . . . . . . . . . . . (212) (177,215) —Dividends paid . . . . . . . . . . . . . . . . . . . . . . . . . . . . . . . . . . . . . . . . . . . . . . . . . . . . . . . . . . . . . . . . . . . . . . . (12,946) — —Repayment of acquiree bank debt (see Note C). . . . . . . . . . . . . . . . . . . . . . . . . . . . . . . . . . . . . . (9,531) — —Decrease in York Property capital lease obligation . . . . . . . . . . . . . . . . . . . . . . . . . . . . . . . . . . . (1,437) (125) (113)Proceeds from exercise of employee stock options. . . . . . . . . . . . . . . . . . . . . . . . . . . . . . . . . . . . 66,987 9,322 9,945Excess tax benefits from stock-based compensation. . . . . . . . . . . . . . . . . . . . . . . . . . . . . . . . . . . 14,871 — —
Net cash provided (used) by financing activities . . . . . . . . . . . . . . . . . . . . . . . . . . . . . . . . . 21,247 (133,476) (10,168)
Effect of exchange rate changes on cash and cash equivalents . . . . . . . . . . . . . . . . . . . . . . . . . . . . 2,335 (233) 893Increase (decrease) in cash and cash equivalents . . . . . . . . . . . . . . . . . . . . . . . . . . . . . . . . . . . . . . . . . . 96,138 (22,067) 81,620Cash and cash equivalents at beginning of period . . . . . . . . . . . . . . . . . . . . . . . . . . . . . . . . . . . . . . . . . 124,956 147,023 65,403
Cash and cash equivalents at end of period . . . . . . . . . . . . . . . . . . . . . . . . . . . . . . . . . . . . . . . . . . . . . . . $ 221,094 $ 124,956 $ 147,023
* Net (loss) income from discontinued operations . . . . . . . . . . . . . . . . . . . . . . . . . . . . . . . . . . . . ($310) ($485) $ 24,282
Supplemental information on noncash investing and financing activities:
On June 7, 2006, the Company acquired Noortman Master Paintings B.V. for initial considerationof 1,946,849 shares of Sotheby’s Stock (see Note C)
53
See accompanying Notes to Consolidated Financial Statements

SOTHEBY’SCONSOLIDATED STATEMENTS OF CHANGES IN SHAREHOLDERS’ EQUITY
YEARS ENDED DECEMBER 31, 2006, 2005 AND 2004(Thousands of dollars)
ComprehensiveIncome (Loss)
CommonStock
AdditionalPaid-InCapital
RetainedEarnings
(AccumulatedDeficit)
DeferredCompensation
Expense
AccumulatedOther
ComprehensiveIncome (Loss)
Balance at January 1, 2004, as reported . . $6,173 $ 204,567 $(78,540) $ (1,507) $ (6,039)Adjustment, net of taxes (see Note M) . . 3,789 (3,789)
Balance at January 1, 2004, as restated . . 208,356* (82,329)*Comprehensive income:
Net income . . . . . . . . . . . . . . . . . . . . . . . . . $ 86,679 86,679Other comprehensive income—
foreign currency translation . . . . . . . 7,128 7,128
Comprehensive income . . . . . . . . . . . . . . . . . . $ 93,807
Stock options exercised . . . . . . . . . . . . . . . . . . 84 10,141Restricted stock shares issued . . . . . . . . . . . 117 15,286 (15,643)Restricted stock shares forfeited . . . . . . . . . (1) (162) 163Amortization of restricted stock
compensation expense . . . . . . . . . . . . . . . . . 6,646Shares issued to directors. . . . . . . . . . . . . . . . 1 292
Balance at December 31, 2004. . . . . . . . . . . 6,374 233,913 4,350 (10,341) 1,089
Comprehensive income:Net income . . . . . . . . . . . . . . . . . . . . . . . . . $ 61,602 61,602Other comprehensive loss—foreign
currency translation . . . . . . . . . . . . . . . (12,263) (12,263)
Comprehensive income . . . . . . . . . . . . . . . . . . $ 49,339
Repurchase of common stock. . . . . . . . . . . . (694) (176,422)Adjustment to deferred tax asset
valuation allowance relatedto stock option exercises . . . . . . . . . . . . . . 1,719
Stock options exercised . . . . . . . . . . . . . . . . . . 76 9,342Tax benefit associated with stock option
exercises. . . . . . . . . . . . . . . . . . . . . . . . . . . . . . . 1,069Restricted stock shares issued . . . . . . . . . . . 34 5,919 (5,956)Restricted shares withheld to satisfy
employee tax obligations . . . . . . . . . . . . . . (13) (2,190)Restricted stock shares forfeited . . . . . . . . . (1) (110)Amortization of restricted stock
compensation expense . . . . . . . . . . . . . . . . . 8,421Shares issued to directors. . . . . . . . . . . . . . . . 1 357
Balance at December 31, 2005. . . . . . . . . . . 5,777 73,597 65,952 (7,876) (11,174)
Comprehensive income:Net income . . . . . . . . . . . . . . . . . . . . . . . . . $107,049 107,049Other comprehensive loss—foreign
currency translation . . . . . . . . . . . . . . . 12,841 12,841
Comprehensive income . . . . . . . . . . . . . . . . . . $119,890
SFAS No. 158 transition adjustment (seeNotes B and N) . . . . . . . . . . . . . . . . . . . . . . . (63,555)
Repurchase of common stock. . . . . . . . . . . . (212)Issuance of common stock in acquisition
(see Note C) . . . . . . . . . . . . . . . . . . . . . . . . . . 195 41,180Stock options exercised . . . . . . . . . . . . . . . . . . 395 66,592Amortization of stock option expense . . . 1,389Elimination of deferred compensation
expense upon adoption of SFASNo. 123R (see Note M) . . . . . . . . . . . . . . . (7,876) 7,876
Restricted stock shares issued . . . . . . . . . . . 127 (127)Restricted shares withheld to satisfy
employee tax obligations . . . . . . . . . . . . . . (22) (5,852)Restricted stock shares forfeited . . . . . . . . . (1) 1Amortization of restricted stock
compensation expense . . . . . . . . . . . . . . . . . 13,226Tax benefit associated with stock option
exercises and the vesting of restrictedstock shares . . . . . . . . . . . . . . . . . . . . . . . . . . . 14,871
Shares issued to directors. . . . . . . . . . . . . . . . 2 258Cash dividends declared . . . . . . . . . . . . . . . . . (12,946)
Balance at December 31, 2006. . . . . . . . . . . $6,473 $ 197,047 $160,055 $ — $(61,888)
* As restated, see Note M.
54
See accompanying Notes to Consolidated Financial Statements

SOTHEBY’SNOTES TO CONSOLIDATED FINANCIAL STATEMENTS
Note A—Organization and Business
Sotheby’s (formerly Sotheby’s Holdings, Inc. and together with its subsidiaries, unless thecontext otherwise requires, the “Company”) is one of the world’s two largest auctioneers ofauthenticated fine art, antiques and decorative art, jewelry and collectibles. In addition toauctioneering, the Auction segment is engaged in a number of related activities, including thebrokering of private purchases and sales of fine art, jewelry and collectibles. The Company alsooperates as a dealer in works of art through its Dealer segment, conducts art-related financingactivities through its Finance segment and is engaged, to a lesser extent, in licensing activities. (SeeNote D for additional information related to the composition of the Company’s segments.)
(See Note U for information related to a recapitalization transaction consummated by theCompany in September 2005. See Note V for information related to the Company’s June 2006reincorporation in the State of Delaware.)
Note B—Summary of Significant Accounting Policies
Principles of Consolidation—The Consolidated Financial Statements include the accounts ofSotheby’s and its wholly-owned subsidiaries, as well as those of an entity for which the Company isthe primary beneficiary in accordance with Financial Accounting Standards Board (“FASB”)Interpretation (“FIN”) No. 46, “Consolidation of Variable Interest Entities” (“FIN 46”), as revised(see Note R). Intercompany transactions and balances have been eliminated. Equity investments inwhich the Company has significant influence over the investee but does not have control and is notthe primary beneficiary are accounted for using the equity method (see Note F).
Reclassifications—In the fourth quarter of 2006, due to the acquisition of Noortman MasterPaintings B.V. (or “NMP”) (see Note C) and the resulting increase in the Company’s Dealeractivities, certain activities which were previously managed and reported as part of the Auctionsegment were realigned with NMP and aggregated into a newly established Dealer segment underthe oversight of an executive committee responsible for managing the Company’s portfolio of Dealeractivities (see Note D). Accordingly, revenues related to such activities, which prior to thisForm 10-K were classified as Auction and Related Revenues, are now reported as Dealer Revenuesfor all periods presented.
Prior to 2005, amounts related to the investigation by the DOJ, other governmentalinvestigations and the related civil litigation were classified as Special Charges in the ConsolidatedIncome Statements. The majority of such expenses was incurred prior to the first quarter of 2005.Beginning in 2005, such amounts, relating principally to settlement administration costs and legalfees, are classified within General and Administrative Expenses for all periods presented as they areno longer significant to the Company’s results. For the year ended December 31, 2006, the Companyrecorded a net benefit of $0.8 million in General and Administrative Expenses associated withantitrust related matters, which includes a $2.4 million benefit for the recovery of settlementadministration costs related to the International Antitrust Litigation. For the years endedDecember 31, 2005 and 2004, antitrust related expenses were $1.1 million and $1.9 million,respectively. See Note Q for additional information on antitrust related matters.
Foreign Currency Translation—Assets and liabilities of foreign subsidiaries are translated atyear-end exchange rates. Income statement amounts are translated using weighted average monthlyexchange rates during the year. Gains and losses resulting from translating foreign currency financialstatements are recorded in Accumulated Other Comprehensive Income (Loss) until the subsidiary issold or liquidated.
Revenue Recognition (Auction and Related Revenues)—The principal components of Auctionand Related Revenues are: (1) auction commission revenues, (2) private sale commissions,(3) principal activities, (4) auction expense recoveries and (5) catalogue subscription revenues. Therevenue recognition policy for each of these is described below.
55

(1) Auction Commission Revenues—In its role as auctioneer, the Company functions as an agentaccepting property on consignment from its selling clients. The Company sells property as agent ofthe consignor, billing the buyer for property purchased, receiving payment from the buyer andremitting to the consignor the consignor’s portion of the buyer’s payment after deducting theCompany’s commissions, expenses and applicable taxes. The Company’s commissions include thoseearned from the buyer (“buyer’s premium revenue”) and those earned from the consignor (“seller’scommission revenue”), both of which are calculated as a percentage of the hammer price ofproperty sold at auction. Buyer’s premium and seller’s commission revenues are recognized at thetime of the auction sale (i.e., when the auctioneer’s hammer falls) and are recorded net ofcommissions owed to third parties. Commissions owed to third parties are typically the result of thecompetitive environment or as a result of risk sharing arrangements, whereby the Company reducesits financial exposure under certain auction guarantees in exchange for sharing in the auctioncommissions with a partner. Also, in certain situations, an auction guarantee partner will assist theCompany in valuing and marketing the property to be sold at auction.
(2) Private Sale Commissions—Private sale commissions are earned through the brokering of artand collectible purchases and sales and are recognized when an agreement with the purchaser isfinalized and the Company has fulfilled its obligations with respect to the transaction.
(3) Principal Activities—Auction segment principal activities consist mainly of income or lossrelated to auction guarantees and gains or losses related to the sale of Auction segment inventory,as well as any decreases in the carrying value of its inventory. Auction segment inventory consistsprincipally of objects obtained as a result of the failure of guaranteed property to sell at auction,and to a much lesser extent, objects obtained incidental to the auction process, primarily as a resultof defaults by purchasers after the consignor has been paid, and the honoring of purchasers’ claims.(See Note P for additional information on auction guarantees.)
From time to time in the ordinary course of business, the Company will guarantee to consignorsa minimum price in connection with the sale of property at auction. The Company must performunder its auction guarantee in the event the property does not sell, or sells for less than theminimum price, in which event the Company must fund the difference between the sale price atauction and the amount of the auction guarantee. If the property does not sell, the amount of theauction guarantee must be paid, but the Company has the right to recover such amount throughfuture sale of the property. In certain instances, the sale proceeds ultimately realized by theCompany exceed the amount of any prior losses recognized on the auction guarantee. Additionally,the Company is generally entitled to a share of the excess proceeds if the property under theauction guarantee sells above a minimum price. The Company’s share of any excess proceeds, aswell as any shortfall between the sale price at auction and the amount of the auction guarantee, arerecognized as principal income or loss in the period of the related auction sale.
Gains or losses on the sale of Auction inventory and loan collateral are recognized when thesale is completed, title to the property has passed to the purchaser and the Company has fulfilled itsobligations with respect to the transaction. The recognition of a loss is accelerated if and whenmanagement determines that an impairment of the inventory’s value has occurred.
(4) Auction Expense Recoveries—According to the terms of certain consignment agreements, theCompany has the right to recover certain direct costs of its auction services from the consignor.Such auction expense recoveries are recognized in the period of the related sale.
(5) Catalogue Subscription Revenues—Catalogue subscription revenues are earned from the saleof auction catalogues and are recognized ratably over the period of the related subscription.
Revenue Recognition (Finance Revenues)—Finance revenues consist principally of interestincome earned on Notes Receivable and Consignor Advances. Such interest income is recognizedwhen earned based on the amount of the outstanding loan and the length of time the loan wasoutstanding during the period. Where there is doubt regarding the ultimate collectibility of principalfor impaired loans, interest income is no longer recognized and any cash receipts subsequentlyreceived are thereafter directly applied to reduce the recorded investment in the loan.
56

Revenue Recognition (Dealer Revenues)—Dealer Revenues consist of revenues earned from thesale of Dealer segment inventory and the Company’s share of gains resulting from the sale ofproperty purchased by art dealers through unsecured loans from the Company. Dealer inventoryconsists principally of property held by NMP and objects purchased for investment purposes.
Revenues earned from the sale of Dealer inventory are recognized when title to the propertyhas passed to the purchaser and the Company has fulfilled its obligations with respect to thetransaction. The recognition of a loss is accelerated if and when management determines that animpairment of the inventory’s value has occurred.
The Company’s share of gains resulting from the sale of property purchased by art dealersthrough unsecured loans from the Company is recognized when the sale is completed and title tothe underlying property passes to the purchaser.
Sales, Use and Value Added Taxes—Sales, use and value added taxes assessed by governmentalauthorities that are both imposed on and concurrent with revenue-producing transactions betweenthe Company and its customers are reported on a net basis (i.e., no impact on revenues).
Direct Costs of Services—Direct Costs of Services consists largely of catalogue production anddistribution costs and sale marketing costs, which are expensed at the time of sale, as well ascorporate marketing expenses, which are expensed as incurred.
Stock-Based Compensation—In December 2004, the FASB issued Statement of FinancialAccounting Standards (“SFAS”) No. 123R, “Share-Based Payment.” SFAS No. 123R is a revision ofSFAS No. 123, as amended, “Accounting for Stock-Based Compensation,” and supersedesAccounting Principles Board Opinion (“APB”) No. 25, “Accounting for Stock Issued to Employees.”SFAS No. 123R eliminates the alternative to use the intrinsic value method of accounting that wasprovided in SFAS No. 123, which generally resulted in no compensation expense recorded in thefinancial statements for stock options awarded to employees with an exercise price equal to thestock’s fair value on the date of grant. SFAS No. 123R requires that the cost resulting from allshare-based payment transactions be recognized in the financial statements. SFAS No. 123Restablishes fair value as the measurement objective in accounting for share-based paymentarrangements and generally requires all companies to apply a fair-value-based measurement methodin accounting for all share-based payment transactions with employees.
On January 1, 2006, the Company adopted SFAS No. 123R using the modified prospectivemethod. Accordingly, prior period amounts have not been restated. Under this method, theCompany is required to record compensation expense for all share-based awards granted after thedate of adoption and for the unvested portion of previously granted awards that remainedoutstanding at the date of adoption. Prior to the adoption of SFAS No. 123R, the Company appliedAPB No. 25 to account for its stock-based awards. The Company historically has treated its stockoptions as having been granted at the stock’s fair market value on the date of grant. Consequently,under the provisions of APB No. 25, the Company did not recognize compensation expense for thecost of stock options issued to employees under its stock option plans. However, see “Review ofStock Option Granting Practices” under Note M for a discussion of a review conducted by outsidelegal counsel which resulted in, among other things, the use of new measurement dates for certainstock option grants.
The Company has elected to adopt the alternative transition method provided in SFAS No.123R-3, “Transition Election Related to Accounting for Tax Effects of Share-Based PaymentAwards,” for calculating the tax effects of stock-based compensation pursuant to SFAS No. 123R.The alternative transition method includes simplified methods to establish the beginning balance ofthe additional paid-in capital pool (the “APIC pool”) related to the tax effects of employee stock-based compensation, and to determine the subsequent impact on the APIC pool and ConsolidatedStatements of Cash Flows of the tax effects of employee stock-based compensation awards that areoutstanding upon adoption of SFAS No. 123R.
Stock-based compensation expense related to restricted stock shares issued pursuant to theAmended and Restated Restricted Stock Plan is determined based on the closing fair value of the
57

shares issued on the business day before the date of grant. Such compensation expense issubsequently amortized to Salaries and Related Costs over the corresponding graded vesting period.
Stock compensation expense is also recognized for the value of future restricted stock grantsthat are contractually guaranteed according to the terms of certain employment arrangements. Theguaranteed value of such future restricted stock grants is amortized over a period beginning on theeffective date of the respective employment arrangement and through the final legal vesting date ofthe grant.
(See Note M for additional information on the Company’s employee stock option plans and theRestricted Stock Plan.)
Earnings Per Share—Basic earnings per share is calculated by dividing net income by theweighted average number of outstanding shares of common stock. The weighted average number ofshares used for calculating basic and diluted earnings per share, which excludes shares issued ascontingent consideration in the acquisition of Noortman Master Paintings B.V. (see Note C), is asfollows:
Year Ended December 31 2006 2005 2004
(In millions)
Basic weighted average shares outstanding . . . . . . . . . . . . . . . . . . . . . . . . . . . . . . . 60.3 60.7 61.9Dilutive effect of stock options and unvested restricted stock . . . . . . . . . . . . 1.8 1.2 0.8
Diluted weighted average shares outstanding . . . . . . . . . . . . . . . . . . . . . . . . . . . . . 62.1 61.9 62.7
(See Note M for information on stock options and restricted stock outstanding.)
For the years ended December 31, 2006, 2005 and 2004, there were no reconciling itemsbetween the net income used in calculating basic and diluted earnings per share.
Comprehensive Income (Loss)—SFAS No. 130, “Reporting Comprehensive Income,” requirescertain transactions to be included as adjustments to net income (loss) in order to reportcomprehensive income (loss). The Company’s Comprehensive Income includes the Net Income forthe period, as well as Other Comprehensive Income (Loss), and is reported in the ConsolidatedStatements of Changes in Shareholders’ Equity. Other Comprehensive Income (Loss) includesprincipally gains and losses related to the Company’s defined benefit plans that arise during theperiod but are not recognized as components of net periodic pension cost pursuant to SFAS No. 87,“Employers’ Accounting for Pensions” (see Note N), as well as the change in the foreign currencytranslation adjustment during the period. Such amounts are included on a cumulative basis inAccumulated Other Comprehensive Income (Loss) in the Consolidated Balance Sheets. Amountsrecognized in Accumulated Other Comprehensive Income (Loss) related to the Company’s definedbenefit plans are adjusted as they are subsequently recognized as components of net periodicpension cost pursuant to the recognition and amortization provisions of SFAS No. 87.
Cash and Cash Equivalents—Cash equivalents are liquid investments comprised primarily ofbank and time deposits and other short-term investments with maturities of three months or lesswhen purchased. These investments are carried at cost, which approximates fair value.
Restricted Cash—Restricted Cash principally consists of amounts or deposits whose use isrestricted by either law or contract and primarily includes deposits supporting rental obligations inthe United States (the “U.S.”) and Europe and net auction proceeds owed to consignors in certainnon-U.S. jurisdictions.
Short-Term Investments—From time-to-time, the Company invests in money-market instrumentswith maturities of more than three months when purchased. These investments are classified asavailable-for-sale and are reflected in the Consolidated Balance Sheets at fair value, which is theequivalent of their par value.
Allowance for Doubtful Accounts—Management evaluates its allowance for doubtful accountsregularly and also evaluates specific accounts receivable balances when it becomes aware of asituation where a client may not be able to meet its financial obligations to the Company. Theamount of the required allowance is based on the facts available to management and is reevaluated
58

and adjusted as additional information is received. Allowances are also established for probablelosses inherent in the remainder of the accounts receivable balance.
Allowance for Credit Losses—Management evaluates its allowance for credit losses regularly andalso evaluates specific loans when it becomes aware of a situation where a borrower may not beable to repay the loan. The amount of the required allowance is based on the facts available tomanagement and is reevaluated and adjusted as additional information is received. Secured loansthat may not be collectible are analyzed based on the current estimated realizable value of thecollateral securing each loan, as well as the ability of the borrower to repay the loan. Reserves areestablished for secured loans that management believes are under-collateralized, and with respect towhich the under-collateralized amount may not be collectible from the borrower. Unsecured loansare analyzed based on management’s estimate of the current collectibility of each loan, taking intoaccount the ability of the borrower to repay the loan. A reserve is also established for probablelosses inherent in the remainder of the loan portfolio based on historical data related to loan write-offs. (See Note E.)
Inventory—Inventory consists of property held by the Dealer and Auction segments. Dealerinventory consists principally of property held by NMP and objects purchased for investmentpurposes. Auction inventory consists principally of objects obtained as a result of the failure ofguaranteed property to sell at auction, and to a lesser extent, objects obtained incidental to theauction process, as a result of defaults by purchasers after the consignor has been paid, and thehonoring of purchasers’ claims. In situations where guaranteed property fails to sell at auction, theCompany has the right to recover the minimum guaranteed amount through the future sale of theproperty (see Note P). Inventory is valued on a specific identification basis at the lower of cost ormanagement’s estimate of net realizable value.
Fixed Assets—Fixed Assets are stated at cost less accumulated depreciation and amortization.Depreciation is calculated using the straight-line method over the estimated useful lives of the assets.Leaseholds and leasehold improvements are amortized using the straight-line method over the lesserof the life of the lease or the estimated useful life of the improvement. Computer software consistsof the capitalized cost of purchased computer software, as well as direct external and internalcomputer software development costs incurred in the acquisition or development of software forinternal use. These costs are amortized on a straight-line basis over the estimated useful life of thesoftware. (See Note G.)
Goodwill—Goodwill represents the excess of the purchase price paid over the fair value of netassets acquired in business acquisitions. Goodwill is not amortized, but it is tested for impairment atthe reporting unit level annually (October 31 for the Company) and between annual tests ifindicators of potential impairment exist. An impairment loss is recognized for any amount by whichthe carrying amount of a reporting unit’s goodwill exceeds its fair value. Fair values are establishedusing discounted cash flows. (See Note H.)
Intangible Assets—Intangible assets are amortized over their estimated useful lives unless suchlives are deemed indefinite. If indicators of potential impairment exist, amortizable intangible assetsare tested for impairment based on undiscounted cash flows and, if impaired, written down to fairvalue based on either discounted cash flows or appraised values. Intangible assets with indefinitelives are tested annually for impairment (October 31 for the Company) and written down to fairvalue as required. (See Note I.)
Impairment of Long-Lived Assets—Long-lived assets are reviewed for impairment wheneverevents or changes in circumstances indicate that the carrying amount of the asset may not berecoverable. In such situations, long-lived assets are considered impaired when estimated future cashflows (undiscounted and without interest charges) resulting from the use of the asset and its eventualdisposition are less than the asset’s carrying amount. In such situations, the asset is written down tothe present value of the estimated future cash flows.
Valuation Allowance for Deferred Tax Assets—The Company records a valuation allowance toreduce its deferred tax assets to the amount that is more likely than not to be realized. In assessingthe need for the valuation allowance, management considers, among other things, its projections offuture taxable income and ongoing prudent and feasible tax planning strategies. (See Note K.)
59

Auction Guarantees—The liability related to the Company’s outstanding auction guarantees isrecorded within Accounts Payable and Accrued Liabilities in the Consolidated Balance Sheets at fairvalue, which is estimated based on an analysis of historical loss experience related to auctionguarantees. (See Note P.)
Defined Benefit Pension Plan—The Company sponsors defined benefit pension plans for certainof its employees. As of December 31, 2006, the Company adopted the recognition and disclosureprovisions of SFAS No. 158, “Employers’ Accounting for Defined Benefit Pension and OtherPostretirement Plans—an amendment of FASB Statements No. 87, 88, 106, and 132(R).” See NoteN for detailed information on the adoption of SFAS No. 158.
Asset Retirement Obligations—In March 2005, the FASB issued FIN No. 47, “Accounting forConditional Asset Retirement Obligations—an interpretation of FASB Statement No. 143.” FINNo. 47 requires an entity to recognize a liability for the fair value of a conditional asset retirementobligation if the fair value can be reasonably estimated. FIN No. 47 states that a conditional assetretirement obligation is a legal obligation to perform an asset retirement activity in which the timingor method of settlement are conditional upon a future event that may or may not be within thecontrol of the entity.
The Company adopted FIN No. 47 effective December 2005 and accordingly recorded an after-tax charge of approximately $1.1 million ($1.6 million, pre-tax), or $0.02 per diluted share, as acumulative effect of a change in accounting principle in the Consolidated Income Statement for theyear ended December 31, 2005. This charge relates primarily to those lease agreements that requirethe Company to restore the underlying facilities to their original condition at the end of the leases.The Company was uncertain of the timing of payment for these asset retirement obligations;therefore a liability was not previously recognized in the financial statements under generallyaccepted accounting principles. On a prospective basis, this accounting change requires recognitionof these costs ratably over the lease term. The adoption of FIN No. 47 initially resulted in a non-cash addition to Fixed Assets of $1 million with a corresponding increase in long-term liabilities. Asof December 31, 2006 and 2005, assets recorded on the Consolidated Balance Sheet related to FINNo. 47 were $0.2 million, consisting of gross assets of $1 million less accumulated depreciation of$0.8 million, and the asset retirement obligation as of those dates was $1.8 million. In future periods,when cash is paid upon the settlement of the asset retirement obligation, the payments will beclassified as a component of operating cash flow in the Consolidated Statements of Cash Flows. Ifthe provisions of FIN No. 47 would have been applied during the periods prior to adoption, theasset retirement obligation as of December 31, 2004 would have been $1.7 million. For the yearended December 31, 2006, changes in the Company’s asset retirement obligations were as follows (inthousands of dollars):
Balance as of January 1, 2006 . . . . . . . . . . . . . . . . . . . . . . . . . . . . . . . . . . . . . $1,864Liabilities incurred . . . . . . . . . . . . . . . . . . . . . . . . . . . . . . . . . . . . . . . . . . . . . . . . —Liabilities settled . . . . . . . . . . . . . . . . . . . . . . . . . . . . . . . . . . . . . . . . . . . . . . . . . . (140)Accretion expense . . . . . . . . . . . . . . . . . . . . . . . . . . . . . . . . . . . . . . . . . . . . . . . . . 90Foreign currency exchange rate changes. . . . . . . . . . . . . . . . . . . . . . . . . . . 35
Balance as of December 31, 2006 . . . . . . . . . . . . . . . . . . . . . . . . . . . . . . . . . $1,849
Financial Instruments—The Company’s financial instruments include Cash and Cash Equivalents,Restricted Cash, Short-Term Investments, Notes Receivable and Consignor Advances (see Note E),Credit Facility Borrowings, Long-Term Debt, the liability for the Discount Certificates issued inconnection with the settlement of certain civil litigation related to the investigation by the UnitedStates Department of Justice (the “DOJ”) and the note payable to Arcimboldo S.A.(“Arcimboldo”).
The carrying amounts of Cash and Cash Equivalents, Restricted Cash, Short-Term Investments,Notes Receivable and Consignor Advances (see Note E) and Credit Facility Borrowings (seeNote J) do not materially differ from their estimated fair values due to their nature and the variableinterest rates associated with each of these financial instruments.
60

The fair value of the Company’s long-term debt was approximately $98 million as ofDecember 31, 2006. This amount is based on quoted market prices. (See Note J.)
The carrying amounts of the Discount Certificate liability (see Note Q) and the note payable toArcimboldo (see Note C) approximate their fair values.
Derivative Financial Instruments—The Company utilizes forward exchange contracts to manageexposures related to foreign currency risks, which primarily arise from short-term foreign currencydenominated intercompany balances and, to a lesser extent, foreign currency denominated clientreceivable and payable balances as well as foreign currency denominated future guaranteeobligations. Generally, exposures related to such foreign currency risks are centrally managed by theCompany’s global treasury function. The Company’s objective for holding derivative instruments isto minimize foreign currency risks using the most effective methods to eliminate or reduce theimpacts of these exposures.
The forward exchange contracts entered into by the Company are used mostly as cash flowhedges of the Company’s exposure to short-term foreign currency denominated intercompanybalances and, to a lesser extent, foreign currency denominated client receivable and payable balancesas well as foreign currency denominated future guarantee obligations. Such forward exchangecontracts are typically short-term with settlement dates less than one year from their inception.These contracts are not designated as hedging instruments under SFAS No. 133, “Accounting forDerivative Instruments and Hedging Activities,” as amended, and are recorded in the ConsolidatedBalance Sheets at fair value, which is based on referenced market rates. Changes in the fair value ofthe Company’s forward exchange contracts are recognized currently in earnings.
At December 31, 2006, the Company had $140.8 million of notional value forward exchangecontracts outstanding. Notional amounts do not quantify risk or represent assets or liabilities of theCompany, but are used in the calculation of cash settlements under such contracts. The Company isexposed to credit-related losses in the event of nonperformance by the two counterparties to itsforward exchange contracts, but the Company does not expect any counterparties to fail to meettheir obligations given their high credit ratings.
As of December 31, 2006, the Consolidated Balance Sheets included a liability of $1.1 millionrecorded within Accounts Payable and Accrued Liabilities reflecting the fair value of the Company’soutstanding forward exchange contracts on that date. As of December 31, 2005, the ConsolidatedBalance Sheets included an asset of $0.1 million recorded within Prepaid Expenses and OtherCurrent Assets reflecting the fair value of the Company’s outstanding forward exchange contracts onthat date.
Use of Estimates—The preparation of consolidated financial statements in conformity withaccounting principles generally accepted in the U.S. requires management to make estimates andassumptions that affect the reported amounts of assets and liabilities and disclosure of contingentassets and liabilities at the date of the financial statements and the reported amounts of revenuesand expenses during the reporting period. Actual results could differ materially from those estimatesand could change in the short-term.
Staff Accounting Bulletin No. 108—In September 2006, the Securities and Exchange Commission(the “SEC”) issued Staff Accounting Bulletin (“SAB”) No. 108, “Considering the Effects of PriorYear Misstatements when Quantifying Misstatements in Current Year Financial Statements.” SABNo. 108 requires that registrants quantify errors using both a balance sheet and income statementapproach and evaluate whether either approach results in a misstated amount that, when all relevantquantitative and qualitative factors are considered, is material. The Company adopted SAB No. 108in the fourth quarter of 2006.
Recently Issued Accounting Standards—In July, 2006, the FASB issued FIN No. 48, “Accountingfor Uncertainty in Income Taxes—an interpretation of FASB Statement No. 109,” which requiresthat realization of an uncertain income tax position must be “more likely than not” (i.e., greaterthan 50% likelihood of receiving a benefit) before it can be recognized in the financial statements.Further, this interpretation prescribes the benefit to be recorded in the financial statements as theamount most likely to be realized assuming a review by tax authorities having all relevant
61

information and applying current conventions; clarifies the financial statement classification of tax-related penalties and interest and sets forth new disclosures regarding unrecognized tax benefits. FINNo. 48 is effective for the Company in the first quarter of 2007. Management is evaluating theCompany’s tax positions and assessing the impact of adopting FIN No. 48.
In September 2006, the FASB issued SFAS No. 157, “Fair Value Measurements.” ThisStatement defines fair value, establishes a framework for measuring fair value, and expandsdisclosures about fair value measurements. SFAS No. 157 applies under other accountingpronouncements that require or permit fair value measurements. The provisions of SFAS No. 157are effective for financial statements issued by the Company starting in 2008. Management isevaluating the impact of adopting SFAS No. 157, if any, on the Company’s financial statements.
In February 2007, the FASB issued SFAS No. 159, “The Fair Value Option for Financial Assetsand Financial Liabilities—Including an amendment of FASB Statement No. 115.” SFAS No. 159permits entities to choose to measure many financial instruments and certain other items at fairvalue. Unrealized gains and losses on items for which the fair value option has been elected will berecognized in earnings at each subsequent reporting date. SFAS No. 159 is effective for theCompany as of January 1, 2008. Management is evaluating the impact of adopting SFAS No. 159, ifany, on the Company’s financial statements.
Note C—Acquisition
On June 7, 2006, the Company and Arcimboldo S.A. (“Arcimboldo”), a private limited liabilitycompany incorporated under the laws of Luxembourg, entered into a sale and purchase agreement(the “Purchase Agreement”), pursuant to which the Company acquired all the issued andoutstanding shares of capital stock of Noortman Master Paintings B.V., a company incorporatedunder the laws of the Netherlands and a pre-eminent art dealer. The acquisition of NMP providesthe Company with the opportunity to expand its dealer activities. NMP is based in Maastricht, theNetherlands. Robert C. Noortman, who was the Managing Director of NMP and sole shareholder ofArcimboldo and also guaranteed the obligations of Arcimboldo under the Purchase Agreement, diedunexpectedly on January 14, 2007. Following Mr. Noortman’s death, his guarantee under thePurchase Agreement remains binding on his estate. NMP is continuing under the leadership of Mr.Noortman’s son, William. NMP’s results are included in the Company’s Consolidated IncomeStatements beginning on June 1, 2006.
Pursuant to the Purchase Agreement, the Company paid initial consideration (the “InitialConsideration”) in the form of 1,946,849 shares of Sotheby’s Class A Common Stock (“Sotheby’sShares”), which had a fair value of approximately $41.4 million. The fair value of the Sotheby’sShares issued as Initial Consideration is based on the actual number of shares issued using theclosing price of Sotheby’s Shares on the New York Stock Exchange of $25.30 per share on June 6,2006 reduced by $7.9 million to reflect the fair value of certain restrictions on the future transfer ofthe Initial Consideration, as discussed in more detail below. The fair value of these restrictions wasdetermined by an independent valuation expert. In addition to the Initial Consideration, theCompany acquired NMP subject to approximately $25.6 million of indebtedness, consisting of a €12.5million ($16.1 million) long-term non-interest bearing note payable to Arcimboldo over a period ofthree years (as discussed in more detail below) and $9.5 million of bank debt that was repaid uponthe closing of the transaction, as well as the settlement of an $11.7 million payable to Sotheby’s. Asof the date of acquisition, the present value of the note payable to Arcimboldo was approximately€11.3 million ($14.6 million). The €1.2 million ($1.5 million) discount on the note payable is beingamortized to interest expense over the three-year term. The first payment of €2.1 million ($2.6million) under the note payable was made on July 26, 2006. The remaining payments under the notepayable are due according to the following schedule: €2 million ($2.7 million) on June 7, 2007,€4.2 million ($5.5 million) on June 7, 2008 and €4.2 million ($5.5 million) on June 7, 2009. As ofDecember 31, 2006, the carrying value of the note payable was $12.6 million. The current portion ofthe note payable ($2.1 million) is recorded in the December 31, 2006 Consolidated Balance Sheetwithin “Accounts Payable and Accrued Liabilities.” The non-current portion of the note payable
62

($10.5 million) is recorded in the December 31, 2006 Consolidated Balance Sheet within “OtherLiabilities.”
If NMP fails to achieve a minimum level of financial performance during the five yearsfollowing the closing of the transaction, up to 20% of the Initial Consideration will be transferredback to the Company.
An additional 486,712 Sotheby’s Shares (the “Additional Consideration”) have been issued andplaced in escrow, to be released only if NMP achieves certain targeted performance criteria specifiedin the Purchase Agreement during the five years following the closing of the transaction and if NMPachieves certain service criteria. Based on the closing price of Sotheby’s Shares on the New YorkStock Exchange of $38.99 per share on February 20, 2007, the Additional Consideration has a fairvalue of approximately $19 million. The Additional Consideration is being held in escrow pursuantto an escrow agreement dated June 7, 2006, among the parties to the Purchase Agreement andLaSalle Bank N.A.
The Purchase Agreement also provides for certain restrictions on the transfer of Sotheby’sShares received by Arcimboldo, as discussed above. Subject to certain limited exclusions,Arcimboldo may not transfer any of the Sotheby’s Shares that it received as Initial Consideration fora period of two years after the closing, and may not transfer 20% of the Sotheby’s Shares that itreceived as Initial Consideration for a period of five years after the closing.
The Company, Arcimboldo and Mr. Noortman also made customary warranties and covenantsin the Purchase Agreement, including certain post-closing business covenants of the Company andcertain non-competition and non-solicitation covenants of Arcimboldo and Mr. Noortman for aperiod of five years following closing. Mr. Noortman also entered into a seven-year employmentagreement with NMP, which ceased upon Mr. Noortman’s death.
In addition, the Company also has in place a key man life insurance policy of $20 millioncovering Mr. Noortman. The Company has filed the necessary claim forms to establish its rightsunder this policy.
In the fourth quarter of 2006, the Company substantially completed its valuation of the NMPassets acquired (including intangible assets) and liabilities assumed and will finalize the valuation inthe first quarter of 2007. The fair value of the art-related assets acquired was estimated by a team ofqualified art experts. The fair value of all other NMP assets and liabilities were estimated utilizing anumber of techniques, including independent appraisals. The table below, which is presented inthousands of dollars, summarizes the allocation of the purchase price to the NMP assets acquiredand liabilities assumed. The initial allocation provided in the Company’s June 30, 2006 Form 10-Qhas been updated to reallocate amounts from Goodwill to Intangible Assets ($14.2 million),Inventory ($9.2 million), Fixed Assets ($2.7 million) and Other Long-Term Assets ($0.4 million)based on the completed appraisals. Additionally, in the third and fourth quarters of 2006, DeferredTax Liabilities of $1.5 million and $5.9 million were recorded to reflect the impact of taxabletemporary differences between the book and tax bases of certain acquired assets and liabilities,resulting in a corresponding increase to Goodwill. The Goodwill related to NMP is not taxdeductible.
63

Purchase price:
Fair value of Initial Consideration . . . . . . . . . . . . . . . . . . . . . . $ 41,374Settlement of payable due to Sotheby’s. . . . . . . . . . . . . . . . . 11,745 *Direct acquisition costs . . . . . . . . . . . . . . . . . . . . . . . . . . . . . . . . . 1,527
Total purchase price . . . . . . . . . . . . . . . . . . . . . . . . . . . . . . . $ 54,646
Allocation of purchase price:Accounts receivable . . . . . . . . . . . . . . . . . . . . . . . . . . . . . . . . . . . . $ 13,424Inventory . . . . . . . . . . . . . . . . . . . . . . . . . . . . . . . . . . . . . . . . . . . . . . . 56,412Fixed assets. . . . . . . . . . . . . . . . . . . . . . . . . . . . . . . . . . . . . . . . . . . . . 3,330Prepaid expenses and other current assets . . . . . . . . . . . . . . 293Other long-term assets. . . . . . . . . . . . . . . . . . . . . . . . . . . . . . . . . . 518Goodwill. . . . . . . . . . . . . . . . . . . . . . . . . . . . . . . . . . . . . . . . . . . . . . . . 20,583 **Intangible assets . . . . . . . . . . . . . . . . . . . . . . . . . . . . . . . . . . . . . . . . 14,162 ***Accounts payable and accrued liabilities . . . . . . . . . . . . . . . . (20,395)Other current liabilities . . . . . . . . . . . . . . . . . . . . . . . . . . . . . . . . . (1,309)Note payable to Arcimboldo . . . . . . . . . . . . . . . . . . . . . . . . . . . (14,590)Bank debt . . . . . . . . . . . . . . . . . . . . . . . . . . . . . . . . . . . . . . . . . . . . . . (9,531)Deferred tax liabilities . . . . . . . . . . . . . . . . . . . . . . . . . . . . . . . . . . (7,419)Other non-current liabilities . . . . . . . . . . . . . . . . . . . . . . . . . . . . (832)
Total purchase price . . . . . . . . . . . . . . . . . . . . . . . . . . . . . . . $ 54,646
* Reflects amounts due to Sotheby’s for property purchased by NMP at auction prior to thedate of acquisition.
** As a result of Mr. Noortman’s death in January 2007, Goodwill related to NMP is beingtested for impairment. The Company anticipates that it will record an impairment charge inthe first quarter of 2007 to reduce the carrying value of NMP’s Goodwill. The amount ofsuch a charge could potentially be material depending on the outcome of the Company’sassessment. See Note H for additional information related to Goodwill.
*** The amount allocated to Intangible Assets relates to customer relationships ($11.1 million),trade name ($2.5 million) and a non-compete agreement ($0.6 million). As a result of Mr.Noortman’s death in January 2007, Intangible Assets related to NMP are being tested forimpairment. The Company anticipates that it will record an impairment charge in the firstquarter of 2007 to reduce the carrying value of NMP’s Intangible Assets. The amount ofsuch a charge could potentially be material depending on the outcome of the Company’sassessment. See Note I for additional information related to Intangible Assets.
Note D—Segment Reporting
The Company’s continuing operations are organized under three business segments—Auction,Finance and Dealer. The Company’s discontinued real estate brokerage business, which almostentirely comprised its former Real Estate segment, is not included in this presentation. In the secondquarter of 2006, management decided to continue to operate the Company’s real estate brokeragebusiness in Australia, which had previously been reported in discontinued operations since the fourthquarter of 2004. Consequently, beginning in the second quarter of 2006, results for this business,which are not material to the Company’s Consolidated Income Statements, have been reclassifiedinto continuing operations and are included in this presentation in All Other for all periodspresented. (See Note T for further information on discontinued operations.)
The Company’s segments are strategic business units that offer different services. They aremanaged separately because each business requires different resources and strategies. TheCompany’s chief operating decision making group, which is comprised of the Chief ExecutiveOfficer, the Chief Financial Officer and the senior executives of each segment, regularly evaluatesfinancial information about each segment in deciding how to allocate resources and in assessing
64

performance. The performance of each segment is measured based on its profit or loss fromoperations before taxes and excluding the unallocated items highlighted below in the reconciliationof segment income (loss) to income (loss) from continuing operations before taxes.
The Auction segment is an aggregation of Auction operations in North America, Europe andAsia as they have similar economic characteristics and they are similar in service, customers and theway in which the services are provided. The Auction segment conducts auctions of fine arts,decorative arts, jewelry and collectibles in which the Company generally functions as an agentaccepting property on consignment from its selling clients. In addition to auctioneering, the Auctionsegment is engaged in a number of related activities including the brokering of private purchasesand sales of art, jewelry and other collectibles. The Finance segment provides art-related financinggenerally secured by works of art that the Company either has in its possession or that the Companypermits the borrower to possess (see Note E). All Other primarily includes amounts related to theCompany’s licensing activities and other ancillary businesses.
In the fourth quarter of 2006, due to the acquisition of NMP (see Note C) and the resultingincrease in the Company’s Dealer activities, certain activities which were previously managed as partof the Auction segment were realigned with NMP and aggregated into a newly established Dealersegment under the oversight of an executive committee responsible for managing the Company’sportfolio of Dealer activities. Such activities include:
• The investment in and resale of art and other collectibles directly by the Company.
• The investment in art through unsecured loans made by the Company to unaffiliated artdealers (see Note E).
• The activities of certain equity investees including Acquavella Modern Art (see Note F).
• The purchase and resale of art through an art dealer whose results are required to beconsolidated with the Company’s results under generally accepted accounting principles. TheCompany has no equity investment in this entity. (See Note R.)
In periods prior to the fourth quarter of 2006, NMP’s results were not material and werereported as part of All Other. All prior period segment information has been revised forcomparability to reflect this change.
The accounting policies of the segments are the same as those described in the summary ofsignificant accounting policies (see Note B). Auction and Dealer segment revenues are attributed togeographic areas based on the location of the actual sale. Finance segment revenues are attributedto geographic areas based on the location of the entity that originated the loan.
65
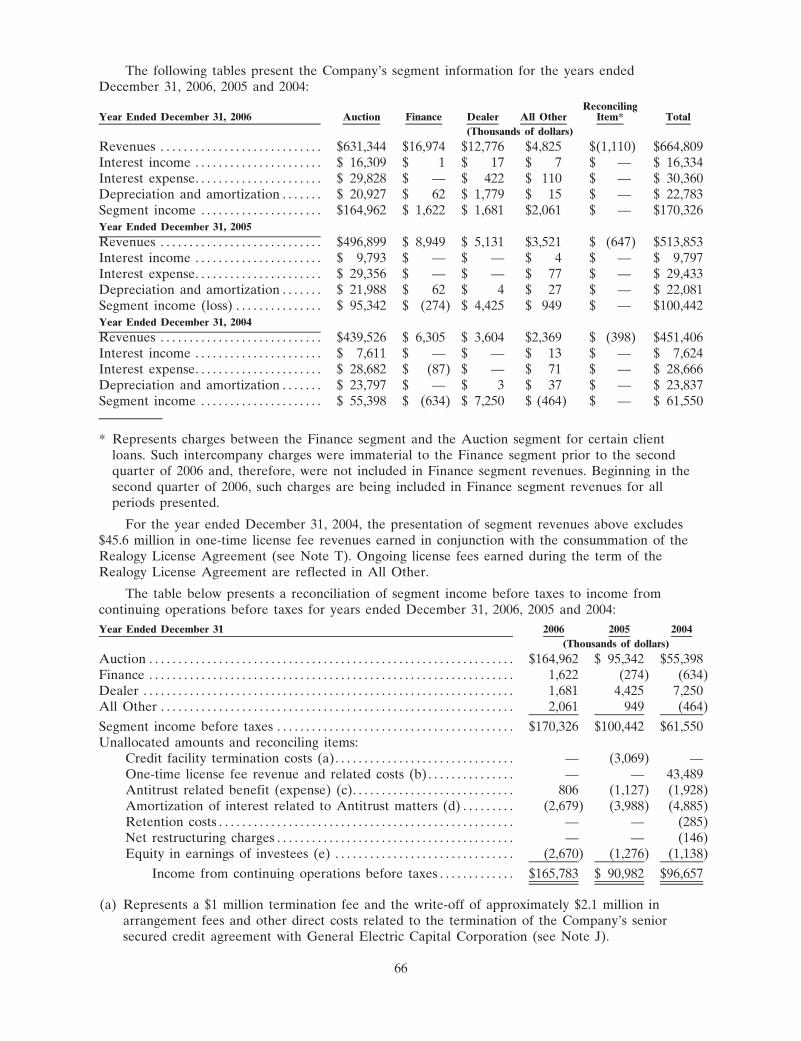
The following tables present the Company’s segment information for the years endedDecember 31, 2006, 2005 and 2004:
Year Ended December 31, 2006 Auction Finance Dealer All OtherReconciling
Item* Total
(Thousands of dollars)
Revenues . . . . . . . . . . . . . . . . . . . . . . . . . . . . $631,344 $16,974 $12,776 $4,825 $(1,110) $664,809Interest income . . . . . . . . . . . . . . . . . . . . . . $ 16,309 $ 1 $ 17 $ 7 $ — $ 16,334Interest expense. . . . . . . . . . . . . . . . . . . . . . $ 29,828 $ — $ 422 $ 110 $ — $ 30,360Depreciation and amortization . . . . . . . $ 20,927 $ 62 $ 1,779 $ 15 $ — $ 22,783Segment income . . . . . . . . . . . . . . . . . . . . . $164,962 $ 1,622 $ 1,681 $2,061 $ — $170,326Year Ended December 31, 2005
Revenues . . . . . . . . . . . . . . . . . . . . . . . . . . . . $496,899 $ 8,949 $ 5,131 $3,521 $ (647) $513,853Interest income . . . . . . . . . . . . . . . . . . . . . . $ 9,793 $ — $ — $ 4 $ — $ 9,797Interest expense. . . . . . . . . . . . . . . . . . . . . . $ 29,356 $ — $ — $ 77 $ — $ 29,433Depreciation and amortization . . . . . . . $ 21,988 $ 62 $ 4 $ 27 $ — $ 22,081Segment income (loss) . . . . . . . . . . . . . . . $ 95,342 $ (274) $ 4,425 $ 949 $ — $100,442Year Ended December 31, 2004
Revenues . . . . . . . . . . . . . . . . . . . . . . . . . . . . $439,526 $ 6,305 $ 3,604 $2,369 $ (398) $451,406Interest income . . . . . . . . . . . . . . . . . . . . . . $ 7,611 $ — $ — $ 13 $ — $ 7,624Interest expense. . . . . . . . . . . . . . . . . . . . . . $ 28,682 $ (87) $ — $ 71 $ — $ 28,666Depreciation and amortization . . . . . . . $ 23,797 $ — $ 3 $ 37 $ — $ 23,837Segment income . . . . . . . . . . . . . . . . . . . . . $ 55,398 $ (634) $ 7,250 $ (464) $ — $ 61,550
* Represents charges between the Finance segment and the Auction segment for certain clientloans. Such intercompany charges were immaterial to the Finance segment prior to the secondquarter of 2006 and, therefore, were not included in Finance segment revenues. Beginning in thesecond quarter of 2006, such charges are being included in Finance segment revenues for allperiods presented.
For the year ended December 31, 2004, the presentation of segment revenues above excludes$45.6 million in one-time license fee revenues earned in conjunction with the consummation of theRealogy License Agreement (see Note T). Ongoing license fees earned during the term of theRealogy License Agreement are reflected in All Other.
The table below presents a reconciliation of segment income before taxes to income fromcontinuing operations before taxes for years ended December 31, 2006, 2005 and 2004:
Year Ended December 31 2006 2005 2004
(Thousands of dollars)
Auction . . . . . . . . . . . . . . . . . . . . . . . . . . . . . . . . . . . . . . . . . . . . . . . . . . . . . . . . . . . . . . . $164,962 $ 95,342 $55,398Finance . . . . . . . . . . . . . . . . . . . . . . . . . . . . . . . . . . . . . . . . . . . . . . . . . . . . . . . . . . . . . . . 1,622 (274) (634)Dealer . . . . . . . . . . . . . . . . . . . . . . . . . . . . . . . . . . . . . . . . . . . . . . . . . . . . . . . . . . . . . . . . 1,681 4,425 7,250All Other . . . . . . . . . . . . . . . . . . . . . . . . . . . . . . . . . . . . . . . . . . . . . . . . . . . . . . . . . . . . . 2,061 949 (464)
Segment income before taxes . . . . . . . . . . . . . . . . . . . . . . . . . . . . . . . . . . . . . . . . . $170,326 $100,442 $61,550Unallocated amounts and reconciling items:
Credit facility termination costs (a). . . . . . . . . . . . . . . . . . . . . . . . . . . . . . . — (3,069) —One-time license fee revenue and related costs (b) . . . . . . . . . . . . . . . — — 43,489Antitrust related benefit (expense) (c). . . . . . . . . . . . . . . . . . . . . . . . . . . . 806 (1,127) (1,928)Amortization of interest related to Antitrust matters (d) . . . . . . . . . (2,679) (3,988) (4,885)Retention costs . . . . . . . . . . . . . . . . . . . . . . . . . . . . . . . . . . . . . . . . . . . . . . . . . . . — — (285)Net restructuring charges . . . . . . . . . . . . . . . . . . . . . . . . . . . . . . . . . . . . . . . . . — — (146)Equity in earnings of investees (e) . . . . . . . . . . . . . . . . . . . . . . . . . . . . . . . (2,670) (1,276) (1,138)
Income from continuing operations before taxes . . . . . . . . . . . . . $165,783 $ 90,982 $96,657
(a) Represents a $1 million termination fee and the write-off of approximately $2.1 million inarrangement fees and other direct costs related to the termination of the Company’s seniorsecured credit agreement with General Electric Capital Corporation (see Note J).
66

(b) Represents one-time license fee revenues earned in conjunction with the consummation of theRealogy License Agreement (approximately $45.6 million) and the related transaction costs ($2.2million), which are not allocated to the Company’s operating segments (see Note T).
(c) Represents amounts related to antitrust matters consisting principally of settlementadministration costs and legal fees, which are classified within General and AdministrativeExpenses. For the year ended December 31, 2006, the amount reflected in this caption includesa $2.4 million benefit for the recovery of settlement administration expenses related to theInternational Antitrust Litigation (see Note Q).
(d) Represents the amortization of interest charges related to the DOJ antitrust fine and certainrelated civil litigation (see Note Q).
(e) Represents the Company’s pre-tax share of earnings related to its equity investees. Suchamounts are included in the table above in income before taxes for the Dealer segment, but arepresented net of taxes below Income from Continuing Operations Before Taxes in theConsolidated Income Statements.
The table below presents other reconciling items related to the Company’s segment informationfor the years ended December 31, 2006, 2005 and 2004:
Year Ended December 31, 2006Segment
TotalsReconciling
ItemsConsolidated
Total
(Thousands of dollars)
Interest income . . . . . . . . . . . . . . . . . . . . . . . . . . . . . . . . . . . . . . . . . . $16,334 $(10,443)(a) $ 5,891Interest expense. . . . . . . . . . . . . . . . . . . . . . . . . . . . . . . . . . . . . . . . . . $30,360 $ 2,679 (b) $33,039Year Ended December 31, 2005
Interest income . . . . . . . . . . . . . . . . . . . . . . . . . . . . . . . . . . . . . . . . . . $ 9,797 $ (4,114)(a) $ 5,683Interest expense. . . . . . . . . . . . . . . . . . . . . . . . . . . . . . . . . . . . . . . . . . $29,433 $ 3,988 (b) $33,421Year Ended December 31, 2004
Interest income . . . . . . . . . . . . . . . . . . . . . . . . . . . . . . . . . . . . . . . . . . $ 7,624 $ (4,340)(a) $ 3,284Interest expense. . . . . . . . . . . . . . . . . . . . . . . . . . . . . . . . . . . . . . . . . . $28,666 $ 4,885 (b) $33,551
(a) Represents the elimination of interest charged by Auction to Finance for funding Finance’s loanportfolio.
(b) Represents the amortization of interest charges related to the DOJ antitrust fine and certainrelated civil litigation (see Note Q).
67

The table below presents information concerning revenues from continuing operations forgeographical areas for the years ended December 31, 2006, 2005 and 2004:
Year Ended December 31 2006 2005 2004
(Thousands of dollars)
United States:Auction . . . . . . . . . . . . . . . . . . . . . . . . . . . . . . . . . . . . . . . . . . . . . . . . $294,042 $201,430 $190,641Finance . . . . . . . . . . . . . . . . . . . . . . . . . . . . . . . . . . . . . . . . . . . . . . . . 8,211 4,650 3,953Dealer . . . . . . . . . . . . . . . . . . . . . . . . . . . . . . . . . . . . . . . . . . . . . . . . . 7,118 5,131 3,604All Other . . . . . . . . . . . . . . . . . . . . . . . . . . . . . . . . . . . . . . . . . . . . . . 3,124 2,140 878
Sub-total. . . . . . . . . . . . . . . . . . . . . . . . . . . . . . . . . . . . . . . . . . . 312,495 213,351 199,076
United Kingdom:Auction . . . . . . . . . . . . . . . . . . . . . . . . . . . . . . . . . . . . . . . . . . . . . . . . 222,088 189,606 167,379Finance . . . . . . . . . . . . . . . . . . . . . . . . . . . . . . . . . . . . . . . . . . . . . . . . 8,505 4,113 2,191All Other . . . . . . . . . . . . . . . . . . . . . . . . . . . . . . . . . . . . . . . . . . . . . . 869 541 700
Sub-total. . . . . . . . . . . . . . . . . . . . . . . . . . . . . . . . . . . . . . . . . . . 231,462 194,260 170,270
China:Auction . . . . . . . . . . . . . . . . . . . . . . . . . . . . . . . . . . . . . . . . . . . . . . . . 40,268 32,793 23,306Finance . . . . . . . . . . . . . . . . . . . . . . . . . . . . . . . . . . . . . . . . . . . . . . . . 230 98 39
Sub-total. . . . . . . . . . . . . . . . . . . . . . . . . . . . . . . . . . . . . . . . . . . 40,498 32,891 23,345
Other Countries:Auction (a) . . . . . . . . . . . . . . . . . . . . . . . . . . . . . . . . . . . . . . . . . . . . 74,946 73,070 58,200Finance . . . . . . . . . . . . . . . . . . . . . . . . . . . . . . . . . . . . . . . . . . . . . . . . 28 88 122Dealer . . . . . . . . . . . . . . . . . . . . . . . . . . . . . . . . . . . . . . . . . . . . . . . . . 5,658 — —All Other . . . . . . . . . . . . . . . . . . . . . . . . . . . . . . . . . . . . . . . . . . . . . . 832 840 791
Sub-total. . . . . . . . . . . . . . . . . . . . . . . . . . . . . . . . . . . . . . . . . . . 81,464 73,998 59,113
One-time License fee revenue (b) . . . . . . . . . . . . . . . . . . . . . . . . . . — — 45,650
Reconciling item:Intercompany revenue earned by Finance from
Auction . . . . . . . . . . . . . . . . . . . . . . . . . . . . . . . . . . . . . . . . . . . . . . (1,110) (647) (398)
Total . . . . . . . . . . . . . . . . . . . . . . . . . . . . . . . . . . . . . . . . . . . . . . $664,809 $513,853 $497,056
(a) No other individual country exceeds 5% of total revenues for any of the periods presented.
(b) Represents one-time license fee revenues earned in conjunction with the consummation of theRealogy License Agreement, which are not allocated to the Company’s operating segments (seeNote T).
The table below presents assets for the Company’s segments, as well as a reconciliation ofsegment assets to consolidated assets as of December 31, 2006 and 2005:
December 31 2006 2005
(Thousands of dollars)
Auction. . . . . . . . . . . . . . . . . . . . . . . . . . . . . . . . . . . . . . . . . . . . . . . . . . . . . . . . . . . . . $1,066,089 $ 815,352Finance . . . . . . . . . . . . . . . . . . . . . . . . . . . . . . . . . . . . . . . . . . . . . . . . . . . . . . . . . . . . . 178,548 148,576Dealer . . . . . . . . . . . . . . . . . . . . . . . . . . . . . . . . . . . . . . . . . . . . . . . . . . . . . . . . . . . . . . 156,710 35,626All Other . . . . . . . . . . . . . . . . . . . . . . . . . . . . . . . . . . . . . . . . . . . . . . . . . . . . . . . . . . . 1,050 110
Total segment assets . . . . . . . . . . . . . . . . . . . . . . . . . . . . . . . . . . . . . . . . . . . 1,402,397 999,664Unallocated amounts:
Deferred tax assets. . . . . . . . . . . . . . . . . . . . . . . . . . . . . . . . . . . . . . . . . . . . . 74,768 61,088
Consolidated assets . . . . . . . . . . . . . . . . . . . . . . . . . . . . . . . . . . . . . . . . $1,477,165 $1,060,752
68

Note E—Receivables
Accounts Receivable—In its role as auctioneer, the Company generally functions as an agentaccepting property on consignment from its selling clients. The Company sells property as agent ofthe consignor, billing the buyer for property purchased, receiving payment from the buyer andremitting to the consignor the consignor’s portion of the buyer’s payment after deducting theCompany’s commissions, expenses and applicable taxes. The amounts billed to buyers are recordedas Accounts Receivable in the Consolidated Balance Sheets. Under the standard terms andconditions of the Company’s auction sales, the Company is not obligated to pay consignors for itemsthat have not been paid for by the purchaser. If the purchaser defaults on payment, the Companyhas the right to cancel the sale and return the property to the owner, re-offer the property at afuture auction or negotiate a private sale.
In certain situations, under negotiated contractual arrangements or when the buyer takespossession of the property before payment is made, the Company is liable to the consignor for thenet sale proceeds whether or not the buyer makes payment. As of December 31, 2006 and 2005,Accounts Receivable included approximately $103.1 million and $180.1 million, respectively, of suchamounts due from buyers. As of December 31, 2006, substantially the entire amount outstanding atDecember 31, 2005 had been collected. As of February 16, 2007, approximately $59.5 million of theamount outstanding at December 31, 2006 had been collected. Management believes that adequateallowances have been established to provide for potential losses on any uncollected amounts.
Notes Receivable and Consignor Advances—The Company provides certain collectors anddealers with financing, generally secured by works of art that the Company either has in itspossession or permits the borrower to possess. The majority of the Company’s secured loans aremade at loan to value ratios (principal loan amount divided by the low auction estimate of thecollateral) of 50% or lower. However, the Company will also lend at loan to value ratios higherthan 50%. As of December 31, 2006, such loans totaled $90.9 million and represented 44% of netNotes Receivable and Consignor Advances. The property related to such loans had a low auctionestimate of approximately $149.5 million. The Company’s loans are predominantly variable interestrate loans.
The Company generally makes two types of secured loans: (1) advances secured by consignedproperty to borrowers who are contractually committed, in the near term, to sell the property atauction (a “consignor advance”); and (2) general purpose term loans to collectors or dealers securedby property not presently intended for sale (a “term loan”). The consignor advance allows aconsignor to receive funds shortly after consignment for an auction that will occur several weeks ormonths in the future, while preserving for the benefit of the consignor the potential of the auctionprocess. Term loans allow the Company to establish or enhance mutually beneficial relationshipswith dealers and collectors and sometimes result in auction consignments. Secured loans aregenerally made with full recourse against the borrower. In certain instances, however, secured loansare made with recourse limited to the works of art pledged as security for the loan. To the extentthat the Company is looking wholly or partially to the collateral for repayment of its loans,repayment can be adversely impacted by a decline in the art market in general or in the value ofthe particular collateral. In addition, in situations where the borrower becomes subject to bankruptcyor insolvency laws, the Company’s ability to realize on its collateral may be limited or delayed bythe application of such laws. Under certain circumstances, the Company also makes unsecured loansto collectors and dealers. Included in gross Notes Receivable and Consignor Advances are unsecuredloans totaling $2.1 million and $0.6 million at December 31, 2006 and 2005, respectively.
In certain situations, the Company also finances the purchase of works of art by certain artdealers through unsecured loans. The property purchased pursuant to such unsecured loans is soldprivately or at auction with any profit or loss shared by the Company and the dealer. The total ofall such unsecured loans was $1.9 million and $0.3 million at December 31, 2006 and 2005,respectively. These amounts are included in the total unsecured loan balances provided in theprevious paragraph.
69

At December 31, 2006, three term loans issued to the same borrower, totaling $58.9 million,comprised in the aggregate approximately 28% of the net Notes Receivable and ConsignorAdvances balance.
As of December 31, 2006 and 2005, Notes Receivable and Consignor Advances consists of thefollowing:
2006 2005
(Thousands of dollars)
Current:
Consignor advances . . . . . . . . . . . . . . . . . . . . . . . . . . . . . . . . . . . . . . $ 47,974 $ 21,596Term loans . . . . . . . . . . . . . . . . . . . . . . . . . . . . . . . . . . . . . . . . . . . . . . . 105,250 64,468
Sub-total . . . . . . . . . . . . . . . . . . . . . . . . . . . . . . . . . . . . . . . . . . . . . 153,224 86,064
Non-current:
Consignor advances . . . . . . . . . . . . . . . . . . . . . . . . . . . . . . . . . . . . . . 5,400 1,925Term loans . . . . . . . . . . . . . . . . . . . . . . . . . . . . . . . . . . . . . . . . . . . . . . . 51,074 54,753
Sub-total . . . . . . . . . . . . . . . . . . . . . . . . . . . . . . . . . . . . . . . . . . . . . 56,474 56,678
Notes receivable and consignor advances . . . . . . . . . . . . . . . . . . . . . 209,698 142,742Allowance for credit losses . . . . . . . . . . . . . . . . . . . . . . . . . . . . . . . . . . . (1,154) (792)
Notes receivables and consignor advances (net). . . . . . . . . . . . . . . $208,544 $141,950
The weighted average interest rates charged on Notes Receivable and Consignor Advances were8.2%, 6.8% and 5.9% for the years ended December 31, 2006, 2005 and 2004, respectively.
As of December 31, 2006 and 2005, Notes Receivable and Consignor Advances includesemployee loans of $0.6 million and $0.4 million, respectively. For the years ended December 31,2006 and 2005, the weighted average interest rates charged on these loans were 9.7% and 8.1%,respectively.
Changes in the Allowance for Credit Losses relating to Notes Receivable and ConsignorAdvances during 2006 and 2005 were as follows:
2006 2005
(Thousands ofdollars)
Allowance for credit losses at January 1. . . . . . . . . . . . . . . . . . . . . . . . . . . $ 792 $1,759Change in loan loss provision . . . . . . . . . . . . . . . . . . . . . . . . . . . . . . . . . . . . . 423 (935)Write-offs. . . . . . . . . . . . . . . . . . . . . . . . . . . . . . . . . . . . . . . . . . . . . . . . . . . . . . . . . . (99) —Foreign currency exchange rate changes . . . . . . . . . . . . . . . . . . . . . . . . . . . 38 (32)
Allowance for credit losses at December 31 . . . . . . . . . . . . . . . . . . . . . . . $1,154 $ 792
Note F—Investments
On May 23, 1990, the Company purchased the common stock of the Pierre Matisse GalleryCorporation (“Matisse”) for approximately $153 million. The assets of Matisse consisted of acollection of fine art (the “Matisse Inventory”). Upon consummation of the purchase, the Companyentered into an agreement with Acquavella Contemporary Art, Inc. (“ACA”) to form AcquavellaModern Art (“AMA”), a partnership through which the Matisse Inventory would be sold. TheCompany contributed the Matisse Inventory to AMA in exchange for a 50% interest in thepartnership. Although the original term of the AMA partnership agreement was for ten years andwas due to expire in 2000, it has been renewed on an annual basis since then.
The Company does not control AMA and is not its primary beneficiary; consequently, theCompany uses the equity method to account for its investment in AMA and records its share ofAMA’s earnings or losses, net of taxes, within Equity in Earnings of Investees in the ConsolidatedIncome Statements. The Company’s 50% interest in the net assets of AMA is included inInvestments in the Consolidated Balance Sheets. The carrying value of the Company’s investment inAMA totaled $20.3 million and $23.5 million as of December 31, 2006 and 2005, respectively. For
70

the years ended December 31, 2006, 2005 and 2004, the Company’s share of AMA’s earnings, net oftaxes, was $1.4 million, $0.5 million and $0.5 million, respectively.
Pursuant to the AMA partnership agreement, upon the death of the majority shareholder ofACA, the successors-in-interest to ACA have the right, but not the obligation, to require theCompany to purchase their interest in AMA at a price equal to the fair market value of suchinterest. The fair market value shall be determined pursuant to a process and a formula set forth inthe partnership agreement that includes an appraisal of the works of art held by AMA at such time.The net assets of AMA consist almost entirely of the Matisse Inventory. At December 31, 2006, thecarrying value of this inventory was $64.2 million.
To the extent that AMA requires working capital, the Company has agreed to lend the same toAMA. As of December 31, 2006 and 2005, no such amounts were outstanding. Additionally, fromtime-to-time, the Company transacts with the principal shareholder of ACA in the normal course ofits business.
As of December 31, 2006 and 2005, the carrying value of the Company’s investment in anotheraffiliate was $2.8 million and $2.4 million, respectively. The Company does not control this affiliateand is not its primary beneficiary; consequently, the Company uses the equity method to account forits investment. For the years ended December 31, 2006, 2005 and 2004, the Company’s share of thisaffiliate’s earnings, net of taxes, was $0.2 million, $0.3 million and $0.2 million, respectively.
Note G—Fixed Assets
As of December 31, 2006 and 2005, Fixed Assets consisted of the following:
December 31 2006 2005
(Thousands of dollars)
Land . . . . . . . . . . . . . . . . . . . . . . . . . . . . . . . . . . . . . . . . . . . . . . . . . . . . . . . . $ 7,776 $ 6,340York Property capital lease . . . . . . . . . . . . . . . . . . . . . . . . . . . . . . . . . 173,866 173,866Buildings and building improvements . . . . . . . . . . . . . . . . . . . . . . . 8,040 4,914Leasehold improvements . . . . . . . . . . . . . . . . . . . . . . . . . . . . . . . . . . . . 72,352 64,222Computer hardware and software . . . . . . . . . . . . . . . . . . . . . . . . . . . 60,612 59,438Furniture, fixtures and equipment . . . . . . . . . . . . . . . . . . . . . . . . . . . 54,679 49,299Construction in progress . . . . . . . . . . . . . . . . . . . . . . . . . . . . . . . . . . . . 6,157 1,293Other . . . . . . . . . . . . . . . . . . . . . . . . . . . . . . . . . . . . . . . . . . . . . . . . . . . . . . . 1,758 1,713
385,240 361,085Less: accumulated depreciation and amortization. . . . . . . . . . . . (158,718) (135,651)
Total . . . . . . . . . . . . . . . . . . . . . . . . . . . . . . . . . . . . . . . . . . . . . . . . . . . $ 226,522 $ 225,434
On February 7, 2003, the Company completed the sale of its headquarters building at 1334York Avenue in New York, New York (the “York Property”) and leased it back from the buyer foran initial 20-year term, with options for the Company to extend the lease for two additional 10-yearterms. The resulting lease is being accounted for as a capital lease, with the related asset beingamortized over the initial 20-year lease term. According to the terms of the lease, if the landlorddesires to sell the York Property, notice shall be given to the Company by the landlord of suchproposed sale and a statement of the proposed purchase price and the proposed closing date for thetransaction (the “Landlord’s Offer”). Upon receipt of such notice, the Company has thirty days toaccept or reject the Landlord’s Offer. If accepted, the Company would purchase the York Propertyat the proposed purchase price. In February 2007, the Company was advised that the landlord of theYork Property intends to market and sell the York Property. Management is currently assessing itsrights and options with respect to the York Property.
Included in Accumulated Depreciation and Amortization above is $33.9 million and $25.3million as of December 31, 2006 and 2005, respectively, related to the York Property capital lease.The sale of the York Property resulted in a deferred gain of approximately $23 million, which isbeing amortized on a straight-line basis against Depreciation and Amortization Expense over theinitial 20-year lease term (see Note L).
71

Note H—Goodwill
The Company has Goodwill in its Auction and Dealer segments. The Goodwill in the Dealersegment is solely attributable to NMP, which was acquired on June 7, 2006 (see Note C). TheCompany completed its annual impairment test and concluded that its Goodwill was not impaired asof October 31, 2006. For the years ended December 31, 2006 and 2005, changes in the carryingvalue of Goodwill were as follows (in thousands of dollars):
Auction Dealer Total Auction Dealer Total
2006 2005
Balance as of January 1 . . . . . . . . . . . . . . . . . . . . $13,447 $ — $13,447 $13,753 $— $13,753Goodwill acquired (see Note C) . . . . . . . . . . . . — 20,583 20,583 — — —Foreign currency exchangerate changes . . . . . . . . . . . . . . . . . . . . . . . . . . . . . . . . 213 466 679 (306) — (306)
Balance as of December 31. . . . . . . . . . . . . . . . . $13,660 $21,049 $34,709 $13,447 $— $13,447
Robert C. Noortman, who was the Managing Director of NMP, died unexpectedly onJanuary 14, 2007. NMP is continuing under the leadership of Mr. Noortman’s son, William. As aresult of Mr. Noortman’s death, Goodwill related to NMP is being tested for impairment. TheCompany anticipates that it will record an impairment charge in the first quarter of 2007 to reducethe carrying value of NMP’s Goodwill. The amount of such a charge could potentially be materialdepending on the outcome of the Company’s assessment.
Note I—Intangible Assets
As discussed in Note C, on June 7, 2006, the Company acquired NMP. In conjunction with thepurchase price allocation, management assigned approximately $14.2 million to acquired intangibleassets. As of December 31, 2006, Intangible Assets consisted of the following:
GrossCarryingAmount
AccumulatedAmortization
NetCarryingAmount
(Thousands of dollars)
Indefinite lived intangible assets:Trade name . . . . . . . . . . . . . . . . . . . . . . . . . . . . . . . . . . . . . . . . . . $ 2,502
Amortizable intangible assets:Customer relationships (a). . . . . . . . . . . . . . . . . . . . . . . . . . . . $11,376 $1,658 $ 9,718Non-compete agreement (b) . . . . . . . . . . . . . . . . . . . . . . . . . . 605 45 560
Total . . . . . . . . . . . . . . . . . . . . . . . . . . . . . . . . . . . . . . . . . . . . . $11,981 $1,703 $10,278
(a) Amortized over a useful life of four years.
(b) Amortized over a useful life of eight years.
Amortization expense related to Intangible Assets for the year ended December 31, 2006, whichis included in Depreciation and Amortization Expense in the Company’s Consolidated IncomeStatement, totaled $1.7 million. As of December 31, 2006, the remaining $10.3 million of acquiredintangible assets have a weighted-average useful life of approximately 3.6 years. Based on theDecember 31, 2006 carrying values and subject to the impairment test discussed below, amortizationexpense related to the customer relationships is expected to be approximately $2.8 million in each of2007, 2008, and 2009 and $1.3 million in 2010.
Robert Noortman, Managing Director of NMP, died unexpectedly on January 14, 2007. As aresult, the remaining unamortized intangible asset of $0.6 million relating to Mr. Noortman’s non-compete agreement will be expensed in the first quarter of 2007, while the intangible assets relatingto the trade name and customer relationships of $2.5 million and $9.7 million, respectively, are beingtested for impairment. The Company anticipates that it will record an impairment charge in the firstquarter of 2007 to reduce the carrying value of NMP’s Intangible Assets. The amount of such a
72

charge could potentially be material depending on the outcome of the Company’s assessment. (SeeNote C.)
Note J—Credit Arrangements
Bank Credit Facilities—On September 7, 2005, in connection with the Transaction discussed inNote U, the Company terminated its previous senior secured credit agreement and entered into anew senior secured credit agreement with an international syndicate of lenders arranged by Banc ofAmerica Securities LLC (“BofA”) and LaSalle Bank N.A. (the “BofA Credit Agreement”). TheBofA Credit Agreement originally provided for borrowings of up to $250 million through arevolving credit facility. On May 18, 2006, the Company amended the BofA Credit Agreement toprovide for $50 million in additional commitments from its existing lenders, thereby increasing thetotal borrowing capacity to $300 million. The amendment also permits the amount of availableborrowings to be increased by an additional $50 million to $350 million.
The amount of borrowings available at any time under the BofA Credit Agreement is limited toa borrowing base, which is generally equal to 100% of eligible loans made by the Company in theU.S. and the U.K. (i.e., notes receivable and consignor advances) plus 15% of the Company’s nettangible assets (calculated as total assets less current liabilities, goodwill, intangible assets,unamortized debt discount and eligible loans). As of December 31, 2006, there were no outstandingborrowings under the BofA Credit Agreement and the amount of unused borrowing capacityavailable and borrowing base under the BofA Credit Agreement was $275.2 million.
The BofA Credit Agreement is available through September 7, 2010; provided that in the eventthat any of the $100 million in long-term debt securities (the “Notes”) issued by the Company inFebruary 1999 are still outstanding on July 1, 2008, then either: (a) the Company shall deposit cashin an amount equal to the aggregate outstanding principal amount of the Notes on such date into anaccount in the sole control and dominion of BofA for the benefit of the lenders and the holders ofthe Notes or (b) the Company shall have otherwise demonstrated its ability to redeem and pay infull the Notes; otherwise, the BofA Credit Agreement shall terminate and all amounts outstandingthereunder shall be due and payable in full on July 1, 2008.
Borrowings under the BofA Credit Agreement were used to finance in part the Transaction andrelated expenses (see Note U) and are also available to provide ongoing working capital and forother general corporate purposes of the Company. The Company’s obligations under the BofACredit Agreement are secured by substantially all of the non-real estate assets of the Company, aswell as the non-real estate assets of its subsidiaries in the U.S. and the U.K.
The BofA Credit Agreement contains financial covenants requiring the Company not to exceeda maximum level of capital expenditures and dividend payments (as discussed in more detail below)and to have a quarterly interest coverage ratio of not less than 2.0 and a quarterly leverage ratio ofnot more than: (i) 3.5 for quarters ending December 31, 2006 to September 30, 2007 and (ii) 3.0 forquarters ending December 31, 2007 and thereafter. The maximum level of annual capitalexpenditures permitted under the BofA Credit Agreement is $15 million through 2007 and $20million thereafter with any unused amounts carried forward to the following year. Dividendpayments, if any, must be paid solely out of 40% of the Company’s net income arising afterJune 30, 2005 and computed on a cumulative basis (see Note M). The BofA Credit Agreement alsohas certain non-financial covenants and restrictions. The Company is in compliance with itscovenants.
At the option of the Company, any borrowings under the BofA Credit Agreement generallybear interest at a rate equal to: (i) LIBOR plus 1.75%, or (ii) 0.5% plus the higher of the PrimeRate or the Federal Funds Rate plus 0.5%. For the years ended December 31, 2006 and 2005, theweighted average interest rates incurred by the Company on outstanding borrowings under the BofACredit Agreement were approximately 7% and 6.3%, respectively. For the year ended December 31,2004, the weighted average interest rate incurred by the Company on outstanding borrowings underits previous credit facility was approximately 6.3%.
73

The Company paid underwriting, structuring and amendment fees of $2.8 million related to theBofA Credit Agreement, which are being amortized on a straight-line basis to interest expense overthe term of the facility.
As a result of the termination of its previous senior secured credit agreement, in the thirdquarter of 2005, the Company incurred a $1 million termination fee and wrote off approximately$2.1 million in arrangement fees and other direct costs related to the GE Capital Credit Agreement,which were previously being amortized over the term of the agreement. These charges are combinedand reflected as a separate caption in the Consolidated Income Statement for the year endedDecember 31, 2005.
Senior Unsecured Debt—In February 1999, the Company issued a tranche of long-term debtsecurities (defined above as the “Notes”), pursuant to the Company’s $200 million shelf registrationwith the SEC, for an aggregate offering price of $100 million. The ten-year Notes have an effectiveinterest rate of 6.98% with interest payments due semi-annually in February and August. The Noteshave covenants that impose limitations on the Company from placing liens on certain property andentering into certain sale-leaseback transactions. The Company is in compliance with thesecovenants. As of December 31, 2006, aggregate principal and interest payments due under the Notesare as follows (in thousands):
2007 . . . . . . . . . . . . . . . . . . . . . . . . . . . . . . . . . . . . . . . . . . . . . . . . . . . . . . . $ 6,8752008 . . . . . . . . . . . . . . . . . . . . . . . . . . . . . . . . . . . . . . . . . . . . . . . . . . . . . . . 6,8752009 . . . . . . . . . . . . . . . . . . . . . . . . . . . . . . . . . . . . . . . . . . . . . . . . . . . . . . . 102,865
Total future principal and interest payments . . . . . . . . . . $116,615
Interest Expense—For the years ended December 31, 2006, 2005 and 2004, interest expenseconsisted of the following:
Year Ended December 31 2006 2005 2004
(Thousands of dollars)
Senior secured credit facility:Interest expense on outstanding borrowings . . . . . . . . . . . . . . . $ 1,787 $ 1,513 $ 298Amortization of amendment and arrangement fees . . . . . . . . 568 844 1,114Commitment fees . . . . . . . . . . . . . . . . . . . . . . . . . . . . . . . . . . . . . . . . . . 707 851 869
Sub-total . . . . . . . . . . . . . . . . . . . . . . . . . . . . . . . . . . . . . . . . . . . . . . 3,062 3,208 2,281
Interest expense on York Property capital lease obligation(see Note L) . . . . . . . . . . . . . . . . . . . . . . . . . . . . . . . . . . . . . . . . . . . . . . . . . 17,826 17,899 17,911
Interest expense on long-term debt . . . . . . . . . . . . . . . . . . . . . . . . . . . . 6,965 6,959 6,952Amortization of discount related to antitrust matters
(see Note Q). . . . . . . . . . . . . . . . . . . . . . . . . . . . . . . . . . . . . . . . . . . . . . . . . 2,679 3,988 4,885Other interest expense . . . . . . . . . . . . . . . . . . . . . . . . . . . . . . . . . . . . . . . . . 2,507 1,367 1,522
Total . . . . . . . . . . . . . . . . . . . . . . . . . . . . . . . . . . . . . . . . . . . . . . . . . . $33,039 $33,421 $33,551
Other interest expense principally relates to interest accrued on the obligations under theSotheby’s, Inc. Benefit Equalization Plan and its successor, the Sotheby’s, Inc. 2005 BenefitEqualization Plan, which were unfunded deferred compensation plans available to certain U.S.officers of the Company through December 31, 2006 (see Note N).
Interest Paid—For the years ended December 31, 2006, 2005 and 2004, interest paid totaled$28.1 million, $29.2 million and $29 million, respectively. Interest paid consists of cash paymentsrelated to the Company’s credit facility borrowings (including interest and fees) and long-term debtsecurities, as well as the portion of lease payments for the York Property capital lease obligationrelated to interest.
74

Note K—Income Taxes
For the years ended December 31, 2006, 2005 and 2004, the significant components of incometax expense (benefit) from continuing operations consist of the following:
Year Ended December 31 2006 2005 2004
(Thousands of dollars)
Income (loss) from continuing operations before taxes:Domestic . . . . . . . . . . . . . . . . . . . . . . . . . . . . . . . . . . . . . . . . . . . . . . . . . $ 32,456 $(13,217) $27,763Foreign. . . . . . . . . . . . . . . . . . . . . . . . . . . . . . . . . . . . . . . . . . . . . . . . . . . 133,327 104,199 68,894
Total. . . . . . . . . . . . . . . . . . . . . . . . . . . . . . . . . . . . . . . . . . . . . . . . . $165,783 $ 90,982 $96,657
Income tax expense—current:Federal and state. . . . . . . . . . . . . . . . . . . . . . . . . . . . . . . . . . . . . . . . . $ 4,043 $ 4,505 $ 1,515Foreign. . . . . . . . . . . . . . . . . . . . . . . . . . . . . . . . . . . . . . . . . . . . . . . . . . . 32,660 15,332 10,270
Sub-total . . . . . . . . . . . . . . . . . . . . . . . . . . . . . . . . . . . . . . . . . . . . . 36,703 19,837 11,785
Income tax expense (benefit)—deferred:Federal and state. . . . . . . . . . . . . . . . . . . . . . . . . . . . . . . . . . . . . . . . . 22,341 (2,375) 9,216Foreign. . . . . . . . . . . . . . . . . . . . . . . . . . . . . . . . . . . . . . . . . . . . . . . . . . . 1,006 11,132 13,999
Sub-total . . . . . . . . . . . . . . . . . . . . . . . . . . . . . . . . . . . . . . . . . . . . . 23,347 8,757 23,215
Total. . . . . . . . . . . . . . . . . . . . . . . . . . . . . . . . . . . . . . . . . . . . . . . . . $ 60,050 $ 28,594 $35,000
For the years ended December 31, 2006, 2005 and 2004, income tax expense related to theCompany’s equity in earnings of investees was approximately $1 million, $0.4 million and $0.4million, respectively.
The components of deferred income tax assets and liabilities are disclosed below:
December 31 2006 2005
(Thousands of dollars)
Deferred Tax Assets:Asset provisions and accrued liabilities . . . . . . . . . . . . . . . . . . . . . . . . . . . . . $ 41,285 $ 33,847Pension obligations . . . . . . . . . . . . . . . . . . . . . . . . . . . . . . . . . . . . . . . . . . . . . . . . . 18,249 —Capital lease obligation. . . . . . . . . . . . . . . . . . . . . . . . . . . . . . . . . . . . . . . . . . . . . 73,079 73,076Tax loss and credit carryforwards . . . . . . . . . . . . . . . . . . . . . . . . . . . . . . . . . . 30,347 49,412Difference between book and tax basis of depreciable and
amortizable assets . . . . . . . . . . . . . . . . . . . . . . . . . . . . . . . . . . . . . . . . . . . . . . . . 1,683 —
Sub-total . . . . . . . . . . . . . . . . . . . . . . . . . . . . . . . . . . . . . . . . . . . . . . . . . . . . . . . 164,643 156,335Valuation allowance . . . . . . . . . . . . . . . . . . . . . . . . . . . . . . . . . . . . . . . . . . . . . . . . (29,147) (24,885)
Total deferred tax assets . . . . . . . . . . . . . . . . . . . . . . . . . . . . . . . . . . 135,496 131,450
Deferred Tax Liabilities:Difference between book and tax basis of depreciable and
amortizable assets . . . . . . . . . . . . . . . . . . . . . . . . . . . . . . . . . . . . . . . . . . . . . . . . 56,382 52,522Step up of acquired assets . . . . . . . . . . . . . . . . . . . . . . . . . . . . . . . . . . . . . . . . . . 2,586 —Pension obligations . . . . . . . . . . . . . . . . . . . . . . . . . . . . . . . . . . . . . . . . . . . . . . . . . — 8,095Basis difference in equity method investments. . . . . . . . . . . . . . . . . . . . . . 8,391 9,787
Total deferred tax liabilities . . . . . . . . . . . . . . . . . . . . . . . . . . . . . . . . . . . 67,359 70,404
Total . . . . . . . . . . . . . . . . . . . . . . . . . . . . . . . . . . . . . . . . . . . . . . . . . . . . . . $ 68,137 $ 61,046
The Company has deferred tax assets related to various foreign and state loss and tax creditcarryforwards totaling $28.4 million that begin to expire in 2008. In addition, at December 31, 2006the Company has alternative minimum tax credits of $1.9 million being carried forward indefinitely.
The Company provided a valuation allowance for certain deferred tax assets primarily related tostate, federal and foreign losses of $29.1 million and $24.9 million at December 31, 2006 and 2005,respectively. In 2005, the valuation allowance decreased from 2004 by $8.9 million, primarily due tothe reversal of allowances related to federal and foreign net operating loss carryforwards. During
75

2006, the valuation allowance increased by $4.2 million due to changes in the state deferred taxassets. The changes in the valuation allowance resulted from management’s evaluation of theutilization of state, federal and foreign operating losses. In assessing the need for the valuationallowance management considers, among other things, its projections of future taxable income andongoing prudent and feasible tax planning strategies.
During 2006, the Company recorded excess tax benefits associated with the exercise of stockoptions and the vesting of restricted stock of $14.9 million to Additional Paid-in Capital. In 2005,the equivalent was $1.3 million.
The effective rate from continuing operations varied from the statutory rate as follows:
Year Ended December 31 2006 2005 2004
Statutory federal income tax rate . . . . . . . . . . . . . . . . . . . . . . . . . . . . . . . . 35.00% 35.00% 35.00%State and local taxes, net of federal tax benefit. . . . . . . . . . . . . . . . . . 0.03% 0.57% (2.42%)Foreign taxes at rates different from U.S. rates . . . . . . . . . . . . . . . . . . (8.85%) (8.48%) (2.11%)Deemed income from foreign subsidiaries, net. . . . . . . . . . . . . . . . . . . 8.08% 5.42% —Valuation allowance . . . . . . . . . . . . . . . . . . . . . . . . . . . . . . . . . . . . . . . . . . . . . — (7.88%) 3.26%Foreign earnings repatriation . . . . . . . . . . . . . . . . . . . . . . . . . . . . . . . . . . . . — 4.35% —Other . . . . . . . . . . . . . . . . . . . . . . . . . . . . . . . . . . . . . . . . . . . . . . . . . . . . . . . . . . . . 1.96% 2.45% 2.48%
Effective income tax rate . . . . . . . . . . . . . . . . . . . . . . . . . . . . . . . . . . . . . . . . 36.22% 31.43% 36.21%
The Company’s consolidated financial statements do not provide U.S. taxes on undistributedearnings of certain foreign subsidiaries that are intended to be indefinitely reinvested in operationsoutside the U.S. Income taxes have not been provided on a cumulative total of $119.9 million and$91.6 million of such earnings at December 31, 2006 and 2005, respectively. It is not practicable todetermine the income tax liability that might be incurred if these earnings were to be distributed.
On November 7, 2005, after approval by the Company’s Chief Executive Officer, the Board ofDirectors approved a plan to repatriate foreign earnings in accordance with the temporaryrepatriation incentive under the American Jobs Creation Act of 2004 (the “AJCA”). The amountrepatriated was $72.4 million. The Company recorded a tax charge and related tax liability of $3.8million in 2005. Repatriated funds have been used for capital and leased asset investments.
Total net income tax payments related to the Company’s continuing operations during 2006,2005 and 2004 were $24.3 million, $20.4 million and $7.8 million, respectively.
(See Notes C, N and O.)
Note L—Lease Commitments
Capital Lease—On February 7, 2003, the Company sold the York Property (see Note G) andleased it back from the buyer for an initial 20-year term, with options for the Company to extendthe lease for two additional 10-year terms. The resulting lease is being accounted for as a capitallease. Under the lease agreement, rental payments escalate 7% every three years during the initialterm.
The following is a schedule, by year, of the future minimum lease payments due under the YorkProperty capital lease, together with the present value of the future minimum lease payments as ofDecember 31, 2006 (in thousands of dollars):
2007. . . . . . . . . . . . . . . . . . . . . . . . . . . . . . . . . . . . . . . . . . . . . . . . . . . . . . . . . . . . . . . . . . . . . . . . $ 19,2872008. . . . . . . . . . . . . . . . . . . . . . . . . . . . . . . . . . . . . . . . . . . . . . . . . . . . . . . . . . . . . . . . . . . . . . . . 19,2872009. . . . . . . . . . . . . . . . . . . . . . . . . . . . . . . . . . . . . . . . . . . . . . . . . . . . . . . . . . . . . . . . . . . . . . . . 20,6132010. . . . . . . . . . . . . . . . . . . . . . . . . . . . . . . . . . . . . . . . . . . . . . . . . . . . . . . . . . . . . . . . . . . . . . . . 20,6372011. . . . . . . . . . . . . . . . . . . . . . . . . . . . . . . . . . . . . . . . . . . . . . . . . . . . . . . . . . . . . . . . . . . . . . . . 20,637Thereafter. . . . . . . . . . . . . . . . . . . . . . . . . . . . . . . . . . . . . . . . . . . . . . . . . . . . . . . . . . . . . . . . . . 269,209
Total future minimum lease payments . . . . . . . . . . . . . . . . . . . . . . . . . . . . . . . . . 369,670Less: amount representing interest. . . . . . . . . . . . . . . . . . . . . . . . . . . . . . . . . . . . . 199,065
Present value of future minimum lease payments . . . . . . . . . . . . . . . . . $170,605
76

In addition to the lease payments above, under the terms of the York Property capital lease,the Company is required to pay real estate taxes and operating costs related to the premises.
Operating Leases—The Company also conducts business on premises leased in various locationsunder long-term operating leases expiring through 2060. For the years ended December 31, 2006,2005 and 2004, net rental expense under operating leases was as follows:
Year Ended December 31 2006 2005 2004
(Thousands of dollars)
Continuing operations . . . . . . . . . . . . . . . . . . . . . . . . . . . . . . . . . . . . . . . . . . . $13,655 $13,611 $13,090Discontinued operations (see Note T). . . . . . . . . . . . . . . . . . . . . . . . . . . — — 827
Total . . . . . . . . . . . . . . . . . . . . . . . . . . . . . . . . . . . . . . . . . . . . . . . . . . . . . . . $13,655 $13,611 $13,917
Future minimum lease payments under non-cancelable operating leases in effect atDecember 31, 2006 are as follows (in thousands of dollars):
2007. . . . . . . . . . . . . . . . . . . . . . . . . . . . . . . . . . . . . . . . . . . . . . . . . . . . . . . . . . . . . . . . . . . . . . . . . $15,7182008. . . . . . . . . . . . . . . . . . . . . . . . . . . . . . . . . . . . . . . . . . . . . . . . . . . . . . . . . . . . . . . . . . . . . . . . . 13,4402009. . . . . . . . . . . . . . . . . . . . . . . . . . . . . . . . . . . . . . . . . . . . . . . . . . . . . . . . . . . . . . . . . . . . . . . . . 10,3512010. . . . . . . . . . . . . . . . . . . . . . . . . . . . . . . . . . . . . . . . . . . . . . . . . . . . . . . . . . . . . . . . . . . . . . . . . 6,0982011. . . . . . . . . . . . . . . . . . . . . . . . . . . . . . . . . . . . . . . . . . . . . . . . . . . . . . . . . . . . . . . . . . . . . . . . . 4,128Thereafter. . . . . . . . . . . . . . . . . . . . . . . . . . . . . . . . . . . . . . . . . . . . . . . . . . . . . . . . . . . . . . . . . . . 33,266
Total future minimum lease payments . . . . . . . . . . . . . . . . . . . . . . . . . . . . . . . . . . $83,001
Future minimum lease payments exclude minimum sublease rental receipts of $6 million owedto the Company in the future under non-cancelable subleases.
In addition to the lease payments above, under the terms of certain leases, the Company isrequired to pay real estate taxes and utility costs and may be subject to escalations in the amount offuture minimum lease payments based on certain contractual provisions.
Note M—Shareholders’ Equity and Share-Based Payments
Common Stock—The principal U.S. market for the Company’s common stock is the New YorkStock Exchange (the “NYSE”). Each share of common stock is entitled to one vote. (See Note Ufor information related to a recapitalization transaction consummated by the Company in September,2005. See Note V for information related to the Company’s June 2006 reincorporation in the Stateof Delaware.)
Preferred Stock—In addition to the common stock outstanding, the Company has the authorityto issue 50 million shares of no par value Preferred Stock. No such shares were issued andoutstanding as of December 31, 2006 and 2005.
Dividends—On each of August 2 and November 2, 2006, the Company’s Board of Directorsdeclared quarterly dividends on its common stock of $0.10 per share totaling approximately $6.4million and $6.5 million, respectively. The dividend declared on August 2, 2006 was paid onSeptember 15, 2006. The dividend declared on November 2, 2006 was paid on December 15, 2006.On February 27, 2007, the Company’s Board of Directors declared a quarterly dividend on itscommon stock of $0.10 per share (approximately $6.5 million), to be paid on March 15, 2007 toshareholders of record on February 28, 2007. (See Note J for information on financial covenantscontained in the BofA Credit Agreement related to dividend payments.)
Share-Based Payments—In December 2004, the FASB issued SFAS No. 123R, “Share-BasedPayment.” SFAS No. 123R is a revision of SFAS No. 123, as amended, “Accounting for Stock-BasedCompensation,” and supersedes APB No. 25, “Accounting for Stock Issued to Employees.” SFASNo. 123R eliminates the alternative to use the intrinsic value method of accounting that wasprovided in SFAS No. 123, which resulted in no compensation expense recorded in the financialstatements related to the issuance of stock option awards to employees with an exercise price equalto the stock’s fair value on the date of grant. SFAS No. 123R requires that the cost resulting fromall share-based payment transactions be recognized in the financial statements. SFAS No. 123R
77
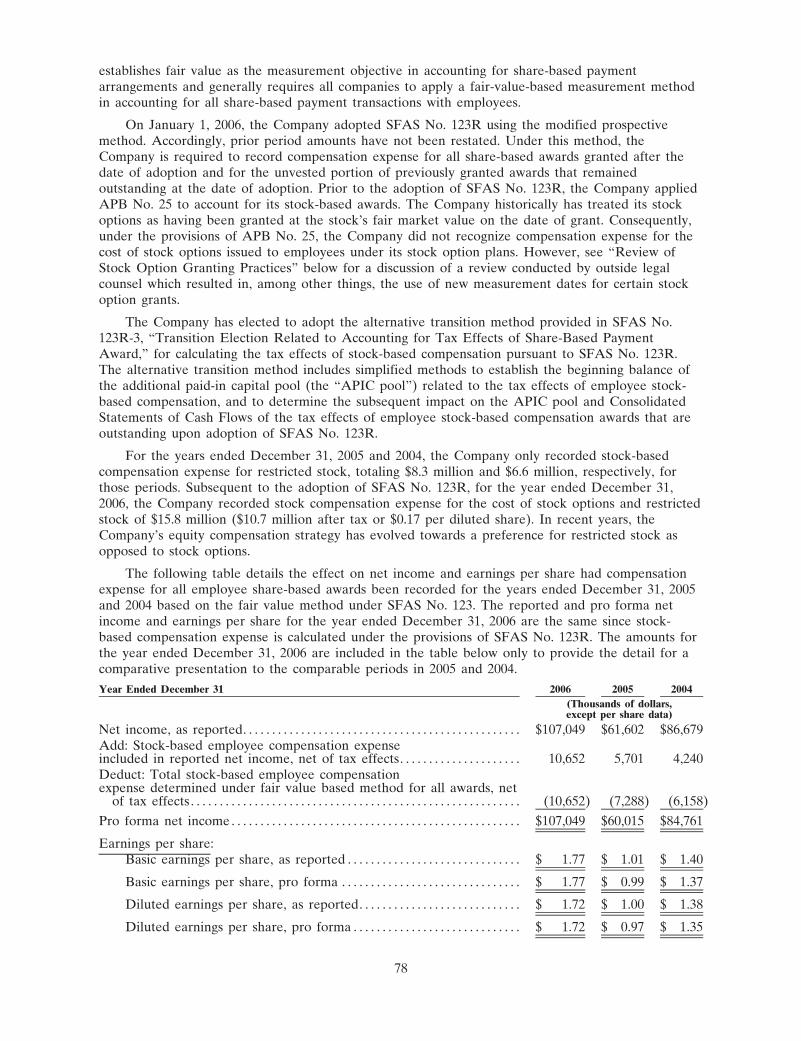
establishes fair value as the measurement objective in accounting for share-based paymentarrangements and generally requires all companies to apply a fair-value-based measurement methodin accounting for all share-based payment transactions with employees.
On January 1, 2006, the Company adopted SFAS No. 123R using the modified prospectivemethod. Accordingly, prior period amounts have not been restated. Under this method, theCompany is required to record compensation expense for all share-based awards granted after thedate of adoption and for the unvested portion of previously granted awards that remainedoutstanding at the date of adoption. Prior to the adoption of SFAS No. 123R, the Company appliedAPB No. 25 to account for its stock-based awards. The Company historically has treated its stockoptions as having been granted at the stock’s fair market value on the date of grant. Consequently,under the provisions of APB No. 25, the Company did not recognize compensation expense for thecost of stock options issued to employees under its stock option plans. However, see “Review ofStock Option Granting Practices” below for a discussion of a review conducted by outside legalcounsel which resulted in, among other things, the use of new measurement dates for certain stockoption grants.
The Company has elected to adopt the alternative transition method provided in SFAS No.123R-3, “Transition Election Related to Accounting for Tax Effects of Share-Based PaymentAward,” for calculating the tax effects of stock-based compensation pursuant to SFAS No. 123R.The alternative transition method includes simplified methods to establish the beginning balance ofthe additional paid-in capital pool (the “APIC pool”) related to the tax effects of employee stock-based compensation, and to determine the subsequent impact on the APIC pool and ConsolidatedStatements of Cash Flows of the tax effects of employee stock-based compensation awards that areoutstanding upon adoption of SFAS No. 123R.
For the years ended December 31, 2005 and 2004, the Company only recorded stock-basedcompensation expense for restricted stock, totaling $8.3 million and $6.6 million, respectively, forthose periods. Subsequent to the adoption of SFAS No. 123R, for the year ended December 31,2006, the Company recorded stock compensation expense for the cost of stock options and restrictedstock of $15.8 million ($10.7 million after tax or $0.17 per diluted share). In recent years, theCompany’s equity compensation strategy has evolved towards a preference for restricted stock asopposed to stock options.
The following table details the effect on net income and earnings per share had compensationexpense for all employee share-based awards been recorded for the years ended December 31, 2005and 2004 based on the fair value method under SFAS No. 123. The reported and pro forma netincome and earnings per share for the year ended December 31, 2006 are the same since stock-based compensation expense is calculated under the provisions of SFAS No. 123R. The amounts forthe year ended December 31, 2006 are included in the table below only to provide the detail for acomparative presentation to the comparable periods in 2005 and 2004.
Year Ended December 31 2006 2005 2004
(Thousands of dollars,except per share data)
Net income, as reported. . . . . . . . . . . . . . . . . . . . . . . . . . . . . . . . . . . . . . . . . . . . . . . . $107,049 $61,602 $86,679Add: Stock-based employee compensation expenseincluded in reported net income, net of tax effects. . . . . . . . . . . . . . . . . . . . . 10,652 5,701 4,240Deduct: Total stock-based employee compensationexpense determined under fair value based method for all awards, net
of tax effects . . . . . . . . . . . . . . . . . . . . . . . . . . . . . . . . . . . . . . . . . . . . . . . . . . . . . . . . . (10,652) (7,288) (6,158)
Pro forma net income . . . . . . . . . . . . . . . . . . . . . . . . . . . . . . . . . . . . . . . . . . . . . . . . . . $107,049 $60,015 $84,761
Earnings per share:Basic earnings per share, as reported . . . . . . . . . . . . . . . . . . . . . . . . . . . . . . $ 1.77 $ 1.01 $ 1.40
Basic earnings per share, pro forma . . . . . . . . . . . . . . . . . . . . . . . . . . . . . . . $ 1.77 $ 0.99 $ 1.37
Diluted earnings per share, as reported. . . . . . . . . . . . . . . . . . . . . . . . . . . . $ 1.72 $ 1.00 $ 1.38
Diluted earnings per share, pro forma . . . . . . . . . . . . . . . . . . . . . . . . . . . . . $ 1.72 $ 0.97 $ 1.35
78

For the year ended December 31, 2006, the adoption of SFAS No. 123R resulted in incrementalstock-based compensation expense of $1.4 million ($0.9 million after tax or $0.01 per diluted share),for the cost of stock options related to the Sotheby’s 1997 Stock Option Plan (the “1997 StockOption Plan”) that otherwise would not have been recognized. For the year ended December 31,2006, stock-based compensation expense for restricted stock of $14.4 million ($9.7 million after taxor $0.16 per diluted share), would have been recognized in 2006 regardless of the adoption of SFASNo. 123R. In addition, in connection with the adoption of SFAS No. 123R, for the year endedDecember 31, 2006, net cash provided by operating activities decreased and net cash provided byfinancing activities increased by approximately $14.9 million related to the classification of excess taxbenefits from stock-based payment arrangements.
Stock Options—Stock options issued pursuant to the 1997 Stock Option Plan are exercisableinto authorized but unissued shares of the Company’s common stock. Stock options generally expireten years after the date of grant. Stock options granted pursuant to the 1997 Stock Option Plangenerally vest and become exercisable ratably after each of the first, second, third, fourth and fifthyears following the date of grant (except in the U.K. where certain options vest three-fifths after thethird year and one-fifth after each of the fourth and fifth years following the date of grant). Stockoptions granted on or after April 29, 1997 vest immediately upon a change in control of theCompany (as defined in the plan document for the 1997 Stock Option Plan, as amended). In March2006, the Compensation Committee of the Board of Directors (the “Compensation Committee”)approved an amendment to the 1997 Stock Option Plan whereby the maximum amount of sharesreserved for issuance under this plan was reduced by approximately 7 million shares to 7.9 millionshares. This amendment is consistent with the evolution of the Company’s equity compensationstrategy towards a preference for restricted stock as opposed to stock options and was made inconjunction with shareholder approval of a 4.5 million increase in the number of shares of commonstock authorized for issuance under the Sotheby’s Amended and Restated Restricted Stock Plan (the“Restricted Stock Plan”). On May 8, 2006, the Restricted Stock Plan was approved. As ofDecember 31, 2006, the number of shares of common stock authorized for issuance under the 1997Stock Option Plan was 7.9 million shares, of which 0.5 million shares were available for issuance.(See “Restricted Stock” for a more detailed discussion of the Restricted Stock Plan.)
In January 2002, the Company granted 1.6 million stock options pursuant to the 1997 StockOption Plan which were due to vest on the earlier of one year from the date of grant or on the dayafter the market price of the common stock closed at or above $30 per share for ten consecutivetrading days. These stock options vested in January 2003 as the market price of the common stockdid not close at or above $30 per share for ten consecutive trading days during the one-year periodafter the date of grant. Such options expired on January 30, 2007.
In 2003, the Company granted 940,000 stock options pursuant to the 1997 Stock Option Plan.Such stock options, which were granted at an exercise price equal to the fair market value of thecommon stock at the date of grant, generally vest and become exercisable ratably after each of thefirst, second, third and fourth years following the date of grant and expire ten years after the date ofgrant.
In June 2004 and August 2004, the Company granted 140,000 and 100,000 stock options,respectively, pursuant to the 1997 Stock Option Plan. These stock options were granted at anexercise price equal to the fair market value of the common stock at the date of grant and expireten years after the date of grant. The stock options granted in June 2004 vested and becameexercisable ratably after each of the first and second years following the date of grant pursuant tothe terms of an employment agreement. The stock options granted in August 2004 vest and becomeexercisable ratably after each of the first, second, third and fourth years following the date of grant.
In 2005, the Company granted 136,500 stock options pursuant to the 1997 Stock Option Plan.These stock options, which were granted at an exercise price equal to the fair market value of thecommon stock at the date of grant, vested on June 30, 2006 pursuant to the terms of anemployment agreement and expire ten years after the date of grant.
Included in the Company’s stock compensation expense for the year ended December 31, 2006is the cost related to the unvested portion of stock options granted in 2001 and from 2003 to 2005.
79

The stock options granted before 2001 and those granted in 2002 were fully vested as of thebeginning of 2006. No stock options were granted in 2006.
Changes in the number of stock options outstanding during the year ended December 31, 2006were as follows (shares in thousands):
Options OutstandingWeighted Average
Exercise Price
Balance at January 1, 2006 . . . . . . . . . . . . . . . . . . . . . . . . . . . . . . 6,172 $16.51Options canceled . . . . . . . . . . . . . . . . . . . . . . . . . . . . . . . . . . . . . . . . (4) $25.84Options expired . . . . . . . . . . . . . . . . . . . . . . . . . . . . . . . . . . . . . . . . . (2) $14.75Options exercised. . . . . . . . . . . . . . . . . . . . . . . . . . . . . . . . . . . . . . . . (3,947) $17.01
Balance at December 31, 2006 . . . . . . . . . . . . . . . . . . . . . . . . . . 2,219 $15.65
Options Exercisable at December 31, 2006 . . . . . . . . . . . . . . 1,968 $16.36
The total intrinsic value for stock options exercised during 2006, 2005 and 2004 wasapproximately $38.4 million, $4.2 million and $4.1 million, respectively. The weighted-average grantdate fair value for the stock options granted in 2005 and 2004 was $6.03 and $6.84, respectively.
The Company expects its remaining unvested stock options to vest.
The fair value of stock options granted in 2005 and 2004 was estimated on the date of grantusing a Black-Scholes option valuation model that uses the assumptions noted in the following table.The risk-free rate is based on the comparable U.S. Treasury yield curve in effect at the time ofgrant. The expected life (estimated period of time outstanding) of the 2005 and 2004 grants wasestimated using historical exercise behavior taking into consideration the shorter-than-normal vestingperiod. Expected volatility was based on historical volatility for a period approximately equal to thestock option’s expected life. No dividend yield was factored into the Black-Scholes valuation for thestock options granted in 2005 and 2004 due to the fact that the Company had not declared adividend during the period 1999 to August 1, 2006.
2005 2004
Dividend yield . . . . . . . . . . . . . . . . . . . . . . . . . . . . . . . . . . . . . . . . . . . . . . . . . . . . . . . . . — —Expected volatility . . . . . . . . . . . . . . . . . . . . . . . . . . . . . . . . . . . . . . . . . . . . . . . . . . . . . 44.0% 47.9%Risk-free rate of return . . . . . . . . . . . . . . . . . . . . . . . . . . . . . . . . . . . . . . . . . . . . . . . . 3.9% 3.8%Expected life . . . . . . . . . . . . . . . . . . . . . . . . . . . . . . . . . . . . . . . . . . . . . . . . . . . . . . . . . . 4.5 years 4.5 years
The following table summarizes additional information about stock options outstanding as ofDecember 31, 2006 (shares and aggregate intrinsic value in thousands):
Number ofOptions
Weighted AverageRemaining
Contractual TermAggregate
Intrinsic Value
Options Outstanding. . . . . . . . . . . . . . . . . . . . . . . . . . . . . . 2,219 4.5 years $34,077Options Exercisable . . . . . . . . . . . . . . . . . . . . . . . . . . . . . . 1,968 4.3 years $28,850
For the year ended December 31, 2006, the amount of cash received from the exercise of stockoptions was approximately $67 million and the related tax benefit was $12 million.
Review of Stock Option Granting Practices—In June through November 2006, at the request ofthe Company’s Chief Executive Officer, outside legal counsel conducted a review of the Company’sstock option granting practices from 1995 through the present to determine whether any backdatingof stock options had occurred. This request was not made because of any knowledge or belief thatthere were any improprieties in the Company’s stock option granting practices, but because of thepublicity that had been given to this subject in relation to other companies. Counsel concluded andmanagement concurred that there was no evidence of intentional wrongdoing by any of theCompany’s Named Executive Officers (as defined by the SEC) or by any other director or employeeof the Company. However, it was concluded that, in a number of instances in 2002 and in prioryears, the Company had used an incorrect measurement date under Accounting Principles BoardOpinion No. 25, “Accounting for Stock Options” (“Opinion 25”), in accounting for certain of itsstock option grants because on the date of such grants, the number of shares that particular
80

individuals were entitled to receive was not finalized or the number of options allocated to certainrecipients was changed after the award approval date. Based on the results of counsel’s review,management concluded that the measurement dates for these awards should be revised.
The Company has determined that from the first quarter of 1996 through 2004, it had certainunrecorded non-cash stock compensation charges associated with its stock option plans. The amountof aggregate unrecorded non-cash stock compensation expense, which the Company should haverecorded in prior periods as a component of Salaries and Related Costs, is approximately $6 millionpre-tax and approximately $4 million after-tax. The Company determined, however, that the chargesfrom 1996 through 2004 were not material to its consolidated financial statements in any of theperiods to which such charges related.
Management has, however, concluded that the aggregate amount of unrecorded stockcompensation expense related to these stock options would be material, if recorded, to the fourthquarter of 2006. As a result, the Company has restated its financial statements for prior periods andrecorded an adjustment of approximately $3.8 million to Retained Earnings and Additional Paid-inCapital as of January 1, 2004, which is reflected in the accompanying Consolidated Statements ofChanges in Shareholders’ Equity. This adjustment represents the cumulative effect on an after taxbasis of the adjustment relating to the non-cash stock compensation charges discussed above relatedto years 1999 to 2003. The impact of these unrecorded amounts is presented in the chart below. Theimpact of the adjustments related to 2004 and years prior to 1999 is inconsequential. In addition,there was no impact on total cash flows from operating, investing or financing activities within theConsolidated Statements of Cash Flows for any of the years presented nor was there any impact onany interim periods within 2005 or 2006.
Year Ended December 31 1999 2000 2001 2002 2003 Total
(Thousands of dollars)
Stock compensation adjustment, pre-tax. . . . . . . . . . . . . $1,584 $1,924 $1,376 $776 $282 $5,942Tax effect . . . . . . . . . . . . . . . . . . . . . . . . . . . . . . . . . . . . . . . . . . . 586 608 590 279 90 2,153
Stock compensation adjustment,net of tax effect. . . . . . . . . . . . . . . . . . . . . . . . . . . . . . . . . . . $ 998 $1,316 $ 786 $497 $192 $3,789*
* Adjustment to December 31, 2004 beginning retained earnings.
Restricted Stock—In February 2003, the Compensation Committee approved the adoption of theRestricted Stock Plan, effective May 1, 2003. The Restricted Stock Plan was approved by a vote ofshareholders on April 29, 2003. The Restricted Stock Plan was amended on November 7, 2005 toconform the plan to the Company’s capital structure following completion of the recapitalizationtransaction described in Note U. The purpose of the Restricted Stock Plan is to enable theCompany to retain valued employees and to continue to attract the finest executives.
The Restricted Stock Plan provides for the issuance of restricted shares of common stock toeligible employees, as determined by the Compensation Committee. In making such selections, theCompensation Committee may take into account the nature of the services rendered by suchemployees, their present and potential contributions to the Company’s success, and such otherfactors as the Compensation Committee in its discretion shall deem relevant.
Restricted stock shares granted pursuant to the Restricted Stock Plan generally vest ratablyafter each of the first, second, third and fourth years following the date of grant; however, sharesissued in connection with the Sotheby’s Holdings, Inc. Executive Bonus Plan (the “EBP”) vestratably over a three-year period and restricted shares issued pursuant to certain employmentarrangements vest over three and five-year periods, subject to the satisfaction of certain performanceor market-based criteria (as discussed in more detail below), as well as continued employmentduring the vesting periods. Prior to vesting, participants have voting rights and receive dividends, ifany, but the shares may not be sold, assigned, transferred, pledged or otherwise encumbered. OnMay 8, 2006, the Company’s shareholders approved an amendment and restatement of theRestricted Stock Plan whereby the maximum amount of restricted stock that may be issued underthe Restricted Stock Plan was increased by 4.5 million shares to 6.5 million shares. As ofDecember 31, 2006, the maximum amount of restricted stock which may be issued from the
81

Company’s authorized but unissued or reacquired shares of common stock was 6.5 million shares, ofwhich 3.9 million shares remained available for future grants.
Also, in February 2003, the Compensation Committee approved an exchange offer of cash orrestricted stock for certain stock options held by eligible employees under the 1997 Stock OptionPlan (the “Exchange Offer”). The Exchange Offer was tendered during the first half of 2004. As aresult of the Exchange Offer, approximately 5.6 million stock options were cancelled and 1.1 millionshares of restricted stock were issued. The restricted shares were issued upon acceptance of theExchange Offer at the closing market price of the Company’s common stock on the dates of grant.For the years ended December 31, 2006, 2005 and 2004, the Company recognized stockcompensation expense of $2.5 million, $4.6 million and $5.5 million related to the Exchange Offer,respectively. The cash payment made in conjunction with the Exchange Offer was approximately$2.2 million and was expensed in full upon acceptance of the offer on March 31, 2004.
In addition to restricted stock issued in conjunction with the Exchange Offer, the Companyissued 375,697 shares and 120,000 shares of restricted stock with fair values of $6.2 million and $1.6million during 2005 and 2004, respectively. For the years ended December 31, 2006, 2005 and 2004,the Company recognized compensation expense of $2.5 million, $3.7 million and $1.1 million,respectively, related to these restricted stock grants. A small portion of these restricted shares weregranted pursuant to a three-year employment agreement and vested on June 30, 2006.
In February 2005, the Compensation Committee approved the adoption of the EBP, effectiveretroactively to January 1, 2005. The EBP was approved by a vote of shareholders on May 4, 2005.The EBP provides for the issuance of restricted stock, generally governed by the Restricted StockPlan, and cash awards based on satisfaction of objective performance criteria set by theCompensation Committee. Restricted shares issued pursuant to the EBP vest ratably after each ofthe first, second and third years following the date of grant. In February 2006, the CompensationCommittee approved the issuance of 201,621 shares of restricted stock with a fair value of $4.1million pursuant to the EBP. For the year ended December 31, 2006, the Company recognizedcompensation expense of $2.3 million related to this restricted stock grant.
On April 1, 2006, in conjunction with his employment arrangement and in an effort toencourage and reward the growth of shareholder value, the Company agreed to grant William F.Ruprecht, the Company’s President and Chief Executive Officer, a one time award of 300,000 sharesof restricted stock that will only vest and create value for Mr. Ruprecht at the end of the third andfifth years of his employment arrangement, and only if certain objective performance or market-based criteria are satisfied. These criteria are based on either a specified compound increase inshareholder value as measured by stock price and dividends, if any, or a specified compoundcumulative increase in the Company’s net income. Additionally, as he had in the past three yearsunder his previous employment agreement, Mr. Ruprecht received a 2006 equity award of restrictedstock. This award of 78,785 restricted shares, which was received on March 31, 2006, had a fairmarket value equal to $2.1 million on the date of grant and will vest in equal annual installmentsover four years. Mr. Ruprecht is no longer eligible to participate in the EBP, but instead, beginningin 2007, will be entitled to a restricted stock award in each year, subject to agreed annual minimum($1.4 million) and maximum ($2.2 million) levels, the value of which will be determined largelybased on the extent to which the performance criteria for the EBP have been satisfied. TheCompany recognized stock compensation expense of $3.8 million in 2006 related to Mr. Ruprecht’semployment arrangement.
Pursuant to certain employment arrangements agreed to in the third quarter of 2006 withcertain senior executives, the Company granted 427,531 shares of restricted stock that will only vestand create value for the grantees at the end of the third and fifth years of the employmentarrangements, and only if certain objective performance or market-based criteria are satisfied. Thesecriteria are based on either a specified compound increase in shareholder value as measured bystock price and dividends, if any, or a specified compound cumulative increase in the Company’s netincome. The Company recognized compensation expense of $1.6 million in 2006 related to this grantof Restricted Stock.
82

In addition to the grants discussed above, the Company also issued 258,818 shares of restrictedstock in 2006 with a fair value of $6.6 million that will vest ratably after each of the first, second,third and fourth years following the date of grant. The Company recognized compensation expenseof $1.7 million in 2006 related to these grants.
In February 2007, the Compensation Committee approved the issuance of the followingrestricted stock grants:
• 151,955 shares with a fair value of $5.8 million pursuant to the EBP. Such shares will vestratably after each of the first, second and third years following the date of grant.
• 57,277 shares with a fair value of $2.2 million to Mr. Ruprecht as part of his employmentarrangement and 19,135 shares with a fair value of $0.7 million related to other executiveemployment arrangements. Such shares will vest ratably after each of the first, second, thirdand fourth years following the date of grant.
• 469,711 shares awarded at the discretion of the Compensation Committee with a fair value of$18.2 million. These shares generally will vest ratably after each of the first, second, third and,fourth years following the date of grant.
Changes in the number of outstanding restricted stock shares during the year endedDecember 31, 2006 were as follows (shares in thousands):
RestrictedShares
Weighted AverageGrant DateFair Value
Balance at January 1, 2006 . . . . . . . . . . . . . . . . . . . . . . . . . . . . . 1,356 $13.73Restricted shares granted . . . . . . . . . . . . . . . . . . . . . . . . . . . . . . . 1,267 $27.20Restricted shares vested . . . . . . . . . . . . . . . . . . . . . . . . . . . . . . . . (529) $12.97Restricted shares canceled . . . . . . . . . . . . . . . . . . . . . . . . . . . . . . (13) $20.21
Balance at December 31, 2006. . . . . . . . . . . . . . . . . . . . . . . . . . 2,081 $21.96
The total fair value of restricted stock shares that vested during 2006, 2005 and 2004 was $14.3million, $5.6 million and $0.6 million, respectively, based on the closing stock price on the dates theshares vested.
The Company expects its remaining unvested shares of restricted stock to vest.
Under the provisions of SFAS No. 123R, the recognition of deferred compensation, a contra-equity account representing the amount of unrecognized restricted stock expense that is reduced asstock compensation expense is recognized at the date restricted stock is granted, is no longerrequired. Therefore, in the first quarter of 2006, the amount that had been in DeferredCompensation was eliminated against Additional Paid-in Capital in the Company’s ConsolidatedBalance Sheets. As of December 31, 2006, unrecognized compensation expense related to theunvested portion of the Company’s stock-based compensation was approximately $29.1 million and isexpected to be recognized over a weighted-average period of approximately 3.1 years.
Note N—Pension Arrangements
Retirement Savings Plan—The Company has a defined contribution plan for U.S. employees whohave completed three consecutive months of employment (the “Retirement Savings Plan”). Prior toJanuary 1, 2005, the Company contributed a standard amount equal to 2% of each participant’seligible compensation to the Retirement Savings Plan. Effective January 1, 2005, the RetirementSavings Plan was amended to replace the standard 2% contribution with a discretionary annualCompany contribution that varies as a percentage of each participant’s eligible compensationdepending on the Company’s profitability and subject to the maximum amount allowable underInternal Revenue Service (“IRS”) regulations. For the years ended December 31, 2006 and 2005, theCompany’s discretionary contribution to the Retirement Savings Plan was 4% and 3% of eachparticipant’s eligible compensation, respectively.
Additionally, prior to January 1, 2005, participants could elect to contribute between 2% and12% of their eligible compensation, up to the maximum amount allowable under IRS regulations, on
83

a pre-tax basis. Effective January 1, 2005, participants may elect to contribute between 2% and 20%of their eligible compensation, up to the maximum amount allowable under IRS regulations, on apre-tax basis. Employee savings have been and will continue to be matched by a Companycontribution of up to an additional 6% of each participant’s eligible compensation.
Effective January 1, 2006, newly hired employees who have completed three consecutive monthsof employment are automatically enrolled in the Retirement Savings Plan at an amount equal to 3%of eligible compensation. An employee who is automatically enrolled is permitted to op-out of theautomatic enrollment or to change the level of employee contributions according to the provisionsdescribed above.
For the years ended December 31, 2006, 2005 and 2004, pension expense recorded withinSalaries and Related Costs for the Retirement Savings Plan, net of the impact of forfeitures, was asfollows:
Year Ended December 31 2006 2005 2004
(Thousands of dollars)
Continuing operations . . . . . . . . . . . . . . . . . . . . . . . . . . . . . . . . . . . . . . . . . . . . . . $4,596 $3,459 $2,808Discontinued operations (see Note T) . . . . . . . . . . . . . . . . . . . . . . . . . . . . . . — — 56
Total . . . . . . . . . . . . . . . . . . . . . . . . . . . . . . . . . . . . . . . . . . . . . . . . . . . . . . . . . . . $4,596 $3,459 $2,864
Benefit Equalization Plan—Through December 31, 2006, the Company had an unfundeddeferred compensation plan, the Sotheby’s, Inc. 2005 Benefit Equalization Plan (the “2005 BEP”),which was available to certain officers of the Company for whom contributions to the RetirementSavings Plan were limited by IRS regulations. Such officers could enter into agreements pursuant towhich their salaries would be reduced and the Company would maintain accounts on their behalf inthe amount of the difference between the deferral election made in the participant’s salary reductionagreement and the aggregate amount of contributions actually made by the participant under theRetirement Savings Plan. Employees could elect to defer up to 12% of their eligible compensationand employee deferrals were matched by a Company contribution of up to 6% of the participant’seligible compensation. Additionally, there was a discretionary annual Company contribution forthose participants for whom discretionary contributions to the Retirement Savings Plan were limitedby IRS regulations. Contributions to the 2005 BEP earned interest at a rate equal to 3.3% abovethe 10-year U.S. Treasury Bond rate.
The establishment of the 2005 BEP was approved by the Company’s Compensation Committeein December 2004. The 2005 BEP, which superseded an existing Benefit Equalization Plan (the“BEP”) on January 1, 2005, was established solely to comply with provisions of the AJCA, whichplaced new restrictions on deferred compensation arrangements, including limiting the ability of bothcompanies and individuals to revise deferral elections or to accelerate distributions from a deferredcompensation plan. With the exception of these changes, the 2005 BEP remained the same as thepreviously existing BEP, which was deemed frozen with no deferrals or employer contributionspermitted after December 31, 2004.
The total combined unfunded liability of the 2005 BEP and the BEP was $24.2 million and$18.6 million as of December 31, 2006 and 2005, respectively, and is included within OtherLiabilities in the Consolidated Balance Sheets.
For the years ended December 31, 2006, 2005 and 2004, compensation expense recorded withinSalaries and Related Costs for the 2005 BEP and the BEP (for 2004) was $1.4 million, $1.1 millionand $0.6 million, respectively.
On December 7, 2006, the Company adopted the Sotheby’s Deferred Compensation Plan (the“Deferred Compensation Plan”), effective January 1, 2007. The Deferred Compensation Planreplaced the Company’s 2005 BEP with a plan that incorporates best practice features ofcontemporary non-qualified plans. Participants in the Plan are able to defer a greater proportion ofeligible compensation as compared to the 2005 BEP and are provided with more flexible distributionoptions. Specifically, the Deferred Compensation Plan allows eligible employees to defer up to 80%of base salary and up to 100% of incentive compensation; non-employee Directors may defer up to100% of the cash portion of Directors’ fees. As with the 2005 BEP, the Company matching and
84
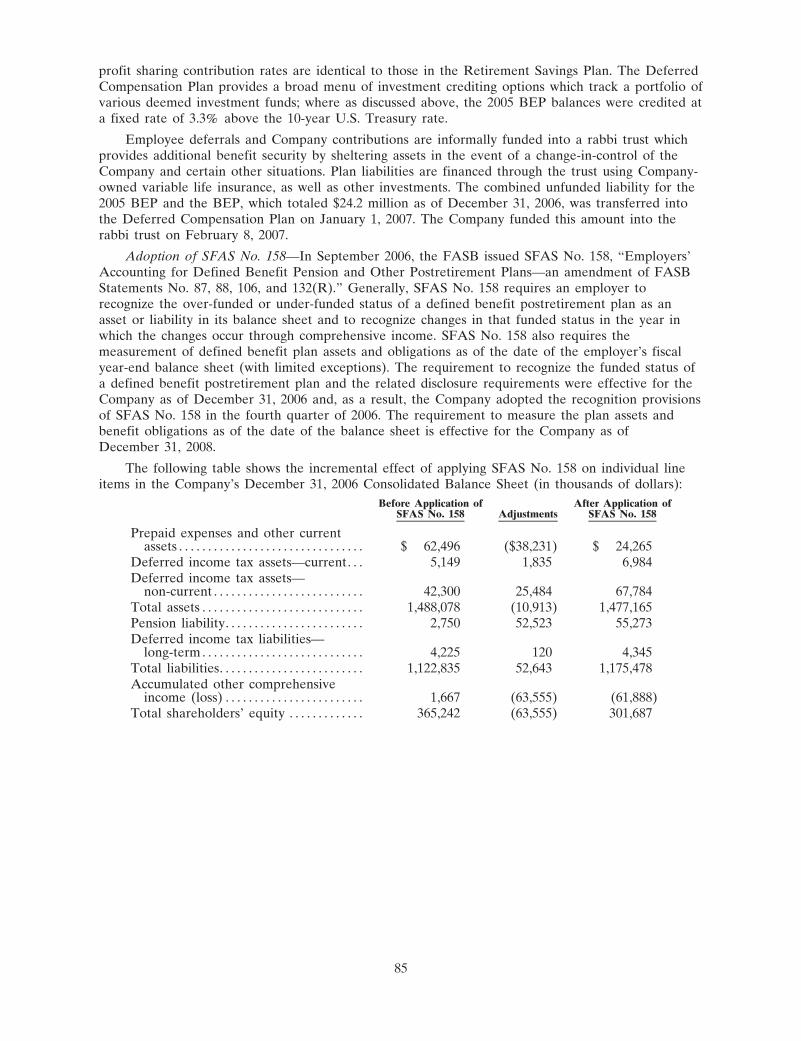
profit sharing contribution rates are identical to those in the Retirement Savings Plan. The DeferredCompensation Plan provides a broad menu of investment crediting options which track a portfolio ofvarious deemed investment funds; where as discussed above, the 2005 BEP balances were credited ata fixed rate of 3.3% above the 10-year U.S. Treasury rate.
Employee deferrals and Company contributions are informally funded into a rabbi trust whichprovides additional benefit security by sheltering assets in the event of a change-in-control of theCompany and certain other situations. Plan liabilities are financed through the trust using Company-owned variable life insurance, as well as other investments. The combined unfunded liability for the2005 BEP and the BEP, which totaled $24.2 million as of December 31, 2006, was transferred intothe Deferred Compensation Plan on January 1, 2007. The Company funded this amount into therabbi trust on February 8, 2007.
Adoption of SFAS No. 158—In September 2006, the FASB issued SFAS No. 158, “Employers’Accounting for Defined Benefit Pension and Other Postretirement Plans—an amendment of FASBStatements No. 87, 88, 106, and 132(R).” Generally, SFAS No. 158 requires an employer torecognize the over-funded or under-funded status of a defined benefit postretirement plan as anasset or liability in its balance sheet and to recognize changes in that funded status in the year inwhich the changes occur through comprehensive income. SFAS No. 158 also requires themeasurement of defined benefit plan assets and obligations as of the date of the employer’s fiscalyear-end balance sheet (with limited exceptions). The requirement to recognize the funded status ofa defined benefit postretirement plan and the related disclosure requirements were effective for theCompany as of December 31, 2006 and, as a result, the Company adopted the recognition provisionsof SFAS No. 158 in the fourth quarter of 2006. The requirement to measure the plan assets andbenefit obligations as of the date of the balance sheet is effective for the Company as ofDecember 31, 2008.
The following table shows the incremental effect of applying SFAS No. 158 on individual lineitems in the Company’s December 31, 2006 Consolidated Balance Sheet (in thousands of dollars):
Before Application ofSFAS No. 158 Adjustments
After Application ofSFAS No. 158
Prepaid expenses and other currentassets . . . . . . . . . . . . . . . . . . . . . . . . . . . . . . . . $ 62,496 ($38,231) $ 24,265
Deferred income tax assets—current. . . 5,149 1,835 6,984Deferred income tax assets—
non-current . . . . . . . . . . . . . . . . . . . . . . . . . . 42,300 25,484 67,784Total assets . . . . . . . . . . . . . . . . . . . . . . . . . . . . 1,488,078 (10,913) 1,477,165Pension liability. . . . . . . . . . . . . . . . . . . . . . . . 2,750 52,523 55,273Deferred income tax liabilities—
long-term . . . . . . . . . . . . . . . . . . . . . . . . . . . . 4,225 120 4,345Total liabilities. . . . . . . . . . . . . . . . . . . . . . . . . 1,122,835 52,643 1,175,478Accumulated other comprehensive
income (loss) . . . . . . . . . . . . . . . . . . . . . . . . 1,667 (63,555) (61,888)Total shareholders’ equity . . . . . . . . . . . . . 365,242 (63,555) 301,687
85

Defined Benefit Plan (U.K.)—The Company sponsors a defined benefit pension plan coveringmost U.K. employees (the “U.K. Pension Plan”). Effective April 1, 2004, the U.K. Pension Plan wasclosed to new employees. From that date, a defined contribution plan was made available to newemployees in the U.K. The Company uses a September 30 measurement date for the U.K. PensionPlan.
Benefit Obligation
The table below details the change in the benefit obligation, the change in the fair value of planassets, the funded status and the amounts recognized in the Consolidated Balance Sheets as ofDecember 31, 2006 and 2005 related to the U.K. Pension Plan:
December 31 2006 2005
(Thousands of dollars)
Reconciliation of benefit obligationBenefit obligation at beginning of year . . . . . . . . . . . . . . . . . . . . . . . . . . . . . . . . . $248,864 $247,937Service cost . . . . . . . . . . . . . . . . . . . . . . . . . . . . . . . . . . . . . . . . . . . . . . . . . . . . . . . . . . . . . 6,720 6,275Interest cost. . . . . . . . . . . . . . . . . . . . . . . . . . . . . . . . . . . . . . . . . . . . . . . . . . . . . . . . . . . . . 12,866 12,525Contributions by plan participants . . . . . . . . . . . . . . . . . . . . . . . . . . . . . . . . . . . . . . 998 1,101Actuarial loss . . . . . . . . . . . . . . . . . . . . . . . . . . . . . . . . . . . . . . . . . . . . . . . . . . . . . . . . . . . 41,202 11,917Benefits paid. . . . . . . . . . . . . . . . . . . . . . . . . . . . . . . . . . . . . . . . . . . . . . . . . . . . . . . . . . . . (4,384) (3,810)Special termination benefits . . . . . . . . . . . . . . . . . . . . . . . . . . . . . . . . . . . . . . . . . . . . . — 7Foreign currency exchange rate changes . . . . . . . . . . . . . . . . . . . . . . . . . . . . . . . . 37,738 (27,088)
Benefit obligation at end of year . . . . . . . . . . . . . . . . . . . . . . . . . . . . . . . . . . . 344,004 248,864
Reconciliation of plan assetsFair value of plan assets at beginning of year. . . . . . . . . . . . . . . . . . . . . . . . . . . 231,882 197,960Actual return on plan assets . . . . . . . . . . . . . . . . . . . . . . . . . . . . . . . . . . . . . . . . . . . . 26,484 42,809Employer contributions . . . . . . . . . . . . . . . . . . . . . . . . . . . . . . . . . . . . . . . . . . . . . . . . . 2,851 17,699Contributions by plan participants . . . . . . . . . . . . . . . . . . . . . . . . . . . . . . . . . . . . . . 998 1,101Benefits paid. . . . . . . . . . . . . . . . . . . . . . . . . . . . . . . . . . . . . . . . . . . . . . . . . . . . . . . . . . . . (4,384) (3,810)Foreign currency exchange rate changes . . . . . . . . . . . . . . . . . . . . . . . . . . . . . . . . 33,343 (23,877)
Fair value of plan assets at end of year . . . . . . . . . . . . . . . . . . . . . . . . . . . . 291,174 231,882
Funded StatusFunded status at end of year. . . . . . . . . . . . . . . . . . . . . . . . . . . . . . . . . . . . . . . . . . . . (52,830) (16,982)Unrecognized prior service cost . . . . . . . . . . . . . . . . . . . . . . . . . . . . . . . . . . . . . . . . . N/A* 373Unrecognized net actuarial loss . . . . . . . . . . . . . . . . . . . . . . . . . . . . . . . . . . . . . . . . . N/A* 54,048
Net pension (liability) asset recognized . . . . . . . . . . . . . . . . . . . . . . . . . . . . . $(52,830) $ 37,439
* As discussed above, the Company adopted SFAS No. 158 in the fourth quarter of 2006. Inconjunction with the adoption of SFAS No. 158, the December 31, 2006 Consolidated BalanceSheet was adjusted so that unrecognized actuarial losses and unrecognized prior service costswere recognized as an adjustment to the ending balance of accumulated comprehensiveincome, net of taxes.
The valuation of the funded status includes an allowance for discretionary benefit increases tothe extent that these are expected to be awarded in the future.
The accumulated benefit obligation for the U.K. Pension Plan was $252.4 million and $188.4million as of December 31, 2006 and 2005, respectively.
86

Components of Net Pension Cost
For the years ended December 31, 2006, 2005 and 2004, the components of net pension costrelated to the U.K. Pension Plan were:
Year Ended December 31 2006 2005 2004
(Thousands of dollars)
Service cost. . . . . . . . . . . . . . . . . . . . . . . . . . . . . . . . . . . . . . . . . . . . . . . . . . . $ 6,720 $ 6,275 $ 6,705Interest cost . . . . . . . . . . . . . . . . . . . . . . . . . . . . . . . . . . . . . . . . . . . . . . . . . . 12,866 12,525 11,240Expected return on plan assets . . . . . . . . . . . . . . . . . . . . . . . . . . . . . . . (16,587) (16,719) (16,559)Amortization of prior service cost . . . . . . . . . . . . . . . . . . . . . . . . . . . . 269 266 267Amortization of net loss. . . . . . . . . . . . . . . . . . . . . . . . . . . . . . . . . . . . . . 3,417 2,084 1,055
Sub-total . . . . . . . . . . . . . . . . . . . . . . . . . . . . . . . . . . . . . . . . . . . . . . . . . 6,685 4,431 2,708Special termination benefits . . . . . . . . . . . . . . . . . . . . . . . . . . . . . . . . . . — 7 49
Net pension cost . . . . . . . . . . . . . . . . . . . . . . . . . . . . . . . . . . . . . . . . . $ 6,685 $ 4,438 $ 2,757
Amounts Recognized in Accumulated Other Comprehensive Loss
The table below details the amounts recognized in accumulated other comprehensive loss, net oftaxes, related to the U.K. Pension Plan for the year ended December 31, 2006:
Year Ended December 31 2006 2005
(Thousands of dollars)
Net loss for period ** . . . . . . . . . . . . . . . . . . . . . . . . . . . . . . . . . . . . . . . . . . . . . . . . . . . ($21,968) N/AAmortization of prior service cost . . . . . . . . . . . . . . . . . . . . . . . . . . . . . . . . . . . . . . . 188 N/AAmortization of net loss . . . . . . . . . . . . . . . . . . . . . . . . . . . . . . . . . . . . . . . . . . . . . . . . . 2,392 N/A
Total . . . . . . . . . . . . . . . . . . . . . . . . . . . . . . . . . . . . . . . . . . . . . . . . . . . . . . . . . . . . . . . . ($19,388) N/A
** Net loss is the change in the value of either the benefit obligation or plan assets resultingfrom experience different from that assumed or from a change in an actuarial assumption.
Amounts Included in Accumulated Other Comprehensive Loss
The table below details the amounts included in accumulated other comprehensive loss, net oftaxes, related to the U.K. Pension Plan that have not yet been recognized as components of netpension cost as of December 31, 2006:
December 31 2006 2005
(Thousands of dollars)
Net loss . . . . . . . . . . . . . . . . . . . . . . . . . . . . . . . . . . . . . . . . . . . . . . . . . . . . . . . . . . . . . . . . . . $63,647 N/APrior service cost . . . . . . . . . . . . . . . . . . . . . . . . . . . . . . . . . . . . . . . . . . . . . . . . . . . . . . . . . 96 N/A
Total. . . . . . . . . . . . . . . . . . . . . . . . . . . . . . . . . . . . . . . . . . . . . . . . . . . . . . . . . . . . . . . . . $63,743 N/A
The net loss and prior service costs are being recognized over the expected remaining servicelives of the active employees in the U.K. Pension Plan. As of September 30, 2006, this wasestimated to be approximately 14 years.
The table below details the amounts in accumulated other comprehensive loss expected to berecognized as components of net pension cost, net of taxes, for the year ended December 31, 2007(in thousands of dollars):
Net loss . . . . . . . . . . . . . . . . . . . . . . . . . . . . . . . . . . . . . . . . . . . . . . . . . . . . . . . . . . . . . . . . . . . . . . . . . . . . . . $4,221Prior service cost . . . . . . . . . . . . . . . . . . . . . . . . . . . . . . . . . . . . . . . . . . . . . . . . . . . . . . . . . . . . . . . . . . . . . 62
Total . . . . . . . . . . . . . . . . . . . . . . . . . . . . . . . . . . . . . . . . . . . . . . . . . . . . . . . . . . . . . . . . . . . . . . . . . . . . . $4,283
87

Assumptions
The following assumptions were used in determining the benefit obligation and net pension costrelated to the U.K. Pension Plan:
Benefit Obligation 2006 2005
Weighted average discount rate . . . . . . . . . . . . . . . . . . . . . . . . . . . . . . . . . . . . . . . . . . . 4.80% 4.90%Weighted average rate of compensation increase . . . . . . . . . . . . . . . . . . . . . . . . . . 4.75% 4.50%
Net Pension Cost 2006 2005 2004
Weighted average discount rate . . . . . . . . . . . . . . . . . . . . . . . . . . . . . . . . . . . . . . . . . . . 4.90% 5.40% 5.20%Weighted average rate of compensation increase . . . . . . . . . . . . . . . . . . . . . . . . . . 4.50% 4.75% 4.25%Weighted average expected long-term rate of return on plan assets . . . . . . . 7.25% 7.75% 8.00%
The expected long-term rate of return on plan assets is based on expected future appreciation,as well as dividend and interest yields currently available on equity and bond markets as of themeasurement date and weighted according to the composition of invested assets as of that date.
Plan Assets
As of September 30, 2006 and 2005, the weighted average asset allocations for the U.K. PensionPlan, by category, were as follows:
September 30 2006 2005
Equity securities . . . . . . . . . . . . . . . . . . . . . . . . . . . . . . . . . . . . . . . . . . . . . . . . . . . . . . . . . . 66% 67%Debt securities. . . . . . . . . . . . . . . . . . . . . . . . . . . . . . . . . . . . . . . . . . . . . . . . . . . . . . . . . . . . 28% 27%Real estate . . . . . . . . . . . . . . . . . . . . . . . . . . . . . . . . . . . . . . . . . . . . . . . . . . . . . . . . . . . . . . . 3% 3%Other . . . . . . . . . . . . . . . . . . . . . . . . . . . . . . . . . . . . . . . . . . . . . . . . . . . . . . . . . . . . . . . . . . . . . 3% 3%
The investment policy for the U.K. Pension Plan is established by its trustees (the “Trustees”)in consultation with the management of the Company. The Trustees’ investment objective is tomaximize the return on assets while controlling the level of risk so as to ensure that sufficient assetsare available to pay participants’ benefits as and when they arise. The Trustees have agreed that adiversified portfolio of assets with a relatively high concentration of equity securities is appropriate.In order to avoid an undue concentration of risk, a diverse spread of assets is held. Thediversification is both within and across asset categories. In setting specific asset allocation targets,the Trustees take expert advice as required from professional investment advisors. Additionally, theTrustees require that the majority of the assets be realizable at short notice. The Trustees’ currentinvestment strategy includes target allocation percentages of approximately 68% for equity securitiesand approximately 32% for debt securities and other assets. These target allocation percentages arespread across different categories within each asset class and permit actual allocation percentages tofall within a reasonable range of these targets.
The investment managers for the U.K. Pension Plan have full discretion in making investmentdecisions, subject to broad guidelines established by the Trustees. It is the Trustees’ policy not toinvest in shares of the Company or any of its subsidiaries. The performance of the investmentmanagers is benchmarked against suitable indices.
Estimated Future Benefit Payments
The following benefit payments related to the U.K. Pension Plan, which reflect expected futureservice, as appropriate, are expected to be paid as follows (in thousands of dollars):
Benefit Payments
October 1, 2006 to September 30, 2007 $ 4,911October 1, 2007 to September 30, 2008 $ 5,996October 1, 2008 to September 30, 2009 $ 7,207October 1, 2009 to September 30, 2010 $ 7,134October 1, 2010 to September 30, 2011 $ 9,233October 1, 2011 to September 30, 2016 $52,987
88

Contributions
In 2006, the Company contributed $2.9 million to the U.K. Pension Plan, and expects tocontribute approximately $3.1 million in 2007.
Defined Benefit Plan (Germany)—The Company sponsors a defined benefit pension plan for itsemployees in Germany (the “German Pension Plan”). The Company uses a December 31stmeasurement date for the German Pension Plan. In the fourth quarter of 2006, the Companyadopted the recognition provisions of SFAS No. 158 for the German Pension Plan and, as a result,recognized net gains of $0.2 million in Other Comprehensive Income. These are the only amountsrelated to the German Pension Plan included in Accumulated Other Comprehensive Loss as ofDecember 31, 2006.
As of December 31, 2006 and 2005, the pension liability related to the German Pension Planrecorded in the Consolidated Balance Sheets was approximately $2.4 million and $2.3 million,respectively. For the years ended December 31, 2006 and 2005, net pension cost for the GermanPension Plan was $0.2 million and $0.9 million, respectively. Future benefit payments to the GermanPension Plan are expected to be approximately $50,000 annually for the years 2007 to 2011 andapproximately $0.5 million in the aggregate during the five years thereafter.
Note O—Commitments and Contingencies
Employment Arrangements—As of December 31, 2006, the Company had employmentarrangements with 8 employees, which expire at various points between August 2008 and June 2013.Such arrangements provide, among other benefits, for minimum salary levels and incentive bonuseswhich are payable only if specified Company and individual goals are attained. Additionally, certainof these arrangements provide for participation in the Company’s Executive Bonus Plan, annualequity grants, severance payments and continuation of benefits upon termination of employmentunder certain circumstances. The aggregate remaining commitment for salaries related to theseemployment arrangements, excluding incentive bonuses, any participation in the Company’sExecutive Bonus Plan and equity grants, was approximately $25.2 million as of December 31, 2006.
Lending Commitments—In certain situations, the Company enters into legally bindingarrangements to lend, primarily on a collateralized basis and subject to certain limitations andconditions, to potential consignors and other individuals who have collections of fine art or otherobjects. Unfunded commitments to extend additional credit were $15 million at December 31, 2006.
Legal Actions—The Company also becomes involved, from time to time, in various claims andlawsuits incidental to the ordinary course of its business. Management does not believe that theoutcome of any of these pending claims or proceedings will have a material adverse effect on theCompany’s business, results of operations, financial condition and/or liquidity.
Tax Contingencies—The Company is routinely under examination by taxing authorities incertain countries and states in which the Company has significant business operations. Suchexaminations challenge certain deductions and credits reported by the Company on its income taxreturns, as well as other tax matters. The major territories where the Company is undergoing suchexaminations are the U.S., the U.K. and France. In accordance with SFAS No. 109, “Accounting forIncome Taxes,” and SFAS No. 5, “Accounting for Contingencies,” the Company establishes reservesfor tax contingencies that reflect management’s best estimate given the Company’s history withsimilar matters and interpretation of current tax laws and regulations. As of December 31, 2006,total income tax contingencies reserved are approximately $7.8 million; of this amount,approximately $6.8 million was recorded in the fourth quarter of 2006 and is primarily related tocertain U.S. and international issues. Additionally the Company has a contingency reserve ofapproximately $2.2 million related to certain other state and local issues, of which approximately$1 million was recorded in the fourth quarter of 2006. (See Note B.)
Gain Contingencies—The Company owns land and a building at Billingshurst, West Sussex (the“Sussex Property”), which previously housed an auction salesroom. The Company has entered intoan agreement for the sale of vacated parts of the Sussex Property. The Company has receivedplanning permission for redevelopment of the land for sale; however, consummation of the sale is
89

conditional upon the completion of a statutory review period. If completed, the sale of the SussexProperty would result in a pre-tax gain in the range of approximately $4 million to $5 million.Management anticipates that the sale of the Sussex Property will be completed in March 2007.
(See Notes C, J, L and P for other commitments. See Notes C, P and Q for othercontingencies.)
Note P—Auction Guarantees
From time to time in the ordinary course of business, the Company will guarantee to consignorsa minimum price in connection with the sale of property at auction. The Company must performunder its auction guarantee in the event the property sells for less than the minimum price, in whichevent the Company must fund the difference between the sale price at auction and the amount ofthe auction guarantee. If the property does not sell, the amount of the auction guarantee must bepaid, but the Company has the right to recover such amount through future sale of the property. Incertain instances, the sale proceeds ultimately realized by the Company exceed the amount of anyprior losses recognized on the auction guarantee. Additionally, the Company is generally entitled toa share of the excess proceeds if the property under the auction guarantee sells above a minimumprice. In addition, the Company is obligated under the terms of certain auction guarantees toadvance a portion of the guaranteed amount prior to the auction. In certain situations, the Companyreduces its financial exposure under auction guarantees through auction commission sharingarrangements with partners. Partners may also assist the Company in valuing and marketing theproperty to be sold at auction.
As of December 31, 2006, the Company had outstanding auction guarantees totaling $116.5million, the property relating to which had a mid-estimate sales price (1) of $132.3 million. TheCompany’s financial exposure under these auction guarantees is reduced by $0.5 million as a resultof sharing arrangements with partners. Substantially all of the property related to such auctionguarantees is being offered at auctions in the first half of 2007. As of December 31, 2006, $36million of the guaranteed amount had been advanced by the Company and is recorded within NotesReceivable and Consignor Advances in the Consolidated Balance Sheet (see Note E). As ofDecember 31, 2006 and December 31, 2005, the carrying amount of the liability related to theCompany’s auction guarantees was approximately $1.5 million and $0.3 million, respectively, and wasreflected in the Consolidated Balance Sheets within Accounts Payable and Accrued Liabilities.
(1) The mid-estimate sales price is calculated as the average of the low and high pre-saleauction estimates for the property under the auction guarantee. Pre-sale estimates are notalways accurate predictions of auction sale results.
Note Q—Antitrust Related Matters
In April 1997, the DOJ began an investigation of certain art dealers and major auction houses,including the Company and its principal competitor, Christie’s International, PLC (“Christie’s”). TheCompany pled guilty to a violation of U.S. antitrust laws in connection with a conspiracy to fixauction commission rates charged to sellers in the U.S. and elsewhere. In February 2001, the U.S.District Court for the Southern District of New York imposed on the Company a fine of $45 millionpayable to the DOJ without interest over a period of five years. As a result, in the third quarter of2000, the Company recorded Settlement Liabilities of $34.1 million representing the present value ofthe fine payable. The $10.9 million discount on the fine payable was amortized to interest expenseover the five-year period during which the fine was paid. The final payment of $15 million owedunder the fine was paid by the Company on February 6, 2006 and the liability to the DOJ wasextinguished.
In conjunction with the settlement of certain civil litigation related to the investigation by theDOJ, in May 2003, the Company issued to the class of plaintiffs vendor’s commission discountcertificates (“Discount Certificates”) with a face value of $62.5 million. The Discount Certificates arefully redeemable in connection with any auction conducted by the Company or Christie’s in the U.S.or in the U.K. and may be used to satisfy consignment charges involving vendor’s commission, riskof loss and/or catalogue illustration. The court determined that the $62.5 million face value of the
90
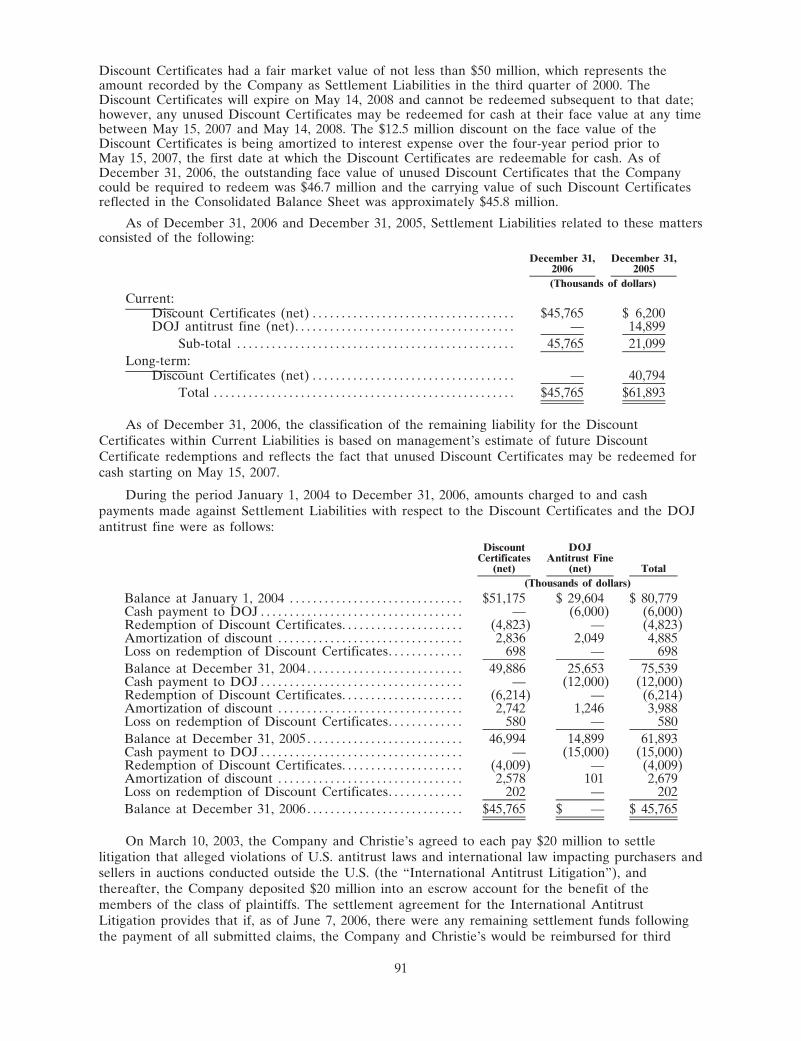
Discount Certificates had a fair market value of not less than $50 million, which represents theamount recorded by the Company as Settlement Liabilities in the third quarter of 2000. TheDiscount Certificates will expire on May 14, 2008 and cannot be redeemed subsequent to that date;however, any unused Discount Certificates may be redeemed for cash at their face value at any timebetween May 15, 2007 and May 14, 2008. The $12.5 million discount on the face value of theDiscount Certificates is being amortized to interest expense over the four-year period prior toMay 15, 2007, the first date at which the Discount Certificates are redeemable for cash. As ofDecember 31, 2006, the outstanding face value of unused Discount Certificates that the Companycould be required to redeem was $46.7 million and the carrying value of such Discount Certificatesreflected in the Consolidated Balance Sheet was approximately $45.8 million.
As of December 31, 2006 and December 31, 2005, Settlement Liabilities related to these mattersconsisted of the following:
December 31,2006
December 31,2005
(Thousands of dollars)
Current:Discount Certificates (net) . . . . . . . . . . . . . . . . . . . . . . . . . . . . . . . . . . . $45,765 $ 6,200DOJ antitrust fine (net). . . . . . . . . . . . . . . . . . . . . . . . . . . . . . . . . . . . . . — 14,899
Sub-total . . . . . . . . . . . . . . . . . . . . . . . . . . . . . . . . . . . . . . . . . . . . . . . . 45,765 21,099
Long-term:Discount Certificates (net) . . . . . . . . . . . . . . . . . . . . . . . . . . . . . . . . . . . — 40,794
Total . . . . . . . . . . . . . . . . . . . . . . . . . . . . . . . . . . . . . . . . . . . . . . . . . . . . $45,765 $61,893
As of December 31, 2006, the classification of the remaining liability for the DiscountCertificates within Current Liabilities is based on management’s estimate of future DiscountCertificate redemptions and reflects the fact that unused Discount Certificates may be redeemed forcash starting on May 15, 2007.
During the period January 1, 2004 to December 31, 2006, amounts charged to and cashpayments made against Settlement Liabilities with respect to the Discount Certificates and the DOJantitrust fine were as follows:
DiscountCertificates
(net)
DOJAntitrust Fine
(net) Total
(Thousands of dollars)
Balance at January 1, 2004 . . . . . . . . . . . . . . . . . . . . . . . . . . . . . . $51,175 $ 29,604 $ 80,779Cash payment to DOJ . . . . . . . . . . . . . . . . . . . . . . . . . . . . . . . . . . . — (6,000) (6,000)Redemption of Discount Certificates. . . . . . . . . . . . . . . . . . . . . (4,823) — (4,823)Amortization of discount . . . . . . . . . . . . . . . . . . . . . . . . . . . . . . . . 2,836 2,049 4,885Loss on redemption of Discount Certificates. . . . . . . . . . . . . 698 — 698
Balance at December 31, 2004 . . . . . . . . . . . . . . . . . . . . . . . . . . . 49,886 25,653 75,539Cash payment to DOJ . . . . . . . . . . . . . . . . . . . . . . . . . . . . . . . . . . . — (12,000) (12,000)Redemption of Discount Certificates. . . . . . . . . . . . . . . . . . . . . (6,214) — (6,214)Amortization of discount . . . . . . . . . . . . . . . . . . . . . . . . . . . . . . . . 2,742 1,246 3,988Loss on redemption of Discount Certificates. . . . . . . . . . . . . 580 — 580
Balance at December 31, 2005 . . . . . . . . . . . . . . . . . . . . . . . . . . . 46,994 14,899 61,893Cash payment to DOJ . . . . . . . . . . . . . . . . . . . . . . . . . . . . . . . . . . . — (15,000) (15,000)Redemption of Discount Certificates. . . . . . . . . . . . . . . . . . . . . (4,009) — (4,009)Amortization of discount . . . . . . . . . . . . . . . . . . . . . . . . . . . . . . . . 2,578 101 2,679Loss on redemption of Discount Certificates. . . . . . . . . . . . . 202 — 202
Balance at December 31, 2006 . . . . . . . . . . . . . . . . . . . . . . . . . . . $45,765 $ — $ 45,765
On March 10, 2003, the Company and Christie’s agreed to each pay $20 million to settlelitigation that alleged violations of U.S. antitrust laws and international law impacting purchasers andsellers in auctions conducted outside the U.S. (the “International Antitrust Litigation”), andthereafter, the Company deposited $20 million into an escrow account for the benefit of themembers of the class of plaintiffs. The settlement agreement for the International AntitrustLitigation provides that if, as of June 7, 2006, there were any remaining settlement funds followingthe payment of all submitted claims, the Company and Christie’s would be reimbursed for third
91

party administration costs incurred in distributing the settlement funds. In June 2006, it wasdetermined that sufficient settlement funds remained following the payment of all submitted claimsto reimburse the Company and Christie’s for third party administration costs incurred in distributingthe settlement funds. As a result, for the year ended December 31, 2006, the Company has recordeda $2.4 million benefit to General and Administrative Expenses, reflecting the recovery of such thirdparty administration costs incurred through December 31, 2006. The Company received thisreimbursement on January 29, 2007. (See Note B for information related to the original incomestatement classification of such expenses.)
In August 2006, a Canadian court approved the final settlement of the Canadian CompetitionBureau’s investigation regarding anticompetitive practices relating to vendor’s commissions chargedby the Company and Christie’s for auction services during the period 1993 to 2000. Under the civilsettlement, the Company and its Canadian subsidiary entered into a civil Consent Prohibition Orderrequiring them to: (i) comply with Canadian antitrust laws and continue antitrust compliance trainingfor five years, (ii) post a copy of the Order on the Company’s website for 120 days and notifyCanadian consignors about the Order and (iii) pay $0.7 million in reimbursement of the costs of theinvestigation. In the first half of 2006, the Company recorded a $0.7 million charge related to thesettlement of this matter within General and Administrative Expenses, which was paid in the thirdquarter of 2006.
Note R—Variable Interest Entity
The Company has concluded that an entity with whom its Finance segment has outstandingloans of approximately $3.5 million and to whom the Company provides management consultingservices meets the definition of a variable interest entity (“VIE”) under FIN 46, “Consolidation ofVariable Interest Entities,” as revised. As primary beneficiary of the VIE, the Company is requiredto consolidate the entity as part of the Dealer segment (see Note D).
The entity is an art gallery which is engaged in business as a broker/dealer in works of art. TheCompany provides management consulting services to the entity in exchange for a management fee,which is equal to 50% of the entity’s net income (excluding the management fee and certain otherspecified revenues and expenses). Included in the Company’s consolidated assets as of December 31,2006 is inventory with a carrying value of approximately $2.8 million. Such inventory consistsentirely of artwork and is the collateral for the $3.5 million in outstanding loans discussed above,which are eliminated in consolidation. The Company has no equity investment in the entity.
The Company accounts for its interest in the entity on a quarter lag applied on a consistentbasis. As of September 30, 2006, the entity had total assets of $7.1 million, total liabilities of $5.4million and capital of $1.7 million.
Note S—Employee Loans
Prior to December 1995, the Company had two bank loan programs available to certainemployees whereby a bank would directly lend money to certain officers and staff at favorableinterest rates. The Company guaranteed all repayment obligations under these bank loan programs,and all loans were immediately repayable in the event an employee left the Company. EffectiveMarch 8, 2004, the entire $0.6 million of outstanding loans under these programs was sold andassigned to the Company. The amount of outstanding loans under this program was $0.1 million and$0.2 million at December 31, 2006 and December 31, 2005, respectively. The Company does notintend to grant any new loans to employees under this program in the future.
(See Note E for the disclosure of employee loans made by the Company’s Finance segment.Such loans are secured by works of art owned by the employees.)
92

Note T—Discontinued Operations
In the fourth quarter of 2003, the Company committed to a plan to sell its domestic real estatebrokerage business, Sotheby’s International Realty, Inc. (“SIR”), as well as most of its real estatebrokerage offices outside of the U.S. As a result, such operations qualified for treatment asdiscontinued operations in the fourth quarter of 2003.
On February 17, 2004, the Company consummated the sale of SIR to a subsidiary of RealogyCorporation (“Realogy”), formerly Cendant Corporation. In conjunction with the sale, the Companyentered into an agreement with Realogy to license the Sotheby’s International Realty trademark andcertain related trademarks for an initial 50-year term with a 50-year renewal option (the “RealogyLicense Agreement”). Initially, the Realogy License Agreement was applicable to the U.S., Canada,Israel, Mexico and certain Caribbean countries.
Also in conjunction with the sale, Realogy received options to acquire most of the other non-U.S. offices of the Company’s real estate brokerage business and to expand the Realogy LicenseAgreement to cover the related trademarks in other countries outside the U.S., excluding Australiaand New Zealand (the “International Options”). The International Options were exercised byRealogy and the Realogy License Agreement was amended to cover New Zealand during 2004. As aresult, such operations qualified for treatment as discontinued operations in 2004.
In the fourth quarter of 2004, the Company committed to a plan to discontinue its real estatebrokerage business in Australia and license the Sotheby’s International Realty trademark and certainrelated trademarks in Australia. The Company had expected to consummate a license agreementrelated to such trademarks some time in 2006, but such an agreement could not be reached on termsacceptable to the Company. As a result, in the second quarter of 2006, management decided tocontinue operating the Company’s real estate brokerage business in Australia. Accordingly, theoperating results of this business, which had previously been reported as discontinued operations inthe Consolidated Income Statements since the fourth quarter of 2004, have been reclassified into theCompany’s results from continuing operations for all periods presented. The Australia real estatebrokerage business, which is the only remaining component of the Company’s former Real Estatesegment, is not material to the Company’s results of operations, financial condition or liquidity.
The following is a summary of the results of the Company’s discontinued operations for theyears ended December 31, 2006, 2005 and 2004:
Year Ended December 31 2006 2005 2004
(Thousands of dollars)
Revenues. . . . . . . . . . . . . . . . . . . . . . . . . . . . . . . . . . . . . . . . . . . . . . . . . . . . . . . . . . $ — $ 534 $17,380Expenses . . . . . . . . . . . . . . . . . . . . . . . . . . . . . . . . . . . . . . . . . . . . . . . . . . . . . . . . . . 489 1,066 10,605
Operating (loss) income . . . . . . . . . . . . . . . . . . . . . . . . . . . . . . . . . . . . . . . . . . . (489) (532) 6,775Gain on sale of discontinued operations. . . . . . . . . . . . . . . . . . . . . . . . . . . — — 32,005Other (expense) income. . . . . . . . . . . . . . . . . . . . . . . . . . . . . . . . . . . . . . . . . . . (15) (322) 18
(Loss) income from discontinuedoperations before taxes. . . . . . . . . . . . . . . . . . . . . . . . . . . . . . . . . . . . . . . . . . . . (504) (854) 38,798Income tax (benefit) expense. . . . . . . . . . . . . . . . . . . . . . . . . . . . . . . . . . . . . . (194) (369) 14,516
(Loss) income from discontinued operations . . . . . . . . . . . . . . . . . . . . . . $(310) $ (485) $24,282
According to the terms of the Stock Purchase Agreement related to the sale of SIR, theCompany is due to receive amounts collected by Realogy for the closing of real estate transactionssubsequent to February 17, 2004 that were under contract prior to that date. For the years endedDecember 31, 2005 and 2004, revenues from discontinued operations included $0.5 million and $9.5million, respectively, of such amounts. Additionally, included in the Company’s results fromdiscontinued operations for the year ended December 31, 2006 are litigation accruals (net ofrecoveries) related to events that occurred prior to sale of SIR on February 17, 2004.
93

Note U—Recapitalization
On September 7, 2005, the Company entered into a Transaction Agreement (the “Agreement”),with various affiliates of A. Alfred Taubman and his family (the “Shareholders”). Prior tocompletion of the transactions contemplated by the Agreement, the Shareholders were theCompany’s largest shareholders, holding in the aggregate 14,034,158 shares of the Company’sClass B Common Stock, par value $0.10 per share (the “Class B Stock”), representing approximately62.4% of the aggregate voting power of the Company’s capital stock. Robert S. Taubman, A. AlfredTaubman’s son, is a director of the Company.
Pursuant to the Agreement, the Company agreed to an exchange of all 14,034,158 shares ofClass B Stock owned by the Shareholders for $168,409,896 in cash and 7.1 million shares of theCompany’s Class A Limited Voting Common Stock, par value $0.10 per share (the “Class AStock”), (such exchange, the “Transaction”). (See “Mechanics of Effecting the Transaction; Funding”below.) Completion of the Transaction was not subject to any conditions and it was completed onSeptember 7, 2005. Because the outstanding shares of Class B Stock constituted less than fiftypercent of the aggregate voting power of the Company’s outstanding common stock followingcompletion of the Transaction, pursuant to the Company’s Third Amended and Restated Articles ofIncorporation (the “Articles”), following completion of the Transaction each remaining outstandingshare of Class B Stock held by shareholders not a party to the Transaction was automaticallyconverted into one share of Class A Stock without any action on the part of the holder thereof.Therefore, immediately following completion of the Transaction and such conversion, the Companyhad approximately 57.3 million shares of Class A Stock outstanding (of which the Shareholdersowned 7.1 million, or approximately 12.4%) and no shares of Class B Stock outstanding.
The Company’s Board of Directors appointed a Special Committee to carefully examine alldetails of the Transaction. The Special Committee consisted of four disinterested Directors who,after careful deliberation and negotiation, and based on the advice of independent legal andfinancial advisors retained by the Special Committee, unanimously recommended that the Company’sBoard of Directors approve the Transaction.
As a result of the Transaction, the dual class super-voting share structure that had been in placesince the Company’s initial public offering in 1988 was eliminated; allowing for a corporategovernance structure that is more consistent with the best practices of public companies.
Mechanics of Effecting the Transaction; Funding—Under the terms of the Agreement, theTransaction was effected by means of: (1) the Shareholders voluntarily converting, on a one-for-onebasis pursuant to the Articles, 7.1 million shares of Class B Stock into shares of Class A Stock, and(2) the Company acquiring the remaining shares of Class B Stock owned by the Shareholders foraggregate cash consideration of $168,409,896. The Company funded the cash portion of theconsideration plus direct transaction and financing costs with then existing cash balances and $100million in borrowings under a new credit facility (see Note J).
The total cost to acquire the Class B Stock owned by the Shareholders of $177.2 million(including $8.8 million in direct transaction costs) was accounted for as a treasury stock transactionin the third quarter of 2005, with Common Stock and Additional Paid-In Capital being reduced by$177.1 million. Additionally, the Company ascribed $100,000 of the cost to the Standstill and theRestrictions on Transfer (as described below) based on their fair value as determined by anindependent valuation expert. Such amount was expensed as incurred within Other Expense in theperiod of the Transaction.
Direct financing costs of $3.7 million attributable to the new credit facility are being amortizedon a straight-line basis over the term of the facility (see Note J).
Standstill—In the Agreement, each Shareholder agreed to a customary standstill lasting until theearlier of (1) the fourth anniversary of the Transaction or (2) 30 days after the date on which (a)the Shareholders, together with their affiliates, own, in the aggregate, securities representing lessthan ten percent of the Company’s total outstanding voting power and (b) no affiliate of anyShareholder is a member of the Board of Directors of the Company (however, if such 30th daywould otherwise occur on or before the second anniversary of the Transaction, such 30th day would
94

not be deemed to occur until such second anniversary). The terms of the Standstill generally statethat, each Shareholder shall not (unless requested by the Company): (1) acquire or propose toacquire ownership of or the ability to vote any securities or other property of the Company or anyof its subsidiaries or (2) act to seek to control or influence the management, Board of Directors,shareholders, business, operations or policies of the Company.
Restrictions on Transfer—In the Agreement, each Shareholder agreed that, prior to the secondanniversary of the Transaction, such Shareholder would not transfer any shares of Class A Stock orany economic interest therein, except to an affiliate of such Shareholder in connection with tax orestate-planning transactions, or, to the extent permitted by law, for sales of shares of Class A Stockin any three month period, that when aggregated with sales by all other Shareholders in such period,would not exceed the greater of one percent of the outstanding shares of Class A Stock or theaverage weekly trading volume of the Class A Stock during the four weeks preceding such sale.
Registration Rights—In the Agreement, the Company agreed that, following the secondanniversary of the Transaction and on not more than two occasions, the Shareholders would havethe right to require the Company to file a registration statement under the federal securities lawsregistering the sale of all or a portion of the shares of Class A Stock owned by the Shareholdersthat are not otherwise freely tradable, provided that the market value of the securities proposed tobe sold exceeds specified thresholds. The Company has the right to defer the filing of suchregistration statement under certain circumstances. The Company also agreed to allow theShareholders to participate in any registration statement proposed to be effected by the Companyfollowing the second anniversary of the Transaction, subject to certain restrictions. The Companyagreed to pay all expenses incurred in connection with such registration, other than any underwritingdiscounts or commissions, and also agreed to indemnify each Shareholder from losses incurred as aresult of material misstatements or omissions in such registration statement (other than those thatare the responsibility of the Shareholders, losses incurred by the Company as a result of whichwould be subject to indemnification from the Shareholders).
Note V—Reincorporation
On June 30, 2006, the Company (then named Sotheby’s Holdings, Inc.) reincorporated into theState of Delaware (the “Reincorporation”). The Reincorporation and related proposals wereapproved by the shareholders of Sotheby’s Holdings, Inc. at the annual meeting of shareholders onMay 8, 2006. The Reincorporation was completed by means of a merger of Sotheby’s Holdings, Inc.with and into Sotheby’s Delaware, Inc., a Delaware corporation (“Sotheby’s Delaware”) and awholly-owned subsidiary of Sotheby’s Holdings, Inc. incorporated for the purpose of effecting theReincorporation, with Sotheby’s Delaware being the surviving corporation. Sotheby’s Delaware wasrenamed “Sotheby’s” upon completion of the merger.
In the merger, each outstanding share of Sotheby’s Holdings, Inc. Class A Limited VotingCommon Stock (“Sotheby’s Holdings, Inc. Stock”) was converted into one share of Common Stockof Sotheby’s Delaware (“Sotheby’s Delaware Stock”). As a result, holders of Sotheby’s Holdings,Inc. Stock are now holders of Sotheby’s Delaware Stock, and their rights as holders thereof aregoverned by the General Corporation Law of the State of Delaware and the Certificate ofIncorporation and By-Laws of Sotheby’s Delaware.
The Reincorporation was accounted for as a reverse merger whereby, for accounting purposes,Sotheby’s Holdings, Inc. is considered the acquiror and the surviving corporation is treated as thesuccessor to the historical operations of Sotheby’s Holdings, Inc. Accordingly, the historical financialstatements of Sotheby’s Holdings, Inc., which Sotheby’s Holdings, Inc. previously reported to theSEC on Forms 10-K and 10-Q, among other forms, are treated as the financial statements of thesurviving corporation.
The Reincorporation did not result in any change in the business or principal facilities ofSotheby’s Holdings, Inc. Upon completion of the merger, the address of Sotheby’s principalexecutive offices is 1334 York Avenue, New York, NY 10021. Sotheby’s Holdings, Inc.’smanagement and board of directors continued as the management and board of directors of
95

Sotheby’s Delaware and Sotheby’s Delaware Stock continued to trade on the NYSE under thesymbol “BID.”
Note W—Retention Costs
In 2001 and 2002, the Company implemented retention programs that provided cash awardspayable to certain key employees upon the fulfillment of full-time employment through certaindates. All amounts related to the retention programs were amortized over the correspondingcontractual service periods. For the year ended December 31, 2004, the Company recognizedRetention Costs of $0.3 million. The final cash payment of $0.4 million due under the retentionprograms was made in January 2004 and, as a result, the retention programs concluded.
Note X—Restructuring Plans
In the fourth quarter of 2002, management approved a restructuring plan impacting the Auctionsegment, as well as certain corporate departments (the “2002 Restructuring Plan”). For the yearended December 31, 2004, Net Restructuring Charges related to the 2002 Restructuring Plan totaled$0.1 million, principally relating to severance benefit costs. During 2004, all remaining amounts dueunder the 2002 Restructuring Plan were paid out and the related restructuring liability wasextinguished.
Note Y—Quarterly Results
The worldwide art auction market has two principal selling seasons, spring and autumn.Accordingly, the Auction segment’s business is seasonal, with peak revenues and operating incomegenerally occurring in the second and fourth quarters of each year. Consequently, first and thirdquarter results of the Auction segment historically reflect lower Net Auction Sales (as definedbelow) when compared to the second and fourth quarters and a loss from continuing operations dueto the fixed nature of many of the Company’s operating expenses.
96

See Note D for information regarding prior period reclassifications relating to the Company’snewly established Dealer segment, as well as the reclassification of results from the Company’s realestate brokerage business in Australia to continuing operations.
First Second Third Fourth
(Thousands of dollars, except per share data)
Year Ended December 31, 2006Net Auction Sales (a) . . . . . . . . . . . . . . . . . . . . . . . . . . . . . . . . . $443,024 $1,281,559 $195,462 $1,314,481Income Statement Data:
Auction and related revenues. . . . . . . . . . . . . . . . . . . . . $ 89,493 $ 242,877 $ 50,830 $ 248,144Finance revenues . . . . . . . . . . . . . . . . . . . . . . . . . . . . . . . . . 3,432 3,550 4,347 4,535Dealer revenues . . . . . . . . . . . . . . . . . . . . . . . . . . . . . . . . . . 2,231 634 920 8,991License fee revenues. . . . . . . . . . . . . . . . . . . . . . . . . . . . . . 470 722 961 769Other revenues . . . . . . . . . . . . . . . . . . . . . . . . . . . . . . . . . . . 389 516 322 676
Total revenues . . . . . . . . . . . . . . . . . . . . . . . . . . . . . . . $ 96,015 $ 248,299 $ 57,380 $ 263,115
(Loss) income from continuing operations . . . . . . . . $ (3,939) $ 72,379 $(30,425) $ 69,344
Net (loss) income. . . . . . . . . . . . . . . . . . . . . . . . . . . . . . . . . $ (3,977) $ 71,448 $(30,727) $ 70,305
Basic and Diluted Earnings (Loss) Per Share:Basic (loss) earnings from continuing operations . $ (0.07) $ 1.21 $ (0.49) $ 1.11
Basic (loss) earnings per share. . . . . . . . . . . . . . . . . . . . $ (0.07) $ 1.20 $ (0.50) $ 1.12
Diluted (loss) earnings from continuingoperations . . . . . . . . . . . . . . . . . . . . . . . . . . . . . . . . . . . . . . $ (0.07) $ 1.17 $ (0.49) $ 1.08
Diluted (loss) earnings per share . . . . . . . . . . . . . . . . . $ (0.07) $ 1.16 $ (0.50) $ 1.09
Year Ended December 31, 2005Net Auction Sales (a) . . . . . . . . . . . . . . . . . . . . . . . . . . . . . . . . . $305,052 $ 838,747 $228,133 $ 989,898Income Statement Data:
Auction and related revenues. . . . . . . . . . . . . . . . . . . . . $ 71,731 $ 173,200 $ 52,914 $ 199,054Finance revenues . . . . . . . . . . . . . . . . . . . . . . . . . . . . . . . . . 1,208 1,768 2,112 3,214Dealer revenues . . . . . . . . . . . . . . . . . . . . . . . . . . . . . . . . . . 444 2,358 779 1,550License fee revenues. . . . . . . . . . . . . . . . . . . . . . . . . . . . . . 176 448 385 395Other revenues . . . . . . . . . . . . . . . . . . . . . . . . . . . . . . . . . . . 556 578 279 704
Total revenues . . . . . . . . . . . . . . . . . . . . . . . . . . . . . . . $ 74,115 $ 178,352 $ 56,469 $ 204,917
(Loss) income from continuing operations . . . . . . . . $ (9,739) $ 42,494 $(21,204) $ 51,666
Net (loss) income (b) . . . . . . . . . . . . . . . . . . . . . . . . . . . . . $ (9,721) $ 41,977 $(20,961) $ 50,307
Basic and Diluted Earnings (Loss) Per Share:Basic (loss) earnings from continuing operations . $ (0.16) $ 0.68 $ (0.35) $ 0.92
Basic (loss) earnings per share (b). . . . . . . . . . . . . . . . $ (0.16) $ 0.67 $ (0.34) $ 0.89
Diluted (loss) earnings from continuingoperations . . . . . . . . . . . . . . . . . . . . . . . . . . . . . . . . . . . . . . $ (0.16) $ 0.67 $ (0.35) $ 0.90
Diluted (loss) earnings per share (b) . . . . . . . . . . . . . $ (0.16) $ 0.66 $ (0.34) $ 0.87
Legend:
(a) Net Auction Sales represents the hammer (sale) price of property sold at auction.
(b) In the fourth quarter of 2005, the Company recorded the cumulative effect of a change inaccounting principle of $1.1 million (net of taxes) related to the adoption of FIN No. 47.
97

ITEM 9. CHANGES IN AND DISAGREEMENTS WITH ACCOUNTANTS ONACCOUNTING AND FINANCIAL DISCLOSURE
Not applicable.
ITEM 9A. CONTROLS AND PROCEDURES
Disclosure Controls and Procedures
As of December 31, 2006, the Company has carried out an evaluation, under the supervisionand with the participation of the Company’s management, including the Company’s Chief ExecutiveOfficer and Chief Financial Officer, of the effectiveness of the Company’s disclosure controls andprocedures. Based upon that evaluation, the Company’s Chief Executive Officer and Chief FinancialOfficer have concluded that the Company’s disclosure controls and procedures (as defined inExchange Act Rule 13a-15(e)) were effective as of December 31, 2006.
Management’s Report on Internal Control over Financial Reporting
The Company’s management is responsible for establishing and maintaining adequate internalcontrol over financial reporting, as such term is defined in Exchange Act Rule 13a-15(f).Management evaluates the effectiveness of the Company’s internal control over financial reportingusing the criteria set forth by the Committee of Sponsoring Organizations of the TreadwayCommission (COSO) in “Internal Control—Integrated Framework.” Management, under thesupervision and with the participation of the Company’s Chief Executive Officer and Chief FinancialOfficer, assessed the effectiveness of the Company’s internal control over financial reporting as ofDecember 31, 2006 and concluded that it is effective.
The Company’s independent registered public accounting firm, Deloitte & Touche LLP, hasaudited the effectiveness of the Company’s internal control over financial reporting andmanagement’s assessment of the effectiveness of the Company’s internal control over financialreporting as of December 31, 2006, and has expressed unqualified opinions in their report which isincluded herein.
Changes in Internal Control over Financial Reporting
There was no change in the Company’s internal control over financial reporting that occurredduring the Company’s most recent fiscal quarter that has materially affected, or is reasonably likelyto materially affect, the Company’s internal control over financial reporting.
98

REPORT OF INDEPENDENT REGISTERED PUBLIC ACCOUNTING FIRM
To the Board of Directors and Shareholders ofSOTHEBY’S
New York, New York
We have audited management’s assessment, included in the accompanying Management’s Reporton Internal Control Over Financial Reporting, that Sotheby’s and subsidiaries (the “Company”)maintained effective internal control over financial reporting as of December 31, 2006, based oncriteria established in Internal Control—Integrated Framework issued by the Committee ofSponsoring Organizations of the Treadway Commission. The Company’s management is responsiblefor maintaining effective internal control over financial reporting and for its assessment of theeffectiveness of internal control over financial reporting. Our responsibility is to express an opinionon management’s assessment and an opinion on the effectiveness of the Company’s internal controlover financial reporting based on our audit.
We conducted our audit in accordance with the standards of the Public Company AccountingOversight Board (United States). Those standards require that we plan and perform the audit toobtain reasonable assurance about whether effective internal control over financial reporting wasmaintained in all material respects. Our audit included obtaining an understanding of internalcontrol over financial reporting, evaluating management’s assessment, testing and evaluating thedesign and operating effectiveness of internal control, and performing such other procedures as weconsidered necessary in the circumstances. We believe that our audit provides a reasonable basis forour opinions.
A company’s internal control over financial reporting is a process designed by, or under thesupervision of, the company’s principal executive and principal financial officers, or personsperforming similar functions, and effected by the company’s board of directors, management, andother personnel to provide reasonable assurance regarding the reliability of financial reporting andthe preparation of financial statements for external purposes in accordance with generally acceptedaccounting principles. A company’s internal control over financial reporting includes those policiesand procedures that (1) pertain to the maintenance of records that, in reasonable detail, accuratelyand fairly reflect the transactions and dispositions of the assets of the company; (2) providereasonable assurance that transactions are recorded as necessary to permit preparation of financialstatements in accordance with generally accepted accounting principles, and that receipts andexpenditures of the company are being made only in accordance with authorizations of managementand directors of the company; and (3) provide reasonable assurance regarding prevention or timelydetection of unauthorized acquisition, use, or disposition of the company’s assets that could have amaterial effect on the financial statements.
Because of the inherent limitations of internal control over financial reporting, including thepossibility of collusion or improper management override of controls, material misstatements due toerror or fraud may not be prevented or detected on a timely basis. Also, projections of anyevaluation of the effectiveness of the internal control over financial reporting to future periods aresubject to the risk that the controls may become inadequate because of changes in conditions, orthat the degree of compliance with the policies or procedures may deteriorate.
In our opinion, management’s assessment that the Company maintained effective internalcontrol over financial reporting as of December 31, 2006, is fairly stated, in all material respects,based on the criteria established in Internal Control—Integrated Framework issued by the Committeeof Sponsoring Organizations of the Treadway Commission. Also in our opinion, the Companymaintained, in all material respects, effective internal control over financial reporting as ofDecember 31, 2006, based on the criteria established in Internal Control—Integrated Frameworkissued by the Committee of Sponsoring Organizations of the Treadway Commission.
We have also audited, in accordance with the standards of the Public Company AccountingOversight Board (United States), the consolidated financial statements and financial statementschedule as of and for the year ended December 31, 2006 of the Company and our report datedMarch 1, 2007 expressed an unqualified opinion and includes an explanatory paragraph referring to
99

the Company’s adoption of Statement of Financial Accounting Standards No. 123(R), “Share-BasedPayment,” as revised, effective January 1, 2006 and the recognition and disclosure provisions ofStatement of Financial Accounting Standards No. 158, “Employers’ Accounting for Defined BenefitPension and Other Postretirement Plans—an amendment of FASB Statements No. 87, 88, 106 and132(R),” effective December 31, 2006, on those financial statements and financial statementschedule.
/s/ DELOITTE & TOUCHE LLP
Deloitte & Touche LLPNew York, New YorkMarch 1, 2007
100

PART III
ITEM 10. DIRECTORS, EXECUTIVE OFFICERS AND CORPORATE GOVERNANCE
Information required by this item is incorporated herein by reference to the Company’sdefinitive proxy statement for the annual meeting of shareholders to be held in 2007 (the “ProxyStatement”) under the captions “Election of Directors,” “Corporate Governance” and “Section 16(a)Beneficial Ownership Compliance.”
ITEM 11. EXECUTIVE COMPENSATION
The information required by this item is incorporated herein by reference to the materialappearing in the Proxy Statement under the captions “Compensation of Executive Officers” and“Compensation of Directors.” Notwithstanding anything to the contrary herein, the Audit CommitteeReport and the Compensation Committee Report in the Proxy Statement are not incorporated byreference herein.
ITEM 12. SECURITY OWNERSHIP OF CERTAIN BENEFICIAL OWNERS ANDMANAGEMENT AND RELATED STOCKHOLDER MATTERS
The information required by this item is incorporated herein by reference to the table andrelated text and footnotes appearing in the Proxy Statement under the caption “Security Ownershipof Certain Beneficial Owners and Management.”
ITEM 13. CERTAIN RELATIONSHIPS AND RELATED TRANSACTIONS AND DIRECTORINDEPENDENCE
The information required by this item is incorporated herein by reference to the materialappearing in the Proxy Statement under the captions “Certain Relationships and RelatedTransactions” and “Corporate Governance.”
ITEM 14. PRINCIPAL ACCOUNTING FEES AND SERVICES
The information required by this item is incorporated herein by reference to the materialappearing in the Proxy Statement under the caption “Ratification of the Appointment ofIndependent Auditors.”
101

PART IV
ITEM 15. EXHIBITS, FINANCIAL STATEMENT SCHEDULES AND REPORTS ON FORM 8-K
15(a)(1)—The following consolidated financial statements and the related notes thereto ofSotheby’s Holdings, Inc. and subsidiaries are contained in Item 8, “Financial Statementsand Supplementary Data”: Consolidated Income Statements—Years ended December31, 2006, 2005 and 2004; Consolidated Balance Sheets—December 31, 2006 and 2005;Consolidated Statements of Cash Flows—Years ended December 31, 2006, 2005 and2004; Consolidated Statements of Changes in Shareholders’ Equity—Years endedDecember 31, 2006, 2005 and 2004.
15(a)(2)—The following is the consolidated financial statement schedule of Sotheby’s Holdings,Inc. and subsidiaries required by Item 15(d): Schedule II—Valuation and QualifyingAccounts for the years ended December 31, 2006, 2005 and 2004.
15(a)(3)
2.1 —Agreement and Plan of Merger between Sotheby’s Holdings, Inc., a Michigancorporation and Sotheby’s Delaware, Inc., a Delaware corporation, dated March 31,2006, incorporated by reference to the Company’s First Quarter Form 10-Q for 2006.
2.2 —Agreement for the Sale and Purchase of All the Issued and Outstanding Shares inNoortman Master Paintings B.V., dated June 7, 2006, incorporated by reference toExhibit 2.1 to the Company’s Second Quarter Form 10-Q for 2006.
3.1 —Certificate of Incorporation of Sotheby’s, as amended as of June 30, 2006, incorporatedby reference to Exhibit 3.1 to the Company’s current report on Form 8-K, filed onJuly 7, 2006.
3.2 —By-Laws of Sotheby’s adopted as of March 31, 2006, incorporated by reference toExhibit 3.2 to the Company’s current report on Form 8-K, filed on July 7, 2006.
4.1 —See Exhibits 3.1 and 3.2.
4.2 —Indenture, dated as of February 5, 1999, between Sotheby’s Holdings, Inc. and TheChase Manhattan Bank as Trustee, incorporated by reference to Exhibit 4(a) to theCompany’s current report on Form 8-K, filed on February 10, 1999 with the Securitiesand Exchange Commission.
4.3 —First Supplemental Indenture, dated as of June 30, 2006, between Sotheby’s andWilmington Trust Company, as successor trustee (Supplemental to Indenture dated as ofFebruary 5, 1999 between Sotheby’s Holdings, Inc. and The Chase Manhattan Bank, astrustee, as filed in the Company’s current report on Form 8-K on February 10, 1999with the Securities and Exchange Commission), incorporated by reference to Exhibit 4.4to the Company’s current report on Form 8-K, filed on July 7, 2006.
4.4 —Fixed Rate Note, dated February 5, 1999, made by Sotheby’s Holdings, Inc. in favor ofCede & Co., incorporated by reference to Exhibit 4(b) to the Company’s current reporton Form 8-K, filed on February 10, 1999 with the Securities and Exchange Commission.
4.5 —Specimen Common Stock Certificate of Sotheby’s, incorporated by reference to Exhibit4.1 to Post-Effective Amendment No. 1 to the Company’s Registration Statement onForm 8-A filed on November 21, 2006.
10.1* —Sotheby’s, Inc. 2005 Benefit Equalization Plan, incorporated by reference to Exhibit 10.2to the Company’s current report on Form 8-K filed on December 15, 2004.
10.2* —First Amendment to the Sotheby’s, Inc. 2005 Benefit Equalization Plan, datedDecember 9, 2005.
10.3* —Sotheby’s Deferred Compensation Plan, dated December 21, 2006 and effectiveJanuary 1, 2007.
102

10.4* —Sotheby’s Holdings, Inc. 1987 Stock Option Plan as amended and restated effectiveJune 1, 1994, incorporated by reference to Exhibit 10(o) to the Company’s AnnualReport on Form 10-K for the year ended December 31, 1994.
10.5* —Sotheby’s Holdings, Inc. 1997 Stock Option Plan Composite Plan Document, effectiveJanuary 1, 2000, incorporated by reference to Exhibit 10(k) to the Company’s AnnualReport on Form 10-K for the year ended December 31, 2000.
10.6* —Seventh Amendment to the Sotheby’s Holdings, Inc. 1997 Stock Option Plan datedNovember 7, 2005, effective September 8, 2005, incorporated by reference toExhibit 10.4 to the Company’s Annual Report on Form 10-K for the year endedDecember 31, 2005.
10.7* —Eighth Amendment to the Sotheby’s 1997 Stock Option Plan Composite PlanDocument, dated and effective May 8, 2006, incorporated by reference to Exhibit 10.2to the Company’s current report on Form 8-K dated May 12, 2006.
10.8 —Agreement of Partnership of Acquavella Modern Art, dated May 29, 1990, betweenSotheby’s Nevada, Inc. and Acquavella Contemporary Art, Inc., incorporated byreference to Exhibit 10(b) to the Company’s current report on Form 8-K, filed onJune 7, 1990, SEC File No. 1-9750, on file at the Washington, D.C. office of theSecurities and Exchange Commission.
10.9 —First Amendment to Agreement of Partnership, dated December 31, 2000, ofAcquavella Modern Art, between Sotheby’s Nevada, Inc. and Acquavella ContemporaryArt, Inc., incorporated by reference to Exhibit 10(m) to the Company’s Annual Reporton Form 10-K for the year ended December 31, 2000.
10.10 —Second Amendment to Agreement of Partnership, dated December 15, 2001, ofAcquavella Modern Art, between Sotheby’s Nevada, Inc. and Acquavella ContemporaryArt, Inc., incorporated by reference to Exhibit 10(k) to the Company’s Annual Reporton Form 10-K for the year ended December 31, 2001.
10.11 —Third Amendment to Agreement of Partnership, dated February 10, 2003, of AcquavellaModern Art, between Sotheby’s Nevada, Inc. and Acquavella Contemporary Art, Inc.,incorporated by reference to Exhibit 10(h) to the Company’s Annual Report on Form10-K for the year ended December 31, 2002.
10.12 —Fourth Amendment to Agreement of Partnership, dated January 13, 2004, of AcquavellaModern Art, between Sotheby’s Nevada, Inc. and Acquavella Contemporary Art, Inc.,incorporated by reference to Exhibit 10 to the Company’s Annual Report on Form 10-Kfor the year ended December 31, 2003.
10.13 —Fifth Amendment to Agreement of Partnership, dated December 8, 2004, of AcquavellaModern Art, between Sotheby’s Nevada, Inc. and Acquavella Contemporary Art, Inc.,incorporated by reference to Exhibit 10.9 to the Company’s Annual Report onForm 10-K for the year ended December 31, 2004.
10.14 —Sixth Amendment to Agreement of Partnership, dated March 1, 2006, of AcquavellaModern Art, between Sotheby’s Nevada, Inc. and Acquavella Contemporary Art, Inc.incorporated by reference to Exhibit 10.11 to the Company’s Annual Report on Form10-K for the year ended December 31, 2005.
10.15* —1998 Stock Compensation Plan for Non-Employee Directors, as amended and restatedon March 14, 2005, effective May 4, 2005, incorporated by reference to Exhibit 10.10 tothe Company’s Annual Report on Form 10-K for the year ended December 31, 2004.
103

10.16 —Amended and Restated Credit Agreement dated as of November 14, 2005, amongSotheby’s Inc., as the Company, Sotheby’s Holdings, Inc., as Holdings, Certain U.K.Subsidiaries of Holdings, Bank of America, N.A., as Administrative Agent, Swing LineLender and L/C Issuer, LaSalle Bank N.A., as Syndication Agent and the OtherLenders Party Hereto, Banc of America Securities, LLC and LaSalle Bank N.A., asJoint Lead Arrangers and Joint Book Managers, incorporated by reference to theCompany’s Annual Report on Form 10-K for the year ended December 31, 2005.
10.17 —Amendment No. 2 to the Amended and Restated Credit Agreement among Sotheby’sHoldings, Inc., Sotheby’s, Inc., Oatshare Limited, Sotheby’s, and Bank of America, N.A.dated May 18, 2006, incorporated by reference to Exhibit 10.1 to the Company’s currentreport on Form 8-K, filed on May 23, 2006.
10.18 —Purchase and Sale Agreement between SIBS, LLC, as Seller and RFR Holding Corp.,as Purchaser; Dated: As of December 16, 2002; Property: 1334 York Avenue, NewYork, New York 10021, incorporated by reference to Exhibit 10(a) to the Company’sFirst Quarter Form 10-Q for 2003.
10.19 —Lease between 1334 York Avenue L.P., “Landlord,” and Sotheby’s, Inc., “Tenant,”February 7, 2003; Premises: 1334 York Avenue, New York, New York, incorporated byreference to Exhibit 10(b) to the Company’s First Quarter Form 10-Q for 2003.
10.20 —Guaranty of Lease, made by Sotheby’s in favor of 1334 York Avenue L.P., dated as ofJune 30, 2006 incorporated by reference to Exhibit 10.29 to the Company’s currentreport on Form 8-K, filed on July 7, 2006.
10.21* —Letter Agreement between Sotheby’s Holdings, Inc. and William F. Ruprecht, withrelated Terms of Employment, dated March 31, 2006
10.22* —Severance Agreement between Sotheby’s and William S. Sheridan, dated August 3,2006, incorporated by reference to Exhibit 10.1 to the Company’s Third Quarter Form10-Q for 2006.
10.23* —Service Agreement between Sotheby’s and Robin Woodhead, with related Terms ofEmployment, dated August 15, 2006, incorporated by reference to Exhibit 10.2 to theCompany’s Third Quarter Form 10-Q for 2006.
10.24* —Sotheby’s Holdings, Inc. Amended and Restated Restricted Stock Plan, incorporated byreference to Exhibit 10.1 to the Company’s Registration Statement on Form S-8 filed onMay 9, 2006.
10.25 —Stock Purchase Agreement, dated as of February 17, 2004, by and among NRTIncorporated as the Purchaser, Sotheby’s Holdings, Inc., as the Seller, and CendantCorporation as the Purchaser Guarantor, incorporated by reference to Exhibit 99.1 tothe Company’s current report on Form 8-K, filed on March 2, 2004.
10.26 —Trademark License Agreement, dated as of February 17, 2004, among SPTC, Inc., asLicensor, Sotheby’s Holdings, Inc. as Guarantor, Monticello Licensee Corporation, asLicensee, and Cendant Corporation, as Guarantor, incorporated by reference toExhibit 99.2 to the Company’s current report on Form 8-K, filed on March 2, 2004.
10.27 —Amendment No. 1 to Trademark License Agreement, dated as of May 2, 2005, amongSPTC Delaware, LLC (as an assignee of SPTC, Inc) and Sotheby’s Holdings, Inc. andCendant Corporation and Sotheby’s International Realty Licensee Corporation (formerlyknown as Monticello Licensee Corporation), incorporated by reference to Exhibit 10.1to the Company’s Second Quarter Form 10-Q for 2005.
10.28 —Amendment No. 2 to Trademark License Agreement, dated as of May 2, 2005, amongSPTC Delaware, LLC (as an assignee of SPTC, Inc) and Sotheby’s Holdings, Inc. andCendant Corporation and Sotheby’s International Realty Licensee Corporation (formerlyknown as Monticello Licensee Corporation), incorporated by reference to Exhibit 10.2to the Company’s Second Quarter Form 10-Q for 2005.
104

10.29* —Sotheby’s Holdings, Inc. Executive Bonus Plan, dated as of February 7, 2005 andeffective January 1, 2005, incorporated by reference to Exhibit 10.1 to the Company’sFirst Quarter Form 10-Q for 2005.
10.30 —Transaction Agreement by and among Sotheby’s Holdings, Inc., and The Investors,dated as of September 7, 2005, incorporated by reference to Exhibit 10.1 to theCompany’s Third Quarter Form 10-Q for 2005.
21 —Subsidiaries of the Registrant
23 —Consent of Deloitte & Touche LLP
24 —Powers of Attorney
31.1 —Certification pursuant to Section 302 of the Sarbanes-Oxley Act of 2002
31.2 —Certification pursuant to Section 302 of the Sarbanes-Oxley Act of 2002
32.1 —Certification pursuant to Section 906 of the Sarbanes-Oxley Act of 2002
32.2 —Certification pursuant to Section 906 of the Sarbanes-Oxley Act of 2002
(15)(b) —On October 26, 2006, the Company filed a current report on Form 8-K under Item 8.01,“Other Events.”
On November 14, 2006, the Company filed a current report on Form 8-K under Item2.02, “Results of Operations and Financial Condition” and Item 9.01, “FinancialStatements and Exhibits.”
On December 12, 2006, the Company filed a current report on Form 8-K under Item5.02 “Departure of Directors or Certain Officers; Election of Directors; Appointment ofCertain Officers; Compensatory Arrangements of Certain Officers.”
(15)(c) —The list of exhibits filed with this report is set forth in response to Item 15(a)(3). Therequired exhibit index has been filed with the exhibits.
(15)(d) —The financial statement schedule of the Company listed in response to Item 15(a)(2) isfiled pursuant to this Item 15(d).
* A compensatory agreement or plan required to be filed pursuant to Item 15(c) of Form 10-K
105

SCHEDULE II
SOTHEBY’SVALUATION AND QUALIFYING ACCOUNTS
YEARS ENDED DECEMBER 31, 2006, 2005 AND 2004
Column A Column B Column C Column D Column E
Description (a)
Balance atBeginningof Period
Charged toCosts andExpenses
Charged toOther
Accounts Deductions
Balanceat End of
Period
(Thousands of dollars)
Valuation reserve deducted in the balancesheet from the asset to which it applies:
Receivables (b):2006 Allowance for doubtful
accounts and credit losses . . . . . . . . $ 6,137 $3,192 $ — $2,240 $ 7,0892005 Allowance for doubtful
accounts and credit losses . . . . . . . . $ 7,931 $1,820 $ 156 $3,770 $ 6,1372004 Allowance for doubtful
accounts and credit losses . . . . . . . . $ 7,548 $5,530 $ — $5,147 $ 7,931Deferred tax assets:
2006 Valuation allowance. . . . . . . . . . . $24,885 $1,368 $2,894 $ — $29,1472005 Valuation allowance. . . . . . . . . . . $33,762 $ — $ — $8,877 $24,8852004 Valuation allowance. . . . . . . . . . . $34,493 $3,167 $ — $3,898 $33,762
(a) The schedule above relates only to the Company s continuing operations and excludes amountsrelated to the Company’s discontinued real estate brokerage business considered to be held forsale (see Note T of Notes to Consolidated Financial Statements under Part II, Item 8, “FinancialStatements and Supplementary Data”).
(b) Consists of Accounts Receivable, as well as Notes Receivables and Consignor Advances.
106

SIGNATURES
Pursuant to the requirements of Section 13 or 15(d) of the Securities Exchange Act of 1934, theregistrant has duly caused this report to be signed on its behalf by the undersigned, thereunto dulyauthorized.
SOTHEBY’S
By: /s/ WILLIAM F. RUPRECHT
William F. RuprechtPresident and Chief Executive Officer
Date: March 1, 2007
Pursuant to the requirements of the Securities Exchange Act of 1934, this report has beensigned below by the following persons on behalf of the registrant and in the capacities and on thedates indicated.
Signature Title Date
/s/ MICHAEL I. SOVERN*Michael I. Sovern
Chairman of the Board March 1, 2007
/s/ DEVONSHIRE*Duke of Devonshire
Deputy Chairman of the Board March 1, 2007
/s/ WILLIAM F. RUPRECHT
William F. Ruprecht
President, Chief Executive Officerand Director
March 1, 2007
/s/ ROBIN G. WOODHEAD*Robin G. Woodhead
Executive Vice President and Director March 1, 2007
/s/ BLAKENHAM*Michael Blakenham
Director March 1, 2007
/s/ STEVEN B. DODGE*Steven B. Dodge
Director March 1, 2007
/s/ ALLEN QUESTROM*Allen Questrom
Director March 1, 2007
/s/ DONALD H. STEWART*Donald H. Stewart
Director March 1, 2007
/s/ ROBERT S. TAUBMAN*Robert S. Taubman
Director March 1, 2007
/s/ DENNIS WEIBLING*Dennis Weibling
Director March 1, 2007
/s/ WILLIAM S. SHERIDAN
William S. Sheridan
Executive Vice President andChief Financial Officer
March 1, 2007
/s/ MICHAEL L. GILLIS
Michael L. Gillis
Senior Vice President, Controller andChief Accounting Officer
March 1, 2007
/s/ WILLIAM S. SHERIDAN
*William S. Sheridanas Attorney-in-Fact
March 1, 2007
107

EXHIBIT INDEX
ExhibitNo. Description
2.1 —Agreement and Plan of Merger between Sotheby’s Holdings, Inc., a Michigan corporation andSotheby’s Delaware, Inc., a Delaware corporation, dated March 31, 2006, incorporated byreference to the Company’s First Quarter Form 10-Q for 2006.
2.2 —Agreement for the Sale and Purchase of All the Issued and Outstanding Shares in NoortmanMaster Paintings B.V., dated June 7, 2006, incorporated by reference to Exhibit 2.1 to theCompany’s Second Quarter Form 10-Q for 2006.
3.1 —Certificate of Incorporation of Sotheby’s, as amended as of June 30, 2006, incorporated byreference to Exhibit 3.1 to the Company’s current report on Form 8-K, filed on July 7, 2006.
3.2 —By-Laws of Sotheby’s adopted as of March 31, 2006, incorporated by reference to Exhibit 3.2 tothe Company’s current report on Form 8-K, filed on July 7, 2006.
4.1 —See Exhibits 3.1 and 3.2.
4.2 —Indenture, dated as of February 5, 1999, between Sotheby’s Holdings, Inc. and The ChaseManhattan Bank as Trustee, incorporated by reference to Exhibit 4(a) to the Company’s currentreport on Form 8-K, filed on February 10, 1999 with the Securities and Exchange Commission.
4.3 —First Supplemental Indenture, dated as of June 30, 2006, between Sotheby’s and Wilmington TrustCompany, as successor trustee (Supplemental to Indenture dated as of February 5, 1999 betweenSotheby’s Holdings, Inc. and The Chase Manhattan Bank, as trustee, as filed in the Company’scurrent report on Form 8-K on February 10, 1999 with the Securities and Exchange Commission),incorporated by reference to Exhibit 4.4 to the Company’s current report on Form 8-K, filed onJuly 7, 2006.
4.4 —Fixed Rate Note, dated February 5, 1999, made by Sotheby’s Holdings, Inc. in favor of Cede &Co., incorporated by reference to Exhibit 4(b) to the Company’s current report on Form 8-K, filedon February 10, 1999 with the Securities and Exchange Commission.
4.5 —Specimen Common Stock Certificate of Sotheby’s, incorporated by reference to Exhibit 4.1 toPost-Effective Amendment No. 1 to the Company’s Registration Statement on Form 8-A filed onNovember 21, 2006.
10.1* —Sotheby’s, Inc. 2005 Benefit Equalization Plan, incorporated by reference to Exhibit 10.2 to theCompany’s current report on Form 8-K filed on December 15, 2004.
10.2* —First Amendment to the Sotheby’s, Inc. 2005 Benefit Equalization Plan, dated December 9, 2005.
10.3* —Sotheby’s Deferred Compensation Plan, dated December 21, 2006 and effective January 1, 2007.
10.4* —Sotheby’s Holdings, Inc. 1987 Stock Option Plan as amended and restated effective June 1, 1994,incorporated by reference to Exhibit 10(o) to the Company’s Annual Report on Form 10-K forthe year ended December 31, 1994.
10.5* —Sotheby’s Holdings, Inc. 1997 Stock Option Plan Composite Plan Document, effective January 1,2000, incorporated by reference to Exhibit 10(k) to the Company’s Annual Report on Form 10-Kfor the year ended December 31, 2000.
10.6* —Seventh Amendment to the Sotheby’s Holdings, Inc. 1997 Stock Option Plan dated November 7,2005, effective September 8, 2005, incorporated by reference to Exhibit 10.4 to the Company’sAnnual Report on Form 10-K for the year ended December 31, 2005.
10.7* —Eighth Amendment to the Sotheby’s 1997 Stock Option Plan Composite Plan Document, datedand effective May 8, 2006, incorporated by reference to Exhibit 10.2 to the Company’s currentreport on Form 8-K dated May 12, 2006.
10.8 —Agreement of Partnership of Acquavella Modern Art, dated May 29, 1990, between Sotheby’sNevada, Inc. and Acquavella Contemporary Art, Inc., incorporated by reference to Exhibit 10(b)to the Company’s current report on Form 8-K, filed on June 7, 1990, SEC File No. 1-9750, on fileat the Washington, D.C. office of the Securities and Exchange Commission.
108

ExhibitNo. Description
10.9 —First Amendment to Agreement of Partnership, dated December 31, 2000, of Acquavella ModernArt, between Sotheby’s Nevada, Inc. and Acquavella Contemporary Art, Inc., incorporated byreference to Exhibit 10(m) to the Company’s Annual Report on Form 10-K for the year endedDecember 31, 2000.
10.10 —Second Amendment to Agreement of Partnership, dated December 15, 2001, of AcquavellaModern Art, between Sotheby’s Nevada, Inc. and Acquavella Contemporary Art, Inc.,incorporated by reference to Exhibit 10(k) to the Company’s Annual Report on Form 10-K forthe year ended December 31, 2001.
10.11 —Third Amendment to Agreement of Partnership, dated February 10, 2003, of Acquavella ModernArt, between Sotheby’s Nevada, Inc. and Acquavella Contemporary Art, Inc., incorporated byreference to Exhibit 10(h) to the Company’s Annual Report on Form 10-K for the year endedDecember 31, 2002.
10.12 —Fourth Amendment to Agreement of Partnership, dated January 13, 2004, of Acquavella ModernArt, between Sotheby’s Nevada, Inc. and Acquavella Contemporary Art, Inc., incorporated byreference to Exhibit 10 to the Company’s Annual Report on Form 10-K for the year endedDecember 31, 2003.
10.13 —Fifth Amendment to Agreement of Partnership, dated December 8, 2004, of Acquavella ModernArt, between Sotheby’s Nevada, Inc. and Acquavella Contemporary Art, Inc., incorporated byreference to Exhibit 10.9 to the Company’s Annual Report on Form 10-K for the year endedDecember 31, 2004.
10.14 —Sixth Amendment to Agreement of Partnership, dated March 1, 2006, of Acquavella Modern Art,between Sotheby’s Nevada, Inc. and Acquavella Contemporary Art, Inc. incorporated by referenceto Exhibit 10.11 to the Company’s Annual Report on Form 10-K for the year endedDecember 31, 2005.
10.15*—1998 Stock Compensation Plan for Non-Employee Directors, as amended and restated onMarch 14, 2005, effective May 4, 2005, incorporated by reference to Exhibit 10.10 to theCompany’s Annual Report on Form 10-K for the year ended December 31, 2004.
10.16 —Amended and Restated Credit Agreement dated as of November 14, 2005, among Sotheby’s Inc.,as the Company, Sotheby’s Holdings, Inc., as Holdings, Certain U.K. Subsidiaries of Holdings,Bank of America, N.A., as Administrative Agent, Swing Line Lender and L/C Issuer, LaSalleBank N.A., as Syndication Agent and the Other Lenders Party Hereto, Banc of AmericaSecurities, LLC and LaSalle Bank N.A., as Joint Lead Arrangers and Joint Book Managers,incorporated by reference to the Company’s Annual Report on Form 10-K for the year endedDecember 31, 2005.
10.17 —Amendment No. 2 to the Amended and Restated Credit Agreement among Sotheby’s Holdings,Inc., Sotheby’s, Inc., Oatshare Limited, Sotheby’s, and Bank of America, N.A. dated May 18,2006, incorporated by reference to Exhibit 10.1 to the Company’s current report on Form 8-K,filed on May 23, 2006.
10.18 —Purchase and Sale Agreement between SIBS, LLC, as Seller and RFR Holding Corp., asPurchaser; Dated: As of December 16, 2002; Property: 1334 York Avenue, New York, New York10021, incorporated by reference to Exhibit 10(a) to the Company’s First Quarter Form 10-Q for2003.
10.19 —Lease between 1334 York Avenue L.P., “Landlord,” and Sotheby’s, Inc., “Tenant,” February 7,2003; Premises: 1334 York Avenue, New York, New York, incorporated by reference to Exhibit10(b) to the Company’s First Quarter Form 10-Q for 2003.
10.20 —Guaranty of Lease, made by Sotheby’s in favor of 1334 York Avenue L.P., dated as of June 30,2006 incorporated by reference to Exhibit 10.29 to the Company’s current report on Form 8-K,filed on July 7, 2006.
109

ExhibitNo. Description
10.21*—Letter Agreement between Sotheby’s Holdings, Inc. and William F. Ruprecht, with related Termsof Employment, dated March 31, 2006
10.22*—Severance Agreement between Sotheby’s and William S. Sheridan, dated August 3, 2006,incorporated by reference to Exhibit 10.1 to the Company’s Third Quarter Form 10-Q for 2006.
10.23*—Service Agreement between Sotheby’s and Robin Woodhead, with related Terms of Employment,dated August 15, 2006, incorporated by reference to Exhibit 10.2 to the Company’s Third QuarterForm 10-Q for 2006.
10.24*—Sotheby’s Holdings, Inc. Amended and Restated Restricted Stock Plan, incorporated by referenceto Exhibit 10.1 to the Company’s Registration Statement on Form S-8 filed on May 9, 2006.
10.25 —Stock Purchase Agreement, dated as of February 17, 2004, by and among NRT Incorporated asthe Purchaser, Sotheby’s Holdings, Inc., as the Seller, and Cendant Corporation as the PurchaserGuarantor, incorporated by reference to Exhibit 99.1 to the Company’s current report on Form8-K, filed on March 2, 2004.
10.26 —Trademark License Agreement, dated as of February 17, 2004, among SPTC, Inc., as Licensor,Sotheby’s Holdings, Inc. as Guarantor, Monticello Licensee Corporation, as Licensee, and CendantCorporation, as Guarantor, incorporated by reference to Exhibit 99.2 to the Company’s currentreport on Form 8-K, filed on March 2, 2004.
10.27 —Amendment No. 1 to Trademark License Agreement, dated as of May 2, 2005, among SPTCDelaware, LLC (as an assignee of SPTC, Inc) and Sotheby’s Holdings, Inc. and CendantCorporation and Sotheby’s International Realty Licensee Corporation (formerly known asMonticello Licensee Corporation), incorporated by reference to Exhibit 10.1 to the Company’sSecond Quarter Form 10-Q for 2005.
10.28 —Amendment No. 2 to Trademark License Agreement, dated as of May 2, 2005, among SPTCDelaware, LLC (as an assignee of SPTC, Inc) and Sotheby’s Holdings, Inc. and CendantCorporation and Sotheby’s International Realty Licensee Corporation (formerly known asMonticello Licensee Corporation), incorporated by reference to Exhibit 10.2 to the Company’sSecond Quarter Form 10-Q for 2005.
10.29*—Sotheby’s Holdings, Inc Executive Bonus Plan, dated as of February 7, 2005 and effectiveJanuary 1, 2005, incorporated by reference to Exhibit 10.1 to the Company’s First Quarter Form10-Q for 2005.
10.30 —Transaction Agreement by and among Sotheby’s Holdings, Inc., and The Investors, dated as ofSeptember 7, 2005, incorporated by reference to Exhibit 10.1 to the Company’s Third QuarterForm 10-Q for 2005.
21 —Subsidiaries of the Registrant
23 —Consent of Deloitte & Touche LLP
24 —Powers of Attorney
31.1 —Certification pursuant to Section 302 of the Sarbanes-Oxley Act of 2002
31.2 —Certification pursuant to Section 302 of the Sarbanes-Oxley Act of 2002
32.1 —Certification pursuant to Section 906 of the Sarbanes-Oxley Act of 2002
32.2 —Certification pursuant to Section 906 of the Sarbanes-Oxley Act of 2002
* A compensatory agreement or plan required to be filed pursuant to Item 15(c) of Form 10-K
110