2005 Ford GT- Maintaining Your Cool at 200 MPH · program timeline was extremely short with...
17
400 Commonwealth Drive, Warrendale, PA 15096-0001 U.S.A. Tel: (724) 776-4841 Fax: (724) 776-5760 Web: www.sae.org SAE TECHNICAL PAPER SERIES 2004-01-1257 2005 Ford GT- Maintaining Your Cool at 200 MPH Curtis M. Hill and Glenn D. Miller Ford Motor Co. Michael R. Evans and David M. Pollock Roush Industries, Inc. 2004 SAE World Congress Detroit, Michigan March 8-11, 2004
Transcript of 2005 Ford GT- Maintaining Your Cool at 200 MPH · program timeline was extremely short with...

400 Commonwealth Drive, Warrendale, PA 15096-0001 U.S.A. Tel: (724) 776-4841 Fax: (724) 776-5760 Web: www.sae.org
SAE TECHNICALPAPER SERIES 2004-01-1257
2005 Ford GT- Maintaining Your Cool at 200 MPH
Curtis M. Hill and Glenn D. MillerFord Motor Co.
Michael R. Evans and David M. PollockRoush Industries, Inc.
2004 SAE World CongressDetroit, MichiganMarch 8-11, 2004

All rights reserved. No part of this publication may be reproduced, stored in a retrieval system, ortransmitted, in any form or by any means, electronic, mechanical, photocopying, recording, or otherwise,without the prior written permission of SAE.
For permission and licensing requests contact:
SAE Permissions400 Commonwealth DriveWarrendale, PA 15096-0001-USAEmail: [email protected]: 724-772-4891Tel: 724-772-4028
For multiple print copies contact:
SAE Customer ServiceTel: 877-606-7323 (inside USA and Canada)Tel: 724-776-4970 (outside USA)Fax: 724-776-1615Email: [email protected]
ISBN 0-7680-1319-4Copyright © 2004 SAE International
Positions and opinions advanced in this paper are those of the author(s) and not necessarily those of SAE.The author is solely responsible for the content of the paper. A process is available by which discussionswill be printed with the paper if it is published in SAE Transactions.
Persons wishing to submit papers to be considered for presentation or publication by SAE should send themanuscript or a 300 word abstract of a proposed manuscript to: Secretary, Engineering Meetings Board, SAE.
Printed in USA

2004-01-1257
2005 Ford GT- Maintaining Your Cool at 200 MPH
Ford Motor Co.
Roush Industries, Inc.
Copyright © 2004 SAE International
Figure 1. Plan view of the cooling system.
ABSTRACT
An integrated engineering approach using computer modeling, laboratory and vehicle testing enabled the Ford GT engineering team to achieve supercar thermal management performance within the aggressive program timing. Theoretical and empirical test data was used during the design and development of the engine cooling system. The information was used to verify design assumptions and validate engineering efforts. This design approach allowed the team to define a system solution quickly and minimized the need for extensive vehicle level testing.
The result of this approach was the development of an engine cooling system that adequately controls air, oil and coolant temperatures during all driving and environmental conditions. INTRODUCTION
The Ford GT program was approved with several major challenges built in: the appearance and overall package size was defined by the show car, performance targets were consistent with world class supercars, and the
Curtis M. Hill and Glenn D. Miller
Michael R. Evans and David M. Pollock

program timeline was extremely short with aggressive milestones.
The GT architecture reflects the basic layout of the historic GT40: a mid-engine V8 with transaxle, central fuel tank, and front mounted cooling module. The supercharged, intercooled 5.4L aluminum engine target was 500+ net horsepower, while meeting emissions, driveability, and quality standards consistent with a modern road car and achieving race car performance levels. (See Paper #2004-01-1252 Ford GT Powertrain – Supercharged Supercar)
COOLING SYSTEM TARGETS
Cooling system performance targets were likewise defined consistent with world-class supercars. The Ford GT was to meet corporate requirements for high and low temperature operation under road car and racecar duty cycles. These include high ambient temperature operation at high engine speeds typical of spirited driving on twisty, mountain roads or road courses, continuous high vehicle speed at or near maximum velocity, and stop and go city traffic.
Performance targets are shown in this chart:
Maximum
Allowable Temp (°F)
Ambient Condition (°F)
Engine Coolant Outlet 245 110 Engine Oil Outlet 300 110 Combustion Air 200 110 COOLING SYSTEM ASSUMPTIONS
The Ford GT cooling system design includes the “normal” engine cooling components for water, oil and interior heating and cooling plus the intercooler circuit.
The front-mounted cooling module is made up of the AC condenser, intercooler radiator (low temp. radiator-LTR), and engine coolant radiator (high temp. radiator-HTR) Also mounted in the front is the electric LTR coolant pump.
The engine compartment components include the engine-driven engine coolant pump, the thermostat housing, LTR and HTR de-gas bottles, and the engine-mounted oil cooler. (The Ford GT engine uses oil to cool the pistons.)
Tubes and hoses connecting front and rear components are routed through the central tunnel and the right side rocker panel.
Figure 1a. Cooling system layout
SYSTEM DESIGN
The challenge of balancing the engine cooling requirements and engine power levels was separated into the following engineering tasks:
• Current design practices
• Vehicle performance requirements
• Vehicle package constraints
• Engineering Projections
• Engine heat load estimation
• Airflow estimates and practical flow optimization
• Cooling system performance predictions
• Engine
• Intercooler
• Oil cooler
CURRENT DESIGN PRACTICES
The goal was to leverage existing base engine cooling system technologies and ensure the Ford GT would achieve program performance targets.

Competitive and corporate vehicles were evaluated against the program design targets. Using proposed engine power levels and current calibration strategies, existing thermal system performances were recalculated using the increased engine power levels and compared to program design targets. Calculated deficiencies in the existing base engine cooling system at these elevated power levels led to identification of the problem areas and allowed the scope of design and development work to be identified and prioritized.
VEHICLE PERFORMANCE REQUIREMENTS
Initially two drive cycles were identified for analysis. One cycle was classified as low-speed and high-power driving. The other was driving with high-speed, high power.
The term Vmin was used to describe the conditions of low average speed and repeated bursts of power, during zero to 70 mile per hour accelerations. This driving condition could occur on small to medium sized road courses or during aggressive over the road driving.
Figure 2: Projected Ford GT Engine Output
The other was Vmax, identified as a driving condition that would occur during high vehicle speed, high-power application. This type of driving might be typical of medium to large road courses with long straight sections and average vehicle speeds greater than 70 mile per hour.
Figure 3. Vehicle/Engine speed in each gear
It was apparent from inspection of the engine performance curves (Figure 2) and transmission gear ratios (Figure 3) that the proposed engine torque would be more than adequate to achieve most of the possible rpm-vehicle speed points.
This resulted in two additional concerns:
The engine power level required to overcome the parasitic losses in the engine could cause an overheat condition if the vehicle were driven at moderately low vehicle speeds with high engine speeds and minimal ram air effect.
The available coolant flow rates would be insufficient for the available airflow and the car could overheat if the

engine speeds were low enough even if the ram air was adequate.
The resulting 4 drive cycles would be evaluated as soon as the Attribute Prototype (AP) cars were available.
VEHICLE PACKAGING
The mid-engine vehicle layout provided distinct design challenges. Because the Low Temperature Radiator (LTR) and High Temperature Radiator (HTR) cooling circuits have very long coolant piping runs, good plumbing practices were paramount in the design and packaging of the system. Pumping losses would play a significant role. The vehicle concept itself is a very compact package. The cooling system flow rates needed to be proportionally greater than any cooling system in current corporate passenger vehicles. Any deficiencies in plumbing and their resulting coolant flow restrictions would negatively impact engine performance and durability.
ENGINEERING PROJECTIONS: HEAT EXCHANGERS AND AIRFLOW
An initial analytical model of engine cooling heat loads was developed from the current 5.4L engine. The engine operating characteristics were extrapolated to provide an estimate for the Ford GT engine coolant and oil heat rejection levels. The estimated heat loads to engine oil, coolant, and intercooler were summed and balanced for various conditions.
Using component information supplied from prospective heat exchanger suppliers, the analytical model was created to balance the engine coolant requirements with the heat exchanger characteristics.
The following table summarizes the program assumptions of heat loads that needed to be managed through the cooling module to sustain Vmax at 200 MPH:
Component Heat Loads Heat Load (Btu/min) Condenser 500 Intercooler Radiator 2100 Engine Radiator 8000 Oil cooler 2800 Total Airside Load
13400
The minimum requirements for sustained airflow were calculated to be 7500 CFM at an ambient temperature of 110 degrees Fahrenheit. See the following chart: Ambient Temp (F)
Total Heat to Air (Btu/min)
Airflow (lbm/min)
Airflow (scfm)
Air Density (lbm/ft3)
80 13400 429.5 5276.5 0.0750 85 13400 446.7 5955.6 0.0750 90 13400 465.3 6203.7 0.0750 95 13400 485.5 6473.4 0.0750
100 13400 507.6 6767.7 0.0750 105 13400 531.7 7089.9 0.0750 110 13400 558.3 7444.4 0.0750 115 13400 587.7 7836.3 0.0750 120 13400 620.4 8271.6 0.0750
A study of air velocities achieved by current production vehicles concluded the effective airflow through the heat exchangers, expressed as a percentage of the available free stream velocity, was in the range of 12-18 percent.
Using an effective air speed of 18 percent, the following equivalent airflow were calculated based on a one square foot grille opening.
Vehicle Speed (MPH)
Velocity Ratio (Ve/Vf)
Effective Air Velocity (MPH)
Effective Air Flow rate (CFM)
30 0.18 5.4 475.2 60 0.18 10.8 950.4 90 0.18 16.2 1425.6
120 0.18 21.6 1900.8 150 0.18 27 2376 180 0.18 32.4 2851.7 200 0.18 36 3168
These results show that regardless of cooling module fin densities and grille open area, the effective air flow would not be sufficient to cool the engine. At a sustained vehicle speed of 200 MPH and a velocity ratio of 18 percent, the resulting airflow is 3168 cubic feet per minute (CFM) versus the required flow of 7500 CFM.

The next table depicts the unrealistic velocity ratio that would provide the requisite airflow.
Required Velocity Ratio for 7500 CFM
Vehicle Speed (MPH)
Velocity Ratio (Ve/Vf)
Effective Air Velocity (MPH)
Effective Air Flow rate (CFM)
30 0.43 12.9 1135.2 60 0.43 25.8 2270.4 90 0.43 38.7 3405.6
120 0.43 51.6 4540.8 150 0.43 64.5 5676 180 0.43 77.4 6811.2 200 0.43 86 7568
An investigation into optimizing airflow rates through the cooling module and bodywork of the GT was initiated. A full-size aerodynamic buck was created and various cooling module configurations and ductwork were evaluated in the wind tunnel. (Figure 4)
Figure 4: Measured Wind Tunnel Airflow
The airflow study results indicated that airflow could be a major issue. Further analysis would require in-vehicle testing when prototypes were available.
OPTIMIZING COOLANT MODULE PERFORMANCE
Engine cooling performance analyses were developed by studying the balance point of the engine coolant temperature and assumed airflow.
There is a direct relationship between the average air discharge of the cooling module and the discharge
engine coolant from the radiator. This relationship can be used to describe thermodynamic balance problems between the coolant and air heat exchanger mechanisms. (Figure 5)
If the relationship between the average radiator discharge air and the coolant is known, then a maximum radiator air discharge temperature can be used to describe a borderline overheat condition. By constraining the radiator air outlet to maximum of 210º Fahrenheit, a solution matrix of minimum acceptable air mass flow rates could be solved. This solution matrix was generated for a range of cooling module loads and ambient operating conditions.
Figure 5: Cooling module heat load balance
COOLING PERFORMANCE PREDICTIONS
Sum of heat loads in cooling module(Condenser, HTR, LTR)
Airside balances all heat from cooling module
COOLING CAPACITIES
Computational fluid dynamics (CFD) computer modeling confirmed that the current engine cooling flow rates were inadequate. The system required a minimum flow rate of 100 gallons per minute in the engine, and a minimum flow rate of 85 gallons per minute to the radiator. (Figure 6)

Figure 6. Required engine coolant flow
COOLANT FLOWS
All proposed cooling components were evaluated and matched to the Ford GT environment to optimize system design:
• Plumbing of circuits and flow balancing
• Engine coolant passages
• Thermostat and housing
• High temperature radiator
• Engine coolant degas circuit
• Heater core
• Water pump
• Intercooler circuit
• Oil cooler
Figure 7. Engine coolant pluming
Engine Coolant Plumbing Figure 7
Cooling fill capacity 8.31 gal
Engine Block and Heads
Coolant passage flow paths were analyzed using CFD and modified to minimize coolant pressure drop and increase total coolant flow.
The first major action was to change from the production block’s side-entry water passage to a front entry. This resulted in a flow improvement of 73.5% without increasing the pressure drop.
The next task was to revise the water jackets to adequately cool the engine without coolant flow between cylinders. The goal was to achieve equal flow to both banks and a 60/40 split to the exhaust side of the right bank and 50/50 on the left.
Extensive CFD modeling resulted in changes to the passages around the impeller, added flow diverters and revised cup plug locations. The new cylinder head was designed to increase flow through the exhaust valve bridge area compared to the production head.
Cooling Module
Heater Core
Degas Bottle
Thermostat
Final CFD analysis predicted 51/49 right/left distribution. Engine dyno testing confirmed a 50/50 split throughout the pump RPM range.
Thermostat
Thermostat housing was redesigned to handle the increased engine coolant flows and to control the flow to the cooling circuits. See Figure 8 • Radiator Coolant Feed Line
• Heater Core and Oil Cooler Feed lines
• Engine Coolant Bypass Return Line
Figure 8. Thermostat housing
Thermostat Figure 8
Thermostat 180°F Start to open
Material Aluminum
Engine coolant inlet 2 inlets, 1.0 in
Bypass coolant outlet 0.75 in
Heater Core Outlet 0.5 in
Radiator Feed 1.25 in
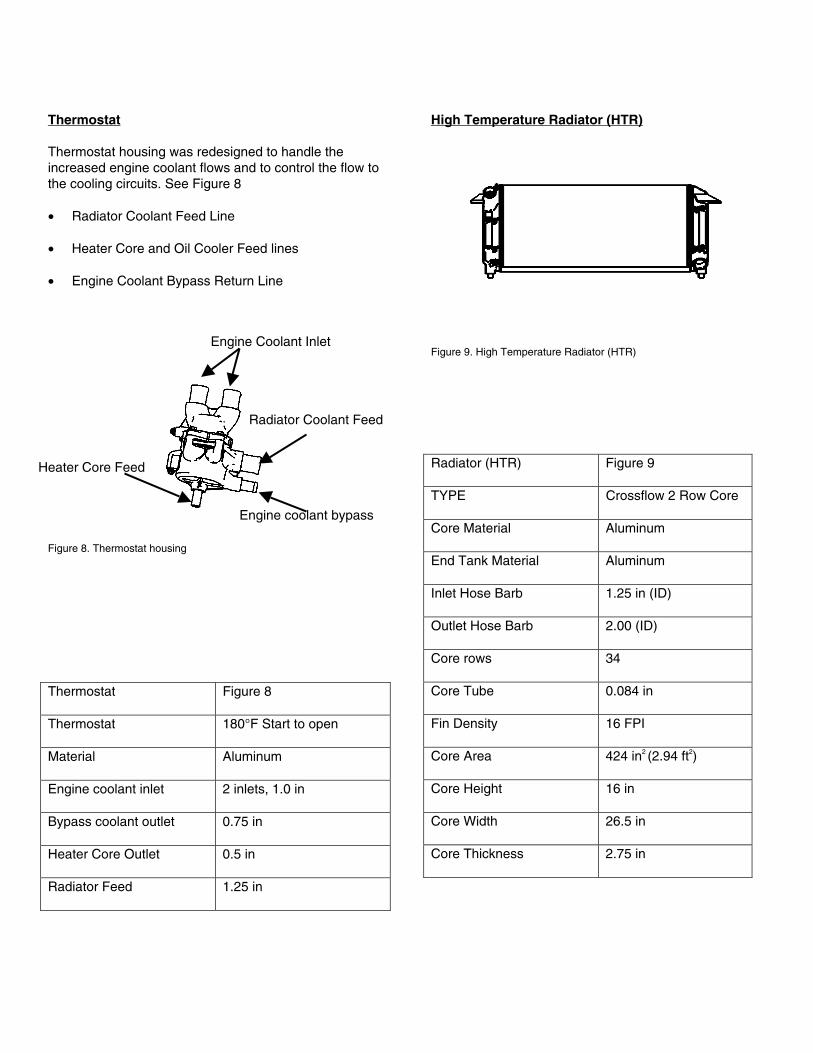
High Temperature Radiator (HTR)
Figure 9. High Temperature Radiator (HTR)
Radiator (HTR) Figure 9
TYPE Crossflow 2 Row Core
Core Material Aluminum
End Tank Material Aluminum
Inlet Hose Barb 1.25 in (ID)
Outlet Hose Barb 2.00 (ID)
Core rows 34
Core Tube 0.084 in
Fin Density 16 FPI
Core Area 424 in2 (2.94 ft2)
Core Height 16 in
Core Width 26.5 in
Core Thickness 2.75 in
Radiator Coolant Feed
Engine Coolant Inlet
Engine coolant bypass
Heater Core Feed

Engine Coolant Degas Bottle
Figure 10. Engine coolant degas bottle
Engine Cooling Degas Bottle Figure 10
Pressure Cap 16 psi
Engine coolant inlet Hose Barbs
2 Hose Barbs, 0.25 in
Engine Coolant Outlet Hose Barb
1.0 in
Coolant capacity to fill 0.396 gal
Heater Core
Figure 11. Heater Core
Heater Core Figure 11
Fin Density 18 FPI
Number of tubes 21
Tube diameter 0.625 (ID)
Size 10.125 x6.85 x0.885 in
Heat Rejection 19400 Btu/hr @ 40 °F air inlet (200°F water temp) 160 cfm
Water pump
The water pump is a reverse rotation, front entrance design. The change from the corporate pump design was driven by the Vmax requirements of a minimum 100 GPM at peak power.
Figure 12. Water pump
Water Pump Figure 12
Rotation CCW
Inlet 2.0 in
Blades 7
Impeller Diameter 4.25 in
Degas Bottle Feeds
Degas Bottle Return

INTERCOOLER CIRCUIT
The Intercooler circuit was another design challenge. The net power target of approximately 100 horsepower per liter, required cooling airflow rates of 65 pound per minute to target temperature of 160 degrees Fahrenheit at 200 mph.. This requirement meant larger coolant flows and heat exchanger capacities than previously available in production.
Figure 13. Intercooler circuit
Intercooler circuit Plumbing Figure 13
Coolant Fill Capacity 1.27 gal
Coolant Plumbing Run 459.6 in
Intercooler
Figure 14. Intercooler
Intercooler Figure 14
Size 11.625 x 4.5 x 0.5 in
Tubes 11 rows
Coolant Inlet Tube 0.75 in
Coolant Outlet Tube 0.75 in
Fin Density 22 FPI
End Tanks 5.0 x 4.25 x 0.75 in
Heat Rejection 2163 Btu/min
Coolant Flow rate 7 GPM
Combustion Airflow 61 lbm/min

Intercooler Electric pump
A higher capacity version of the corporate intercooler pump was needed. Program performance requirements set coolant flow targets at six GPM in to order cool the combustion air during Vmax, 200 MPH. (Figure 15)
Figure 15. Intercooler electric pump
Intercooler Pump Figure 15
Coolant flow rating 10 GPM @ 13.5 psi
Voltage input 9-18 vdc
Max current rating 20 amps
Low Temperature Radiator (LTR)
Figure 16. Low temperature radiator
LTR (Intercooler circuit) Figure 16
Type Single Core Crossflow
Core Material Aluminum
End Tank Material Aluminum
Inlet Hose Barb 1.00 in (ID)
Outlet Hose Barb 1.00 in (ID)
Core Rows 34
Core Tube 0.084 in
Fin Density 12 FPI
Core Area 424 in2 (2.94 ft2)
Core Height 16 in
Core Width 26.5 in
Core Thickness 1.25 in
Intercooler Degas Bottle
The coolant flow rates required to achieve the combustion air targets at Vmax required coolant flow rates through the Degas bottle nearly three times the normal. A significant design feature is the introduction of coolant to the bottle below the coolant fill level to eliminate coolant aeration at high coolant flow rates.
Figure 17. Intercooler degas bottle
I/C Degas Bottle Feed
I/C Degas Bottle Return

Intercooler Degas Bottle Figure 17
Pressure Cap 10 psi
Coolant Inlet Hose Barb 1.0 in
Coolant Outlet Hose Barb 1.0 in
Coolant fill capacity 0.396 gal
Oil Cooler
The engine employs an external dry sump oiling system with internal crankcase mounted oil squirters to provide piston cooling. Oil cooling is accomplished through liquid to liquid heat exchange using a plate cooler.
Figure 18. Oil cooler
Oil Cooler Figure 18
Oil Cooling Plate 10- 10 x10 x0.015 in
Coolant Plates 10-10 x 10 x0.015 in
Inlet Tube (Oil circuit) .0625 in
Outlet Tube (Oil circuit) 0.625 in
Inlet Tube (Coolant circuit) 0.6875 in
Outlet Tube (Coolant Circuit) 0.6875 in
SYSTEM VALIDATION
LABORATORY TESTING
THERMAL BENCH
The goal of these evaluations was to establish coolant flow rate and pressure drop performance maps for engine cooling designs. The methodology for these evaluations was to assemble a complete engine cooling system on a test stand, using in-vehicle positions, elevations and minimum modification to hardware. The engine coolant was heated with an electrical heater and pumped throughout these circuits using the water pump, driven externally by an electric motor. The cooling circuitry was tested through temperatures from 195 to 245º F. This methodology allowed quick evaluation of the following:
• Coolant flow rates in each coolant circuit
• Coolant pressure drop through each component.
• Water Pump sensitivity to boiling and cavitation during sustained high speed operation and rapid accelerations
• Individual component performance
• Total system flow rate and pressure drop
After each battery of tests, system performance was evaluated and changes to components were made.
Plumbing configurations, hose and tubing sizes, coupled with flow restrictors were part of the experiment. The goal of this approach was to achieve the optimum solution, which provided the best flow balance with minimal pumping losses.

Corporate Baseline Radiator Flow versus Ford GT
Figure 19. Radiator flow comparison
Radiator Pressure Drop and Flow Comparison
Figure 20. Radiator performance comparison
Cooling circuit balancing
Figure 21. Cooling component pressure drops
Figure 21a: Cooling component delta temperature
The thermal bench was a valuable tool to assist the vehicle packaging efforts, which often resulted in competition for the same package space in the vehicle. The information gathered from these tests helped define and rank the importance of each component to the overall system performance.

DYNAMOMETER
Engine dynamometer tests were conducted using early prototype engines to validate heat load assumptions made at the beginning of the program.
The results shown below validate the initial program design assumptions and the engineering models. The thermal bench and dynamometer testing provided confidence that the vehicle cooling system would perform to target.
WOT Heat rejection testing
Engine Control Targets for Testing.
WOT 1100 to 6100 RPM in delta 200 RPM steps
Engine Coolant Outlet Temp (°F)
Combustion Air Inlet Temp (°F)
Engine Oil Outlet Temp (°F)
195 77 240
210 77 250
220 77 260
230 77 270
240 77 280
WOT Heat Rejection
Figure 22. WOT heat rejection
Figure 23: WOT heat rejection to coolant and oil
Figure 24: WOT Power and torque
Engine coolant flow was also compared to the initial design target. The actual coolant flow meets the required flow to maintain the target 10-15º F differential across the engine.

Figure 25. Actual vs. required coolant flow
CLIMATE CONTROL TUNNEL
A single Attribute Prototype (AP) vehicle was dedicated to evaluate the three thermal systems.
• HVAC and climate control systems
• Engine and powertrain cooling
• Vehicle thermal protection.
To reduce test time instrumentation was installed to allow simultaneous data collection for all systems. Total channel count exceeded 450, and packaging posed significant challenges due to the compact vehicle interior.
TEST PROCEDURES
As discussed earlier, customer drive cycles were the key to meeting performance targets. The standard validation test procedures needed to be modified to address the uniqueness of this vehicle and identify critical operating conditions that would cause failures in the thermal systems.
The testing strategy was to conduct the standard corporate tests and then evaluate vehicle performance under the 4 drive cycles identified previously..
Since the Attribute Prototype (AP) had all the required instrumentation to evaluate three separate thermal systems, the requirement to repeatedly conduct the same corporate tests was removed. With each return to
the climate control tunnel, slight changes to the testing method allowed the newly updated system components to be evaluated to their design limits. This testing increased engineering confidence in the final vehicle design.
These tests followed the standard and modified steady state tests. One of the new and aggressive tests was a rapid acceleration after the prescribed vehicle soaks at temperature, similar to the Vmin cycle discussed earlier. Additional heat was built up into the thermal systems by dynamic and aggressive driving. The vehicle was accelerated on the chassis rolls as quickly as possible to a target speed. After reaching the target speed, different gear selections were made while maintaining that speed. This testing was intended to simulate high ambient temperature road course drive cycles.
ON-ROAD TESTING
On-road testing was employed to evaluate each of the three thermal systems during real world driving conditions.
The thermal systems were evaluated under extreme and varying driving conditions in the high ambient conditions in the southwest U.S.
This testing was important because the system designs might present problems under less than aggressive driving conditions than that evaluated in the tunnel. The question of whether the cooling system design was robust in different climates and altitudes needed to be addressed.
TRACK TESTING
The thermal Attribute Prototype (AP) car was also tested during road-race course operation. The road course is a two-mile hilly road course with 10 corners. It includes uphill and downhill sections and a 3200-foot straight.
Figure 26. AP racetrack cooling performance

This portion of the test data illustrates the relationship between the engine coolant outlet, Radiator outlet and average air discharge temperatures. The design models that were used in the beginning of the program made use of this relationship to estimate the thermal performances of the cooling modules and ultimately the design of the heat exchanger. From this testing the Vmin, driving characterization is correlated to the thermodynamic balancing of the system. The engine coolant outlet temperature tracked the average air discharge temperature. With each successive lap of the track, it was observed that the engine coolant temperature increased and was heading toward a failure. The root cause for the impending failure was inadequate airflow to balance the coolant loads.
AP TESTING SUMMARY
All three testing modes, tunnel, road and track, yielded consistent and similar results. Repeated WOT accelerations at high engine speeds, the Vmin drive cycle, would result in a continued heat build that would lead to an overtemp condition unless the cycle was interrupted by a higher gear cruise, for example. The root cause was inadequate airflow.
AP level cooling package conditions and grille and hood openings were not representative of the later design levels incorporated into the confirmation prototypes (CP). Alternative frontal grille opening treatments, air handling designs, electric fan packages and fan operating strategies were identified. The cooling module supplier was contacted to investigate methods of reducing the airside pressure drops and to reevaluate the heat transfer impact on the cooling module performance with these changes.
CP TESTING
Confirmation prototypes (CP) incorporated the latest design level for cooling system packaging, system components and air handling.
The confirmation prototype (CP) level cars were subjected to road course testing at the Dearborn Proving
Grounds. This testing was more aggressive than that for the AP vehicle. The testing ambient temperature was hotter; the usage of only first and second gear limited the vehicle speeds and maximized engine cooling heat loads.
Initial test results were essentially the same as those for the AP. Air handling refinements and LTR design revisions improved airflow sufficiently to meet the test target – continuous operation on the DPG handling track without overheating. The results are shown below (Figure 27).
Figure 27: CP racetrack cooling performance
CONCLUSION
Through focused engineering efforts in CAE, CAD, laboratory and vehicle testing, the Ford GT thermal engineering team achieved supercar performance in record time.
Accurate definition of customer drive cycles made possible thermal system designs that provide predictable thermal control of the air, oil and water under all anticipated driving conditions


![MPIA 15 459 1133 - · Dst: Type: icmp time exceeded in-transit [tos OxcO] /-----, -----\ > > > > > > > > > ® . MPIA 15 459 11302/17/99 , !](https://static.fdocuments.in/doc/165x107/5ab91efd7f8b9ac10d8dd314/mpia-15-459-1133-type-icmp-time-exceeded-in-transit-tos-oxco-.jpg)