2002-Inventory of U.S. Greenhouse Gas Emissions and Sinks ...€¦ · through 2000. To ensure that...
26
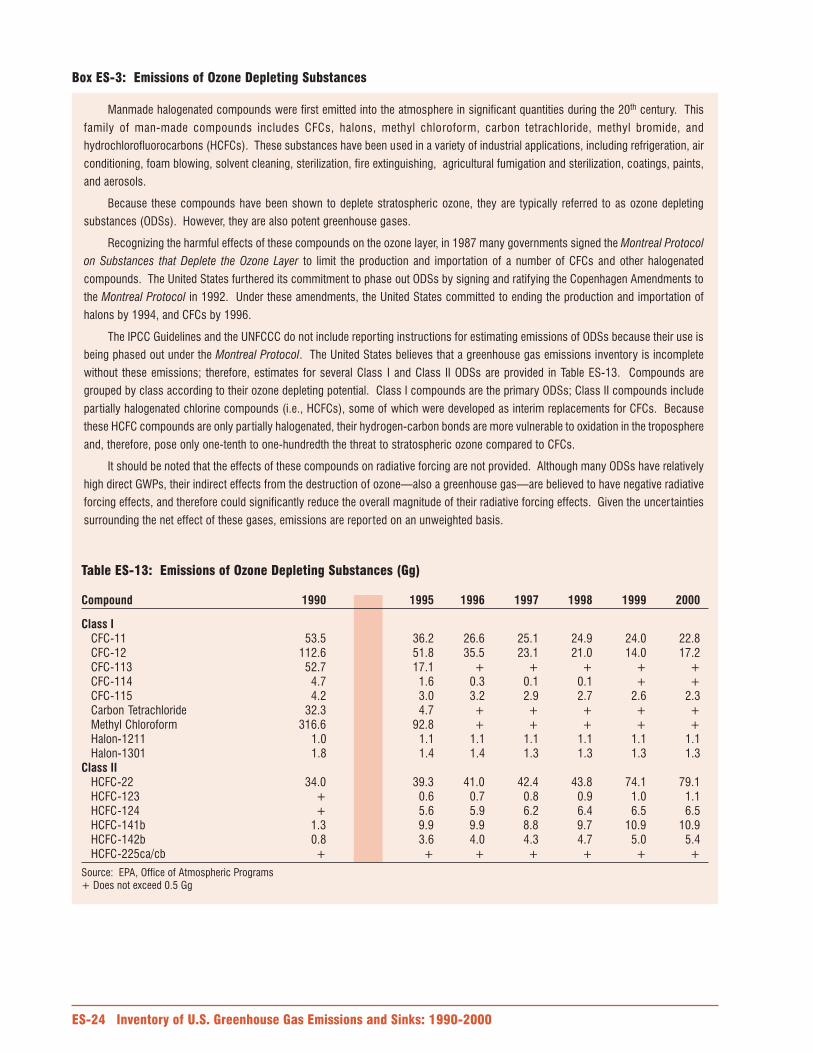
entral to any study of climate change is the development of an emissions inventory that identifies and quantifies a country’s primary anthropogenic 1 sources and sinks of greenhouse gases. This inventory adheres to both 1) a comprehensive and detailed methodology for estimating sources and sinks of anthropogenic greenhouse gases, and 2) a common and consistent mechanism that enables signatory countries to the United Nations Framework Convention on Climate Change (UNFCCC) to compare the relative contribution of different emission sources and greenhouse gases to climate change. Moreover, systematically and consistently estimating national and international emissions is a prerequisite for accounting for reductions and evaluating mitigation strategies. In June of 1992, the United States signed, and later ratified in October, the UNFCCC. The objective of the UNFCCC is “to achieve…stabilization of greenhouse gas concentrations in the atmosphere at a level that would prevent dangerous anthropogenic interference with the climate system.” 2 By signing the Convention, Parties make commitments “to develop, periodically update, publish and make available…national inventories of anthropogenic emissions by sources and removals by sinks of all greenhouse gases not controlled by the Montreal Protocol, using comparable methodologies…” 3 The United States views this report as an opportunity to fulfill this commitment. This chapter summarizes the latest information on U.S. anthropogenic greenhouse gas emission trends from 1990 through 2000. To ensure that the U.S. emissions inventory is comparable to those of other UNFCCC signatory countries, the estimates presented here were calculated using methodologies consistent with those recommended in the Revised 1996 IPCC Guidelines for National Greenhouse Gas Inventories (IPCC/UNEP/OECD/IEA 1997) and the Good Practice Guidance and Uncertainty Management in National Greenhouse Gas Inventories (IPCC 2000). For most source categories, the IPCC default methodologies were expanded, resulting in a more comprehensive and detailed estimate of emissions. Naturally occurring greenhouse gases include water vapor, carbon dioxide (CO 2 ), methane (CH 4 ), nitrous oxide (N 2 O), and ozone (O 3 ). Several classes of halogenated substances that contain fluorine, chlorine, or bromine are also greenhouse gases, but they are, for the most part, solely a product of industrial activities. Chlorofluorocarbons (CFCs) and hydrochlorofluorocarbons (HCFCs) are halocarbons that contain chlorine, while halocarbons that contain bromine are referred to as bromofluorocarbons (i.e., halons). Because CFCs, HCFCs, and halons are stratospheric ozone depleting substances, they are covered under the Montreal Protocol on Substances that Deplete the Ozone Layer. The UNFCCC 1 The term “anthropogenic”, in this context, refers to greenhouse gas emissions and removals that are a direct result of human activities or are the result of natural processes that have been affected by human activities (IPCC/UNEP/OECD/IEA 1997). 2 Article 2 of the Framework Convention on Climate Change published by the UNEP/WMO Information Unit on Climate Change. See <http:// www.unfccc.de>. 3 Article 4 of the Framework Convention on Climate Change published by the UNEP/WMO Information Unit on Climate Change (also identified in Article 12). See <http://www.unfccc.de>.
Transcript of 2002-Inventory of U.S. Greenhouse Gas Emissions and Sinks ...€¦ · through 2000. To ensure that...
entral to any study of climate change is the development of an emissions inventory that identifies and quantifies
a country’s primary anthropogenic1 sources and sinks of greenhouse gases. This inventory adheres to both 1)
a comprehensive and detailed methodology for estimating sources and sinks of anthropogenic greenhouse gases, and 2) a
common and consistent mechanism that enables signatory countries to the United Nations Framework Convention on
Climate Change (UNFCCC) to compare the relative contribution of different emission sources and greenhouse gases to
climate change. Moreover, systematically and consistently estimating national and international emissions is a prerequisite
for accounting for reductions and evaluating mitigation strategies.
In June of 1992, the United States signed, and later ratified in October, the UNFCCC. The objective of the UNFCCC
is “to achieve…stabilization of greenhouse gas concentrations in the atmosphere at a level that would prevent dangerous
anthropogenic interference with the climate system.”2
By signing the Convention, Parties make commitments “to develop, periodically update, publish and make
available…national inventories of anthropogenic emissions by sources and removals by sinks of all greenhouse gases not
controlled by the Montreal Protocol, using comparable methodologies…”3 The United States views this report as an
opportunity to fulfill this commitment.
This chapter summarizes the latest information on U.S. anthropogenic greenhouse gas emission trends from 1990
through 2000. To ensure that the U.S. emissions inventory is comparable to those of other UNFCCC signatory countries,
the estimates presented here were calculated using methodologies consistent with those recommended in the Revised
1996 IPCC Guidelines for National Greenhouse Gas Inventories (IPCC/UNEP/OECD/IEA 1997) and the Good Practice
Guidance and Uncertainty Management in National Greenhouse Gas Inventories (IPCC 2000). For most source categories,
the IPCC default methodologies were expanded, resulting in a more comprehensive and detailed estimate of emissions.
Naturally occurring greenhouse gases include water vapor, carbon dioxide (CO2), methane (CH
4), nitrous oxide (N
2O),
and ozone (O3). Several classes of halogenated substances that contain fluorine, chlorine, or bromine are also greenhouse
gases, but they are, for the most part, solely a product of industrial activities. Chlorofluorocarbons (CFCs) and
hydrochlorofluorocarbons (HCFCs) are halocarbons that contain chlorine, while halocarbons that contain bromine are
referred to as bromofluorocarbons (i.e., halons). Because CFCs, HCFCs, and halons are stratospheric ozone depleting
substances, they are covered under the Montreal Protocol on Substances that Deplete the Ozone Layer. The UNFCCC
1 The term “anthropogenic”, in this context, refers to greenhouse gas emissions and removals that are a direct result of human activities or are theresult of natural processes that have been affected by human activities (IPCC/UNEP/OECD/IEA 1997).2 Article 2 of the Framework Convention on Climate Change published by the UNEP/WMO Information Unit on Climate Change. See <http://www.unfccc.de>.3 Article 4 of the Framework Convention on Climate Change published by the UNEP/WMO Information Unit on Climate Change (also identified inArticle 12). See <http://www.unfccc.de>.
4 Emissions estimates of CFCs, HCFCs, halons and other ozone-depleting substances are included in this document for informational purposes.5 Estimates are presented in units of teragrams of carbon dioxide equivalents (Tg CO2 Eq.), which weight each gas by its Global Warming Potential,or GWP, value. (See the following section on Global Warming Potentials, in Executive Summary or Chapter 1.)
defers to this earlier international treaty; consequently these
gases are not included in national greenhouse gas
inventories.4 Some other fluorine containing halogenated
substances—hydrofluorocarbons (HFCs), perfluorocarbons
(PFCs), and sulfur hexafluoride (SF6)—do not deplete
stratospheric ozone but are potent greenhouse gases. These
latter substances are addressed by the UNFCCC and
accounted for in national greenhouse gas inventories.
There are also several gases that do not have a direct
global warming effect but indirectly affect terrestrial and/
or solar radiation absorption by influencing the formation
or destruction of other greenhouse gases, including
tropospheric and stratospheric ozone. These gases include
carbon monoxide (CO), oxides of nitrogen (NOx), and
nonmethane volatile organic compounds (NMVOCs).
Aerosols, which are extremely small particles or liquid
droplets, such as those produced by sulfur dioxide (SO2) or
elemental carbon emissions, can also affect the absorptive
characteristics of the atmosphere.
Although the direct greenhouse gases CO2, CH
4, and
N2O occur naturally in the atmosphere, their atmospheric
concentrations have been affected by human activities.
Since pre-industrial time (i.e., about 1750), concentrations
of these greenhouse gases have increased by 31, 150, and
16 percent, respectively (IPCC 2001). According to the
IPCC, the current concentration of CO2 and CH
4 in the
atmosphere has not been exceeded in the last 420,000 years.
Additionally, the rate of increase of CO2 in the atmosphere
in the past century has been unprecedented in the last 20,000
years. This build-up has altered the chemical composition
of the earth’s atmosphere, and therefore effected the global
climate system.
Beginning in the 1950s, the use of CFCs and other
stratospheric ozone depleting substances (ODSs) increased
by nearly 10 percent per year until the mid-1980s, when
international concern about ozone depletion led to the
signing of the Montreal Protocol. Since then, the production
of ODSs is being phased out. In recent years, use of ODS
substitutes such as HFCs and PFCs has grown as they begin
to be phased in as replacements for CFCs and HCFCs.
Accordingly, atmospheric concentrations of these substitutes
have been growing (IPCC 2001).
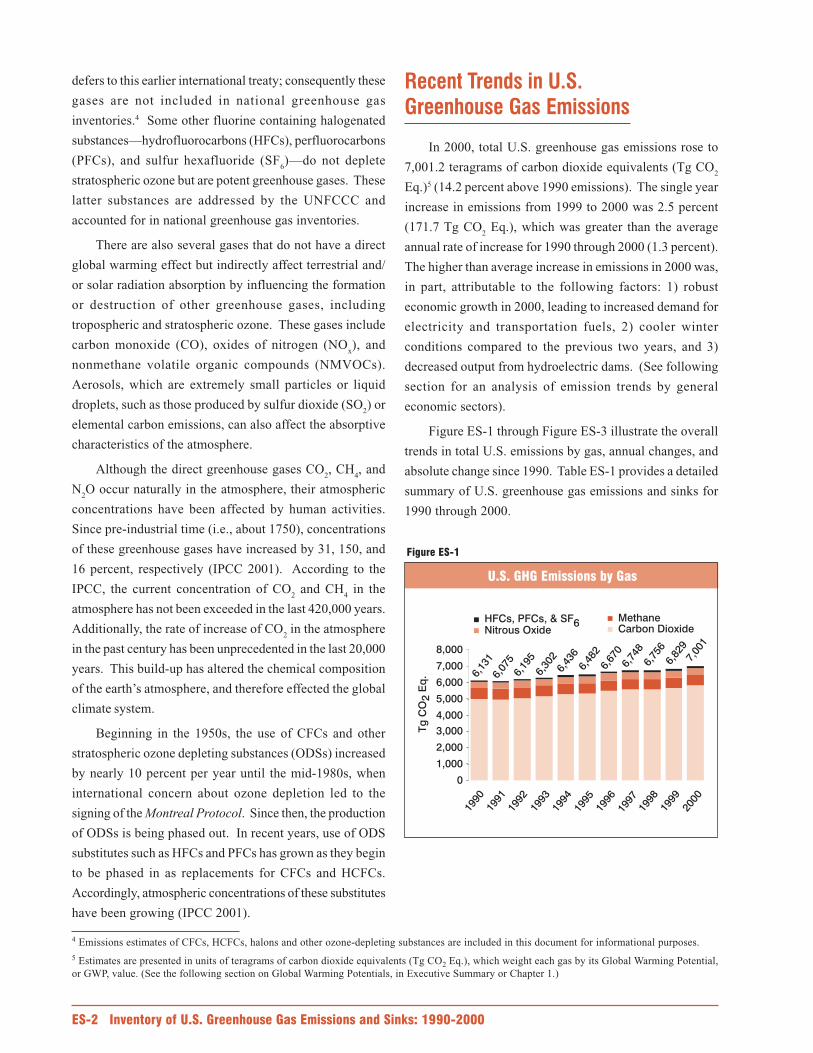
In 2000, total U.S. greenhouse gas emissions rose to
7,001.2 teragrams of carbon dioxide equivalents (Tg CO2
Eq.)5 (14.2 percent above 1990 emissions). The single year
increase in emissions from 1999 to 2000 was 2.5 percent
(171.7 Tg CO2 Eq.), which was greater than the average
annual rate of increase for 1990 through 2000 (1.3 percent).
The higher than average increase in emissions in 2000 was,
in part, attributable to the following factors: 1) robust
economic growth in 2000, leading to increased demand for
electricity and transportation fuels, 2) cooler winter
conditions compared to the previous two years, and 3)
decreased output from hydroelectric dams. (See following
section for an analysis of emission trends by general
economic sectors).
Figure ES-1 through Figure ES-3 illustrate the overall
trends in total U.S. emissions by gas, annual changes, and
absolute change since 1990. Table ES-1 provides a detailed
summary of U.S. greenhouse gas emissions and sinks for
1990 through 2000.
6,13
16,
075
6,19
56,
302
6,43
66,
482
6,67
06,
748
6,75
66,
829
7,00
1
0
1,000
2,000
3,000
4,000
5,000
6,000
7,000
8,000
HFCs, PFCs, & SF6Nitrous Oxide
MethaneCarbon Dioxide
Tg
CO
2E
q.
1999
2000
1998
1997
1996
1995
1994
1993
1992
1991
1990
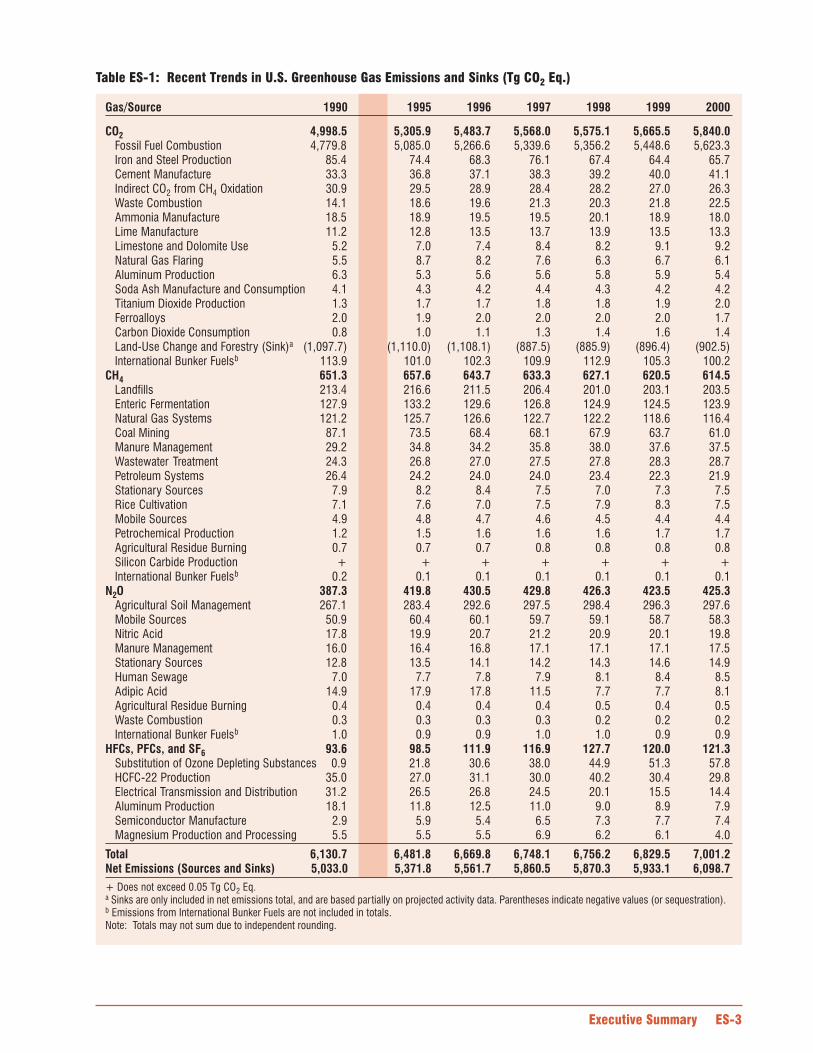
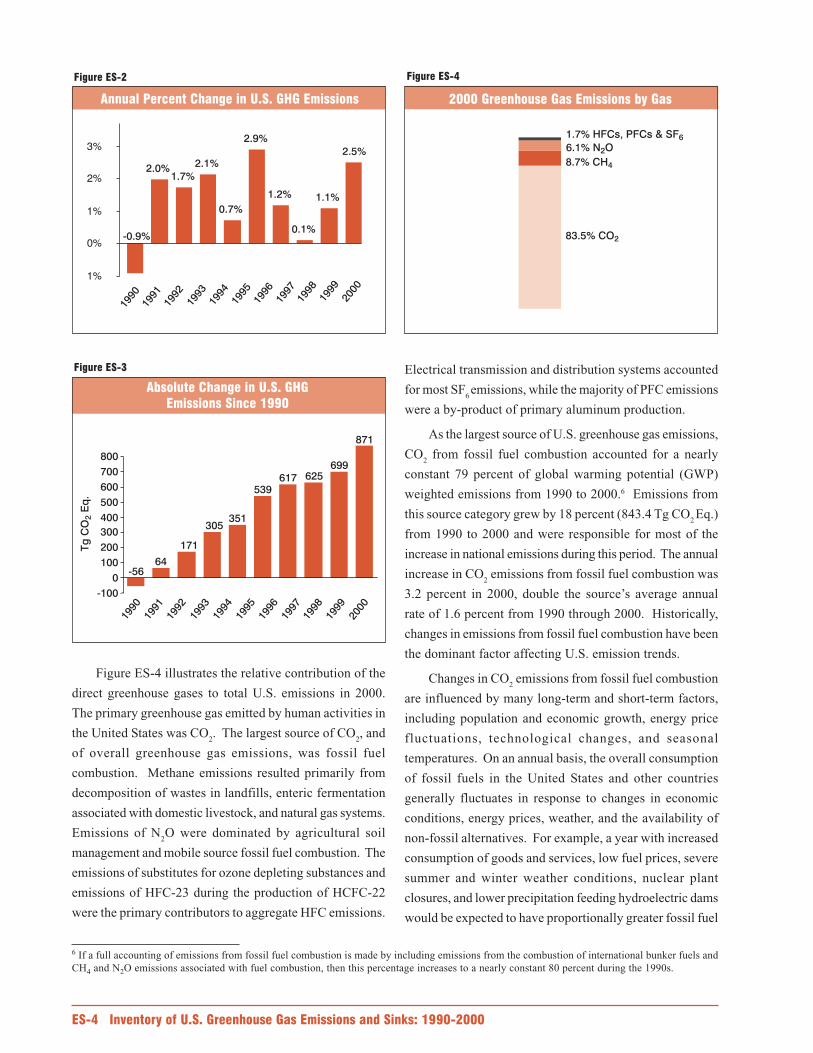
Figure ES-4 illustrates the relative contribution of the
direct greenhouse gases to total U.S. emissions in 2000.
The primary greenhouse gas emitted by human activities in
the United States was CO2. The largest source of CO
2, and
of overall greenhouse gas emissions, was fossil fuel
combustion. Methane emissions resulted primarily from
decomposition of wastes in landfills, enteric fermentation
associated with domestic livestock, and natural gas systems.
Emissions of N2O were dominated by agricultural soil
management and mobile source fossil fuel combustion. The
emissions of substitutes for ozone depleting substances and
emissions of HFC-23 during the production of HCFC-22
were the primary contributors to aggregate HFC emissions.
Electrical transmission and distribution systems accounted
for most SF6 emissions, while the majority of PFC emissions
were a by-product of primary aluminum production.
As the largest source of U.S. greenhouse gas emissions,
CO2 from fossil fuel combustion accounted for a nearly
constant 79 percent of global warming potential (GWP)
weighted emissions from 1990 to 2000.6 Emissions from
this source category grew by 18 percent (843.4 Tg CO2 Eq.)
from 1990 to 2000 and were responsible for most of the
increase in national emissions during this period. The annual
increase in CO2 emissions from fossil fuel combustion was
3.2 percent in 2000, double the source’s average annual
rate of 1.6 percent from 1990 through 2000. Historically,
changes in emissions from fossil fuel combustion have been
the dominant factor affecting U.S. emission trends.
Changes in CO2 emissions from fossil fuel combustion
are influenced by many long-term and short-term factors,
including population and economic growth, energy price
fluctuations, technological changes, and seasonal
temperatures. On an annual basis, the overall consumption
of fossil fuels in the United States and other countries
generally fluctuates in response to changes in economic
conditions, energy prices, weather, and the availability of
non-fossil alternatives. For example, a year with increased
consumption of goods and services, low fuel prices, severe
summer and winter weather conditions, nuclear plant
closures, and lower precipitation feeding hydroelectric dams
would be expected to have proportionally greater fossil fuel
6 If a full accounting of emissions from fossil fuel combustion is made by including emissions from the combustion of international bunker fuels andCH4 and N2O emissions associated with fuel combustion, then this percentage increases to a nearly constant 80 percent during the 1990s.
2.0%1.7%
2.1%
0.7%
2.9%
1.2%
0.1%
1.1%
2.5%
-0.9%
1%
0%
1%
2%
3%
1999
2000
1998
1997
1996
1995
1994
1993
1992
1991
1990
64
171
305351
539617 625
699
871
-56
-100
0
100
200
300
400
500
600
700
800
Tg
CO
Eq
.2
1999
2000
1998
1997
1996
1995
1994
1993
1992
1991
1990
1.7% HFCs, PFCs & SF6
6.1% N O2
8.7% CH4
83.5% CO2
consumption than a year with poor economic performance,
high fuel prices, mild temperatures, and increased output
from nuclear and hydroelectric plants.
Longer-term changes in energy consumption patterns,
however, tend to be more a function of changes that affect
the scale of consumption (e.g., population, number of cars,
and size of houses), the efficiency with which energy is
used in equipment (e.g., cars, power plants, steel mills, and
light bulbs) and consumer behavior (e.g., walking, bicycling,
or telecommuting to work instead of driving).
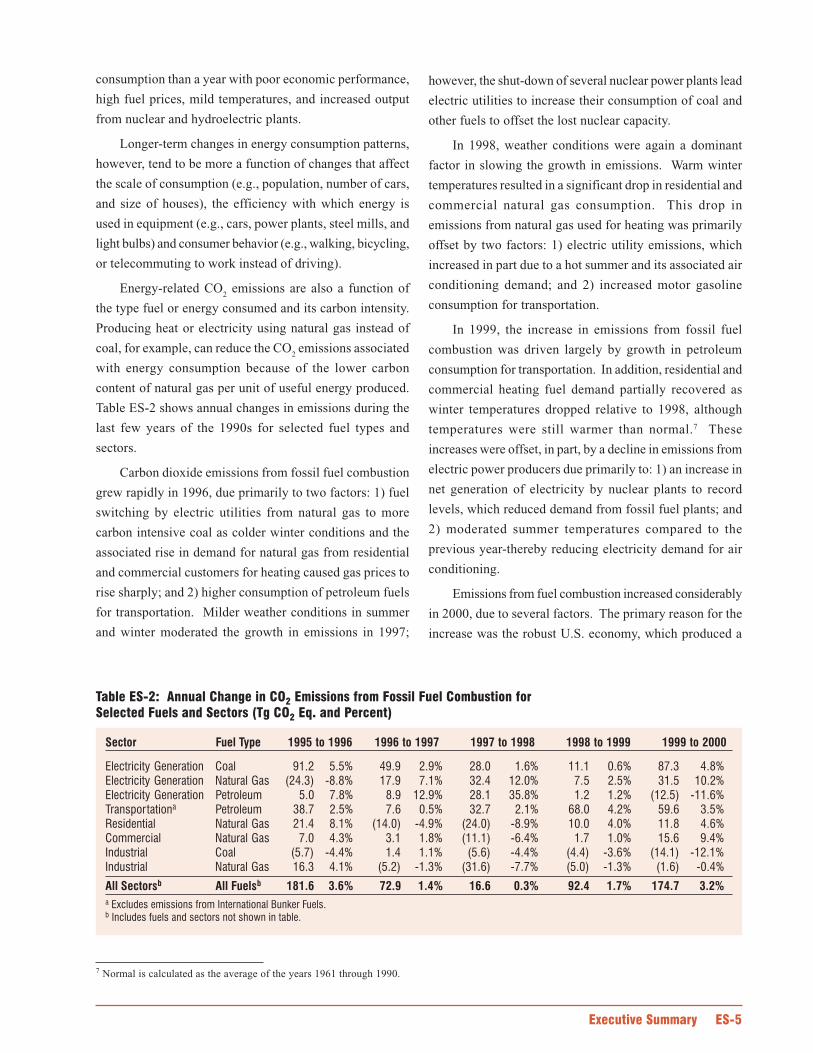
Energy-related CO2 emissions are also a function of
the type fuel or energy consumed and its carbon intensity.
Producing heat or electricity using natural gas instead of
coal, for example, can reduce the CO2 emissions associated
with energy consumption because of the lower carbon
content of natural gas per unit of useful energy produced.
Table ES-2 shows annual changes in emissions during the
last few years of the 1990s for selected fuel types and
sectors.
Carbon dioxide emissions from fossil fuel combustion
grew rapidly in 1996, due primarily to two factors: 1) fuel
switching by electric utilities from natural gas to more
carbon intensive coal as colder winter conditions and the
associated rise in demand for natural gas from residential
and commercial customers for heating caused gas prices to
rise sharply; and 2) higher consumption of petroleum fuels
for transportation. Milder weather conditions in summer
and winter moderated the growth in emissions in 1997;
however, the shut-down of several nuclear power plants lead
electric utilities to increase their consumption of coal and
other fuels to offset the lost nuclear capacity.
In 1998, weather conditions were again a dominant
factor in slowing the growth in emissions. Warm winter
temperatures resulted in a significant drop in residential and
commercial natural gas consumption. This drop in
emissions from natural gas used for heating was primarily
offset by two factors: 1) electric utility emissions, which
increased in part due to a hot summer and its associated air
conditioning demand; and 2) increased motor gasoline
consumption for transportation.
In 1999, the increase in emissions from fossil fuel
combustion was driven largely by growth in petroleum
consumption for transportation. In addition, residential and
commercial heating fuel demand partially recovered as
winter temperatures dropped relative to 1998, although
temperatures were still warmer than normal.7 These
increases were offset, in part, by a decline in emissions from
electric power producers due primarily to: 1) an increase in
net generation of electricity by nuclear plants to record
levels, which reduced demand from fossil fuel plants; and
2) moderated summer temperatures compared to the
previous year-thereby reducing electricity demand for air
conditioning.
Emissions from fuel combustion increased considerably
in 2000, due to several factors. The primary reason for the
increase was the robust U.S. economy, which produced a
7 Normal is calculated as the average of the years 1961 through 1990.

high demand for fuels—especially for petroleum in the
transportation sector—despite increases in the price of both
natural gas and petroleum. Colder winter conditions relative
to the previous year triggered a rise in residential and
commercial demand for heating. Structural and other
economic changes taking place within U.S. industry—
especially manufacturing—lead to lower coal consumption.
Additionally, electricity generation became more carbon
intensive as coal and natural gas consumption offset reduced
hydropower output. In sum, emissions from fossil fuel
combustion exhibited the second highest annual increase
since 1990.
Overall, from 1990 to 2000, total emissions of CO2 and
N2O increased by 841.5 (17 percent) and 38.0 Tg CO
2 Eq.
(10 percent), respectively, while CH4 emissions decreased
by 36.8 Tg CO2 Eq. (6 percent). During the same period,
aggregate weighted emissions of HFCs, PFCs, and SF6 rose
by 27.7 Tg CO2 Eq. (30 percent). Despite being emitted in
smaller quantities relative to the other principal greenhouse
gases, emissions of HFCs, PFCs, and SF6 are significant
because many of them have extremely high global warming
potentials and, in the cases of PFCs and SF6, long
atmospheric lifetimes. Conversely, U.S. greenhouse gas
emissions were partly offset by carbon sequestration in
forests and in landfilled carbon, which were estimated to
be 13 percent of total emissions in 2000.
Other significant trends in emissions from additional
source categories over the eleven year period from 1990
through 2000 included the following:
• Aggregate HFC and PFC emissions resulting from the
substitution of ozone depleting substances (e.g., CFCs)
increased by 56.8 Tg CO2 Eq. This increase was
significantly offset, however, by reductions in PFC
emissions from aluminum production (10.2 Tg CO2 Eq.
or 56 percent), reductions in emissions of HFC-23 from
the production of HCFC-22 (5.2 Tg CO2 Eq. or 15
percent), and reductions of SF6 from electric power
transmission and distribution systems (16.8 Tg CO2 Eq.
or 54 percent). Reductions in PFC emissions from
aluminum production were the result of both industry
emission reduction efforts and lower domestic
aluminum production. HFC-23 emissions from the
production of HCFC-22 decreased due to a reduction
in the intensity of emissions from that source, despite
increased HCFC-22 production. Reduced emissions of
SF6 from electric power transmission and distribution
systems are primarily the result of higher purchase prices
for SF6 and efforts by industry to reduce emissions.
• Methane emissions from coal mining dropped by 26.2
Tg CO2 Eq. (30 percent) as a result of the mining of
less gassy coal from underground mines and the
increased use of methane from degasification systems.
• Nitrous oxide emissions from agricultural soil
management increased by 30.5 Tg CO2 Eq. (11 percent)
as fertilizer consumption and cultivation of nitrogen
fixing crops rose.
• By 1998, all of the three major adipic acid producing
plants had implemented N2O abatement technology, and
as a result, emissions fell by 6.8 Tg CO2 Eq. (46
percent). The majority of this decline occurred from
1997 to 1998, despite increased production.
• Carbon dioxide emissions from feedstock uses of coal
coke for iron and steel production decreased by 19.7
Tg CO2 Eq. (23 percent), as imports of steel have
increased.
• Methane emissions from U.S. landfills decreased 5
percent, as the amount of landfill gas collected and
combusted by landfill operators has increased.
• Emissions of N2O from mobile combustion rose by 7.4
Tg CO2 Eq. (14 percent), primarily due to an increased
average N2O generation rate for the U.S. highway
vehicle fleet.
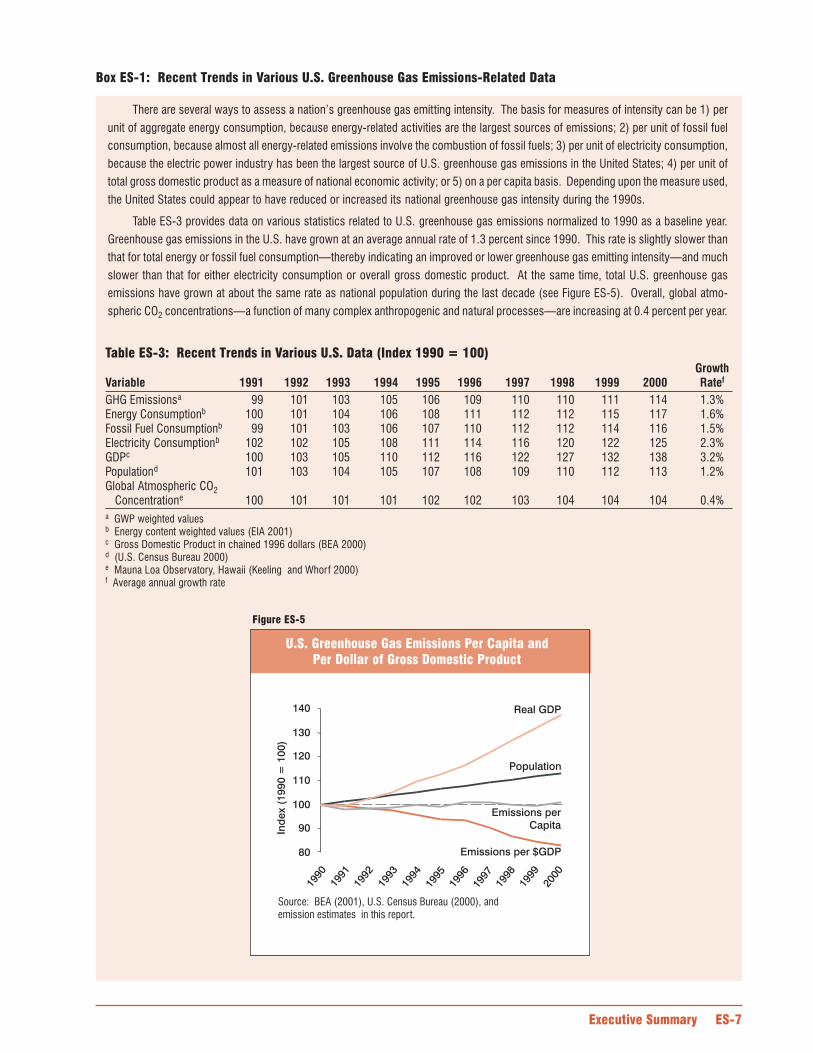
Emissions perCapita
Emissions per $GDP
Population
Real GDP
80
90
100
110
120
130
140
1999
2000
1998
1997
1996
1995
1994
1993
1992
1991
1990
Ind
ex
(19
90
=1
00
)
Source: BEA (2001), U.S. Census Bureau (2000), andemission estimates in this report.
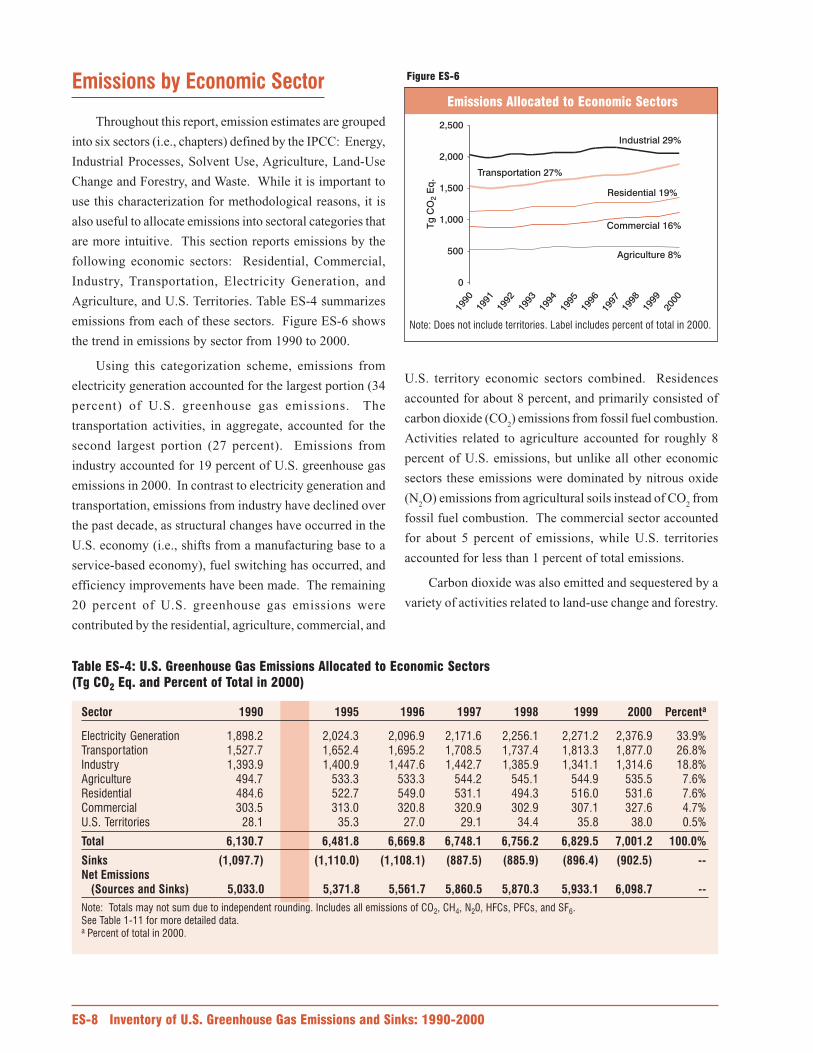
Throughout this report, emission estimates are grouped
into six sectors (i.e., chapters) defined by the IPCC: Energy,
Industrial Processes, Solvent Use, Agriculture, Land-Use
Change and Forestry, and Waste. While it is important to
use this characterization for methodological reasons, it is
also useful to allocate emissions into sectoral categories that
are more intuitive. This section reports emissions by the
following economic sectors: Residential, Commercial,
Industry, Transportation, Electricity Generation, and
Agriculture, and U.S. Territories. Table ES-4 summarizes
emissions from each of these sectors. Figure ES-6 shows
the trend in emissions by sector from 1990 to 2000.
Using this categorization scheme, emissions from
electricity generation accounted for the largest portion (34
percent) of U.S. greenhouse gas emissions. The
transportation activities, in aggregate, accounted for the
second largest portion (27 percent). Emissions from
industry accounted for 19 percent of U.S. greenhouse gas
emissions in 2000. In contrast to electricity generation and
transportation, emissions from industry have declined over
the past decade, as structural changes have occurred in the
U.S. economy (i.e., shifts from a manufacturing base to a
service-based economy), fuel switching has occurred, and
efficiency improvements have been made. The remaining
20 percent of U.S. greenhouse gas emissions were
contributed by the residential, agriculture, commercial, and
U.S. territory economic sectors combined. Residences
accounted for about 8 percent, and primarily consisted of
carbon dioxide (CO2) emissions from fossil fuel combustion.
Activities related to agriculture accounted for roughly 8
percent of U.S. emissions, but unlike all other economic
sectors these emissions were dominated by nitrous oxide
(N2O) emissions from agricultural soils instead of CO
2 from
fossil fuel combustion. The commercial sector accounted
for about 5 percent of emissions, while U.S. territories
accounted for less than 1 percent of total emissions.
Carbon dioxide was also emitted and sequestered by a
variety of activities related to land-use change and forestry.
0
500
1,000
1,500
2,000
2,500
Transportation 27%
Industrial 29%
Residential 19%
Agriculture 8%
Commercial 16%
1999
2000
1998
1997
1996
1995
1994
1993
1992
1991
1990
Tg
CO
Eq
.2
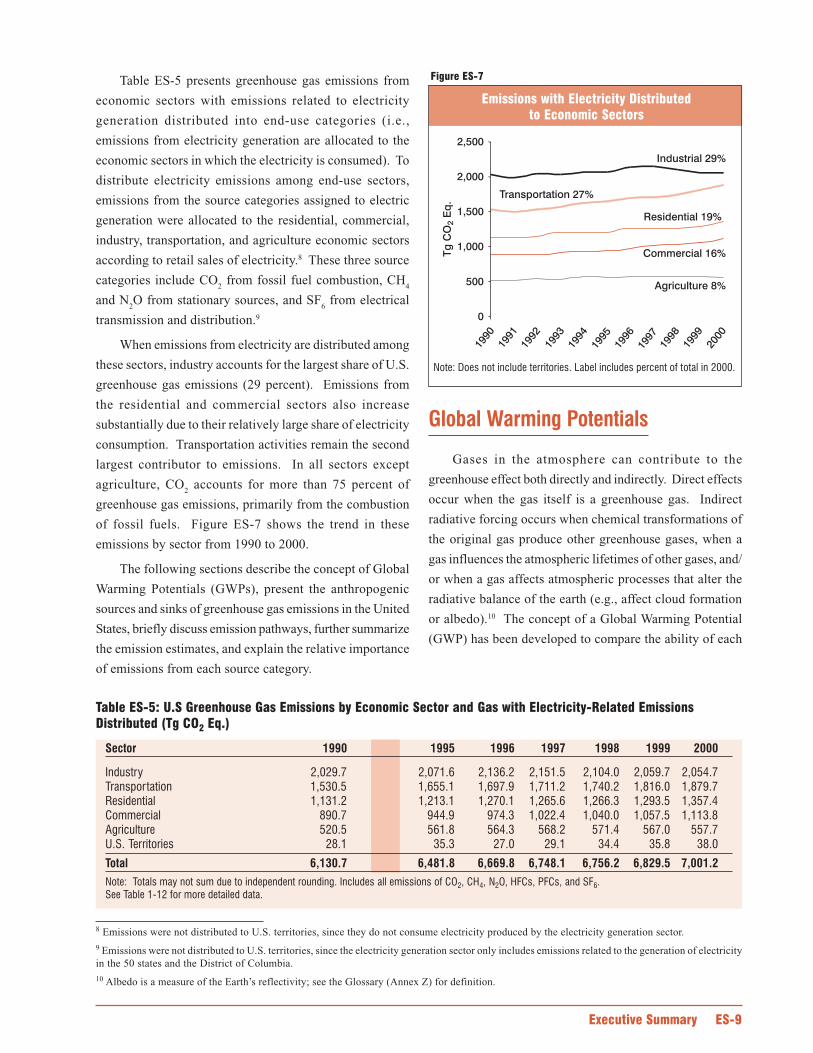
Table ES-5 presents greenhouse gas emissions from
economic sectors with emissions related to electricity
generation distributed into end-use categories (i.e.,
emissions from electricity generation are allocated to the
economic sectors in which the electricity is consumed). To
distribute electricity emissions among end-use sectors,
emissions from the source categories assigned to electric
generation were allocated to the residential, commercial,
industry, transportation, and agriculture economic sectors
according to retail sales of electricity.8 These three source
categories include CO2 from fossil fuel combustion, CH
4
and N2O from stationary sources, and SF
6 from electrical
transmission and distribution.9
When emissions from electricity are distributed among
these sectors, industry accounts for the largest share of U.S.
greenhouse gas emissions (29 percent). Emissions from
the residential and commercial sectors also increase
substantially due to their relatively large share of electricity
consumption. Transportation activities remain the second
largest contributor to emissions. In all sectors except
agriculture, CO2 accounts for more than 75 percent of
greenhouse gas emissions, primarily from the combustion
of fossil fuels. Figure ES-7 shows the trend in these
emissions by sector from 1990 to 2000.
The following sections describe the concept of Global
Warming Potentials (GWPs), present the anthropogenic
sources and sinks of greenhouse gas emissions in the United
States, briefly discuss emission pathways, further summarize
the emission estimates, and explain the relative importance
of emissions from each source category.
Gases in the atmosphere can contribute to the
greenhouse effect both directly and indirectly. Direct effects
occur when the gas itself is a greenhouse gas. Indirect
radiative forcing occurs when chemical transformations of
the original gas produce other greenhouse gases, when a
gas influences the atmospheric lifetimes of other gases, and/
or when a gas affects atmospheric processes that alter the
radiative balance of the earth (e.g., affect cloud formation
or albedo).10 The concept of a Global Warming Potential
(GWP) has been developed to compare the ability of each
8 Emissions were not distributed to U.S. territories, since they do not consume electricity produced by the electricity generation sector.9 Emissions were not distributed to U.S. territories, since the electricity generation sector only includes emissions related to the generation of electricityin the 50 states and the District of Columbia.10 Albedo is a measure of the Earth’s reflectivity; see the Glossary (Annex Z) for definition.
0
500
1,000
1,500
2,000
2,500
Transportation 27%
Industrial 29%
Residential 19%
Agriculture 8%
Commercial 16%
1999
2000
1998
1997
1996
1995
1994
1993
1992
1991
1990
Tg
CO
Eq
.2

11 See FCCC/CP/1999/7 at <www.unfccc.de>.
greenhouse gas to trap heat in the atmosphere relative to
another gas. Carbon dioxide (CO2) was chosen as the
reference gas to be consistent with IPCC guidelines.
Global warming potentials are not provided for CO, NOx,
NMVOCs, SO2, and aerosols because there is no agreed upon
method to estimate the contribution of gases that are short-
lived in the atmosphere, spatially variable, and have only
indirect effects on radiative forcing (IPCC 1996).
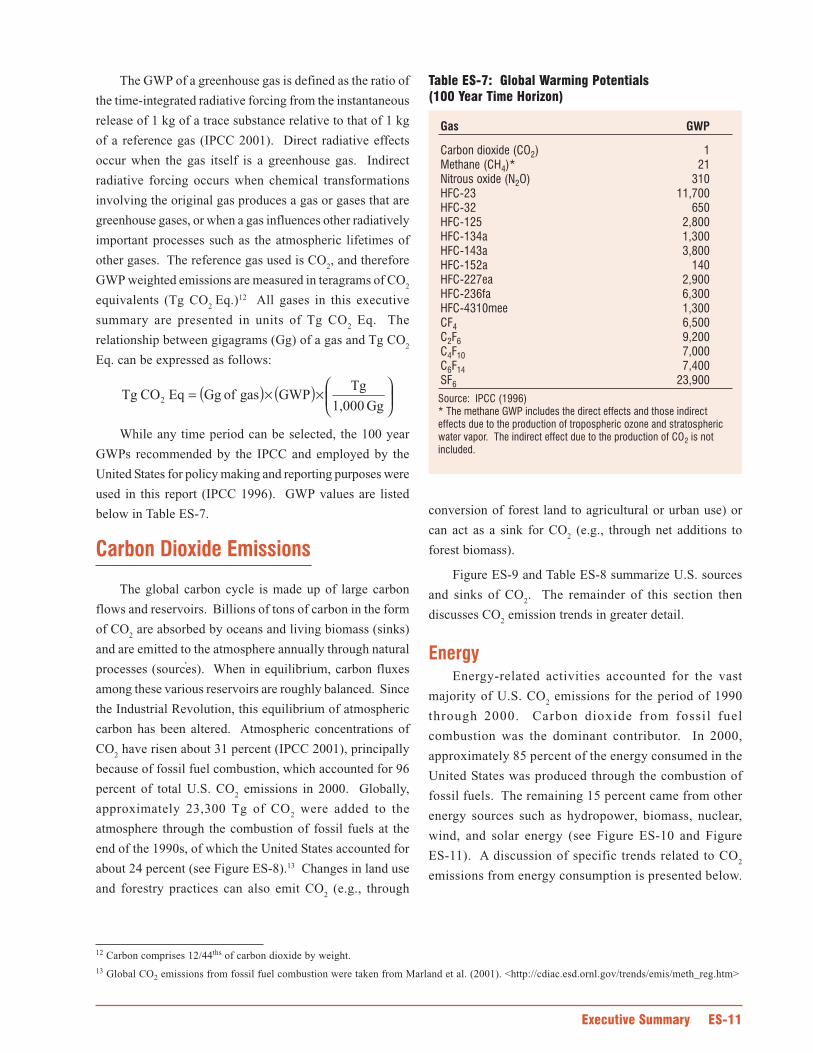
The GWP of a greenhouse gas is defined as the ratio of
the time-integrated radiative forcing from the instantaneous
release of 1 kg of a trace substance relative to that of 1 kg
of a reference gas (IPCC 2001). Direct radiative effects
occur when the gas itself is a greenhouse gas. Indirect
radiative forcing occurs when chemical transformations
involving the original gas produces a gas or gases that are
greenhouse gases, or when a gas influences other radiatively
important processes such as the atmospheric lifetimes of
other gases. The reference gas used is CO2, and therefore
GWP weighted emissions are measured in teragrams of CO2
equivalents (Tg CO2
Eq.)12 All gases in this executive
summary are presented in units of Tg CO2 Eq. The
relationship between gigagrams (Gg) of a gas and Tg CO2
Eq. can be expressed as follows:
( ) ( )
××=
Gg 1,000
TgGWPgasofGgEq CO Tg 2
While any time period can be selected, the 100 year
GWPs recommended by the IPCC and employed by the
United States for policy making and reporting purposes were
used in this report (IPCC 1996). GWP values are listed
below in Table ES-7.
The global carbon cycle is made up of large carbon
flows and reservoirs. Billions of tons of carbon in the form
of CO2 are absorbed by oceans and living biomass (sinks)
and are emitted to the atmosphere annually through natural
processes (sources). When in equilibrium, carbon fluxes
among these various reservoirs are roughly balanced. Since
the Industrial Revolution, this equilibrium of atmospheric
carbon has been altered. Atmospheric concentrations of
CO2 have risen about 31 percent (IPCC 2001), principally
because of fossil fuel combustion, which accounted for 96
percent of total U.S. CO2 emissions in 2000. Globally,
approximately 23,300 Tg of CO2 were added to the
atmosphere through the combustion of fossil fuels at the
end of the 1990s, of which the United States accounted for
about 24 percent (see Figure ES-8).13 Changes in land use
and forestry practices can also emit CO2 (e.g., through
.
12 Carbon comprises 12/44ths of carbon dioxide by weight.13 Global CO2 emissions from fossil fuel combustion were taken from Marland et al. (2001). <http://cdiac.esd.ornl.gov/trends/emis/meth_reg.htm>
conversion of forest land to agricultural or urban use) or
can act as a sink for CO2 (e.g., through net additions to
forest biomass).
Figure ES-9 and Table ES-8 summarize U.S. sources
and sinks of CO2. The remainder of this section then
discusses CO2 emission trends in greater detail.
Energy-related activities accounted for the vast
majority of U.S. CO2 emissions for the period of 1990
through 2000. Carbon dioxide from fossil fuel
combustion was the dominant contributor. In 2000,
approximately 85 percent of the energy consumed in the
United States was produced through the combustion of
fossil fuels. The remaining 15 percent came from other
energy sources such as hydropower, biomass, nuclear,
wind, and solar energy (see Figure ES-10 and Figure
ES-11). A discussion of specific trends related to CO2
emissions from energy consumption is presented below.

ApparentConsumption
6,123
DomesticFossil Fuel
Production4,219
Coal2,084
Natural Gas1,001
Petroleum949
Natural Gas Liquids,Liquefied Refinery Gas,& Other Liquids185
Fossil FuelEnergyImports2,012
Non-EnergyUse Imports
47
StockChanges
133
Fossil FuelConsumption
U.S.Territories
32
Non-EnergyUse U.S.
Territories17
Fossil FuelCombustionResidual(Not OxidizedFraction)50
Non-EnergyUse CarbonSequestered283
Natural Gas CombustionEmissions 1,198
PetroleumCombustion
Emissions2,269
Coal CombustionEmissions
2,029
Fossil FuelEnergyExports257
BalancingItem27
Non-EnergyUse Exports80
(Tg CO Eq.)2InternationalBunkers101
IndustrialProcesses93
2,030
2,388
1,205
AtmosphericEmissions
5,817
Petroleum1,659
NG 202
Coal 38
Other 113
NEU0.6
NEU 119
NEU 7
Note: Totals may not sum due to independent rounding.
The “Balancing Item” above accounts for the statistical imbalancesand unknowns in the reported data sets combined here.
NEU = Non-Energy UseNG = Natural Gas
5,623
0 10 20 30 40
Carbon DioxideConsumption
Ferroalloys
Titanium DioxideProduction
Soda Ash Manufactureand Consumption
Aluminum Production
Natural Gas Flaring
Limestone andDolomite Use
Lime Manufacture
Ammonia Manufacture
Waste Combustion
Indirect CO Emissions2
Cement Manufacture
Iron and SteelProduction
Fossil Fuel Combustion
Tg CO Eq.2
83.4%
CO as a Portionof all Emissions
2
Source: DOE/EIA-0384(2000), Annual Energy Review 2000,Table 1.3, August 2001
38.4%Petroleum
23.7%Natural Gas
22.8% Coal
8.1% Nuclear
6.9% Renewable
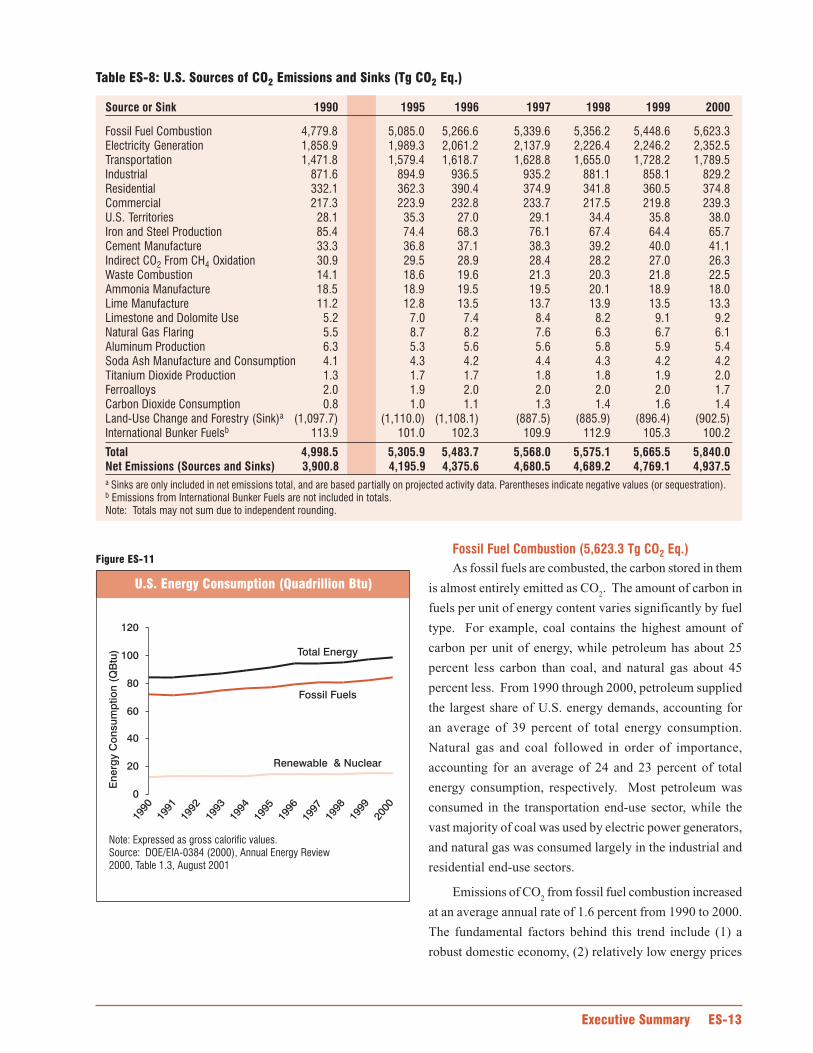
As fossil fuels are combusted, the carbon stored in them
is almost entirely emitted as CO2. The amount of carbon in
fuels per unit of energy content varies significantly by fuel
type. For example, coal contains the highest amount of
carbon per unit of energy, while petroleum has about 25
percent less carbon than coal, and natural gas about 45
percent less. From 1990 through 2000, petroleum supplied
the largest share of U.S. energy demands, accounting for
an average of 39 percent of total energy consumption.
Natural gas and coal followed in order of importance,
accounting for an average of 24 and 23 percent of total
energy consumption, respectively. Most petroleum was
consumed in the transportation end-use sector, while the
vast majority of coal was used by electric power generators,
and natural gas was consumed largely in the industrial and
residential end-use sectors.
Emissions of CO2 from fossil fuel combustion increased
at an average annual rate of 1.6 percent from 1990 to 2000.
The fundamental factors behind this trend include (1) a
robust domestic economy, (2) relatively low energy prices
Fossil Fuels
Total Energy
Renewable & Nuclear
0
20
40
60
80
100
120
1999
2000
1998
1997
1996
1995
1994
1993
1992
1991
1990
En
erg
yC
on
su
mp
tio
n(Q
Btu
)
Note: Expressed as gross calorific values.Source: DOE/EIA-0384 (2000), Annual Energy Review2000, Table 1.3, August 2001
as compared to 1990, (3) significant growth in emissions
from transportation activities and electricity generation, and
(4) heavier reliance on nuclear energy. Between 1990 and
2000, CO2 emissions from fossil fuel combustion steadily
increased from 4,779.8 Tg CO2 Eq. to 5,623.3 Tg CO
2 Eq.—
an 18 percent total increase over the eleven year period.
As introduced above, the four end-use sectors
contributing to CO2 emissions from fossil fuel combustion
include industrial, transportation, residential, and
commercial. Electricity generation also emits CO2, although
these emissions are produced as they consume fossil fuel to
provide electricity to one of the four end-use sectors. For
the discussion below, electricity generation emissions have
been distributed to each end-use sector based upon the
sector’s share of aggregate electricity consumption. This
method of distributing emissions assumes that each end-
use sector consumes electricity that is generated with the
national average mix of fuels according to their carbon
intensity. In reality, sources of electricity vary widely in
carbon intensity. By assuming the same carbon intensity
for each end-use sector’s electricity consumption, for
example, emissions attributed to the residential end-use
sector may be underestimated, while emissions attributed
to the industrial end-use sector may be overestimated.
Emissions from electricity generation are also addressed
separately after the end-use sectors have been discussed.
14 If emissions from international bunker fuels are included, the transportation end-use sector accounted for 34 percent of U.S. emissions from fossilfuel combustion in 2000.
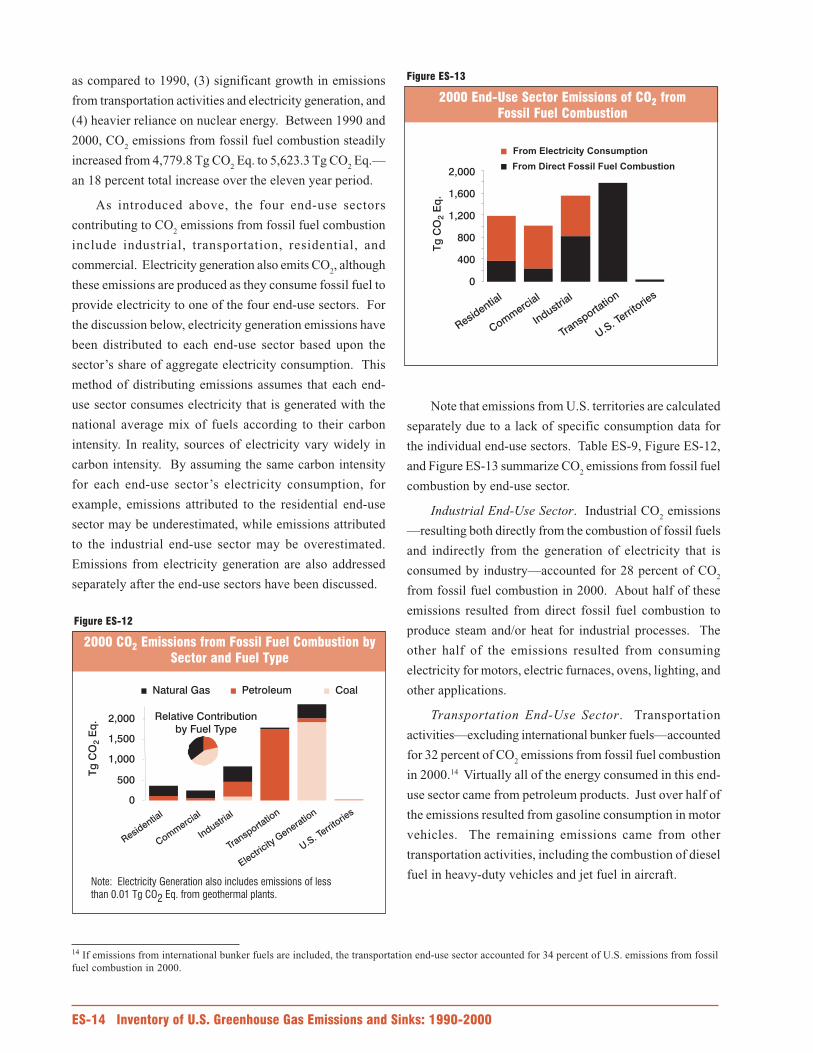
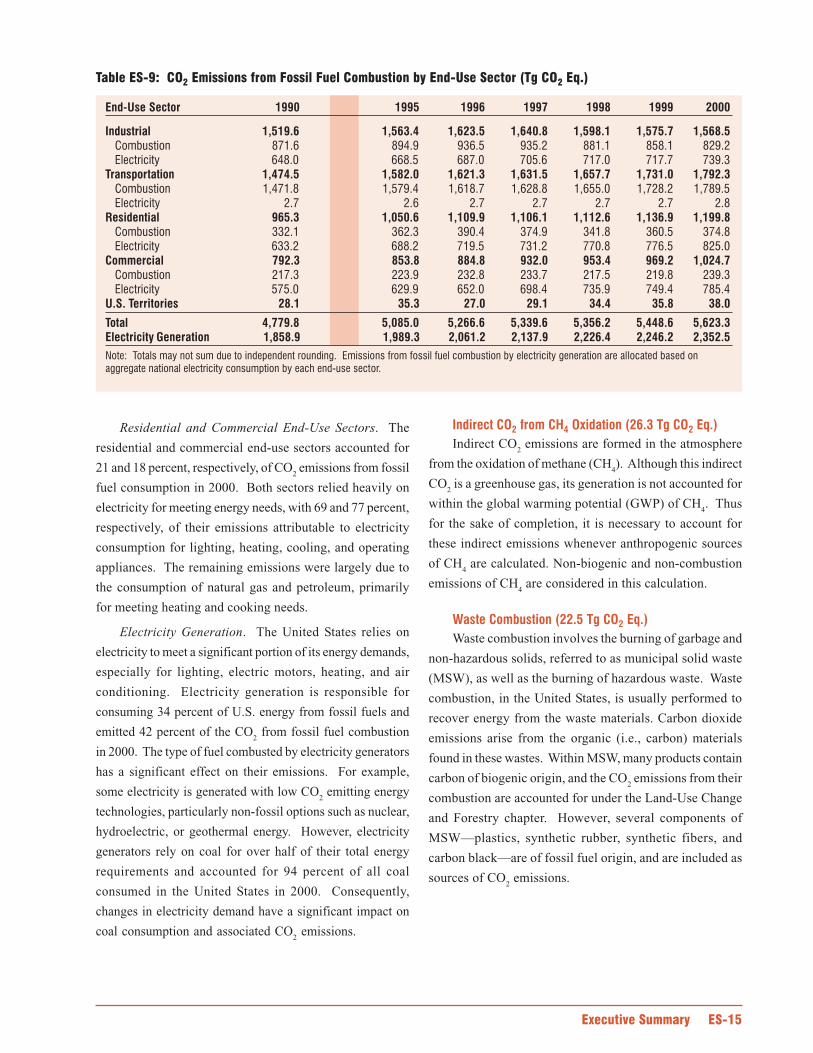
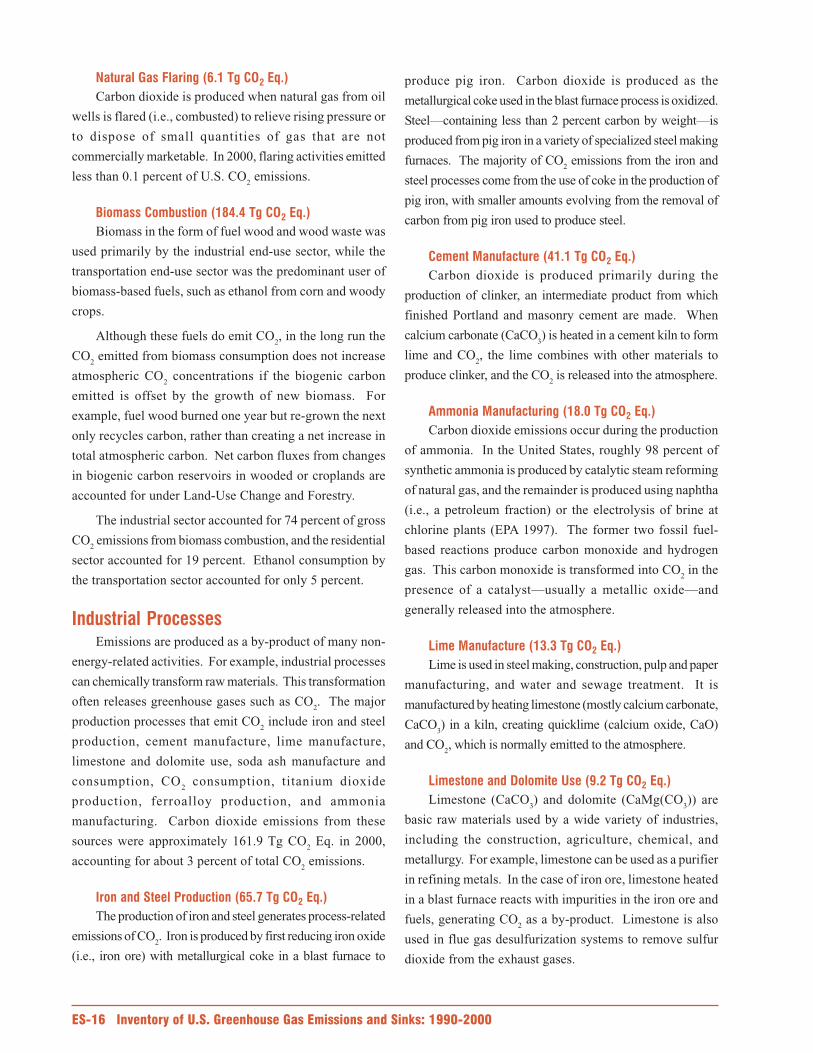
Note that emissions from U.S. territories are calculated
separately due to a lack of specific consumption data for
the individual end-use sectors. Table ES-9, Figure ES-12,
and Figure ES-13 summarize CO2 emissions from fossil fuel
combustion by end-use sector.
Industrial End-Use Sector. Industrial CO2 emissions
—resulting both directly from the combustion of fossil fuels
and indirectly from the generation of electricity that is
consumed by industry—accounted for 28 percent of CO2
from fossil fuel combustion in 2000. About half of these
emissions resulted from direct fossil fuel combustion to
produce steam and/or heat for industrial processes. The
other half of the emissions resulted from consuming
electricity for motors, electric furnaces, ovens, lighting, and
other applications.
Transportation End-Use Sector. Transportation
activities—excluding international bunker fuels—accounted
for 32 percent of CO2 emissions from fossil fuel combustion
in 2000.14 Virtually all of the energy consumed in this end-
use sector came from petroleum products. Just over half of
the emissions resulted from gasoline consumption in motor
vehicles. The remaining emissions came from other
transportation activities, including the combustion of diesel
fuel in heavy-duty vehicles and jet fuel in aircraft.
0
500
1,000
1,500
2,000
Natural Gas Petroleum Coal
Residential
Comm
ercial
Industri
al
Transporta
tion
Electricity
Generatio
n
U.S. Te
rrito
ries
Relative Contributionby Fuel Type
Note: Electricity Generation also includes emissions of lessthan 0.01 Tg CO2 Eq. from geothermal plants.
Tg
CO
Eq
.2
0
400
800
1,200
1,600
2,000
From Electricity Consumption
From Direct Fossil Fuel Combustion
Residential
Comm
ercial
Industri
al
Transporta
tion
U.S. Te
rrito
ries
Tg
CO
Eq
.2
Indirect CO2 emissions are formed in the atmosphere
from the oxidation of methane (CH4). Although this indirect
CO2 is a greenhouse gas, its generation is not accounted for
within the global warming potential (GWP) of CH4. Thus
for the sake of completion, it is necessary to account for
these indirect emissions whenever anthropogenic sources
of CH4 are calculated. Non-biogenic and non-combustion
emissions of CH4 are considered in this calculation.
Waste combustion involves the burning of garbage and
non-hazardous solids, referred to as municipal solid waste
(MSW), as well as the burning of hazardous waste. Waste
combustion, in the United States, is usually performed to
recover energy from the waste materials. Carbon dioxide
emissions arise from the organic (i.e., carbon) materials
found in these wastes. Within MSW, many products contain
carbon of biogenic origin, and the CO2 emissions from their
combustion are accounted for under the Land-Use Change
and Forestry chapter. However, several components of
MSW—plastics, synthetic rubber, synthetic fibers, and
carbon black—are of fossil fuel origin, and are included as
sources of CO2 emissions.
Residential and Commercial End-Use Sectors. The
residential and commercial end-use sectors accounted for
21 and 18 percent, respectively, of CO2 emissions from fossil
fuel consumption in 2000. Both sectors relied heavily on
electricity for meeting energy needs, with 69 and 77 percent,
respectively, of their emissions attributable to electricity
consumption for lighting, heating, cooling, and operating
appliances. The remaining emissions were largely due to
the consumption of natural gas and petroleum, primarily
for meeting heating and cooking needs.
Electricity Generation. The United States relies on
electricity to meet a significant portion of its energy demands,
especially for lighting, electric motors, heating, and air
conditioning. Electricity generation is responsible for
consuming 34 percent of U.S. energy from fossil fuels and
emitted 42 percent of the CO2 from fossil fuel combustion
in 2000. The type of fuel combusted by electricity generators
has a significant effect on their emissions. For example,
some electricity is generated with low CO2 emitting energy
technologies, particularly non-fossil options such as nuclear,
hydroelectric, or geothermal energy. However, electricity
generators rely on coal for over half of their total energy
requirements and accounted for 94 percent of all coal
consumed in the United States in 2000. Consequently,
changes in electricity demand have a significant impact on
coal consumption and associated CO2 emissions.
Carbon dioxide is produced when natural gas from oil
wells is flared (i.e., combusted) to relieve rising pressure or
to dispose of small quantities of gas that are not
commercially marketable. In 2000, flaring activities emitted
less than 0.1 percent of U.S. CO2 emissions.
Biomass in the form of fuel wood and wood waste was
used primarily by the industrial end-use sector, while the
transportation end-use sector was the predominant user of
biomass-based fuels, such as ethanol from corn and woody
crops.
Although these fuels do emit CO2, in the long run the
CO2 emitted from biomass consumption does not increase
atmospheric CO2 concentrations if the biogenic carbon
emitted is offset by the growth of new biomass. For
example, fuel wood burned one year but re-grown the next
only recycles carbon, rather than creating a net increase in
total atmospheric carbon. Net carbon fluxes from changes
in biogenic carbon reservoirs in wooded or croplands are
accounted for under Land-Use Change and Forestry.
The industrial sector accounted for 74 percent of gross
CO2 emissions from biomass combustion, and the residential
sector accounted for 19 percent. Ethanol consumption by
the transportation sector accounted for only 5 percent.
Emissions are produced as a by-product of many non-
energy-related activities. For example, industrial processes
can chemically transform raw materials. This transformation
often releases greenhouse gases such as CO2. The major
production processes that emit CO2 include iron and steel
production, cement manufacture, lime manufacture,
limestone and dolomite use, soda ash manufacture and
consumption, CO2 consumption, titanium dioxide
production, ferroalloy production, and ammonia
manufacturing. Carbon dioxide emissions from these
sources were approximately 161.9 Tg CO2 Eq. in 2000,
accounting for about 3 percent of total CO2 emissions.
The production of iron and steel generates process-related
emissions of CO2. Iron is produced by first reducing iron oxide
(i.e., iron ore) with metallurgical coke in a blast furnace to
produce pig iron. Carbon dioxide is produced as the
metallurgical coke used in the blast furnace process is oxidized.
Steel—containing less than 2 percent carbon by weight—is
produced from pig iron in a variety of specialized steel making
furnaces. The majority of CO2 emissions from the iron and
steel processes come from the use of coke in the production of
pig iron, with smaller amounts evolving from the removal of
carbon from pig iron used to produce steel.
Carbon dioxide is produced primarily during the
production of clinker, an intermediate product from which
finished Portland and masonry cement are made. When
calcium carbonate (CaCO3) is heated in a cement kiln to form
lime and CO2, the lime combines with other materials to
produce clinker, and the CO2 is released into the atmosphere.
Carbon dioxide emissions occur during the production
of ammonia. In the United States, roughly 98 percent of
synthetic ammonia is produced by catalytic steam reforming
of natural gas, and the remainder is produced using naphtha
(i.e., a petroleum fraction) or the electrolysis of brine at
chlorine plants (EPA 1997). The former two fossil fuel-
based reactions produce carbon monoxide and hydrogen
gas. This carbon monoxide is transformed into CO2 in the
presence of a catalyst—usually a metallic oxide—and
generally released into the atmosphere.
Lime is used in steel making, construction, pulp and paper
manufacturing, and water and sewage treatment. It is
manufactured by heating limestone (mostly calcium carbonate,
CaCO3) in a kiln, creating quicklime (calcium oxide, CaO)
and CO2, which is normally emitted to the atmosphere.
Limestone (CaCO3) and dolomite (CaMg(CO
3)) are
basic raw materials used by a wide variety of industries,
including the construction, agriculture, chemical, and
metallurgy. For example, limestone can be used as a purifier
in refining metals. In the case of iron ore, limestone heated
in a blast furnace reacts with impurities in the iron ore and
fuels, generating CO2 as a by-product. Limestone is also
used in flue gas desulfurization systems to remove sulfur
dioxide from the exhaust gases.
Carbon dioxide is emitted during the aluminum
smelting process when alumina (aluminum oxide, Al2O
3) is
reduced to aluminum. The reduction of the alumina occurs
through electrolysis in a molten bath of natural or synthetic
cryolite. The reduction cells contain a carbon lining that
serves as the cathode. Carbon is also contained in the anode,
which can be a carbon mass of paste, coke briquettes, or
prebaked carbon blocks from petroleum coke. During
reduction, some of this carbon is oxidized and released to
the atmosphere as CO2.
Commercial soda ash (sodium carbonate, Na2CO
3) is
used in many consumer products, such as glass, soap and
detergents, paper, textiles, and food. During the
manufacturing of soda ash, some natural sources of sodium
carbonate are heated and transformed into a crude soda ash,
in which CO2 is generated as a by-product. In addition,
CO2 is often released when the soda ash is consumed.
Titanium dioxide (TiO2) is a metal oxide manufactured
from titanium ore, and is principally used as a pigment.
Titanium dioxide is used as an ingredient in white paint
and as a pigment in the manufacture of white paper, foods,
and other products. There are two processes for making
TiO2, the chloride process and the sulfate process. Carbon
dioxide is emitted from the chloride process, which uses
petroleum coke and chlorine as raw materials.
Carbon dioxide is emitted from the production of
several ferroalloys through the use of metallurgical coke as
a raw material. Ferroalloys are composites of iron and other
elements often including silicon, manganese, and chromium.
When incorporated in alloy steels, ferroalloys are used to
alter the material properties of the steel.
Carbon dioxide (CO2) is used directly in many segments
of the economy, including food processing, beverage
manufacturing, chemical processing, and a host of industrial
and other miscellaneous applications. Carbon dioxide may
be produced as a by-product from the production of certain
chemicals (e.g., ammonia) from select natural gas wells, or
by separating it from crude oil and natural gas. For the
most part, the CO2 used in these applications is eventually
released to the atmosphere.
When humans alter the terrestrial biosphere through
land use, changes in land-use, and forest management
practices, they alter the natural carbon flux between biomass,
soils, and the atmosphere. Forest management practices,
the management of agricultural soils, management of trees
in urban areas, and landfilling of yard trimmings have
resulted in a net uptake (sequestration) of carbon in the
United States that is equivalent to about 13 percent of total
U.S. gross emissions. Forests (including vegetation, soils,
and harvested wood) accounted for approximately 85
percent of the total sequestration, agricultural soils
(including mineral and organic soils and the application of
lime) accounted for over 7 percent, urban trees accounted
for more than 6 percent, and landfilled yard trimmings
accounted for less than 1 percent of the total sequestration.
The net forest sequestration is largely a result of improved
forest management practices, the regeneration of previously
cleared forest areas, and timber harvesting. In agricultural
soils, mineral soils account for a net carbon sink that is more
than three times larger than the sum of emissions from
organic soils and liming. Net sequestration in agricultural
mineral soils is largely due to improved cropland and grazing
land management practices, especially the adoption of
conservation tillage practices and leaving residues on the
field after harvest, and to taking erodable lands out of
production and planting them with grass or trees through
the Conservation Reserve Program. The landfilled yard
trimmings net sequestration is due to the long-term
accumulation of yard trimming carbon in landfills.
Atmospheric methane (CH4) is an integral component
of the greenhouse effect. Methane’s overall contribution
to global warming is significant because it has been
estimated to be more than 20 times as effective at trapping
heat in the atmosphere as CO2. Over the last two hundred
and fifty years, methane’s concentration in the atmosphere
has increased by 150 percent (IPCC 2001). Experts believe
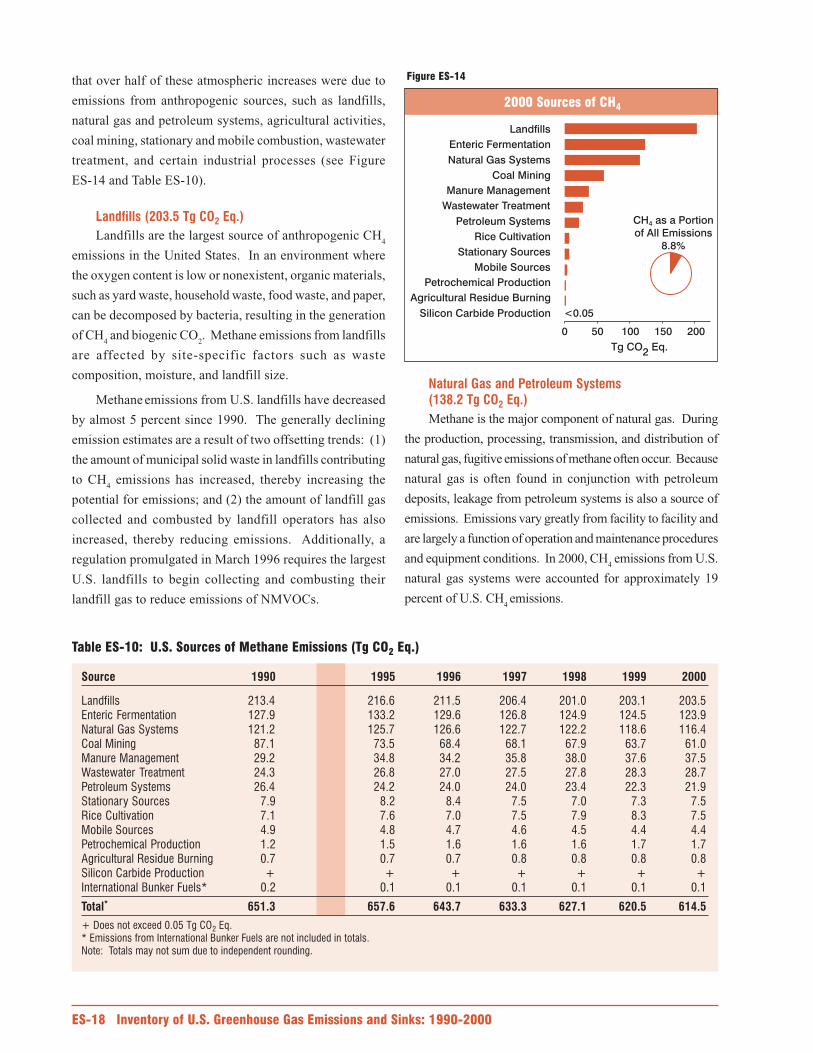
that over half of these atmospheric increases were due to
emissions from anthropogenic sources, such as landfills,
natural gas and petroleum systems, agricultural activities,
coal mining, stationary and mobile combustion, wastewater
treatment, and certain industrial processes (see Figure
ES-14 and Table ES-10).
Landfills are the largest source of anthropogenic CH4
emissions in the United States. In an environment where
the oxygen content is low or nonexistent, organic materials,
such as yard waste, household waste, food waste, and paper,
can be decomposed by bacteria, resulting in the generation
of CH4 and biogenic CO
2. Methane emissions from landfills
are affected by site-specific factors such as waste
composition, moisture, and landfill size.
Methane emissions from U.S. landfills have decreased
by almost 5 percent since 1990. The generally declining
emission estimates are a result of two offsetting trends: (1)
the amount of municipal solid waste in landfills contributing
to CH4 emissions has increased, thereby increasing the
potential for emissions; and (2) the amount of landfill gas
collected and combusted by landfill operators has also
increased, thereby reducing emissions. Additionally, a
regulation promulgated in March 1996 requires the largest
U.S. landfills to begin collecting and combusting their
landfill gas to reduce emissions of NMVOCs.
Methane is the major component of natural gas. During
the production, processing, transmission, and distribution of
natural gas, fugitive emissions of methane often occur. Because
natural gas is often found in conjunction with petroleum
deposits, leakage from petroleum systems is also a source of
emissions. Emissions vary greatly from facility to facility and
are largely a function of operation and maintenance procedures
and equipment conditions. In 2000, CH4 emissions from U.S.
natural gas systems were accounted for approximately 19
percent of U.S. CH4 emissions.
Silicon Carbide Production
Agricultural Residue Burning
Petrochemical Production
Mobile Sources
Stationary Sources
Rice Cultivation
Wastewater Treatment
Petroleum Systems
Manure Management
Coal Mining
Natural Gas Systems
Enteric Fermentation
Landfills
0 50 100 150 200
<0.05
CH as a Portionof All Emissions
8.8%
4
Tg CO2 Eq.

Petroleum is found in the same geological structures
as natural gas, and the two are often retrieved together.
Methane is also saturated in crude oil, and volatilizes as the
oil is exposed to the atmosphere at various points along the
system. Methane emissions from the components of
petroleum systems—including crude oil production, crude
oil refining, transportation, and distribution—generally
occur as a result of system leaks, disruptions, and routine
maintenance. In 2000, emissions from petroleum systems
were just under 4 percent of U.S. methane emissions.
During animal digestion, methane is produced through
the process of enteric fermentation, in which microbes
residing in animal digestive systems break down the feed
consumed by the animal. Ruminants, which include cattle,
buffalo, sheep, and goats, have the highest CH4 emissions
among all animal types because they have a rumen, or large
fore-stomach, in which CH4-producing fermentation occurs.
Non-ruminant domestic animals, such as pigs and horses,
have much lower CH4 emissions. In 2000, enteric
fermentation was the source of about 20 percent of U.S.
CH4 emissions, and more than half of the CH
4 emissions
from agriculture. From 1990 to 2000, emissions from this
source decreased by 3 percent. Emissions from enteric
fermentation have been generally decreasing since 1995,
primarily due to declining dairy cow and beef cattle
populations.
Produced millions of years ago during the formation
of coal, CH4 trapped within coal seams and surrounding rock
strata is released when the coal is mined. The quantity of
CH4 released to the atmosphere during coal mining
operations depends primarily upon the depth and type of
the coal that is mined.
Methane from surface mines is emitted directly to the
atmosphere as the rock strata overlying the coal seam are
removed. Because CH4 in underground mines is explosive
at concentrations of 5 to 15 percent in air, most active
underground mines are required to vent this methane,
typically to the atmosphere. At some mines, CH4-recovery
systems may supplement these ventilation systems.
Recovery of CH4 in the United States has increased in recent
years. During 2000, coal mining activities emitted 10
percent of U.S. CH4 emissions. From 1990 to 2000,
emissions from this source decreased by 30 percent due to
increased use of the CH4 collected by mine degasification
systems and a general shift toward surface mining.
The decomposition of organic animal waste in an
anaerobic environment produces methane. The most
important factor affecting the amount of CH4 produced is
how the manure is managed, because certain types of storage
and treatment systems promote an oxygen-free environment.
In particular, liquid systems tend to encourage anaerobic
conditions and produce significant quantities of CH4,
whereas solid waste management approaches produce little
or no CH4. Higher temperatures and moist climatic
conditions also promote CH4 production.
Emissions from manure management were about 6
percent of U.S. CH4 emissions in 2000 and 22 percent of
the methane emissions from agriculture. From 1990 to 2000,
emissions from this source increased by 28 percent. The
bulk of this increase was from swine and dairy cow manure,
and is attributed to the shift in the composition of the swine
and dairy industries towards larger facilities. Larger swine
and dairy farms tend to use liquid management systems.
Wastewater from domestic sources (i.e., municipal
sewage) and industrial sources is treated to remove soluble
organic matter, suspended solids, pathogenic organisms and
chemical contaminants. Soluble organic matter is generally
removed using biological processes in which
microorganisms consume the organic matter for
maintenance and growth. Microorganisms can biodegrade
soluble organic material in wastewater under aerobic or
anaerobic conditions, with the latter condition producing
CH4. During collection and treatment, wastewater may be
accidentally or deliberately managed under anaerobic
conditions. In addition, the sludge may be further
biodegraded under aerobic or anaerobic conditions.
Untreated wastewater may also produce CH4 if contained
under anaerobic conditions.
Stationary and mobile combustion were responsible for
methane emissions of 7.5 and 4.4 Tg CO2 Eq., respectively.
The majority of emissions from stationary combustion
resulted from the burning of wood in the residential end-
use sector. The combustion of gasoline in highway vehicles
was responsible for the majority of the CH4 emitted from
mobile combustion.
Most of the world’s rice, and all of the rice in the United
States, is grown on flooded fields. When fields are flooded,
anaerobic conditions develop and the organic matter in the
soil decomposes, releasing methane to the atmosphere,
primarily through the rice plants. In 2000, rice cultivation
was the source of 1 percent of U.S. methane emissions, and
about 4 percent of U.S. CH4 emissions from agriculture.
Emission estimates from this source have increased about
5 percent since 1990 due to an increase in the area harvested.
Methane emissions resulted from two industrial
sources, petrochemical and silicon carbide production.
Small amounts of CH4 were released during the production
of five petrochemicals: carbon black, ethylene, ethylene
dichloride, styrene, and methanol. These production
processes resulted in emissions of 1.7 Tg CO2 Eq. in 2000.
Methane is also emitted from the production of silicon
carbide, a material used as an industrial abrasive. In 2000,
silicon carbide production resulted in emissions of less than
0.1 Tg CO2 Eq.
Burning crop residue releases a number of greenhouse
gases, including CH4. Because field burning is not a common
debris clearing method used in the United States, it was
responsible for only 0.1 percent of U.S. CH4 emissions in 1999.
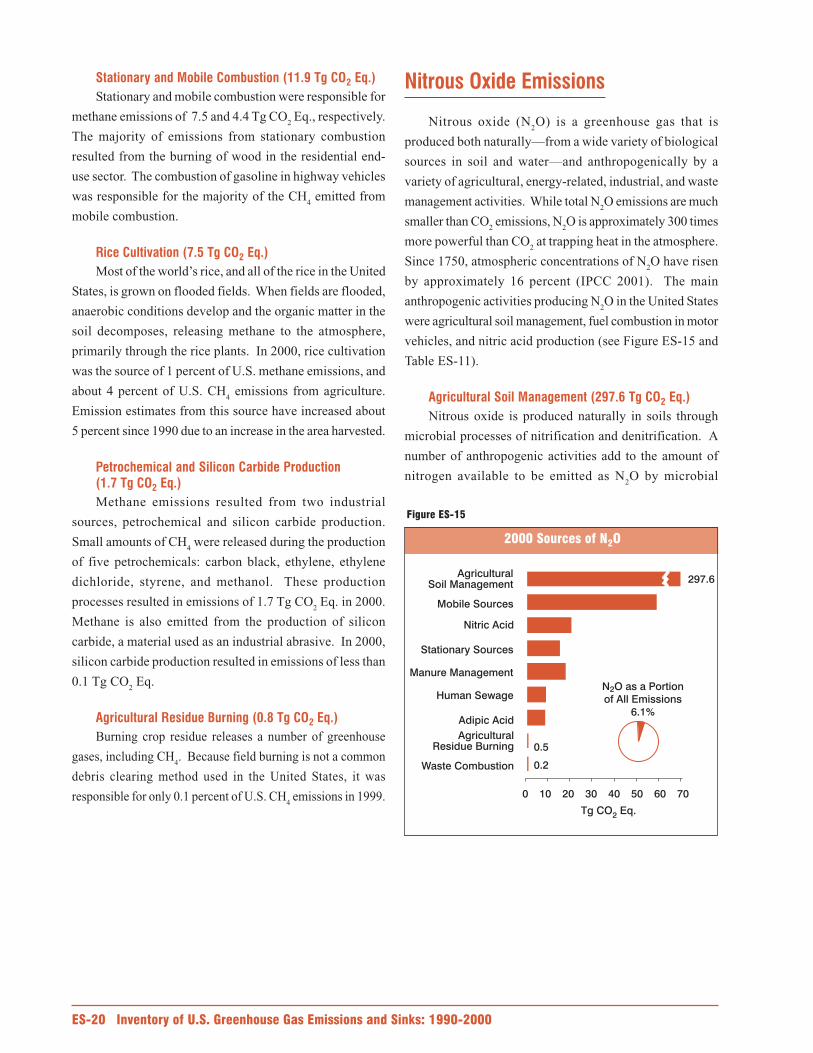
Nitrous oxide (N2O) is a greenhouse gas that is
produced both naturally—from a wide variety of biological
sources in soil and water—and anthropogenically by a
variety of agricultural, energy-related, industrial, and waste
management activities. While total N2O emissions are much
smaller than CO2 emissions, N
2O is approximately 300 times
more powerful than CO2 at trapping heat in the atmosphere.
Since 1750, atmospheric concentrations of N2O have risen
by approximately 16 percent (IPCC 2001). The main
anthropogenic activities producing N2O in the United States
were agricultural soil management, fuel combustion in motor
vehicles, and nitric acid production (see Figure ES-15 and
Table ES-11).
Nitrous oxide is produced naturally in soils through
microbial processes of nitrification and denitrification. A
number of anthropogenic activities add to the amount of
nitrogen available to be emitted as N2O by microbial
0.2
0.5
297.6
0 10 20 30 40 50 60 70
Waste Combustion
AgriculturalResidue Burning
Adipic Acid
Human Sewage
Manure Management
Stationary Sources
Nitric Acid
Mobile Sources
AgriculturalSoil Management
Tg CO Eq.2
N O as a Portionof All Emissions
6.1%
2
processes. These activities may add nitrogen to soils either
directly or indirectly. Direct additions occur through the
application of synthetic and organic fertilizers; production
of nitrogen-fixing crops; the application of livestock manure,
crop residues, and sewage sludge; cultivation of high-
organic-content soils; and direct excretion by animals onto
soil. Indirect additions result from volatilization and
subsequent atmospheric deposition, and from leaching and
surface run-off of some of the nitrogen applied to soils as
fertilizer, livestock manure, and sewage sludge.
In 2000, agricultural soil management accounted for
70 percent of U.S. N2O emissions. From 1990 to 2000,
emissions from this source increased by 11 percent as
fertilizer consumption, manure production, and crop
production rose.
Nitrous oxide is a product of the reaction that occurs
between nitrogen and oxygen during fuel combustion. Both
mobile and stationary combustion emit N2O, and the quantity
emitted varies according to the type of fuel, technology,
and pollution control device used, as well as maintenance
and operating practices. For example, catalytic converters
installed to reduce motor vehicle pollution can result in the
formation of N2O.
In 2000, N2O emissions from mobile combustion were
14 percent of U.S. N2O emissions, while stationary
combustion accounted for 4 percent. From 1990 to 2000,
combined N2O emissions from stationary and mobile
combustion increased by 15 percent, primarily due to
increased rates of N2O generation in highway vehicles.
Most adipic acid produced in the United States is used
to manufacture nylon 6,6. Adipic acid is also used to
produce some low-temperature lubricants and to add a
“tangy” flavor to foods. Nitrous oxide is emitted as a by-
product of the chemical synthesis of adipic acid.
In 2000, U.S. adipic acid plants emitted 2 percent of
U.S. N2O emissions. Even though adipic acid production
has increased, by 1998, all three major adipic acid plants in
the United States had voluntarily implemented N2O
abatement technology. As a result, emissions have decreased
by 46 percent since 1990.
Nitric acid production is another industrial source of
N2O emissions. Used primarily to make synthetic
commercial fertilizer, this raw material is also a major
component in the production of adipic acid and explosives.
Virtually all of the nitric acid manufactured in the
United States is produced by the oxidation of ammonia,
during which N2O is formed and emitted to the atmosphere.
In 2000, N2O emissions from nitric acid production
accounted for 5 percent of U.S. N2O emissions. From 1990
to 2000, emissions from this source category increased by
11 percent as nitric acid production grew.
Nitrous oxide is produced as part of microbial
nitrification and denitrification processes in managed and
unmanaged manure, the latter of which is addressed under
agricultural soil management. Total N2O emissions from
managed manure systems in 2000 accounted for 4 percent
of U.S. N2O emissions. From 1990 to 2000, emissions from
this source category increased by 9 percent, as poultry and
swine populations have increased.
Large quantities of agricultural crop residues are
produced by farming activities, some of which is disposed
by burning in the field. Field burning of crop residues is a
source of N2O, which is released during combustion. Field
burning is not a common method of agricultural residue
disposal in the United States; therefore, emissions from this
source are minor.
Domestic human sewage is usually mixed with other
household wastewater and transported by a collection
system to either a direct discharge, an on-site or
decentralized wastewater system, or a centralized
wastewater system. After processing, treated effluent may
be discharged to a receiving water environment (e.g., river,
lake, estuary, etc.), applied to soils, or disposed of below
the surface. Nitrous oxide (N2O) may be generated during
both nitrification and denitrification of the nitrogen that is
present in the sewage, usually in the form of urea and
proteins. Emissions of N2O from treated human sewage
discharged into aquatic environments were estimated to be
8.5 Tg CO2 Eq. in 2000.
Combustion is used to manage about 7 to 17 percent of
the municipal solid wastes (MSW) generated in the United
States. Almost all combustion of MSW in the United States
occurs at waste-to-energy facilities where energy is
recovered. Most of the organic materials in MSW are of
biogenic origin (e.g., paper, yard trimmings). However,
some components—plastics, synthetic rubber, and synthetic
fibers—are of fossil origin, which accounted for emissions
of 0.2 Tg CO2 Eq. in 2000.
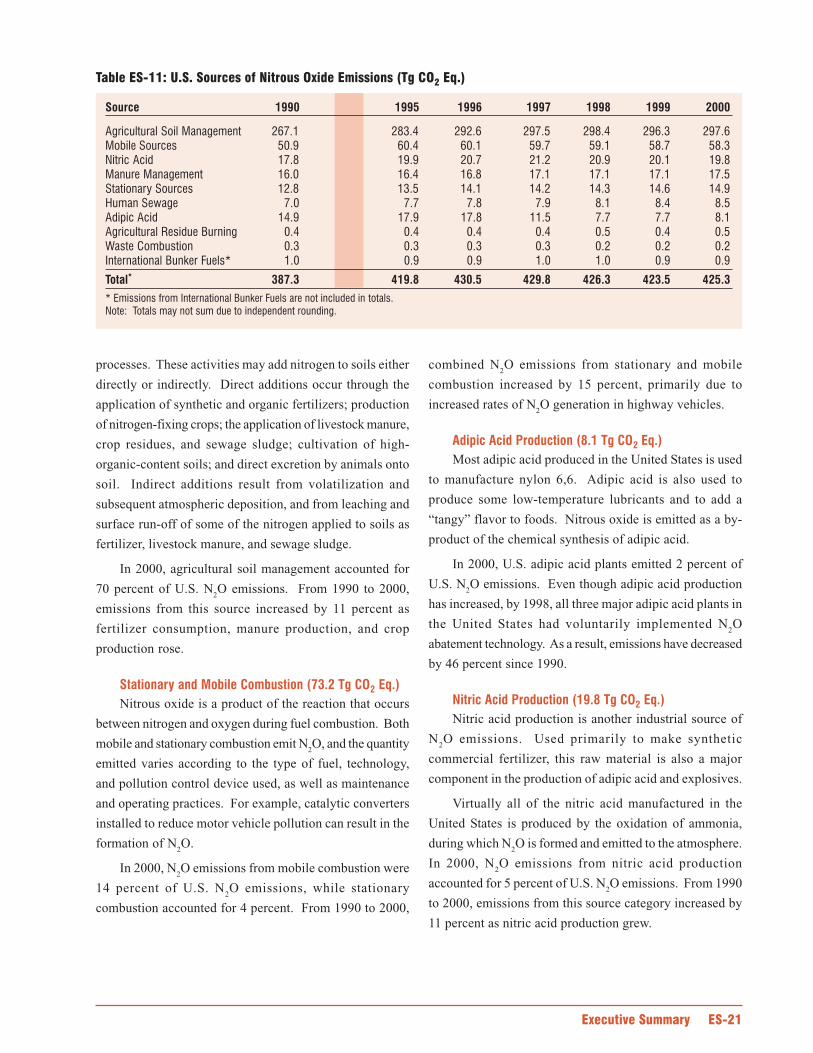
Hydrofluorocarbons (HFCs) and perfluorocarbons
(PFCs) are categories of synthetic chemicals that are being
used as alternatives to the ozone depleting substances
(ODSs), which are being phased out under the Montreal
Protocol and Clean Air Act Amendments of 1990. Because
HFCs and PFCs do not deplete the stratospheric ozone layer,
they are not controlled by the Montreal Protocol.
These compounds, however, along with sulfur
hexafluoride (SF6), are potent greenhouse gases. In addition
to having high global warming potentials, SF6 and PFCs
have extremely long atmospheric lifetimes, resulting in their
essentially irreversible accumulation in the atmosphere once
emitted. Sulfur hexafluoride is the most potent greenhouse
gas the IPCC has evaluated.
Other emissive sources of these gases include aluminum
production, HCFC-22 production, semiconductor
manufacturing, electrical transmission and distribution systems,
and magnesium production and processing. Figure ES-16 and
Table ES-12 present emission estimates for HFCs, PFCs, and
SF6, which totaled 121.3 Tg CO
2 Eq. in 2000.
0 10 20 30 40 50 60 70
Magnesium Productionand Processing
SemiconductorManufacture
AluminumProduction
Electrical Transmissionand Distribution
HCFC-22Production
Substitution of OzoneDepleting Substances
Tg CO Eq.2
HFC, PFC, and SFas a Portion ofAll Emissions
1.7%
6
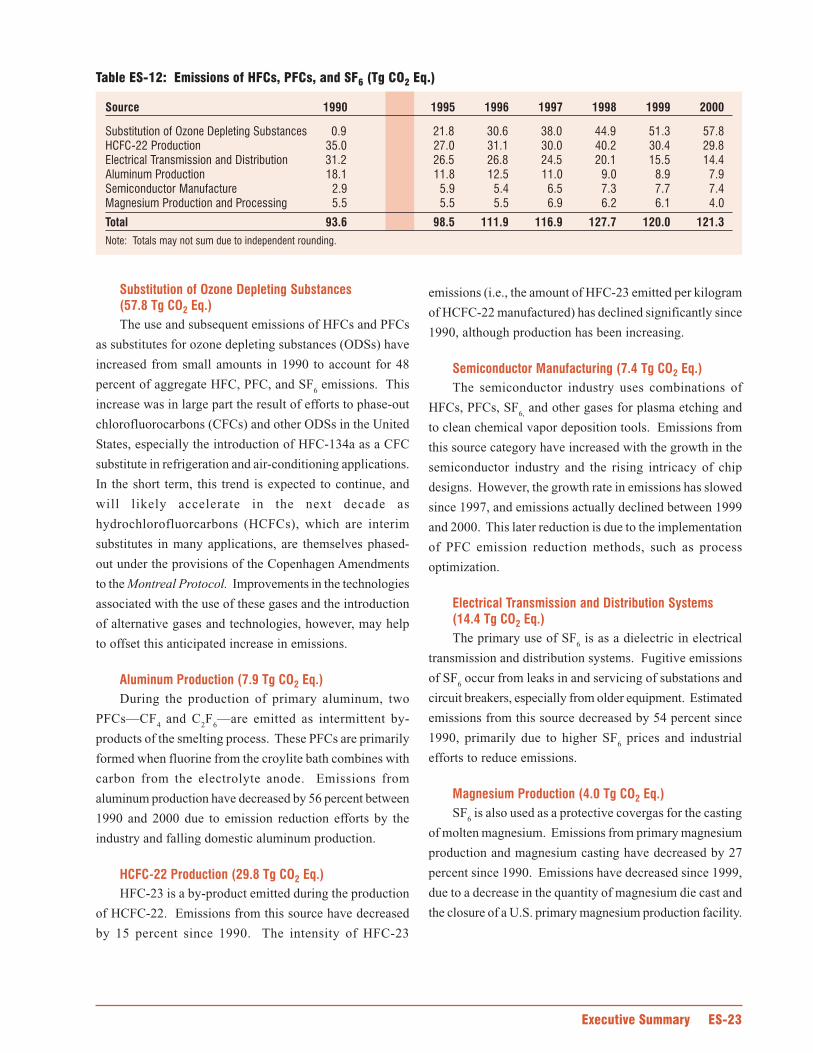
The use and subsequent emissions of HFCs and PFCs
as substitutes for ozone depleting substances (ODSs) have
increased from small amounts in 1990 to account for 48
percent of aggregate HFC, PFC, and SF6 emissions. This
increase was in large part the result of efforts to phase-out
chlorofluorocarbons (CFCs) and other ODSs in the United
States, especially the introduction of HFC-134a as a CFC
substitute in refrigeration and air-conditioning applications.
In the short term, this trend is expected to continue, and
will likely accelerate in the next decade as
hydrochlorofluorcarbons (HCFCs), which are interim
substitutes in many applications, are themselves phased-
out under the provisions of the Copenhagen Amendments
to the Montreal Protocol. Improvements in the technologies
associated with the use of these gases and the introduction
of alternative gases and technologies, however, may help
to offset this anticipated increase in emissions.
During the production of primary aluminum, two
PFCs—CF4 and C
2F
6—are emitted as intermittent by-
products of the smelting process. These PFCs are primarily
formed when fluorine from the croylite bath combines with
carbon from the electrolyte anode. Emissions from
aluminum production have decreased by 56 percent between
1990 and 2000 due to emission reduction efforts by the
industry and falling domestic aluminum production.
HFC-23 is a by-product emitted during the production
of HCFC-22. Emissions from this source have decreased
by 15 percent since 1990. The intensity of HFC-23
emissions (i.e., the amount of HFC-23 emitted per kilogram
of HCFC-22 manufactured) has declined significantly since
1990, although production has been increasing.
The semiconductor industry uses combinations of
HFCs, PFCs, SF6, and other gases for plasma etching and
to clean chemical vapor deposition tools. Emissions from
this source category have increased with the growth in the
semiconductor industry and the rising intricacy of chip
designs. However, the growth rate in emissions has slowed
since 1997, and emissions actually declined between 1999
and 2000. This later reduction is due to the implementation
of PFC emission reduction methods, such as process
optimization.
The primary use of SF6 is as a dielectric in electrical
transmission and distribution systems. Fugitive emissions
of SF6 occur from leaks in and servicing of substations and
circuit breakers, especially from older equipment. Estimated
emissions from this source decreased by 54 percent since
1990, primarily due to higher SF6 prices and industrial
efforts to reduce emissions.
SF6 is also used as a protective covergas for the casting
of molten magnesium. Emissions from primary magnesium
production and magnesium casting have decreased by 27
percent since 1990. Emissions have decreased since 1999,
due to a decrease in the quantity of magnesium die cast and
the closure of a U.S. primary magnesium production facility.
15 NOx and CO emission estimates from agricultural residue burning were estimated separately, and therefore not taken from EPA (2001).
In the United States, carbon monoxide (CO), nitrogen
oxides (NOx), nonmethane volatile organic compounds
(NMVOCs), and sulfur dioxide (SO2) are referred to as
“ambient air pollutants,” as termed in the Clean Air Act.
These pollutants do not have a direct global warming effect,
but indirectly affect terrestrial radiation absorption by
influencing the formation and destruction of tropospheric
and stratospheric ozone, or, in the case of SO2, by affecting
the absorptive characteristics of the atmosphere. Carbon
monoxide is produced when carbon-containing fuels are
combusted incompletely. Nitrogen oxides (i.e., NO and
NO2) are created by lightning, fires, fossil fuel combustion,
and in the stratosphere from nitrous oxide (N2O).
NMVOCs—which includes hundreds of organic
compounds that participate in atmospheric chemical
reactions (i.e., propane, butane, xylene, toluene, ethane and
many others)—are emitted primarily from transportation,
industrial processes, and non-industrial consumption of
organic solvents. In the United States, SO2 is primarily
emitted from coal combustion for electric power generation
and the metals industry.
Ambient air pollutants are regulated under the Clean
Air Act in an effort to protect human health and the
environment. These gases also indirectly affect the global
climate by either acting as short-lived greenhouse gases or
reacting with other chemical compounds in the atmosphere
to form compounds that are greenhouse gases. Unlike the
other ambient air pollutants, sulfur-containing compounds
emitted into the atmosphere affect the Earth’s radiative
budget negatively; therefore, it is discussed separately.
One important indirect climate change effect of
NMVOCs and NOx is their role as precursors for
tropospheric ozone formation. They can also alter the
atmospheric lifetimes of other greenhouse gases. Another
example of ambient air pollutant formation into greenhouse
gases is carbon monoxide’s interaction with the hydroxyl
radical—the major atmospheric sink for methane
emissions—to form CO2. Therefore, increased atmospheric
concentrations of CO limit the number of hydroxyl
molecules (OH) available to destroy methane.
Since 1970, the United States has published estimates
of annual emissions of ambient air pollutants (EPA 2001).15
Table ES-14 shows that fuel combustion accounts for the
majority of emissions of these gases. Industrial processes—
such as the manufacture of chemical and allied products,
metals processing, and industrial uses of solvents—are also
significant sources of CO, NOx, and NMVOCs.