2002 Full Year Results. 2 Johnston Press plc Agenda Introductions and Overview Introductions and...
47
2002 Full Year Results 2002 Full Year Results
-
Upload
cory-watson -
Category
Documents
-
view
219 -
download
1
Transcript of 2002 Full Year Results. 2 Johnston Press plc Agenda Introductions and Overview Introductions and...

2002 Full Year Results2002 Full Year Results
2
Johnston Press plcJohnston Press plc
AgendaAgenda
• Introductions and Introductions and OverviewOverview
• 2002 Prelims2002 Prelims
• Operating ReviewOperating Review
• OutlookOutlook

3
Key Financial HighlightsKey Financial Highlights
Like for like advertising revenue Up 2%
Profit before taxation Up 35%
Headline earnings per share Up 13%
Turnover Up 43%
Operating profit Up 45%
- Like for like pre exceptionals
Up 7%
Dividend per share Up 18%
Free cash flow Up 127%
4
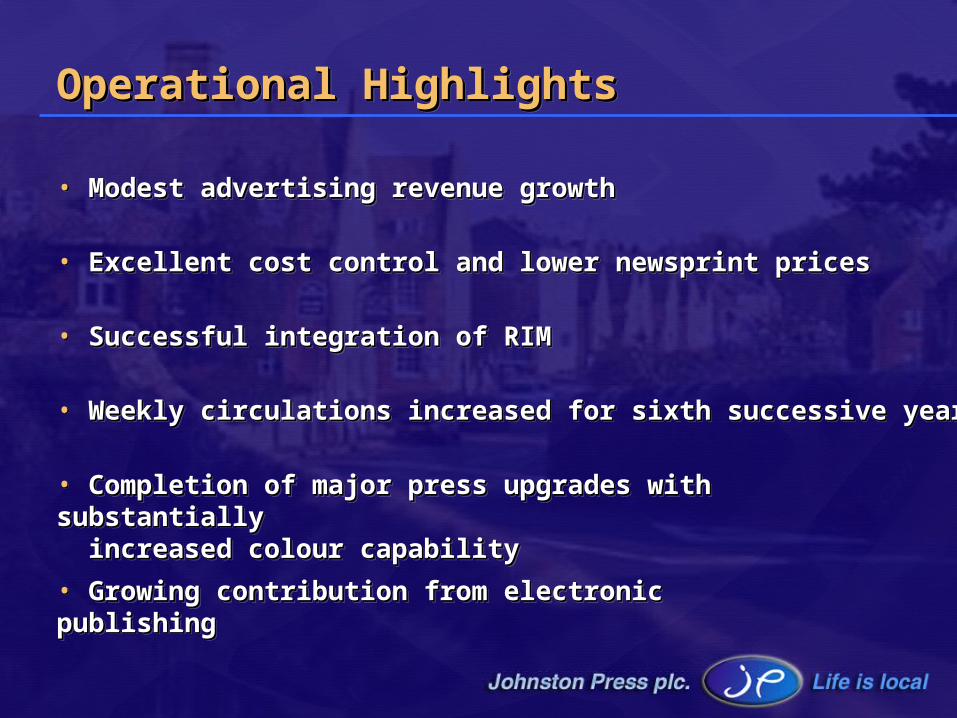
Operational HighlightsOperational HighlightsOperational HighlightsOperational Highlights
• Modest advertising revenue growthModest advertising revenue growth• Modest advertising revenue growthModest advertising revenue growth
• Weekly circulations increased for sixth successive yearWeekly circulations increased for sixth successive year• Weekly circulations increased for sixth successive yearWeekly circulations increased for sixth successive year
• Successful integration of RIMSuccessful integration of RIM• Successful integration of RIMSuccessful integration of RIM
• Completion of major press upgrades with Completion of major press upgrades with substantiallysubstantially increased colour capabilityincreased colour capability
• Completion of major press upgrades with Completion of major press upgrades with substantiallysubstantially increased colour capabilityincreased colour capability
• Excellent cost control and lower newsprint pricesExcellent cost control and lower newsprint prices• Excellent cost control and lower newsprint pricesExcellent cost control and lower newsprint prices
• Growing contribution from electronic Growing contribution from electronic publishingpublishing• Growing contribution from electronic Growing contribution from electronic publishingpublishing

5
Corporate GovernanceCorporate GovernanceCorporate GovernanceCorporate Governance
• Proposed new non executive appointmentsProposed new non executive appointments• Proposed new non executive appointmentsProposed new non executive appointments
• 2 year CE contract removed2 year CE contract removed• 2 year CE contract removed2 year CE contract removed
• Introduction of LTIPIntroduction of LTIP• Introduction of LTIPIntroduction of LTIP
• Appointment of new auditorsAppointment of new auditors• Appointment of new auditorsAppointment of new auditors
• ConsultationConsultation• ConsultationConsultation

Financial ReviewFinancial Review
7
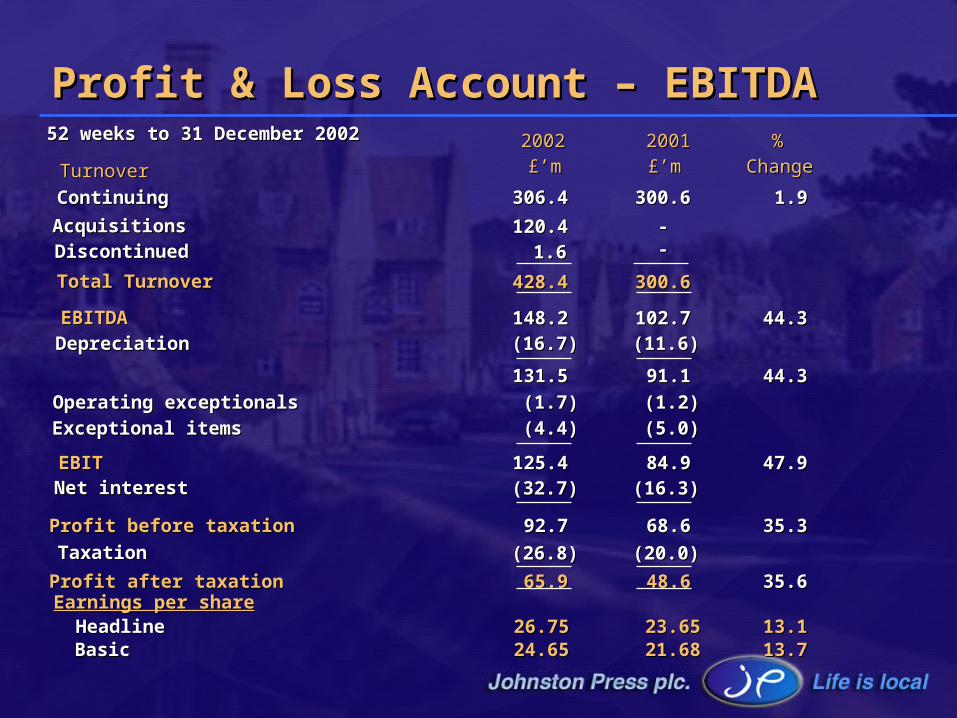
Profit & Loss Account – EBITDAProfit & Loss Account – EBITDA20022002 20012001
TurnoverTurnover
ContinuingContinuing
AcquisitionsAcquisitions
Total TurnoverTotal Turnover
EBITDAEBITDADepreciationDepreciation
Operating exceptionalsOperating exceptionalsExceptional itemsExceptional items
EBITEBITNet interestNet interest
Profit before taxationProfit before taxation
TaxationTaxation
Earnings per shareEarnings per share
306.4306.4
120.4120.4
428.4428.4
148.2148.2(16.7)(16.7)
(1.7)(1.7)(4.4)(4.4)
(32.7)(32.7)
92.792.7
26.7526.75
65.965.9
(26.8)(26.8)
131.5131.5
%%
1.91.9
44.344.3
44.344.3
35.335.3
300.6300.6
300.6300.6
102.7102.7(11.6)(11.6)
(1.2)(1.2)(5.0)(5.0)
(16.3)(16.3)
68.668.6
(20.0)(20.0)
23.6523.65
91.191.1
48.648.6
£’m£’m£’m£’m
13.113.1
ChangeChange
Profit after taxationProfit after taxation
HeadlineHeadlineBasicBasic 24.6524.65 21.6821.68 13.713.7
35.635.6
125.4125.4 84.984.9 47.947.9
52 weeks to 31 December 200252 weeks to 31 December 2002
DiscontinuedDiscontinued 1.61.6----
8
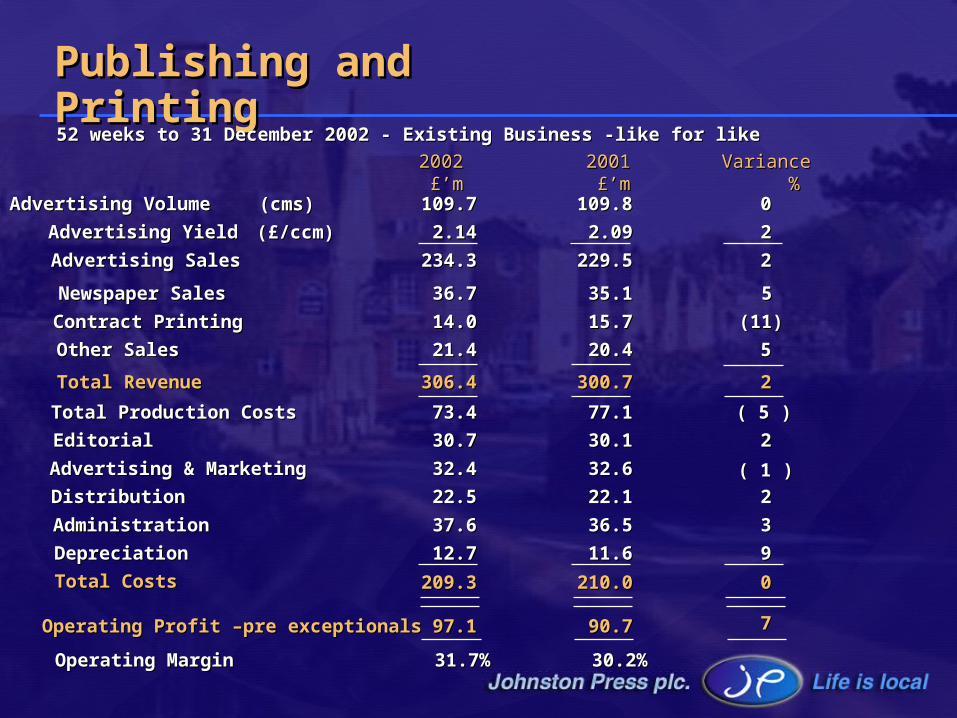
209.3209.3 210.0210.0
20022002 £’m£’m
20012001 £’m£’m
VarianceVariance %%
Publishing and PrintingPublishing and Printing
Advertising VolumeAdvertising Volume
Advertising YieldAdvertising Yield
Advertising SalesAdvertising Sales
Newspaper SalesNewspaper Sales
Contract PrintingContract Printing
Other SalesOther Sales
Total RevenueTotal Revenue
Total Production CostsTotal Production Costs
EditorialEditorial
Advertising & MarketingAdvertising & Marketing
DistributionDistribution
AdministrationAdministration
DepreciationDepreciation
Total CostsTotal Costs
Operating Profit –pre exceptionalsOperating Profit –pre exceptionals
Operating MarginOperating Margin
109.7109.7 109.8109.8 00
2.142.14 2.092.09 22
234.3234.3 229.5229.5 22
36.736.7 35.135.1 5 5
14.014.0 15.715.7 (11)(11)
21.421.4 20.420.4 55
306.4306.4 300.7300.7 22
73.473.4 77.177.1 ( 5 )( 5 )
30.730.7 30.130.1 22
32.432.4 32.632.6 ( 1 )( 1 )
22.522.5 22.122.1 22
37.637.6 36.536.5 33
12.712.7 11.611.6 99
00
97.197.1 90.790.7 77
31.7%31.7% 30.2%30.2%
52 weeks to 31 December 2002 - Existing Business -like for like52 weeks to 31 December 2002 - Existing Business -like for like
(cms)(cms)
(£/ccm)(£/ccm)
9
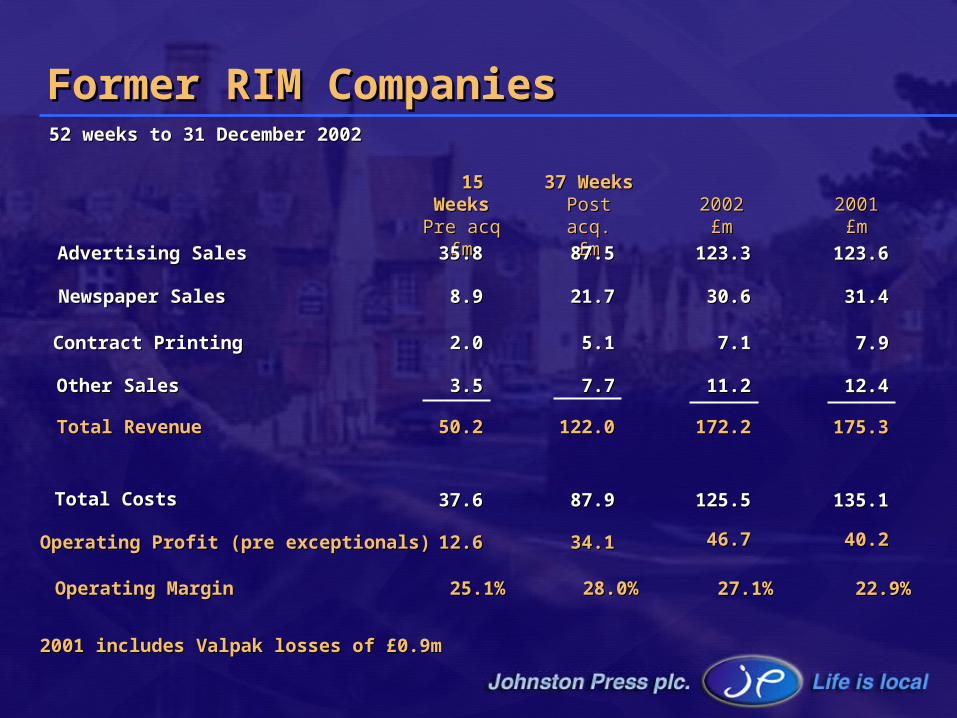
37.637.6 87.987.9
15 15 WeeksWeeksPre acqPre acq
£m£m
37 37 WeeksWeeks
Post acq.Post acq.£m£m
20022002£m£m
Former RIM CompaniesFormer RIM Companies
Advertising SalesAdvertising Sales
Newspaper SalesNewspaper Sales
Contract PrintingContract Printing
Other SalesOther Sales
Total RevenueTotal Revenue
Total CostsTotal Costs
Operating Profit (pre exceptionals)Operating Profit (pre exceptionals)
Operating MarginOperating Margin
35.835.8 87.587.5 123.3123.3
8.98.9 21.721.7 30.630.6
2.02.0 5.15.1 7.17.1
3.53.5 7.77.7 11.211.2
50.250.2 122.0122.0 172.2172.2
125.5125.5
12.612.6 34.134.1 46.746.7
25.1%25.1% 28.0%28.0%
52 weeks to 31 December 200252 weeks to 31 December 2002
20012001£m£m
123.6123.6
31.431.4
7.97.9
12.412.4
175.3175.3
135.1135.1
40.240.2
27.1%27.1% 22.9%22.9%
2001 includes Valpak losses of £0.9m2001 includes Valpak losses of £0.9m
10
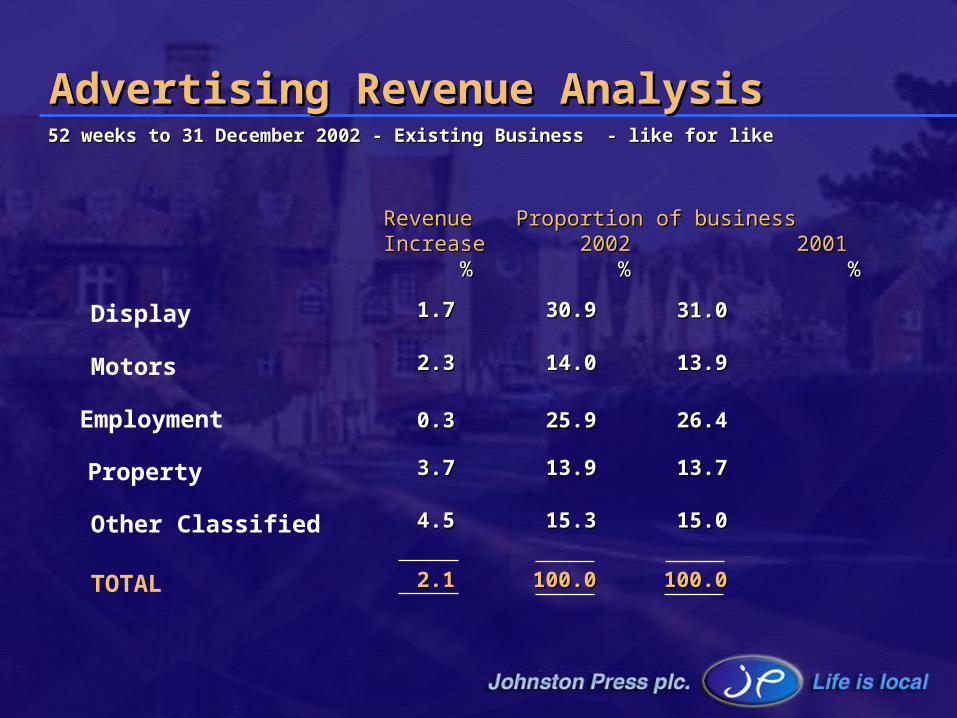
Display
Motors
Property
Other Classified
TOTAL
Advertising Revenue Analysis Advertising Revenue Analysis
Employment
RevenueRevenueIncreaseIncrease %%
Proportion of businessProportion of business 2002 20012002 2001 % % %%
1.71.7 30.930.9 31.031.0
2.32.3 14.014.0 13.913.9
0.30.3 25.925.9 26.426.4
3.73.7 13.913.9 13.713.7
4.54.5 15.315.3 15.015.0
2.12.1 100.0100.0 100.0100.0
52 weeks to 31 December 2002 - Existing Business - like for like52 weeks to 31 December 2002 - Existing Business - like for like
11
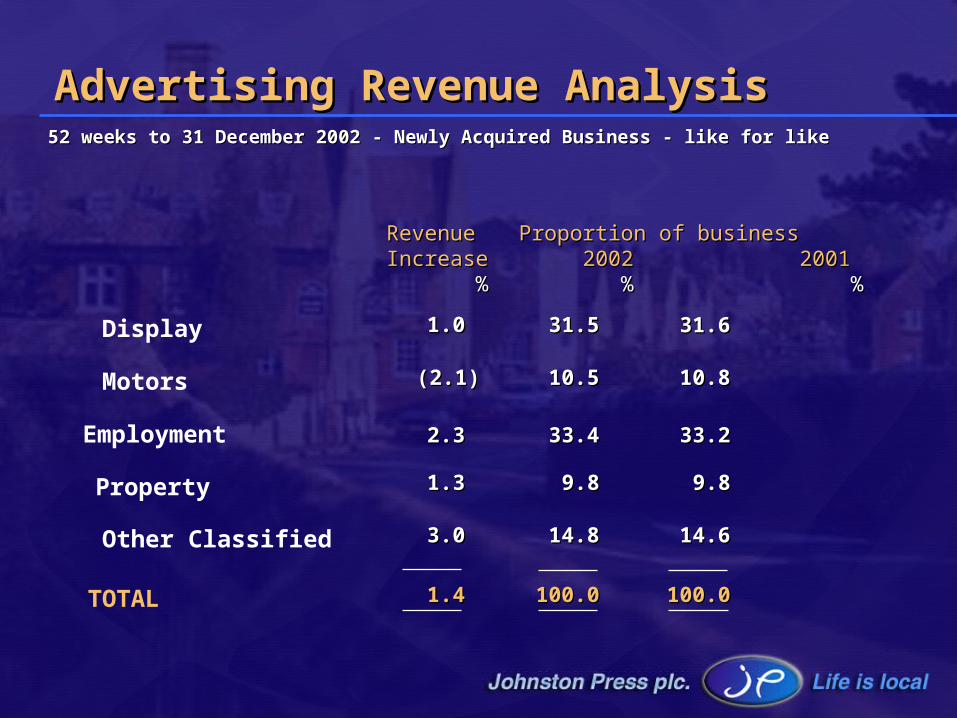
Display
Motors
Property
Other Classified
TOTAL
Advertising Revenue Analysis Advertising Revenue Analysis
Employment
RevenueRevenueIncreaseIncrease %%
Proportion of businessProportion of business 2002 20012002 2001 % % %%
1.01.0 31.531.5 31.631.6
(2.1)(2.1) 10.510.5 10.810.8
2.32.3 33.433.4 33.233.2
1.31.3 9.89.8 9.89.8
3.03.0 14.814.8 14.614.6
1.41.4 100.0100.0 100.0100.0
52 weeks to 31 December 2002 - Newly Acquired Business - like for like52 weeks to 31 December 2002 - Newly Acquired Business - like for like
12
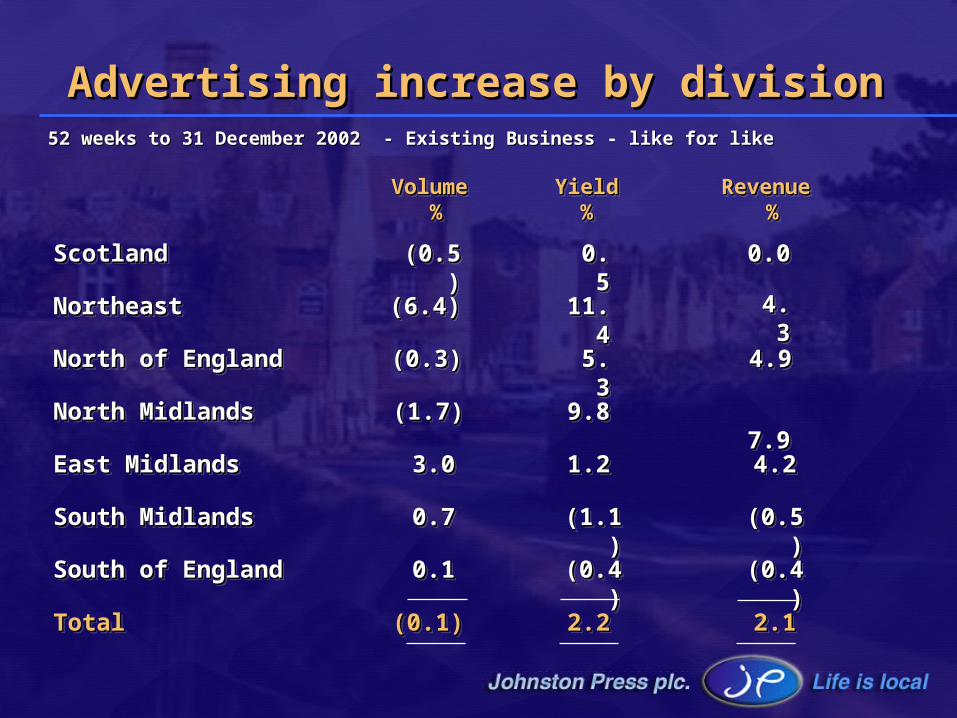
Advertising increase by divisionAdvertising increase by division
VolumeVolume %%
VolumeVolume %%
YieldYield%%
YieldYield%%
RevenueRevenue %%
RevenueRevenue %%
ScotlandScotlandScotlandScotland
NortheastNortheastNortheastNortheast
North of EnglandNorth of EnglandNorth of EnglandNorth of England
North MidlandsNorth MidlandsNorth MidlandsNorth Midlands
East MidlandsEast MidlandsEast MidlandsEast Midlands
South MidlandsSouth MidlandsSouth MidlandsSouth Midlands
South of EnglandSouth of EnglandSouth of EnglandSouth of England
TotalTotalTotalTotal
(0.5(0.5))
(0.5(0.5))
0.0.55
0.0.55
0.00.0 0.00.0
(6.4)(6.4) (6.4)(6.4) 11.11.44
11.11.44
4.4.33
4.4.33
(0.3)(0.3)(0.3)(0.3) 5.35.35.35.3 4.94.9 4.94.9
(1.7)(1.7)(1.7)(1.7) 9.89.89.89.8 7.97.9
7.97.9
3.03.0 3.03.0 1.21.21.21.2 4.24.2 4.24.2
0.70.70.70.7 (1.1(1.1))
(1.1(1.1))
(0.5(0.5))
(0.5(0.5))
0.10.10.10.1 (0.4(0.4))
(0.4(0.4))
(0.4(0.4))
(0.4(0.4))
(0.1)(0.1)(0.1)(0.1) 2.22.22.22.2 2.12.1 2.12.1
52 weeks to 31 December 2002 - 52 weeks to 31 December 2002 - Existing BusinessExisting Business - like for likelike for like
13
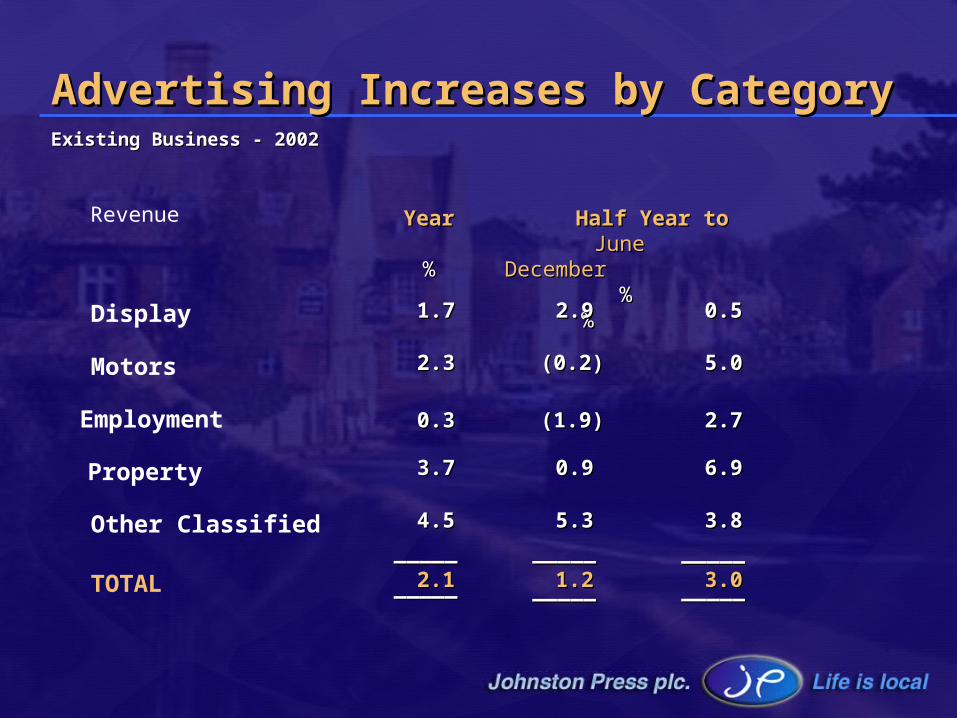
Display
Motors
Property
Other Classified
TOTAL
Advertising Increases by CategoryAdvertising Increases by Category
Revenue
Employment
YearYear
%%
Half Year toHalf Year to June DecemberJune December % % %%
1.71.7 2.92.9 0.50.5
2.32.3 (0.2)(0.2) 5.05.0
0.30.3 (1.9)(1.9) 2.72.7
3.73.7 0.90.9 6.96.9
4.54.5 5.35.3 3.83.8
2.12.1 1.21.2 3.03.0__________ __________ __________
______________________________
Existing Business - 2002Existing Business - 2002
14
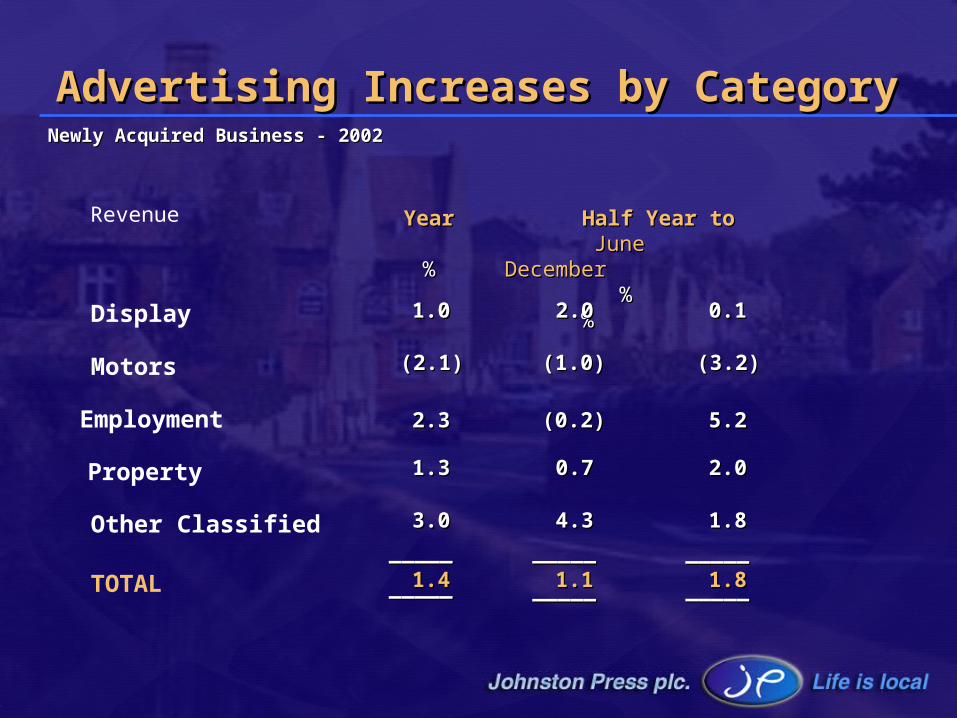
Display
Motors
Property
Other Classified
TOTAL
Advertising Increases by CategoryAdvertising Increases by Category
Revenue
Employment
YearYear
%%
Half Year toHalf Year to June DecemberJune December % % %%
1.01.0 2.02.0 0.10.1
(2.1)(2.1) (1.0)(1.0) (3.2)(3.2)
2.32.3 (0.2)(0.2) 5.25.2
1.31.3 0.70.7 2.02.0
3.03.0 4.34.3 1.81.8
1.41.4 1.11.1 1.81.8__________ __________ __________
______________________________
Newly Acquired Business - 2002Newly Acquired Business - 2002
15
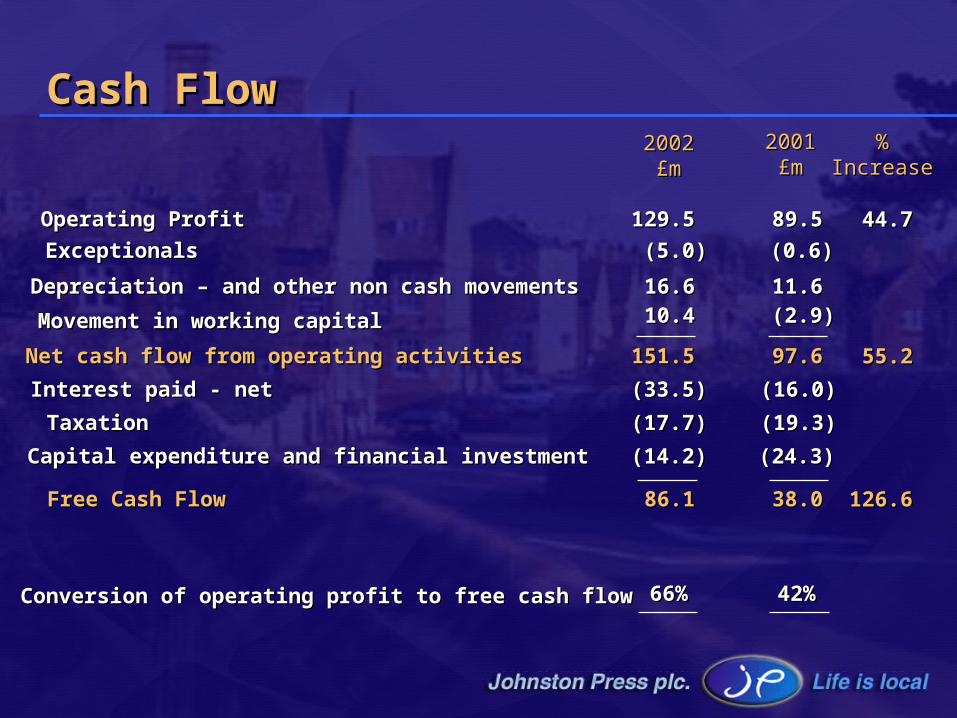
Cash FlowCash Flow
Operating ProfitOperating Profit 129.5129.5 89.589.5
ExceptionalsExceptionals (5.0)(5.0) (0.6)(0.6)
Depreciation – and other non cash movementsDepreciation – and other non cash movements 16.616.6 11.611.6
Net cash flow from operating activitiesNet cash flow from operating activities 151.5151.5 97.697.6
Interest paid - netInterest paid - net (33.5)(33.5) (16.0)(16.0)
TaxationTaxation (17.7)(17.7) (19.3)(19.3)
Capital expenditure and financial investmentCapital expenditure and financial investment (14.2)(14.2) (24.3)(24.3)
Free Cash FlowFree Cash Flow 86.186.1 38.038.0
66%66% 42%42%
10.410.4 (2.9)(2.9)Movement in working capitalMovement in working capital
Conversion of operating profit to free cash flowConversion of operating profit to free cash flow
20022002£m£m
20012001£m£m
%%IncreaseIncrease
44.744.7
55.255.2
126.6126.6
16
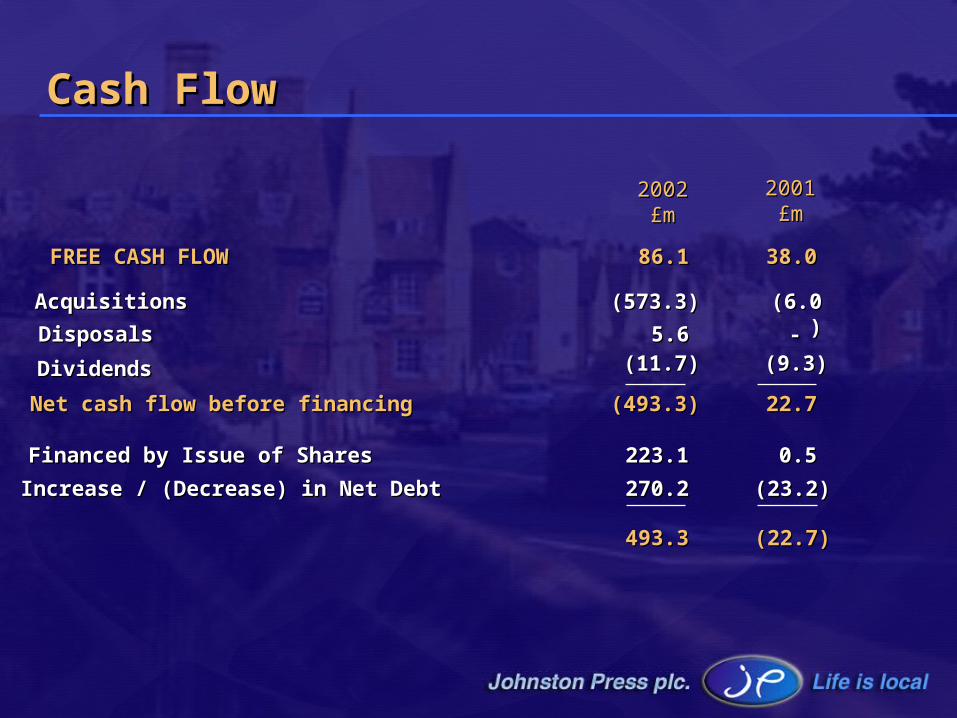
Cash FlowCash Flow
FREE CASH FLOWFREE CASH FLOW 86.186.1 38.038.0
AcquisitionsAcquisitions (573.3)(573.3) (6.0(6.0))DisposalsDisposals 5.65.6
Net cash flow before financingNet cash flow before financing (493.3)(493.3) 22.722.7
Financed by Issue of SharesFinanced by Issue of Shares 223.1223.1 0.50.5
Increase / (Decrease) in Net DebtIncrease / (Decrease) in Net Debt 270.2270.2 (23.2)(23.2)
493.3493.3 (22.7)(22.7)
(11.7)(11.7) (9.3)(9.3)DividendsDividends
20022002£m£m
20012001£m£m
--
17
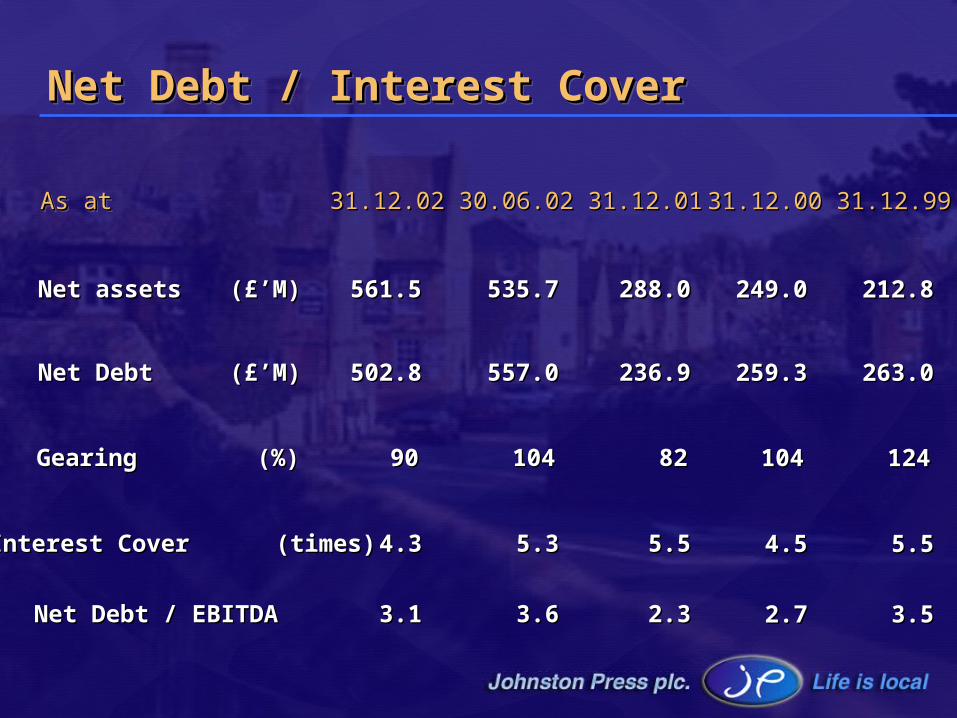
Net Debt / Interest CoverNet Debt / Interest CoverNet Debt / Interest CoverNet Debt / Interest Cover
As atAs atAs atAs at
Net assetsNet assets (£’M)(£’M)
Net DebtNet Debt (£’M)(£’M)
GearingGearing (%) (%)
Interest CoverInterest Cover (times)(times)
31.12.0231.12.02 30.06.0230.06.02 31.12.0131.12.01
561.5561.5 535.7535.7 288.0288.0
502.8502.8 557.0557.0 236.9236.9
9090 104104 8282
4.34.3 5.35.3 5.55.5
31.12.0031.12.00 31.12.9931.12.99
249.0249.0 212.8212.8
259.3259.3 263.0263.0
104104 124124
4.54.5 5.55.5
Net Debt / EBITDANet Debt / EBITDA 3.13.1 3.63.6 2.32.3 2.72.7 3.53.5
18
£’m£’m
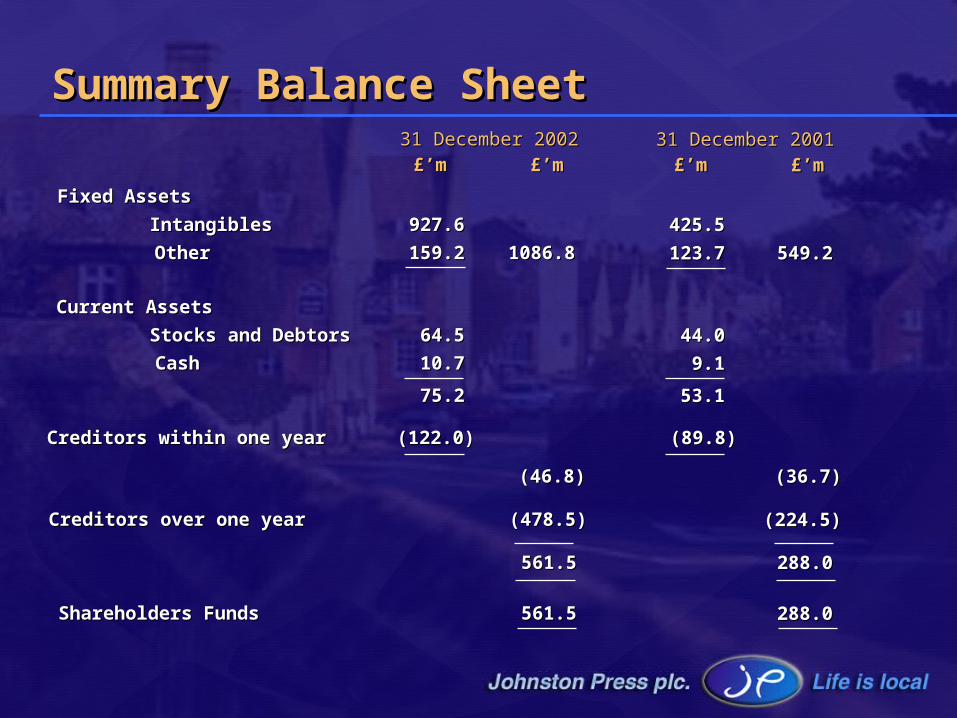
Summary Balance SheetSummary Balance Sheet
Fixed AssetsFixed Assets
IntangiblesIntangibles
OtherOther
Current AssetsCurrent Assets
Stocks and DebtorsStocks and Debtors
CashCash
Creditors within one yearCreditors within one year
Creditors over one yearCreditors over one year
Shareholders FundsShareholders Funds
927.6927.6
159.2159.2 1086.81086.8
64.564.5
10.710.7
75.275.2
(122.0)(122.0)
(46.8)(46.8)
(478.5)(478.5)
561.5561.5
561.5561.5
£’m£’m £’m£’m
425.5425.5
123.7123.7 549.2549.2
44.044.0
9.19.1
53.153.1
(89.8)(89.8)
(36.7)(36.7)
(224.5)(224.5)
288.0288.0
288.0288.0
£’m£’m31 December 200231 December 2002 31 December 200131 December 2001
19
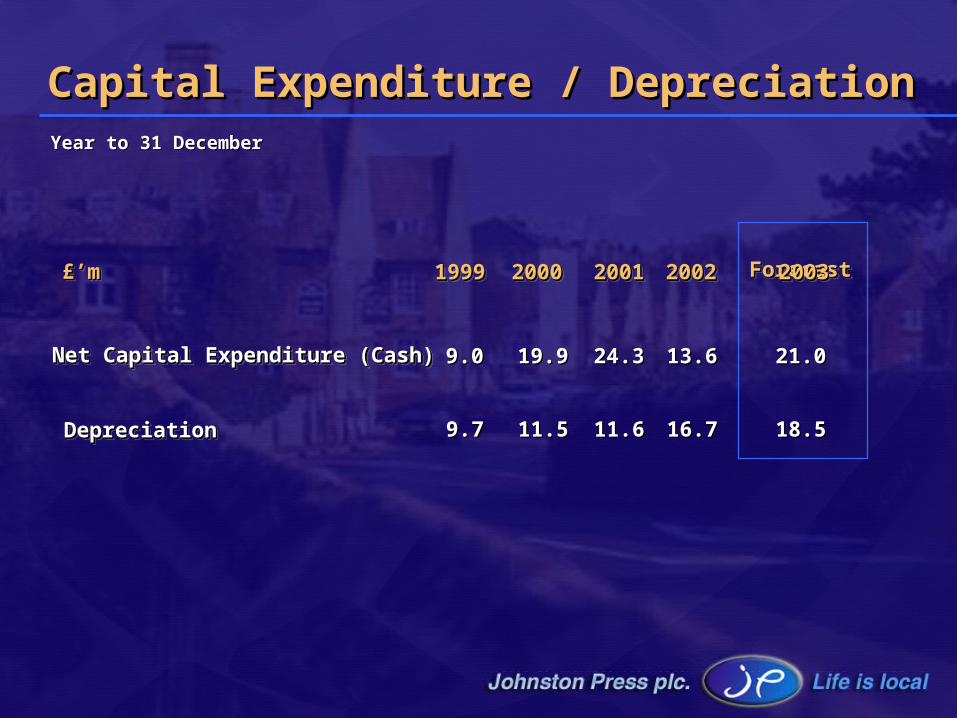
Capital Expenditure / DepreciationCapital Expenditure / Depreciation
Net Capital Expenditure (Cash)Net Capital Expenditure (Cash)Net Capital Expenditure (Cash)Net Capital Expenditure (Cash)
DepreciationDepreciationDepreciationDepreciation
9.09.0 19.919.9 24.324.3 13.613.6
9.79.7 11.511.5 11.611.6 16.716.7
1999199919991999 2000200020002000 2001200120012001 2002200220022002
ForecastForecast
ForecastForecast£’m£’m£’m£’m
21.021.0
18.518.5
2003200320032003
Year to 31 DecemberYear to 31 December
20
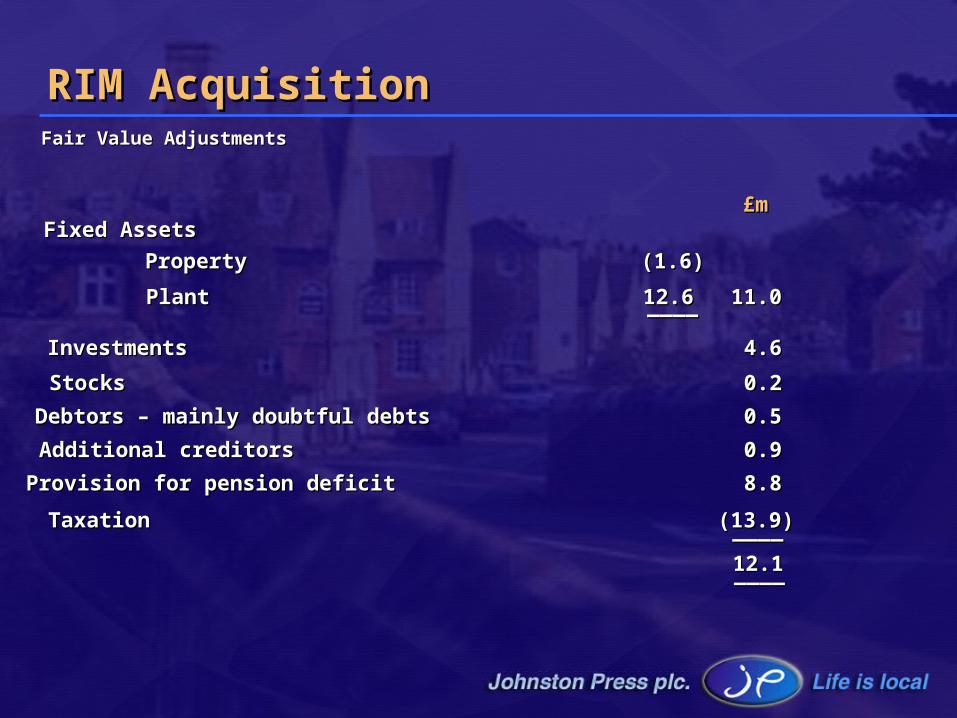
RIM AcquisitionRIM Acquisition
Fixed AssetsFixed Assets
PropertyProperty
PlantPlant 11.011.0
StocksStocks 0.20.2
Debtors – mainly doubtful debtsDebtors – mainly doubtful debts 0.50.5
Additional creditorsAdditional creditors 0.90.9
Provision for pension deficitProvision for pension deficit 8.88.8
TaxationTaxation (13.9)(13.9)
4.64.6InvestmentsInvestments
________
________
£m£m
(1.6)(1.6)
12.612.6
12.112.1________
Fair Value AdjustmentsFair Value Adjustments

21
RIM AcquisitionRIM Acquisition
Termination and redundancies costsTermination and redundancies costs
RIM Board members and support staffRIM Board members and support staff 2.22.2
Closure of Harrogate PressClosure of Harrogate Press 0.50.5
Termination of superfluous contractsTermination of superfluous contracts 0.10.1
0.40.4Closure of London and Manchester national sales officesClosure of London and Manchester national sales offices
________
£m£m
4.44.4________
Central ActivitiesCentral Activities 1.21.2
Non Operating Exceptional ItemsNon Operating Exceptional Items
22
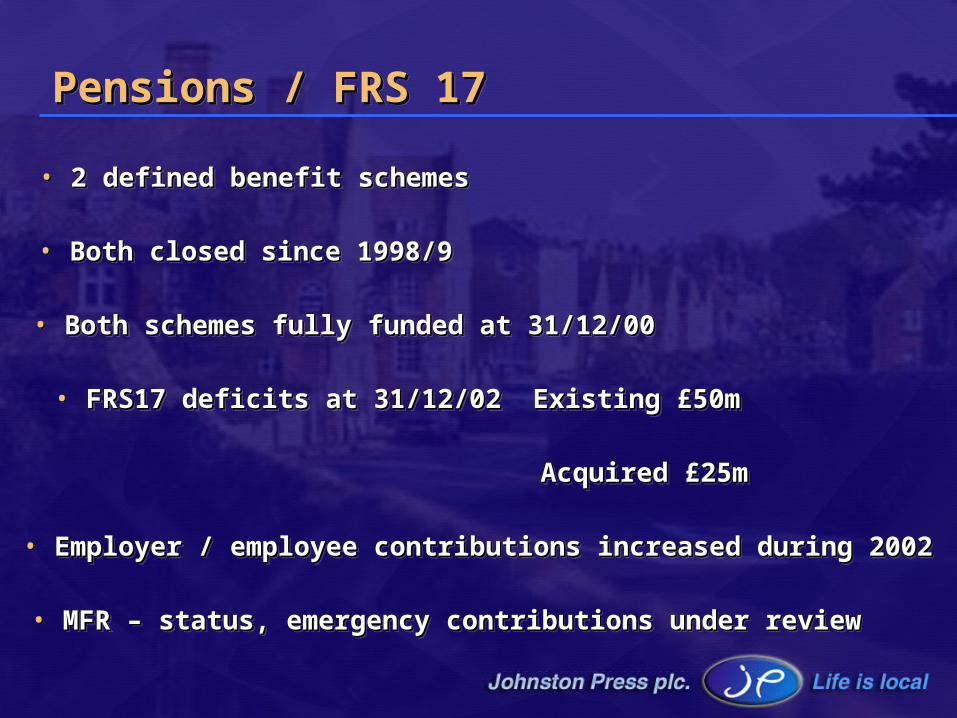
Pensions / FRS 17Pensions / FRS 17Pensions / FRS 17Pensions / FRS 17
• 2 defined benefit schemes2 defined benefit schemes• 2 defined benefit schemes2 defined benefit schemes
• Both closed since 1998/9Both closed since 1998/9• Both closed since 1998/9Both closed since 1998/9
• Both schemes fully funded at 31/12/00Both schemes fully funded at 31/12/00• Both schemes fully funded at 31/12/00Both schemes fully funded at 31/12/00
• FRS17 deficits at 31/12/02FRS17 deficits at 31/12/02 Existing £50mExisting £50m• FRS17 deficits at 31/12/02FRS17 deficits at 31/12/02 Existing £50mExisting £50m
• Employer / employee contributions increased during 2002Employer / employee contributions increased during 2002• Employer / employee contributions increased during 2002Employer / employee contributions increased during 2002
• MFR – status, emergency contributions under reviewMFR – status, emergency contributions under review• MFR – status, emergency contributions under reviewMFR – status, emergency contributions under review
Acquired £25mAcquired £25mAcquired £25mAcquired £25m

Operational ReviewOperational Review
24
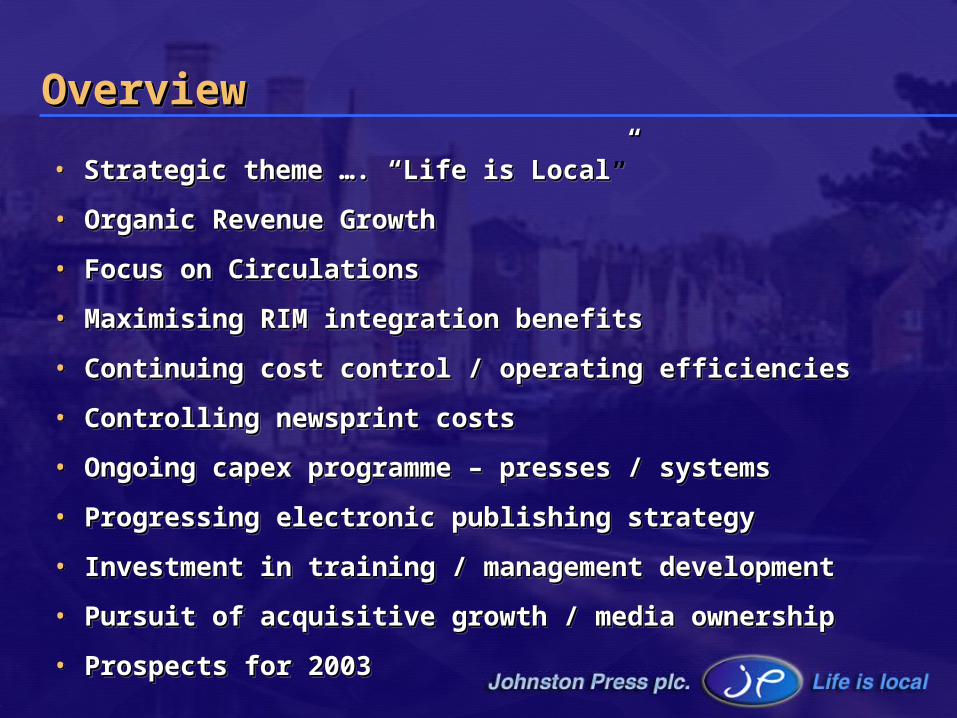
OverviewOverviewOverviewOverview
• Strategic theme …. “Life is Local”Strategic theme …. “Life is Local”• Strategic theme …. “Life is Local”Strategic theme …. “Life is Local”
• Organic Revenue Growth Organic Revenue Growth • Organic Revenue Growth Organic Revenue Growth
• Focus on CirculationsFocus on Circulations• Focus on CirculationsFocus on Circulations
• Maximising RIM integration benefitsMaximising RIM integration benefits• Maximising RIM integration benefitsMaximising RIM integration benefits
• Continuing cost control / operating efficienciesContinuing cost control / operating efficiencies• Continuing cost control / operating efficienciesContinuing cost control / operating efficiencies
• Controlling newsprint costsControlling newsprint costs• Controlling newsprint costsControlling newsprint costs
• Ongoing capex programme – presses / systemsOngoing capex programme – presses / systems• Ongoing capex programme – presses / systemsOngoing capex programme – presses / systems
• Progressing electronic publishing strategyProgressing electronic publishing strategy• Progressing electronic publishing strategyProgressing electronic publishing strategy
• Investment in training / management developmentInvestment in training / management development• Investment in training / management developmentInvestment in training / management development
• Pursuit of acquisitive growth / media ownershipPursuit of acquisitive growth / media ownership• Pursuit of acquisitive growth / media ownershipPursuit of acquisitive growth / media ownership
• Prospects for 2003Prospects for 2003• Prospects for 2003Prospects for 2003

25
Revenue Growth InitiativesRevenue Growth InitiativesRevenue Growth InitiativesRevenue Growth Initiatives
• Driving proactive categoriesDriving proactive categories• Driving proactive categoriesDriving proactive categories
• Better tailored packagingBetter tailored packaging• Better tailored packagingBetter tailored packaging
• Dissemination of best practiceDissemination of best practice• Dissemination of best practiceDissemination of best practice
• New revenue streamsNew revenue streams• New revenue streamsNew revenue streams
26
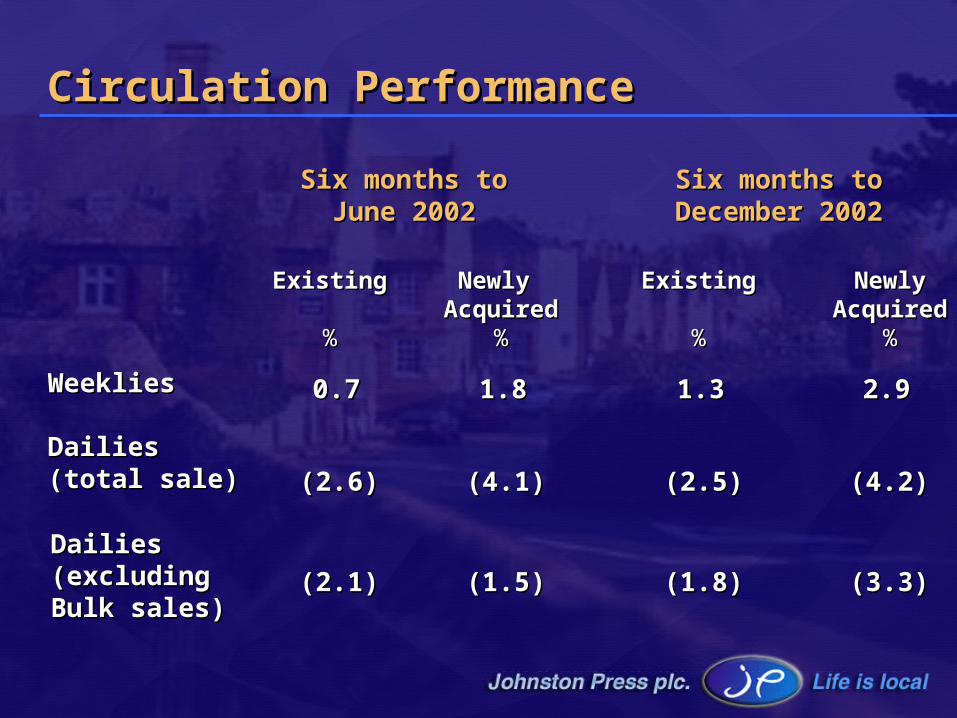
Circulation PerformanceCirculation Performance
WeekliesWeeklies
SixSix months tomonths toJune 2002June 2002
Six months toSix months toDecember 2002December 2002
ExistingExisting
%%
Newly Newly AcquiredAcquired
%%
ExistingExisting
%%
Newly Newly AcquiredAcquired
%%
0.70.7
(2.6)(2.6)
(2.1)(2.1)
1.81.8
(4.1)(4.1)
(1.5)(1.5)
1.31.3
(2.5)(2.5)
(1.8)(1.8)
2.92.9
(4.2)(4.2)
(3.3)(3.3)
DailiesDailies(total sale)(total sale)
DailiesDailies(excluding(excludingBulk sales)Bulk sales)

27
Circulation – Action PlansCirculation – Action Plans
• Focus on content and design Focus on content and design
• Dissemination of best practice Dissemination of best practice
• Review of underlying trendsReview of underlying trends
• Added value supplements and daily Added value supplements and daily
platformsplatforms• Improved direct delivery and supply Improved direct delivery and supply
arrangementsarrangements• Canvassing programmesCanvassing programmes
• Conservative approach to cover pricesConservative approach to cover prices
28
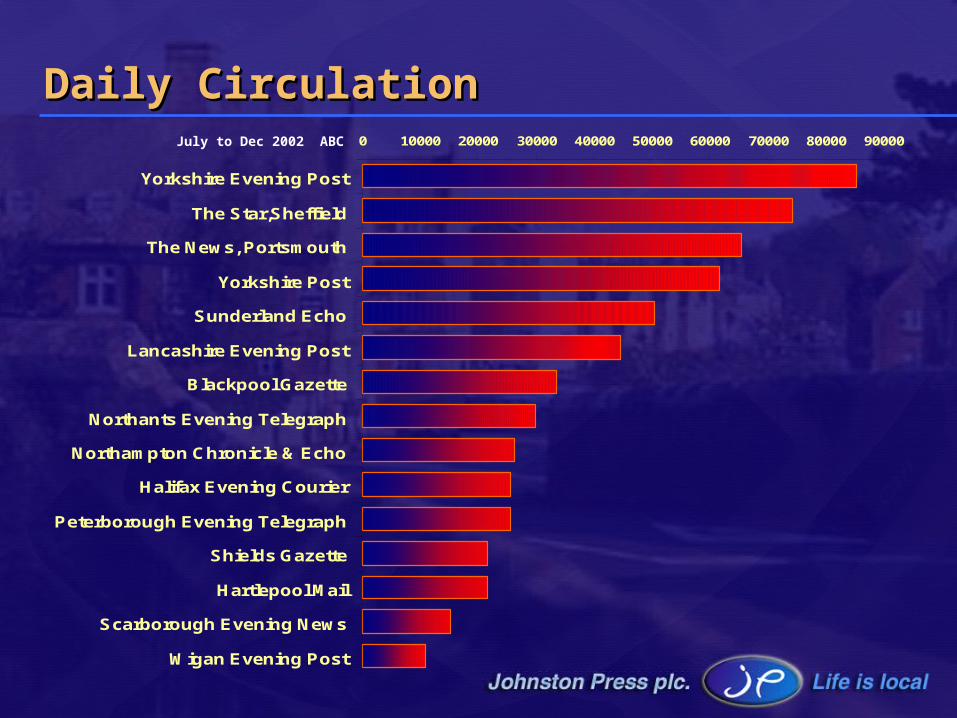
Daily CirculationDaily Circulation0 10000 20000 30000 40000 50000 60000 70000 80000 90000
Yorkshire Evening Post
The Star,Sheffield
The News, Portsmouth
Yorkshire Post
Sunderland Echo
Lancashire Evening Post
Blackpool Gazette
Northants Evening Telegraph
Northampton Chronicle & Echo
Halifax Evening Courier
Peterborough Evening Telegraph
Shields Gazette
Hartlepool Mail
Scarborough Evening News
Wigan Evening Post
July to Dec 2002 ABC
29
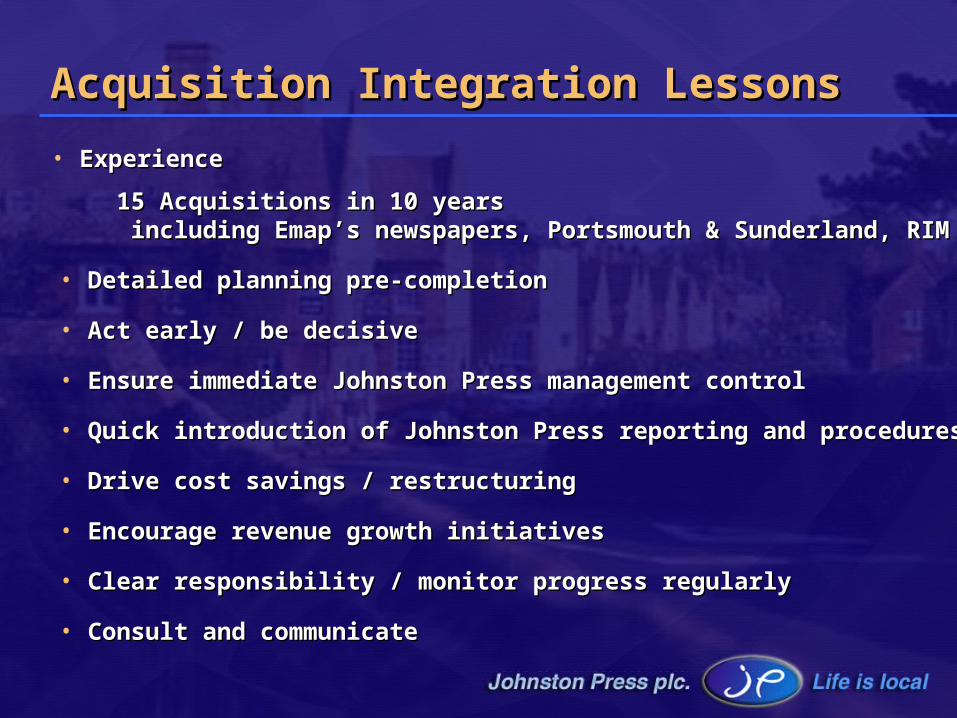
• ExperienceExperience
15 Acquisitions in 10 years15 Acquisitions in 10 years including Emap’s newspapers, Portsmouth & Sunderland, RIMincluding Emap’s newspapers, Portsmouth & Sunderland, RIM
• Detailed planning pre-completionDetailed planning pre-completion
• Act early / be decisiveAct early / be decisive
• Ensure immediate Johnston Press management controlEnsure immediate Johnston Press management control
• Quick introduction of Johnston Press reporting and proceduresQuick introduction of Johnston Press reporting and procedures
• Drive cost savings / restructuringDrive cost savings / restructuring
• Encourage revenue growth initiativesEncourage revenue growth initiatives
• Clear responsibility / monitor progress regularlyClear responsibility / monitor progress regularly
• Consult and communicateConsult and communicate
Acquisition Integration LessonsAcquisition Integration Lessons
30
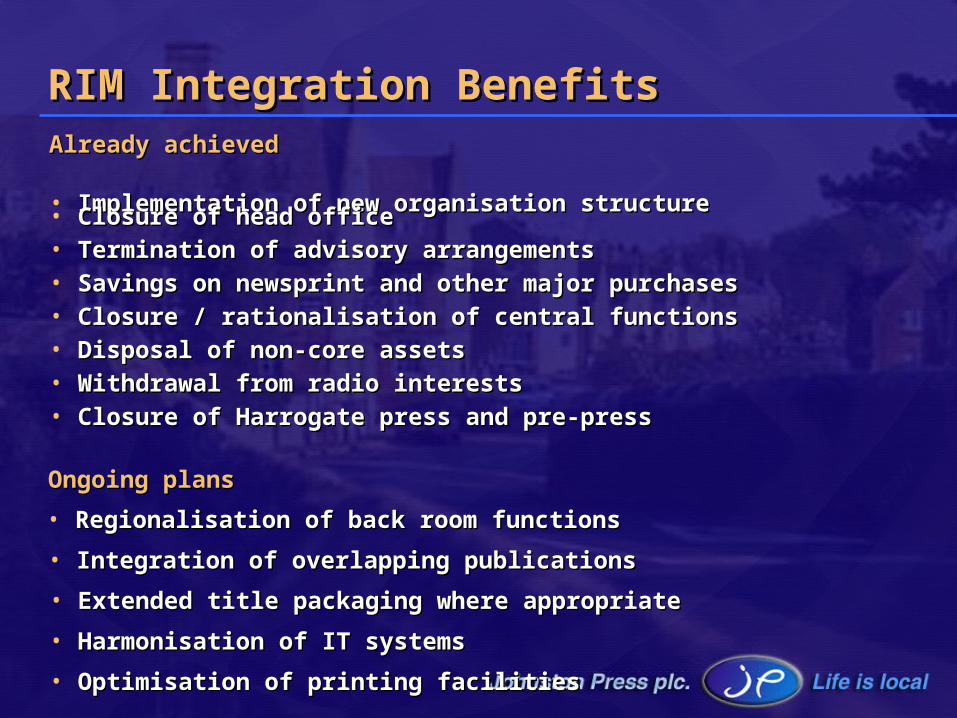
RIM Integration BenefitsRIM Integration BenefitsAlready achievedAlready achieved
• Implementation of new organisation structureImplementation of new organisation structure• Closure of head officeClosure of head office• Termination of advisory arrangementsTermination of advisory arrangements• Savings on newsprint and other major purchasesSavings on newsprint and other major purchases• Closure / rationalisation of central functionsClosure / rationalisation of central functions• Disposal of non-core assetsDisposal of non-core assets• Withdrawal from radio interestsWithdrawal from radio interests• Closure of Harrogate press and pre-pressClosure of Harrogate press and pre-press
• Extended title packaging where appropriateExtended title packaging where appropriate
• Harmonisation of IT systemsHarmonisation of IT systems
• Optimisation of printing facilitiesOptimisation of printing facilities
• Integration of overlapping publicationsIntegration of overlapping publications
• Regionalisation of back room functionsRegionalisation of back room functions
Ongoing plansOngoing plans
31
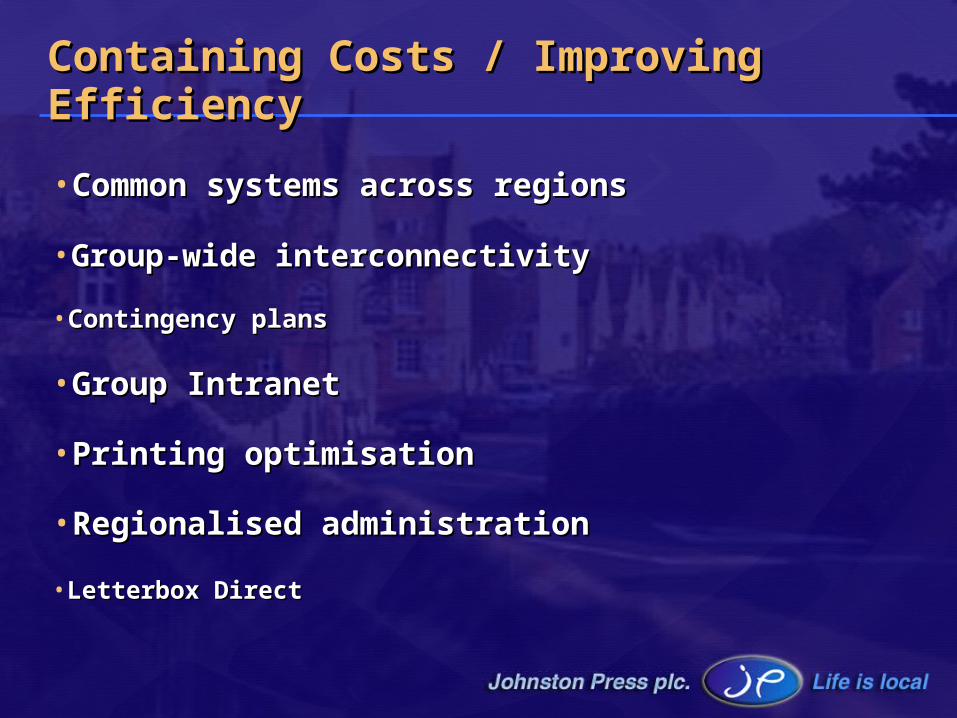
Containing Costs / Improving Containing Costs / Improving EfficiencyEfficiency
•Common systems across regionsCommon systems across regions
•Group-wide interconnectivityGroup-wide interconnectivity
•Contingency plansContingency plans
•Group Intranet Group Intranet
•Printing optimisationPrinting optimisation
•Regionalised administrationRegionalised administration
•Letterbox DirectLetterbox Direct
32
Newsprint Newsprint
•Price reductions 2002/03Price reductions 2002/03
•Standardising on reduced web-widthStandardising on reduced web-width
•Reducing wastageReducing wastage

33
Capital Expenditure PlansCapital Expenditure Plans
•Front end systemsFront end systems
•Press upgrades …. Leeds/SunderlandPress upgrades …. Leeds/Sunderland
•Computer-to-plateComputer-to-plate
•Longer term - Sheffield site/pressLonger term - Sheffield site/press

34
Electronic PublishingElectronic Publishing
•Withdrawal from Fish4Withdrawal from Fish4
•New property portalNew property portal
•Individual job uploadsIndividual job uploads
•Jobs and motors upgradesJobs and motors upgrades
•Integration of RIMIntegration of RIM
•Over 140 sitesOver 140 sites
35
0
2000000
4000000
6000000
8000000
10000000
12000000
14000000
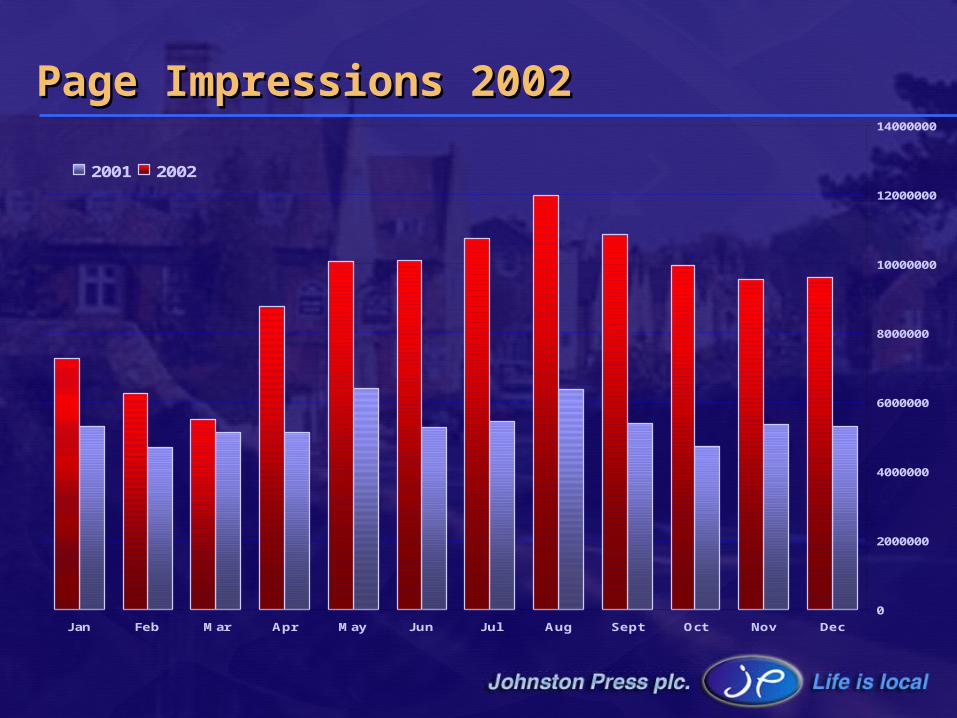
DecNovOctSeptAugJulJunMayAprMarFebJan
2001 2002
Page Impressions 2002Page Impressions 2002
36
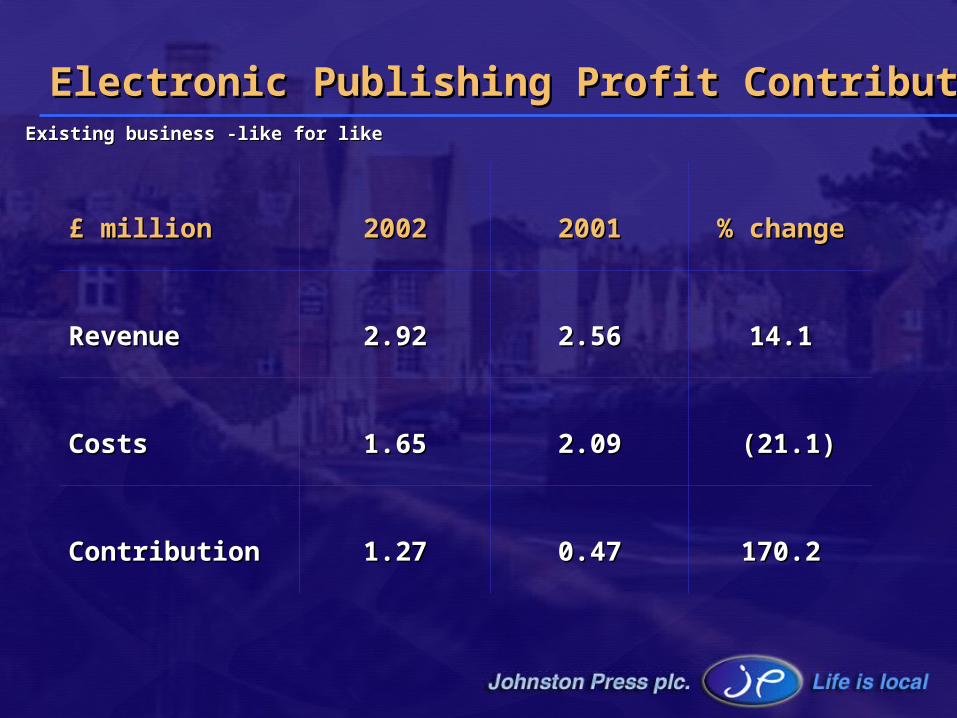
Electronic Publishing Profit Contribution Electronic Publishing Profit Contribution
£ million£ million 20022002 20012001 % change% change
RevenueRevenue 2.922.92 2.562.56 14.114.1
CostsCosts 1.651.65 2.092.09 (21.1)(21.1)
ContributionContribution 1.271.27 0.470.47 170.2170.2
Existing business -like for likeExisting business -like for like

37
Investment in PeopleInvestment in People
•Enhanced skill-based trainingEnhanced skill-based training
•Succession planningSuccession planning
•Management developmentManagement development
•SIP SchemeSIP Scheme

38
Acquisitive Growth / Acquisitive Growth / Regulatory EnvironmentRegulatory Environment
•Further consolidation anticipatedFurther consolidation anticipated
•Strategic focusStrategic focus
•SMG titlesSMG titles
•Communications BillCommunications Bill
•Regulators approachRegulators approach
39
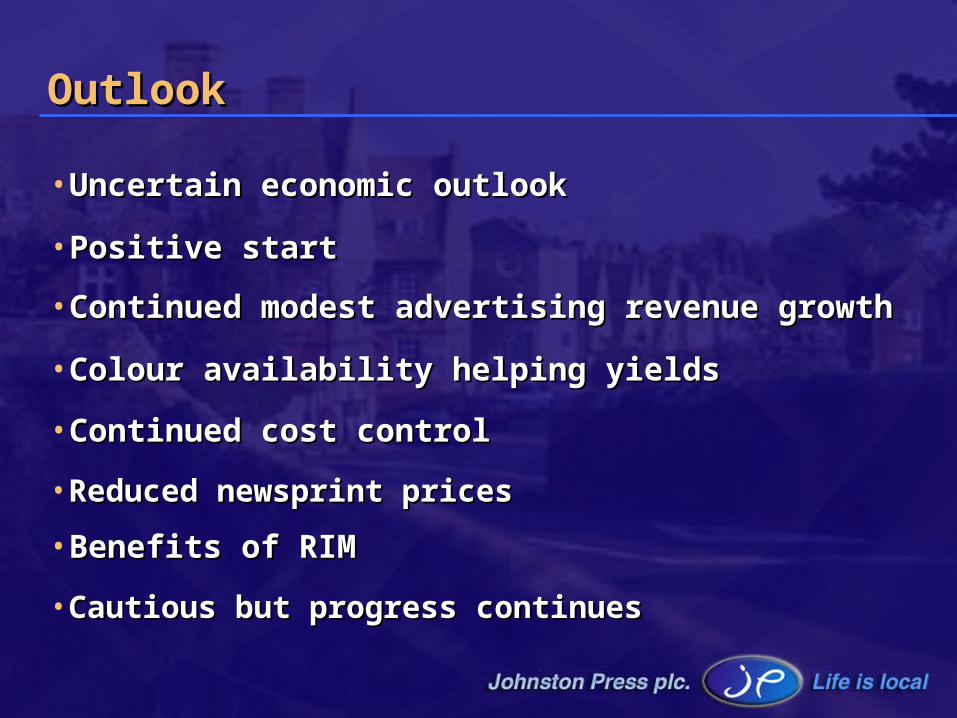
OutlookOutlook
•Uncertain economic outlookUncertain economic outlook
•Positive startPositive start
•Continued modest advertising revenue growthContinued modest advertising revenue growth
•Colour availability helping yieldsColour availability helping yields
•Continued cost controlContinued cost control
•Reduced newsprint pricesReduced newsprint prices
•Benefits of RIMBenefits of RIM
•Cautious but progress continuesCautious but progress continues

AppendicesAppendices
41
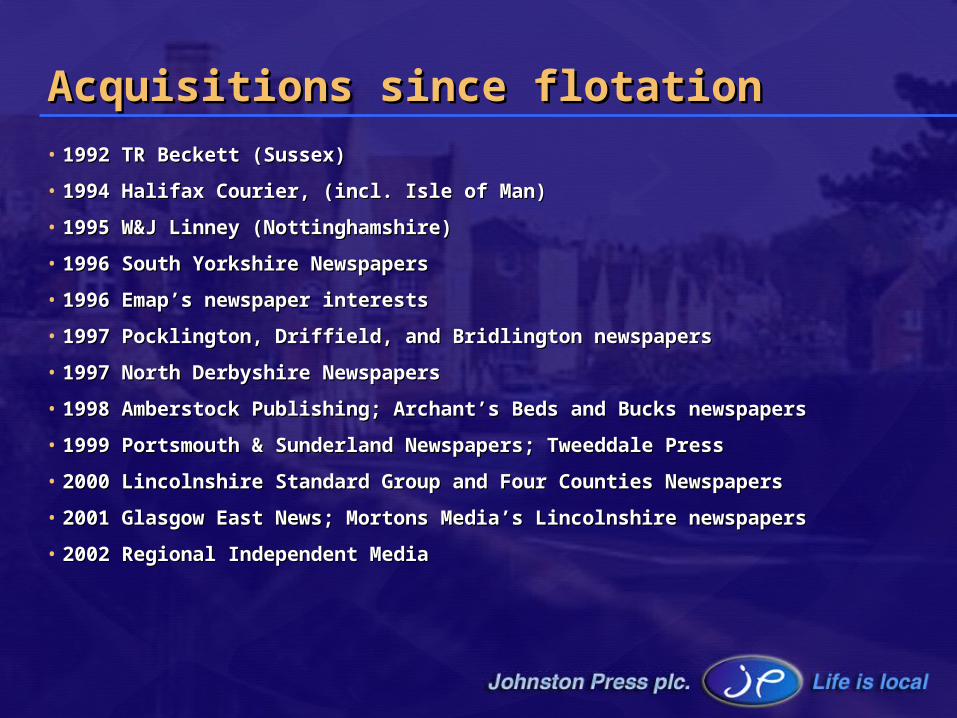
Acquisitions since flotationAcquisitions since flotation• 1992 TR Beckett (Sussex)1992 TR Beckett (Sussex)
• 1994 Halifax Courier, (incl. Isle of Man)1994 Halifax Courier, (incl. Isle of Man)
• 1995 W&J Linney (Nottinghamshire)1995 W&J Linney (Nottinghamshire)
• 1996 South Yorkshire Newspapers1996 South Yorkshire Newspapers
• 1996 Emap’s newspaper interests1996 Emap’s newspaper interests
• 1997 Pocklington, Driffield, and Bridlington newspapers1997 Pocklington, Driffield, and Bridlington newspapers
• 1997 North Derbyshire Newspapers1997 North Derbyshire Newspapers
• 1998 Amberstock Publishing; Archant’s Beds and Bucks newspapers 1998 Amberstock Publishing; Archant’s Beds and Bucks newspapers
• 1999 Portsmouth & Sunderland Newspapers; Tweeddale Press1999 Portsmouth & Sunderland Newspapers; Tweeddale Press
• 2000 Lincolnshire Standard Group and Four Counties Newspapers2000 Lincolnshire Standard Group and Four Counties Newspapers
• 2001 Glasgow East News; Mortons Media’s Lincolnshire newspapers 2001 Glasgow East News; Mortons Media’s Lincolnshire newspapers
• 2002 Regional Independent Media2002 Regional Independent Media
42
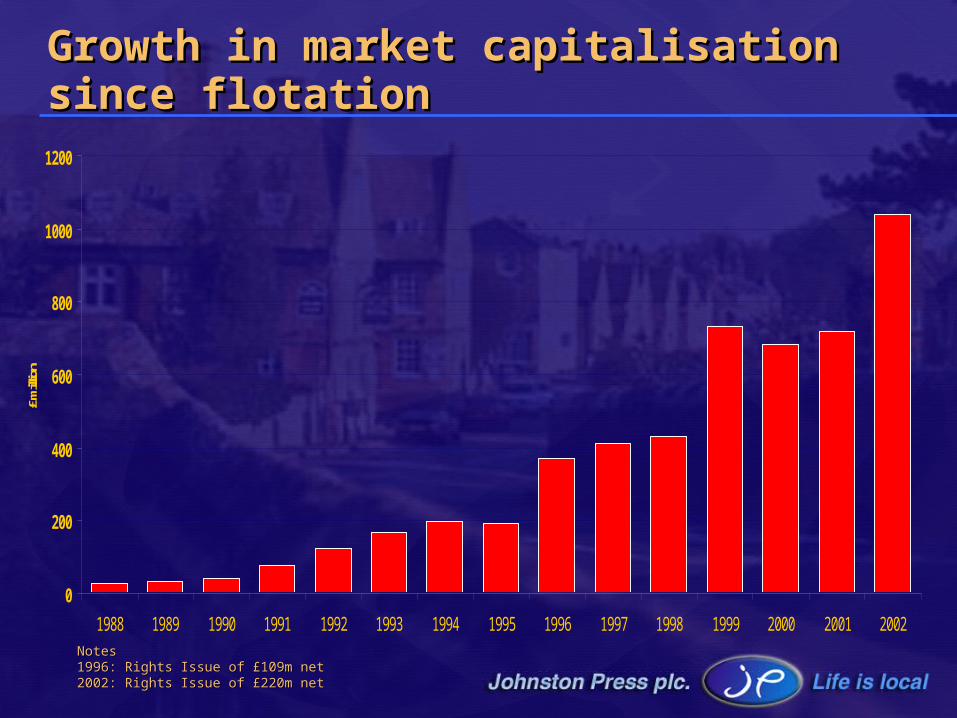
Growth in market capitalisation Growth in market capitalisation since flotationsince flotation
0
200
400
600
800
1000
1200
1988 1989 1990 1991 1992 1993 1994 1995 1996 1997 1998 1999 2000 2001 2002
£ milli
on
NotesNotes1996: Rights Issue of £109m net1996: Rights Issue of £109m net2002: Rights Issue of £220m net 2002: Rights Issue of £220m net
43
0
50
100
150
200
250
300
350
400
450
1988 1989 1990 1991 1992 1993 1994 1995 1996 1997 1998 1999 2000 2001 2002
£mill
ion
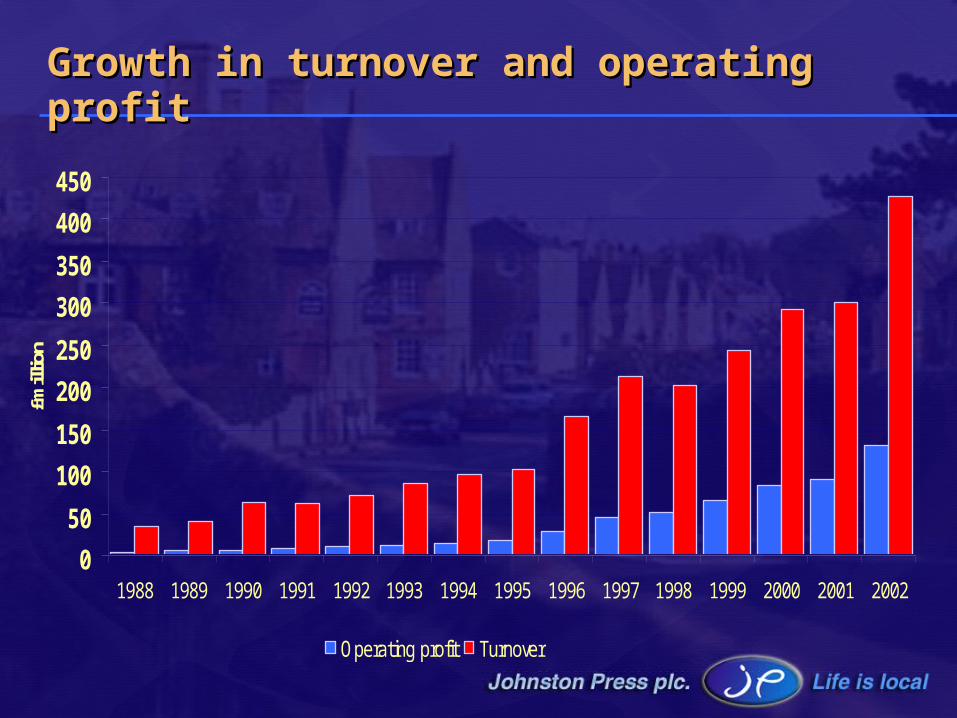
Operating profit Turnover
Growth in turnover and operating profitGrowth in turnover and operating profit
44
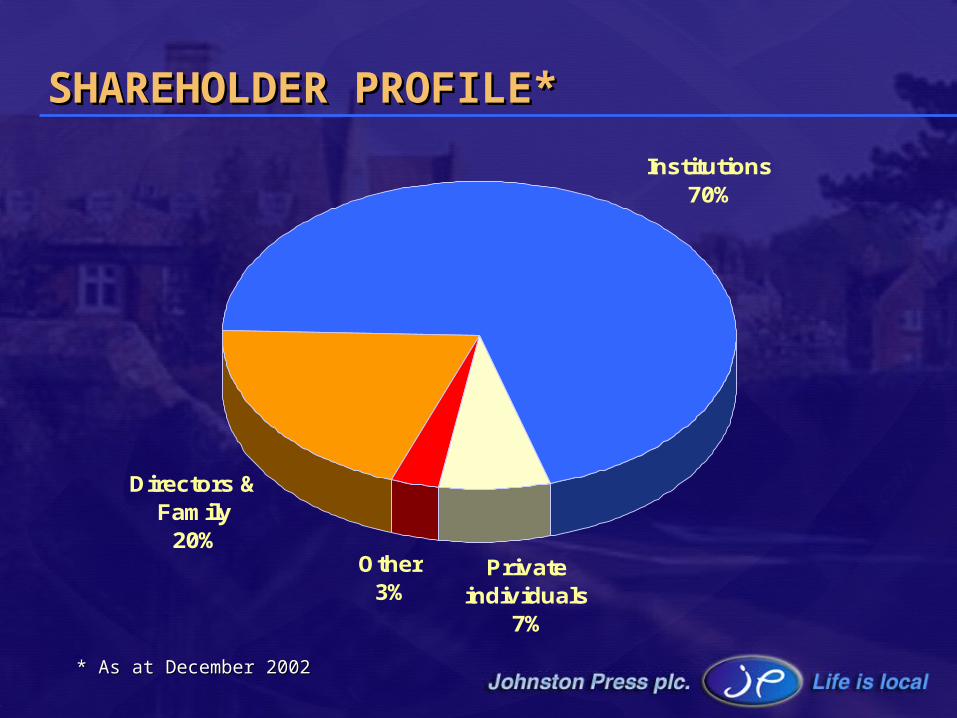
SHAREHOLDER PROFILE* SHAREHOLDER PROFILE*
Directors & Family
20%
Institutions70%
Other3%
Private individuals
7%
* As at December 2002* As at December 2002
45
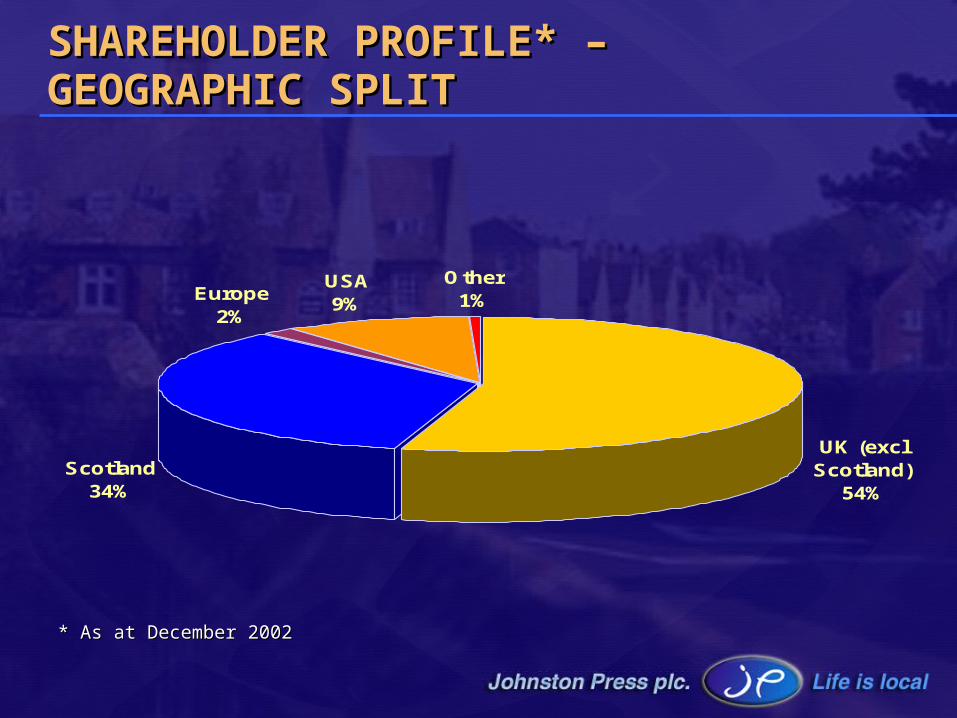
SHAREHOLDER PROFILE* – SHAREHOLDER PROFILE* – GEOGRAPHIC SPLITGEOGRAPHIC SPLIT
UK (excl Scotland)
54%
Scotland34%
Europe2%
USA9%
Other1%
* As at December 2002* As at December 2002
46
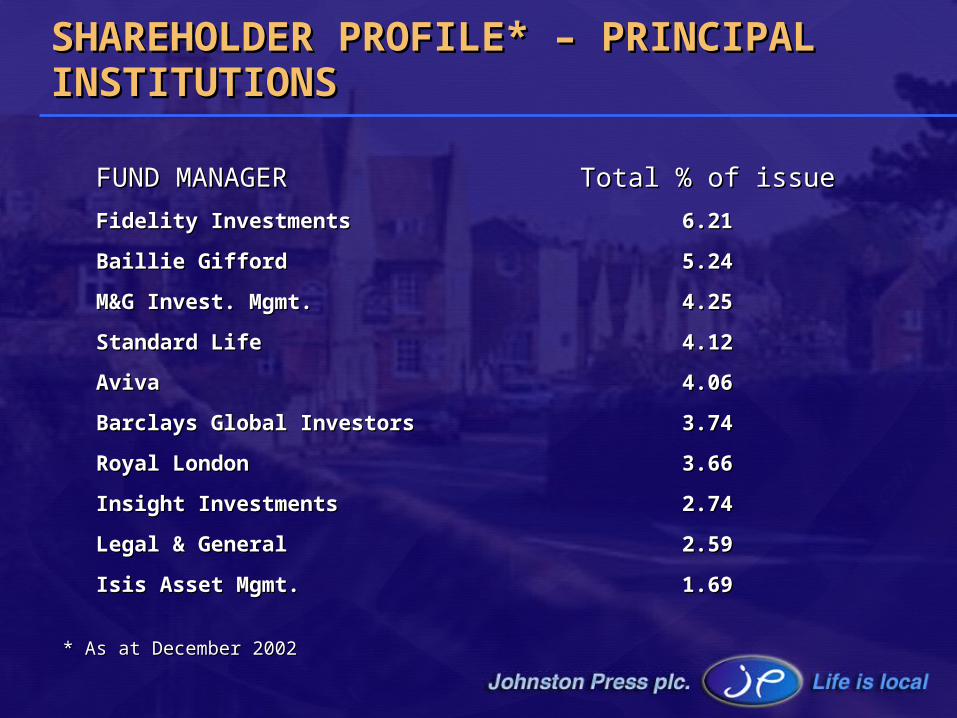
SHAREHOLDER PROFILE* – PRINCIPAL SHAREHOLDER PROFILE* – PRINCIPAL INSTITUTIONSINSTITUTIONS
FUND MANAGERFUND MANAGER Total % of issueTotal % of issue
Fidelity InvestmentsFidelity Investments 6.216.21
Baillie GiffordBaillie Gifford 5.245.24
M&G Invest. Mgmt.M&G Invest. Mgmt. 4.254.25
Standard LifeStandard Life 4.124.12
AvivaAviva 4.064.06
Barclays Global InvestorsBarclays Global Investors 3.743.74
Royal LondonRoyal London 3.663.66
Insight InvestmentsInsight Investments 2.742.74
Legal & GeneralLegal & General 2.592.59
Isis Asset Mgmt.Isis Asset Mgmt. 1.691.69
* As at December 2002* As at December 2002