2. N. A. PHYSICOCHEMICAL AND BACTERIOLOGICAL …
12
https://dx.doi.org/10.4314/gjgs.v17i1.2 GLOBAL JOURNAL OF GEOLOGICAL SCIENCES VOL. 17, 2019: 13-24 COPYRIGHT© BACHUDO SCIENCE CO. LTD PRINTED IN NIGERIA ISSN 1596-6798 www.globaljournalseries.com , Email: [email protected] PHYSICOCHEMICAL AND BACTERIOLOGICAL PARAMETERS OF SURFACE WATER QUALITY IN PART OF OBAN MASSIF, NIGERIA A.N. UGBAJA AND B. E.EPHRAIM (Received 27July 2018; Revision Accepted 2 November 2018) ABSTRACT The present study presents preliminary investigation on the physico-chemical and bacteriological parameters of surface water samples collected, during the wet and dry seasons, from streams in Orem and environs, a typical Basement terrain in southeastern Nigeria. The intension was to evaluate the suitability of the water for domestic and agricultural uses. Results generally indicate normal water temperature, especially for the tropic; pH reflecting slightly acidic conditions; low EC and water hardness which respectively qualifies the water as excellent and soft; turbidity values that points to the water as a possible sources of water-borne diseases; DO values that are reasonable, to support good fish production, throughout the year; low levels of nutrients and heavy metals that pose no detrimental effect for the aquatic ecosystem; and low Salinity and Total Dissolved Solids (TDS) that reflects water of low mineralization. The major dissolved cations points to a possible geogenic source for the major ions, while the anion levels supports agricultural and anthropogenic pollutions. Values recorded during the dry season were frequently higher than those recorded during the wet season, possibly reflecting dilution and evaporation effects during the wet and dry seasons, respectively. With minor exceptions, the levels of almost all the tested parameters were within the respective permissible limits of the Nigerian standards for drinking water quality (NSDWQ). Among the exceptions in this regards, is the unacceptable and alarmingly high volume of bacteriological inputs recorded for the waters. Clearly, this renders the water unfit for consumption and various other usage, in its present form. INTRODUCTION All living organisms on the earth need water for survival and growth. However, increased rate of urbanization, industrialization and other forms of modernization have continued to threaten the quality of natural water available to organisms. In particular, sustained usage of fertilizer, pesticide and other agrochemicals, have, to a large extent, rendered natural water, in most cases, highly contaminated with different harmful pollutants. Therefore, regular checks on the quality of drinking water become necessary. The availability of good quality water is an indispensable feature for preventing diseases and improving quality of life. Simpiet al. (2011) emphasized the need for proper understanding of the hydro-biological relationship caused by metabolic interactions in the ecosystem. Natural water frequently contain impurities that originate either from natural source,(weathering of rocks, leaching of soils and dissolution of aerosols particles), or from anthropogenic sources ,such as, mining, processing, agricultural practices and use of metal - based materials (Adeyeye 1994;Asaolu 1997). Increased use of potentially harmful substances has placed humans under tremendous threat. Fakayode (2005) observed that industrial developments is frequently associated with the generation of industrial effluents, which can bring about water, sediment and soil pollution, if unchecked. Increased concentration of organic matter in the surface waters leads to increased biological oxygen demands (BOD), chemical oxygen demands (COD), total dissolved solids, total suspended solids and faecal coli form. All these make the water unsuitable for drinking, irrigation and other uses (Hari et al., 1994; Kulkarni, 1997). This study presents preliminary investigation on the physico-chemical and bacteriological parameters of water samples collected in two seasons from Orem and its environs in south-eastern Nigeria. The intension is to evaluate their suitability for domestic and agricultural uses. STUDY AREA DESCRIPTION The area under investigation (Fig. 1) form parts of the Oban Massif, a prominent basement terrain within southeast Nigerian. It is delimited by the coordinates :longitude 8 ° 45 ' E – 8 ° 50 ' E of the Greenwich meridian, and latitude 5 ° 28 ' N – 5 ° 33 ' N of the equator. The relief of the area can best be classified as an elevated or high land. In terms of climate, the area A. N. Ugbaja, Department of Geology, University of Calabar, Calabar, Nigeria. B. E. Ephraim, Department of Geology, University of Calabar, Calabar, Nigeria. © 2019 Bachudo Science co. Ltd. This work is licensed Under Creative Commons Attribution 4.0 international license. 13
Transcript of 2. N. A. PHYSICOCHEMICAL AND BACTERIOLOGICAL …

https://dx.doi.org/10.4314/gjgs.v17i1.2
GLOBAL JOURNAL OF GEOLOGICAL SCIENCES VOL. 17, 2019: 13-24 COPYRIGHT© BACHUDO SCIENCE CO. LTD PRINTED IN NIGERIA ISSN 1596-6798
www.globaljournalseries.com, Email: [email protected] PHYSICOCHEMICAL AND BACTERIOLOGICAL PARAMETERS OF SURFACE WATER QUALITY IN PART OF OBAN MASSIF, NIGERIA
A.N. UGBAJA AND B. E.EPHRAIM
(Received 27July 2018; Revision Accepted 2 November 2018)
ABSTRACT
The present study presents preliminary investigation on the physico-chemical and bacteriological parameters of surface water samples collected, during the wet and dry seasons, from streams in Orem and environs, a typical Basement terrain in southeastern Nigeria. The intension was to evaluate the suitability of the water for domestic and agricultural uses. Results generally indicate normal water temperature, especially for the tropic; pH reflecting slightly acidic conditions; low EC and water hardness which respectively qualifies the water as excellent and soft; turbidity values that points to the water as a possible sources of water-borne diseases; DO values that are reasonable, to support good fish production, throughout the year; low levels of nutrients and heavy metals that pose no detrimental effect for the aquatic ecosystem; and low Salinity and Total Dissolved Solids (TDS) that reflects water of low mineralization. The major dissolved cations points to a possible geogenic source for the major ions, while the anion levels supports agricultural and anthropogenic pollutions. Values recorded during the dry season were frequently higher than those recorded during the wet season, possibly reflecting dilution and evaporation effects during the wet and dry seasons, respectively. With minor exceptions, the levels of almost all the tested parameters were within the respective permissible limits of the Nigerian standards for drinking water quality (NSDWQ). Among the exceptions in this regards, is the unacceptable and alarmingly high volume of bacteriological inputs recorded for the waters. Clearly, this renders the water unfit for consumption and various other usage, in its present form. INTRODUCTION All living organisms on the earth need water for survival and growth. However, increased rate of urbanization, industrialization and other forms of modernization have continued to threaten the quality of natural water available to organisms. In particular, sustained usage of fertilizer, pesticide and other agrochemicals, have, to a large extent, rendered natural water, in most cases, highly contaminated with different harmful pollutants. Therefore, regular checks on the quality of drinking water become necessary. The availability of good quality water is an indispensable feature for preventing diseases and improving quality of life. Simpiet al. (2011) emphasized the need for proper understanding of the hydro-biological relationship caused by metabolic interactions in the ecosystem. Natural water frequently contain impurities that originate either from natural source,(weathering of rocks, leaching of soils and dissolution of aerosols particles), or from anthropogenic sources ,such as, mining, processing, agricultural practices and use of metal - based materials (Adeyeye 1994;Asaolu 1997). Increased use of potentially harmful substances has placed humans under tremendous threat. Fakayode (2005) observed that industrial
developments is frequently associated with the generation of industrial effluents, which can bring about water, sediment and soil pollution, if unchecked. Increased concentration of organic matter in the surface waters leads to increased biological oxygen demands (BOD), chemical oxygen demands (COD), total dissolved solids, total suspended solids and faecal coli form. All these make the water unsuitable for drinking, irrigation and other uses (Hari et al., 1994; Kulkarni, 1997). This study presents preliminary investigation on the physico-chemical and bacteriological parameters of water samples collected in two seasons from Orem and its environs in south-eastern Nigeria. The intension is to evaluate their suitability for domestic and agricultural uses. STUDY AREA DESCRIPTION The area under investigation (Fig. 1) form parts of the Oban Massif, a prominent basement terrain within southeast Nigerian. It is delimited by the coordinates :longitude 8
°45
'E – 8
°50
'E of the Greenwich meridian,
and latitude 5°28
'N – 5
°33
'N of the equator. The relief of
the area can best be classified as an elevated or high land. In terms of climate, the area
A. N. Ugbaja, Department of Geology, University of Calabar, Calabar, Nigeria.
B. E. Ephraim, Department of Geology, University of Calabar, Calabar, Nigeria.
© 2019 Bachudo Science co. Ltd. This work is licensed Under Creative Commons Attribution 4.0 international license.
13

experiences two distinct seasons as common in most tropical area; the wet season (March – October) and the dry season (November –February). The dry season is usually ushered in by dry Northeast Trade Wind which blow s across the Sahara Desert (Beka et al., 2014), while the wet season is often influenced by rain-bearing southwest monsoon that blows from the oceans in the southern regions. The mean temperature documented for the area is about 30
°C, while the relative humidity is
frequently high throughout the year except for the short dry period, during the harmattan.
The Oban Massif is characterized by highly deformed Precambrian crystalline basement rocks, mainly migmatites, granites, gneisses, and schists (Ekwueme and Ekwere, 1989; Ekwere and Ekwueme, 1991). These are intruded by pegmatites, granodiorites, diorites, tonalites, monzonites, charnokites dolerites and pyroxenites (Ekwueme, 1990, 2003).Structurally, the predominant trend is in the NE-SW direction (Figure 1) with only few deviations, for most of the minerals foliations and fracture patterns. The basement rocks exhibit varying degrees of weathering across the Massif.
FIG 1.Geological Map of the study area showing the sample locations
METHODOLOGY Sampling and Sampling techniques Sampling was confined to surface water (mostly streams and small rivers) located within the study area, Orem and environs. A total of 16water samples were collected from different streams namely: Akonje stream, Orem stream, IyataiRiver, Akunjak River, Akonji, AgbiEyeta, Ebinoku and Achang rivers (Fig.1). Most of these sampled streams, which served as sources of water for cooking and drinking for the villagers, were major sites for recreational activities, including washing and bathing by the inhabitant of the area. The sampling was carried out in April 2015 to cover the wet season, and in December 2015 to cover the dry season. The intension was to ensure overall coverage of the variation in the surface water quality during the two seasons. The sampling and analysis of the water samples were carried out with strict adherence to the standards prescribes by the Nigerian standard for drinking water quality (NSDWQ, 2008). At each sampling station, water samples were collected from the shallow end towards
the centre of the streams so as to obtain a more representative sample. The collected samples were analysed for various parameters, namely: Temperature (°C), pH, Electrical Conductivity (EC; µs/cm), Turbidity (NTU), Total Alkalinity (mg/L), Total Hardness (mg/L), Salinity (ppt), TDS (mg/L), TSS (mg/L), DO (mg/L), BOD (mg/L), Ca
2+ (mg/L), Mg
2+ (mg/L), Na
+ (mg/L), K
+
(mg/L), Cl-
(mg/L), SO42-
(mg/L), NO3-
(mg/L), PO42-
(mg/L), NO4
- (mg/L), NH4 (mg/L), F (mg/L), Fe (mg/L),
Mn (mg/L), Cr (mg/L), Cu (mg/L) and Zn (mg/L). Bacteriological analyses carried out include Total heterotrophic count (THC/100ml), total coli form count (TCC/100ml) and faecal coli form count (FCC/100ml).All analyses were carried out at the Cross River State Water Board standardized laboratory, using international regulatory methods. The analytical techniques employed for each of the physicochemical parameters are listed in Table 1. The generated analytical data was statistically handled using the statistical package for social sciences (SPSS), software version 20. Histograms and charts were used for the presentation of the data for easy visualization.
14 A.N. UGBAJA AND B. E.EPHRAIM

Table 1: Analytical techniques employed for the study
PARAMETERS ANALYTICAL TECHNIQUES
Temperature Mercury – in – Glass Thermometer Ph Digital Ph Meter Electrical Conductivity (EC) Conductivity Meter Turbidity Spectrophotometer (Dr 3000) Total Alkalinity Acid-Base Titrimetric Method Total Hardness, Ca
2+, Mg
2+ EDTA Titrimetric Method
Salinity Salinity Meter (HANNA MODEL). Total Dissolved Solids (TDS),Total Solids(TSS) Gravimetric Method Dissolved Oxygen(DO) Winkler Titrimetric Method Biochemical Oxygen Demand(BOD) Dilution Winkler Method Na
+, K
+, Fe, Mn, Cr , Cu,Zn Atomic Absorption Spectrophotometry (AAS)
Cl- Mercuric Nitrate Titrimetric Method
NO3- , NO4
- Phenoldisulphonic Acid Colorimetric Method
PO42-
Ascorbic Acid Colorimetric Method SO4
2- Turbidimetric Method
NH4 Nessler’s Colorimetric Method
RESULTS AND DISCUSSION Results of the physico-chemical and bacteriological analyses carried out on water samples from Orem and environs in Eastern Oban Massif area of south eastern Nigeria are presented in Tables 2and 3. Data in Table 2 are for samples collected during the wet season, while those of Table 3 are for samples collected during the dry
season. Both datasets are compared with the relevant values of the Nigerian standard for drinking water quality (NSDWQ, 2008). The statistical summary of these datasets, together with T-test data comparing values for both the wet and dry seasons, is given in Table 4. In addition, graphical representation of variations of selected physicochemical parameters in the surface waters of both seasons are presented as Figures 2 to 5.
Table 2: Result of physico-chemical and bacteriological analysis of surface waters, sampled during the wet
season
Parameter/Unit L 1 L 2 L 3 L 4 L 6 L 7 L 8 L 9 NSDWQ (2008)
Physico-Chemical Parameters
Temp (°C) 26.50
26.60
26.20
25.90
26.30
25.60
25.80
25.80
Ambient
pH 6.16 5.33 5.39 4.58 5.97 6.31 6.26 6.20 6.5-8.5
EC (µs/cm) 16.60
16.80
17.40
23.20
16.40
26.10
21.30
24.90
500
Turbidity (NTU) 0.06 0.08 1.05 2.37 0.09 0.09 0.11 0.05 5.00 Total Alkalinity (mg/L)
7.73 7.37 7.40 6.94 7.65 7.78 7.76 7.74
Total Hardness (mg/L)
17.10
17.10
17.10
17.10
17.10
17.10
17.10
17.10
100.00
Salinity (ppt) 0.00 0.00 0.10 0.00 0.05 0.06 0.07 0.07
TDS (mg/L) 9.93 10.10
10.40
13.90
9.83 15.70
12.80
14.90
1000
TSS (mg/L) BDL BDL BDL BDL BDL BDL BDL BDL 0.100
DO (mg/L) 8.00 8.00 9.00 11.00
8.00 13.00
10.00
12.00
14.00
BOD (mg/L) 4.20 4.00 4.90 6.50 3.60 7.66 6.10 6.00
Major Dissolved Components
Ca2+
(mg/L) 7.50 6.90 7.57 7.30 7.60 7.30 6.80 7.05
Mg2+
(mg/L) 9.60 10.20
9.53 9.80 9.50 9.80 10.30
10.10
20.00
Na+ (mg/L) 0.76 0.62 0.86 0.67 1.20 1.00 1.10 0.96
K+ (mg/L) 1.06 0.96 1.20 0.98 1.03 1.05 0.95 2.03 100.00
Cl-
(mg/L) 1.03 1.02 1.03 1.10 1.05 1.30 1.09 1.05 100.00 SO4
2- (mg/L) 3.20 2.60 2.51 1.60 2.00 3.51 2.90 3.23 100.00
NO3-
(mg/L) 3.50 4.00 3.00 5.60 3.80 4.00 2.60 3.10 10.00
Nutrients and Heavy Metals
PO42-
(mg/L) 2.06 1.60 2.05 2.30 2.00 2.06 2.50 1.30 100.00 NO2
- (mg/L) BDL BDL BDL BDL BDL BDL BDL BDL 0.100
NH4 (mg/L) 0.40 0.30 0.60 0.50 0.40 0.30 0.40 0.30 1.00 F (mg/L) 0.06 0.08 0.05 0.06 0.07 0.06 0.07 0.05 1.50 Fe (mg/L) 0.13 0.09 0.07 0.10 0.08 0.08 0.07 0.09 0.30 Mn (mg/L) 0.03 0.05 0.03 0.04 0.06 0.05 0.03 0.04 0.05
PHYSICOCHEMICAL AND BACTERIOLOGICAL PARAMETERS OF SURFACE WATER QUALITY 15

Cr (mg/L) BDL BDL BDL BDL BDL BDL BDL BDL 0.004 Cu (mg/L) BDL BDL BDL BDL BDL BDL BDL BDL 1.00 Zn (mg/L) 0.03 0.06 0.05 0.05 0.03 0.05 0.06 0.07 5.00
Bacteriological Pollutants
FCC/100ml 21.00
19.00
14.00
23.00
22.00
18.00
20.00
19.00
0.00
TCC/100ml 45.00
38.00
29.00
56.00
46.00
33.00
37.00
25.00
0.00
THC/100ml 96.00
78.00
64.00
92.00
77.00
55.00
78.00
69.00
3.00
BDL = below detection limits
Table 3: Result of physico-chemical and bacteriological analysis of surface waters, sampled during the dry Season (December 2016)
Parameter/Unit L 1 L 2 L 3 L 4 L 6 L 7 L 8 L 9 NSDWQ (2008)
Physico-Chemical Parameters
Temp (°C) 24.10
24.50
24.50
24.60
24.70
22.40
24.80
24.80
Ambient
pH 6.47 6.03 6.12 6.25 6.75 6.51 5.93 6.51 6.5-8.5
EC (µs/cm) 29.50
31.90
28.20
32.10
64.40
34.20
35.40
32.70
500
Turbidity (NTU) 1.43 1.07 5.59 3.75 0.13 8.58 5.36 8.99 5.00 Total Alkalinity (mg/L)
7.84 7.30 7.71 7.00 9.23 7.85 7.64 6.43 -
Total Hardness mg/L)
9.63 6.45 13.64
9.93 16 12.31
11.21
14.57
100
Salinity (ppt) BDL 0.05 0.10 0.05 0.08 0.03 0.02 0.04
TDS (mg/L) 17.70
10.30
16.90
19.26
38.64
20.50
21.24
19.62
1000
TSS (mg/L) 0.000
0.000
0.068
0.026
1.053
0.641
0.060
0.083
0.100
DO (mg/L) 9.50 7.52 8.52 7.34 9.88 8.19 3.09 8.06 14.00 BOD (mg/L) 7.22 6.90 7.35 6.20 7.18 7.14 0.33 6.77 -
Major Dissolved Ions
Ca2+
(mg/L) 4.53 2.33 6.52 4.80 6.55 4.09 4.08 6.07 - Mg
2+ (mg/L) 5.10 4.12 7.12 5.13 9.46 7.22 7.13 8.50 20.00
Na+ (mg/L) 0.86 0.62 1.03 0.67 1.22 1.02 1.20 1.00
K+ (mg/L) 2.03 0.96 2.00 2.46 4.62 2.07 1.80 1.28 100
Cl-
(mg/L) 1.09 0.89 2.50 2.00 3.50 2.53 2.50 2.06 100.00 SO4
2- (mg/L) 3.05 BDL BDL BDL 5.91 6.80 3.09 5.03 100
NO3-
(mg/L) 5.60 3.50 5.30 4.60 16.20
13.20
10.20
15.30
10.00
PO42-
(mg/L) 2.50 1.63 4.16 3.11 3.08 4.55 2.11 2.99 100
NO4-
(mg/L) 0.002
0.001
bdl 0.006
0.160
0.080
0.090
0.060
0.100
NH3 (mg/L) 0.61 0.30 0.50 0.30 0.80 0.80 0.40 0.60 1.0 F (mg/L) 0.26 0.32 0.65 0.42 0.68 0.34 0.16 0.11 1.50 Fe (mg/L) 0.42 0.15 0.86 0.34 1.37 0.83 0.60 1.20 0.30
Mn (mg/L) 0.053
0.022
0.080
0.013
0.972
0.106
0.067
0.901
0.050
Cr (mg/L) 0.000
0.000
0.002
0.000
0.001
0.000
0.000
0.000
0.004
Cu (mg/L) 0.11 0.13 0.19 0.20 0.35 0.28 0.11 0.24 1.00 Zn (mg/L) 0.20 0.14 1.80 1.00 1.65 0.76 0.36 0.13 5.00
Bacteriological Pollutants
FCC/100ml 95.0 103.0
250.0
31.0 250.0
250.0
250.0
250.0
0.0
TCC/100ml 112.0
146.0
250.0
53.0 250.0
250.0
250.0
250.0
0.00
THC/100ml 156.0
172.0
250.0
96.0 250.0
250.0
250.0
250.0
3.00
BDL = below detection limits
A cursory appraisal of the presented data revealed that values recorded during the dry season (Table. 3) were
generally higher than values recorded during the wet season (Table. 1), and the variations, in most cases,
16 A.N. UGBAJA AND B. E.EPHRAIM

were statistically significant(p<0.05) (Table 4).It was also revealed that the levels of most, if not all, of the tested parameters of the water samples of both rainy and dry seasons were within the permissible limits of the Nigerian standard for drinking water quality (NSDWQ) and World Health Organization (WHO, 1999)
permissible limit (Table 1 and 2). The only exceptions were observed in the dry season (Table 3) for turbidity (L3, L7, L8 and L9), TSS (L6 and L7), Fe (in almost all the locations sampled), Mn (L6, L9) NO3
- (L6, L7, L9)
and NO2- (L6).
Table 4: Statistical summary of some physical and chemical characteristics of surface water samples in the study area
MIN MAX MEAN STD T-Test Data
Parameter/Unit WET DRY WET DRY WET DRY WET DRY t-score
p-level
Temp (°C) 25.60 22.40 26.60 24.80 26.09 24.30 0.36 0.80 5.75 0.00***
pH 4.58 5.93 6.31 6.75 5.78 6.32 0.62 0.28 2.28 0.04***
EC (µs/cm) 16.40 28.20 26.10 64.40 20.34 36.05 4.03 11.69 3.59 0.00***
Turbidity (NTU) 0.05 0.13 2.37 8.99 0.49 4.36 0.83 3.37 3.16 0.01***
Total Alkalinity (mg/L)
6.94 6.43 7.78 9.23 7.55 7.63 0.29 0.81 0.26 0.80
Total Hardness mg/L)
17.10 6.45 17.10 16.00 17.10 11.72 0.00 3.07 4.95 0.00***
Salinity (ppt) 0.00 0.00 0.10 0.10 0.04 0.05 0.04 0.03 0.14 0.89
TDS (mg/L) 9.83 10.30 15.70 38.64 12.20 20.52 2.43 8.08 2.79 0.01***
TSS (mg/L) 0.00 0.00 0.00 1.05 0.00 0.24 0.00 0.39 1.75 0.10
DO (mg/l) 8.00 3.09 13.00 9.88 9.88 7.76 1.96 2.08 2.09 0.06
BOD (mg/L) 3.60 0.33 7.66 7.35 5.37 6.14 1.42 2.37 0.78 0.45
Ca2+
(mg/L) 6.80 2.33 7.60 6.55 7.25 4.87 0.31 1.45 4.53 0.00***
Mg2+
(mg/L) 9.50 4.12 10.30 9.46 9.85 6.72 0.31 1.82 4.80 0.00***
Na+ (mg/L) 0.62 0.62 1.20 1,22 0.90 0.95 0.21 0.22 0.53 0.61
K+ (mg/L) 0.95 0.96 2.03 4.62 1.16 2.15 0.36 1.10 2.42 0.03***
Cl-
(mg/L) 1.02 0.89 1.30 3.5 1.08 2.13 0.09 0.84 3.51 0.00***
SO42-
(mg/L) 1.60 3.05 3.51 6.8 0.65 2.78 2.69 2.99 0.29 0.78
NO3-
(mg/L) 2.60 3.50 5.60 16.2 3.70 9.24 0.92 5.14 3.00 0.01***
PO42-
(mg/L) 1.30 1.63 2.50 4.55 1.98 3.02 0.38 0.98 2.79 0.01***
NO2-
(mg/L) 0.00 0.00 0.00 0.16 0.00 0.05 0.00 0.06 2.42 0.03***
NH3 (mg/L) 0.3 0.3 0.6 0.8 0.40 0.54 0.11 0.20 1.73 0.11
F (mg/L) 0.05 0.11 0.08 0.68 0.06 0.37 0.01 0.21 4.13 0.00***
Fe (mg/L) 0.07 0.15 0.13 1.37 0.09 0.72 0.02 0.42 4.22 0.00***
Mn (mg/L) 0.03 0.01 0.06 0.972 0.04 0.28 0.01 0.41 1.63 0.13
Cr (mg/L) 0 0 0 0.002 0.00 0.00 0.00 0.00 1.43 0.18
Cu (mg/L) 0 0.11 0 0.35 0.00 0.20 0.00 0.09 6.62 0.00***
Zn (mg/L) 0.03 0.13 0.07 1.8 0.05 0.76 0.01 0.67 2.96 0.01***
FCC/100ml 14 31 23 250 19.50 184.88
2.78 92.32 5.06 0.00***
TCC/100ml 25 53 56 250 38.63 195.13
10.07 79.80 5.50 0.00***
THC/100ml 55 96 96 250 76.13 209.25
13.62 60.18 6.10 0.00***
***significant at p<0.05
PHYSICOCHEMICAL AND BACTERIOLOGICAL PARAMETERS OF SURFACE WATER QUALITY 17

Physico-chemical Parameters The physic-chemical parameters considered in this study includes, temperature (in °C), pH, electrical conductivity (EC; in µs/cm), turbidity (in NTU), alkalinity (in mg/L), total hardness (in mg/L), salinity (ppt), dissolved oxygen (DO; in mg/L), biological oxygen demand (BOD; in mg/L), total dissolved solids (TDS; in mg/L) and total suspended solids (TSS; in mg/L). The levels of these parameters are illustrated in Fig. 2, and discussed below under appropriate subheadings:
FIG 2: Graphical representation of distribution of physicochemical characteristics of surface water in the study area
Temperature: As shown in Tables 2&3, and Fig 2, water samples of both seasons are reasonably warm with consistent temperatures, ranging from 25.6 to 26.6 ºC for water sampled during the wet season, and from 22.4 to 24.8 ºC for water sampled during the dry season. The range values are normal for water in the tropics, and is attributed to weather conditions of the study area – which is characterized by hot dry season and cold wet season (Akpan et al, 2015; Moses, 1987). The difference in the water temperature between the wet and dry seasons were, expectedly, statistically (p<0.05) significant (Table 4).Conversely, the recorded mean water temperature for each of the seasons showed variations within very narrow limits (Table 4). pH: pH is one of the most important parameters commonly measured in natural and waste waters to ascertain their quality status. Generally, pH values measured in the present study are indicative of slightly acidic water (4.58 to6.31 for the wet season, and 5.93 to 6.75 for the dry season). The mean pH values were frequently below the acceptable range of 6.5 - 8.5 prescribed by the regulatory agency (NSDWQ, 2008). The acidic nature of the water samples possible reflect the presence of high levels of free CO2 in the waters. An important problem associated with acidic nature of surface waters is that these waters favours the mobility of non-biodegradable and hazardous trace elements within them (Ephraim and Ajayi, 2015). Electrical Conductivity (EC): Electrical conductivity (EC) in natural waters is the normalized measure of the ability of the water to conduct electricity. Waters with EC values between 250 and 1000 μs /cm are not usually recommended for human consumption, and such waters are also not suitable for irrigation except for high salt tolerant crops with special techniques of management (Kuyeli et al., 2009). The electrical conductivity (EC) values measured in the
sampled waters during the wet season ranged from 16.40 to 26.10 μs/cm with a mean of 20.34 μs/cm; while that measured during the dry season ranged from 28.00 to 64.40 μs/cm with an average value of 36.05 μs/cm (Table 4). As shown (Table 4), EC values measured during the dry season are higher than those of the wet seasons. This most likely reflect the effect of dilution during the wet season. Akpan et al (2015) explained that precipitation, fresh water discharge and low temperature conditions do not favour high concentration of ionized substances in water. Ephraim and Ajayi (2015) considered waters with EC values less than 250 μs/cmas excellent waters. Turbidity and Total Suspended Solids (TSS): Turbidity is considered an important water quality parameter because of pathogenic properties it has on drinking water. The higher the mineral content, the more the total suspended solid present in the water. The higher the turbidity level, the more likely taste and odour problems may arise in the water. Although the mean values of turbidity for both the wet and dry seasons are below the acceptable 5.0 NTU limit prescribed by the Nigerian Standard for drinking water quality (NSDWQ, 2008), most of the waters sampled during the dry season (Table 3) displayed values (i.e. 5.36 – 8.99 NTU) above the acceptable limit of 5.0 NTU. Water with turbidity values above 5.0 NTU is not only visible and objectionable, but facilitates transmission of disease by micro-organisms associated with particulate matter (WRC, 2003). Thus, indication is that the waters with higher turbidity values could be sources of water-borne diseases to people that consume it raw without treatment. Typical sources of turbidity in the area include suspended and colloidal matters such as clay, silt, and organic matter. TSS was not observed at all in all the locations sampled during the wet season. On the other hand, TSS
0
10
20
30
40
50
60
70
APRIL MINIMUM
DEC MINIMUM
APRIL MAXIMUM
DEC MAXIMUM
18 A.N. UGBAJA AND B. E.EPHRAIM

values varied between 0.00 and 1.05 mg/L with a mean value of 0.39 mg/L during the wet season. Apart from the very high TSS values recorded at the locations “L6” during the dry season sampling the documented values are below the 0.1 mg/L limit set by the Nigerian standard for drinking water quality (NSDWQ, 2008). Total Alkalinity and Total Hardness: The alkalinity of water refers to its ability to neutralized acids. Very high level of alkalinity unlike acidity indicates the presence of industrial or chemical pollution. Water with moderate amounts of alkalinity can be consumed without adverse health effect but excessive contents would cause objectionable taste. Although peak values was recorded in the dry season, Total Alkalinity is one of the few measured parameters that does not show significant seasonal variation, The mean Total Alkalinity measured during the wet season was 7.55±0.29 mg/L, where the minimum value was 6.94 mg/l and the maximum was 7.78 mg/L (Table 2); while that for the dry season was 7.63±0.81 mg/L, where the minimum value was 6.43 mg/l and the maximum was 9.23 mg/L (Table 4). Hardness of water reflects the nature of the geology of the area with which the water has been in contact. The major cations causing hardness in water include Ca
2+ and Mg
2+, and to a lesser extent, Fe
2+, Sr
2+
and Mn2+
. The widespread abundance of these cations in rock formations often leads to very considerable hardness levels in surface waters. In the sampled waters, hardness values recorded for the wet season period was consistently given as 17.1 mg/L CaCO3 (Table 2), while that for the dry season vary between 6.45 and 16 mg/L CaCO3 (Table 3). Following the classification of water hardness in Sawyer et al. (2003), the sampled waters qualifies as soft waters, since it displays hardness values less than 75 mg/L CaCO3. Indication is that Hardness does not pose a problem for the suitability of the water of Orem and Environs for potable purposes. Salinity and Total Dissolved Solids (TDS): In agreement with the level of electrical conductivity (EC), salinity and total dissolved solids in the studied waters are very low. However, unlike the electrical conductivity (EC) and total dissolved solids, salinity does not show significant spatial or temporal variations (Table 4). The mean salinity measured during the wet season was 0.04±0.04 mg/L, where the minimum value was 0.00 mg/L and the maximum was 0.10 mg/L (Table 2) while that for the dry season was 0.05±0.03 mg/L, where the minimum value was 0.00 mg/L and the maximum was 0.10 mg/L (Table 3). Similarly, Similarly, TDS vary between 9.83 and 15.70 mg/L (Table 2) during the wet season, and between 10.30 and 38.64 mg/L (Table 3) during the wet season.(Table 3). All the samples considered displayed values that qualifies the water in the fresh water class (Gorrell, 1953; Heath 1984; Ephraim and Ajayi 2015). Indication is that, the waters are not only of low mineralization, but suitable for drinking and irrigation purposes since the reported TDS content has no adverse effects on crop production (Pascod et al., 2007). The relatively higher values recorded for the dry season samples are possible caused by greater water evaporation often encountered during the dry season. Dissolved Oxygen (DO): Dissolved Oxygen is vital to aquatic life, as it is needed to keep organisms
alive. Depletion of DO could suppress respiration, cause death of fish, depress feeding or affect embryonic development and hatching success due to oxygen starvation (Clark, 1996) which could lead to reproductive failure, stock-recruitment failure at the population level or changes in the composition, abundance and diversity of species in the community. Like total alkalinity, dissolved oxygen content of the sampled waters does not show significant temporal variations (Table 4), rather it appear to display inversed variation relationship with water temperature (Tables 2&3). The displayed inversed relationship with temperature exists because solubility of O2and other gaseous matter often increases at lower temperature and decreases at high temperature (Akpan et al., 2015; Elueze et al., 2001; Silva and Schiemer, 2000; Van Ginkel, 2001; Mustapha and Omotosho, 2005). The mean dissolved oxygen concentration measured during the wet season was 9.88±1.96 mg/L, with a minimum value of8.00 mg/l and maximum value of13.00 mg/L (Table 2); while that for the dry season was 7.76±2.08 mg/L, where the minimum value was 3.09 mg/l and the maximum was 9.88 mg/L (Table 3). Apart from the low DO value recorded at “L8” during the dry season sampling the documented values are reasonable, as it remained well above the minimum level (>5ppm; Banerjea,1967) required to support good fish production, throughout the year. Moreover the values are frequently below the 14 mg/L limit set by the Nigerian standard for drinking water quality (NSDWQ, 2008).The observed low DO values possibly reflects early indication of undesirable conditions in the physical, chemical and biochemical factors within the water bodies. Biological Oxygen Demand (BOD):Biological Oxygen Demand (BOD), which is a measure of the biological activities in a water body, gives an indication of the organic load of water bodies, especially those receiving organic effluent. BOD values for the investigated waters ranged from 3.60 to 7.66 mg/L, with mean value of 5.37 mg/L for the wet season (Table 1), and from 0.33 to 7.35 mg/L, with mean value of 6.14 mg/L for the wet season (Table 2). Very low BOD of 0.33 mg/L was observed during the dry season sampling at location “L8”. Ephraim and Ajayi (2015) interpreted low BOD values as an indication of limited levels of organic matter decomposition requiring oxygen from the water. Major Dissolved Ions A cursory appraisal of the major dissolved ion data presented in Tables 2– 4 and Figure 3reveal that, apart from SO4
2-, the levels of all other dissolved
components + in the surface waters of the study area
show significant (p>0.05) temporal variations. The concentration of Ca
2+ and Mg
2 ranged from6.80 – 7.60
mg/L and 9.50 – 10.30 mg/L respectively for the wet season (Table 2). Those of the dry season ranged between 2.33 – 6.55 mg/L and 4.12 – 9.46 mg/L respectively (Table 3). Thus, Mg
2+ levels is consistently
higher that those of Ca2+,
which points to a possible geogenic source for these ions. This assertion is supported by the copious occurrence of rocks rich in feromagnesium minerals (and rich in Fe and Mg) like dolerite, charnockites, pyroxenites, etc within the study region.
PHYSICOCHEMICAL AND BACTERIOLOGICAL PARAMETERS OF SURFACE WATER QUALITY 19

FIG 3: Graphical representation showing the magnitudeand extent of temporal variation of major dissolved ions in the surface waters of Orem and environs, southeastern Nigeria
Na
+ and K
+ contents varied from0.62 – 1.20 mg/L and
0.95 – 2.03 mg/L respectively for the wet season, and from 0.62 – 1.22 mg/L and 0.96 – 4.62/L respectivelyin the dry season. The Na and K in the study area appear to be derived mostly from the weathering of hard roas suggested by the consistently higher K contents, which points to derivations through breakdown of rocks rich aluminosilicate minerals (e.g. feldspar, mica, etc), which also occur within the study region. In addition, an insignificant concentration of sodium may be sourced through cation exchange reaction and human activities, while potassium can also be sourced from fertilizers and manures from the surrounding agricultural fields. In terms of mean abundance, the concentration of cations in the investigated waters is in the order MgK
+> Na
+ for both seasons.
The anionic trend for mean levels in the sampled water: NO3
->Cl
-> SO4
2- for the wet season, and NO
for the dry season. In both seasons, NO3- displayed the
highest levels. The variation in nitrate content of the water ranged from 2.60 to 5.60 mg/L in the wet season, and from 3.50 mg/L to 16.20 mg/L in the wet season. The highestnitrate content (ie 16.20 mg/L) was obtained in the dry season in location “L6”, and the minimum (ie 2.60 mg/L) was obtained in the wet season in location “L8”. Most of the dry season samples had elevated nitrate levels that exceeded the 10 mg/L permissible limits of the Nigerian standard for drinking water quality (NSDWQ, 2008), thereby indicating that the water is polluted in NONitrate is essential for growth, thus high concentration of nitrate indicates potentials or excessive weed or algae growth which impaired water quality. However, nitrate itself is not a direct toxicant to human, but constituthealth hazard through conversion to nitrite, which reacts with blood haemoglobin to cause methemoglobinemia in infants less than 6 months old. The source of nitrate in most surface water is often linked to geological, agricultural and anthropogenic factors. However, in the absence of nitrogenrocks, the enrichment of nitrate in the study area can be attributed to fertilizer usage, seasonal influence of biomass burning, harmattan dust during the dry season
0
2
4
6
8
10
Ca2+ Mg2+
20
FIG 3: Graphical representation showing the magnitudeand extent of temporal variation of major dissolved ions in the surface waters of Orem and environs, southeastern Nigeria
1.20 mg/L and 2.03 mg/L respectively for the wet season, and
4.62/L respectivelyin the dry season. The Na and K in the study area appear to be derived mostly from the weathering of hard rocks, as suggested by the consistently higher K contents, which points to derivations through breakdown of rocks rich aluminosilicate minerals (e.g. feldspar, mica, etc), which also occur within the study region. In addition, an
of sodium may be sourced through cation exchange reaction and human activities, while potassium can also be sourced from fertilizers and manures from the surrounding agricultural fields. In terms of mean abundance, the concentration of cations
tigated waters is in the order Mg2+
> Ca2+
>
The anionic trend for mean levels in the sampled water: for the wet season, and NO3
->SO4
2->Cl
-
displayed the
e variation in nitrate content of the water ranged from 2.60 to 5.60 mg/L in the wet season, and from 3.50 mg/L to 16.20 mg/L in the wet season. The highestnitrate content (ie 16.20 mg/L) was obtained in the dry season
2.60 mg/L) was obtained in the wet season in location “L8”. Most of the dry season samples had elevated nitrate levels that exceeded the 10 mg/L permissible limits of the Nigerian standard for drinking water quality (NSDWQ, 2008),
the water is polluted in NO3. Nitrate is essential for growth, thus high concentration of nitrate indicates potentials or excessive weed or algae growth which impaired water quality. However, nitrate itself is not a direct toxicant to human, but constitutes a health hazard through conversion to nitrite, which reacts with blood haemoglobin to cause methemoglobinemia in
The source of nitrate in most surface water is often linked to geological, agricultural and anthropogenic actors. However, in the absence of nitrogen-bearing
rocks, the enrichment of nitrate in the study area can be attributed to fertilizer usage, seasonal influence of biomass burning, harmattan dust during the dry season
1991; Vomocil, 1987), and leachates from human and animal sewages, pit latrines and refuse dump located close to streams. The sulphate (SO4
2-) concentration in the waters ranged
between 1.60 – 3.51 mg/L and 3.05 and dry seasons, respectively. The maximum sulphate content 6.80 mg/L) was obtained in the dry season in location “L7”, and the minimum (1.60 mg/L) was obtained in the wet season in location “L2”. Elevated sulphate levels in the waters is mainly due to the influence of agricultural and anthropogenic activities (Ephraim and Ajayi, 2015). Sulphate in surface water is primarily related to the types of minerals occurring in the watershed, acid rain and human factors.In the study area, chloride content ranged between 1.0– 1.30 mg/L and 0.89 – 3.50 mg/L respectively for the wet and dry seasons, respectively.chloride content (ie 3.50 mg/L) was obtained in the dry season atlocation “L6” and, the minimum (ie 1.02 mg/L) was obtained in the wet season atlocation range of chloride is low and typical of tropical freshwaters, even though high levels are not known to affect plant and algae growth. The chlorine in the waters possibly originates from both natural and anthropogenic sources like runoff containifertilizers, animal feeds, irrigation,seawater intrusion in coastal area. Generally, the higher levels of the anions (NO3
-, SO4
season samples, compared to those of the wet season samples is probably due to demonstrate an increase in the discharge of the respective components into the water body with time. Nutrients and Heavy Metals The parameters considered as nutrients and heavy metals in the present study include, POFe and Mn. The levels of these parameters in the studied waters are illustrated in Fig. 4, and appropriate discussions follows.
Mg2+ Na+ K+ Cl- SO42- NO3-
Wet Season Dry Season
A.N. UGBAJA AND B. E.EPHRAIM
FIG 3: Graphical representation showing the magnitudeand extent of temporal variation of major dissolved ions in the surface waters of Orem and environs, southeastern Nigeria
1991; Vomocil, 1987), and leachates from human and animal sewages, pit latrines and refuse dump located
) concentration in the waters ranged 3.51 mg/L and 3.05 – 6.80 mg/L for wet
asons, respectively. The maximum sulphate content 6.80 mg/L) was obtained in the dry season in location “L7”, and the minimum (1.60 mg/L) was obtained in the wet season in location “L2”. Elevated sulphate levels in the waters is mainly due to the
of agricultural and anthropogenic activities (Ephraim and Ajayi, 2015). Sulphate in surface water is primarily related to the types of minerals occurring in the watershed, acid rain and human factors. In the study area, chloride content ranged between 1.02
3.50 mg/L respectively for the wet and dry seasons, respectively. The maximum chloride content (ie 3.50 mg/L) was obtained in the dry season atlocation “L6” and, the minimum (ie 1.02 mg/L) was obtained in the wet season atlocation “L2”. The range of chloride is low and typical of tropical freshwaters, even though high levels are not known to affect plant and algae growth. The chlorine in the waters possibly originates from both natural and anthropogenic sources like runoff containing inorganic fertilizers, animal feeds, irrigation, drainage and seawater intrusion in coastal area. Generally, the higher
42-
and Cl-) in the dry
season samples, compared to those of the wet season samples is probably due to dilution effect, and demonstrate an increase in the discharge of the respective components into the water body with time.
The parameters considered as nutrients and heavy metals in the present study include, PO4
2-, NO2, NH4, F,
Fe and Mn. The levels of these parameters in the studied waters are illustrated in Fig. 4, and appropriate
A.N. UGBAJA AND B. E.EPHRAIM
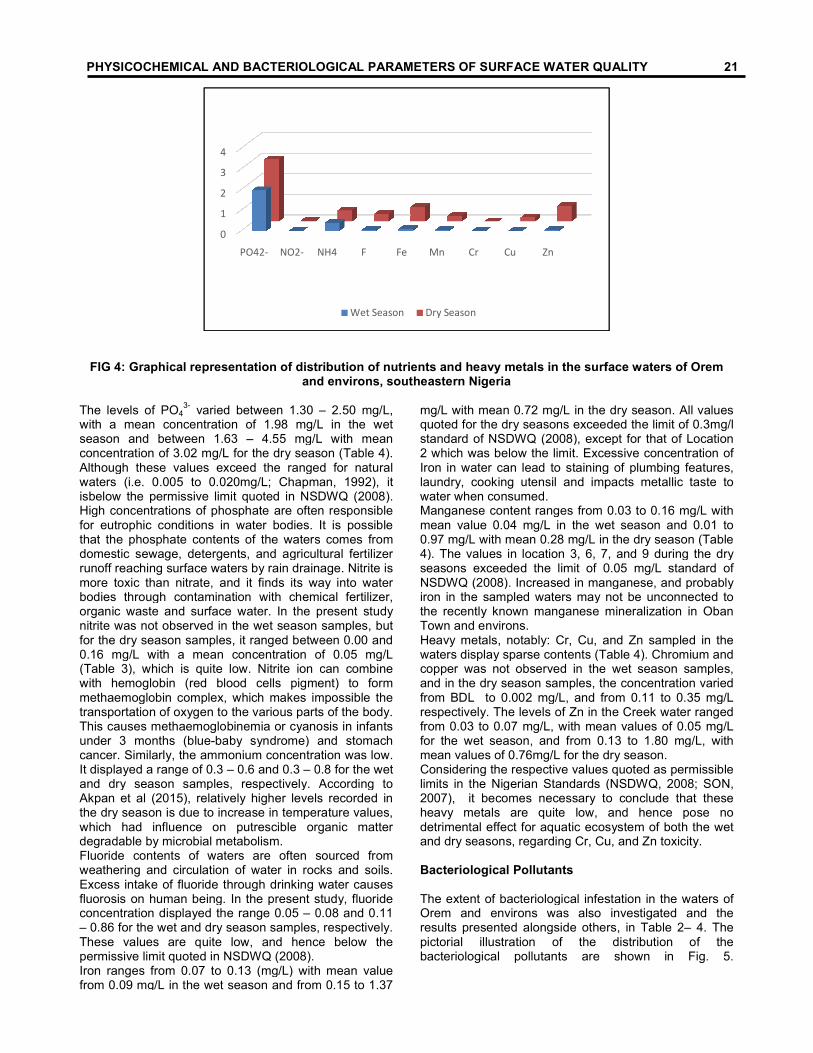
FIG 4: Graphical representation of distribution of nutrients and heavy metals in the surface waters of Orem and environs, southeastern Nigeria
The levels of PO43-
varied between 1.30 –with a mean concentration of 1.98 mg/L in the wet season and between 1.63 – 4.55 mg/L with mean concentration of 3.02 mg/L for the dry season (Table 4). Although these values exceed the ranged for natural waters (i.e. 0.005 to 0.020mg/L; Chapman, 199isbelow the permissive limit quoted in NSDWQ (2008). High concentrations of phosphate are often responsible for eutrophic conditions in water bodies. It is possible that the phosphate contents of the waters comes from domestic sewage, detergents, and agricultural fertilizer runoff reaching surface waters by rain drainage. Nitrite is more toxic than nitrate, and it finds its way into water bodies through contamination with chemical fertilizer, organic waste and surface water. In the present study nitrite was not observed in the wet season samples, but for the dry season samples, it ranged between 0.00 and 0.16 mg/L with a mean concentration of 0.05 mg/L (Table 3), which is quite low. Nitrite ion can combine with hemoglobin (red blood cells pigment) to methaemoglobin complex, which makes impossible the transportation of oxygen to the various parts of the body. This causes methaemoglobinemia or cyanosis in infants under 3 months (blue-baby syndrome) and stomach cancer. Similarly, the ammonium concentration was low. It displayed a range of 0.3 – 0.6 and 0.3 – 0.8 for the wet and dry season samples, respectively. According to Akpan et al (2015), relatively higher levels recorded in the dry season is due to increase in temperature values, which had influence on putrescible organic matter degradable by microbial metabolism. Fluoride contents of waters are often sourced from weathering and circulation of water in rocks and soils. Excess intake of fluoride through drinking water causes fluorosis on human being. In the present study, fluoride concentration displayed the range 0.05 – 0.08 and 0.11 – 0.86 for the wet and dry season samples, respectively. These values are quite low, and hence below the permissive limit quoted in NSDWQ (2008). Iron ranges from 0.07 to 0.13 (mg/L) with mean value from 0.09 mg/L in the wet season and from 0.15 to 1.37
0
1
2
3
4
PO42- NO2- NH4
PHYSICOCHEMICAL AND BACTERIOLOGICAL PARAMETERS OF SURFACE WATER QUALITY
FIG 4: Graphical representation of distribution of nutrients and heavy metals in the surface waters of Orem and environs, southeastern Nigeria
– 2.50 mg/L,
with a mean concentration of 1.98 mg/L in the wet 4.55 mg/L with mean
concentration of 3.02 mg/L for the dry season (Table 4). Although these values exceed the ranged for natural waters (i.e. 0.005 to 0.020mg/L; Chapman, 1992), it isbelow the permissive limit quoted in NSDWQ (2008). High concentrations of phosphate are often responsible for eutrophic conditions in water bodies. It is possible that the phosphate contents of the waters comes from
d agricultural fertilizer runoff reaching surface waters by rain drainage. Nitrite is more toxic than nitrate, and it finds its way into water bodies through contamination with chemical fertilizer, organic waste and surface water. In the present study
ite was not observed in the wet season samples, but for the dry season samples, it ranged between 0.00 and 0.16 mg/L with a mean concentration of 0.05 mg/L (Table 3), which is quite low. Nitrite ion can combine with hemoglobin (red blood cells pigment) to form methaemoglobin complex, which makes impossible the transportation of oxygen to the various parts of the body. This causes methaemoglobinemia or cyanosis in infants
baby syndrome) and stomach ration was low. 0.8 for the wet
and dry season samples, respectively. According to Akpan et al (2015), relatively higher levels recorded in the dry season is due to increase in temperature values,
ence on putrescible organic matter
Fluoride contents of waters are often sourced from weathering and circulation of water in rocks and soils. Excess intake of fluoride through drinking water causes
ing. In the present study, fluoride 0.08 and 0.11
0.86 for the wet and dry season samples, respectively. These values are quite low, and hence below the
07 to 0.13 (mg/L) with mean value
from 0.09 mg/L in the wet season and from 0.15 to 1.37
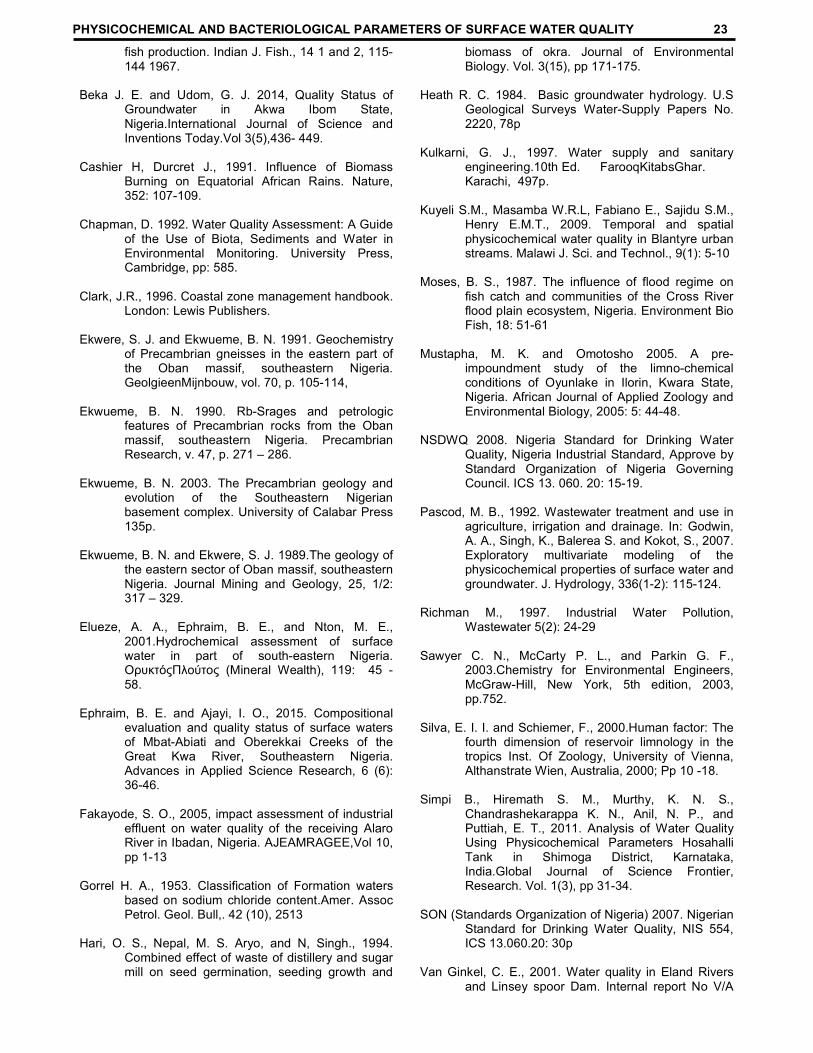
mg/L with mean 0.72 mg/L in the dry season. All values quoted for the dry seasons exceeded the limit of 0.3mg/l standard of NSDWQ (2008), except for that of Location 2 which was below the limit. Excessive concentration of Iron in water can lead to staining of plumbing features, laundry, cooking utensil and impacts metallic taste to water when consumed. Manganese content ranges from 0.03 to 0.16 mg/L with mean value 0.04 mg/L in the wet season and 0.01 to 0.97 mg/L with mean 0.28 mg/L in the dry season (Table 4). The values in location 3, 6, 7, and 9 during the dry seasons exceeded the limit of 0.05 mg/L standard of NSDWQ (2008). Increased in manganese, and probably iron in the sampled waters may not be unconnected to the recently known manganese mineralization in Oban Town and environs. Heavy metals, notably: Cr, Cu, and Zn sampled in the waters display sparse contents (Table 4). Chromium and copper was not observed in the wet season samples, and in the dry season samples, the concentration varied from BDL to 0.002 mg/L, and from 0.11 to 0.35 mg/L respectively. The levels of Zn in the Creek water ranged from 0.03 to 0.07 mg/L, with mean values of 0.05 mg/L for the wet season, and from 0.13 to 1.80 mg/L, with mean values of 0.76mg/L for the dry season.Considering the respective values quoted as permissible limits in the Nigerian Standards (NSDWQ, 2008; SON, 2007), it becomes necessary to conclude that these heavy metals are quite low, and hence pose no detrimental effect for aquatic ecosystem of both the wet and dry seasons, regarding Cr, Cu, and Zn toxicity. Bacteriological Pollutants The extent of bacteriological infestation in the Orem and environs was also investigated and the results presented alongside others, in Table 2pictorial illustration of the distribution of the bacteriological pollutants are shown in Fig. 5.
NH4 F Fe Mn Cr Cu Zn
Wet Season Dry Season
PHYSICOCHEMICAL AND BACTERIOLOGICAL PARAMETERS OF SURFACE WATER QUALITY
FIG 4: Graphical representation of distribution of nutrients and heavy metals in the surface waters of Orem
mg/L with mean 0.72 mg/L in the dry season. All values quoted for the dry seasons exceeded the limit of 0.3mg/l standard of NSDWQ (2008), except for that of Location
which was below the limit. Excessive concentration of Iron in water can lead to staining of plumbing features, laundry, cooking utensil and impacts metallic taste to
Manganese content ranges from 0.03 to 0.16 mg/L with mg/L in the wet season and 0.01 to
0.97 mg/L with mean 0.28 mg/L in the dry season (Table 4). The values in location 3, 6, 7, and 9 during the dry seasons exceeded the limit of 0.05 mg/L standard of NSDWQ (2008). Increased in manganese, and probably
in the sampled waters may not be unconnected to the recently known manganese mineralization in Oban
Heavy metals, notably: Cr, Cu, and Zn sampled in the waters display sparse contents (Table 4). Chromium and
e wet season samples, and in the dry season samples, the concentration varied from BDL to 0.002 mg/L, and from 0.11 to 0.35 mg/L respectively. The levels of Zn in the Creek water ranged from 0.03 to 0.07 mg/L, with mean values of 0.05 mg/L
son, and from 0.13 to 1.80 mg/L, with mean values of 0.76mg/L for the dry season. Considering the respective values quoted as permissible limits in the Nigerian Standards (NSDWQ, 2008; SON, 2007), it becomes necessary to conclude that these
are quite low, and hence pose no detrimental effect for aquatic ecosystem of both the wet and dry seasons, regarding Cr, Cu, and Zn toxicity.
The extent of bacteriological infestation in the waters of Orem and environs was also investigated and the results presented alongside others, in Table 2– 4. The pictorial illustration of the distribution of the bacteriological pollutants are shown in Fig. 5.
PHYSICOCHEMICAL AND BACTERIOLOGICAL PARAMETERS OF SURFACE WATER QUALITY 21

FIG 5: Graphical representation of distribution of bacteriological pollutants in the surface waters of Orem and
environs, southeastern Nigeria
From the results (Tables 2– 4), the respectiveFecal coliform count (FCC), total coliform count (TCC) and total heterotrophic count (THC) during the wet season ranges as follows: (14-23/100ml, 25and 55-96/100ml), while that of the respective values of Fecal coliform count (FCC), total coliform count (TCC) and total heterotrophic count (THC) during the dry season ranges as follows: (31-250/100ml, 53and 96-250/100ml). These result, do not only exceed the prescribed respective limits by the regulatory Authority, but shows an alarmingly high bacteriological inputs into the surface waters of Orem and environs, which is a potential threat to human population in the vicinity that consume the water. Richman (1997) observed that the presence of coliforms group in water samples genesuggests that a certain selection of the water may have been contaminated with faeces of either human or animal origin. In the present study, the bacteriological contamination possibly reflects the indiscriminate human defecation and poor waste disposal system prevalent in the area. Conclusion Thephysico-chemical parameters of surface water from Orem and environs are generally within acceptable standards of NSDWQ during the wet season. On the other hand, parameters such as Turbidity, TSS, Fe, Mn, NO3 and NO2 in majority of the streams fall short of the allowable limit of NSDWQ in the dry season samples. Also, results of bacteriological assessments during the wet and dry season appear very high, and attributable to indiscriminate, uncontrolled discharge of untreated domestic sewage into the river. The presence of coliform bacteria in any water body renders the swatersunfit for human consumption (WHO, 1999). Therefore, good management measures should be employed to make sure that the river regains its fitness for the support of aquatic life and also for other domestic uses. The villagers should be enlightened through public awareness programmes on the effects of polluted water on their health and the health of their children. Maintaining adequate in-stream flow is critical to protecting water quality and preserving aquatic habitat. Uses of best management practices can also help
0
50
100
150
200
250
FCC
22
FIG 5: Graphical representation of distribution of bacteriological pollutants in the surface waters of Orem and environs, southeastern Nigeria
4), the respective values of
Fecal coliform count (FCC), total coliform count (TCC) and total heterotrophic count (THC) during the wet
23/100ml, 25-56/100ml 96/100ml), while that of the respective values of
tal coliform count (TCC) and total heterotrophic count (THC) during the dry
250/100ml, 53-250/100ml 250/100ml). These result, do not only exceed the
prescribed respective limits by the regulatory Authority, alarmingly high bacteriological inputs into
the surface waters of Orem and environs, which is a potential threat to human population in the vicinity that consume the water. Richman (1997) observed that the presence of coliforms group in water samples generally suggests that a certain selection of the water may have been contaminated with faeces of either human or animal origin. In the present study, the bacteriological contamination possibly reflects the indiscriminate human
sal system prevalent in
chemical parameters of surface water from Orem and environs are generally within acceptable standards of NSDWQ during the wet season. On the other hand, parameters such as Turbidity, TSS, Fe, Mn,
in majority of the streams fall short of the allowable limit of NSDWQ in the dry season samples.
results of bacteriological assessments during the wet and dry season appear very high, and attributable to indiscriminate, uncontrolled discharge of untreated domestic sewage into the river. The presence of coliform bacteria in any water body renders the surface watersunfit for human consumption (WHO, 1999). Therefore, good management measures should be employed to make sure that the river regains its fitness for the support of aquatic life and also for other domestic
ed through public awareness programmes on the effects of polluted water on their health and the health of their children.
stream flow is critical to protecting water quality and preserving aquatic habitat.
actices can also help
villages, utilities and landowners avoid harm to aquatic systems. This includes cautious use of pesticides and herbicides. Farmers should be taught how to apply the right amount of the fertilizers at the right moment, and know that it would go directly into their crops and not into the river. REFERENCES Adejuwon J. O., and Adelakun M. A., 2012, Physiochemical and bacteriological analysis of surface water in Ewekoro Local Government Area of Ogun State, Nigeria: Case study of Lala, Yobo and Agodo Rivers, International Journal of Water Resources and Environmental Engineering, 4(3), 66-72 Adeyeye EI 1994. Determination of heavy metals in IllishaAfricana, associated Water, Soil Sediments from some fish ponds. Int. J. Environ. Stud. 45: 231-240. AddoM.A., Affum H.A., Botwe B.O., Gbadago J.K., Acquah S.A., Senu J. K., A., Adu P.S. and Mumuni I.I. 2011.Assessment of Water Quality and Heavy Metal Levels in Water and Bottom Sediment Samples from Mokwé Lagoon, Accra, Ghana. Research Journal of Environmental and Earth Sciences 4(2): 119-130 Akpan M. M., Uwem G. U., Ekpo, E. A. on the Physico-chemical Parameters of the fresh water segment of the Lower Cross River System, South Eastern Nigeria. New York Science Journal: 8(7):60-65]. Asaolu S. S., Ipinmoroti K. O., Adeeyinwo C. E. and Olaofe O., 1997.“Interrelationship of Heavy Metal Contamination in Water, Sediment a Fish of Ondo State Coastal Wa Journal of Science, Vol. 1, pp. 55 Banerjea, S.M. 1967: Water quality and soil condition of fish ponds in some states of India in relation to
TCC THC
Wet Season Dry Season
A.N. UGBAJA AND B. E.
FIG 5: Graphical representation of distribution of bacteriological pollutants in the surface waters of Orem and
villages, utilities and landowners avoid harm to aquatic systems. This includes cautious use of pesticides and herbicides. Farmers should be taught how to apply the right amount of the fertilizers at the right moment, and
would go directly into their crops and not
Adejuwon J. O., and Adelakun M. A., 2012, Physiochemical and bacteriological analysis of surface water in Ewekoro Local Government Area of Ogun State, Nigeria: Case study of Lala, Yobo and Agodo Rivers, International Journal of Water Resources and Environmental
. Determination of heavy metals in associated Water, Soil
Sediments from some fish ponds. Int. J. 240.
AddoM.A., Affum H.A., Botwe B.O., Gbadago J.K., K., Adom T., Coleman
Adu P.S. and Mumuni I.I. 2011.Assessment of Water Quality and Heavy Metal Levels in
Sediment Samples from Mokwé Lagoon, Accra, Ghana. Research Journal of Environmental and Earth Sciences
Akpan M. M., Uwem G. U., Ekpo, E. A., 2015. Studies chemical Parameters of the
fresh water segment of the Lower Cross River System, South Eastern Nigeria. New York
65].
Asaolu S. S., Ipinmoroti K. O., Adeeyinwo C. E. and .“Interrelationship of Heavy
Metal Contamination in Water, Sediment and Fish of Ondo State Coastal Wa-ters,” African.
, Vol. 1, pp. 55-60.
Banerjea, S.M. 1967: Water quality and soil condition of fish ponds in some states of India in relation to
A.N. UGBAJA AND B. E. EPHRAIM
fish production. Indian J. Fish., 14 1 and 2, 115- 144 1967. Beka J. E. and Udom, G. J. 2014, Quality Status of Groundwater in Akwa Ibom State, Nigeria.International Journal of Science and Inventions Today.Vol 3(5),436- 449. Cashier H, Durcret J., 1991. Influence of Biomass Burning on Equatorial African Rains. Nature, 352: 107-109. Chapman, D. 1992. Water Quality Assessment: A Guide of the Use of Biota, Sediments and Water in Environmental Monitoring. University Press, Cambridge, pp: 585. Clark, J.R., 1996. Coastal zone management handbook. London: Lewis Publishers. Ekwere, S. J. and Ekwueme, B. N. 1991. Geochemistry of Precambrian gneisses in the eastern part of the Oban massif, southeastern Nigeria. GeolgieenMijnbouw, vol. 70, p. 105-114, Ekwueme, B. N. 1990. Rb-Srages and petrologic features of Precambrian rocks from the Oban massif, southeastern Nigeria. Precambrian Research, v. 47, p. 271 – 286. Ekwueme, B. N. 2003. The Precambrian geology and evolution of the Southeastern Nigerian basement complex. University of Calabar Press 135p. Ekwueme, B. N. and Ekwere, S. J. 1989.The geology of the eastern sector of Oban massif, southeastern Nigeria. Journal Mining and Geology, 25, 1/2: 317 – 329. Elueze, A. A., Ephraim, B. E., and Nton, M. E., 2001.Hydrochemical assessment of surface water in part of south-eastern Nigeria. ΟρυκτόςΠλούτος (Mineral Wealth), 119: 45 - 58. Ephraim, B. E. and Ajayi, I. O., 2015. Compositional evaluation and quality status of surface waters of Mbat-Abiati and Oberekkai Creeks of the Great Kwa River, Southeastern Nigeria. Advances in Applied Science Research, 6 (6): 36-46. Fakayode, S. O., 2005, impact assessment of industrial effluent on water quality of the receiving Alaro River in Ibadan, Nigeria. AJEAMRAGEE,Vol 10, pp 1-13 Gorrel H. A., 1953. Classification of Formation waters based on sodium chloride content.Amer. Assoc Petrol. Geol. Bull,. 42 (10), 2513 Hari, O. S., Nepal, M. S. Aryo, and N, Singh., 1994. Combined effect of waste of distillery and sugar mill on seed germination, seeding growth and
biomass of okra. Journal of Environmental Biology. Vol. 3(15), pp 171-175. Heath R. C. 1984. Basic groundwater hydrology. U.S Geological Surveys Water-Supply Papers No. 2220, 78p Kulkarni, G. J., 1997. Water supply and sanitary engineering.10th Ed. FarooqKitabsGhar. Karachi, 497p. Kuyeli S.M., Masamba W.R.L, Fabiano E., Sajidu S.M., Henry E.M.T., 2009. Temporal and spatial physicochemical water quality in Blantyre urban streams. Malawi J. Sci. and Technol., 9(1): 5-10 Moses, B. S., 1987. The influence of flood regime on fish catch and communities of the Cross River flood plain ecosystem, Nigeria. Environment Bio Fish, 18: 51-61 Mustapha, M. K. and Omotosho 2005. A pre- impoundment study of the limno-chemical conditions of Oyunlake in Ilorin, Kwara State, Nigeria. African Journal of Applied Zoology and Environmental Biology, 2005: 5: 44-48. NSDWQ 2008. Nigeria Standard for Drinking Water Quality, Nigeria Industrial Standard, Approve by Standard Organization of Nigeria Governing Council. ICS 13. 060. 20: 15-19. Pascod, M. B., 1992. Wastewater treatment and use in agriculture, irrigation and drainage. In: Godwin, A. A., Singh, K., Balerea S. and Kokot, S., 2007. Exploratory multivariate modeling of the physicochemical properties of surface water and groundwater. J. Hydrology, 336(1-2): 115-124. Richman M., 1997. Industrial Water Pollution, Wastewater 5(2): 24-29 Sawyer C. N., McCarty P. L., and Parkin G. F., 2003.Chemistry for Environmental Engineers, McGraw-Hill, New York, 5th edition, 2003, pp.752. Silva, E. I. I. and Schiemer, F., 2000.Human factor: The fourth dimension of reservoir limnology in the tropics Inst. Of Zoology, University of Vienna, Althanstrate Wien, Australia, 2000; Pp 10 -18. Simpi B., Hiremath S. M., Murthy, K. N. S., Chandrashekarappa K. N., Anil, N. P., and Puttiah, E. T., 2011. Analysis of Water Quality Using Physicochemical Parameters Hosahalli Tank in Shimoga District, Karnataka, India.Global Journal of Science Frontier, Research. Vol. 1(3), pp 31-34. SON (Standards Organization of Nigeria) 2007. Nigerian Standard for Drinking Water Quality, NIS 554, ICS 13.060.20: 30p Van Ginkel, C. E., 2001. Water quality in Eland Rivers and Linsey spoor Dam. Internal report No V/A
PHYSICOCHEMICAL AND BACTERIOLOGICAL PARAMETERS OF SURFACE WATER QUALITY 23

220/02201. Institute for water quality studies Dept. of water Affairs and Forestry,; 40Pp. Vomocil JA 1987. Fertlizer - Best Management Practices to Control Nutrients in Processing of the Northwest Non-point Source Pollution
Conference. Olympia, WA: Department of Social and Health Services, State of Washington, LD- 11. World Health Organization (WHO).1999. International standard for drinking water, Vol. 5 pp 3-6.
24 A.N. UGBAJA AND B. E.EPHRAIM