2 L - Johns Hopkins University · Web viewThe signal of cellular phospholipids, cholesterol esters...
210
THE ROLE OF INTRAMYOCELLULAR FATTY ACIDS ON THE ETIOLOGY OF THE INSULIN RESISTANCE OF OBESITY by Chryssanthi Stylianopoulos A dissertation submitted to the Johns Hopkins University in conformity with the requirements for the degree of Doctor of Philosophy Baltimore, Maryland December 2005 Chryssanthi Stylianopoulos 2005 All rights reserved
Transcript of 2 L - Johns Hopkins University · Web viewThe signal of cellular phospholipids, cholesterol esters...

THE ROLE OF INTRAMYOCELLULAR FATTY ACIDS ON THE ETIOLOGY OF THE INSULIN RESISTANCE OF
OBESITY
byChryssanthi Stylianopoulos
A dissertation submitted to the Johns Hopkins University in conformity with the requirements for the degree of Doctor of
Philosophy
Baltimore, MarylandDecember 2005
Chryssanthi Stylianopoulos 2005All rights reserved

ABSTRACT
The intracellular concentration of fatty acids in insulin-sensitive
cells is purported to be a key factor in the development of insulin
resistance. It is hypothesized that the intramyocellular lipid (IMCL)
concentration is correlated with the degree of insulin resistance (IR),
and that a reduction in IMCL will have a more significant effect on IR
than a reduction in body adipose tissue stores. This study assessed the
effects of weight loss through dietary intervention on the IMCL and IR
on a group of obese adults and explored the correlations between IR,
IMCL, body mass index (BMI), serum triglycerides (TG), free fatty
acids, and total body fat of obese adults with an otherwise similar
group of lean individuals.
Baseline tests were performed in lean and obese, including a 2
hour Oral Glucose Tolerance Test (OGTT), body composition
measurement by Dual Energy X-Ray Absorptiometry (DEXA), and
IMCL determination in the tibialis anterioris (TA) and soleus (SOL)
muscles by proton magnetic resonance spectroscopy. The obese
underwent insulin sensitivity assessment by the euglycemic-
hyperinsulinemic clamp. Furthermore, they were instructed to follow
a hypocaloric diet, and were subsequently re-evaluated after a weight
loss of 8-10% of total body weight.
Our results indicate that the obese group had significantly higher
IMCL levels in the SOL muscle than the lean group. In both groups,
ii

there was a significant positive correlation of IR, assessed by
Homeostasis Model Assessment Index (HOMA), with IMCL in the SOL
muscle but not in the TA. IMCL in the SOL was an important predictor
of IR by HOMA, after controlling for age, BMI, and TG. Weight loss
resulted in a significant decrease in IR and IMCL in the TA, but not in
the SOL muscle. There was no correlation between changes in IMCL
in TA myocytes and in IR. Our data documented that reduction in
IMCL stores might play an important role in insulin signaling.
Thesis Advisor: Dr. Benjamin Caballero
Thesis Committee: Drs. Christopher Saudek, Benjamin Caballero,
Alena Horska, Margarita Treuth, Eliseo Guallar
iii

ACKNOWLEDGEMENTS
I would like to thank my advisor, Dr. Benjamin Caballero, who
provided me with the support and guidance for the successful
completion of this project.
I would like to thank Dr. Christopher Saudek for financial
support through the National Research Service Award Research
Training Grant. I would also like to thank the Johns Hopkins
University School of Medicine General Clinical Research Center
(award M01-RR00052, from the National Center for Research
Resources/National Institutes of Health) and the United Stated
Department of Agriculture (award 58-1235-2-060) for financial
support of this project.
I would like to thank Dr. Alena Horska for assistance on the
radiology component of this project. I would also like to thank Terri
Brawner and Kathleen Kahl for technical support with the magnetic
resonance scanner.
I would like to thank Dr. Lawrence Cheskin and Amy Mitchell
for their contribution on the weight management part of this project.
I would like to thank Dr. Todd Brown and Dr. Alice Ryan for
their help with the insulin clamp procedure.
I would also like to thank Mary Missouri, Suzanne Dunphy and
all the nurses and staff at the General Clinical Research Center for
their invaluable collaboration.
iv

Most of all, I would like to thank my family and friends for their
continuous love and support throughout this journey.
v

TABLE OF CONTENTS
1 INTRODUCTION.............................................................................12 LITERATURE REVIEW....................................................................4
2.1 Insulin Actions: Overview.........................................................................42.2 Insulin receptor.............................................................................................52.3 Insulin Resistance, Insulin Insensitivity and Insulin Unresponsiveness.....................................................................................................62.4 Insulin and Leptin........................................................................................72.5 Insulin and Adiponectin.............................................................................92.6 From Insulin Resistance to Type 2 Diabetes...................................102.7 Type 2 Diabetes...........................................................................................102.8 Diagnosis of Diabetes...............................................................................112.9 Genetic Contributions to Type 2 Diabetes.......................................122.10 Obesity-Induced Type 2 Diabetes........................................................14
2.10.1 Receptor Events..................................................................................142.10.2 Post-receptor Events.........................................................................16
2.11 Adipose Tissue Deposition in Human Skeletal Muscle and Liver 16
2.11.1 Quantification Methods....................................................................162.11.2 Proton Magnetic Resonance Spectroscopy.............................172.11.3 Mechanism of Muscle Lipid Accumulation..............................202.11.4 Fatty Liver Disease............................................................................222.11.5 Lipid Accumulation and Insulin Resistance.............................222.11.6 Lipid Accumulation and Exercise................................................282.11.7 Lipid Accumulation and Adiponectin.........................................29
3 HYPOTHESES AND OBJECTIVES.................................................313.1 Hypotheses....................................................................................................313.2 Objectives......................................................................................................31
4 MATERIALS AND METHODS.......................................................334.1 Study Design................................................................................................334.2 Sample Size..................................................................................................344.3 Subjects..........................................................................................................354.4 Baseline Measurements...........................................................................36
4.4.1 Initial Screening.....................................................................................364.4.2 Proton Nuclear Magnetic Resonance Spectroscopy................384.4.3 Euglycemic-Hyperinsulinemic Clamp Procedure......................41
4.5 Dietary Intervention..................................................................................424.6 Follow-up measurements........................................................................444.7 Laboratory Procedures............................................................................454.8 Insulin Sensitivity Assessments............................................................464.9 Proton Magnetic Resonance Spectroscopy Data Processing. . .484.10 Statistical Analysis.....................................................................................50
5 RESULTS.......................................................................................525.1 Subject Characteristics............................................................................525.2 Baseline Comparisons..............................................................................52
vi

5.2.1 Anthropometric Data and Fasting Blood Tests..........................525.2.2 Intracellular Lipid Accumulation.....................................................555.2.3 Euglycemic-Hyperinsulinemic Clamp............................................625.2.4 Correlations..............................................................................................645.2.5 Insulin Resistance Predictors............................................................68
5.3 Follow up.......................................................................................................695.3.1 Anthropometric Data and Fasting Blood Tests..........................705.3.2 Intracellular Lipid Accumulation.....................................................725.3.3 Losses to Follow up...............................................................................765.3.4 Correlations..............................................................................................78
6 DISCUSSION.................................................................................806.1 Intracellular Lipid Concentration is Higher in Obese Compared to Lean..................................................................................................806.2 Intracellular Lipid Levels are Positively Correlated with Insulin Resistance and Glucose Intolerance...............................................806.3 Weight Loss Reduces Intracellular Lipid..........................................826.4 Other Factors Affecting Intramyocellular Lipid Concentration
846.4.1 Muscle Fiber Type.................................................................................846.4.2 Physical Activity......................................................................................866.4.3 Adiponectin...............................................................................................87
6.5 Proton Magnetic Resonance Spectroscopy.....................................886.6 Measures of Insulin Resistance............................................................896.7 Suggestions for Future Research........................................................906.8 Summary and Conclusions.....................................................................92
7 REFERENCES...............................................................................948 CURRICULUM VITAE.................................................................117LIST OF TABLES
1 Study methodology..…………………………………………………………………..
452 Spectral parameters…………………………………………………………………....
493 Baseline anthropometric characteristics of lean and obese…………………………….
534 Baseline plasma lipid levels of lean and obese…………………………………………
545 Baseline plasma hormones levels, insulin sensitivity and glucose metabolism indices
of lean and obese……………………………………………………………………...
55
vii

6 Baseline IMCL, EMCL, and IHL by proton magnetic resonance spectroscopy of
lean and obese………………………………………………………………………...
567
Baseline euglycemic-hyperinsulinemic clamp data of obese subjects…………………..
638
Anthropometric characteristics of obese subjects before and after weight loss………...
709
Plasma lipid levels of obese subjects before and after weight loss……………………..
7110 Plasma hormones levels, insulin sensitivity and glucose metabolism of obese subjects
before and after weight loss…………………………………………………………...
7211
IMCL, EMCL, and IHL by proton magnetic resonance spectroscopy of obese
subjects before and after weight loss...……………...…………………………………
7312
Anthropometric characteristics of obese subjects that completed the weight loss
compared to those who dropped out………………………………………………….
7613
Plasma metabolite concentrations of obese subjects that completed the weight loss
compared to those who dropped out………………………………………………….
7714
IMCL, EMCL, and IHL by proton magnetic resonance spectroscopy of obese subjects
that completed the weight loss compared to those who dropped out…………………
78
viii

LIST OF FIGURES
1 Mobilization of GLUT4 from intracellular stores to cell surface………………………..
62 Types of insulin resistance……………………………………………………………...
73 Proton spectrum of human soleus muscle…………………………………………….
184 Proton spectrum of human liver………………………………………………………205 Mechanism of insulin resistance due to increased FFA concentration………………...
216
Diagram of study design………………………………………………………………
337 Sagittal magnetic resonance images of the calf muscle…….…………………………...
398 Axial magnetic resonance image of the calf of a 34-year-old male volunteer…………..
409 Axial, coronal, and sagittal magnetic resonance images of the liver……………………
4110 Axial magnetic resonance image and TA proton spectra of the right calf muscle of
a 30-year-old female lean subject……………………………………………………...
5711
Axial magnetic resonance image and SOL proton spectra of the right calf muscle of
a 43-year-old male lean subject………………………………………………………...
5812
Axial magnetic resonance image and TA proton spectra of the right calf muscle of
a 39-year-old female obese subject…………………………………………………….
59
ix

13 Axial magnetic resonance image and SOL proton spectra of the right
calf muscle ofa 46-year-old male obese
subject………………………………………………….........6014
Magnetic resonance images and corresponding proton spectrum of the liver of a
26-year-old female lean subject………………………………………………………..
6115
Magnetic resonance liver images and corresponding proton spectrum of the liver of a
35-year-old female obese subject……………………………………………………....
6116
Plasma glucose levels and infusion rate during the baseline euglycemic-hyperinsulinemic
clamp of obese subjects……………………………………………………………….
6317
Correlation of HOMA versus IMCL in the SOL muscle for lean and obese….……….
6518
Correlation of HOMA versus IMCL in the TA muscle for lean and obese...….……….
6519
Correlation of lnAUCG versus IMCL in the SOL muscle for lean and obese…………
6620
Correlation of lnAUCG versus IMCL in the TA muscle for lean and obese…..………
6721
Correlation of 2-hour post-OGTT PG versus IMCL in the SOL muscle for lean
and obese………………………………………...………………………..…..………
67
x

22 Correlation of 2-hour post-OGTT PG versus IMCL in the TA muscle
for leanand obese……………………………….……..…………………………..…..
………68
23 Axial magnetic resonance images and SOL proton spectra of the
right calf muscle of a 42-year-old female obese subject before and after weight
loss……………………74
24 Axial magnetic resonance images and TA proton spectra of the right
calf muscleof a 39-year-old female obese subject before and after weight
loss……………………75
xi

1 INTRODUCTION
In the past decade, obesity has been on the rise in the United
States and has reached epidemic proportions. Recent results from the
National Health and Nutrition Examination Survey (NHANES) in
1999-2002 indicate that 65 percent of U.S. adults are either
overweight or obese, defined as having a body mass index
(BMI=kg/m2) of 25 or more (CDC, 2005). The prevalence of
overweight (defined as BMI 25.0 – 29.9 kg/m2) among U.S. adults age
20 – 74 years, according to the Center for Disease Control (CDC,
2005) has increased from 56 percent in 1988-1994 to 64 percent of
the population in 1999-2002 (based on NHANES data). In the same
age group, obesity (defined as BMI greater than or equal to 30.0
kg/m2) has increased from approximately 23 percent in 1988-1994 to
30 percent in 1999-2002 (CDC, 2005). In the state of Maryland,
obesity in adults 20 – 74 years increased from 12.0% in 1990 to 19.4%
in 2002, an astonishing 61.7% rise (CDC, 2005).
Obesity is a serious public health problem associated with high
rates of morbidity and mortality (Khan et al, 1999; James et al, 2001;
Popkin & Doak, 1998). It is an important risk factor for 4 out of 8
leading causes of death in the U.S.: coronary heart disease (CHD),
cancer, stroke and diabetes. The costs of obesity and chronic diseases
are enormous. The Centers for Disease Control and Prevention
1

estimated that in 2002 obesity among U.S. adults cost approximately
$100 billion in medical expenditures (CDC, 2005).
Obesity is the single most important risk factor for the
development of type 2 diabetes mellitus. As a result, the high rates of
obesity are increasing the prevalence of type 2 diabetes (Seidell,
2000). Diabetes is the 6th leading cause of death in the United States
in the year 2000, contributing to over 200,000 deaths annually (CDC,
2005). It is estimated that 18.2 million Americans have diabetes,
among which 13 million are diagnosed, and an estimated 5.2 million
remain undiagnosed (CDC, 2005). The costs of diabetes amount to
$132 billion a year and the average health care cost of a diabetic
person is almost four times higher than that of a non-diabetic person
(CDC, 2005).
More than 80% of people who suffer from type 2 diabetes are
obese and the majority of these individuals are insulin resistant.
Although the association between excess adiposity and insulin
resistance is most likely causal, a thorough biochemical explanation of
the role of free fatty acids and intracellular lipid in the pathogenesis
of insulin resistance and type 2 diabetes has not been elucidated.
The deposition of triglycerides (TG), for the breakdown into fatty
acids (FAs) and the production of energy, has been thought to occur
only in adipose tissue, but recently FAs in the skeletal muscle have
been established to be important energy sources (Sinha et al, 2002;
2

Krssak et al, 1999). The overaccumulation of various lipids in the
skeletal muscle has been linked with an increase in insulin resistance
in obese and lean adults, as well as in nondiabetic offspring of type 2
diabetic subjects (Jacob et al, 1999; Krssak et al, 1999; Boden et al,
2001; Ashley et al, 2002; Kelley et al, 2002; Sinha et al, 2002).
Previous studies that evaluated increased skeletal fat
concentration were cross-sectional. This prospective intervention
study was developed to investigate the role of intramyocellular lipid
(IMCL) accumulation in skeletal muscle in the development of the
insulin resistance of obesity. It is hypothesized that insulin resistance
in obesity is primarily dependent on IMCL concentration and that a
reduction in IMCL will have more significant effects on insulin
sensitivity than a reduction in body adipose tissue stores.
Following this introductory chapter, a literature review on the
etiology of the insulin resistance associated with obesity is presented
in Chapter 2. This review focuses on insulin action and insulin
resistance, as well as skeletal muscle and liver fatty acid
accumulation. Chapter 3 provides a description of the hypotheses and
objectives of this study. Chapter 4 contains the research design and
methodology used in this study. Chapter 5 outlines the results
obtained, including a description of the study groups and analytical
test outcomes. Chapter 6 contains the discussion of the main findings,
3

including the strengths and limitations of the study and suggestions
for future research.
4

2 LITERATURE REVIEW
2.1 Insulin Actions: Overview
Insulin plays a vital role in human metabolism. It mainly
regulates carbohydrate, lipid, and amino acid metabolism. When a
meal is ingested, glucose is liberated from hydrolysis of dietary
carbohydrate in the small intestine and then it is absorbed into the
blood. Increased glucose concentrations stimulate the production and
secretion of insulin by the β cells of the pancreas. Insulin promotes
the transfer of glucose into the target cells (i.e. skeletal muscle, liver
and adipose tissue) for utilization as energy and for storage in the
form of glycogen, in the liver, primarily.
Glucose enters the target tissues by facilitated diffusion through
a family of transporters known as glucose transporters. There are five
different isoforms of glucose transporters that have been isolated and
characterized, commonly known as GLUT1 – GLUT5. GLUT4 is mainly
present in skeletal and cardiac muscle and brown adipose tissue. It
differs significantly from the other isoforms as it can be stimulated by
insulin. The other types of glucose transporters do not require
insulin’s action for glucose transport. GLUT1 and GLUT3 are
responsible for glucose transport in most body tissues and are found
in the brain, kidney, placenta, red blood cells and fetal tissue. GLUT2
5

exists mainly in the liver and pancreas and GLUT5 is responsible for
glucose and fructose transport in the small intestine.
Insulin also stimulates the liver to form glycogen. When glucose
is plentiful, insulin activates the enzyme hexokinase to phosphorylate
glucose and aid in retaining glucose within the cell. Furthermore,
insulin activates phosphofructokinase and glycogen synthase, among
other enzymes, which are directly involved in glycogen synthesis.
Consequently, insulin action results in a decrease of glucose
concentration in the blood; when glucose concentration decreases,
insulin secretion is also terminated. When insulin is absent, glycogen
synthesis stops and glycogen breakdown is activated. Glucagon,
another hormone secreted by the pancreas, is then activated and
stimulates the breakdown of glycogen, counteracting the action of
insulin.
When the liver is saturated with glycogen to a level higher than
approximately 5% of its mass, glycogen synthesis is inhibited. Insulin
then promotes the synthesis of fatty acids in the liver, when there is
additional glucose uptake. These fatty acids are exported from the
liver as lipoproteins and are shuttled through the blood to other
tissues for the synthesis of triglycerides.
Insulin also suppresses the breakdown of fat in adipose tissue
and prevents triglyceride hydrolysis and the subsequent release of
fatty acids. Insulin promotes glucose transport in adipose tissue for
6

the synthesis of glycerol and triglycerides in adipose tissue.
Therefore, insulin stimulates the accumulation of triglycerides in
adipose tissue and promotes the use of carbohydrates for energy
instead of fatty acids.
Insulin participates in amino acid transport in the cells and
storage of proteins. Insulin also promotes protein synthesis in the
ribosomes. As a result, in the presence of insulin, blood amino acid
concentration is decreased and protein breakdown is inhibited. When
insulin is absent, protein catabolism is induced. Consequently, insulin
is vital for growth.
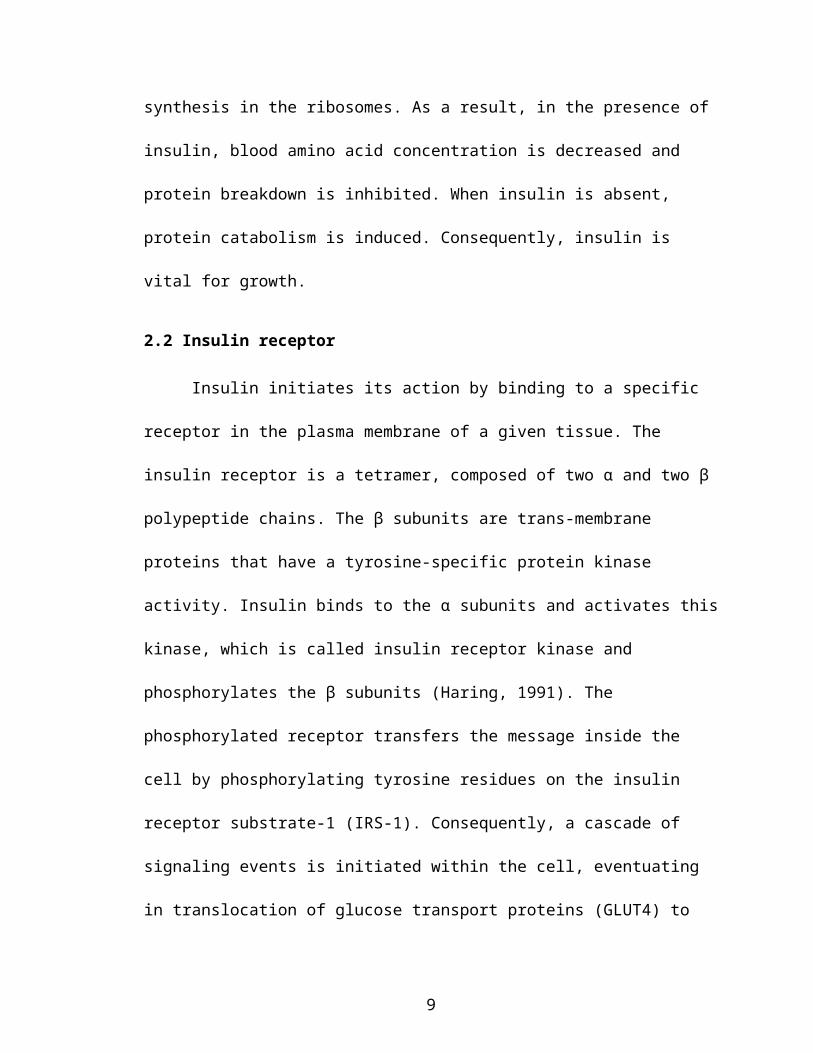
2.2 Insulin receptor
Insulin initiates its action by binding to a specific receptor in the
plasma membrane of a given tissue. The insulin receptor is a
tetramer, composed of two α and two β polypeptide chains. The β
subunits are trans-membrane proteins that have a tyrosine-specific
protein kinase activity. Insulin binds to the α subunits and activates
this kinase, which is called insulin receptor kinase and phosphorylates
the β subunits (Haring, 1991). The phosphorylated receptor transfers
the message inside the cell by phosphorylating tyrosine residues on
the insulin receptor substrate-1 (IRS-1). Consequently, a cascade of
signaling events is initiated within the cell, eventuating in
translocation of glucose transport proteins (GLUT4) to the cell surface
and increased glucose uptake into the cells (Figure 1).
7

Figure 1: Mobilization of GLUT4 from intracellular stores to cell
surface
Source: Pietropaolo & Le Roith, 2001
2.3 Insulin Resistance, Insulin Insensitivity and Insulin
Unresponsiveness
Kahn (1978) defines insulin resistance as a state when normal
insulin concentrations result in “a less than normal biological
response.” Kahn postulates that insulin resistance consists of insulin
insensitivity and insulin unresponsiveness. Insulin insensitivity is a
state when greater than normal insulin concentrations are needed to
elicit a normal biological response and the dose-response curve of
insulin is shifted to the right. This effect is consistent with an insulin
receptor defect (Molnar, 1990). Insulin unresponsiveness is a state
when the maximal insulin response is decreased, but the dose-
8

response curve of insulin remains the same. This effect is consistent
with a post-receptor defect, which would not permit a maximal
biological response, even at high insulin levels (Molnar, 1990).
Furthermore, a combination of insulin insensitivity and
unresponsiveness can exist, which is the existence of receptor and
post-receptor defects (Figure 2).
Figure 2: Types of insulin resistance
Adapted from Kahn, 1978.
2.4 Insulin and Leptin
Leptin is a hormone synthesized by adipose tissue that regulates
body weight, food intake, energy expenditure and endocrine functions
(Steppan & Lazar, 2002; Koopmans et al, 1998). Leptin and its
function in animal and human physiology have been studied
9

extensively. Increasing leptin levels lead to fatty acid oxidation and
reduction in adipose tissue mass, whereas leptin deficiency is
associated with an increase in fat deposition (Friedman & Halaas,
1998). The leptin receptor (db or Ob-R), which has been isolated from
mice, is essential for signal transduction and for leptin’s weight-
reducing effects (Friedman & Halaas, 1998).
Leptin concentration can be increased in obese individuals,
suggesting a resistance to its effect (Haffner et al, 1997), but there
are significant differences in leptin levels at each degree of adiposity,
suggesting that environmental and genetic factors may regulate leptin
concentrations. However, 5-10% of obese individuals have low leptin
levels, an indication of a decreased rate of leptin production
(Friedman & Halaas, 1998). Therefore, the pathogenesis of some
forms of obesity is more likely to be a result of differences in leptin
secretion and/or sensitivity (Friedman & Halaas, 1998).
In animal models, leptin levels have been associated with insulin
action. Leptin-deficient ob/ob mice and leptin receptor-deficient db/db
mice are characterized by extreme insulin resistance, which in the
ob/ob mice is reversible by leptin infusion (Steppan & Lazar, 2002).
Leptin administration has been shown to enhance insulin sensitivity
and glucose disposal rate in ob/ob mice (Steppan & Lazar, 2002). A
constant insulin infusion in rats resulted in a progressive increase in
10
leptin levels and in a parallel decrease in food consumption
(Koopmans el al, 1998).
Conflicting results have been published on the effect of insulin
on leptin in human subjects. Several studies have failed to find a
correlation between insulin concentrations and circulating leptin
levels (Caprio et al, 1996; Schwartz et al, 1997). Increasing evidence
suggests that insulin-mediated glucose uptake, rather than insulin
itself, regulates circulating leptin concentration (Fruehwald-Schultes
et al, 2002; Wellhoener et al, 2000). Numerous studies have found an
association between leptin concentration and plasma insulin response
(Abbasi et al, 2000; Albala et al, 2000; Schmitz et al, 1997). It has
been postulated that leptin resistance may be a result of insulin
resistance from a study in lean, normoglycemic men (Haffner et al,
1997). Fruehwald-Schultes et al (2002) showed that experimentally-
induced insulin resistance in normal-weight men diminished the
stimulatory effect of insulin on leptin.
2.5 Insulin and Adiponectin
Adiponectin is a hormone that is synthesized in the adipose tissue
(Scherer et al, 1995; Hu et al, 1996; Maeda et al, 1996; Nakano et al,
1996). Adiponectin is an abundant plasma protein, ranging in
concentration from 5 – 30 µg/ml, which is approximately three times
higher than that of the majority of hormones (Gil-Campos et al, 2004).
Its physiological role has not been fully clarified. Several studies
11

suggest that it may modulate insulin action, and that it has anti-
inflammatory and anti-atherogenic properties (Gil-Campos et al,
2004). It has been postulated that adiponectin increases insulin
sensitivity by increasing muscle glucose uptake and fatty acid
oxidation (Gil-Campos et al, 2004).
In animal models, adiponectin has been associated with insulin
sensitivity and lipid oxidation in the muscle. In normal and db/db
mice, adiponectin administration resulted in lowering serum glucose
levels (Berg et al, 2001). Furthermore, adiponectin administration
improved obesity-induced insulin resistance in ob/ob mice (Yamauchi
et al, 2001).
It has been shown that transcription of the adiponectin gene is
decreased in diabetic and obese individuals (Statnick et al, 2000). It
has also been demonstrated that weight loss results in increased
adiponectin concentrations in obese and diabetic individuals (Hotta et
al, 2000; Yang et al, 2001). This increase in adiponectin levels has
been correlated with improvement in insulin resistance after weight
loss (Vendrell et al, 2004). High adiponectin values have been shown
to predict increased insulin sensitivity, independent of body fat mass
in both men and women (Tschritter et al, 2003).
2.6 From Insulin Resistance to Type 2 Diabetes
At the initial steps of insulin resistance, enhanced insulin
secretion (2-3 fold) can compensate for this situation for several years
12

(Groop, 2000). However, after a certain point, this is no longer
possible and hyperglycemia occurs. Once chronic hyperglycemia has
developed, it can result in further increases in insulin resistance and
subsequent deterioration of the pancreatic β cells (So et al, 2000). In
most cases, type 2 diabetes begins years before it is diagnosed. In
50% of the cases, patients have already developed macrovascular
disease by the time of diagnosis (Groop, 2000).
2.7 Type 2 Diabetes
Diabetes mellitus is a group of metabolic disorders,
characterized by high levels of blood glucose and resulting from
defects in insulin secretion, insulin action or both (CDC, 2005). The
two principal forms of diabetes mellitus are Type 1 and Type 2. Type 1
diabetes is caused by autoimmune pancreatic β cell exhaustion and
loss of insulin secretion (Fagot-Campagna et al, 1999; Ludwig &
Ebbeling, 2001). Until recently, type 1 diabetes in children was the
only type of diabetes prevalent among this age group (ADA, 2000).
Type 2 diabetes, which is characterized by insulin resistance, obesity,
a sedentary lifestyle, and occasionally by decreased insulin secretion
was considered an adult disease. Because obesity and physical
inactivity are increasing in children, the prevalence of pediatric type 2
diabetes has increased dramatically over the past 20 years
(Rosenbloom et al, 1999; Fagot-Campagna et al, 1999). More than
13

85% of adult and pediatric cases of diabetes mellitus are type 2 (So et
al, 2000).
Maturity-Onset Diabetes of the Young (MODY) is a subtype of
type 2 diabetes, which accounts for 2-5% of the cases of type 2
diabetes (So et al, 2000). It is an autosomal dominant trait and it
primarily affects insulin secretion. MODY can be caused by mutations
in the glucokinase genes. Defective glucokinase activity leads to
reduced rate of glycolysis in the pancreas, reduced glycogen synthesis
and increased gluconeogenesis in the liver. It is a disease thus far
diagnosed mostly in France (50% of cases) and in the United Kingdom
(17% of the cases).
2.8 Diagnosis of Diabetes
According to the 1997 Report of the Expert Committee on the
Diagnosis and Classification of Diabetes Mellitus, there are three
ways to diagnose diabetes:
1. Symptoms of diabetes (polyuria, polydipsia, and unexplained
weight loss) plus casual plasma glucose concentration >200
mg/dL (11.1 mmol/L). Casual is defined as a value taken at any
time of day without regard to time since last meal.
2. Fasting plasma glucose (FPG) >126 mg/dL (7.0 mmol/L).
Fasting is defined as no caloric intake for at least 8 hours.
3. 2-hour postload glucose >200 mg/dL (11.1 mmol/L) during an
oral glucose tolerance test (OGTT). The test should be
14

performed as described by the World Health Organization
(WHO), using a glucose load containing the equivalent of 75 g
anhydrous glucose dissolved in water.
In the presence of hyperglycemia, testing should be performed to
confirm diagnosis on a subsequent day. In the absence of
hyperglycemia, repeat testing should be performed on a different day
(Expert committee on the diagnosis and classification of diabetes
mellitus, 1997).
The same report defines impaired fasting glucose (IFG) as FPG
from 110 – 126 mg/dL (6.1 – 7.0 mmol/L) and impaired glucose
tolerance (IGT) as 2-hour postload glucose from 140 – 200 mg/dL
(7.75 – 11.1 mmol/L) during an OGTT (Diabetes Care, 1997). Normal
fasting glucose (NFG) is defined as < 110 mg/dL (6.1 mmol/L) and
normal glucose tolerance as 2-hour postload glucose <140 mg/dL
(7.75 mmol/L) during an OGTT (Diabetes Care, 1997).
2.9 Genetic Contributions to Type 2 Diabetes
Type 2 diabetes is a complex heterogeneous disorder caused by
interactions of various genetic and environmental factors (Gloyn &
McCarthy, 2001; Ong & Dunger, 2000; So et al, 2000). Only a small
percentage of cases of type 2 diabetes (2-5%) is caused by a defect of
a single gene (MODY). Several susceptibility genes have been
discovered to contribute to the pathogenesis of type 2 diabetes (Gloyn
& McCarthy, 2001).
15

Many twin studies have evaluated the genetic component of
type 2 diabetes, resulting in additional evidence of a genetic
predisposition for the disease (Medici et al, 1999; Poulsen et al, 1999;
Kaprio et al, 1992). A study performed on 606 Danish twins,
calculated a 26% hereditability for type 2 diabetes and a 61% value
for glucose intolerance (Poulsen et al, 1999). Another study of 13,888
Finish twins revealed similar concordance rates for monozygotic twins
(Kaprio et al, 1992). A prospective study of 44 non-diabetic British
monozygotic twins, who had siblings with type 2 diabetes, had more
astonishing results. The concordance rate of these twins increased
with age, reaching 96% after 15 years follow up (Medici et al, 1999).
Numerous epidemiological studies have shown an increased
prevalence of insulin resistance and type 2 diabetes in various ethnic
groups, among which are American Indians, African American and
Hispanic (Saad et al, 1991, Haffner et al, 1991). The Pima Indians,
who have the highest recorded prevalence of type 2 diabetes, have
been studied extensively (Dabelea et al, 1999; Dabelea & Pettitt,
2001; Saad et al, 1991; Story et al, 1999). The high prevalence of
diabetes among this ethnic group has been related to the increase in
frequency of exposure to diabetes in utero as well as low birth weight
(Dabelea et al; 1998; Dabelea et al, 2000; Lindsay et al, 2000).
African-Americans have been shown to have significantly lower insulin
secretion and sensitivity than whites (Arslanian & Suprasongsin,
16

1996; Cruz et al, 2002). Hispanics have been shown to have a higher
insulin secretion and hyperinsulinemia could be a possible reason for
the high prevalence of diabetes type 2 among this ethnic group
(Haffner, 1987; Haffner et al, 1991; Haffner et al, 1992).
The increased prevalence of diabetes type 2 among several
ethnic groups has triggered several researchers to explore the “thrifty
genotype hypothesis.” According to this hypothesis, the high
frequency of type 2 diabetes in societies that suffered from
malnutrition, suggests that there is a predisposition to this disease
due to an evolutionary advantage (Ong & Dunger, 2000). This
advantage enables the fetuses with the “thrifty genotype” to store
energy more efficiently in an unfavorable intrauterine environment
and survive prolonged food shortages (Kawaga et al, 2002; So et al,
2000). However, in affluent societies, these fetuses are at a greater
risk of developing diabetes later in life (Kawaga et al, 2002). The
opposing theory suggests that poor maternal nutrition would result in
poor fetal growth, resulting in defective development of the
pancreatic β cells and insulin sensitive tissues (So et al, 2000). This
“thrifty phenotype” hypothesis postulates that low rates of growth
program fetal metabolism and result in an increased risk for type 2
diabetes (Forsen et al, 2000; Hales & Barker, 1992; Ong & Dunger,
2000). Those two hypotheses explain the high prevalence of type 2
diabetes among individuals who had a low birth-weight and have a
17

later affluent life, with food abundance, physical inactivity, and
psychosocial stress (So et al, 2000; Lindsay et al, 2000; Dabelea et al,
1999).
2.10 Obesity-Induced Type 2 Diabetes
Obesity-induced insulin resistance in adults has been linked
with endothelial dysfunction (Tounian et al, 2001). It has been
suggested that impairment of nitric oxide (NO) synthesis results from
the decreased levels of apolipoprotein A-I and HDL in the obese state
(Tounian et al, 2001). Decreased endothelial NO synthesis causes the
tightening of the lumen of the capillaries and prevents vascular
relaxation. Endothelial dysfunction could thus prevent effective insulin
transport to the peripheral tissues and cause insulin resistance.
Several studies support the existence of endothelial dysfunction in
insulin resistance (Verma & McNeill, 2001; Weyer et al, 2002).
However, it still remains a controversy whether endothelial
dysfunction is a cause or consequence of obesity and insulin
resistance (Baumgartner-Parzer & Waldhausl, 2001; Tack et al, 1998;
Avogaro et al, 1997; Utriainen et al, 1996).
Most factors in obesity that influence the response to insulin
and result in insulin resistance can be receptor or post-receptor
events (Caballero, 1992).
18

2.10.1 Receptor Events
In 1963, Randle et al proposed a relationship between glucose
and free fatty acid metabolism, the glucose – fatty acid cycle.
According to Randle, FFAs compete with glucose as a substrate for
energy. As a result, increased FFAs cause a rise in fatty acid oxidation
and a decrease in glucose uptake by insulin, leading to insulin
resistance (Randle et al, 1963). Substrate competition caused by
dietary factors has been shown to impair insulin response during
elevated fat metabolism (Vouillamoz et al, 1987; Boden et al, 1991).
However, this event has been observed at high and low plasma insulin
levels (Vaag et al, 1994).
In obesity, there is a decrease in the binding of insulin to its
receptors due to a decrease in the number of available receptors in
muscle, liver and adipose tissues (Kahn, 1980). Excess adiposity
results in a down-regulation of insulin receptors, that is proportional
to basal insulin concentration and body adiposity, and is caused by the
increase of plasma insulin for a prolonged period of time (Kahn,
1980). A decreased number of insulin receptors is not likely to affect
insulin sensitivity exceedingly, because saturation of the receptors
and maximal insulin action is achieved at a 10% utilization of the
receptors (Caballero, 1992).
Rare mutations in the insulin receptor result in severe insulin
resistance (leprechaunism or type A syndrome of insulin resistance).
19

These mutations are less than 1% of all cases of type 2 diabetes
(Zierath & Wllberg-Herniksson, 2002). Impaired signal transduction
through the insulin receptor pathway is more likely to have a
profound effect on glucose metabolism.
The human insulin receptor (HIR) exists in two subtypes: HIR-A
and HIR-B, which differ by a 12-amino acid sequence insertion in the
α-subunit of the HIR-B type (Mosthaf et al, 1991). These two types of
receptors differ in the affinity for insulin and HIR-B has the lowest
insulin-binding activity of the two isoforms. These differences in the
two isoforms are acquired, rather than derived from defects in the
primary structure of the receptor (Cama et al, 1990). In experiments
it has been shown that in skeletal muscle of non-diabetic individuals,
predominantly mRNA encoding for the HIR-A is found, while in type 2
diabetic individuals similar amounts of each isoform are expressed
and therefore an increased level of HIR-B is found (Kellerer et al,
1993). However, it has been shown that the expression of the isoforms
does not account for skeletal muscle insulin resistance in type 2
diabetes and obesity (Anderson et al, 1993; Haring et al, 1994).
Insulin receptor activity can be inhibited by hyperglycemia, through
the isoforms of protein kinase C, which are able to form stable
complexes with the insulin receptor and modulate its tyrosine kinase
activity through serine phosphorylation of the receptor β subunit
(Haring et al, 1994).
20

2.10.2 Post-receptor Events
Various post-receptor defects have been linked to obesity and
the mechanisms involve defects in the signaling cascade following the
binding of insulin to its receptor, resulting in a reduction of glucose
transporters (Caballero, 1992; Molnar, 1990). These defects have
been linked to abnormalities in the skeletal muscle and include
increased concentration of intramyocellular lipids (IMCL) and altered
composition of muscle fiber types (Ashley et al, 2002).
2.11 Adipose Tissue Deposition in Human Skeletal Muscle and
Liver
2.11.1 Quantification Methods
Muscle fat deposition can be measured by Computed Axial
Tomography (CAT scan). However, there are safety issues resulting
from ionizing radiation of this method (Sinha et al, 2002).
Furthermore, muscle fat deposition can be measured through muscle
biopsy, but the major problem of this method is its invasive nature and
variable results, with a coefficient of variation ranging from 20 – 26%
(Wendling et al, 1996). In addition to the problems associated with
these two techniques, they also lack the accuracy and sensitivity to
discern between intramyocellular and extramyocellular lipids (EMCL)
(Sinha et al, 2002).
21

Proton nuclear magnetic resonance (MRS) is a non-invasive
method, which has the capacity to quantitatively determine IMCL and
EMCL, as well as intrahepatic lipid accumulation (IHL) in vivo and has
been validated in animal and human models against histological and
biochemical analyses (Schick et al, 1993; Rico-Sanz et al, 1998; Rico-
Sanz et al, 1999; Boesch et al 1997; Szczepaniak et al, 1999).
2.11.2 Proton Magnetic Resonance Spectroscopy
Over the last few years, the use of magnetic resonance has been
applied to the measurement of metabolic products and intermediates
(Szczepaniak et al, 1999). 31P magnetic resonance spectroscopy is
used to study energy metabolism, 13C magnetic resonance
spectroscopy is used to study carbohydrate metabolism. Proton MRS
has been used to study brain disorders and defects in lipid metabolism
and recently it has been used to measure intracellular triglyceride
levels in body tissues (Szczepaniak et al, 1999).
MRS is mainly performed in the soleus (SOL) and tibialis
anterioris (TA) calf muscles, because of their muscle fiber content
(Perseghin et al, 1999). The human muscle fiber types are slow-twitch
oxidative fibers (fibers type I), fast-twitch oxidative fibers (fibers type
IIa) and fast-twitch glycolytic fibers (fibers type IIb). Fibers type I are
the insulin sensitive fibers, whereas fibers type IIa have moderate
insulin sensitivity and fibers type IIb have the least (Perseghin et al,
1999). The SOL is a feathered muscle with oblique and crossing fiber
22

and orientation and is prevalently composed of insulin-sensitive
oxidative fibers type I (Machann et al, 2004). The TA is a spindle-
shaped muscle with parallel fiber orientation and has a higher
percentage of less insulin sensitive glycolytic fibers type IIb (Machann
et al, 2004). Thus, both of these muscles are very useful in observing
an association between insulin resistance and IMCL (Perseghin et al,
1999; Ashley et al, 2001).
MRS distinguishes between IMCL and EMCL because of the
frequency shift caused by the difference in magnetic susceptibility
between the adipocyte pool and the intramuscular fatty acid
compartment, as well as the difference in geometric arrangement of
muscle tissue (Boesch et al, 1997, Schick et al, 1993). The resonances
of the methyl and methylene proton of the triglyceride (TG) acyl
chains appear between 1.0 and 1.6 parts per million (ppm;
Szczepaniak et al, 1999). In healthy human muscle, it has been shown
that four peaks appear in a proton spectrum, as can be seen in Figure
3 (Szczepaniak et al, 1999). The peak at 1.6ppm represents the
methylene (-CH2) resonance of EMCL, while the peak at 1.2ppm
represents the methyl (-CH3) resonance of EMCL (Rico-Sanz et al,
1998). Furthermore, the peak at 1.4ppm corresponds to the
methylene (-CH2) resonance of IMCL, while the peak at 1.0ppm
corresponds to the methyl (-CH3) resonance of IMCL (Szczepaniak et
al, 1999).
23

Figure 3: Proton spectrum of human soleus muscle
A: raw spectrum; B: deconvolution with fitted peaks for signals identified by prior knowledge; C: difference spectrum after subtracting fitted curves from B from raw data in A. EMCL, extramyocellular; IMCL, intramyocellular. IMCL CH3 (1) and CH2 (3) at 1.0 and 1.4 parts per million (ppm); EMCL CH3 (2) and CH2 (4) at 1.2 and 1.6 ppm; IMCL+EMCL -CH2 (5, 6) and polyolefinic/monolefinic (7, 8) CH2 overlap and were approximated by four peaks. Source: Szczepaniak et al, 1999
The MRS determination of IMCL has several potential sources
of error. The signal of cellular phospholipids, cholesterol esters and
lactate is possible to contaminate the total methylene signal at
approximately 1.3 ppm. However, under normal conditions, the
concentration of these moieties is low and these compounds do not
interfere significantly with the TG methylene peaks (Szczepaniak et
al, 1999). Furthermore, in MRS TG determination, a source of error
can occur if the composition of TGs in the diet is much different than
expected (Szczepaniak et al, 1999). The predominance of a limited
number of fatty acids (18:0, 18:1 and 16:0) in the diet can minimize
such errors.
24

In the human calf muscle, the coefficient of variation (CV) of
MRS for IMCL determination of SOL has been shown to be 11.8% for
lean individuals and 7.9% for obese individuals and the EMCL of SOL
was 22.6 and 52.5% respectively (Szczepaniak et al, 1999). Another
study by Rico-Sanz et al (1998) measured the CV of IMCL of the SOL
muscle to be 13.6% and that of EMCL to be 13.2%. Brechtel et al
(1999) quantified the CV of IMCL of the SOL muscle to be within 2 –
15% and that of the TA to be 2 – 12%, while the CV of EMCL of the
SOL muscle was 8 – 17% and that of the TA was 12 – 45%. The strong
dependence of EMCL on the voxel positioning and the high CV
obtained from its measurement limit its physiological relevance
(Machann et al, 2004).
MRS is a useful tool for noninvasive determination of
abnormalities in lipid metabolism and can accurately distinguish
between IMCL and EMCL in animal and human models (Perseghin et
al, 1999; Szczepaniak et al, 1999; Sinha et al; 2002). It can be used
successfully to study alterations in IMCL and the association of
muscular lipid accumulation with the development of insulin
resistance in obesity.
MRS has also been used in studies of liver diseases and has
been shown to correlate well with histological and biochemical
analyses (Tarasow et al, 2002; Szczepaniak et al, 1999). In liver
proton spectra, a single peak at 0.8 – 1.6ppm indicates the presence
25

of abnormal liver fat (Figure 4). A separation of methyl and methylene
IHL is not possible. Thomas et al (2005) reported that the CV for IHL
determination with subject repositioning was 6 – 7%.
Figure 4: Proton spectrum of human liver
The left spectrum is a liver spectrum of a subject with presence of abnormal intrahepatic lipid (IHL) at 0.8 – 1.6ppm. The right spectrum is a liver spectrum of a subject with absence of abnormal IHL at 0.8 – 1.6ppm. The water peak is shown at 4.7 – 4.8 ppm at both spectra.
2.11.3 Mechanism of Muscle Lipid Accumulation
As a result of lipid accumulation in the muscle, glucose
metabolism is compromised due to impaired insulin-stimulated
glucose transport and subsequent defect in glycogen synthesis
(Perseghin et al, 1999). Defective glucose transport is thought to
cause an interruption in the insulin-signaling cascade (Krssak et al,
1999). The exact molecular mechanism of defective glucose transport
waterwater
Presence of abnormal IHL
Absence of abnormal IHL
26

is not yet elucidated. However, it has been postulated that increased
IMCL, due to dietary excess, inhibits the docking and fusion process
of the GLUT4 transporters to the plasma membrane and the
subsequent glucose transport in the muscle cell (Jacob et al, 1999).
The proposed mechanism (Figure 5) postulates that IMCL levels
activate protein kinase C (PKC) in the muscle cell, which in turn
phosphorylates the IRS-1 molecule at the serine residue instead of the
tyrosine residue. As result, IRS-1 is deactivated and there is a
disruption of the cascade that leads to GLUT4 translocation to the
surface and therefore, glucose cannot be transported in the cell.
Figure 5: Mechanism of insulin resistance due to increased FFA
concentrationNormal glucose transport
Insulin Insulin
Receptor
Tyrosine Kinase
Phosphorylation
GLUT4
Glucose
IRS-1
Insulin Insulin
Receptor
IRS-1
FFA FAcyl-CoA
PKC
Serine KinasePhosphorylation
GLUT4
Glucose
Defective glucose transport
27

IRS-1: Insulin Receptor Substrate 1; FFA: Free Fatty Acids; FAcyl-CoA: Fatty Acyl Coenzyme A; PKC: Protein Kinase C.
2.11.4 Fatty Liver Disease
Fatty liver disease can be classified as alcoholic and
nonalcoholic. Alcoholic fatty liver disease (AFLD) is the inflammation
of the liver caused by alcohol abuse. The pathophysiology of alcoholic
fatty liver is linked to nutrient malabsorption and reduced
consumption because of an increase in empty calories from alcohol
and reduced appetite (NIH, 2005). The liver inflammation progresses
to fatty liver and the final stage is irreversible liver damage
(cirrhosis).
Nonalcoholic fatty liver disease (NAFLD) includes a range of
changes from fatty liver (steatosis) to steatohepatitis (NASH) and
cirrhosis (Mendler, 2005). The similarity among all stages of NAFLD
is lipid accumulation in the liver cells (hepatocytes). In NASH, the fat
accumulation is associated with different levels of hepatitis
(inflammation) and fibrosis (scarring) of the liver. Although the
histology of NAFLD is similar to AFLD, it does not occur due to high
alcohol consumption. Several conditions are associated with NAFLD,
the two most important being obesity and type 2 diabetes (Choudhury
28

and Sanyal, 2004). Although the prevalence of NAFLD is 3% in the
U.S. population, among obese individuals it is as high as 20 – 40%
(Youssef and McCullough, 2002). The high rates of NAFLD among
obese individuals may be explained by the action of the liver cells
(hepatocytes) as a reservoir of toxic compounds which are susceptible
to reactive oxygen species, resulting in lipid peroxidation and
eventually leading to cell death (Youssef and McCullough, 2002).
2.11.5 Lipid Accumulation and Insulin Resistance
The deposition of triglycerides (TG), for the breakdown into
fatty acids (FAs) and the production of energy, has been thought to
take place only in adipose tissue, but recently FAs in the skeletal
muscle have been established to be important energy sources (Sinha
et al, 2002; Krssak et al, 1999). The overaccumulation of various lipids
in the skeletal muscle has been linked with an increase in insulin
resistance in obese and lean adults, as well as in nondiabetic offspring
of type 2 diabetic subjects (Jacob et al, 1999; Krssak et al, 1999;
Perseghin et al 1999; Boden et al, 2001; Ashley et al, 2002; Sinha et
al, 2002; Virkamaki et al, 2001).
Perseghin et al (1999) studied 14 young lean offspring of type 2
diabetic parents and 14 healthy subjects matched for anthropometric
and lifestyle factors (mean age = 30 years). Insulin sensitivity was
evaluated by the euglycemic-hyperinsulinemic clamp and IMCL of the
SOL and TA was determined by proton MRS. This study results
29

indicated an increase IMCL of the SOL but not the TA muscle in the
offspring of diabetic parents. Furthermore, IMCL in the SOL muscle
and FFA were the main predictors of insulin sensitivity.
A group of 41 boys with a mean age of 9.1 years and no history
of diabetes, and a group of 23 mothers of this cohort with a mean age
39 years were studied (Ashley et al, 2002). Insulin sensitivity was
assessed by fasting glucose and insulin values and IMCL of the SOL
muscle was determined by proton MRS. Significant associations were
found between the boy’s IMCL and insulin sensitivity, as well as
maternal log fasting plasma insulin (FPI) and IMCL values. In a
subset of 23 boys, maternal IMCL explained 39% of the variance in
their IMCL.
In a study performed by Jacob et al (1999), 13 lean insulin
resistant (mean age = 31.8 years) were compared to 13 lean insulin
sensitive subjects (mean age = 29.4 years), both relatives of type 2
diabetics which were matched for sex, age, BMI, percent body fat,
physical fitness and waist-to-hip ratio. Insulin sensitivity was
determined by the euglycemic-hyperinsulinemic clamp and IMCL was
determined by proton MRS of the SOL and the TA muscles. This study
showed that IMCL in both muscles was statistically significantly
higher in the insulin-resistant compared to the insulin-sensitive
individuals, whereas EMCL content in both muscles was not
significantly different in the two groups. These results demonstrated
30

that high levels of IMCL can be an early response in the development
of insulin resistance.
Virkamaki et al (2001) studied a group of 20 healthy men (mean
age = 42 years) with no family history of diabetes (mean BMI=26
kg/m2). Insulin sensitivity was assessed by the euglycemic-
hyperinsulinemic clamp and IMCL was determined by proton MRS of
the vastus lateralis muscle. The subjects were then separated in two
groups, one with high IMCL and one with low IMCL levels. Both
groups had similar characteristics, with respect to age, BMI, and
maximal oxygen consumption. In that study, IMCL accumulation was
associated with whole-body insulin resistance and with defective
insulin signaling in skeletal muscle independent of body weight and
physical fitness (Virkamaki et al, 2001).
Furthermore, Krssak et al (1999) investigated the association
between IMCL levels and insulin sensitivity in a group of 23 normal
weight non-diabetic subjects (mean age = 29 years, mean BMI = 24.1
kg/m2). In this study group, IMCL of SOL muscle was quantified using
proton MRS and insulin sensitivity was assessed by the insulin clamp.
It was demonstrated that IMCL and insulin sensitivity were inversely
correlated. In the same study, it was shown that IMCL-associated
insulin resistance was unrelated to BMI, age and fasting plasma
concentrations of triglycerides, non-esterified fatty acids, glucose or
insulin (Krssak et al, 1999). The authors concluded that IMCL levels
31

quantified by proton MRS are good indicators of whole body insulin
sensitivity in non-diabetic lean adults.
Sinha et al (2002) explored the relationships between IMCL and
EMCL to in vivo insulin sensitivity, independent of total body fat and
central obesity in a group of 14 obese (mean BMI = 35 kg/m2, mean
age = 13 years) and 8 lean adolescents (mean BMI = 21kg/m2, mean
age = 14 years). Both study groups underwent IMCL and EMCL
determination of the SOL muscle by proton MRS and insulin
sensitivity assessment by the euglycemic-hyperinsulinemic clamp.
Both IMCL and EMCL of SOL were significantly higher in the obese
adolescents compared to the lean controls. In the same study, a
strong inverse correlation was found between IMCL and insulin
sensitivity, which became stronger after adjusting for TBF and
abdominal subcutaneous fat mass (Sinha et al, 2002).
However, a study by the same group failed to uncover a
correlation between insulin sensitivity and IMCL in the SOL muscle in
a group of 30 healthy Asian Indian males with a mean age of 40.6
years and a mean BMI of 23.2 kg/m2 (Sinha et al, 2005). Proton MRS
was used to evaluate IMCL in the SOL muscle and HOMA was used as
an index of insulin resistance. IMCL levels of this group did not show
a significant correlation with HOMA values.
Several studies have investigated the effect of acute changes in
plasma FFA and changes in IMCL and insulin resistance (Boden et al,
32

2001; Brechtel & Dahl et al, 2001; Backman et al, 2001). These
studies were performed in young healthy lean volunteers. IMCL was
quantified by proton MRS and insulin resistance was assessed by the
euglycemic-hyperinsulinemic clamp, before and after lipid and
heparin infusions. Acute changes in plasma FFA were accompanied by
corresponding changes in IMCL (Boden et al, 2001; Brechtel & Dahl
et al, 2001; Backman et al, 2001) and insulin resistance (Boden et al,
2001; Backman et al, 2001).
The majority of studies that have been used to evaluate skeletal
fat accumulation were cross-sectional. Few longitudinal studies
investigated the depletion of IMCL levels in the skeletal muscle with
weight loss (Petersen et al, 2005; Greco et al, 2002; Tamura et al
2005).
Greco et al (2002) tested the effects of selective IMCL depletion
on the obesity-associated insulin resistance. This group measured
whole-body insulin sensitivity by the euglycemic-hyperinsulinemic
clamp technique, and IMCL by quantitative histochemistry on
quadriceps muscle biopsies on a group of 20 morbidly obese patients,
and 7 non-obese control patients. A group of 8 obese individuals
underwent biliopancreatic diversion (BPD) and lost 24% of their total
body weight, while a group of 9 obese subjects were administered a
hypocaloric diet and lost 10% of the their total body weight in a
period of 6 months. Insulin resistance was reversed in the obese
33

group who underwent BPD and IMCL levels were decreased.
Furthermore, Glut4 expression was restored, and circulating leptin
concentrations were normalized in the same group. The hypocaloric
diet group showed small changes in insulin sensitivity and IMCL
compared to the obese BPD group. This research group concluded
that IMCL was selectively depleted as a result of lipid deprivation and
a normal metabolic state was subsequently induced.
A short-term weight loss study to examine the effect of
moderate weight reduction on IMCL and insulin resistance in type 2
diabetic patients was recently published (Petersen et al, 2005). This
study included a group of 8 obese sedentary diabetic patients (5 men
and 3 women), with a mean age of 47 years and mean BMI of 30.1
kg/m2, and a control group of lean sedentary individuals (5 men and 5
women), with a mean age of 30 years and a mean BMI of 25.2 kg/m2.
The endpoint of the intervention was normoglycemia (3 – 12 weeks)
and the obese subjects were analyzed at baseline and two weeks after
weight stabilization on a hypocaloric low-fat diet. The control group
was only examined at baseline. Insulin sensitivity was assessed by the
euglycemic-hyperinsulinemic clamp technique, while IMCL of the SOL
muscle and IHL were measured by proton MRS. The diabetic group
was significantly insulin resistant compared to the insulin sensitive
lean controls at baseline. After a mean weight loss of 8 kg (9.3% of
total body weight), the diabetic group demonstrated a significant
34

improvement in hepatic insulin resistance, but not in peripheral
glucose metabolism or IMCL.
Another short-term diet and exercise study examined the effects
of IMCL, IHL, and peripheral insulin sensitivity (Tamura et al, 2005).
In this study, two groups of type 2 diabetics were studied at baseline
and after a two-week diet and a diet plus exercise intervention. The
diet group had a mean age of 55.0 years and a mean BMI of 27.4
kg/m2 compared to that of 46.3 years and 27.1 kg/m2 of the diet and
exercise group. Insulin sensitivity was assessed by the euglycemic-
hyperinsulinemic clamp technique, while IMCL in the TA muscle and
IHL were measured by proton MRS. In both groups a significant
decrease in IHL was found, which was independent of fasting FFA
levels. However, IMCL was reduced by 19% and glucose infusion rate
was increased by 57% only in the diet and exercise group.
A longer intervention trial of diet and exercise was performed
by He et al (2004) to examine the effect on IMCL and lipid droplet size
in a group of sedentary obese individuals. IMCL and lipid droplet size
were quantified by percutaneous biopsy in the vastus lateralis muscle
of 21 obese individuals (mean age 40 years, mean BMI = 33.3
kg/m2). Insulin sensitivity was assessed by the euglycemic-
hyperinsulinemic clamp technique. The intervention resulted in a
10% weight loss and a 46% increase in insulin sensitivity. Even
though, IMCL levels were not significantly different after weight loss,
35

the size of lipid droplets was significantly decreased and this
reduction was associated with an increase in insulin sensitivity.
2.11.6 Lipid Accumulation and Exercise
Several studies have examined the role of physical activity and
aerobic fitness on IMCL. Trained endurance athletes have been shown
to possess elevated IMCL levels, even though they are very insulin
sensitive (van Loon et al, 2004). This paradox was investigated in a
group of 8 highly trained endurance athletes, 8 type 2 diabetic
patients, and eight overweight, sedentary men after an overnight fast
(van Loon et al, 2004). IMCL in the vastus lateralis was determined by
muscle biopsy obtained from this population. IMCL levels were
considerably higher in the athlete group compared to the overweight
or type 2 diabetic individuals. Furthermore, a group of 9 lean trained
subjects was examined before and after a submaximal treadmill run to
exhaustion to determine the role of lipid utilization during exercise
(Krssak et al, 2000). IMCL of the SOL muscle was quantified by
proton MRS. After the exercise, IMCL levels increased to 83% of the
baseline value.
One the contrary, a study on trained males (age range 24 – 38
years) showed that IMCL and EMCL of SOL, TA and gastrocnemius
muscles (quantified by proton MRS) were not affected by exercise
intensity (Rico-Sanz et al, 1998). The role of exercise duration and
workload on IMCL was investigated by Brechtel & Niess et al (2001).
36

A group of 12 male runners was studied before and after exercise to
determine the effects of prolonged exercise of moderate intensity on
skeletal muscle lipids. IMCL and EMCL of the TA and SOL muscles
were quantified by proton MRS. Prolonged and moderate intensity
exercise decreased IMCL in both muscles, whereas high intensity
exercise did not affect IMCL in either muscle.
In a substudy of the Tubingen Family Study for Type 2 Diabetes,
105 healthy lean previously untrained individuals (mean age = 19
years, mean BMI = 24.6 kg/m2) were examined to determine the role
of aerobic fitness and IMCL (Thamer et al, 2003). IMCL in the TA and
SOL muscles was determined by proton MRS, aerobic capacity by
bicycle ergometry, and insulin sensitivity by the euglycemic-
hyperinsulinemic clamp. Only IMCL in the TA was significantly
associated with measures of aerobic fitness, after adjusting for
adiposity. In this study, no correlation was found between insulin
sensitivity with IMCL in neither of the muscles studied.
2.11.7 Lipid Accumulation and Adiponectin
The possible role of adiponectin in insulin resistance and IMCL
accumulation still remains unclear (Weiss et al, 2003; Perseghin et al,
2003). A study of 15 patients with type 1 diabetes, 7 patients with
type 2 diabetes, 15 non diabetic insulin resistant offspring of type 2
diabetics, and 15 healthy controls investigated the role of reduced
plasma adiponectin and increased IMCL in the pathogenesis of type 2
37

diabetes (Perseghin et al, 2003). Insulin sensitivity was assessed by
the euglycemic-hyperinsulinemic clamp and IMCL of the SOL and TA
muscles was quantified by proton MRS. In type 1, type 2 diabetics and
offspring of type 2 diabetics, IMCL concentration was positively
associated with insulin resistance. However, adiponectin levels were
shown to be increased in type 1 diabetics in contrast to the decreased
levels found in type 2 diabetics and their offspring.
Another study by Weiss et al (2003) examined the effects of
adolescent obesity on plasma adiponectin, insulin sensitivity, IMCL,
plasma TG and FFAs. Eight non obese (mean TBF = 18%) and 14
obese adolescents (mean TBF = 41%) were studied. Insulin sensitivity
was assessed by the euglycemic-hyperinsulinemic clamp and IMCL of
the SOL muscle was quantified by proton MRS. Adiponectin
concentration was higher in the non obese adolescents and was
positively associated with insulin sensitivity in both obese and non
obese individuals. IMCL and plasma TG were negatively associated
with adiponectin levels, and explained 62% of the change in
adiponectin levels between the two groups. Further investigation is
required to establish the link between excess adiposity, IMCL and
insulin resistance.
38

3 HYPOTHESES AND OBJECTIVES
3.1 Hypotheses
1. Insulin resistance in obesity is primarily dependent on IMCL
concentration. There is better correlation between insulin
resistance and IMCL than with BMI, serum TG levels or TBF.
2. A reduction in IMCL will have more significant effects on insulin
sensitivity than a reduction in body adipose tissue stores.
3.2 Objectives
The general aims of this study were to assess the correlations
between insulin resistance, IMCL, BMI, serum TG and TBF of an
obese group with an otherwise similar group of lean individuals, and
to quantify the effects of weight loss through dietary intervention on
the IMCL and insulin sensitivity of a group of healthy obese adults.
The specific objectives were:
1. To quantify IMCL in lean and obese individuals and correlate
with TBF and insulin sensitivity.
2. To determine which variables are more useful in predicting
insulin sensitivity among the outcome variables: BMI, TBF, IHL,
waist-to-hip ratio (WHR), serum TG content, leptin, adiponectin,
and IMCL.
3. To establish whether the association of IMCL with insulin
resistance is independent of other factors known to affect
39

insulin action, like BMI, body composition and body fat
distribution.
4. To assess the impact of weight loss in obese individuals on
IMCL, TBF and insulin sensitivity.
5. To determine correlations between IMCL and leptin,
adiponectin, insulin, glucose, serum TG levels, TBF, IHL, WHR,
and BMI before and after the dietary intervention.
40

4 MATERIALS AND METHODS
4.1 Study Design
A prospective intervention trial was conducted to assess the
effects of weight loss through dietary intervention on IMCL and
insulin sensitivity in a group of healthy obese adults. Body
composition, plasma metabolite levels, IMCL, IHL, and insulin
resistance indices were compared at baseline and follow up. The
desired endpoint for weight loss was 8 – 10% reduction of initial
weight.
Furthermore, cross-sectional comparisons were performed at
baseline between the obese group and an otherwise similar group of
lean individuals to assess the correlation of insulin resistance in
obesity with IMCL concentration. Anthropometric data, blood
metabolites, IMCL, IHL, and insulin resistance indices of the obese
were compared with those of the lean group. Baseline correlations
were obtained for insulin resistance indices and measures of adiposity
(including IMCL, BMI, TG, and WHR). A flow diagram of the study
design is shown in Figure 6.
All participants from both obese and lean groups underwent the
initial screening, and the intracellular lipid measurement by proton
MRS. Only the obese subjects underwent the euglycemic-
hyperinsulinemic insulin clamp procedure, the weight loss
intervention and the follow up measurements (Figure 6).
41

Figure 6: Diagram of study design
MRS: Proton Magnetic Resonance Spectroscopy; Clamp: Euglycemic-
Hyperinsulinemic clamp.
4.2 Sample Size
A total of 10 obese subjects were needed to detect a 0.2%
difference in IMCL after an 8 – 10% weight loss and a standard
deviation of 0.22% with power of 0.80 and a significance level of
0.05 (Sinha et al, 2002). The following sample size formula for paired
data was used:
where is the percentile of the normal distribution used as the
critical value in a two-tailed test of size α (1.96 for an 0.05 level test),
42

is the th percentile of the normal distribution (0.84 for the
80th percentile), σ is the standard deviation and Δ is the expected
difference between the two measurements. For baseline comparisons,
a reference group of 19 lean individuals matched for gender and
ethnicity was also used.
The sample size was verified using Stata version 8.1 (College
Station, TX, 2004) for paired analysis with a baseline measurement
and one follow up measurement, and a correlation of baseline and
post-treatment measurement of 0.5.
The proposed sample size is sufficient to detect a significant
difference in insulin resistance with a weight loss of 8 – 10 %. Similar
studies that evaluated the change in insulin resistance after a 10%
weight loss were able to detect a 32 – 42% improvement (Colman et
al, 1995; Ikeda et al, 1996). Several studies have shown that even
moderate weight loss (5-10% of body weight) results in great
improvement in insulin sensitivity (up to 60%) and other risk factors
for cardiovascular disease (Goldstein, 1992; Vidal, 2002; de Leiva,
1998; Van Gaal et al, 1997; Ross et al, 2000).
4.3 Subjects
All subjects recruited in this study were adults 20 – 65 years old.
Obese participants had a BMI of 30.0 – 40.0 kg/m2, while lean subjects
had a BMI of 18.0 – 25.0 kg/m2 and no history of obesity. Participants
43

had to meet certain criteria to be eligible for inclusion in this study.
All subjects should have had a normal electrocardiogram (ECG) or
ECG approved by a physician investigator. Women of childbearing age
should have agreed to use an acceptable form of birth control, and
should have been non-pregnant or lactating. Subjects should have had
no history or presence of any uncontrolled disease, or have taken
drugs that could interfere with their metabolic status and their ability
to complete the study. All subjects should have had normal fasting
blood glucose (< 126 mg/dl), liver enzymes and thyroid hormone
levels. Furthermore, all subjects had to sign an informed consent for
their participation and agree to follow the research protocol.
4.4 Baseline Measurements
4.4.1 Initial Screening
All participants for this study (lean and obese) were pre-
screened by telephone and their eligibility was established. All eligible
participants were then asked to fast 8-10 hours prior to the screening
visit. At the morning of the visit, they were provided with the informed
consent forms.
Their vital signs were obtained (pulse and blood pressure) using
an Omron HEM 907 blood pressure monitor (Omron Healthcare Inc,
Bannockburn, Illinois). Height was measured to the nearest 0.1cm
with a Harpenden 602VR stadiometer (Holtain Limited, Crymych,
44

United Kingdom) and weight was measured with a ScaleTronix 6002
digital scale (Scale-Tronix, White Plains, New York) to the nearest
100g. Their BMI was calculated as weight (kilograms) divided by
height squared (meters2).
A fasting blood draw was obtained for the following tests:
complete blood count, thyroid and liver functions [Thyroid-Stimulating
Hormone (TSH), Alanine Transaminase (ALT) Aspartate
Aminotransferase (AST)], albumin, lipid profile [free fatty acids (FFA),
serum triglycerides (TG), total cholesterol (TCho), High Density
Lipoprotein (HDL), Low-Density Lipoprotein (LDL)], glycated
hemoglobin (HbA1c), glucose, insulin, leptin and adiponectin. After
the fasting blood draw, an Oral Glucose Tolerance Test (OGTT) was
performed. Subjects ingested 75g of glucose solution (Glucotrol).
Repeat blood samples were taken at 30, 60, 90 and 120 minutes after
the glucose ingestion. Between blood draws, an electrocardiogram
(ECG) was performed using a GE Mac 5000 ECG system (GE
Healthcare, Waukesha, Wisconsin).
Body composition was determined by Dual-energy X-ray
Absorptiometry (DEXA) using a Hologic QDR 4500W total body
scanner (Hologic Inc, Bedford, Massachusetts). DEXA has been used
extensively for the determination of body composition (Rosenfalck et
al, 2002; Munoz et al, 2002; Weyers et al, 2002; Martini et al, 2001;
Lukaski, 1993; Slosman et al, 1992). DEXA allowed the direct
45

measurement of the lean body mass, fat body mass and bone mineral
body mass (Slosman et al, 1992). DEXA is accurate and precise
enough to detect even small to moderate weight loss (Weyers et al,
2002). It is relatively inexpensive, widely available and exposure to
radiation is low. Therefore, it has been deemed safe for clinical
investigations in most populations (Wang et al, 1999).
The DEXA scanner performed serial transverse scans from head
to toe at 1.2-cm intervals providing a pixel size of 1.9 mm × 1.2 cm
(Panotopoulos et al, 2001). For each pixel, the equipment calculated
weight, bone mass and percent of fat and integrated the
measurements for the whole body and different regions as arms,
trunk, and legs. Lean mass was indirectly calculated and the head was
assumed to contain 17% fat. The precision of a whole body scan,
performed by the Hologic QDR 4500W scanner has been reported in
previous studies: 0.5% for lean body mass and 4% for body fat
(Berruti et al, 2002).
Anthropometric measurements of waist and hip circumference
were performed by a study dietician. Waist circumference was
measured at the mid-point between the iliac crest and the lower costal
margin in the mid-axillary line. Hip circumference was measured at
the level of the greatest posterior protuberance of the buttocks. Both
measurements were done to the nearest 0.1 cm using Gullick II tape.
The waist circumference was divided by the hip circumference in
46

order to calculate the waist-to-hip ratio (WHR) as a measure of central
obesity. In previous studies, central obesity has been shown to
correlate with higher insulin secretion and increased insulin
resistance (Mayer-Davis et al, 2001; Furler et al, 2001).
The dietician also provided the subjects with food record forms.
Subjects were asked to document detailed food intake on study forms
for two weekdays and one weekend day. The subjects were asked to
answer various questionnaires in order to determine their health
status, eating and physical activity patterns, as well as weight and
diet history. Screening for eating disorder symptoms (Eating Attitudes
Test) and depression (Beck Inventory Scale) was performed. After the
OGTT was completed, the subjects were given breakfast and were
discharged.
4.4.2 Proton Nuclear Magnetic Resonance Spectroscopy
Subjects (lean and obese) were scheduled at the Kennedy
Krieger F.M. Kirby Research Center for IMCL and IHL measurements.
This procedure was performed in a Phillips Intera 1.5 Tesla magnetic
resonance imaging (MRI) scanner (Philips Medical Systems N.A,
Bothell, Washington), using a combination of whole body and knee
coils by a trained radiology technician. Subjects were placed with
their feet first in the MRI scanner in the supine position. The right calf
of each subject was placed flat on a padded circular knee coil where
47

the larger diameter of the calf muscle was positioned in the middle of
the coil.
Initially, an initial crude scan, known as scout, was performed
and sagittal T1 images were taken, using the body coil and a repetition
time (TR) of 500 ms, echo time (TE) of 15ms, and field-of-view (FOV)
of 350mm. Slice thickness was 0.5 mm gap and a total of 18 slices
were obtained. Water markers were used to visualize the position of
the knee coil on the sagittal images (Figure 7). The distance between
an anatomical landmark on the knee and the center of axial slice 11
was recorded and that image with the distance marked was saved to
ensure reproducible positioning for the subsequent measurement
(Figure 7). Then, axial T1 images were taken, using the knee coil and a
TR of 500 ms, a TE of 15ms, and a FOV of 150mm. Slice thickness was
0.5 mm and a total of 21 axial slices were obtained.
Figure 7: Sagittal magnetic resonance images of calf muscle
48

In both images the right calf is shown: on the right of a 31 year old obese male, while on the left of a 42 year old lean female. The distance between an anatomical landmark on the knee and the center of axial slice 11 is clearly marked on each image. The water markers used to visualize the position of the knee coil are visible on the left image.
The axial images were used to choose the position of the volume
of interest, known as voxel, on the TA and SOL muscles of the calf
(Figure 8). Voxel positions were determined in order to avoid vascular
structures and gross adipose tissue deposits and to make sure that the
muscle fibers were consistently oriented along the magnetic field.
Single voxel magnetic resonance spectroscopy (MRS) was performed
on both muscles, using the Point-Resolved Spectroscopy (PRESS)
sequence, a voxel of 15 x 15 x 15 mm3, 128 acquisitions, TR=3s,
TE=30ms, and water suppression. The same voxel was subsequently
used to obtain 8 acquisitions, using TR=10s, TE=25ms, and no water
suppression. The images of the voxel position of both muscles were
saved to ensure reproducible positioning for the subsequent
measurement.
49
Figure 8: Axial magnetic resonance image of the calf of a 34-
year-old male volunteer
Regions of interest for evaluation of the muscular lipid content are drawn in tibialis anterioris (TA), tibialis posterioris (TP), soleus (SOL), gastrocnemius medialis (GM) and lateralis (GL), and peroneus longus and brevis (PLB). BM stands for tibial bone marrow. Source: Machann et al, 2003
When the muscle MRS was completed, the subjects were
switched to head first in the MRI scanner in the supine position.
Initially, a scout was performed and axial T2-weighted spin-echo
images were obtained from the torso, using the body coil and a TR of
5.9 ms and a TE of 3.1 ms. Then, a T2 W scan was performed in the
axial, sagittal and coronal planes in order to achieve proper
positioning of the voxel in the liver. For this scan, the body coil was
used and a TE of 90 ms and a TR of 3593ms. The images had a slice
and gap thickness of 11mm. The position of the voxel was chosen to
avoid major vascular structures in the liver. Single voxel MRS was
performed the liver, using the PRESS sequence, a voxel of 60 x 50 x
50

60 mm3 (A-P=60mm, F-H=50mm, and R-L=60mm), 8 acquisitions,
TR=10ms, TE=30ms, and no water suppression (Figure 9).
51

Figure 9: Axial, coronal, and sagittal magnetic resonance
images of the liver
The axial image is shown on the left, the coronal is on the center, and the sagittal is
on the right.
4.4.3 Euglycemic-Hyperinsulinemic Clamp Procedure
Obese subjects were admitted to the Johns Hopkins General
Clinical Research Center (GCRC) the evening prior to the euglycemic-
hyperinsulinemic clamp procedure. The clamp was performed the
following morning after an overnight fast. The clamp is considered the
gold standard for the measurement of insulin sensitivity (Radziuk,
2000). It is performed by infusing insulin in order to raise the plasma
insulin concentration and maintain it at high levels, while keeping the
plasma glucose concentration at basal levels by variable glucose
infusion (DeFronzo et al, 1979). Under these steady state conditions,
the glucose infusion rate is the same as the rate of glucose uptake
from the body tissues, thus providing a means of calculating the
sensitivity of the body tissues to exogenous insulin (DeFronzo et al,
1979).
52

Two flexible catheters were inserted in the subject: a 2’’ 18G
flexible catheter was placed in a vein of the forearm for infusion of
insulin and glucose, and a 1.5’’ 20G catheter was placed in a dorsal
vein of the ipsilateral hand for blood sampling. Both lines were kept
patent with a slow saline infusion until the start of the insulin infusion.
The hand was then placed in a warming box at 500C for the duration
of the procedure. The warming box was used for “arterialization” of
the hand line.
After obtaining baseline blood samples and determining the
baseline glucose value, the insulin clamp procedure started. The
insulin infusion was manually changed, while the glucose infusion was
calculated by the CLAMP software, developed by Dr. Dariush Elahi.
At time zero, the insulin infusion started at a high rate and was
manually decreased every two minutes for the first ten minutes,
remaining constant thereafter at a rate of 40 mU/m2 of surface area
per minute. Four minutes after the start of the insulin infusion, a
variable-rate infusion of 20% dextrose started and was adjusted every
5 minutes based on the plasma glucose level. During the insulin
clamp, circulating insulin levels where acutely elevated and blood
glucose concentration was maintained within 10% of baseline levels
(baseline glucose value 5%). Blood samples for insulin analysis
were obtained at baseline and at 30, 60, 90, 100, 110, and 120
minutes after the start of the insulin infusion. Blood samples for
53

glucose analysis were obtained at baseline and every five minutes
thereafter.
The glucose disposal rate, a measure of insulin sensitivity, was
calculated by the average of the glucose infusion rates during the last
30 minutes of the infusion. Upon completion of sampling at 120
minutes, the insulin infusion was discontinued, and the glucose
infusion continued over a 10-20 minute period, while blood glucose
was still being monitored. During this period, subjects were offered
sweetened fruit juice. After the subjects were given lunch and their
blood glucose value was at normal post-prandial levels, they were
discharged.
4.5 Dietary Intervention
After the obese subjects have completed the initial screening
and the baseline tests (IMCL and IHL determination by proton MRS
and insulin sensitivity measurement by the clamp), they were referred
to the Johns Hopkins Nutrition & Health Research Center. An
experienced research associate assessed the participants and
designed the weight loss program for each one at an energy intake
designed to achieve a 1-2 lbs weight loss per week. The Mifflin-St Jeor
prediction equation was used to estimate each participant’s resting
metabolic rate (RMR), based on height, weight, age and gender
(Mifflin et al, 1990). This equation was derived from a sample of 251
men and 247 women, aged 19 – 78 years. This study population
54

included 264 normal weight and 234 obese individuals, and RMR
calculations were compared to measured values from indirect
calorimetry, and the predictive value of this equation was very high
compared to other RMR prediction equation, like the Harris-Benedict,
the Cunningham and the Owen equations (Harris and Benedict, 1919;
Cunningham, 1980; Owen et al, 1986; Owen et al, 1987).
First, the Ideal Body Weight (IBW) was calculated, based on the
individual’s gender:
Men: IBW = 106 lbs for the first 5 feet of height + 6 lbs for each
additional inch
Women: IBW = 119 lbs for the first 5 feet of height + 3 lbs for each
additional inch
The Adjusted Body Weight (ABW) was then calculated:
ABW = (CBW – IBW) x 0.25 + IBW, where CBW is the Current Body
Weight in kg and IBW is in kg.
RMR (in kilocalories / day) was calculated, using the following
equation:
Men: RMR = (10 x ABW in kg) + (6.25 x Height in cm) – (5 x Age) + 5
Women: RMR = (10 x ABW in kg) + (6.25 x Height in cm) – (5 x Age)
− 161
After the calculation of each participant’s RMR, each
individual’s physical activity level (PAL) was assessed, based on self-
reported physical activity. For example, a value of 1.3 was assigned to
55

sedentary individuals, while values of 1.4, 1.5, 1.6 or 1.7 were
assigned respectively to individuals who averaged 15, 30, 45 or 60
minutes of exercise daily. This factor was multiplied by the calculated
RMR to provide the calorie consumption necessary to achieve weight
maintenance. The resulting number was multiplied by 0.75 to provide
a 25% daily caloric deficit. A personalized sample menu was created
for each participant, in which meals were prepared from self-selected
whole foods and commercially available Medifast supplements. The
macronutrient diet composition was approximately 50-60%
carbohydrate, 25-30% fat and 15-20% protein.
Weekly or biweekly personal meetings were scheduled with the
research associate throughout the weight loss phase of the study.
During those meetings, participants were weighed and their progress
was evaluated. Nutritional counseling and food supplements were
provided. Furthermore, physical activity was assessed and the caloric
consumption was modified if necessary to adjust for any changes in
physical activity and lifestyle factors. Periodically, food records were
obtained to assess adherence to the diet regimen.
4.6 Follow-up measurements
When the participants reached their weight goal, they repeated
the initial screening and baseline tests: anthropometric
measurements, blood pressure, pulse, ECG, fasting blood draw, OGTT,
body composition measurement by DEXA, measurement of IMCL and
56

IHL by MRS, insulin sensitivity measurement by the clamp. An outline
of the study methodology is shown in Table 1.
57

Table 1: Study methodology
Obese Lean1. Screening
Fasting blood tests OGTT ECG DEXA Anthropometric
measurements Questionnaires
2. Baseline Measurements MRS Clamp
3. Weight Loss Weekly or biweekly
nutritional counseling & weighing
4. Follow-up Fasting blood tests OGTT ECG DEXA Anthropometric
measurements MRS Clamp
1. Screening Fasting blood tests OGTT ECG DEXA Anthropometric
measurements Questionnaires
2. Baseline Measurements MRS
OGTT = Oral Glucose Tolerance Test, ECG = Electrocardiogram, MRS = Proton Nuclear Magnetic Resonance Spectroscopy, Clamp = Euglycemic-Hyperinsulinemic Clamp, and DEXA = Dual-Energy X-ray Absorptiometry.
4.7 Laboratory Procedures
Complete blood count was determined by optic and flow
cytometry automated cell count, using a SYSMEX XE (Sysmex, Kobe,
Japan). TSH and insulin were determined by Enzyme Immunoassay
(EIA), using a TOSOH 1800 (Tosoh Corporation, Tokyo, Japan).
Albumin was determined by the Bromo Cresol Green dye binding
58

method, AST, ALT, TG, HDL, LDL, TCho, were determined by
enzymatic methods and glucose (OGTT testing) was determined by
the hexokinase method. All these tests were performed using the
Roche Modular (Roche Diagnostics, Basel, Switzerland). FFA and
leptin testing was performed at the Nichols Institute. FFA were
quantified using an enzymatic-spectrophotometric method and leptin
and was quantified by Radioimmunoassay (RIA). HbA1c was
quantified by High-Performance Liquid Chromatography by Bio-Rad
Variant II (Bio-Rad, Hercules, California). Adiponectin testing was
performed by Enzyme-Linked Immunosorbent Assay (ELISA), using a
Linco Research Kit (Linco Research Inc., St. Charles, Missouri).
4.8 Insulin Sensitivity Assessments
Homeostasis model assessment (HOMA) was proposed about 15
years ago and has been used systematically as an inexpensive and
simple technique of estimating insulin sensitivity from a mathematical
modeling of fasting plasma glucose (FPG) and fasting plasma insulin
(FPI) levels:
HOMA values increase with a decrease in insulin sensitivity.
Bonora et al (2000) recently validated the HOMA technique, and
determined the intra-individual CV values for HOMA scores to be
9.4% for nondiabetic and 7.8% for diabetic individuals. Furthermore,
59

the inter-individual CV values were 13.8% and 11.2% in five
consecutive day measurements in a nondiabetic and in a diabetic
individual respectively. The HOMA index has been used in various
clinical and epidemiological studies (Haffner et al, 2000; Hanley et al,
2002; Rocha et al; 2005; Haugen et al, 2005; Sinha et al, 2005; Emoto
et al, 1999; Haffner et al, 1996; Katsuki et al, 2001; Shoji et al, 2001;
Unwin et al, 2002). In particular the log transformed value of HOMA
was shown to have high correlation (r = – 0.801) with insulin
sensitivity values from the clamp (Bonora et al, 2000).
Furthermore, two additional indices of insulin sensitivity were
calculated from the 2-hour OGTT: Area under the Curve (AUC) for
Insulin (AUCI) and for Glucose (AUCG). The AUCI measures insulin
response after a glucose challenge and the AUCG measures post-
prandial glucose disposal (Kim et al, 2004; Ciampelli et al, 2005; Mori
et al, 2005; Tschritter et al, 2003). Those two indices were calculated
using the trapezoid rule. According to this rule, the areas of the
trapezoids formed in the graph of glucose or insulin values versus
time are calculated using the following formula for the trapezoid area:
Consequently, the AUC for both insulin and glucose are calculated as
the sum of the individual trapezoids over the 120 minutes of the
OGTT.
60

During the clamp, glucose was determined by the glucose
oxidase method, using a Beckman Glucose Analyzer 2 (Beckman
Coulter, Fullerton, California). Insulin was determined by Enzyme
Immunoassay (EIA), using a TOSOH 1800 (Tosoh Corporation, Tokyo,
Japan).
The following values were calculated from the clamp (DeFronzo
et al, 1979):
Corrected glucose infusion (in mg/kg/min) = Total glucose infusion
during the last 30 minutes of the clamp – space correction
Space correction = (PG120min – PG90min) / 0.063 (where PG90min and
PG120min are the plasma glucose values at 90 and 120 minutes of the
clamp respectively)
Glucose utilization M (in µmol x kg-1 x min-1) = Corrected glucose
infusion x 180 g/mol (glucose molecular weight) x 1000 µg/mg
Glucose utilization ML (in µmol x kgLBM -1 x min-1) = Glucose
utilization (in µmol x kg-1 x min-1) x kg of body weight / kg LBM
Insulin Sensitivity MI (in µmol x kg-1 x min-1/pmol/l) = [Glucose
utilization (in µmol x kg-1 x min-1)]/[average insulin during the last 30
minutes of clamp (in µU/ml) x 6.945 (pmol/L)/(µU/ml)]
Insulin Sensitivity MLI (in µmol x kgLBM -1 x min-1/pmol/l) =
Insulin Sensitivity (in µmol x kg-1 x min-1/pmol/l) x kg of body weight /
kg LBM
61

4.9 Proton Magnetic Resonance Spectroscopy Data Processing
Spectral data were processed using the Magnetic Resonance
User Interface software (jMRUI, version 2.2) developed by A. van den
Boogaart (Katholieke Universiteit Leuven, Leuven, Belgium). After
Fourier transformation and manual phasing of the spectra, the water
peak was identified and nominated 4.75 parts per million (ppm).
For the water-suppressed signal, the signal amplitude was
obtained in absolute units for each resonance by using AMARES, a
non-linear least squares quantification algorithm (Vanhamme et al,
1997; Naressi et al, 2001). Prior knowledge was used to achieve
reproducibility in data processing (Schick et al, 1993; Rico-Sanz et al,
1998; Rico-Sanz et al, 1999). The line widths of IMCL and EMCL–
(CH2)n resonances as well as for the IMCL and EMCL–CH3 resonances
were constrained to be the same with a –CH3 : (–CH2–)n factor ratio of
1.2:1 (e.g. line width IMCL– CH3 = line width EMCL–CH3, line width
IMCL– (CH2)n = line width EMCL– (CH2)n and line width IMCL/EMCL–
(CH2)n: line width IMCL/EMCL– (CH3)=1.2 (Rico-Sanz et al, 1998).
Soft constraints were used for the IMCL, EMCL, total creatine (Cr),
trimethyl amines (TMA) and water resonances (IMCL-CH3: 0.8 – 1.0,
EMCL-CH3: 1.0 – 1.2, IMCL-CH2: 1.2 – 1.4, EMCL-CH2: 1.4 – 1.6, Cr:
3.0 – 3.1, TMA: 3.2 – 3.3, water: 4.7 – 4.8, all in ppm). The resonances
were fitted assuming a Gaussian line shape for IMCL and EMCL, and
a Lorenzian line shape for all other resonances. The zero-order was
62

estimated by AMARES and the first order phase correction manually
estimated and fixed.
For the unsuppressed water signal, the water peak was
identified and nominated 4.75 ppm. The Cadzow enhancement
procedure was used to filter all resonances, except the water at
4.75ppm. Then, the water resonance was fitted to a Lorenzian line
shape, using the Hankel Lanczos Squares Singular Values
Decomposition (HLSVD) algorithm. For IMCL and EMCL
quantification, the –CH2 peaks were used, and were expressed as a
ratio to the unsuppressed water resonance.
The values obtained from the spectra were corrected for
longitudinal T1 and transverse T2 relaxation effects, using values from
the literature (Table 2 ; Schick et al, 1993). The signal equation for a
repeated spin echo sequence as a function of TR and TE is:
S = k ( 1 – e – TR/T1 ) e – TE/T2
where S is the amplitude of the signal after being Fourier transformed
(S), k is a proportionality constant and is the density of spins in the
sample (Hornak, 2005).
Table 2: Spectral parameters
TR TE T1 T2
IMCL 3000 30 280 85EMCL 3000 30 270 75Water 10,000 25 1100 50
63

All values are in milliseconds (ms). TR: Repetition time; TE: Echo time. T1 and T2 values are obtained from Schick et al (1993).
64

The T1 and T2 correction values of the signal amplitude are the
following:
SIMCL = 0.702603 * k
SEMCL = 0.670310028 * k
Swater = 0.606462312 * k
The obtained signal amplitude for each peak (IMCL, EMCL, and
water) was divided by the corresponding factors, to correct for T1 and
T2 relaxation effects.
In the liver spectra, presence of a peak at 0.8 – 1.6 ppm,
indicated the presence of abnormal liver fat and patient was then
diagnosed with fatty liver.
4.10 Statistical Analysis
Data analysis focused on the mean differences in each
anthropometric and metabolic variable in the lean and the obese
group, using unpaired T-test. Spearman Rank correlation coefficients
were calculated to assess the cross-sectional associations between
variables. Multiple linear regression was performed to establish the
variables that were more accurate at predicting insulin resistance
(IR). Several models were tested including the following:
IR = β0 + β1 * age + β2 * IMCL
IR = β0 + β1 * ΒΜΙ + β2 * IMCL
65

IR = β0 + β1 * leptin + β2 * IMCL
IR = β0 + β1 * WHR + β2 * IMCL
IR = β0 + β1 * serum TG + β2 * IMCL
IR = β0 + β1 * TBF + β2 * IMCL
Furthermore, mean differences were examined in anthropometric
and metabolic variables in the obese group at baseline and after
weight loss, using paired non-parametric analysis. The differences
between baseline and post-treatment measurements (Δ) of each
variable were examined for associations, using Spearman Rank
correlation coefficients.
All data is presented as mean standard error of the mean (SE).
Differences were regarded as statistically significant if p < 0.05.
Possible outliers and inconsistent values were examined. Graphs were
also used to determine associations between variables in exploratory
data analysis and linear regression. All data analysis was performed
using Stata (Version 8.1, Stata Corporation, College Station, TX).
66

5 RESULTS
5.1 Subject Characteristics
A total of 22 obese subjects and 19 lean controls were initially
recruited for this study and completed the baseline measurements. All
subjects were in good health on admission and throughout the course
of the study. Only two obese subjects had slightly low hemoglobin
levels and were instructed to take an iron supplement during the
weight loss phase. Thirteen of the obese subjects had moderately
elevated total cholesterol levels.
There were no significant medical problems during the study,
except for two incidents. During one of the baseline clamps, there was
infiltration of the infusion catheter in the forearm of the participant,
which caused mild swelling of the tissue. The participant was kept for
a period of two hours for observation, while glucose was monitored
carefully. The participant was discharged without any complications.
Another obese individual lost consciousness at the screening visit
after the first blood draw for approximately one minute. Upon
regaining consciousness, the individual felt mildly disoriented and
nauseated. She admitted to having prior vasovagal episodes with
blood draws and minor surgery. Her blood pressure and pulse were
monitored hourly for more than three hours. Upon refusal to obtain
further treatment and after stabilization of her vital signs, she was
67

discharged. As a result, this individual was not enrolled in the study,
but no further complications were reported.
5.2 Baseline Comparisons
5.2.1 Anthropometric Data and Fasting Blood Tests
The baseline characteristics of the two groups are presented in
Table 3. The mean age of the obese groups was 40.91 2.07 years
(mean SE) with a mean BMI of 35.05 0.57 kg/m2. The mean age of
the lean group was 31.89 1.59 years with a mean BMI of 21.26
0.39 kg/m2. The mean age of the obese group was statistically
significantly higher than the lean group (p=0.001).
Table 3: Baseline anthropometric characteristics of lean and
obese
Lean Obese p value Lean vs. Obesen 19 22Age (years) 31.89 1.59 40.91 2.07 0.001Body weight (kg)61.32 2.60 100.39 2.51 < 0.0001BMI (kg/m2) 21.26 0.39 35.05 0.57 < 0.0001TBF (%) 23.39 1.44 39.37 1.41 < 0.0001LBM (kg) 43.16 2.18 56.08 2.12 0.0001WHR 0.83 0.013 0.93 0.016 < 0.0001Data are means SE. The two sample t-test was used. NS: No statistical significance, p> 0.1; BMI: Body Mass Index; TBF: Total Body Fat by Dual-Energy X-Ray Absorptiometry; LBM: Lean Body Mass; WHR: Waist-to-Hip Ratio.
68

Both groups differed significantly in the majority of plasma
metabolite levels, as can be expected in these two populations (Tables
4 & 5). Almost all blood lipid metabolites, including total cholesterol
(TCho), low-density lipoprotein (LDL), serum triglycerides (TG), and
free fatty acids (FFA) were statistically significantly higher in the
obese group compared to the control group (Table 4). High-density
lipoprotein (HDL) was not different in the two groups.
69

Table 4: Baseline plasma lipid levels of lean and obese
Lean Obese p value Lean vs. Obesen 19 22TCho (mg/dl) 162.89 6.41 206.32 6.56 < 0.0001HDL (mg/dl) 65.63 3.39 65.55 3.29 NSLDL (mg/dl) 83.21 4.29 117.71 5.25 < 0.0001TG (mg/dl) 69.74 7.70 115.91 18.02 < 0.0001FFA (mg/dl) 0.38 0.29 0.59 0.048 < 0.0001Data are means SE. The two sample t-test was used, except for IGT data, where the 2 test was used. NS: No statistical significance, p> 0.1; TCho: Total Cholesterol; HDL: High-Density Lipoprotein; LDL: Low-Density Lipoprotein; TG: Serum Triglyceride; FFA: Free Fatty Acids.
Almost all indices of insulin resistance and glucose tolerance,
including FPI, HOMA, log transformed value of AUCI (lnAUCI), log
transformed value of AUCG (lnAUCG), were significantly higher in the
obese group compared to the control group (Table 5). In the obese
group, 7 subjects had IGT (31.8%), as defined by the Expert
Committee on the diagnosis and classification of diabetes mellitus
(1997). However, only 1 subject from the lean group had IGT (5.3%).
Both 2-hour post-OGTT plasma insulin and glucose values were
significantly higher in the obese compared to the control group.
Adiponectin levels, which have been linked to insulin sensitivity, were
statistically significantly lower in the obese group, as has been
previously observed in other studies (Fu et al, 2005; Bullo et al, 2005;
Fasshauer et al, 2004). Furthermore, leptin values were statistically
significantly higher in the obese than the control group. However,
70

fasting plasma glucose (FPG) and glycated hemoglobin (HbA1c),
which are markers of glucose tolerance and mean glycemia for the
previous 3 months respectively, were not different between the two
groups.
71

Table 5: Baseline plasma hormone levels, insulin sensitivity and
glucose metabolism indices of lean and obese
Lean Obese p value Lean vs. Obesen 19 22FPG (mg/dl) 85.11 1.40 87.32 1.48 NSFPI (µU/ml) 4.77 0.56 9.52 1.22 0.001HbA1c (%) 5.22 0.071 5.34 0.095 NSHOMA 1.01 0.13 1.89 0.17 0.0002lnAUCI 8.35 0.082 8.75 0.11 0.005lnAUCG 9.44 0.036 9.61 0.041 0.0032-hour PG 95.89 4.52 121.91 4.61 0.0062-hour PI 42.92 4.61 69.39 10.18 0.02IGT 1/19 7/22 0.03Leptin (ng/ml) 7.68 0.93 25.13 2.54 < 0.0001Adiponectin (µg/ml)23.96 1.64 18.35 1.30 0.03Data are means SE, except for IGT data, which is reported as subjects with IGT/total subjects. The two sample t-test was used, except for IGT data, where the 2 test was used. NS: No statistical significance, p> 0.1; FPG: Fasting Plasma Glucose; FPI: Fasting Plasma Insulin; HOMA: Homeostasis Model Assessment Index; lnAUCI: log transformed Area under the Curve of Insulin in a 2 hour Oral Glucose Tolerance Test (OGTT); lnAUCG: log transformed Area under the Curve of Glucose in a 2 hour OGTT; IGT: Impaired Glucose Tolerance defined as 2 hour post-OGTT glucose 140 – 200 mg/dl; 2-hour PG: 2 hour post-OGTT plasma glucose; 2-hour PI: 2 hour post-OGTT plasma insulin; HbA1c: Glycated Hemoglobin.
5.2.2 Intracellular Lipid Accumulation
The obese had 36.6% higher IMCL levels in the SOL and 28.8%
higher IMCL levels in the TA than the lean (Table 6). The difference in
IMCL levels in the SOL muscle was highly statistically significant
(p=0.001), while the difference in IMCL in the TA muscle was
marginally statistically significant (p=0.06). EMCL of the SOL and TA
muscles were not different in the two groups (Table 6). These results
72

are consistent with other studies conducted on obese compared to
lean individuals (Sinha et al, 2002; He et al, 2004).
Repeat measurements of eight subjects (3 lean and 5 obese)
were taken, after voxel repositioning during the same visit, to
determine the CV for the MRS procedure. The combined CV for IMCL
in the TA and SOL muscles was 6.2% and for the EMCL in the TA and
SOL muscles was 18.6%. These values are consistent with those
obtained from other investigators (Rico-Sanz et al, 1998; Brechtel et
al 1999; Torriani et al, 2005; Szczepaniak et al, 1999).
From the 20 obese subjects with liver data, 16 had abnormal
IHL, or 80% of that group (Table 6). However from the 19 lean
individuals, only one had abnormal IHL (5.3%). The obese group had a
significantly higher proportion of people with abnormal IHL compared
to the lean group (p< 0.0001). Selected muscle and liver magnetic
resonance images and corresponding spectra are shown for control
and lean participants in Figures 10 – 15.
Table 6: Baseline IMCL, EMCL, and IHL by proton magnetic
resonance spectroscopy of lean and obese
Lean Obese p value Lean vs. Obesen 19 22IMCL-TA 0.408 0.049 0.567 0.068 0.06EMCL-TA 0.747 0.18 1.27 0.28 NSIMCL-SOL 1.74 0.10 2.73 0.25 0.001
73

EMCL-SOL 1.73 0.19 2.46 0.238 0.02IHL 1/19 16/20 < 0.0001Data are means SE, except IHL data, which is reported as presence or absence of abnormal IHL (subjects with presence of abnormal IHL/total subjects with IHL data). The two sample t-test was used. NS: No statistical significance, p> 0.1; IMCL-TA: Intramyocellular lipid in the tibialis anterioris muscle; EMCL-TA: Extramyocellular lipid in the tibialis anterioris muscle; IMCL-SOL: Intramyocellular lipid in the soleus muscle; EMCL-SOL: Extramyocellular lipid in the soleus muscle; IHL: Intrahepatic Lipid. IMCL and EMCL data are presented in arbitrary units as a ratio of the corresponding peaks over the unsuppressed water peak x 100, corrected for T1 and T2 relaxation effects.Figure 10: Axial magnetic resonance image and TA proton
spectra of the right calf muscle of a 30-year-old female lean
subject
In both processed spectra, the bottom line labeled ‘original’ represents the original data, the second from the bottom line labeled ‘estimate’ represents the estimated
5
74

spectrum, the third from the bottom line labeled ‘individual components’ represents the individual peaks, and the top line labeled ‘residue’ represents the residual spectrum obtained by subtracting the original spectrum from the estimate. The left set of spectra show the tibialis anterioris (TA) suppressed water spectra. In the line labeled ‘individual components,’ peaks 1, 2, 3, and 4 represent the intramyocellular methyl, extramyocellular methyl, intramyocellular methylene, and extramyocellular peaks respectively. Peak 5 is identified as water, peak 6 as a mixture of allylic methylene compounds and peak 7 as the total creatine. The right set of spectra show the corresponding TA unsuppressed water spectra. In the line labeled ‘individual components,’ a single water peak is observed at 4.7 – 4.8 ppm.
75

Figure 11: Axial magnetic resonance image and SOL proton
spectra of the right calf muscle of a 43-year-old male lean
subject
In both processed spectra, the bottom line labeled ‘original’ represents the original data, the second from the bottom line labeled ‘estimate’ represents the estimated spectrum, the third from the bottom line labeled ‘individual components’ represents the individual peaks, and the top line labeled ‘residue’ represents the residual spectrum obtained by subtracting the original spectrum from the estimate. The left set of spectra show the soleus (SOL) suppressed water spectra. In the line labeled ‘individual components,’ peaks 1, 2, 3, and 4 represent the intramyocellular methyl, extramyocellular methyl, intramyocellular methylene, and extramyocellular peaks respectively. Peak 10 is identified as the water peak, peak 6 as a mixture of allylic methylene compounds, peak 7 as the total creatine, and peak 8 as the trimethyl amines. The right set of spectra show the corresponding SOL unsuppressed water spectra. In the line labeled ‘individual components,’ a single water peak is observed at 4.7 – 4.8 ppm.
76

Figure 12: Axial magnetic resonance image and TA proton
spectra of the right calf muscle of a 39-year-old female obese
subject
In both processed spectra, the bottom line labeled ‘original’ represents the original data, the second from the bottom line labeled ‘estimate’ represents the estimated spectrum, the third from the bottom line labeled ‘individual components’ represents the individual peaks, and the top line labeled ‘residue’ represents the residual spectrum obtained by subtracting the original spectrum from the estimate. The left set of spectra show the tibialis anterioris (TA) suppressed water spectra. In the line labeled ‘individual components,’ peaks 1, 2, 3, and 4 represent the intramyocellular methyl, extramyocellular methyl, intramyocellular methylene, and extramyocellular peaks respectively. Peak 10 is identified as the water peak, peak 7 as a mixture of allylic methylene compounds and peak 8 as the total creatine. The right set of spectra show the corresponding TA unsuppressed water spectra. In the line labeled ‘individual components,’ a single water peak is observed at 4.7 – 4.8 ppm.
4
77

Figure 13: Axial magnetic resonance image and SOL proton
spectra of the right calf muscle of a 46-year-old male obese
subject
In both processed spectra, the bottom line labeled ‘original’ represents the original data, the second from the bottom line labeled ‘estimate’ represents the estimated spectrum, the third from the bottom line labeled ‘individual components’ represents the individual peaks, and the top line labeled ‘residue’ represents the residual spectrum obtained by subtracting the original spectrum from the estimate. The left set of spectra show the soleus (SOL) suppressed water spectra. In the line labeled ‘individual components,’ peaks 1, 2, 3, and 4 represent the intramyocellular methyl, extramyocellular methyl, intramyocellular methylene, and extramyocellular peaks respectively. Peak 9 is identified as the water peak, peak 5 as a mixture of allylic methylene compounds, peak 6 as the total creatine, and peak 7 as the trimethyl amines. The right set of spectra show the corresponding SOL unsuppressed water spectra. In the line labeled ‘individual components,’ a single water peak is observed at 4.7 – 4.8 ppm.
78

Figure 14: Magnetic resonance images and corresponding
proton spectrum of the liver of a 26-year-old female lean
subject
On the liver spectrum, the water peak is shown at 4.7 – 4.8 parts per million (ppm), while no liver fat is observed at 0.8 – 1.6 ppm.
Figure 15: Magnetic resonance images and corresponding
proton spectrum of the liver of a 35-year-old female obese
subject
On the liver spectrum, the water peak is shown at 4.7 – 4.8 parts per million (ppm) and the liver fat peak at 0.8 – 1.6 ppm.
79

5.2.3 Euglycemic-Hyperinsulinemic Clamp
The clamp procedure was implemented and carried out at the
inpatient unit of the General Clinical Research Center (GCRC) in the
obese participants only. This procedure, although conceptually
simple, had many technical complications. The greatest challenge was
to maintain a blood sampling line open for the two hours period of the
clamp. Another difficulty was to maintain a constant flow of both
insulin and glucose through the intravenous catheters and connectors
(3-way stopcocks). Furthermore, another complex issue was the
adjustment of the glucose infusion rate in such a way that a steady
blood glucose level was maintained for at least the last 30 minutes of
the clamp. As a result, several of the clamp procedures cannot be
used in this data analysis because of problems with insulin and
glucose catheters or the blood sampling line. Two individuals were not
able to undergo the procedure due to access problems of the blood
sampling line. From the remaining baseline clamps, data from 15 of
them were used.
The mean glucose utilization of the obese group in reference to
total body mass was 18.14 1.85 µmol x kg-1 x min-1 and in reference
to LBM was 31.65 3.39 µmol x kgLBM -1 x min-1 (Table 7). The mean
insulin sensitivity in reference to total body mass was 0.0442
0.0059 µmol x kg-1 x min-1/pmol/l and in reference to LBM was 0.0767
0.010 µmol x kgLBM -1 x min-1/pmol/l (Table 7). The mean glucose
80

infusion rate and blood glucose concentration during the 2-hour clamp
for 15 obese individuals is shown in Figure 16. The last 30 minutes of
the clamp were used for measuring glucose utilization and insulin
sensitivity.
81

Table 7: Baseline euglycemic-hyperinsulinemic clamp data of
obese subjects
Clamp data n 15M (µmol x kg-1 x min-1) 18.14 1.85ML (µmol x kgLBM -1 x min-1) 31.65 3.39MI (µmol x kg-1 x min-1/pmol/l) 0.0442 0.0059MLI (µmol x kgLBM -1 x min-1/pmol/l) 0.0767 0.010Data are means SE. M is glucose utilization divided by kg of body total mass, while ML is divided by lean body mass; MI is insulin sensitivity divided by kg of total body mass, while MLI is divided by lean body mass.
Figure 15: Plasma glucose levels and infusion rate during the
baseline euglycemic-hyperinsulinemic clamp of obese subjects
Upper graph is plasma glucose in mg/dl and lower graph is glucose infusion rate mg/kg/min. Values are expressed as mean SE. Number of subjects is 15.
0102030405060708090
100
0 10 20 30 40 50 60 70 80 90 100 110 120Time (min)
Glucose (mg/dl)
0
2
4
6
8
10
Glucose Infusion (mg/kg/min)
82

The values obtained for glucose utilization (M, ML) and insulin
sensitivity (MI, MLI) from the clamp were correlated with
corresponding indices from the glucose tolerance test, including FPG,
FPI, HOMA, lnAUCI, and lnAUCG, using the Spearman Rank
correlation coefficient r. This type of correlation coefficient was used
in this dataset because it is fairly insensitive to outliers and non-
normal observations. There was a strong negative correlation of
HOMA with insulin sensitivity indices from the clamp (MI: r=–0.74,
p=0.002; MLI: r=– 0.70, p=0.003). The HOMA index was therefore
chosen to make comparisons of insulin sensitivity between the obese
and lean groups.
The clamp is a sensitive method for evaluating insulin sensitivity
in vivo and has been widely used in small clinical studies. HOMA is a
good estimate of basal insulin resistance and has been used in large
epidemiological studies, because it depicts fasting glucose and insulin
conditions. However, no definite conclusions can be drawn about
insulin secretion, distribution, and degradation.
5.2.4 Correlations
The Spearman Rank correlation coefficient r, was calculated for
both the lean and the obese groups to determine linear associations
between measures of insulin sensitivity, blood metabolites,
anthropometric variables, and intracellular lipids.
83

Moderate, but statistically significant correlations were found
between HOMA and IMCL in the SOL muscle (Figure 17; r=0.55,
p=0.0002), BMI (r=0.67, p< 0.0001), TBF (r=0.56, p=0.0001), and
leptin (r=0.55, p=0.0002). Weak and marginally statistically
significant correlation was found between HOMA and IMCL in the TA
muscle (Figure 18; r=0.28, p=0.07).
84

Figure 17: Correlation of HOMA versus IMCL in the SOL
muscle for lean and obese
01
23
4H
OM
A
1 2 3 4 5IMCL in the SOL muscle (a.u.)
Correlation of IMCL in the SOL muscle vs. HOMA
Lean are represented by squares and obese are represented by triangles. Spearman Rank correlation coefficient, r=0.55, p=0.0002; SOL: Soleus; HOMA: Homeostasis Model Assessment Index; IMCL: Intramyocellular lipid by proton magnetic resonance spectroscopy. IMCL data are presented in arbitrary units as a ratio of the corresponding peaks over the unsuppressed water peak x 100, corrected for T1 and T2 relaxation effects.
Figure 18: Correlation of HOMA versus IMCL in the TA muscle
for lean and obese
01
23
4H
OM
A
0 .5 1 1.5IMCL in the TA muscle (a.u.)
Correlation of IMCL in the TA muscle vs. HOMA
85

Lean are represented by squares and obese are represented by triangles. Spearman Rank correlation coefficient, r=0.28, p=0.07; TA: tibialis anterioris; HOMA: Homeostasis Model Assessment Index; IMCL: Intramyocellular lipid by proton magnetic resonance spectroscopy. IMCL data are presented in arbitrary units as a ratio of the corresponding peaks over the unsuppressed water peak x 100, corrected for T1 and T2 relaxation effects.
Adiponectin was negatively correlated with BMI (r=– 0.47,
p=0.002), lnAUCG (r=– 0.45, p=0.003), and WHR (r=– 0.40,
p=0.002). There was a moderate positive correlation between
adiponectin and HDL (r=0.43, p=0.005).
Moderate but statistically significant correlations were found
between lnAUCG and FFA (r=0.60, p< 0.0001), serum TG (r=0.43,
p=0.005), WHR (r=0.45, p=0.008), and IMCL in the SOL muscle
(Figure 19; r=0.41, p=0.008). A positive correlation was also found
between lnAUCG and IMCL in the TA muscle (Figure 20; r=0.50,
p=0.0009). This association was even stronger for the obese group
(r=0.66, p=0.0009). The 2-hour plasma glucose (PG) value during the
OGTT was positively correlated with FFA (r=0.58, p=0.0001), IMCL in
the SOL muscle (Figure 21; r=0.51, p=0.0006), and IMCL in the TA
muscle (Figure 22; r=0.50, p=0.0008). The correlation of 2-hour PG
with IMCL in the TA muscle was even stronger in the obese group
(r=0.65, p=0.001).
Figure 19: Correlation of lnAUCG versus IMCL in the SOL
muscle for lean and obese
86

9.29.4
9.69.8
10ln
AUCG
1 2 3 4 5IMCL in the SOL muscle (a.u.)
Correlation of lnAUCG vs. IMCL in the SOL muscle
Lean are represented by squares and obese are represented by triangles. Spearman Rank correlation coefficient, r=0.41, p=0.008; SOL: soleus lnAUCG: log transformed values of Area under the Curve for Glucose in a 2 hour Oral Glucose Tolerance Test; IMCL: Intramyocellular lipid by proton magnetic resonance spectroscopy. IMCL data are presented in arbitrary units as a ratio of the corresponding peaks over the unsuppressed water peak x 100, corrected for T1 and T2 relaxation effects. Figure 20: Correlation of lnAUCG versus IMCL in the TA muscle
for lean and obese
9.29.4
9.69.8
10ln
AUCG
0 .5 1 1.5IMCL in the TA muscle (a.u.)
Correlation of lnAUCG vs. IMCL in the TA muscle
Lean are represented by squares and obese are represented by triangles. Spearman Rank correlation coefficient, r=0.50, p=0.0009; TA: tibialis anterioris; lnAUCG: log transformed values of Area under the Curve for Glucose in a 2 hour Oral Glucose Tolerance Test; IMCL: Intramyocellular lipid by proton magnetic resonance spectroscopy. IMCL data are presented in arbitrary units as a ratio of the corresponding peaks over the unsuppressed water peak x 100, corrected for T1 and T2 relaxation effects.
87

Figure 21: Correlation of 2-hour post-OGTT PG versus IMCL in
the SOL muscle for lean and obese
5010
015
020
02-
hour
PG
(mg/
dl)
1 2 3 4 5IMCL in the SOL muscle (a.u.)
Correlation of 2-hour PG vs. IMCL in the SOL muscle
Lean are represented by squares and obese are represented by triangles. Spearman Rank correlation coefficient, r=0.50, p=0.0008; SOL: soleus; OGTT: Oral Glucose Tolerance Test; PG: Plasma glucose levels; IMCL: Intramyocellular lipid by proton magnetic resonance spectroscopy. IMCL data are presented in arbitrary units as a ratio of the corresponding peaks over the unsuppressed water peak x 100, corrected for T1 and T2 relaxation effects. Figure 22: Correlation of 2-hour post-OGTT PG versus IMCL in
the TA muscle for lean and obese
5010
015
020
02-
hour
PG
(mg/
dl)
0 .5 1 1.5IMCL in the TA muscle (a.u.)
Correlation of 2-hour PG vs. IMCL in the TA muscle
88

Lean are represented by squares and obese are represented by triangles. Spearman Rank correlation coefficient, r=0.51, p=0.0006; TA: tibialis anterioris; OGTT: Oral Glucose Tolerance Test; PG: Plasma glucose levels; IMCL: Intramyocellular lipid by proton magnetic resonance spectroscopy. IMCL data are presented in arbitrary units as a ratio of the corresponding peaks over the unsuppressed water peak x 100, corrected for T1 and T2 relaxation effects.
Strong positive associations were found between BMI and WHR
(r=0.72, p< 0.0001), TBF (r=0.81, p< 0.0001), and leptin (r=0.79, p<
0.0001).
5.2.5 Insulin Resistance Predictors
Multiple linear regression was performed to evaluate which
variables perform better in predicting insulin resistance. HOMA was
used as an index of insulin resistance and as the dependent variable in
the regression analysis. In the model, age was included since it has
been shown to affect insulin sensitivity (Machann et al, 2005; Ryan,
2000). BMI was also included in the model, as a measure of total body
adiposity. WHR was examined as a measure of central obesity and
fasting blood metabolites were also considered in this model. The
initial analysis was performed separately for the two study groups.
However, since no difference was found between groups, both groups
were joined for the final analysis.
The most important predictors of insulin resistance were age,
IMCL of the SOL muscle, TG, and BMI. They accounted for 58% of
variability in insulin resistance by the HOMA index. IMCL in the SOL
muscle accounted for 27% of the variability in insulin resistance by
89

the HOMA index, after adjusting for age, BMI, and TG. The best
model for predicting insulin resistance was:
HOMA = β0 + β1 x age + β2 x BMI + β3 x TG + β4 x IMCLSOL
This model was checked for violation of basic assumptions of multiple
linear regression, including normal distribution, constant variance,
and independence of residuals, as well as the presence of influential
data points. When highly influential points were removed, the
predictive ability of this model increased and the variables accounted
for 76% of variability in insulin resistance by the HOMA index.
5.3 Follow up
A total of 10 obese subjects completed the intervention part and
the follow up testing. The drop out rate (54.5%) for the weight loss
part of the study is similar to that of other intervention studies (14 –
52%) and it is expected because of the inherent difficulties associated
with weight loss and weight maintenance (Blue and Black, 2005).
From the obese group, one subject was recruited by the marines, two
subjects were removed from the study for non-compliance to the diet
regimen, and nine subjects dropped out of the study either at the
beginning or during the weight loss phase.
5.3.1 Anthropometric Data and Fasting Blood Tests
The 10 obese participants who completed the weight loss
intervention achieved a statistically significant weight loss of 10% of
90

baseline body weight (p=0.005) in an average time of 4.60 months.
This group was sedentary to moderately active, with a mean PAL of
1.42, ranging from 1.3 to 1.6.
The anthropometric and body composition comparisons before
and after weight loss are shown on Table 8. There was a significant
decrease in BMI of the obese participants (p=0.005), and it almost
reached the overweight range. TBF and LBM decreased significantly
by 7.1% and 5.3% respectively. There was trend for a decrease in
WHR in this group, but it did not reach statistical significance.
Table 8: Anthropometric characteristics of obese subjects before and after weight loss
Before weight lossAfter weight lossp value Before vs. After weight loss
n 10 10Age (years) 43.20 2.02Body weight (kg)96.58 3.90 86.81 3.91 0.005BMI (kg/m2) 34.14 0.92 30.65 0.91 0.005TBF (%) 37.92 2.46 35.24 2.71 0.006LBM (kg) 55.11 3.68 52.18 3.65 0.005WHR 0.91 0.030 0.89 0.023 NSData are means SE. The Wilcoxon matched-pairs signed-ranks test was used. NS: No statistical significance, p> 0.1; BMI: Body Mass Index; TBF: Total Body Fat, by Dual Energy X-Ray Absortiometry; LBM: Lean Body Mass; WHR: Waist-to-Hip Ratio.
Plasma lipid levels of obese subjects before and after weight
loss are shown in Table 9. TCho and LDL were significantly reduced
with weight loss by 18.3% and 22.3% respectively. FFA, TG, and HDL
91

were also reduced with weight loss, but their change did not reach
statistical significance.
Table 9: Plasma lipid levels of obese subjects before and after
weight loss
Before weight lossAfter weight lossp value Before vs. After weight loss
n 10 10TCho (mg/dl) 226.20 7.42 184.90 6.38 0.005HDL (mg/dl) 72.00 5.62 67.20 4.73 NSLDL (mg/dl) 129.90 7.28 100.90 3.83 0.007TG (mg/dl) 122.60 30.90 83.30 8.89 NSFFA (mg/dl) 0.55 0.044 0.51 0.070 NSData are means SE. The Wilcoxon matched-pairs signed-ranks test was used. NS: No statistical significance, p> 0.1; TCho: Total Cholesterol; HDL: High-Density Lipoprotein; LDL: Low-Density Lipoprotein; TG: Serum Triglyceride; FFA: Free Fatty Acids; FFA levels were calculated for 9 subjects.
The majority of indices of insulin sensitivity were significantly
improved with weight loss, including HOMA, lnAUCI, lnAUCG, and
FPI (Table 10). HOMA decreased significantly, showing a 36.5%
improvement in insulin sensitivity (p=0.005). All subjects had normal
glucose tolerance (NGT) after weight loss. Adiponectin levels
increased significantly by 35.8% (p=0.005), further indicating an
improvement in insulin sensitivity in this group. FPG and HbA1c were
not significantly changed, as expected since those values were not
92

different from the lean controls at baseline. Leptin levels decreased
dramatically after the intervention by 50.6% (p=0.05).
93

Table 10: Plasma hormone levels, insulin sensitivity and
glucose metabolism indices of obese subjects before and after
weight loss
Before weight lossAfter weight lossp value Before vs. After weight loss
n 10 10FPG (mg/dl) 87.40 2.12 85.60 3.30 NSFPI (µU/ml) 8.36 0.97 6.68 1.39 0.09HbA1c (%) 5.25 0.12 5.33 0.11 NSHOMA 1.70 0.16 1.08 0.15 0.005lnAUCI 8.56 0.19 8.23 0.19 0.005lnAUCG 9.61 0.066 9.49 0.045 0.03IGT 3/10 0/10 0.082-hour PG 118.4 11.05 95.3 6.02 0.0472-hour PI 58.35 12.21 39.01 12.01 0.02Leptin (ng/ml) 26.90 4.45 13.29 2.93 0.005Adiponectin (µg/ml)20.07 3.52 27.25 4.05 0.005Data are means SE, except for IGT data, which is reported as subjects with IGT/total subjects. The Wilcoxon matched-pairs signed-ranks test was used. NS: No statistical significance, p> 0.1; FPG: Fasting Plasma Glucose; FPI: Fasting Plasma Insulin; HOMA: Homeostasis Model Assessment Index; lnAUCI: log transformed Area under the Curve of Insulin in a 2 hour Oral Glucose Tolerance Test (OGTT); lnAUCG: log transformed Area under the Curve of Glucose in a 2 hour OGTT; IGT: Impaired Glucose Tolerance defined as 2 hour post-OGTT glucose 140 – 200 mg/dl; 2-hour PG: 2 hour post-OGTT plasma glucose; 2-hour PI: 2 hour post-OGTT plasma insulin; HbA1c: Glycated Hemoglobin.
5.3.2 Intracellular Lipid Accumulation
After weight loss, there was a significant change in body water
which can be attributed to loss of LBM. Since the water peak was
used as a reference for the IMCL and EMCL quantification, a
correction was made to account for that difference. The tissue water
94

content of human skeletal muscle is 0.81 kg/kg LBM (Szczepaniak et
al, 1999). As a result, loss of tissue water was calculated as: Tissue
water lost = LBM lost x 0.81 kg water/kg LBM.
This value was calculated for each participant and was added to the
absolute water value obtained from proton MRS. This adjusted water
value was used as a reference for the post-treatment IMCL and EMCL
quantification. The MRS results are shown in Table 11.
Table 11: IMCL, EMCL, and IHL by proton magnetic resonance
spectroscopy of obese subjects before and after weight loss
Before weight loss After weight lossp value Before vs. After weight loss
n 10 10IMCL-TA 0.597 0.10 0.468 0.089 0.046EMCL-TA 0.945 0.19 1.01 0.18 NSIMCL-SOL 2.28 0.17 2.45 0.27 NSEMCL-SOL 2.23 0.34 2.35 0.45 NSIHL 8/10 3/10 0.03Data are means SE, except IHL data, which is reported as presence or absence of abnormal IHL (subjects with presence of abnormal IHL/total subjects with IHL data). The Wilcoxon matched-pairs signed-ranks test was used. NS: No statistical significance, p> 0.1; IMCL-TA: Intramyocellular lipid in the tibialis anterioris muscle; EMCL-TA: Extramyocellular lipid in the tibialis anterioris muscle; IMCL-SOL: Intramyocellular lipid in the soleus muscle; EMCL-SOL: Extramyocellular lipid in the soleus muscle; IHL: Intrahepatic Lipid. IMCL and EMCL data are presented in arbitrary units as a ratio of the corresponding peaks over the unsuppressed water peak x 100, corrected for T1 and T2 relaxation effects.
After weight loss there was a significant decrease of 22% in
IMCL of the TA muscle (p=0.046). This decrease in IMCL was not
correlated with the decease in insulin resistance by HOMA or the
95

improvement in glucose tolerance by lnAUCG, even after adjusting for
percent of total weight or TBF lost. Magnetic resonance images and
spectra of the TA and SOL muscle before and after weight loss are
shown in Figures 23 and 24. Furthermore, the proportion of subjects
with presence of abnormal IHL was also significantly decreased in this
group (p=0.03). Before weight loss, 80% of this obese had abnormal
IHL, but only 30% had abnormal IHL after weight loss. There was no
significant change in IMCL of the SOL muscle or EMCL of the SOL or
TA muscle.
Figure 23: Axial magnetic resonance images and SOL proton
spectra of the right calf muscle of a 42-year-old female obese
subject before and after weight loss
96

In both processed water suppressed spectra, the bottom line labeled ‘original’ represents the original data, the second from the bottom line labeled ‘estimate’ represents the estimated spectrum, the third from the bottom line labeled ‘individual components’ represents the individual peaks, and the top line labeled ‘residue’ represents the residual spectrum obtained by subtracting the original spectrum from the estimate. The left set of spectra and image show the soleus (SOL) muscle before weight loss. In the line labeled ‘individual components,’ peaks 1, 2, 3, and 4 represent the intramyocellular methyl (IMCL-CH3), extramyocellular methyl (EMCL-CH3), intramyocellular methylene (IMCL-CH2), and extramyocellular (EMCL-CH2) peaks respectively. Peak 10 is identified as the water peak, peak 6 as a mixture of allylic methylene compounds, peak 7 as the total creatine (TCr), and peak 8 the trimethyl amines (TMA). The right set of spectra and image show the SOL muscle after weight loss. In the line labeled ‘individual components,’ peaks 1, 2, 3, and 4 represent the IMCL-CH3, EMCL-CH3, IMCL-CH2, and EMCL-CH2 peaks respectively. Peak 9 is identified as the water peak, peak 5 as a mixture of allylic methylene compounds, peak 6 as the TCr, and peak 7 as the TMA.
97

Figure 24: Axial magnetic resonance images and TA proton
spectra of the right calf muscle of a 39-year-old female obese
subject before and after weight loss
In both processed spectra, the bottom line labeled ‘original’ represents the original data, the second from the bottom line labeled ‘estimate’ represents the estimated spectrum, the third from the bottom line labeled ‘individual components’ represents the individual peaks, and the top line labeled ‘residue’ represents the residual spectrum obtained by subtracting the original spectrum from the estimate. The left set of spectra and image show the tibialis anterioris (TA) muscle before weight loss. In the line labeled ‘individual components,’ peaks 1, 2, 3, and 4 represent the intramyocellular methyl (IMCL-CH3), extramyocellular methyl (EMCL-CH3), intramyocellular methylene (IMCL-CH2), and extramyocellular (EMCL-CH2) peaks respectively. Peak 10 is identified as the water peak, peak 6 as a mixture of allylic methylene compounds, peak 7 as the total creatine (TCr), and peak 8 as the trimethyl amines (TMA). The right set of spectra and image show the TA muscle after weight loss. In the line labeled ‘individual components,’ peaks 1, 2, 3, and 4 represent the IMCL-CH3, EMCL-CH3, IMCL-CH2, and EMCL-CH2 peaks respectively.
4 4
98

Peak 9 is identified as the water peak, peak 5 as a mixture of allylic methylene compounds, peak 6 as the TCr, and peak 7 as the TMA.
99

5.3.3 Losses to Follow up
We observed a loss to follow up of 54.5% in the obese group.
Participants excluded from the follow up analyses were compared to
those who completed the weight loss program to determine if there
were significant differences between groups. Overall, the two groups
appeared to be very similar in baseline anthropometric
characteristics, plasma metabolites, and intracellular lipid levels. The
group that dropped out had a slightly but not statistically significantly
higher BMI compared to the group that completed the weight loss
(Table 12).
Table 12: Anthropometric characteristics of obese subjects that
completed the weight loss compared to those who dropped out
Completed Drop outs p value Completed weight loss vs. Drop outs
n 10 12Age (years) 43.20 2.02 39.00 3.40 NSBody weight (kg)96.58 3.90 104.10 3.43 NSBMI (kg/m2) 34.14 0.92 36.02 0.77 0.06TBF (%) 37.92 2.46 40.58 1.58 NSLBM (kg) 55.11 3.68 56.88 2.51 NSWHR 0.91 0.030 0.95 0.016 NSData are means SE. The two sample Wilcoxon rank sum test was used. NS: No statistical significance, p> 0.1; BMI: Body Mass Index; TBF: Total Body Fat by Dual Energy X-Ray Absorptiometry; LBM: Lean Body Mass; WHR: Waist-to-Hip Ratio.
100

Furthermore, the total cholesterol of the group that dropped out of the study was statistically significantly lower than the corresponding values of the group that completed the weight loss (Table 13). The lnAUCI was also slightly higher in the drop out group, but that difference was only marginally significant (p=0.06). Table 13: Plasma metabolite concentrations of obese subjects
that completed the weight loss compared to those who dropped
out
Completed Drop outs p value Completed weight loss vs. Drop outs
n 10 12TCho (mg/dl) 226.20 7.42 189.75 7.64 0.006TG (mg/dl) 122.60 30.90 110.33 21.90 NSFFA (mg/dl) 0.55 0.044 0.64 0.081 NSFPG (mg/dl) 87.40 2.12 87.25 2.14 NSFPI (µU/ml) 8.36 0.97 10.48 2.09 NSHOMA 1.70 0.16 2.05 0.28 NSlnAUCI 8.56 0.19 8.91 0.14 0.06lnAUCG 9.61 0.066 9.61 0.055 NSHbA1c (%) 5.25 0.12 5.41 0.14 NSLeptin (ng/ml) 26.90 4.45 24.33 3.35 NSAdiponectin (µg/ml)20.07 3.52 16.92 1.69 NSData are means SE. The two sample Wilcoxon rank sum test was used. NS: No statistical significance, p> 0.1; TCho: Total Cholesterol; TG: Serum Triglyceride; FFA: Free Fatty Acids; FPG: Fasting Plasma Glucose; FPI: Fasting Plasma Insulin; HOMA: Homeostasis Model Assessment Index; lnAUCI: log transformed Area under the Curve of Insulin in a 2 hour Oral Glucose Tolerance Test (OGTT); lnAUCG: log transformed Area under the Curve of Glucose in a 2 hour OGTT; HbA1c: Glycated Hemoglobin.
No differences were observed in the intracellular lipid
accumulation levels of the muscle and liver between the group that
101

completed the weight loss program compared to the one who did not
(Table 14). In general, the two groups are comparable and no
systematic bias can be observed due to attrition.
102

Table 14: IMCL, EMCL, and IHL by proton magnetic resonance
spectroscopy of obese subjects that completed the weight loss
compared to those who dropped out
Completed Drop outs p value Completed weight loss vs. Drop outs
n 10 12IMCL-TA 0.597 0.10 0.542 0.096 NSEMCL-TA 0.945 0.19 1.53 0.49 NSIMCL-SOL 2.28 0.17 3.10 0.41 NSEMCL-SOL 2.23 0.34 2.64 0.34 NSIHL 8/10 8/10 NSData are means SE, except IHL data, which is reported as presence or absence of IHL (subjects with presence of IHL/total subjects with IHL data). The two sample Wilcoxon rank sum test was used. NS: No statistical significance, p> 0.1; IMCL-TA: Intramyocellular lipid in the tibialis anterioris muscle; EMCL-TA: Extramyocellular lipid in the tibialis anterioris muscle; IMCL-SOL: Intramyocellular lipid in the soleus muscle; EMCL-SOL: Extramyocellular lipid in the soleus muscle; IHL: Intrahepatic Lipid.
5.3.4 Correlations
The differences between baseline and post-treatment
measurements (Δ) of each variable were examined for associations,
using the Spearman Rank correlation coefficient r, to determine linear
associations between measures of insulin sensitivity, blood
metabolites, anthropometric variables, and intracellular lipids. No
correlations were found between measures of insulin resistance and
IMCL in the TA or the SOL muscles. There was a moderate negative
and marginally statistically significant correlation of ΔIMCL in the
SOL muscle with ΔTBF (r=– 0.56, p=0.09). Furthermore, there was a
103

moderate positive correlation between Δleptin and ΔIMCL in the SOL
(r=0.66, p=0.04), Δleptin and ΔHDL (r=0.69, p=0.03). There was a
strong negative correlation between ΔIMCL in the TA muscle and
ΔLDL (r=–0.70, p=0.02), ΔFPG and ΔFFA (r=–0.77, p=0.02). A
moderate negative correlation was found between Δadiponectin and
ΔlnAUCG, (r=–0.68, p=0.03), and ΔTG and ΔFPG (r=–0.62, p=0.06). A
strong positive correlation was found between ΔBMI and ΔHDL
(r=0.75, p=0.01), ΔBMI and Δleptin (r=0.72, p=0.02).
104
6 DISCUSSION
6.1 Intracellular Lipid Concentration is Higher in Obese
Compared to Lean
The obese group in the present study exhibited higher IMCL levels
in both SOL and TA muscles than the lean group. The IMCL levels in
the TA muscle were marginally significant, but there was an obvious
trend of increased IMCL levels in the TA muscle of obese compared to
lean. These results are consistent with other studies in obese and
lean, as well as insulin resistant and insulin sensitive individuals
(Sinha et al, 2002; Jacob et al, 1999; Perseghin et al, 1999). Sinha et
al (2002) found that IMCL of the SOL muscle was significantly higher
in obese adolescents compared to lean controls. Jacob et al (1999)
concluded that IMCL levels in both the TA and SOL muscles were
statistically significantly higher in insulin-resistant compared to
insulin-sensitive individuals. Perseghin et al (1999) found that there
were higher IMCL levels in the SOL but not the TA muscle in the
offspring of diabetic parents compared to healthy controls. These
results are similar to the results of this study, which showed higher
IMCL levels in the obese compared to lean subjects.
The obese group had a significantly higher proportion of
subjects with fatty liver compared to the lean group. This result is
consistent with a study by Petersen et al (2005). The prevalence of
105

fatty liver in the obese group (80%) is similar to that observed in
obese populations (Youssef and McCullough, 2002).
6.2 Intracellular Lipid Levels are Positively Correlated with
Insulin Resistance and Glucose Intolerance
In both study groups, there was a significant positive correlation
between insulin resistance by HOMA and IMCL in the SOL, but not in
the TA muscle. This result agrees with previous studies (Ashley et al,
2002; Virkamaki et al, 2001; Krssak et al, 1999; Sinha et al, 2002).
Ashley et al (2002) found a significant association between
IMCL in the SOL muscle in his group of healthy lean adolescent boys.
In a study by Virkamaki et al (2001), IMCL accumulation in the vastus
lateralis muscle was associated with whole-body insulin resistance
and with defective insulin signaling in skeletal muscle independent of
body weight and physical fitness in healthy lean men. Krssak et al
(1999) found a negative correlation between insulin sensitivity and
IMCL in the SOL muscle in a group of healthy adults. Sinha et al
(2002) found a strong inverse correlation between IMCL and insulin
sensitivity, which became stronger after adjusting for percent TBF
and abdominal subcutaneous fat mass in a group of lean and obese
adolescents. However, a study of the same group in Asian Indian
males failed to uncover a correlation between insulin sensitivity and
IMCL in the SOL muscle (Sinha et al, 2005).
106

All study subjects had normal fasting glucose values (NFG),
therefore their ability to maintain basal insulin secretion and hepatic
glucose output has not been compromised. However, 5.3% of the lean
group and 31.8% of the obese group had impaired glucose tolerance
(IGT), which is considered a risk factor for the development of
diabetes (Unwin et al, 2002). During an OGTT, the body responds to
the carbohydrate load by suppressing hepatic glucose output and
stimulating liver and muscle glucose uptake (Unwin et al, 2002).
Therefore, IGT is mainly associated with skeletal muscle insulin
resistance and is more prevalent than impaired fasting glucose (IFG)
in most populations (Unwin et al, 2002).
In both study groups, there was a significant positive correlation
between glucose intolerance (lnAUCG and 2-hour post-OGTT plasma
glucose) and IMCL in the SOL and TA muscles. The correlation
between glucose intolerance and IMCL in the TA muscle was stronger
for the obese group. Glucose intolerance was also significantly
positively correlated with FFA, TG, and WHR. A study in healthy
elderly and young volunteers also found a correlation between IMCL
in the SOL muscle and measures of glucose tolerance (Cree et al,
2004). A study in women with previous gestational diabetes found a
significant positive correlation of glucose intolerance with IMCL in the
TA muscle, but not the SOL (Kautzky-Willer et al, 2003)
107

From the outcome variables studied, it was shown that IMCL in
the SOL muscle, serum TG, and BMI are the main predictors of insulin
resistance. Perseghin et al (1999) also found that IMCL in the SOL
muscle was an important predictor of insulin sensitivity in a group of
lean offspring of type 2 diabetic parents and healthy subjects. On the
contrary, he found FFA not TG to be another important predictor of
insulin sensitivity in the populations studied. Krssak et al (1999),
however, did not find any associations between BMI, age, TG, FFA
and insulin sensitivity in a group of healthy lean adults.
6.3 Weight Loss Reduces Intracellular Lipid
In this study there was a 22% decrease in IMCL levels in the TA
muscle with a mean 10% weight loss. This decrease in IMCL was
significant, but it was not correlated with the mean 36.5%
improvement in insulin resistance by HOMA, even after adjusting for
TBF or percent of total body weight lost. No change in the IMCL
levels of the SOL muscle was found before and after weight loss in
this group. These results are consistent with animal and human
studies (Korach-Andre et al, 2005; Greco et al, 2002; Garg et al, 2000;
Petersen et al, 2005; Tamura et al; 2005).
A study in Zucher lean and fat rats, investigated the IMCL
content in glycolytic (SOL) and oxidative (TA) muscles and its
relationship to insulin resistance (Korach-Andre et al, 2005). In
repeated measurements over 3 months of IMCL in these rats, IMCL in
108

both SOL and TA were significantly higher in the fat compared to the
lean rats. For the fat rats, IMCL in the TA muscle increased with age,
whereas in the lean rats IMCL in the TA muscle decreased with age.
In contrast, IMCL levels in the SOL muscle were not significantly
changed in either rat throughout the study. Impairment in whole-body
insulin sensitivity in fat rats was concomitant with IMCL
concentration in the TA muscle. The results are consistent with the
findings of our study and support the hypothesis that glycolytic
muscles (TA) play a major role during the onset of insulin resistance.
In a 6-month intervention study, IMCL of the quadriceps muscle,
which has higher percentage of glycolytic fibers, was reduced and
insulin resistance was reversed in a group of morbidly obese patients
who underwent weight loss (24% of total body weight) through
biliopancreatic diversion (BPD), but small changes in IMCL and
insulin sensitivity were observed in a second group who followed a
hypocaloric diet and lost 10% of their total body weight (Greco et al,
2002; Garg et al, 2000).
In a 3-12 week study (end-point to achievement of
normoglycemia) of a group of obese sedentary diabetic patients who
lost 9.3% of total body weight, a significant improvement was
observed in hepatic insulin resistance, but not in peripheral glucose
metabolism or IMCL of the SOL muscle (Petersen et al, 2005).
109

In a two-week intervention study involving two groups of type 2
diabetics who were studied at baseline and after a two-week diet and
a diet plus exercise program, a significant decrease in IHL was found,
which was independent of fasting FFA levels (Tamura et al, 2005).
However, IMCL of the TA muscle was reduced by 19% and glucose
infusion rate was increased by 57% in the diet and exercise group.
Contrary to the results of our study, a 4-month intervention trial
of diet and exercise in a group of sedentary obese adults that resulted
in a 10% weight loss and a 46% increase in insulin sensitivity did not
uncover a significant decrease in IMCL levels of the TA muscle (He et
al, 2004). Furthermore, this study found a significant decrease in the
size of lipid droplets and an association of this reduction with an
increase in insulin sensitivity.
It can be hypothesized that the decrease if IMCL levels in the TA
muscle with weight loss results in improvement of skeletal insulin
resistance in the obese group by an increase in GLUT4 expression and
enhanced glucose transport in the muscle cell. Since IMCL in the SOL
muscle was not decreased, it can be hypothesized that the weight
reduction was not adequate to induce a decrease in the lipid
concentration in that muscle or can be attributed to the different
muscle fiber composition of that muscle.
The lack of correlation between IMCL in the TA and SOL muscles
and indices of insulin resistance and glucose tolerance can be partly
110

attributed to insufficient weight loss. Furthermore, several factors
including the difference in the time to achieve target weight loss and
in relative changes of body composition among the obese subjects
could be responsible for the lack of correlation between IMCL and
insulin resistance after weight loss.
6.4 Other Factors Affecting Intramyocellular Lipid
Concentration
6.4.1 Muscle Fiber Type
Given the greater content of IMCL and increased insulin
sensitivity in oxidative muscles, like SOL, it is possible that fiber-type
variability is responsible for the different relationships seen in the
examined muscles types (Jacob et al, 1999; Perseghin et al, 1999;
Essen et al, 1975; Rico-Sanz et al, 1999; Malenfant et al, 2001; James
et al, 1985; Lillioja et al, 1987). The SOL muscle, which mainly
consists of type I muscle fibers has a higher oxidative potential than
TA, which mainly consists of type II muscle fibers. In addition to
differences in oxidative capacity, muscle I fibers typically have
increased capillary density, increased lipid storage capacity,
increased insulin binding, increased insulin-stimulated glucose
uptake, and increased glucose transport protein content relative to
type II fibers (Hickey et al, 1995). Therefore, the statistically significant
111

positive correlation of IMCL in the SOL muscle that was found with
insulin resistance can be explained.
Animal studies have investigated the effects of muscle fiber on
glucose and insulin metabolism (Halseth et al, 2001; Rizk et al, 1998;
James et al, 1985). Halseth et al (2001) examined glucose uptake in
different rat muscle types and demonstrated that muscle glucose
uptake was much lower in muscle comprised of type II fibers (like the
TA) than in the SOL muscle under both basal and insulin-stimulated
conditions, and concluded that glucose delivery and transport are the
primary factors for this limitation. Furthermore, it has been shown
that the oxidative muscles in rats exhibit greater basal uptake than
the glycolytic muscles (Rizk et al, 1998). A study by James et al (1985)
examined the effect of insulin on glucose metabolism in different types
of skeletal muscle in rats. This study concluded that insulin-induced
increases in total peripheral glucose disposal occur predominantly in
muscles containing a high proportion of oxidative fibers.
Human studies have demonstrated that GLUT-4 expression is
muscle fiber type dependent (Gaster et al, 2000). The association
among muscle insulin resistance, obesity, GLUT4 immunoreactivity,
and muscle fiber type has been investigated (Gaster et al, 2001).
GLUT4 expression in oxidative fibers was shown to be lower in obese
individuals and even lower in type 2 diabetics compared to lean
controls (Gaster et al, 2001). It can be hypothesized that the reduced
112

GLUT4 contribution from oxidative fibers in obese and type 2
diabetics may result in a decrease in skeletal muscle glucose uptake.
A study by Lillioja et al (1987) compared insulin sensitivity with
muscle fiber type in human skeletal muscle in healthy men. This study
found a significant association between muscle fiber type and insulin
action. It has been postulated that even though the proportion of type
I muscle fibers is genetically determined and fixed, interchange may
occur between IIa and IIb fiber types (Lillioja et al, 1987). In another
study by Kriketos et al (1997), it was demonstrated that the
composition of muscle fiber type is different between infants and
adults (Kriketos et al, 1997). Increased levels of type IIb glycolytic
fibers was shown to be correlated with obesity in adults (Kriketos et
al, 1997).
Furthermore, glucose intolerant individuals have been shown to
have elevated percentage of insulin insensitive type IIb (glycolytic)
muscle fibers compared to normoglycemic controls (Toft et al, 1998).
It has been indicated that chronic hyperglycemia is more likely to
result in insulin resistance in glycolytic muscles, since they are
affected to a greater extent by hyperglycemia and hyperinsulinemia
than the oxidative muscles (Rizk et al, 1998).
Since the SOL muscle (mainly oxidative) has an increased
capacity for lipid storage and oxidation, simultaneous depletion and
repletion of IMCL in SOL muscle could explain the lack of IMCL
113

reduction after weight loss in this muscle. On the contrary, the TA
muscle (mainly glycolytic) has a reduced capacity for lipid storage and
oxidation. Therefore, weight loss resulted in depletion of IMCL in this
muscle, with possible reduction in fatty acid uptake.
6.4.2 Physical Activity
In this study group, physical activity was self-reported; thus, it
can only be estimated. The study group consisted of sedentary to
moderately active individuals. Only one study subject was very active
for part of the intervention. This individual was the only one who
showed increased IMCL in the TA muscle after weight loss. Trained
endurance athletes have been shown to possess elevated IMCL levels,
even though they are very insulin sensitive (van Loon et al, 2004). In a
study of highly trained endurance athletes, an increase of 83% of
baseline IMCL levels in the SOL muscle was observed after a
submaximal treadmill run to exhaustion (Krssak et al, 2000). In a
study of healthy lean previously untrained individuals, IMCL in the TA
was significantly associated with measures of aerobic fitness, after
adjusting for adiposity (Thamer et al, 2003). Rico-Sanz et al (1998)
and Brechtel & Niess et al (2001) have shown that in trained males
IMCL levels in the calf muscle were increased with prolonged and
moderate intensity exercise.
114

6.4.3 Adiponectin
At baseline, adiponectin values were shown to be significantly
lower in the obese compared to the lean group. There results agree
with the study of Perseghin et al (2003), which showed that
adiponectin levels were decreased in type 2 diabetics and their
offspring. Weiss et al (2003) also found that adiponectin concentration
was higher in non obese compared to obese adolescents.
In this study, adiponectin was moderately negatively associated
with lnAUCG, which is an index of glucose tolerance, yet it was not
associated with insulin resistance by HOMA. However, Perseghin et al
(2003) demonstrated that in type 1, type 2 diabetics and offspring of
type 2 diabetics, IMCL concentration was positively associated with
insulin resistance. Weiss et al (2003) found that adiponectin was
positively associated with insulin sensitivity in both obese and non-
obese individuals.
6.5 Proton Magnetic Resonance Spectroscopy
In this study, proton nuclear magnetic resonance spectroscopy
(MRS) was used for the quantification of IMCL accumulation in vivo.
MRS is a non-invasive method that has been recently utilized to assess
the composition and structure of living tissue. The sensitivity of the
fatty acid proton chemical shift enables the separation of difference
115

types of protons, based on the geometrical arrangement of the lipid
compartments (Machann et al, 2004).
EMCL is enclosed in septa along the muscle fiber bundles or
fasciae, whereas IMCL is located in droplets within the cytoplasm
(Machann et al, 2004). This frequency shift of the EMCL, caused by
the different geometrical arrangement, results in the separation of
these two types of fatty acids. The IMCL and EMCL are well
separated in the TA muscle because it contains parallel muscle fibers;
the IMCL-EMCL separation in the SOL muscle is less pronounced,
because of its crossing fiber orientation. MRS can accurately
distinguish between IMCL and EMCL in animal and human models
(Perseghin et al, 1999; Szczepaniak et al, 1999; Sinha et al; 2002). It
can be used successfully to study alterations in IMCL and the
association of muscular lipid accumulation with the development of
insulin resistance in obesity.
The method used for MRS and spectroscopy data processing was
validated in this study. The CV for IMCL of TA and SOL muscles was
6.2% and for the EMCL was 18.6%, which are consistent with values
obtained from other investigators (Rico-Sanz et al, 1998; Brechtel et
al 1999; Torriani et al, 2005; Szczepaniak et al, 1999). Since EMCL
strongly depends on voxel positioning, its physiological relevance is
limited and it was not used as an outcome variable in data analysis
(Machann et al, 2004).
116
IMCL and EMCL quantification requires the use of an internal
standard. Water and creatine are the only standards used for this
purpose throughout the literature. Since weight loss reduces all body
compartments, including body fat, muscle mass, and bone mineral
density, both water and creatine were reduced. The creatine peak was
examined and it was not possible to determine and quantify the
degree of reduction in the obese. Previous literature provided
information on the water content of the human skeletal muscle
(Szczepaniak et al, 1999). Since lean tissue mass was accurately
quantified by DEXA, lean tissue water loss could be estimated. This
estimation was used to account for changes in muscle water content
due to weight loss, and therefore provide a more accurate
measurement of post weight loss IMCL. Nevertheless, this correction
could be a possible source of measurement error and should be
further explored with future studies. Additional internal validation is
required to establish the accuracy of this correction and possibly
uncover an internal standard which is not altered by changes in body
composition.
6.6 Measures of Insulin Resistance
The clamp has been widely used since the 1970s and it is
considered the gold standard for measurement of insulin sensitivity in
vivo. The clamp can be modified to include a stable glucose tracer in
order to evaluate endogenous glucose production, indirect calorimetry
117

to evaluate substrate oxidation, stable free fatty acid (FFA) tracer to
evaluate lipolysis, and tracer amino acids to evaluate protein
turnover. It can also be used with other techniques like Positron
Emission Tomography (PET) scanning to estimate regional glucose
uptake and nuclear magnetic resonance to estimate glycogen storage.
The clamp values are fairly reproducible, with an intra-subject CV
ranging from 5 – 17%. However, the clamp requires the use of special
equipment and personnel training, and it is not suitable for large
epidemiological studies. Furthermore, the true steady state assumed
in the insulin sensitivity calculations is never achieved.
In this study, the HOMA index was used as a measure of insulin
resistance. In this study, HOMA had a strong negative correlation
with the insulin sensitivity values obtained from the euglycemic-
hyperinsulinemic clamp. HOMA has been used systematically to
estimate basal glucose output in the skeletal muscle, but cannot
describe insulin secretion, distribution, and degradation (Katsuki et
al, 2001; Emoto et al, 1999; Shoji et al, 2001; Haffner et al, 1996;
Unwin et al, 2002). HOMA is mainly used in large epidemiological
studies.
It would have been very useful to use the clamp data to compare
improvement in glucose utilization and insulin sensitivity before and
after weight loss in the obese. However, such a comparison was not
possible due to the limited number of clamp data obtained. The clamp
118

technique is labor intensive and several complications made the data
obtained unusable.
6.7 Suggestions for Future Research
Proton MRS can be a useful tool for evaluating and monitoring the
effects of interventions for diabetic and prediabetic states. Water and
creatine are used as internal standards to quantify IMCL and EMCL
using proton MRS. However, the reduction of body weight results in
changes in body composition and loss of lean muscle and tissue water,
as well as reduction in muscle lipids. The limited and short-term
longitudinal studies evaluating the effects of weight loss in IMCL do
not provide adequate information for resolving this issue. Therefore,
the use of water as an internal standard for the quantification of IMCL
and EMCL should be re-examined and alternative internal standards
should be considered that remain unaltered with weight loss or other
changes in body composition. Absolute IMCL quantification should
also be explored to eliminate the need of an internal standard.
The dietary intervention in this study consisted of a balanced
hypocaloric diet with a consistent macronutrient composition (50-60%
carbohydrate, 25-30% fat and 15-20% protein). Future studies should
examine the effect of dietary macronutrient and fatty acid composition
on IMCL levels. High protein, low carbohydrate (f.e. Atkins or South
Beach Diet), low-fat, high carbohydrate (f.e. Pritikin diet), and
119

vegetarian diets are possible candidates for exploring the effect of
macronutrient composition on IMCL and insulin resistance.
In this study, physical activity was self-reported and there was no
structured exercise intervention associated with the weight loss
program. Overall, this group was sedentary and no significant effect
can be observed on the outcome variables. Since there is some
evidence that physical activity influences IMCL, the role of exercise as
part of weight loss should be further examined. Specifically, the role
of different types of exercise (endurance or aerobic conditioning and
strength or anaerobic training) and their effect on IMCL should be
evaluated.
In this study the HOMA index was used as a measure of insulin
resistance. The complications associated with the clamp procedure
resulted in few usable clamp data. As a result, the clamp could not be
used for comparison of insulin sensitivity before and after weight loss.
Future metabolic studies should include the use of the clamp, which is
a more sensitive measure of glucose metabolism. Furthermore, the
use of tracer glucose and FFA should also be considered to evaluate
endogenous glucose production and lipolysis in relation to IMCL
concentration.
The role of muscle fiber composition and insulin resistance should
be investigated further. Muscle fiber orientation and GLUT4
expression should be quantified to determine the fiber type on glucose
120

and insulin metabolism. Furthermore, the influence of different types
of exercise on muscle fiber should also be explored.
This study estimated central obesity by the WHR. More accurate
methods for the quantification of visceral fat, including Computerized
Assisted Tomography and Magnetic Resonance Imaging should be
employed instead of WHR. Central obesity should be further
investigated as a confounder in the relationship between obesity and
insulin resistance.
An improvement in insulin resistance was observed in all obese
participants who lost weight. However, the amount of weight loss for
the study group might not have been sufficient to result in a reduction
in IMCL in SOL muscle or a correlation between insulin resistance
and IMCL. A prospective study with a greater target weight loss is
needed to examine the effects of weight loss on IMCL and re-
investigate the correlation between IMCL and insulin resistance.
Adiponectin is one of several pro-inflammatory cytokines, which
are proteins secreted by adipocytes and can induce insulin resistance
in peripheral tissues. Several cytokines have been shown to disrupt
the insulin signaling cascade. The role of cytokines in the impairment
of insulin signaling and their relationship with free fatty acid
concentration in the skeletal muscle should be closely examined.
121

6.8 Summary and Conclusions
The obese group had significantly higher IMCL levels in both SOL
and TA muscles than the lean group. In both groups, there was a
significant positive correlation of insulin resistance with IMCL in the
SOL muscle but not in the TA. Both IMCL in the TA and SOL were
significantly positively correlated with glucose intolerance. IMCL in
the SOL was an important predictor of insulin resistance by HOMA,
after controlling for age, BMI, and TG.
Weight loss in the obese group resulted in a significant decrease
in insulin resistance and IMCL in the TA, but not in the SOL muscle.
There was no significant correlation between changes in IMCL in TA
myocytes and insulin resistance in the obese group after weight loss.
This study provided with information on the regulatory role of
free fatty acid inside the muscle cell in regards to insulin resistance.
When humans gain excess adipose tissue, there is an increase in lipid
concentration in a variety of tissues, especially in the skeletal muscle.
Impairment in insulin sensitivity could result from the excess fatty
acid concentration in the muscle cells. Weight loss is known to
improve insulin sensitivity by reducing total body adiposity. Our data
documented that concurrent reduction in IMCL stores might have an
important role in improving insulin signaling. Future research will
explore if specific interventions with different diet composition and
122

various types of physical activity have a more significant effect on
IMCL reduction and improvement in insulin resistance.
123

7 REFERENCES
Abbasi F, Carantoni M, McLaughlin T, Reaven GM. Plasma insulin
concentration is more tightly linked to plasma leptin concentration
than is the body mass index. Metabolism 2000;49:544-7.
Albala C, Perez F, Santos JL, et al. Relationship between leptin and
insulin blood levels in obese and lean Chilean women. Rev Med Chil
2000;128:154-61.
American Diabetes Association (ADA). Type 2 diabetes in children and
adolescents. Diabetes Care 2000;23:381-9.
American Obesity Association. AOA Fact Sheets: Obesity - A Global
Epidemic. Internet:
http://www.obesity.org/subs/fastfacts/obesity_global_epidemic.shtml
(accessed 09/14 2005).
Anderson CM, Henry RR, Knudson PE, Olefsky JM, Webster NJ.
Relative expression of insulin receptor isoforms does not differ in
lean, obese, and noninsulin-dependent diabetes mellitus subjects. J
Clin Endocrinol Metab 1993;76:1380-2.
Arslanian S, Suprasongsin C. Differences in the in vivo insulin
secretion and sensitivity of healthy black versus white adolescents. J
Pediatr 1996;129:440-3.
124

Ashley MA, Buckley AJ, Criss AL, et al. Familial, anthropometric, and
metabolic associations of intramyocellular lipid levels in prepubertal
males. Pediatr Res 2002;51:81-6.
Avogaro A, Piarulli F, Valerio A, et al. Forearm nitric oxide balance,
vascular relaxation, and glucose metabolism in NIDDM patients.
Diabetes 1997;46:1040-6.
Bachmann OP, Dahl DB, Brechtel K, et al. Effects of intravenous and
dietary lipid challenge on intramyocellular lipid content and the
relation with insulin sensitivity in humans. Diabetes 2001;50:2579-84.
Baumgartner-Parzer SM, Waldhausl WK. The endothelium as a
metabolic and endocrine organ: its relation with insulin resistance.
Exp Clin Endocrinol Diabetes 2001;109 Suppl 2:S166-79.
Berg AH, Combs TP, Du X, Brownlee M, Scherer PE. The adipocyte-
secreted protein Acrp30 enhances hepatic insulin action. Nat Med
2001;7:947-53.
Berruti A, Dogliotti L, Terrone C, et al. Changes in bone mineral
density, lean body mass and fat content as measured by dual energy
x-ray absorptiometry in patients with prostate cancer without
apparent bone metastases given androgen deprivation therapy. J Urol
2002;167:2361,7; discussion 2367.
125

Boden G, Jadali F, White J, et al. Effects of fat on insulin-stimulated
carbohydrate metabolism in normal men. J Clin Invest 1991;88:960-6.
Boden G, Lebed B, Schatz M, Homko C, Lemieux S. Effects of acute
changes of plasma free fatty acids on intramyocellular fat content and
insulin resistance in healthy subjects. Diabetes 2001;50:1612-7.
Bonora E, Targher G, Alberiche M, et al. Homeostasis model
assessment closely mirrors the glucose clamp technique in the
assessment of insulin sensitivity: studies in subjects with various
degrees of glucose tolerance and insulin sensitivity. Diabetes Care
2000;23:57-63.
Brechtel K, Dahl DB, Machann J, et al. Fast elevation of the
intramyocellular lipid content in the presence of circulating free fatty
acids and hyperinsulinemia: a dynamic 1H-MRS study. Magn Reson
Med 2001;45:179-83.
Brechtel K, Machann J, Jacob S, et al. In-vivo 1H-MR spectroscopy:
the determination of the intra- and extramyocellular lipid content
depending on the insulin effect in the direct offspring of type-2
diabetics. Rofo 1999;171:113-20.
Brechtel K, Niess AM, Machann J, et al. Utilisation of intramyocellular
lipids (IMCLs) during exercise as assessed by proton magnetic
resonance spectroscopy (1H-MRS). Horm Metab Res 2001;33:63-6.
126

Bullo M, Salas-Salvado J, Garcia-Lorda P. Adiponectin expression and
adipose tissue lipolytic activity in lean and obese women. Obes Surg
2005;15:382-6.
Caballero B. Insulin resistance in obesity. Arch Latinoam Nutr
1992;42:131S-6S.
Cama A, Patterson AP, Kadowaki T, et al. The amino acid sequence of
the insulin receptor is normal in an insulin-resistant Pima Indian. J
Clin Endocrinol Metab 1990;70:1155-61.
Caprio S, Tamborlane WV, Silver D, et al. Hyperleptinemia: an early
sign of juvenile obesity. Relations to body fat depots and insulin
concentrations. Am J Physiol 1996;271:E626-30.
Centers for Disease Control and Prevention (CDC). Overweight and
Obesity. Version current 04/29/2005. Internet:
http://www.cdc.gov/nccdphp/dnpa/obesity/ (accessed 09/14 2005).
Centers for Disease Control and Prevention (CDC). National Diabetes
Fact Sheets. Version current 06/09/2005. Internet:
http://www.cdc.gov/diabetes/pubs/factsheet.htm (accessed 09/14
2005).
Ciampelli M, Leoni F, Cucinelli F, et al. Assessment of insulin
sensitivity from measurements in the fasting state and during an oral
127

glucose tolerance test in polycystic ovary syndrome and menopausal
patients. J Clin Endocrinol Metab 2005;90:1398-406.
Colman E, Katzel LI, Rogus E, Coon P, Muller D, Goldberg AP. Weight
loss reduces abdominal fat and improves insulin action in middle-aged
and older men with impaired glucose tolerance. Metabolism
1995;44:1502-8.
Cree MG, Newcomer BR, Katsanos CS, et al. Intramuscular and liver
triglycerides are increased in the elderly. J Clin Endocrinol Metab
2004;89:3864-71.
Cruz ML, Huang TT, Johnson MS, Gower BA, Goran MI. Insulin
sensitivity and blood pressure in black and white children.
Hypertension 2002;40:18-22.
Cunningham JJ. A reanalysis of the factors influencing basal metabolic
rate in normal adults. Am J Clin Nutr 1980;33:2372-4.
Dabelea D, Hanson RL, Bennett PH, Roumain J, Knowler WC, Pettitt
DJ. Increasing prevalence of Type II diabetes in American Indian
children. Diabetologia 1998;41:904-10.
Dabelea D, Hanson RL, Lindsay RS, et al. Intrauterine exposure to
diabetes conveys risks for type 2 diabetes and obesity: a study of
discordant sibships. Diabetes 2000;49:2208-11.
128

Dabelea D, Pettitt DJ. Intrauterine diabetic environment confers risks
for type 2 diabetes mellitus and obesity in the offspring, in addition to
genetic susceptibility. J Pediatr Endocrinol Metab 2001;14:1085-91.
Dabelea D, Pettitt DJ, Hanson RL, Imperatore G, Bennett PH, Knowler
WC. Birth weight, type 2 diabetes, and insulin resistance in Pima
Indian children and young adults. Diabetes Care 1999;22:944-50.
DeFronzo RA, Tobin JD, Andres R. Glucose clamp technique: a method
for quantifying insulin secretion and resistance. Am J Physiol
1979;237:E214-23.
Emoto M, Nishizawa Y, Maekawa K, et al. Homeostasis model
assessment as a clinical index of insulin resistance in type 2 diabetic
patients treated with sulfonylureas. Diabetes Care 1999;22:818-22.
Essen B, Jansson E, Henriksson J, Taylor AW, Saltin B. Metabolic
characteristics of fibre types in human skeletal muscle. Acta Physiol
Scand 1975;95:153-65.
Expert Committee on the diagnosis and classification of diabetes
mellittus. Report of the Expert Committee on the Diagnosis and
Classification of Diabetes Mellitus. Diabetes Care 1997;20:1183-97.
Fagot-Campagna A, Burrows NR, Williamson DF. The public health
epidemiology of type 2 diabetes in children and adolescents: a case
129

study of American Indian adolescents in the Southwestern United
States. Clin Chim Acta 1999;286:81-95.
Fasshauer M, Paschke R, Stumvoll M. Adiponectin, obesity, and
cardiovascular disease. Biochimie 2004;86:779-84.
Forsen T, Eriksson J, Tuomilehto J, Reunanen A, Osmond C, Barker D.
The fetal and childhood growth of persons who develop type 2
diabetes. Ann Intern Med 2000;133:176-82.
Friedman JM, Halaas JL. Leptin and the regulation of body weight in
mammals. Nature 1998;395:763-70.
Fruehwald-Schultes B, Oltmanns KM, Kern W, Born J, Fehm HL,
Peters A. The effect of experimentally induced insulin resistance on
the leptin response to hyperinsulinaemia. Int J Obes Relat Metab
Disord 2002;26:510-6.
Fu Y, Luo N, Klein RL, Garvey WT. Adiponectin promotes adipocyte
differentiation, insulin sensitivity, and lipid accumulation. J Lipid Res
2005;46:1369-79.
Furler SM, Poynten AM, Kriketos AD, et al. Independent influences of
central fat and skeletal muscle lipids on insulin sensitivity. Obes Res
2001;9:535-43.
130

Garg A, Stray-Gundersen J, Parsons D, Bertocci LA. Skeletal muscle
morphology and exercise response in congenital generalized
lipodystrophy. Diabetes Care 2000;23:1545-50.
Gaster M, Poulsen P, Handberg A, Schroder HD, Beck-Nielsen H.
Direct evidence of fiber type-dependent GLUT-4 expression in human
skeletal muscle. Am J Physiol Endocrinol Metab 2000;278:E910-6.
Gaster M, Staehr P, Beck-Nielsen H, Schroder HD, Handberg A.
GLUT4 is reduced in slow muscle fibers of type 2 diabetic patients: is
insulin resistance in type 2 diabetes a slow, type 1 fiber disease?
Diabetes 2001;50:1324-9.
Gil-Campos M, Canete RR, Gil A. Adiponectin, the missing link in
insulin resistance and obesity. Clin Nutr 2004;23:963-74.
Gloyn AL, McCarthy MI. The genetics of type 2 diabetes. Best Pract
Res Clin Endocrinol Metab 2001;15:293-308.
Goldstein DJ. Beneficial health effects of modest weight loss. Int J
Obes Relat Metab Disord 1992;16:397-415.
Greco AV, Mingrone G, Giancaterini A, et al. Insulin resistance in
morbid obesity: reversal with intramyocellular fat depletion. Diabetes
2002;51:144-51.
131

Groop L. Pathogenesis of type 2 diabetes: the relative contribution of
insulin resistance and impaired insulin secretion. Int J Clin Pract
Suppl 2000;(113):3-13.
Haffner SM. Hyperinsulinemia as a possible etiology for the high
prevalence of non insulin dependent diabetes in Mexican Americans.
Diabete Metab 1987;13:337-44.
Haffner SM, Hazuda HP, Mitchell BD, Patterson JK, Stern MP.
Increased incidence of type II diabetes mellitus in Mexican
Americans. Diabetes Care 1991;14:102-8.
Haffner SM, Kennedy E, Gonzalez C, Stern MP, Miettinen H. A
prospective analysis of the HOMA model. The Mexico City Diabetes
Study. Diabetes Care 1996;19:1138-41.
Haffner SM, Miettinen H, Mykkanen L, Karhapaa P, Rainwater DL,
Laakso M. Leptin concentrations and insulin sensitivity in
normoglycemic men. Int J Obes Relat Metab Disord 1997;21:393-9.
Haffner SM, Mykkanen L, Festa A, Burke JP, Stern MP. Insulin-
resistant prediabetic subjects have more atherogenic risk factors than
insulin-sensitive prediabetic subjects: implications for preventing
coronary heart disease during the prediabetic state. Circulation
2000;101:975-80.
132

Haffner SM, Stern MP, Watanabe RM, Bergman RN. Relationship of
insulin clearance and secretion to insulin sensitivity in non-diabetic
Mexican Americans. Eur J Clin Invest 1992;22:147-53.
Hales CN, Barker DJ. Type 2 (non-insulin-dependent) diabetes
mellitus: the thrifty phenotype hypothesis. Diabetologia 1992;35:595-
601.
Halseth AE, Bracy DP, Wasserman DH. Functional limitations to
glucose uptake in muscles comprised of different fiber types. Am J
Physiol Endocrinol Metab 2001;280:E994-9.
Hanley AJ, Williams K, Stern MP, Haffner SM. Homeostasis model
assessment of insulin resistance in relation to the incidence of
cardiovascular disease: the San Antonio Heart Study. Diabetes Care
2002;25:1177-84.
Haring HU. The insulin receptor: signalling mechanism and
contribution to the pathogenesis of insulin resistance. Diabetologia
1991;34:848-61.
Haring HU, Kellerer M, Mosthaf L. Modulation of insulin signalling in
non-insulin-dependent diabetes mellitus: significance of altered
receptor isoform patterns and mechanisms of glucose-induced
receptor modulation. Horm Res 1994;41 Suppl 2:87,91; discussion 92.
133

Harris JA, Benedict FG. A Biometric Study of Basal Metabolism in
Man. Washinton, D.C: Publication No. 279.: Carnegie Institute of
Washington, 1919.
Haugen F, Ranheim T, Harsem NK, Lips E, Staff AC, Drevon CA.
Increased plasma levels of adipokines in preeclampsia: relationship to
placenta and adipose tissue gene expression. Am J Physiol Endocrinol
Metab 2005 (in press)
He J, Goodpaster BH, Kelley DE. Effects of weight loss and physical
activity on muscle lipid content and droplet size. Obes Res
2004;12:761-9.
Hickey MS, Carey JO, Azevedo JL, et al. Skeletal muscle fiber
composition is related to adiposity and in vitro glucose transport rate
in humans. Am J Physiol 1995;268:E453-7.
Hornak JP. The Basics of MRI. Internet:
http://www.cis.rit.edu/htbooks/mri/ (accessed September 22, 2005).
Hotta K, Funahashi T, Arita Y, et al. Plasma concentrations of a novel,
adipose-specific protein, adiponectin, in type 2 diabetic patients.
Arterioscler Thromb Vasc Biol 2000;20:1595-9.
Hu E, Liang P, Spiegelman BM. AdipoQ is a novel adipose-specific
gene dysregulated in obesity. J Biol Chem 1996;271:10697-703.
134

Ikeda T, Gomi T, Hirawa N, Sakurai J, Yoshikawa N. Improvement of
insulin sensitivity contributes to blood pressure reduction after weight
loss in hypertensive subjects with obesity. Hypertension
1996;27:1180-6.
Jacob S, Machann J, Rett K, et al. Association of increased
intramyocellular lipid content with insulin resistance in lean
nondiabetic offspring of type 2 diabetic subjects. Diabetes
1999;48:1113-9.
James DE, Jenkins AB, Kraegen EW. Heterogeneity of insulin action in
individual muscles in vivo: euglycemic clamp studies in rats. Am J
Physiol 1985;248:E567-74.
James PT, Leach R, Kalamara E, Shayeghi M. The worldwide obesity
epidemic. Obes Res 2001;9 Suppl 4:228S-33S.
Kagawa Y, Yanagisawa Y, Hasegawa K, et al. Single nucleotide
polymorphisms of thrifty genes for energy metabolism: evolutionary
origins and prospects for intervention to prevent obesity-related
diseases. Biochem Biophys Res Commun 2002;295:207-22.
Kahn CR. Role of insulin receptors in insulin-resistant states.
Metabolism 1980;29:455-66.
135

Kahn CR. Insulin resistance, insulin insensitivity, and insulin
unresponsiveness: a necessary distinction. Metabolism 1978;27:1893-
902.
Kaprio J, Tuomilehto J, Koskenvuo M, et al. Concordance for type 1
(insulin-dependent) and type 2 (non-insulin-dependent) diabetes
mellitus in a population-based cohort of twins in Finland. Diabetologia
1992;35:1060-7.
Katsuki A, Sumida Y, Gabazza EC, et al. Homeostasis model
assessment is a reliable indicator of insulin resistance during follow-
up of patients with type 2 diabetes. Diabetes Care 2001;24:362-5.
Kautzky-Willer A, Krssak M, Winzer C, et al. Increased
intramyocellular lipid concentration identifies impaired glucose
metabolism in women with previous gestational diabetes. Diabetes
2003;52:244-51.
Kellerer M, Sesti G, Seffer E, et al. Altered pattern of insulin receptor
isotypes in skeletal muscle membranes of type 2 (non-insulin-
dependent) diabetic subjects. Diabetologia 1993;36:628-32.
Kelley DE, Goodpaster BH, Storlien L. Muscle triglyceride and insulin
resistance. Annu Rev Nutr 2002;22:325-46.
136

Khan LK, Bowman BA. Obesity: a major global public health problem.
Annu Rev Nutr 1999;19:xiii-vii.
Kim SH, Abbasi F, Reaven GM. Impact of degree of obesity on
surrogate estimates of insulin resistance. Diabetes Care
2004;27:1998-2002.
Koopmans SJ, Frolich M, Gribnau EH, Westendorp RG, DeFronzo RA.
Effect of hyperinsulinemia on plasma leptin concentrations and food
intake in rats. Am J Physiol 1998;274:E998-E1001.
Korach-Andre M, Gounarides J, Deacon R, et al. Age and muscle-type
modulated role of intramyocellular lipids in the progression of insulin
resistance in nondiabetic Zucker rats. Metabolism 2005;54:522-8.
Kriketos AD, Baur LA, O'Connor J, et al. Muscle fibre type composition
in infant and adult populations and relationships with obesity. Int J
Obes Relat Metab Disord 1997;21:796-801.
Krssak M, Falk Petersen K, Dresner A, et al. Intramyocellular lipid
concentrations are correlated with insulin sensitivity in humans: a 1H
NMR spectroscopy study. Diabetologia 1999;42:113-6.
Krssak M, Petersen KF, Bergeron R, et al. Intramuscular glycogen and
intramyocellular lipid utilization during prolonged exercise and
137

recovery in man: a 13C and 1H nuclear magnetic resonance
spectroscopy study. J Clin Endocrinol Metab 2000;85:748-54.
Lindsay RS, Dabelea D, Roumain J, Hanson RL, Bennett PH, Knowler
WC. Type 2 diabetes and low birth weight: the role of paternal
inheritance in the association of low birth weight and diabetes.
Diabetes 2000;49:445-9.
Ludwig DS, Ebbeling CB. Type 2 diabetes mellitus in children:
primary care and public health considerations. JAMA 2001;286:1427-
30.
Lukaski HC. Soft tissue composition and bone mineral status:
evaluation by dual-energy X-ray absorptiometry. J Nutr 1993;123:438-
43.
Machann J, Bachmann OP, Brechtel K, et al. Lipid content in the
musculature of the lower leg assessed by fat selective MRI: intra- and
interindividual differences and correlation with anthropometric and
metabolic data. J Magn Reson Imaging 2003;17:350-7.
Machann J, Haring H, Schick F, Stumvoll M. Intramyocellular lipids
and insulin resistance. Diabetes Obes Metab 2004;6:239-48.
Machann J, Thamer C, Schnoedt B, et al. Age and gender related
effects on adipose tissue compartments of subjects with increased risk
138

for type 2 diabetes: a whole body MRI/MRS study. MAGMA
2005;18:128-37.
Maeda K, Okubo K, Shimomura I, Funahashi T, Matsuzawa Y,
Matsubara K. cDNA cloning and expression of a novel adipose specific
collagen-like factor, apM1 (AdiPose Most abundant Gene transcript
1). Biochem Biophys Res Commun 1996;221:286-9.
Malenfant P, Joanisse DR, Theriault R, Goodpaster BH, Kelley DE,
Simoneau JA. Fat content in individual muscle fibers of lean and obese
subjects. Int J Obes Relat Metab Disord 2001;25:1316-21.
Martini G, Valenti R, Giovani S, Campagna S, Franci B, Nuti R. Leptin
and body composition in healthy postmenopausal women. Panminerva
Med 2001;43:149-54.
Mayer-Davis EJ, Levin S, Bergman RN, et al. Insulin secretion,
obesity, and potential behavioral influences: results from the Insulin
Resistance Atherosclerosis Study (IRAS). Diabetes Metab Res Rev
2001;17:137-45.
Medici F, Hawa M, Ianari A, Pyke DA, Leslie RD. Concordance rate for
type II diabetes mellitus in monozygotic twins: actuarial analysis.
Diabetologia 1999;42:146-50.
139

Mendler M. Fatty Liver: Nonalcoholic Fatty Liver Disease (NAFLD)
and Nonalcoholic Steatohepatitis (NASH). Internet:
http://www.medicinenet.com/fatty_liver/article.htm (accessed
September 26, 2005).
Mifflin MD, St Jeor ST, Hill LA, Scott BJ, Daugherty SA, Koh YO. A
new predictive equation for resting energy expenditure in healthy
individuals. Am J Clin Nutr 1990;51:241-7.
Molnar D. Insulin secretion and carbohydrate tolerance in childhood
obesity. Klin Padiatr 1990;202:131-5.
Mosthaf L, Vogt B, Haring HU, Ullrich A. Altered expression of insulin
receptor types A and B in the skeletal muscle of non-insulin-
dependent diabetes mellitus patients. Proc Natl Acad Sci U S A
1991;88:4728-30.
Munoz J, Derstine A, Gower BA. Fat distribution and insulin sensitivity
in postmenopausal women: influence of hormone replacement. Obes
Res 2002;10:424-31.
Nakano Y, Tobe T, Choi-Miura NH, Mazda T, Tomita M. Isolation and
characterization of GBP28, a novel gelatin-binding protein purified
from human plasma. J Biochem (Tokyo) 1996;120:803-12.
140

Naressi A, Couturier C, Devos JM, et al. Java-based graphical user
interface for the MRUI quantitation package. MAGMA 2001;12:141-
52.
National Institutes of Health (NIH). Alcoholic liver disease. Internet:
http://www.nlm.nih.gov/medlineplus/ency/article/000281.htm
(accessed September 26, 2005).
Ong KK, Dunger DB. Thrifty genotypes and phenotypes in the
pathogenesis of type 2 diabetes mellitus. J Pediatr Endocrinol Metab
2000;13 Suppl 6:1419-24.
Owen OE, Holup JL, D'Alessio DA, et al. A reappraisal of the caloric
requirements of men. Am J Clin Nutr 1987;46:875-85.
Owen OE, Kavle E, Owen RS, et al. A reappraisal of caloric
requirements in healthy women. Am J Clin Nutr 1986;44:1-19.
Perseghin G, Lattuada G, Danna M, et al. Insulin resistance,
intramyocellular lipid content, and plasma adiponectin in patients
with type 1 diabetes. Am J Physiol Endocrinol Metab 2003;285:E1174-
81.
Perseghin G, Scifo P, De Cobelli F, et al. Intramyocellular triglyceride
content is a determinant of in vivo insulin resistance in humans: a 1H-
141

13C nuclear magnetic resonance spectroscopy assessment in
offspring of type 2 diabetic parents. Diabetes 1999;48:1600-6.
Petersen KF, Dufour S, Befroy D, Lehrke M, Hendler RE, Shulman GI.
Reversal of nonalcoholic hepatic steatosis, hepatic insulin resistance,
and hyperglycemia by moderate weight reduction in patients with
type 2 diabetes. Diabetes 2005;54:603-8.
Pietropaolo M, Le Roith D. Pathogenesis of diabetes: our current
understanding. Clin Cornerstone 2001;4:1-16.
Popkin BM, Doak CM. The obesity epidemic is a worldwide
phenomenon. Nutr Rev 1998;56:106-14.
Poulsen P, Kyvik KO, Vaag A, Beck-Nielsen H. Heritability of type II
(non-insulin-dependent) diabetes mellitus and abnormal glucose
tolerance--a population-based twin study. Diabetologia 1999;42:139-
45.
Radziuk J. Insulin sensitivity and its measurement: structural
commonalities among the methods. J Clin Endocrinol Metab
2000;85:4426-33.
Randle PJ, Garland PB, Hales CN, Newsholme EA. The glucose fatty-
acid cycle. Its role in insulin sensitivity and the metabolic
disturbances of diabetes mellitus. Lancet 1963;1:785-9.
142

Rico-Sanz J, Hajnal JV, Thomas EL, Mierisova S, Ala-Korpela M, Bell
JD. Intracellular and extracellular skeletal muscle triglyceride
metabolism during alternating intensity exercise in humans. J Physiol
1998;510 ( Pt 2):615-22.
Rico-Sanz J, Thomas EL, Jenkinson G, Mierisova S, Iles R, Bell JD.
Diversity in levels of intracellular total creatine and triglycerides in
human skeletal muscles observed by (1)H-MRS. J Appl Physiol
1999;87:2068-72.
Rizk NM, Meier DA, Pastorek DJ, Krakower GR, Kissebah AH. Glucose
utilization in muscle fiber types: use of the partial pancreatectomized
rat model to distinguish effects of glucose and insulin on insulin
resistance. Mol Genet Metab 1998;65:44-50.
Rocha R, Cotrim HP, Carvalho FM, Siqueira AC, Braga H, Freitas LA.
Body mass index and waist circumference in non-alcoholic fatty liver
disease. J Hum Nutr Diet 2005;18:365-70.
Rosenbloom AL, Joe JR, Young RS, Winter WE. Emerging epidemic of
type 2 diabetes in youth. Diabetes Care 1999;22:345-54.
Rosenfalck AM, Almdal T, Hilsted J, Madsbad S. Body composition in
adults with Type 1 diabetes at onset and during the first year of
insulin therapy. Diabet Med 2002;19:417-23.
143

Ryan AS. Insulin resistance with aging: effects of diet and exercise.
Sports Med 2000;30:327-46.
Saad MF, Lillioja S, Nyomba BL, et al. Racial differences in the
relation between blood pressure and insulin resistance. N Engl J Med
1991;324:733-9.
Scherer PE, Williams S, Fogliano M, Baldini G, Lodish HF. A novel
serum protein similar to C1q, produced exclusively in adipocytes. J
Biol Chem 1995;270:26746-9.
Schmitz O, Fisker S, Orskov L, Hove KY, Nyholm B, Moller N. Effects
of hyperinsulinaemia and hypoglycaemia on circulating leptin levels in
healthy lean males. Diabetes Metab 1997;23:80-3.
Schwartz MW, Prigeon RL, Kahn SE, et al. Evidence that plasma
leptin and insulin levels are associated with body adiposity via
different mechanisms. Diabetes Care 1997;20:1476-81.
Seidell JC. Obesity, insulin resistance and diabetes--a worldwide
epidemic. Br J Nutr 2000;83 Suppl 1:S5-8.
Shoji T, Emoto M, Nishizawa Y. HOMA index to assess insulin
resistance in renal failure patients. Nephron 2001;89:348-9.
Sinha R, Dufour S, Petersen KF, et al. Assessment of skeletal muscle
triglyceride content by (1)H nuclear magnetic resonance spectroscopy
144

in lean and obese adolescents: relationships to insulin sensitivity, total
body fat, and central adiposity. Diabetes 2002;51:1022-7.
Sinha S, Rathi M, Misra A, et al. Subclinical inflammation and soleus
muscle intramyocellular lipids in healthy Asian Indian males. Clin
Endocrinol (Oxf) 2005;63:350-5.
Slosman DO, Casez JP, Pichard C, et al. Assessment of whole-body
composition with dual-energy x-ray absorptiometry. Radiology
1992;185:593-8.
So WY, Ng MC, Lee SC, Sanke T, Lee HK, Chan JC. Genetics of type 2
diabetes mellitus. Hong Kong Med J 2000;6:69-76.
Stata Corporation. Stata Statistical Software. 2004; v. 8.1.
Statnick MA, Beavers LS, Conner LJ, et al. Decreased expression of
apM1 in omental and subcutaneous adipose tissue of humans with
type 2 diabetes. Int J Exp Diabetes Res 2000;1:81-8.
Steppan CM, Lazar MA. Resistin and obesity-associated insulin
resistance. Trends Endocrinol Metab 2002;13:18-23.
Story M, Evans M, Fabsitz RR, Clay TE, Holy Rock B, Broussard B.
The epidemic of obesity in American Indian communities and the need
for childhood obesity-prevention programs. Am J Clin Nutr
1999;69:747S-54S.
145

Szczepaniak LS, Babcock EE, Schick F, et al. Measurement of
intracellular triglyceride stores by H spectroscopy: validation in vivo.
Am J Physiol 1999;276:E977-89.
Tack CJ, Ong MK, Lutterman JA, Smits P. Insulin-induced
vasodilatation and endothelial function in obesity/insulin resistance.
Effects of troglitazone. Diabetologia 1998;41:569-76.
Tamura Y, Tanaka Y, Sato F, et al. Effects of diet and exercise on
muscle and liver intracellular lipid contents and insulin sensitivity in
type 2 diabetic patients. J Clin Endocrinol Metab 2005;90:3191-6.
Tarasow E, Siergiejczyk L, Panasiuk A, et al. MR proton spectroscopy
in liver examinations of healthy individuals in vivo. Med Sci Monit
2002;8:MT36-40.
Thamer C, Machann J, Bachmann O, et al. Intramyocellular lipids:
anthropometric determinants and relationships with maximal aerobic
capacity and insulin sensitivity. J Clin Endocrinol Metab
2003;88:1785-91.
Toft I, Bonaa KH, Lindal S, Jenssen T. Insulin kinetics, insulin action,
and muscle morphology in lean or slightly overweight persons with
impaired glucose tolerance. Metabolism 1998;47:848-54.
146
Torriani M, Thomas BJ, Halpern EF, Jensen ME, Rosenthal DI, Palmer
WE. Intramyocellular lipid quantification: repeatability with 1H MR
spectroscopy. Radiology 2005;236:609-14.
Tounian P, Aggoun Y, Dubern B, et al. Presence of increased stiffness
of the common carotid artery and endothelial dysfunction in severely
obese children: a prospective study. Lancet 2001;358:1400-4.
Tschritter O, Fritsche A, Thamer C, et al. Plasma adiponectin
concentrations predict insulin sensitivity of both glucose and lipid
metabolism. Diabetes 2003;52:239-43.
Unwin N, Shaw J, Zimmet P, Alberti KG. Impaired glucose tolerance
and impaired fasting glycaemia: the current status on definition and
intervention. Diabet Med 2002;19:708-23.
Utriainen T, Makimattila S, Virkamaki A, Bergholm R, Yki-Jarvinen H.
Dissociation between insulin sensitivity of glucose uptake and
endothelial function in normal subjects. Diabetologia 1996;39:1477-
82.
Vaag AA, Handberg A, Skott P, Richter EA, Beck-Nielsen H. Glucose-
fatty acid cycle operates in humans at the levels of both whole body
and skeletal muscle during low and high physiological plasma insulin
concentrations. Eur J Endocrinol 1994;130:70-9.
147

Van Gaal LF, Wauters MA, De Leeuw IH. The beneficial effects of
modest weight loss on cardiovascular risk factors. Int J Obes Relat
Metab Disord 1997;21 Suppl 1:S5-9.
van Loon LJ, Koopman R, Manders R, van der Weegen W, van
Kranenburg GP, Keizer HA. Intramyocellular lipid content in type 2
diabetes patients compared with overweight sedentary men and
highly trained endurance athletes. Am J Physiol Endocrinol Metab
2004;287:E558-65.
Vendrell J, Broch M, Vilarrasa N, et al. Resistin, adiponectin, ghrelin,
leptin, and proinflammatory cytokines: relationships in obesity. Obes
Res 2004;12:962-71.
Verma S, McNeill JH. Alterations in the vascular actions of insulin in
the pathogenesis of insulin resistance and hypertension. Adv Exp Med
Biol 2001;498:133-42.
Vidal J. Updated review on the benefits of weight loss. Int J Obes Relat
Metab Disord 2002;26 Suppl 4:S25-8.
Virkamaki A, Korsheninnikova E, Seppala-Lindroos A, et al.
Intramyocellular lipid is associated with resistance to in vivo insulin
actions on glucose uptake, antilipolysis, and early insulin signaling
pathways in human skeletal muscle. Diabetes 2001;50:2337-43.
148

Vouillamoz D, Temler E, Jequier E, Felber JP. Importance of substrate
competition in the mechanism of insulin resistance in man.
Metabolism 1987;36:715-20.
Wang W, Wang Z, Faith MS, Kotler D, Shih R, Heymsfield SB.
Regional skeletal muscle measurement: evaluation of new dual-energy
X-ray absorptiometry model. J Appl Physiol 1999;87:1163-71.
Weiss R, Dufour S, Groszmann A, et al. Low adiponectin levels in
adolescent obesity: a marker of increased intramyocellular lipid
accumulation. J Clin Endocrinol Metab 2003;88:2014-8.
Wellhoener P, Fruehwald-Schultes B, Kern W, et al. Glucose
metabolism rather than insulin is a main determinant of leptin
secretion in humans. J Clin Endocrinol Metab 2000;85:1267-71.
Wendling PS, Peters SJ, Heigenhauser GJ, Spriet LL. Variability of
triacylglycerol content in human skeletal muscle biopsy samples. J
Appl Physiol 1996;81:1150-5.
Weyer C, Yudkin JS, Stehouwer CD, Schalkwijk CG, Pratley RE,
Tataranni PA. Humoral markers of inflammation and endothelial
dysfunction in relation to adiposity and in vivo insulin action in Pima
Indians. Atherosclerosis 2002;161:233-42.
149

Weyers AM, Mazzetti SA, Love DM, Gomez AL, Kraemer WJ, Volek JS.
Comparison of methods for assessing body composition changes
during weight loss. Med Sci Sports Exerc 2002;34:497-502.
World Health Organization (WHO). Global Strategy on Diet, Physical
Activity and Health: Obesity and Overweight. Internet:
http://www.who.int/hpr/NPH/docs/gs_obesity.pdf (accessed 09/14
2005).
World Health Organization (WHO). Obesity: preventing and managing
the global epidemic. Report of a WHO consultation. World Health
Organ Tech Rep Ser 2000;894:i,xii, 1-253.
Yamauchi T, Kamon J, Waki H, et al. The fat-derived hormone
adiponectin reverses insulin resistance associated with both
lipoatrophy and obesity. Nat Med 2001;7:941-6.
Yang WS, Lee WJ, Funahashi T, et al. Weight reduction increases
plasma levels of an adipose-derived anti-inflammatory protein,
adiponectin. J Clin Endocrinol Metab 2001;86:3815-9.
Youssef WI, McCullough AJ. Steatohepatitis in obese individuals. Best
Pract Res Clin Gastroenterol 2002;16:733-47.
150

Zierath JR, Wallberg-Henriksson H. From receptor to effector: insulin
signal transduction in skeletal muscle from type II diabetic patients.
Ann N Y Acad Sci 2002;967:120-34.
151

8 CURRICULUM VITAE
CHRYSSANTHI L. STYLIANOPOULOS
Johns Hopkins Bloomberg School of Public Health615 N. Wolfe Street, W2041
Baltimore, MD 21205Email: [email protected]
Phone: 410-502-3332
EDUCATION
9/01–12/05 JOHNS HOPKINS BLOOMBERG SCHOOL OF PUBLIC HEALTH, Baltimore, MD.PhD, Human Nutrition
9/02–7/04 JOHNS HOPKINS BLOOMBERG SCHOOL OF PUBLIC HEALTH, Baltimore, MD.MHS, Biostatistics
8/97–7/99: I. T. E. S. M., Monterrey, Mexico.MS, Biotechnology
9/92–8/96: THE UNIVERSITY OF MEMPHIS, Memphis, TN.BS Summa Cum Laude, in Chemistry with minor in Biology and Mathematics
PROFESSIONAL EXPERIENCE
7/02–12/05 JOHNS HOPKINS BLOOMBERG SCHOOL OF PUBLIC HEALTH, Baltimore, MDResearch Assistant in Human Nutrition Study of the role of intramyocellular fatty acids
on the etiology of the insulin resistance of obesity Study of dietary fat intake and uncoupling protein
expression in lean and obese mice
4/02–10/04 JOHNS HOPKINS BLOOMBERG SCHOOL OF PUBLIC HEALTH, Baltimore, MDTeaching Assistant in Principles of Human NutritionDevelopment of course exercises and exams, grading and assisting students with questions
152

10/00–7/01 REXALL SUNDOWN, Boca Raton, FLAnalytical Chemist II – Quality Control DepartmentMethod validation in microbiology, proximate analysis and chemical testing of nutritional supplements and food products
9/98–7/99 I. T. E. S. M., Monterrey, MexicoResearch Assistant in Biotechnology and Food ScienceStudy of the effects of the fortification and enrichment of tortillas on the cerebral and physiological growth of rats
10/9–-9/98 I. T. E. S. M., Monterrey, MexicoResearch Assistant in Cellular Biology Study of the gelatinization of potato using video-
enhanced microscopy and image analysis Study of the air contamination in the US-Mexico border
area
10/96–2/97 WOODSON - TENENT LABORATORIES, Memphis, TN
Micro-Analyst – Antibiotics / Analytical Microbiology Department
Coordinate laboratory testing of livestock feed samples.
1/96–12/96 THE UNIVERSITY OF MEMPHIS, Memphis, TNResearch Assistant in Computational ChemistryStudy of vanadium peroxide structures using computer modeling and computational chemistry calculations to discover possible insulin mimics
9/92–5/96 THE UNIVERSITY OF MEMPHIS, Memphis, TNTutor in Science and Mathematics. Specialized in
disabled students
LANGUAGES
Greek, English, Spanish – Fluency in speaking, excellent reading and writing skills.
HONORS AND AWARDS
05/05: Elsa Orent Keiles Fellowship – JHSPH, Baltimore, MD.
153

05/05: Harry D. Kruse Fellowship – JHSPH, Baltimore, MD.
10/02 – 9/05: National Research Service Award Research
Training Grant – NIH, Bethesda, MD.
8/98 – 7/99: Research Fellowship – GIMSA, Monterrey, Mexico.
6/93: Honors Certificate – THE UNIVERSITY OF MEMPHIS,
Memphis, TN.
9/92 – 8/96: Early Scholars’ Scholarship – THE UNIVERSITY
OF MEMPHIS, Memphis, TN.
PROFESSIONAL SOCIETIES
7/02–present American Society for Nutrition
7/02–present North American Association for the Study
of Obesity
3/05–present American College of Sports Medicine
9/92 – 8/96: Alpha Epsilon Delta Honor Society
PUBLICATIONS
1. Stylianopoulos CL (2005) Carbohydrates: Chemistry and Classification (Including Dietary Fiber). In: Caballero B, Allen L and Prentice A (eds) Encyclopedia of Human Nutrition, 2nd
edition. London: Elsevier Ltd.
2. Stylianopoulos CL (2005) Carbohydrates: Regulation of Carbohydrate Metabolism. In: Caballero B, Allen L and Prentice A (eds) Encyclopedia of Human Nutrition, 2nd edition. London: Elsevier Ltd.
154
3. Stylianopoulos CL (2005) Carbohydrates: Requirements and Dietary Importance. In: Caballero B, Allen L and Prentice A (eds) Encyclopedia of Human Nutrition, 2nd edition. London: Elsevier Ltd.
4. Stylianopoulos C, Serna Saldívar SO, MacKinney GA. Effects of Fortification and Enrichment of Maize Tortillas on Growth and Brain Development of Rats Throughout Two Generations. Cereal Chemistry 2002; 79(1): 85 – 91.
5. Cundari TR, Sisterhen LL, Stylianopoulos C. Molecular Modeling of Vanadium Peroxides. Inorganic Chemistry 1997; 36(18): 4029 – 4034 and 36(25): 5972.
155