2 INTERNATIONAL CONFERENCE ON RAW MATERIALS TO …
359
2 ND INTERNATIONAL CONFERENCE ON RAW MATERIALS TO PROCESSED FOODS 03 - 04 JUNE 2021 C O N F E R E N C E P R O C E E D I N G S ISBN: 978-625-00-9702-1
Transcript of 2 INTERNATIONAL CONFERENCE ON RAW MATERIALS TO …
2ND INTERNATIONAL CONFERENCE ON RAW MATERIALS TO PROCESSED FOODS
03 - 04 JUNE 2021
C O N F E R E N C E P R O C E E D I N G S
ISBN: 978-625-00-9702-1
International Conference on
RAW MATERIALS TO PROCESSED FOODS 03-04 June 2021, Turkey
2
RPFOODS 2021 CONFERENCE PROCEEDINGS
2nd International Conference on Raw Materials to Processed Foods
Editors
Prof. Dr. Serkan SELLI / Food Engineering Department, Cukurova University
Prof. Dr. Hasim KELEBEK / Food Engineering Department, Adana Alparslan Turkes Science and Technology
University
ISBN: 978-625-00-9702-1
No part of this publication may be reproducedor transmitted in any form by means, electronic or mechanical, including
photocopy, or any information storage and retrieval system, without permission from the Publisher.
Published Date: September, 2021
International Conference on
RAW MATERIALS TO PROCESSED FOODS 03-04 June 2021, Turkey
3
Table of Contents
Attendance list ....................................................................................................................... 1
Committees of RPFOODS 2021 ........................................................................................... 4
Conference Programme ......................................................................................................... 7
Presentations ....................................................................................................................... 20

International Conference on
RAW MATERIALS TO PROCESSED FOODS 03-04 June 2021, Turkey
1
ATTANDANCE LIST ABDERRAHMANE AIT KADDOUR - FRANCE AHMET SALIH SONMEZDAG
ABDUL MALIK - INDIA ALEV YÜKSEL AYDAR
ABID HASNAIN - PAKISTAN AYŞE HANDAN BAYSAL
ADAMO DOMENICO ROMBOLA - ITALIA AYŞE NESLİHAN DÜNDAR
ADEKEMI ESTHER ADEWUYI - NIGERIA AYŞE TÜLİN ÖZ
ABDERRAHMANE AIT-KADDOUR - FRANCE BANU METİN
ALI RAFE - IRAN BASAR SEVINDIK
AMADOU DICKO- FRANCE BERFU GELEN
ANA FLÁVIA RAMOS - BRAZIL BEYZA ÖZPALAS
ANGEL ANTONIO CARBONELL BARRACHINA - SPAIN BİLAL AĞIRMAN
ANIDA YUSOFF- MALAYSIA BİRSEN SARICI
ANJALI A BHOITE - INDIA BURCU ÖZTÜRK KERİMOĞLU
ANNA MICHALSKA-CIECHANOWSKA - POLAND CÜNEYT DİNÇER
ANWAR BOUALI - TUNISIA ÇAĞIM AKBULUT ÇAKIR
APOSTOLOS KIRITSAKIS - GREECE DUYGU ÜSKÜTOĞLU
B. GHIASI TARZI- IRAN EDA ADAL
BELOUFA NABIL - UZBEKISTAN EDA ÖNDÜL KOÇ
BORD, C. - FRANCE ELİF TUĞÇE AKSUN
BRUCE HAMAKER - USA EMİR AYŞE ÖZER
BRUNA MARA APARECIDA DE CARVALHO- BRAZIL ERVA PARILDI
CECILIO TAPIA IGNACIO - PORTUGAL ESRA ÇAPANOĞLU
CHANG-QING DUAN - CHINA ESRA ESİN YÜCEL
CHARU GUPTA - ARGENTINA FATİH ÖZ
CHENG ZHONG- CHINA FIRAT ÇINAR
CHARALAMPOS ANOUSAKIS - GREECE HAŞİM KELEBEK
CHARU GUPTA - INDIA GAMZE GÜÇLÜ
CHEOL HO PARK – SOUTH KOREA GAMZE SONKAYA
DEVINDER KAUR - INDIA GÖKHAN DURMAZ
DING-XIN PENG - CHINA GÖZDE OĞUZ KORKUT
DHAN PRAKASH - INDIA GÜRBÜZ GÜNEŞ
DOINA ANDRONOIU - ROMANIA GÜRKAN TÜRK
DRITAN TOPI - ALBANIA HAMZA BOZKIR
EMMANUEL ANYACHUKWU IRONDI - NIGERIA HANDE BALTACIOĞLU
FAIZA SHAIKH - PAKISTAN HASENE KESKİN
FABIANE NEVES SILVA - BRAZIL HATİCE KIRTIL
FRANCISCO JAVIER GUZMAN - MEXICO HÜLYA SERPİL KAVUŞAN
GABRIELA R. LEMOS MENDES - BRAZIL HÜSEYİN ERTEN
GEANY PERUCH CAMILLOTO- BRAZIL İNCİ CERİT
GEORGIANA GABRIELA CODINĂ - ROMANIA MEHMET FATİH CENGİZ
GITI SABET TEYMOURI - IRAN MEHMET YETIŞEN
HIDAJETE MUHARREMI- KOSOVO MELİS SÜMENGEN ÖZDENEFE
HÉLA EL FERCHICHI OUARDA- TUNISIA MERIC SIMSEK
IBTISAM E. M. EL ZUBEIR- SUDAN MERVE DARICI
INTAN NURSYAKILA ZAINAL ABIDIN- MALAYSIA MUHARREM KESKİN
IGOR VIANA BRANDI - BRAZIL MUSTAFA BAYRAM
ISABEL ESCRICHE - SPAIN MÜGE CANATAR
JASUR SAFAROV - UZBEKISTAN NURTEN CENGİZ

International Conference on
RAW MATERIALS TO PROCESSED FOODS 03-04 June 2021, Turkey
2
JANAINA TELES DE FARIA- BRAZIL ONUR SEVİNDİK
JESSICA BRZEZOWSKA - POLAND ÖZLEM YÜNCÜ
JOLANTA KRÓL - POLAND PERİHAN YOLCI ÖMEROĞLU
JURGA BUDIENE - LITHUANIA RIDVAN ARSLAN
JUMAEV B.M. - UZBEKISTAN SALİH AKSAY
J. A. ALI WALA - SUDAN SALİH KARASU
JULIANA PINTO DE LIMA- BRAZIL SENEM KAMİLOĞLU BEŞTEPE
JUNG-WAN KIM – SOUTH KOREA SERKAN SELLİ
KARTIKEY CHATURVEDI - INDIA SONER SOYLU
KANAEVA R.N. - UZBEKISTAN SÜLEYMAN POLAT
KHUDOYBERDIEV M.A. - UZBEKISTAN TEFİDE KIZILDENİZ
LAURA MIHAI - ROMANIA TUĞBA DEDEBAŞ
LEONTINA LIPAN - SPAIN TUĞBA ÖZDAL
LUBNA RAZA - PAKISTAN TURGAY ÇETİNKAYA
LOUDIYI, M. - FRANCE TURGUT CABAROĞLU
MARIA PAPAPOSTOLOU - GREECE TURKAN UZLASIR
MAIMUNAH SANNY- MALAYSIA TÜRKAN KEÇELİ MUTLU
MARYAM ‘AFIFAH ABDUL LATIF- MALAYSIA ZEYNEP ERGÜN
MAJLINDA VASJARI - ALBANIA
MATTEO BORDIGA - ITALY
MEENA KUMARI - INDIA
MICHELE DI FOGGIA - ITALY MILAN CERTIK - SLOVAK REPUBLIC
MILTON NOBEL CANO CHAUCA- BRAZIL
MIOARA NEGOIȚĂ - ROMANIA
MOHAMED BOUAZIZ - TUNISIA
MOHAMED NADJIB BOUKHATEM - ALGERIA
MOHAMED LARBI KHOUJA- TUNISIA
MOZHGAN SABET TEIMORI - IRAN
MONICA AZUCENA NAZARENO - ARGENTINA
MUNIR DANDAGO - NIGERIA
M. ZELANVAR- IRAN
NARZULLAEV M.S. - UZBEKISTAN
NEVILA BROLI - ALBANIA
NOORLAILA AHMAD - MALAYSIA
NOGUEIRA LIMA- BRAZIL
NORIZZAH ABD RASHID- MALAYSIA
NORIHAM A. - MALAYSIA
NOR HASANAH, H. - MALAYSIA
OANA VIORELA NISTOR - ROMANIA
OUMAYMA BOUKRIA - FRANCE
P. DAMANAFSHAN- IRAN
PARMJIT S. PANESAR - INDIA
PINTU CHOUDHARY - INDIA
PUI LIEW PHING - MALAYSIA
International Conference on
RAW MATERIALS TO PROCESSED FOODS 03-04 June 2021, Turkey
3
QING-HAO JIN - CHINA
RADHA KUSHWAHA - UZBEKISTAN
RAFAEL OLIVEIRA - PORTUGAL
RANIA BEN NASR - FRANCE
RENATO SOUZA CRUZ - BRAZIL
RONALD PEGG - USA
S. THIRUKKUMAR - INDIA
SARA ATEK LEZZOUM - ALGERIA
SAMANDAROV D.I. - UZBEKISTAN
SENAY SIMSEK - USA
SEERATPREET KAUR - INDIA
SÉRGIO HENRIQUE SOUSA SANTOS- BRAZIL
SENJIA ZHANG- CHINA
SHAKHNOZA SULTANOVA - UZBEKISTAN
SHOIB MOHMAD WANI - INDIA
SIDDHARTHA SINGHA - INDIA
SITI AZIMA A. M. - MALAYSIA
SILVIU GABRIEL STROE - ROMANIA
SUDIP CHAKRABORTY - ITALY
SORINA ROPCIUC - ROMANIA
TAHIRA MOHSIN ALI - PAKISTAN
TANASE (BUTNARIU) LUIZA-ANDREEA - ROMANIA
TERAWAAN SUWAN - THAILAND
TIANZHEN ZHANG- CHINA
VIKTORIJA EISINAITE - LITHUANIA
YARI JAGUEY-HERNÁNDEZ - MEXICO
YULIBAYEV M. - UZBEKISTAN
YUQING SHEN- CHINA
ZARAI ZIED - TUNISIA
ZAIBUNNISA ABDUL HAIYEE- MALAYSIA
XIYU CHENG- CHINA
WAFA GHNIMI - FRANCE
WILLIAM JAMES- BRAZIL
WENCHAO LI- CHINA
International Conference on
RAW MATERIALS TO PROCESSED FOODS 03-04 June 2021, Turkey
4
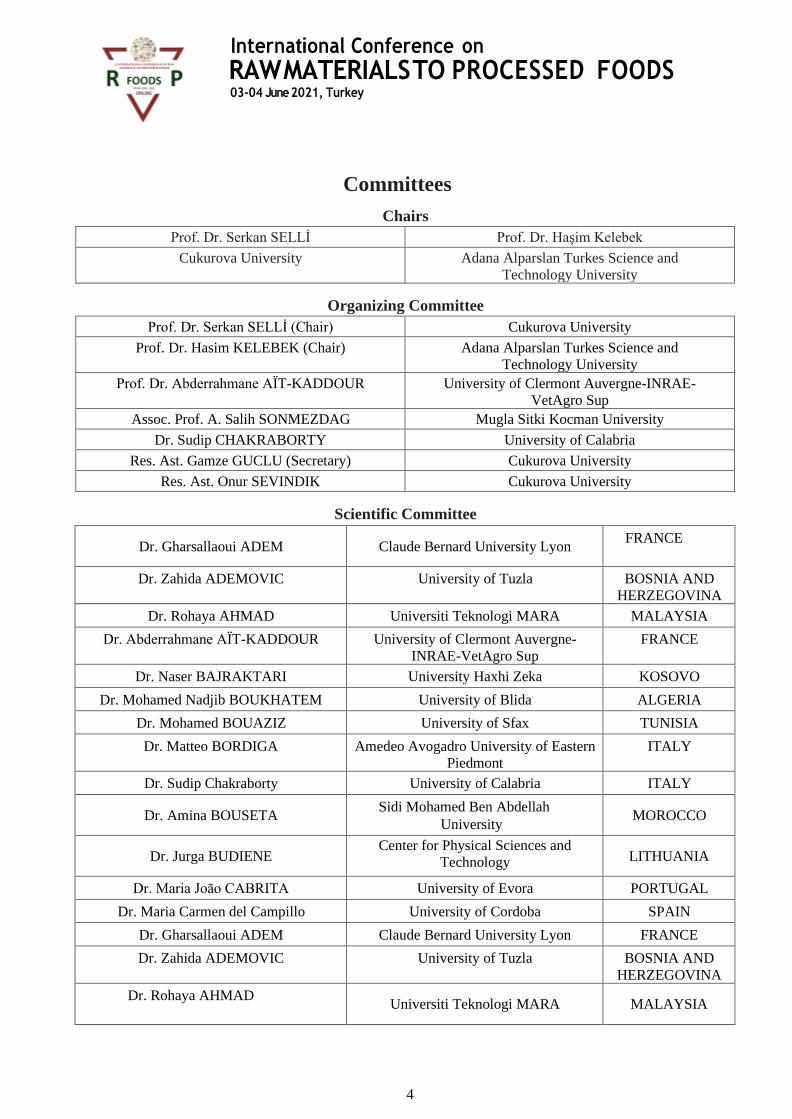
Committees
Chairs
Prof. Dr. Serkan SELLİ Prof. Dr. Haşim Kelebek
Cukurova University Adana Alparslan Turkes Science and
Technology University
Organizing Committee
Prof. Dr. Serkan SELLİ (Chair) Cukurova University
Prof. Dr. Hasim KELEBEK (Chair) Adana Alparslan Turkes Science and
Technology University
Prof. Dr. Abderrahmane AÏT-KADDOUR University of Clermont Auvergne-INRAE-
VetAgro Sup
Assoc. Prof. A. Salih SONMEZDAG Mugla Sitki Kocman University
Dr. Sudip CHAKRABORTY University of Calabria
Res. Ast. Gamze GUCLU (Secretary) Cukurova University
Res. Ast. Onur SEVINDIK Cukurova University
Scientific Committee
Dr. Gharsallaoui ADEM Claude Bernard University Lyon FRANCE
Dr. Zahida ADEMOVIC University of Tuzla BOSNIA AND
HERZEGOVINA
Dr. Rohaya AHMAD Universiti Teknologi MARA MALAYSIA
Dr. Abderrahmane AÏT-KADDOUR University of Clermont Auvergne-
INRAE-VetAgro Sup
FRANCE
Dr. Naser BAJRAKTARI University Haxhi Zeka KOSOVO
Dr. Mohamed Nadjib BOUKHATEM University of Blida ALGERIA
Dr. Mohamed BOUAZIZ University of Sfax TUNISIA
Dr. Matteo BORDIGA Amedeo Avogadro University of Eastern
Piedmont
ITALY
Dr. Sudip Chakraborty University of Calabria ITALY
Dr. Amina BOUSETA Sidi Mohamed Ben Abdellah
University MOROCCO
Dr. Jurga BUDIENE Center for Physical Sciences and
Technology LITHUANIA
Dr. Maria João CABRITA University of Evora PORTUGAL
Dr. Maria Carmen del Campillo University of Cordoba SPAIN
Dr. Gharsallaoui ADEM Claude Bernard University Lyon FRANCE
Dr. Zahida ADEMOVIC University of Tuzla BOSNIA AND
HERZEGOVINA
Dr. Rohaya AHMAD Universiti Teknologi MARA MALAYSIA

International Conference on
RAW MATERIALS TO PROCESSED FOODS 03-04 June 2021, Turkey
5
Committees
Scientific Committee
Dr. Ángel A CARBONELL-
BARRACHINA
Miguel Hernández University of Elche SPAIN
Dr. Milan CERTIK Slovak University of Technology SLOVAK
REPUBLIC
Dr. Pedro CORREIA University of Algarve PORTUGAL
Dr. Natka ĆURKO University of Zagreb CROATIA
Dr. Miriam DEL POZO BAYÓN Institute of Food Science Research SPAIN
Prof.Dr. David HERAK Czech University of Life Sciences
Prague
CZECH
REPUBLIC
Dr. Francisca HERNÁNDEZ-
GARCÍA
Universidad Miguel Hernández
de Elche SPAIN
Dr. Mohammed FARID The University of Auckland NEW ZEALAND
Dr. Aneta WOJDYŁO Wrocław University of Environmental
and Life Sciences
POLAND
Dr. Adam FIGIEL Wrocław University of Environmental
and Life Sciences
POLAND
Dr. José ESCALONA University of Balearic Islands SPAIN
Dr. Wessam GALIA VetAgro Sup
FRANCE
Dr. Antonio GELSOMINO Università degli Studi Mediterranea di
Reggio Calabria
ITALIA
Dr. Miroslava KACANIOVÁ Slovak University of Agriculture in Nitra SLOVAK
REPUBLIC
Dr. Antoni SZUMNY Wrocław University of Environmental
and Life Sciences
POLAND
Dr. Abid HASNAIN University of Karachi PAKISTAN
Dr. Laura STAN University of Agricultural Sciences and
Veterinary Medicine
ROMANIA
Dr. Ghozlene MEKHLOUFI Paris-Sud University FRANCE
Dr. Hela EL FERCHICHI OUARDA University of Carthage TUNISIA
Dr. Maribela PESTANA University of Algarve PORTUGAL
Dr. Abdul MALIK Aligarh Muslim University INDIA
Dr. Brijesh TIWARI Teagasc Food Research Centre IRELAND
Dr. Taha RABABAH Jordan University of Science and
Technology JORDAN
Dr. Miroslav NIKOLIC University of Belgrade SERBIA
International Conference on
RAW MATERIALS TO PROCESSED FOODS 03-04 June 2021, Turkey
6
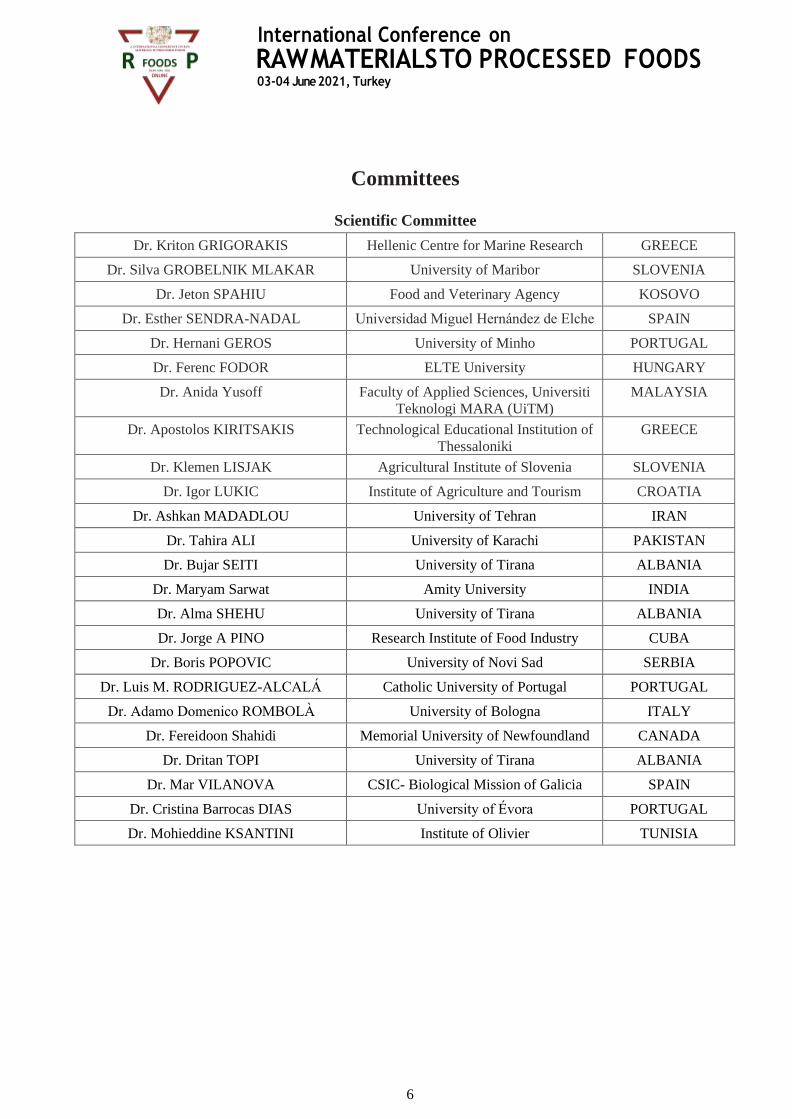
Committees
Scientific Committee
Dr. Kriton GRIGORAKIS Hellenic Centre for Marine Research GREECE
Dr. Silva GROBELNIK MLAKAR University of Maribor SLOVENIA
Dr. Jeton SPAHIU Food and Veterinary Agency KOSOVO
Dr. Esther SENDRA-NADAL Universidad Miguel Hernández de Elche SPAIN
Dr. Hernani GEROS University of Minho PORTUGAL
Dr. Ferenc FODOR ELTE University HUNGARY
Dr. Anida Yusoff Faculty of Applied Sciences, Universiti
Teknologi MARA (UiTM)
MALAYSIA
Dr. Apostolos KIRITSAKIS Technological Educational Institution of
Thessaloniki
GREECE
Dr. Klemen LISJAK Agricultural Institute of Slovenia SLOVENIA
Dr. Igor LUKIC Institute of Agriculture and Tourism CROATIA
Dr. Ashkan MADADLOU University of Tehran IRAN
Dr. Tahira ALI University of Karachi PAKISTAN
Dr. Bujar SEITI University of Tirana ALBANIA
Dr. Maryam Sarwat Amity University INDIA
Dr. Alma SHEHU University of Tirana ALBANIA
Dr. Jorge A PINO Research Institute of Food Industry CUBA
Dr. Boris POPOVIC University of Novi Sad SERBIA
Dr. Luis M. RODRIGUEZ-ALCALÁ Catholic University of Portugal PORTUGAL
Dr. Adamo Domenico ROMBOLÀ University of Bologna ITALY
Dr. Fereidoon Shahidi Memorial University of Newfoundland CANADA
Dr. Dritan TOPI University of Tirana ALBANIA
Dr. Mar VILANOVA CSIC- Biological Mission of Galicia SPAIN
Dr. Cristina Barrocas DIAS University of Évora PORTUGAL
Dr. Mohieddine KSANTINI Institute of Olivier TUNISIA
International Conference on
RAW MATERIALS TO PROCESSED FOODS 03-04 June 2021, Turkey
7
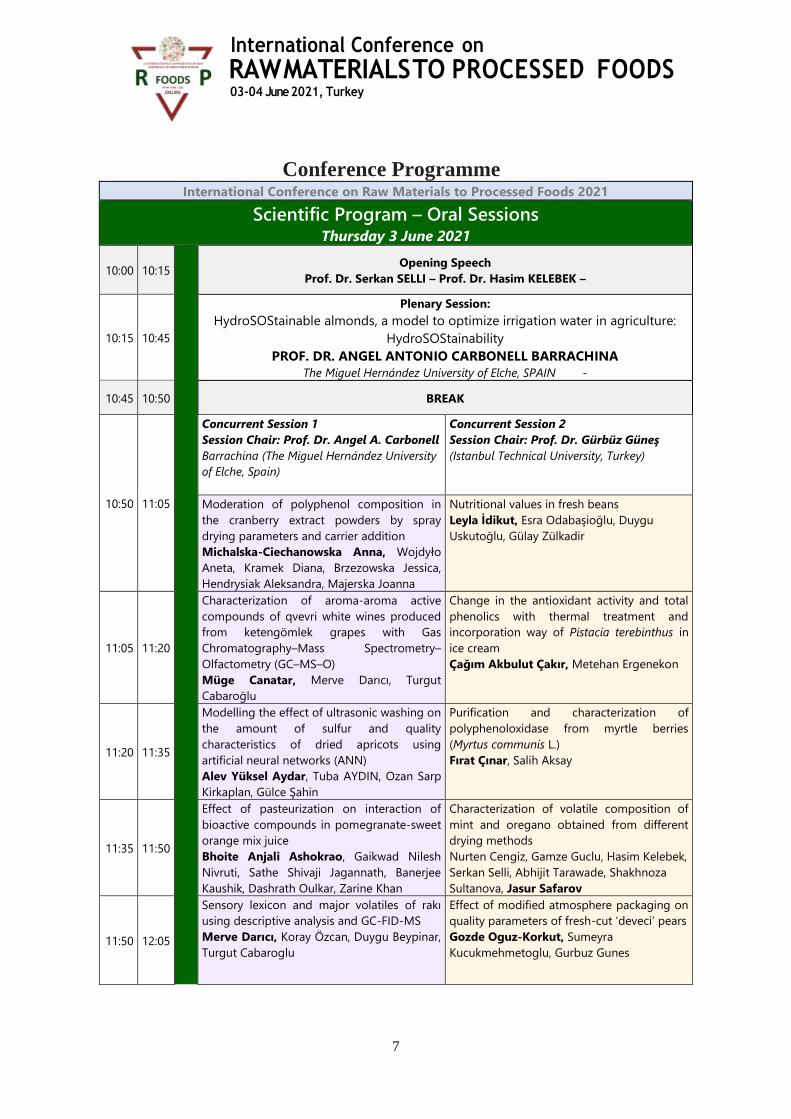
Conference Programme International Conference on Raw Materials to Processed Foods 2021
Scientific Program – Oral Sessions
Thursday 3 June 2021
10:00 10:15
Opening Speech
Prof. Dr. Serkan SELLI – Prof. Dr. Hasim KELEBEK –
10:15 10:45
Plenary Session:
HydroSOStainable almonds, a model to optimize irrigation water in agriculture:
HydroSOStainability
PROF. DR. ANGEL ANTONIO CARBONELL BARRACHINA
The Miguel Hernández University of Elche, SPAIN -
10:45 10:50 BREAK
10:50 11:05
Concurrent Session 1
Session Chair: Prof. Dr. Angel A. Carbonell
Barrachina (The Miguel Hernández University
of Elche, Spain)
Concurrent Session 2
Session Chair: Prof. Dr. Gürbüz Güneş
(Istanbul Technical University, Turkey)
Moderation of polyphenol composition in
the cranberry extract powders by spray
drying parameters and carrier addition
Michalska-Ciechanowska Anna, Wojdyło
Aneta, Kramek Diana, Brzezowska Jessica,
Hendrysiak Aleksandra, Majerska Joanna
Nutritional values in fresh beans
Leyla İdikut, Esra Odabaşioğlu, Duygu
Uskutoğlu, Gülay Zülkadir
11:05 11:20
Characterization of aroma-aroma active
compounds of qvevri white wines produced
from ketengömlek grapes with Gas
Chromatography–Mass Spectrometry–
Olfactometry (GC–MS–O)
Müge Canatar, Merve Darıcı, Turgut
Cabaroğlu
Change in the antioxidant activity and total
phenolics with thermal treatment and
incorporation way of Pistacia terebinthus in
ice cream
Çağım Akbulut Çakır, Metehan Ergenekon
11:20 11:35
Modelling the effect of ultrasonic washing on
the amount of sulfur and quality
characteristics of dried apricots using
artificial neural networks (ANN)
Alev Yüksel Aydar, Tuba AYDIN, Ozan Sarp
Kirkaplan, Gülce Şahin
Purification and characterization of
polyphenoloxidase from myrtle berries
(Myrtus communis L.)
Fırat Çınar, Salih Aksay
11:35 11:50
Effect of pasteurization on interaction of
bioactive compounds in pomegranate-sweet
orange mix juice
Bhoite Anjali Ashokrao, Gaikwad Nilesh
Nivruti, Sathe Shivaji Jagannath, Banerjee
Kaushik, Dashrath Oulkar, Zarine Khan
Characterization of volatile composition of
mint and oregano obtained from different
drying methods
Nurten Cengiz, Gamze Guclu, Hasim Kelebek,
Serkan Selli, Abhijit Tarawade, Shakhnoza
Sultanova, Jasur Safarov
11:50 12:05
Sensory lexicon and major volatiles of rakı
using descriptive analysis and GC-FID-MS
Merve Darıcı, Koray Özcan, Duygu Beypinar,
Turgut Cabaroglu
Effect of modified atmosphere packaging on
quality parameters of fresh-cut ‘deveci’ pears
Gozde Oguz-Korkut, Sumeyra
Kucukmehmetoglu, Gurbuz Gunes

International Conference on
RAW MATERIALS TO PROCESSED FOODS 03-04 June 2021, Turkey
8
12:05 12:20
Antifungal activities of essential oils against
mycotoxigenic fungal agent Fusarium
incarnatum, causal disease agent of pepper
fruit rot
Soner Soylu, Mehmet Atay, Merve Kara,
Aysun Uysal, Emine Mine Soylu, Şener Kurt
Effect of industrial freezing process on the
bioaccessibility of carotenoids in organic
butternut squash (Cucurbita moschata)
Senem Kamiloglu, Elif Koç Alibaşoğlu, Büşra
Acoğlu
12:20 12:40 BREAK
Concurrent Session 3
Session Chair: Prof. Dr. Parmjit S. Panesar
(Sant Longowal Institute of Engineering &
Technology, India)
Concurrent Session 4
Session Chair: Prof. Dr. Abdul Malik
(Aligarh Muslim University, India)
12:40 12:55
Bio-valorization of whey to high value
products for sustainable environmental
management
Parmjit S. Panesar
Impact of sodium alginate packaging film
with seed extract of Syzygium cumini on
Multi-drug resistant Escherichia coli isolated
from raw buffalo meat
Abdul Malik
12:55 13:10
Identification of fungal species from turkish
mold-ripened cheeses and the
morphological and genetic diversity of
Penicillium roqueforti isolates
Hatice Ebrar Kırtıl, Banu Metin
Effect of chia (Salvia hispanica L.) seed
mucilage on lipid oxidation of reduced-fat
beef patties
Özlem Yüncü, Serpil Kavuşan, Meltem
Serdaroğlu
13:10 13:25
Delineation of Molecular Structure
Modification of Camel Milk and Cow Milk
Mixtures during Coagulation by 2D-cross
Correlation Spectroscopy Coupled with
Molecular Fluorescence Spectroscopy
Oumayma Boukria, El Mestafa El Hadrami,
Jasur Safarov, Shakhnoza Sultanova,
Françoise Leriche, Abderrahmane Aït-
Kaddour
The use of arugula and barberry extracts as
nitrite alternative in heat-treated fermented
sausages
Hilal Can, Burcu Sarı, Hülya Serpil Kavuşan,
Meltem Serdaroğlu
13:25 13:40
A comparison of the acid gelation properties
of nonfat cow, sheep and goat milks with
standardized protein contents
Çağım Akbulut Çakır, Ergül Teker
A sensory observation at a house for
different fish species stored at room
temperature
Zafer Ceylan, Oktay Tomar, Abdullah Çağlar,
Turgay Çetinkaya
13:40 13:55
Optimization of extraction parameters to
improve cottonseed milk yield and reduce
gossypol levels using response surface
methodology (RSM)
Thirukkumar S, Hemalatha, Vellaikumar,
Amutha
Development of special designed meatballs
technology
Tanase (Butnariu) Luiza-Andreea,
Andronoiu Doina-Georgeta, Nistor Oana-
Viorela, Mocanu Gabriel-Danut, Barbu
Vasilica-Viorica, Botez Elisabeta
13:55 14:10 BREAK
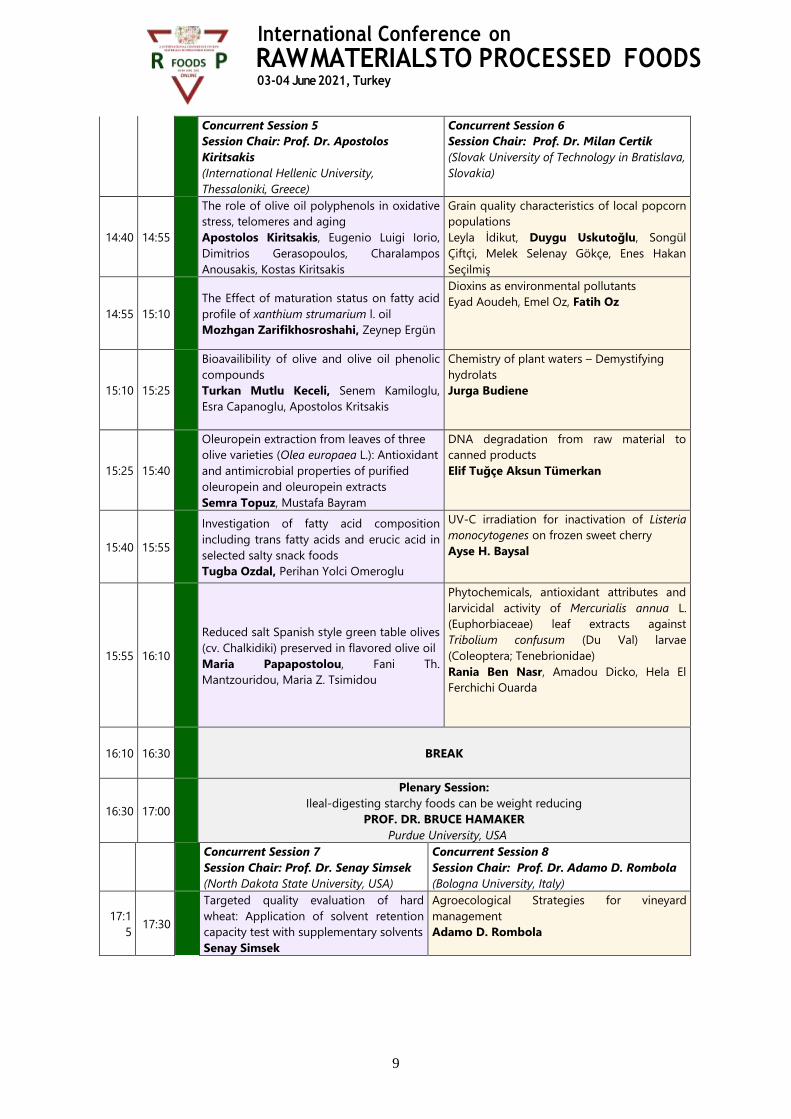
14:10 14:40
Plenary Session:
Biotechnologically prepared functional agro-based bioproducts as new types of food/feed
supplement with required nutritional design
PROF. DR. MILAN CERTIK
Slovak University of Technology in Bratislava, SLOVAKIA
International Conference on
RAW MATERIALS TO PROCESSED FOODS 03-04 June 2021, Turkey
9
Concurrent Session 5
Session Chair: Prof. Dr. Apostolos
Kiritsakis
(International Hellenic University,
Thessaloniki, Greece)
Concurrent Session 6
Session Chair: Prof. Dr. Milan Certik
(Slovak University of Technology in Bratislava,
Slovakia)
14:40 14:55
Τhe role of olive oil polyphenols in oxidative
stress, telomeres and aging
Apostolos Kiritsakis, Eugenio Luigi Iorio,
Dimitrios Gerasopoulos, Charalampos
Anousakis, Kostas Kiritsakis
Grain quality characteristics of local popcorn
populations
Leyla İdikut, Duygu Uskutoğlu, Songül
Çiftçi, Melek Selenay Gökçe, Enes Hakan
Seçilmiş
14:55 15:10
The Effect of maturation status on fatty acid
profile of xanthium strumarium l. oil
Mozhgan Zarifikhosroshahi, Zeynep Ergün
Dioxins as environmental pollutants
Eyad Aoudeh, Emel Oz, Fatih Oz
15:10 15:25
Bioavailibility of olive and olive oil phenolic
compounds
Turkan Mutlu Keceli, Senem Kamiloglu,
Esra Capanoglu, Apostolos Kritsakis
Chemistry of plant waters – Demystifying
hydrolats
Jurga Budiene
15:25 15:40
Oleuropein extraction from leaves of three
olive varieties (Olea europaea L.): Antioxidant
and antimicrobial properties of purified
oleuropein and oleuropein extracts
Semra Topuz, Mustafa Bayram
DNA degradation from raw material to
canned products
Elif Tuğçe Aksun Tümerkan
15:40 15:55
Investigation of fatty acid composition
including trans fatty acids and erucic acid in
selected salty snack foods
Tugba Ozdal, Perihan Yolci Omeroglu
UV-C irradiation for inactivation of Listeria
monocytogenes on frozen sweet cherry
Ayse H. Baysal
15:55 16:10
Reduced salt Spanish style green table olives
(cv. Chalkidiki) preserved in flavored olive oil
Maria Papapostolou, Fani Th.
Mantzouridou, Maria Z. Tsimidou
Phytochemicals, antioxidant attributes and
larvicidal activity of Mercurialis annua L.
(Euphorbiaceae) leaf extracts against
Tribolium confusum (Du Val) larvae
(Coleoptera; Tenebrionidae)
Rania Ben Nasr, Amadou Dicko, Hela El
Ferchichi Ouarda
16:10 16:30 BREAK
16:30 17:00
Plenary Session:
Ileal-digesting starchy foods can be weight reducing
PROF. DR. BRUCE HAMAKER
Purdue University, USA
Concurrent Session 7
Session Chair: Prof. Dr. Senay Simsek
(North Dakota State University, USA)
Concurrent Session 8
Session Chair: Prof. Dr. Adamo D. Rombola
(Bologna University, Italy)
17:1
5 17:30
Targeted quality evaluation of hard
wheat: Application of solvent retention
capacity test with supplementary solvents
Senay Simsek
Agroecological Strategies for vineyard
management
Adamo D. Rombola
International Conference on
RAW MATERIALS TO PROCESSED FOODS 03-04 June 2021, Turkey
10
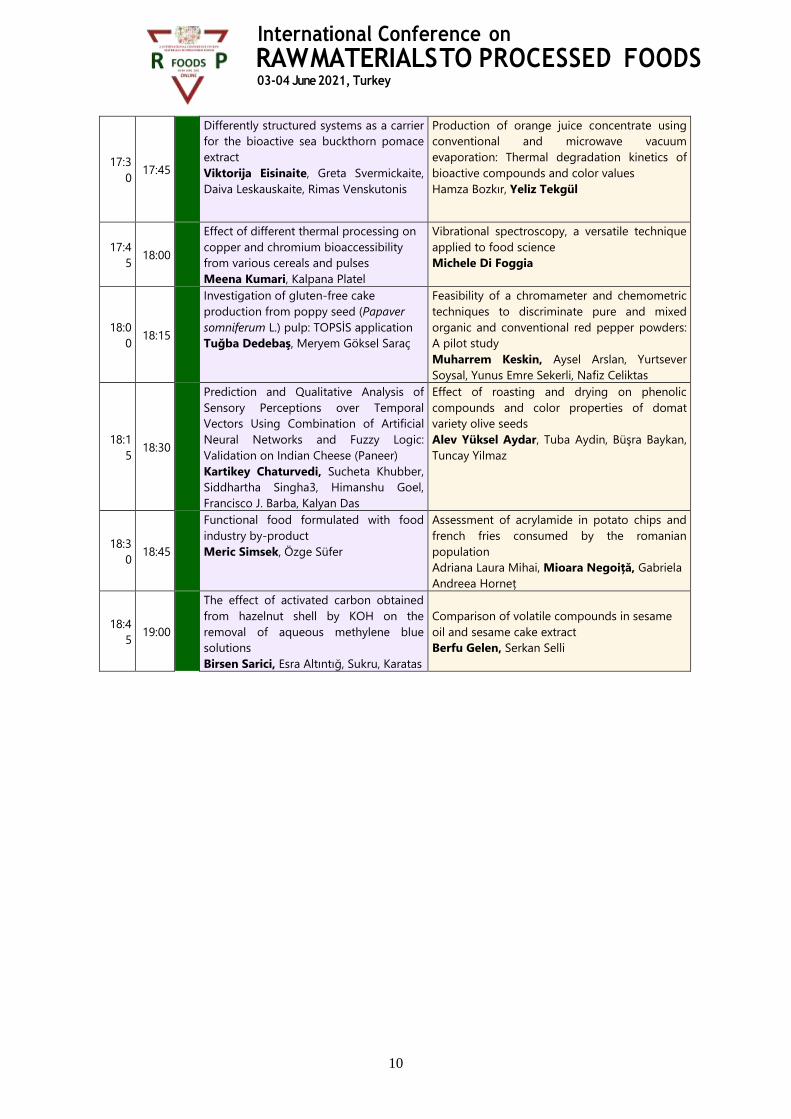
17:3
0 17:45
Differently structured systems as a carrier
for the bioactive sea buckthorn pomace
extract
Viktorija Eisinaite, Greta Svermickaite,
Daiva Leskauskaite, Rimas Venskutonis
Production of orange juice concentrate using
conventional and microwave vacuum
evaporation: Thermal degradation kinetics of
bioactive compounds and color values
Hamza Bozkır, Yeliz Tekgül
17:4
5 18:00
Effect of different thermal processing on
copper and chromium bioaccessibility
from various cereals and pulses
Meena Kumari, Kalpana Platel
Vibrational spectroscopy, a versatile technique
applied to food science
Michele Di Foggia
18:0
0 18:15
Investigation of gluten-free cake
production from poppy seed (Papaver
somniferum L.) pulp: TOPSİS application
Tuğba Dedebaş, Meryem Göksel Saraç
Feasibility of a chromameter and chemometric
techniques to discriminate pure and mixed
organic and conventional red pepper powders:
A pilot study
Muharrem Keskin, Aysel Arslan, Yurtsever
Soysal, Yunus Emre Sekerli, Nafiz Celiktas
18:1
5 18:30
Prediction and Qualitative Analysis of
Sensory Perceptions over Temporal
Vectors Using Combination of Artificial
Neural Networks and Fuzzy Logic:
Validation on Indian Cheese (Paneer)
Kartikey Chaturvedi, Sucheta Khubber,
Siddhartha Singha3, Himanshu Goel,
Francisco J. Barba, Kalyan Das
Effect of roasting and drying on phenolic
compounds and color properties of domat
variety olive seeds
Alev Yüksel Aydar, Tuba Aydin, Büşra Baykan,
Tuncay Yilmaz
18:3
0 18:45
Functional food formulated with food
industry by-product
Meric Simsek, Özge Süfer
Assessment of acrylamide in potato chips and
french fries consumed by the romanian
population
Adriana Laura Mihai, Mioara Negoiță, Gabriela
Andreea Horneț
18:4
5 19:00
The effect of activated carbon obtained
from hazelnut shell by KOH on the
removal of aqueous methylene blue
solutions
Birsen Sarici, Esra Altıntığ, Sukru, Karatas
Comparison of volatile compounds in sesame
oil and sesame cake extract
Berfu Gelen, Serkan Selli
International Conference on
RAW MATERIALS TO PROCESSED FOODS 03-04 June 2021, Turkey
11
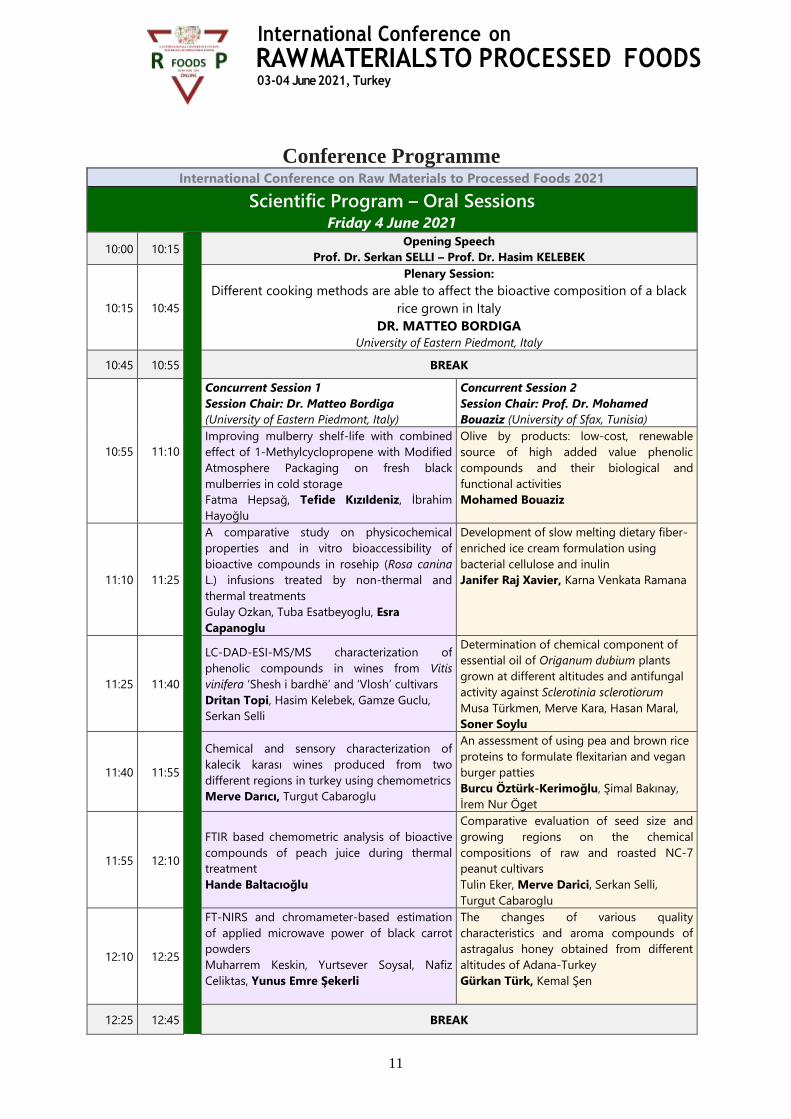
Conference Programme International Conference on Raw Materials to Processed Foods 2021
Scientific Program – Oral Sessions
Friday 4 June 2021
10:00 10:15
Opening Speech
Prof. Dr. Serkan SELLI – Prof. Dr. Hasim KELEBEK
10:15 10:45
Plenary Session:
Different cooking methods are able to affect the bioactive composition of a black
rice grown in Italy
DR. MATTEO BORDIGA
University of Eastern Piedmont, Italy
10:45 10:55 BREAK
10:55 11:10
Concurrent Session 1
Session Chair: Dr. Matteo Bordiga
(University of Eastern Piedmont, Italy)
Concurrent Session 2
Session Chair: Prof. Dr. Mohamed
Bouaziz (University of Sfax, Tunisia)
Improving mulberry shelf-life with combined
effect of 1-Methylcyclopropene with Modified
Atmosphere Packaging on fresh black
mulberries in cold storage
Fatma Hepsağ, Tefide Kızıldeniz, İbrahim
Hayoğlu
Olive by products: low-cost, renewable
source of high added value phenolic
compounds and their biological and
functional activities
Mohamed Bouaziz
11:10 11:25
A comparative study on physicochemical
properties and in vitro bioaccessibility of
bioactive compounds in rosehip (Rosa canina
L.) infusions treated by non-thermal and
thermal treatments
Gulay Ozkan, Tuba Esatbeyoglu, Esra
Capanoglu
Development of slow melting dietary fiber-
enriched ice cream formulation using
bacterial cellulose and inulin
Janifer Raj Xavier, Karna Venkata Ramana
11:25 11:40
LC-DAD-ESI-MS/MS characterization of
phenolic compounds in wines from Vitis
vinifera ‘Shesh i bardhë’ and ‘Vlosh’ cultivars
Dritan Topi, Hasim Kelebek, Gamze Guclu,
Serkan Selli
Determination of chemical component of
essential oil of Origanum dubium plants
grown at different altitudes and antifungal
activity against Sclerotinia sclerotiorum
Musa Türkmen, Merve Kara, Hasan Maral,
Soner Soylu
11:40 11:55
Chemical and sensory characterization of
kalecik karası wines produced from two
different regions in turkey using chemometrics
Merve Darıcı, Turgut Cabaroglu
An assessment of using pea and brown rice
proteins to formulate flexitarian and vegan
burger patties
Burcu Öztürk-Kerimoğlu, Şimal Bakınay,
İrem Nur Öget
11:55 12:10
FTIR based chemometric analysis of bioactive
compounds of peach juice during thermal
treatment
Hande Baltacıoğlu
Comparative evaluation of seed size and
growing regions on the chemical
compositions of raw and roasted NC-7
peanut cultivars
Tulin Eker, Merve Darici, Serkan Selli,
Turgut Cabaroglu
12:10 12:25
FT-NIRS and chromameter-based estimation
of applied microwave power of black carrot
powders
Muharrem Keskin, Yurtsever Soysal, Nafiz
Celiktas, Yunus Emre Şekerli
The changes of various quality
characteristics and aroma compounds of
astragalus honey obtained from different
altitudes of Adana-Turkey
Gürkan Türk, Kemal Şen
12:25 12:45 BREAK
International Conference on
RAW MATERIALS TO PROCESSED FOODS 03-04 June 2021, Turkey
12
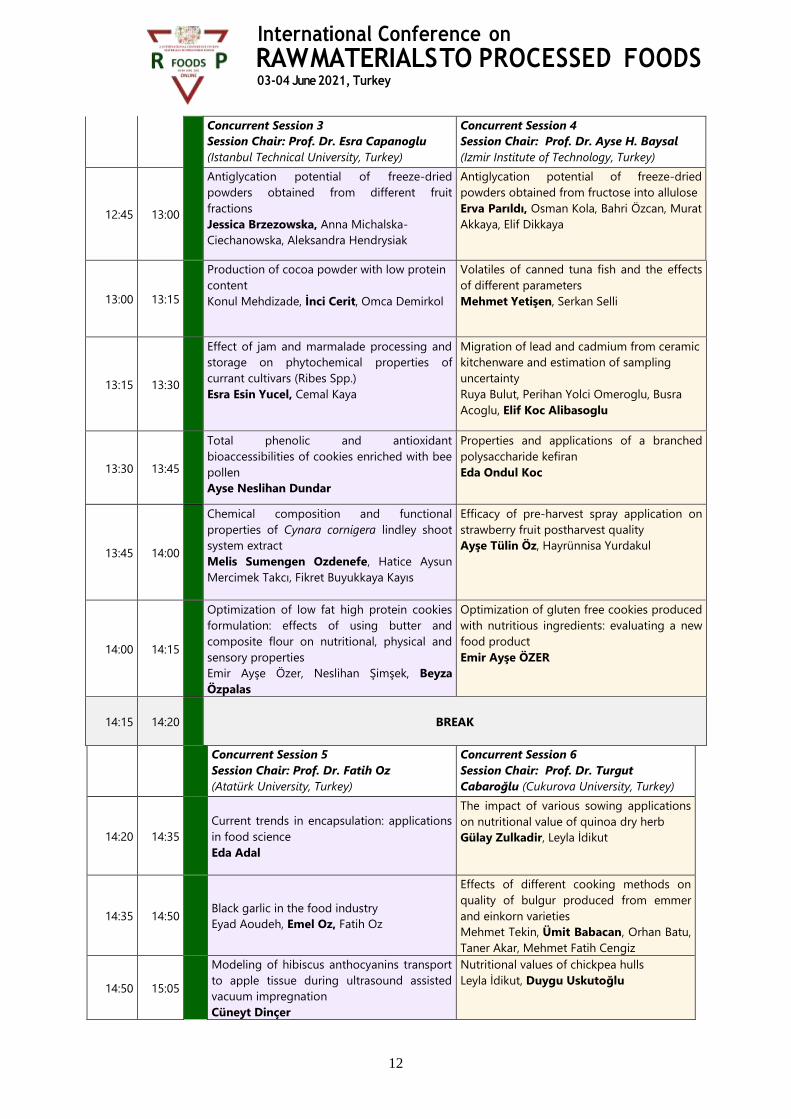
Concurrent Session 3
Session Chair: Prof. Dr. Esra Capanoglu
(Istanbul Technical University, Turkey)
Concurrent Session 4
Session Chair: Prof. Dr. Ayse H. Baysal
(Izmir Institute of Technology, Turkey)
12:45 13:00
Antiglycation potential of freeze-dried
powders obtained from different fruit
fractions
Jessica Brzezowska, Anna Michalska-
Ciechanowska, Aleksandra Hendrysiak
Antiglycation potential of freeze-dried
powders obtained from fructose into allulose
Erva Parıldı, Osman Kola, Bahri Özcan, Murat
Akkaya, Elif Dikkaya
13:00 13:15
Production of cocoa powder with low protein
content
Konul Mehdizade, İnci Cerit, Omca Demirkol
Volatiles of canned tuna fish and the effects
of different parameters
Mehmet Yetişen, Serkan Selli
13:15 13:30
Effect of jam and marmalade processing and
storage on phytochemical properties of
currant cultivars (Ribes Spp.)
Esra Esin Yucel, Cemal Kaya
Migration of lead and cadmium from ceramic
kitchenware and estimation of sampling
uncertainty
Ruya Bulut, Perihan Yolci Omeroglu, Busra
Acoglu, Elif Koc Alibasoglu
13:30 13:45
Total phenolic and antioxidant
bioaccessibilities of cookies enriched with bee
pollen
Ayse Neslihan Dundar
Properties and applications of a branched
polysaccharide kefiran
Eda Ondul Koc
13:45 14:00
Chemical composition and functional
properties of Cynara cornigera lindley shoot
system extract
Melis Sumengen Ozdenefe, Hatice Aysun
Mercimek Takcı, Fikret Buyukkaya Kayıs
Efficacy of pre-harvest spray application on
strawberry fruit postharvest quality
Ayşe Tülin Öz, Hayrünnisa Yurdakul
14:00 14:15
Optimization of low fat high protein cookies
formulation: effects of using butter and
composite flour on nutritional, physical and
sensory properties
Emir Ayşe Özer, Neslihan Şimşek, Beyza
Özpalas
Optimization of gluten free cookies produced
with nutritious ingredients: evaluating a new
food product
Emir Ayşe ÖZER
14:15 14:20 BREAK
Concurrent Session 5
Session Chair: Prof. Dr. Fatih Oz
(Atatürk University, Turkey)
Concurrent Session 6
Session Chair: Prof. Dr. Turgut
Cabaroğlu (Cukurova University, Turkey)
14:20 14:35
Current trends in encapsulation: applications
in food science
Eda Adal
The impact of various sowing applications
on nutritional value of quinoa dry herb
Gülay Zulkadir, Leyla İdikut
14:35 14:50 Black garlic in the food industry
Eyad Aoudeh, Emel Oz, Fatih Oz
Effects of different cooking methods on
quality of bulgur produced from emmer
and einkorn varieties
Mehmet Tekin, Ümit Babacan, Orhan Batu,
Taner Akar, Mehmet Fatih Cengiz
14:50 15:05
Modeling of hibiscus anthocyanins transport
to apple tissue during ultrasound assisted
vacuum impregnation
Cüneyt Dinçer
Nutritional values of chickpea hulls
Leyla İdikut, Duygu Uskutoğlu
International Conference on
RAW MATERIALS TO PROCESSED FOODS 03-04 June 2021, Turkey
13
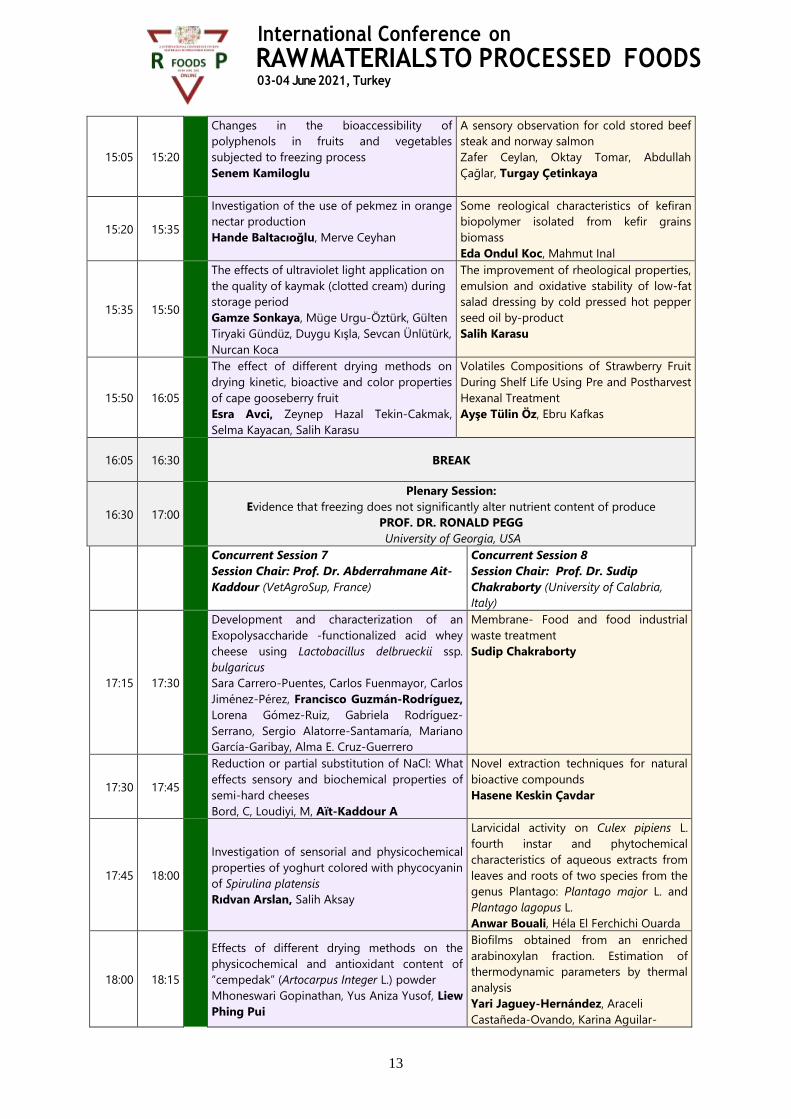
15:05 15:20
Changes in the bioaccessibility of
polyphenols in fruits and vegetables
subjected to freezing process
Senem Kamiloglu
A sensory observation for cold stored beef
steak and norway salmon
Zafer Ceylan, Oktay Tomar, Abdullah
Çağlar, Turgay Çetinkaya
15:20 15:35
Investigation of the use of pekmez in orange
nectar production
Hande Baltacıoğlu, Merve Ceyhan
Some reological characteristics of kefiran
biopolymer isolated from kefir grains
biomass
Eda Ondul Koc, Mahmut Inal
15:35 15:50
The effects of ultraviolet light application on
the quality of kaymak (clotted cream) during
storage period
Gamze Sonkaya, Müge Urgu-Öztürk, Gülten
Tiryaki Gündüz, Duygu Kışla, Sevcan Ünlütürk,
Nurcan Koca
The improvement of rheological properties,
emulsion and oxidative stability of low-fat
salad dressing by cold pressed hot pepper
seed oil by-product
Salih Karasu
15:50 16:05
The effect of different drying methods on
drying kinetic, bioactive and color properties
of cape gooseberry fruit
Esra Avci, Zeynep Hazal Tekin-Cakmak,
Selma Kayacan, Salih Karasu
Volatiles Compositions of Strawberry Fruit
During Shelf Life Using Pre and Postharvest
Hexanal Treatment
Ayşe Tülin Öz, Ebru Kafkas
16:05 16:30 BREAK
16:30 17:00
Plenary Session:
Evidence that freezing does not significantly alter nutrient content of produce
PROF. DR. RONALD PEGG
University of Georgia, USA
Concurrent Session 7
Session Chair: Prof. Dr. Abderrahmane Ait-
Kaddour (VetAgroSup, France)
Concurrent Session 8
Session Chair: Prof. Dr. Sudip
Chakraborty (University of Calabria,
Italy)
17:15 17:30
Development and characterization of an
Exopolysaccharide -functionalized acid whey
cheese using Lactobacillus delbrueckii ssp.
bulgaricus
Sara Carrero-Puentes, Carlos Fuenmayor, Carlos
Jiménez-Pérez, Francisco Guzmán-Rodríguez,
Lorena Gómez-Ruiz, Gabriela Rodríguez-
Serrano, Sergio Alatorre-Santamaría, Mariano
García-Garibay, Alma E. Cruz-Guerrero
Membrane- Food and food industrial
waste treatment
Sudip Chakraborty
17:30 17:45
Reduction or partial substitution of NaCl: What
effects sensory and biochemical properties of
semi-hard cheeses
Bord, C, Loudiyi, M, Aït-Kaddour A
Novel extraction techniques for natural
bioactive compounds
Hasene Keskin Çavdar
17:45 18:00
Investigation of sensorial and physicochemical
properties of yoghurt colored with phycocyanin
of Spirulina platensis
Rıdvan Arslan, Salih Aksay
Larvicidal activity on Culex pipiens L.
fourth instar and phytochemical
characteristics of aqueous extracts from
leaves and roots of two species from the
genus Plantago: Plantago major L. and
Plantago lagopus L.
Anwar Bouali, Héla El Ferchichi Ouarda
18:00 18:15
Effects of different drying methods on the
physicochemical and antioxidant content of
“cempedak” (Artocarpus Integer L.) powder
Mhoneswari Gopinathan, Yus Aniza Yusof, Liew
Phing Pui
Biofilms obtained from an enriched
arabinoxylan fraction. Estimation of
thermodynamic parameters by thermal
analysis
Yari Jaguey-Hernández, Araceli
Castañeda-Ovando, Karina Aguilar-

International Conference on
RAW MATERIALS TO PROCESSED FOODS 03-04 June 2021, Turkey
14
Arteaga, Luis Guillermo González-
Olivares, Javier Añorve-Morga, Nelly
Cruz-Cansino
18:15 18:30
The use of Torulaspora delbrueckii yeast for the
production of beer
Firuze Kayadelen, Bilal Agirman, Huseyin Erten
Aroma enhancement of Ocimum
basilicum L. via drought stress induced
by polyethylene glycol (PEG)
Basar Sevindik, Onur Sevindik, Serkan
Selli
18:30 18:45
The effect of different fermentation
temperatures on şalgam quality
Mehmet Ali Cirak, Bilal Agirman, Huseyin
Erten
Assessment of the aroma profiles of
Spirulina Platensis using HS-SPME–GC-
MS and Determination of Antioxidant
Capacity
Turkan Uzlasir, Oya Isik, Leyla Hizarci
Uslu, Serkan Selli, Hasim Kelebek
18:45 19:00
Elucidation of retro-and orthonasal aroma
differences of biscuits (Panis biscoctus) using
artificial masticator
Ahmet Salih Sonmezdag, Clement Cataneo,
Cécile Rannou, Serkan Selli, Carole Prost
Evaluation of plant ingredients obtained
from cannabis species for use as food
additives
Ümit Babacan, Mehmet Fatih Cengiz,
Mariem Bouali, Sude Keşçi
International Conference on
RAW MATERIALS TO PROCESSED FOODS 03-04 June 2021, Turkey
15
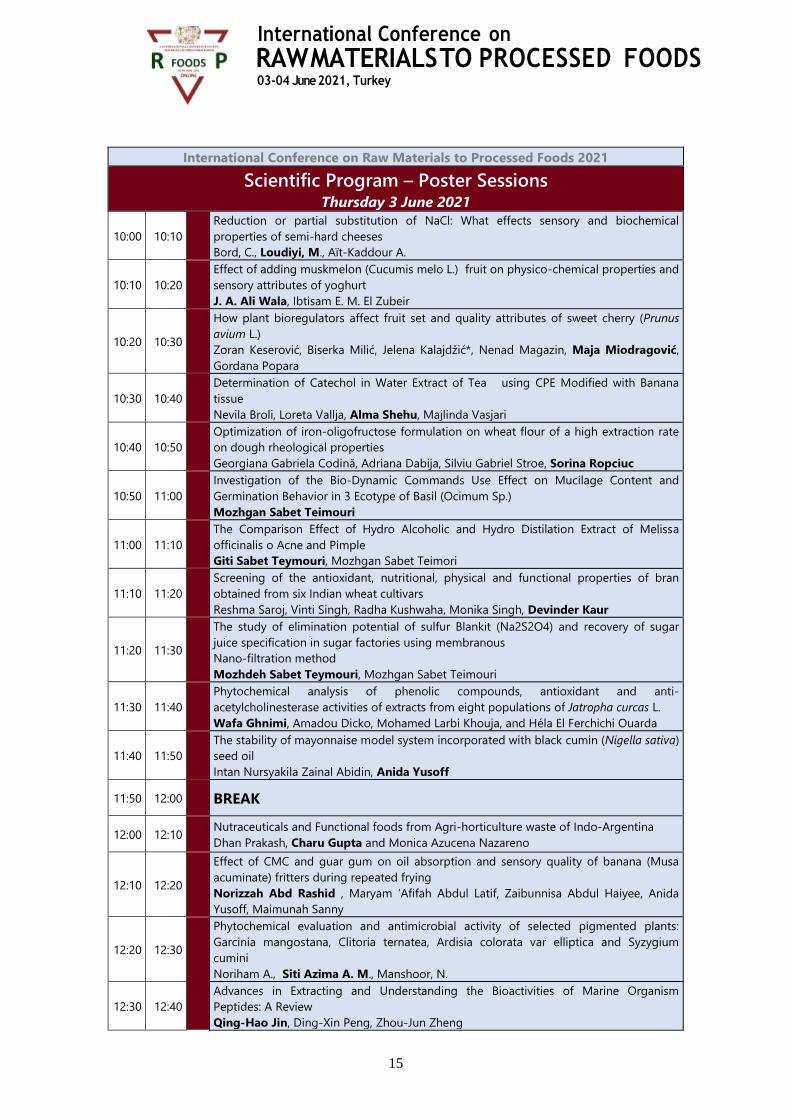
International Conference on Raw Materials to Processed Foods 2021
Scientific Program – Poster Sessions
Thursday 3 June 2021
10:00 10:10
Reduction or partial substitution of NaCl: What effects sensory and biochemical
properties of semi-hard cheeses
Bord, C., Loudiyi, M., Aït-Kaddour A.
10:10 10:20
Effect of adding muskmelon (Cucumis melo L.) fruit on physico-chemical properties and
sensory attributes of yoghurt
J. A. Ali Wala, Ibtisam E. M. El Zubeir
10:20 10:30
How plant bioregulators affect fruit set and quality attributes of sweet cherry (Prunus
avium L.)
Zoran Keserović, Biserka Milić, Jelena Kalajdžić*, Nenad Magazin, Maja Miodragović,
Gordana Popara
10:30 10:40
Determination of Catechol in Water Extract of Tea using CPE Modified with Banana
tissue
Nevila Broli, Loreta Vallja, Alma Shehu, Majlinda Vasjari
10:40 10:50
Optimization of iron-oligofructose formulation on wheat flour of a high extraction rate
on dough rheological properties
Georgiana Gabriela Codină, Adriana Dabija, Silviu Gabriel Stroe, Sorina Ropciuc
10:50 11:00
Investigation of the Bio-Dynamic Commands Use Effect on Mucilage Content and
Germination Behavior in 3 Ecotype of Basil (Ocimum Sp.)
Mozhgan Sabet Teimouri
11:00 11:10
The Comparison Effect of Hydro Alcoholic and Hydro Distilation Extract of Melissa
officinalis o Acne and Pimple
Giti Sabet Teymouri, Mozhgan Sabet Teimori
11:10 11:20
Screening of the antioxidant, nutritional, physical and functional properties of bran
obtained from six Indian wheat cultivars
Reshma Saroj, Vinti Singh, Radha Kushwaha, Monika Singh, Devinder Kaur
11:20 11:30
The study of elimination potential of sulfur Blankit (Na2S2O4) and recovery of sugar
juice specification in sugar factories using membranous
Nano-filtration method
Mozhdeh Sabet Teymouri, Mozhgan Sabet Teimouri
11:30 11:40
Phytochemical analysis of phenolic compounds, antioxidant and anti-
acetylcholinesterase activities of extracts from eight populations of Jatropha curcas L.
Wafa Ghnimi, Amadou Dicko, Mohamed Larbi Khouja, and Héla El Ferchichi Ouarda
11:40 11:50
The stability of mayonnaise model system incorporated with black cumin (Nigella sativa)
seed oil
Intan Nursyakila Zainal Abidin, Anida Yusoff
11:50 12:00
BREAK
12:00 12:10 Nutraceuticals and Functional foods from Agri-horticulture waste of Indo-Argentina
Dhan Prakash, Charu Gupta and Monica Azucena Nazareno
12:10 12:20
Effect of CMC and guar gum on oil absorption and sensory quality of banana (Musa
acuminate) fritters during repeated frying
Norizzah Abd Rashid , Maryam ‘Afifah Abdul Latif, Zaibunnisa Abdul Haiyee, Anida
Yusoff, Maimunah Sanny
12:20 12:30
Phytochemical evaluation and antimicrobial activity of selected pigmented plants:
Garcinia mangostana, Clitoria ternatea, Ardisia colorata var elliptica and Syzygium
cumini
Noriham A., Siti Azima A. M., Manshoor, N.
12:30 12:40
Advances in Extracting and Understanding the Bioactivities of Marine Organism
Peptides: A Review
Qing-Hao Jin, Ding-Xin Peng, Zhou-Jun Zheng

International Conference on
RAW MATERIALS TO PROCESSED FOODS 03-04 June 2021, Turkey
16
12:40 12:50
Monosaccharide Removal and Effects of Komagataeibacter Xylinus Fermentation on
Antioxidant Capacity and Flavor Profile of Chinese Wolfberry Juice
Tianzhen Zhang, Yuqing Shen, Senjia Zhang, Zexiong Xie, Xiyu Cheng, Wenchao Li,
Cheng Zhong
12:50 13:00
BREAK
13:00 13:10
Effect of storage on fatty acid composition of hazelnut (Corylus avellana L.) varieties
cultivated in Turkey
Hasim Kelebek, Zeynep Ergün, Türkan Uzlaşır
13:10 13:20 Cloud point extraction of lutein and β-carotene from spinach waste
Bahar Er, Gökhan Durmaz
13:20 13:30
Effect of ultrasound-assisted extraction application on total phenolic substance, catechin
and caffein amounts of green tea (Camellie Sinensis) extract
Esra Esin Yücel, Cemal Kaya
13:30 13:40
Optimization of tray dryer drying parameters of Hacıhaliloğlu apricot using response
surface methodology
Hamza Bozkir, Ahsen Rayman Ergün, Asuman Adali, Mehmet Güldane
13:40 13:50
Influence of the carrier type and drying methods on the physico-chemical properties of
sustainable powders gained from chokeberry pomace extracts
Aleksandra Hendrysiak, Anna Michalska-Ciechanowska, Aneta Wojdyło, Jessica
Brzezowska
13:50 14:00
Comparison of some local banana types and varieties in terms of physical qualities,
pomological properties and phytochemical contents
Evren Caglar Eroglu, Rıdvan Arslan, Mustafa Unlu, Rasim Arslan
14:00 14:15
BREAK
14:15 14:25
Assessment of hygiene procedures in fresh fishery products retailers of Lisbon's
traditional food markets
Rafael S Oliveira, Maria José Rodrigues, Ana Rita
14:25 14:35 Determination of honey adulteration with high fructose wheat syrup
Tamer Arslan, Gökhan Durmaz, Oktay Yıldız, Durmuş Özdemir
14:35 14:45 Pollen content in raw Spanish rosemary honey: influence of the geographical origin
Isabel Escriche, Marisol Juan-Borrás, Mario Visquert, José-Miguel Valiente
14:45 14:55
Antioxidant potential of milk obtained from the most important breeds of dairy cattle in
Poland
Jolanta Jola Król, Aneta Brodziak, Magdalena Stobiecka
14:55 15:05
Delineation of molecular structure modification during coagulation of mixed camel and
cow milk by mid-infrared spectroscopy and parallel factor analysis
Abderrahmane Ait Kaddour
15:05 15:20 BREAK
15:20 15:30
Color quality, ascorbic acid and total carotenoid contents of dried orange slices as
influenced by packaging methods and storage conditions
Süleyman Polat
15:30 15:40
Volatile profile of Spanish raw citrus honey: the best strategy for its correct labelling
Isabel Escriche, Marisol Juan-Borrás, Mario Visquert, Eva Domenech, Andrea Asensio,
José-Miguel Valiente
15:40 15:50
The development of melon sorbets with acacia or lavender syrup
Oana Viorela Nistor, Doina G Andronoiu, Luiza Andreea Tanase, Gabriel Danut
Mocanu, Vasilica Viorica Barbu, Elisabeta Botez
15:50 16:00
Application of response surface methodology (RSM) to optimize the concentrations of
essential oils in olive oil used as a preservation means for reduced salt green table olives
Maria Papapostolou, Fani Mantzouridou, Maria Tsimidou

International Conference on
RAW MATERIALS TO PROCESSED FOODS 03-04 June 2021, Turkey
17
16:00 16:10
Functional properties of soy and pea protein isolates
Beyza Özpalas, Emir Ayşe Özer
16:10 16:15 BREAK
16:15 16:25
Determination of physical quality and phytochemical properties of prickly pear (Opuntia
ficus-indica)
Evren Caglar Eroglu, Rıdvan Arslan, Ayşegül Güleç, Salih Aksay
16:25 16:35
Sensitivity of biofilms formed by Listeria monocytogens and L. innocua to biocides
Sara Atek Lezzoum, Leila Bouayad, Taha-Mossadak Hamdi
16:35 16:45
The preservative potential of essential oils in a real food system: A comprehensive
review
Mohamed Nadjib Boukhatem
16:45 16:55
Development of mucilage powder from Basella rubra and elderly products application
Teerawan Suwan, Nopparat Muangma, Benyapa Soponpattarin, Nattakan
Jakkranuhwat
16:55 17:05
Texture and color evaluation of dough and tortillas elaborated by adding solids from
nixtamalization waste
Francisco Guzmán-Rodríguez, Ruth Peña-Reyes, Lorena Gómez-Ruiz, Gerardo
Ramírez-Romero, Alma E. Cruz-Guerrero
17:05 17:15
Determination of some physical and chemical properties and antioxidant activity of
cranberry pulp produced with the addition of different sweeteners
Hacer Ünver, Memnune Şengül
17:15 17:25 Nutritional composition of functional snack grain-based mix
Emir Ayşe Özer, Cahide Yağmur
17:25 17:35
Rheological, textural and digestibility characteristics of chapatti as affected by
incorporation of type 4 Resistant starch prepared from sorghum and corn starch
Faiza Shaikh, Tahira Mohsin Ali, Saqib Arif, Lubna Raza, Abid Hasnain
17:35 17:45
Development of value-added functional food by fusion of colored potato and
buckwheat flour through hot melt extrusion
Md Obyedul Kalam Azad, Md. Adnan, In Je Sung, Jung Dae Lim, Jong-Suep Baek, Young
Seok Lim, Cheol Ho Park
17:45 17:55
Effect of quinoa and germinated wheat flour in physicochemical, textural and sensory
properties of cupcakes
Negin Javaheripour, Lida Shahsavani Mojarrad, Shadi Mehdikhani, Yaser Inanloo, Ali
Rafe
17:55 18:05 Impact of low pH on the textural and structural characteristic of canned meatballs (rista)
Sajad Ahmad Mir, Shoib Mohmad Wani
International Conference on Raw Materials to Processed Foods 2021
Scientific Program – Poster Sessions
Friday 4 June 2021
13:00 13:10
The effect of mixing milk of different species on chemical, physicochemical, and sensory
features of cheeses: A Review
Oumayma Boukria, El Mestafa El Hadrami, Sofiane Boudalia, Jasur Safarov, Françoise
Leriche, Abderrahmane Aït-Kaddour
13:10 13:20 Investigating the effect of the Maltodextrin gel usage on oil cake formulation
M. Zelanvar, B. Ghiasi Tarzi, P. Damanafshan
13:20 13:30
Development of cakes with Almond Baru flour: characteristics and their correlations with
the Texture Profile Analysis
Ana Flávia Ramos, Gabriela R. Lemos Mendes, Fabiane Neves Silva, Renato Souza Cruz,
Geany Peruch Camilloto, Bruna Mara Aparecida de Carvalho, William James, Nogueira
Lima, Milton Nobel Cano Chauca, Janaína Teles de Faria, Juliana Pinto de Lima, Sérgio

International Conference on
RAW MATERIALS TO PROCESSED FOODS 03-04 June 2021, Turkey
18
Henrique Sousa Santos, Igor Viana Brandi
13:30 13:40
Effect of cultivar and maturity on functional properties, low molecular weight
carbohydrate and antioxidant activity of Jackfruit seed flour
Radha Kushwaha, Neha Taslim Fatima, Monika Singh, Vinti Singh, Seeratpreet Kaur, Vinita
Puranik, Rajendra Kumar, Devinder Kaur
13:40 13:50 Next-Gen probiotics for the management of obesity and weight control
Charu Gupta, Dhan Prakash
13:50 14:00
2D-Cross correlation spectroscopy coupled with molecular fluorescence spectroscopy for
analysis of molecular structure modification of camel milk and cow milk mixtures during
coagulation
Oumayma Boukria, El Mestafa El Hadrami, Shaxnoza Sultanova, Jasur Safarov, Françoise
Leriche, Abderrahmane Aït-Kaddour
14:00 14:15 BREAK
14:15 14:25
Visible and near-infrared multispectral features in conjunction with artificial neural
network and partial least squares for predicting biochemical and micro-structural
features of beef muscles
Abderrahmane Aït-Kaddour, Donato Andueza, Annabelle Dubost, Jean-Michel Roger,
Jean-François Hocquette, Anne Listrat
14:25 14:35 Experimental studies of the drying process of plant materials
Jasur Safarov, Gani Dadayev
14:35 14:45 First principles study of structural and electronic, properties of ScxGa1-xN alloys
Beloufa Nabil, Benazouzi Aicha
14:55 15:05 Storage of herbal raw materials
Narzullaev M.S., Jumaev B.M., Khudoyberdiev M.A.
15:05 15:20 BREAK
15:20 15:30 Research solar water heating drying plant for drying medicinal plants
Shaxnoza Abduvaxitovna Sultanova, Tojiniso Tursunboyevna Raxmanova
15:30 15:40 Drying herbal raw materials
Kanaeva R.N., Samandarov D.I., Yulibayev M
15:40 15:50
Effect of cultivar and maturity on functional properties, low molecular weight
carbohydrate and antioxidant activity of Jackfruit seed flour
Radha Kushwaha, Neha Fatima, Monika Singh, Vinti Singh, Seeratpreet Kaur, Vinita
Puranik, Rajendra Kumar, Devinder Kaur
15:50 16:00
Effect of endogenous lipids and proteins on the antioxidant and pasting properties of
Sorghum bicolor flour
Emmanuel Anyachukwu Irondi, Adekemi Esther Adewuyi and Tolulope Muktar
Aroyehun
16:00 16:10
Comparison of the potential abilities of three spectroscopy methods: near-infrared, mid-
infrared, and molecular fluorescence, to predict carotenoid, vitamin and fatty acid
contents in cow milk
Julien Soulat, Donato Andueza, Benoît Graulet, Christiane L. Girard, Cyril Labonne,
Abderrahmane Aït-Kaddour, Bruno Martin, Anne Ferlay
16:10 16:25 BREAK
16:25 16:35
Quality evaluation of pumpkin (Cucurbita pepo) powder produced using three different
drying methods
Munir Dandago
16:35 16:45 Chapatti (flat bread) characteristics as affected by onion peel powder
Nabia Siddiqui, Tahira Mohsin Ali, Abid Hasnain
16:45 16:55
Drying treatments change the composition of aromatic compounds from fresh to dried
centennial seedless grapes
Hafiz Umer Javed, Dong Wang, Rani Andaleeb, Muhammad Salman Zahid, Ying Shi,
Saeed Akhtar, Wang Shiping, Chang-Qing Duan
16:55 17:05 Phytosterols as nutraceutical for cardio-vascular diseases
International Conference on
RAW MATERIALS TO PROCESSED FOODS 03-04 June 2021, Turkey
19
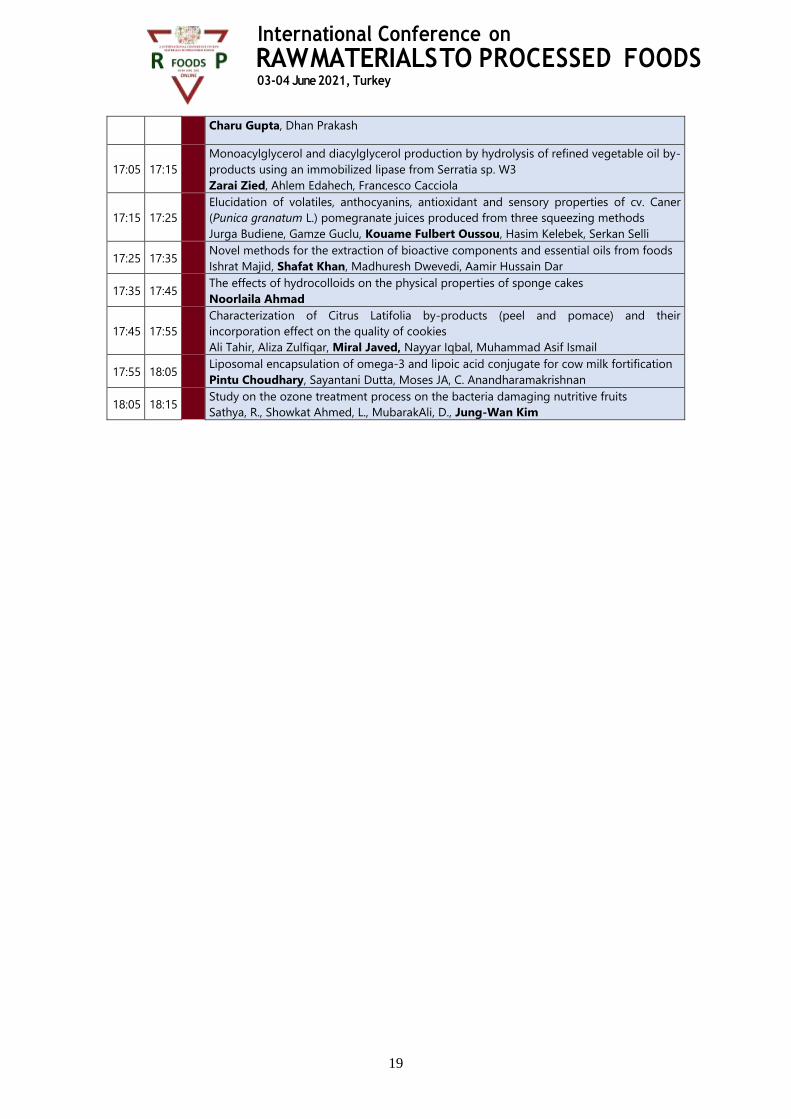
Charu Gupta, Dhan Prakash
17:05 17:15
Monoacylglycerol and diacylglycerol production by hydrolysis of refined vegetable oil by-
products using an immobilized lipase from Serratia sp. W3
Zarai Zied, Ahlem Edahech, Francesco Cacciola
17:15 17:25
Elucidation of volatiles, anthocyanins, antioxidant and sensory properties of cv. Caner
(Punica granatum L.) pomegranate juices produced from three squeezing methods
Jurga Budiene, Gamze Guclu, Kouame Fulbert Oussou, Hasim Kelebek, Serkan Selli
17:25 17:35 Novel methods for the extraction of bioactive components and essential oils from foods
Ishrat Majid, Shafat Khan, Madhuresh Dwevedi, Aamir Hussain Dar
17:35 17:45 The effects of hydrocolloids on the physical properties of sponge cakes
Noorlaila Ahmad
17:45 17:55
Characterization of Citrus Latifolia by-products (peel and pomace) and their
incorporation effect on the quality of cookies
Ali Tahir, Aliza Zulfiqar, Miral Javed, Nayyar Iqbal, Muhammad Asif Ismail
17:55 18:05 Liposomal encapsulation of omega-3 and lipoic acid conjugate for cow milk fortification
Pintu Choudhary, Sayantani Dutta, Moses JA, C. Anandharamakrishnan
18:05 18:15 Study on the ozone treatment process on the bacteria damaging nutritive fruits
Sathya, R., Showkat Ahmed, L., MubarakAli, D., Jung-Wan Kim
International Conference on
RAW MATERIALS TO PROCESSED FOODS 03-04 June 2021, Turkey
20
Biotechnologically Prepared Functional Agro-Based Bioproducts as New Types
of Food/Feed Supplement with Required Nutritional Design
Milan Čertík1*, Tatiana Klempová1, Ondrej Slaný1, Slavomír Marcinčák2
1Institute of Biotechnology, Faculty of Chemical and Food Technology, Slovak University of
Technology, Radlinského 9, 812 37 Bratislava, Slovak Republic 2Department of Food Hygiene Technology and Safety, University of Veterinary Medicine and
Pharmacy, Komenského 73, 041 81 Košice, Slovak Republic
*E-mail:
ABSTRACT
Development of functional diet enriched with biologically active compounds and their applications in
nutrition is one of the strategic targets in food and feed industry. Increasing commercial demand for natural
improvement of food/feed functionalities has led for the search of economically and industrially accessible
biotechnological methods. Attention has been focused on development of solid-state fermentation (SSF)
processes where appropriate microorganisms successfully utilize raw agroindustrial materials and enrich
them with biologically active metabolites. Zygomycetous filamentous fungi (Thamnidium sp.,
Cunninghamella sp., Mucor sp., Umbelopsis sp., Mortierella sp.) are able effectively transform agroindustrial
substrates to fermented bioproducts containing polyunsaturated fatty acids (PUFAs), sterols (ergosterol,
desmosterol), carotenoid pigments, coenzyme Q, glycolipids, dietary fibres, various enzymes (e.g. amylases,
proteases, lipases) and amino-polysaccharides (chitin, chitosan). Fungi also improve content of dry matter,
proteins and ash in fermented bioproducts. Depends on the fungal strain and cultivation conditions, a range
of agro-based bioproducts enriched with PUFAs (up to 2.4% gamma-linolenic acid, 4.2% arachidonic acid,
2.1% dihomo-gamma linolenic acid, 2.3% eicosapentaenoic acid) and pigments (0.26% betacarotene) have
been prepared and successfully employed for making cereal goods (e.g. rolls, bread and pasta) and tested as a
feed additive for animal diet (chicken, egg-laying hens, calves, artificial rumen). These tailor-made
microbial-derived bioproducts with improved nutritional and functional properties are generally recognized
as safe (GRAS) and represent a challenging and potentially rewarding subject for preparation of new types of
food/feed with required nutritional design.
The work was supported by grants VEGA 1/0323/19 (Slovak Ministry of Education, Science, Research and
Sport) and APVV-18-0039 (Slovak Research and Development Agency).
International Conference on
RAW MATERIALS TO PROCESSED FOODS 03-04 June 2021, Turkey
21
Monoacylglycerol and Diacylglycerol Production by Hydrolysis of Refined
Vegetable Oil By-Products Using an Immobilized Lipase from Serratia sp. W3
Zarai Zied1*, Ahlem Edahech1, Francesco Cacciola2
1Laboratory of Biochemistry and Enzymatic Engineering of Lipases, National School of Engineers of Sfax, University of
Sfax, PB 1173, Km 4 Road Soukra, Sfax, Tunisia 2Dipartimento di Scienze Biomediche, Odontoiatriche e delle Immagini Morfologiche e Funzionali, University of
Messina, Via Consolare Valeria, 98125 Messina, Italy
E-mail: [email protected]/[email protected]
ABSTRACT
In the present work, the hydrolysis of lipid fraction by-products of refined vegetable oils was performed by
Serratia sp. W3 lipase immobilized on CaCO3. This support was selected out of 4 carriers as it exhibited the
finest activity support (950 U/g) and the most satisfactory behavior at use. The immobilized lipase was stable
and active in the whole range of pH and temperature, yielding a 75% degree of hydrolysis at optimal
environmental conditions of pH 8.5 and temperature 55°C. TLC, GC and LC methods were evaluated to
determine the analytical characterization of hydrolysis products. For monoacylglycerols, diacylglycerol
fractions identified in the samples, a novel approach by LC method was employed. The adopted approach
allowed the use of basic instrumentation set-ups, without the need of sophisticated detectors, such as mass
spectrometers. Thus, it could be an effective alternative to produce emulsifiers from cheap vegetable oils.
Keywords: by-products; refined vegetable oils, monoacylglycerols, diacylglycerols, immobilized microbial
lipase
International Conference on
RAW MATERIALS TO PROCESSED FOODS 03-04 June 2021, Turkey
22
Sensitivity of Biofilms Formed by Listeria monocytogens and L. innocua to
Biocides
Sara Lezzoum-Atek*1,2, Bouayad Leila 2, Hamdi Taha-Mossadak 2
1Faculté des sciences, Univérsité Ben youcef Benkhedda - Alger 1. 02 Rue Didouche Mourad-Alger, Algérie
2Laboratoire HASAQ, Ecole Nationale Supérieure Vétérinaire-Alger. Rue Issad Abbes, Oued Smar- Alger, Algérie
E-mail: [email protected], telephone: +213770431882
ABSTRACT
The present study was carried out to assess the sensitivity of biofilms formed by Listeria monocytogenes and
Listeria innocua to 04 biocides which contain amine, quaternary ammoniums and sodium hypochlorite. The
bacteria were tested alone and in combinations under different conditions by calculating the percentages of
reduction of biofilms.
The results revealed that the disinfectants were more or less effective depending on the nature of the biofilm
and the incubation conditions. The highest reduction percentages were observed using the amine and the
alkaline quaternary ammonium detergent and disinfectant. L. innocua showed more sensitivity to the
biocides. The reduction rates of biofilms formed under aerobic conditions were greater than those obtained
under microaerophilic conditions. Overall, the percentage reduction in biofilms ranged from 100% to 0%.
Also, the percentages of reduction of multi-species biofilms were less than those obtained on biofilms
formed by a single bacterial species.
More researches are needed for a better understanding of the phenomena involved in the formation of
biofilms and their effects on sensitivity to biocides. These informations would allow manufacturers to adapt
their cleaning and disinfection protocols in order to prevent contamination problems and resistance to
biocides.
Keywords: biocides, biofilm, L. innocua, L. monocytogenes, sensitivity

International Conference on
RAW MATERIALS TO PROCESSED FOODS 03-04 June 2021, Turkey
23
Utilizing Agri-Horticultural Wastes for Development of Functional Foods and
Nutraceuticals
Charu Gupta*, Dhan Prakash
Amity Institute for Herbal Research & Studies, Amity University UP, Sector-125, Noida-201303, India
*E-mail: [email protected]
ABSTRACT
Antioxidants are known to defuse free radicals leading to limited risk of oxidative stress and associated
disorders. Phytochemicals with antioxidant capacity naturally present in food are of great interest due to their
beneficial effects on human health as they offer protection against oxidative deterioration. Several
epidemiological and in vitro studies have supported the idea that plant constituents with antioxidant activity
are capable of exerting protective effects against oxidative stress in biological systems which is among the
major causative factors in induction of many chronic and degenerative diseases. Three agri-horticultural
wastes like left over residuals from Chenopodium album (Bathua; Family: Chenopodiaceae), Coriandrum
sativum (Coriander; Family: Apiaceae), and Brassica oleracea (Cauliflower; Family: Brassicaceae) were
selected and studied for their antioxidant activity individually and synergistically to determine their
nutraceutical potential by CUPRAC assay method. The antioxidant activity of residuals of chenopodium,
coriander and cauliflower were 842.4, 632 and 181.6 µmTE/g (TE= Trolox equivalent) respectively whereas
the antioxidant activity of their synergistic combinations of chenopodium and coriander; chenopodium and
cauliflower; coriander and cauliflower and all three (chenopodium, coriander, and cauliflower) in
combination was found to be 540.8, 928.8, 771.2 and 406.4 µmTE/g respectively. The synergy fold (1.89)
was highest in combination of coriander and cauliflower. Thus, the present studies showed that agri-
horticultural wastes have tremendous potential to be used as antioxidants and for the development of
nutraceutical and functional foods for preventing diseases caused by oxidative stress.
Keywords: Agri-horticultural wastes, Functional foods, Antioxidant activity, Oxidative stress, Nutraceutical

International Conference on
RAW MATERIALS TO PROCESSED FOODS 03-04 June 2021, Turkey
24
Phytosterols as Nutraceutical for Cardio-Vascular Diseases
Charu Gupta*, Dhan Prakash
Amity Institute for Herbal Research and Studies, Amity University-UP, Sector-125, NOIDA-201313 (India)
*Email: [email protected]
ABSTRACT
Phytosterols are defined as plant sterols and plant stanols that the human body cannot synthesize and
therefore originate from the diet. Phytosterols lower total and low-density lipoproteins (LDL) blood
cholesterol by preventing cholesterol absorption from the intestine, so they are known as blood cholesterol-
lowering agents. Phytosterols are naturally present in fruits, vegetables, nuts and principally oils. Dietary
phytosterol intakes normally range from 160-400mg/day with variations depending on food culture and
major food sources. Studies have shown that maximum cholesterol lowering benefits are achieved at doses
of 2-3g per day. Therefore, today’s use implies the need for enriched functional foods, which give enough
phytosterols intake thereby contributing to lowering LDL cholesterol levels. Dairy foods remain a food of
choice for use as delivery vehicle for many functional ingredients including phytosterols and there are many
dairy products available in the global markets which are enriched with phytosterols. At the current growth
rate of cardio-vascular disease (CVD) throughout world, it is expected that the world market demand for
phytosterol fortified products would increase in the near future. There is no doubt that phytosterol as a
functional food ingredient will be a new approach to reduce LDL cholesterol through dairy foods and hold a
great promise for long term health management. The use of phytosterols in commonly consumed dairy
products may soon provide an effective tool against CVD and its introduction in world market is worth
anticipating in the near future.
Keywords: Phytosterols, Nutraceuticals, Herbal, Cardio-Vascular Diseases (CVD), Cholesterol, functional
foods
Assessment of hygiene procedures in fresh fishery products retailers of
Lisbon's traditional food markets
International Conference on
RAW MATERIALS TO PROCESSED FOODS 03-04 June 2021, Turkey
25
Oliveira, R. S.1*, Rodrigues, M. J.2, Henriques, A. R.1
1Faculty of Veterinary Medicine, University of Lisbon (FMV-ULisboa), Avenida da Universidade Técnica,
1300-477 Lisbon, Portugal 2 Economics and Innovation Board of Lisbon’s Council (Câmara Municipal de Lisboa), Campo Grande, 25,
1600-036 Lisbon, Portugal
*E-mail: [email protected], (+351)916077090
ABSTRACT
Fresh fishery products consumption has a long tradition in Portugal. Fresh fish retailers (FFR) represent an
important link in the food chain continuum, as these food business operators have the responsibility of
assuring that perishable fresh fish will get to the consumer as fresh as possible, which rely widely on the
prevailing hygienic conditions and practices.
This study aimed to assess hygiene procedures compliance by FFR in Lisbon’s traditional food markets. For
that, 74 FFR were assessed in 18 food markets. Business owners were interviewed for data collection and an
audit was performed, using a specifically prepared checklist considering hygiene requirements, based on
European hygiene regulations, including practices and food safety management system (FSMS) and premises
assessment.
Business owners’ interviews revealed that 68% of the participants were aged 50 or plus and 15% were over
70 years old; while 7% were illiterate, the majority (74%) had basic education level. Additionally, most of
the participants (80%) had a basic training in food hygiene and safety but were in need of an update. Audit
results demonstrated that only 15% of the FFR presented FSMS related documents, such as the ones
contemplated in the hygiene program. Most of the operators (73%) lacked hot water for hand-washing
purposes. Even though some FFR wore reusable rubber gloves, hand-washing procedures were in most cases
incomplete, and gloves were not considered in the regular hygiene practices. Regarding food-contact
surfaces, most of the FFR did not use a proper cleaning method, still 64% applied a sanitizer to disinfect
fresh fish contact surfaces, such as cutting boards, trays and exposition benches.
Taken together, our results emphasize the need for a thorough training on hygiene practices and food safety
management systems of FFR, as well as an enhancement of these retailers’ premises in traditional food
markets.
Keywords: Traditional Food Markets, Fresh Fish Retailers, Hygiene Assessment, Food Safety Management
Systems
References: Food and Agriculture Organization of the United Nations and World Health Organization, 2009. Codex Alimentarius:
Food Hygiene Basic Texts, Fourth Edition.
European Commission, 2004. Commission Regulation (EC) No. 852/2004 of the European Parliament and of the
Council of 29 April 2004 on the hygiene of foodstuffs. Official Journal L 139, 30.4.2004.
European Commission, 2004. Commission Regulation (EC) No. 853/2004 of the European Parliament and of the
Council of 30 April 2004 laying down specific hygiene rules for food of animal origin. Official Journal L 139,
30.4.2004.
European Commission, 2002. Commission Regulation (EC) No. 178/2002 of the European Parliament and of the
Council of 28 January 2002 laying down the general principles and requirements of food law, establishing the European
Food Safety Authority and laying down procedures in matters of food safety. Official Journal L 31, 1.2.2002.
International Conference on
RAW MATERIALS TO PROCESSED FOODS 03-04 June 2021, Turkey
26
Effect of different thermal processing on copper and chromium bioaccessibility
from various cereals and pulses
Meena Kumari1,2, Kalpana Platel1
1 CSIR- Central Food Technological Research Institute,
Department of Biochemistry, Mysuru (Karnataka) - 570020, India 2Amity Institute of Food Technology, AMITY University, Noida (Uttar Pradesh) – 201303, India
+91-9743954201, [email protected]
ABSTRACT
The present investigation was undertaken to study the influence of heat processing on the total content and
bioaccessibility of copper and chromium from various cereals and pulses. The bioaccessibility of these
minerals was determined by employing an in vitro dialysability procedure. Microwave cooking, pressure
cooking, and open-pan boiling were the three heat treatment methods used in this study. The copper
bioaccessibility in different cereals and pulses was increased as a result of microwave cooking, pressure
cooking and open-pan boiling ranging from 34 to 99%, 16 to 131% and 18 to 133%, respectively. Similarly,
the chromium bioaccessibility was also increased as a result of these three heat processing methods in cereals
and pulses ranging between 23 to 126%, 15 to 98%, and 30 to 58%, respectively. The bioaccessibility of
copper and chromium in most of the analyzed grains was enhanced by pressure cooking; hence, it was the
most efficient method. A general enhancing effect of heat processing on copper and chromium
bioaccessibility from food grains was observed. These methods can be implemented to improve the same
from cereals and pulses. This is the first paper to report the effect of domestic processing on the
bioaccessibility of trace minerals.
Keywords: Bioaccessibility, Cereals, Heat processing, Pulses
International Conference on
RAW MATERIALS TO PROCESSED FOODS 03-04 June 2021, Turkey
27
Comparative Evaluation of Seed Size and Growing Regions on The Chemical
Compositions of Raw and Roasted NC-7 Peanut Cultivars
Tulin Eker1, Merve Darici2, Serkan Selli2, Turgut Cabaroglu2*
1Department of Food Engineering, Faculty of Engineering, Osmaniye Korkut Ata University, 80000, Osmaniye, Turkey 2Department of Food Engineering, Faculty of Agriculture, Cukurova University, 01330 Adana, Turkey
*E-mail: [email protected], Presenter’s phone: +90 322 338 61 73 (114), fax: + 90 322 338 66 14
ABSTRACT
This study examined the impact of seed size, roasting process, growing region and their interactions on
chemical composition of NC-7 peanut cultivar from Turkey. Peanut seeds obtained from Osmaniye and
Adana regions of Turkey were sized into two market grades as 7 mm and 11 mm and roasted until obtained
equal skin color. It was found that the moisture, total sugar, stachyose, raffinose sucrose and amino acid
values of small sized samples were generally significantly higher than the larger ones. Region, size and
process effects were found significant on oleic (O) and linoleic (L) acid content of samples. Significantly
higher O/L ratios were obtained for the large seeds. Significant size x process interactions were indicated for
O/L ratio and linoleic acid content of samples. Larger size seed especially in Osmaniye region seems to have
a positive effect on the shelf life of peanut seeds in regard to O/L ratio. In Osmaniye region, raw samples
showed higher concentration for detected sugars than Adana region. Sucrose and stachyose contents of both
seeds decreased after roasting in Osmaniye, while a slight increase was obtained in Adana region. It was
determined that roasting process generally caused a decrease in the amount of amino acids. It was elucidated
that seed size, growing regions and roasting process were crucial factors for the chemical compositions of
peanut seed samples.
Keywords: Peanut, Growing Region, Size, Roasting, Sugar, Amino Acid
International Conference on
RAW MATERIALS TO PROCESSED FOODS 03-04 June 2021, Turkey
28
Chemistry of Plant Waters – Demystifying Hydrolats
Jurga Budiene1,2
1Department of Organic chemistry, Center for Physical Science and Technology, Sauletekio av. 3, LT-10257 Vilnius,
Lithuania 2JSC Kvapu namai, Seimyniskiu 3A, LT-09312 Vilnius, Lithuania
E-mail: [email protected], +37068525190
ABSTRACT
Hydrolats or often referred to as aromatic or plant waters are obtained after steam distillation of aromatic
plants in the case of essential oil production. They are enriched not only with small amounts of aromatic
herbal substances, but also with valuable non-volatile but water-soluble compounds such as: polyphenols,
flavonoids, sugars, organic acids, or vitamin C. Most plants with low amount of essential oil are ideal for
hydrolat production. Such products are much safer to use for kids, pregnant women, and sensitive people.
In our research volatile organic compounds (VOCs), total phenolic content (TPC) and radical scavenging
activity of six different hydrolats of aromatic plants: birch (Betula pendula L.), yarrow (Achillea millefolium
L.), mountain pine (Pinus mugo L.), linden (Tilia cordata L.), elder (Sambucus nigra L.), meadow-sweet
(Filipendula ulmaria L.) growing wild in Lithuania were investigated.
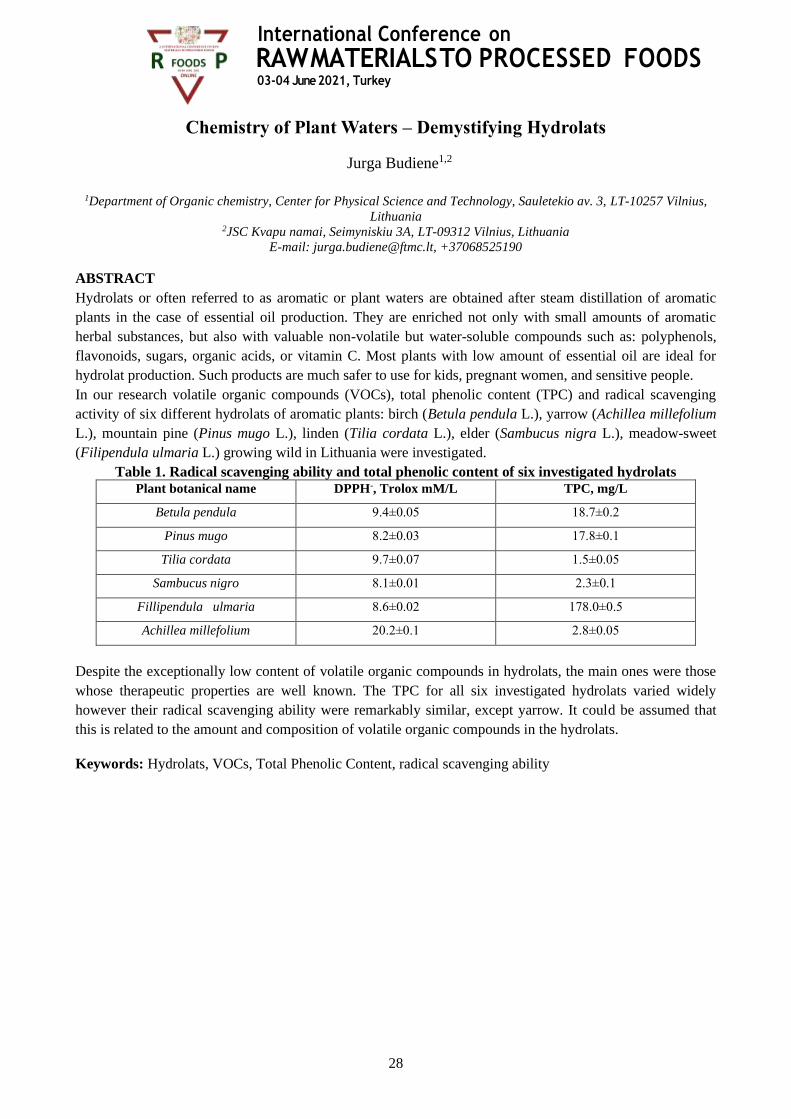
Table 1. Radical scavenging ability and total phenolic content of six investigated hydrolats Plant botanical name DPPH-, Trolox mM/L TPC, mg/L
Betula pendula 9.4±0.05 18.7±0.2
Pinus mugo 8.2±0.03 17.8±0.1
Tilia cordata 9.7±0.07 1.5±0.05
Sambucus nigro 8.1±0.01 2.3±0.1
Fillipendula ulmaria 8.6±0.02 178.0±0.5
Achillea millefolium 20.2±0.1 2.8±0.05
Despite the exceptionally low content of volatile organic compounds in hydrolats, the main ones were those
whose therapeutic properties are well known. The TPC for all six investigated hydrolats varied widely
however their radical scavenging ability were remarkably similar, except yarrow. It could be assumed that
this is related to the amount and composition of volatile organic compounds in the hydrolats.
Keywords: Hydrolats, VOCs, Total Phenolic Content, radical scavenging ability
International Conference on
RAW MATERIALS TO PROCESSED FOODS 03-04 June 2021, Turkey
29
Elucidation of Volatiles, Anthocyanins, Antioxidant and Sensory Properties of
cv. Caner Pomegranate (Punica granatum L.) Juices Produced from Three Juice
Extraction Methods
Jurga Budiene1, Gamze Guclu2, Kouame Fulbert Oussou2, Hasim Kelebek3, Serkan Selli2,4,*
1Department of Organic Chemistry, State Research Institute Center for Physical Sciences and Technology, Sauletekio
Ave. 3, LT-10222 Vilnius, Lithuania 2 Department of Food Engineering, Faculty of Agriculture, Cukurova University, Adana 01130, Turkey
3 Department of Food Engineering, Faculty of Engineering, Adana Alparslan Turkes Science and Technology
University, Adana 01250, Turkey 4 Department of Nutrition and Dietetics, Faculty of Health Sciences, Cukurova University, Adana 01250, Turkey
*E-mail: [email protected]; Tel.: +90-322-338-6173
ABSTRACT
This study deals with the characterization of the phytochemical profiles and antioxidant activities of cv.
Caner pomegranate (Punica granatum) juices obtained from three different juice extraction methods
including halved pomegranate (HPJ), arils (AJ), and macerated arils (MAJ) extraction for the first time. It
was found that the type of the juice extraction process had substantial effects on the volatiles, anthocyanin
compositions, and antioxidant activities of the samples. Results showed that the AJ sample (593 mg L−1)
had more anthocyanin compounds followed by HPJ (555 mg L−1) and MAJ (408 mg L−1) samples. GC-MS
analysis revealed a total of 34 volatile compounds. The highest number of volatiles was found in the MAJ
sample (1872 µg L−1); thus, the aril maceration process played an important role in increasing the volatiles
as compared to the HPJ (751.8 µg L−1) and AJ (710.7 µg L−1) samples. Sensory analysis showed that the
HPJ sample was the most preferred and its general impression was higher as compared to the AJ and MAJ
samples. The findings of this study elucidated that the juice extraction technique had a significant influence
on the phytochemical profiles, sensory quality, and antioxidant activity of pomegranate juices.
Keywords: pomegranate; cv. Caner; juice extraction methods; aroma compounds; anthocyanins;
antioxidants
INTRODUCTION
Pomegranate fruit (Punica granatum L.) belonging to the Punicaceae family is primarily considered to be a
crucial source of bioactive compounds that are claimed to possess health beneficial properties. Thus,
recently, there has been a massive increment in the popularity of pomegranate consumption [1]. This fruit,
originating from the Middle East, has been a widely known fruit since ancient times. The total global
production of pomegranate is reported to be over 3 million tons, and Turkey is an important producer with a
total annual production of 581.189 tons [2]. The interest in pomegranate fruits is growing year by year not
only because it is pleasant to eat, but also because it is a fruit with a good source of minerals, acids, sugars,
vitamins, polysaccharides, and phenolics such as anthocyanins and phenolic acids [3]. Anthocyanins are well
known to function as natural antioxidants and play a role in the protection against oxidative stress, reduction
of risks of chronic diseases, as well as prevention of their progression [4,5]. Recently, numerous studies
demonstrated that there has been a relation between the intake of fruits and vegetables comprising natural
antioxidants and the inhibitions of many diseases including cancers [6,7]. Pomegranate fruits are generally
consumed fresh, but lately, there is a substantial demand in industry to obtain pomegranate juice, jams, jelly,
International Conference on
RAW MATERIALS TO PROCESSED FOODS 03-04 June 2021, Turkey
30
vinegar, and wine [8]. The overall quality of pomegranate cultivars depends on its taste components, aroma
profiles, and color properties. Among these, aroma is a vital quality criterion for foods affecting the
consumer’s acceptance and preference to a higher extent. These compounds, also known as volatile organic
compounds, can be chemically classified as aldehydes, alcohols, acids, ketones, esters, lactones, and
terpenes. These constituents are also present in very low concentrations in food samples, and due to their
different molecular characteristics, every single aroma compound has different contributions to the final
aroma of a food sample [9]. Even if exhaustive works are present in the literature concerning the health
effects of pomegranates and their juices, only a small portion of them focus on volatile compounds. In one of
the most comprehensive papers, it is reported that a mixture of volatiles responsible for the green, fruity,
floral, and earthy notes composes the pomegranate juice aroma [10]. In addition, Beaulieu et al. [11]
investigated the quality properties and aroma components in sweet, sweet–sour, and sour pomegranate
cultivars from around the world that were grown in a collection of California-grown pomegranates from the
National Clonal Germplasm Repository. They found that aldehyde and terpene compounds characterize
cultivar differences and 3-hexenol and 1-hexanol were the dominant compounds. Another important group of
compounds in pomegranates are phenolics. They have great importance because of their role for quality
parameters such as color, taste, and their favorable impacts on health [1]. Pomegranates are very rich in
terms of anthocyanins, ellagic acid, phytoestrogenic flavonoids, and tannins, which have the ability to act as
antioxidant properties [12,13]. Among these, anthocyanins are the key pigments in pomegranate cultivars
found in various parts of the pomegranate trees, leaves, flowers, peels, and fruits. In the extant literature, six
anthocyanin molecules were determined in different pomegranate fruits, including mono- and di-glucosides
of cyanidin, delphinidin, and pelargonidin [14]. In addition to their contribution to sensory profiles, they are
also important for health with their antitumor, antioxidant, antimicrobial, and anti-inflammatory effects. As
pomegranates and their products are rich in phenolics, specifically anthocyanins, they display these health
beneficial properties, and [14,15]. Kostka et al. [15] extracted and separated pomegranate polyphenolics into
an anthocyanin and copigment fraction with the aid of the adsorptive membrane technique. They elucidated
that the total phenolics and free radical scavenging activity were considerably higher in the XAD-7 extract
compared to the juice and that anthocyanins and copigments act together in decreasing oxidative stress.
Pomegranate fruit, being rich in these mentioned health-beneficial and bioactive compounds, requires
handling with care. The processes like juice extraction to be applied on this fruit may result a loss in desired
compounds, so the conditions of the procedures should be decided carefully to get the highest benefit from
the compounds. There has been no comprehensive work on the color quality, volatiles, anthocyanins, sugar,
and organic acid constituents of cv. Caner pomegranate juice produced from different juice extraction
methods in the extant literature. So, this work was established to assess the influence of three juice extraction
methods (halved fruit, arils, and macerated arils extraction) on the amounts and types of the volatiles,
anthocyanins, antioxidant properties, sugars, and organic acids of cv. Caner pomegranate. Besides, in the
work that was conducted in this comprehensive manner for the first time, a sensory study was also utilized
for investigating the influence of three different juice extraction techniques.
MATERIALS AND METHODS
Pomegranate Juice Samples
Pomegranate fruits of cv. Caner were harvested from the Cukurova University’s experimental orchards
located in Adana province of Turkey at the full ripeness stage. Ten kilograms of pomegranates were used for
each batch. Fruits were washed with tap water, dried with towels, and divided into two parts. Three different
juice extraction methods were employed to obtain the juice samples. Pomegranates from the first batch were
cut into two pieces and the juice was obtained by a hydraulic stainless-steel bladder press (Speidel, Bayrakli-
Izmir, Turkey) at 2 atm pressure and this sample was called as halved pomegranate juice (coded by “HPJ”).
The second sample (coded as “AJ”) was extracted from the arils by pressing at 2 atm pressure using a
hydraulic press without crushing the seeds. For the last sample, arils of the fruit were separated from the skin

International Conference on
RAW MATERIALS TO PROCESSED FOODS 03-04 June 2021, Turkey
31
(membrane) manually then they were crushed without damage to their seeds and kept at 4 ◦C for 3 h for
maceration (coded “MAJ”). After maceration, the juice was extracted with the same procedure used for the
AJ sample. Juices were frozen and stored at −20 ◦C until analyses.
General Chemical Analysis
The pH and total soluble solids were determined immediately after obtaining the juice samples with the use
of a pH meter (Orion 3 STAR pH Benchtop Meter, Thermo Scientific, Waltham, MA, USA) and a
refractometer (Carl Zeiss, Jena, Germany) (expressed as ◦Brix), respectively. The titratable acidity of the
juice samples was determined by titration with NaOH (0,1 N) [16]. The color of juice was quantified using a
colorimeter (ColorQuest XE, HunterLab, Reston, VA, USA) and expressed as L* (lightness), a* (redness),
and b* (yellowness). The average values of the triplicate measurements were reported.
Analysis of Sugars and Organic Acids
Analysis of sugars and organic acids were carried out according to the method of Lee and Coates [17] with
slight modifications. Pomegranate juices were centrifuged (6000× g, 15 min), filtered through a 0.45 µm
filter, and diluted 1:1 with ultra-pure water. The obtained extract was directly injected to the HPLC system
equipped with LC-20AD, SPD20A UV and RID 10 A detectors (Shimadzu, Kyoto, Japan). HRC NH2
column (Biorad, 150 × 4.6 mm, 5 m) was used in both analyses. The mobile phase consisted of 5 mM
H2SO4 solution with a flow rate of 0.5 mL min−1. Glucose and fructose standards (Sigma-Aldrich, St.
Louis, MO, USA) were used to obtain a calibration curve for the calculation of sugar concentrations. Organic
acid concentrations were quantified in same manner with citric, malic, and ascorbic acid standards (Sigma-
Aldrich, St. Louis, MO, USA). The limit of detection (LOD) and limit of quantification (LOQ) for the
analysis were calculated at a signal-to-noise ratio (S/N) of about 3 and 10, respectively.
Analysis of Individual Anthocyanins
An Agilent 1100 HPLC system (Agilent Technologies, Palo Alto, CA, USA) operated by ChemStation
software was used in the analysis. All juices were centrifuged (6000× g, 15 min) and filtered through 0.45
µm filter (Millipore) before injection. The analysis was performed on a Beckman Ultrasphere ODS (Roissy
CDG, France; 4.6 mm × 250 mm) column. The mobile phase consisted of two solvents: Solvent A;
water/formic acid (95:5; v/v) and Solvent B; acetonitrile/solvent A (60:40; v/v). Anthocyanins were
separated in reference to the method reported in Kelebek and Selli [18]. The compounds were identified
using the retention times as spectra were matched to authentic standards. The quantities of different
anthocyanins were assessed from the peak areas and calculated as equivalents of representative standard
compounds in calibration curves as follows: At 520 nm (anthocyanins), cyanidin 3-glucoside and cyanidin 3-
rutinoside, respectively. The results were expressed as mg L−1 . The limit of detection (LOD) and limit of
quantification (LOQ) were calculated at a signal-to-noise ratio (S/N) of about 3 and 10, respectively.
Antioxidant Capacity Analyses
The ABTS (2, 20 -azinobis-(3-ethylbenzothiazoline-6-sulfonic acid) and DPPH (1,1-diphenyl-2-
picrylhydrazyl) assays were used in the determination of the antioxidant capacities of the pomegranate juice
samples. In regard the antioxidants, the assays were performed in reference to the method reported in
Kelebek et al. [19]. The absorbance of the solution was determined by a UV-VIS Spectrophotometer (UV-
1601, Shimadzu, Kyoto, Japan). The absorbance values of the ABTS and DPPH solutions were recorded at
734 and 517 nm, respectively.
Analysis of the Volatile Composition
Volatiles of the pomegranate juice samples obtained from three different juice extraction methods (AJ, HPJ,
and MAJ) were extracted by the liquid–liquid extraction technique. The procedure was applied with slight

International Conference on
RAW MATERIALS TO PROCESSED FOODS 03-04 June 2021, Turkey
32
modification according to Selli and Kelebek [20]. Dichloromethane was preferred as the solvent in the
extraction of the aroma compounds. Briefly, 100 mL centrifuged sample (6000× g for 15 min at 4 ◦C), 40
mL dichloromethane, and 5 µL of 4-nonanol (43.3 mgL−1 ) as an internal standard was stirred at 4 ◦C for 30
min under nitrogen gas. After stirring, the mixture was centrifuged again (9000× g, 15 min at 4 ◦C) and the
organic phase was dehydrated by using anhydrous sodium sulfate. The extract was condensed to 5 mL in a
concentrator (Kuderna Danish, Supelco, St. Quentin, France) at 40 ◦C and thereafter, to 0.2 mL by using a
flow of nitrogen [20]. After this stage, each extract was placed in a glass vial of 2 mL with a Teflon-lined
cap. Samples were extracted in triplicate.
GC-FID and GC-MS Analysis of Volatile Compounds
The system of gas chromatography (GC) comprised an Agilent 6890 chromatograph interfaced to an FID
(flame ionization detector) and an MSD (mass selective detector) (Agilent 5973, Wilmington, DE, USA). To
separate the volatiles of the samples, a DB-Wax column was utilized (0.5 µm thickness × 0.25 mm i.d. × 30
m length; J&W Scientific, Folsom, CA, USA). The analysis was applied according to the method used in
Keser et al. [21] with a slight modification. Volatiles of the samples were studied based on the retention
index and mass spectra on the DB-Wax column using a commercial database of spectra (Wiley 6, NBS 75
k). The volatiles were then quantified utilizing the internal standard with 4-nonanol at 43.3 µg L−1 .
Response factors were computed based on the intensity ratio of each volatile to 4 nonanol and ratios of peak
areas were corrected by using each constituent’s response factor [21,22]. Subsequently, the means and
standard deviations were computed for the GC analyses in triplicate. Retention index data for the volatiles
were subtracted by utilizing the n-alkane series (C8–C32).
Sensory Analysis of Pomegranate Juice Samples
Ten trained panelists (five women and five men aged between 25–47) from Food Engineering Department of
Cukurova University (Adana, Turkey) evaluated pomegranate juice samples in terms of overall appearance
including color, pulpiness, sourness, sweetness, astringency, fruity, and floral notes. Samples were prepared
at room temperature approximately 30 min before the analysis. The juices were served in disposable,
odorless plastic cups after shaking. The order of samples was randomized, and the panelists were asked to
evaluate the samples on a 10 cm evaluation scale [13].
Statistical Data Analysis
The data were studied by using analysis of variance (ANOVA) in SPSS (v.24.0, SPSS Inc., Chicago, IL,
USA). In addition, principal component analysis (PCA) was employed in XLSTAT software (trial version of
2020, Addinsoft, New York, NY, USA).
RESULTS AND DISCUSSION
Physicochemical Properties of Pomegranate Juices
Fruit size, skin, and aril colour are known to directly affect the customer acceptability and these properties
depend on variety, climatic, and agricultural conditions. cv. Caner pomegranates used in the study were of
medium size compared to the samples reported on Tunisian pomegranate cultures [23]. Fruit skin and arils
were observed to have an intensive pink-red colour. It was detected that juice extraction methods did not
significantly change pH values. Similar results were reported by other researchers [24,25]. The other
characteristics responsible for the determination of juice quality are total soluble solids (◦Brix) and titratable
acidity. The total soluble solid values were between 14 and 16 ◦Brix in pomegranate samples. The
differences in the total soluble solid values may be related to the tannins formed by the damage of rind cells
during the juice extraction process in the HPJ sample. The existence of tannins is reported as an important
problem in juices extracted from whole fruits. Accordingly, a bitter taste can develop, and this must be
removed by industrial processing in order to meet the consumer demand [26]. The AJ and HPJ samples were
International Conference on
RAW MATERIALS TO PROCESSED FOODS 03-04 June 2021, Turkey
33
revealed to have close values of titratable acidity (TA) while juice obtained from the MAJ had a lower TA
value. Vazquez-Araujo et al. [27] reported that no significant differences were found in pH, TA, and TSS
values between Wonderful pomegranate juice samples from arils with albedo homogenate and from arils
only.
Significant differences were observed in the HPJ, AJ, and MAJ samples in terms of all L*, a*, b* colour
parameters (p < 0.05). Colour is an important food quality parameter, and it influences the consumer’s
preference and market value of the final product. As displayed in Table 1, the AJ (L*: 15.7) was found to be
darker than HPJ (L*: 22.0) and MAJ (L*: 23.9) samples. The colour of pomegranate juices is known to be
affected by the treatments applied in processing. The use of juices with low values of L* parameter (darker
red–purple) is recommended in the literature [28,29]. In comparison to the reported L*, a*, b* values in the
literature, the colour of the AJ juice sample from the cv. Caner pomegranate was found to be almost twice as
dark as the juices of nine Spanish pomegranate varieties [30]. In terms of redness (a*) and yellowness (b*),
cv. Caner pomegranate juices, independently from the extraction methods, were observed to have higher
values than both Spanish and Tunisian cultivars (values are in the range of 3.0–29.7 for a* and −1.7–23.7 for
b*) [23,30].
Sugars and Organic Acids of the Pomegranate Juice Samples
Sugars were detected as glucose and fructose in the samples. Sugar contents varied in the range of 51.0–56.0
g L−1 for glucose and 61.2–69.5 g L−1 for fructose depending on the juice extraction methods. These
findings are in agreement with the sugar contents determined in pomegranate juices in other previous studies
also reporting the glucose and fructose as the principal component of the juice sugar contents. Individual
sugar contents reported in the literature were 57–65 g L−1 for glucose and 60–71 g L−1 for fructose in 40
different Spanish cultivars [31] and 58–76 g L−1 for glucose and 58–71 g L−1 for fructose in the arils from
six pomegranate varieties in Turkey [24]. In the present study, citric, malic, and ascorbic acids were found as
organic acids in the juice samples (Table 2). Among these, ascorbic acid was present in minor amounts in all
samples. These data showed a similar correlation with the previous studies [24,31]. In the present study, the
juice sample obtained after maceration (MAJ) had lower amounts of sugars, but the organic acid contents
were similar in all three juice samples. When the three samples were compared, it was found that malic and
ascorbic acid levels were not significantly changed by the juice extraction methods.
Anthocyanin Compositions of Pomegranate Juice Samples
Anthocyanins are crucial quality compounds as they are responsible for the attractive red colour in
pomegranate juices [33]. In cv. Caner pomegranate juice samples analyzed in the present study, the total
anthocyanin concentration was determined as 408, 555, and 593 mgL−1 in the MAJ, HPJ, and AJ samples,
respectively. Thus, the juice extraction process method had a significant influence on anthocyanin
composition.
In the present study, a total of six anthocyanins, typical for pomegranates, were detected including cyanidin-
3-glucoside (Cya3), cyanidin-3,5-diglucoside (Cya3,5), delph inidin-3-glucoside (Dp3), delphinidin-3,5-
diglucoside (Dp3,5), pelargonidin-3-glucoside (Pg3), and pelargonidin-3,5-diglucoside (Pg3,5) in all juice
samples. Cya3,5 was determined to be the dominant anthocyanin in the studied samples followed by Dp3,5
(Table 3). This compound was reported as the main anthocyanin in Georgian pomegranate juices obtained
from cultivars of Rose, Afganski, Nikitski ranni, and Fleshman [25]. In addition, Kelebek and Canbas [34]
stated that cv. Hicaz pomegranate juices from Turkey are also rich in cyanidin-3,5-diglucoside. In the current
study, among the anthocyanins, Pg3 had the lowest amount in cv. Caner juice samples. Fawole and Opara
[35] reported that Cya3,5 was the major anthocyanin followed by Dp3,5 in cv. Bhagwa juices similar to the
results found in the present study. They also stated that the amounts of Cya3,5 and Dp3,5 increased with
ripening stage. With regard to the effects of juice extraction methods on the anthocyanin contents,

International Conference on
RAW MATERIALS TO PROCESSED FOODS 03-04 June 2021, Turkey
34
maceration of arils resulted in a reduction in their total amounts. This decrement may originate from the
effects of light exposure, oxygen, storage time, and temperature [36]. Similarly, Galego et al. [37] reported
that anthocyanins are highly sensitive pigments and significant changes in their structure are detected even if
these compounds are stored at −20 ◦C.
Antioxidant Capacity of the Juice Samples
Two methods (ABTS+ and DPPH−) were employed to assess the antioxidant capacities of the pomegranate
juices in the present study. These two assays are basically radical scavenging methods based on the
decolorization of free radicals [38]. The selection of these two assays was based on the chemical structure of
antioxidant substances and the interaction of them with oxidants. ABTS+ can be applied to both hydrophilic
and lipophilic antioxidants while DPPH− is applicable to hydrophobic systems as it can be dissolved in
organic media [38]. Antioxidant activity values were detected in the range of 6.1–11.3 mmol Trolox L−1 for
ABTS+ and 5.8–14.7 mmol Trolox L−1 for DPPH− analyses. These results are consistent with previous
studies that reported high antioxidant power in pomegranates of different varieties [12,23,39]. In addition,
the AJ sample was found to exhibit higher antioxidant activities than aril juices of cv. Mollar de Elche
pomegranate of Spain [13]. In the current study, juice extraction methods were determined to have an
influence on the valuable benefit of antioxidant activity as both assays revealed for all three pomegranate
juice samples. The HPJ sample had higher antioxidant activities than the AJ and MAJ samples (Table 3).
Similarly, Mphahlele et al. [40] reported that cv. Wonderful pomegranate juices obtained from halved fruits
showed higher antioxidant activity (1337 µM Trolox mL−1 ) in comparison with the juices from arils and
arils plus seeds. With respect to this, the research conducted by Orak et al. [41], which examined different
parts of the pomegranate, revealed that the pomegranate peel extract had the highest DPPH scavenging
activity compared to the pomegranate juice or seeds. Thus, it can be deduced that the HPJ sample with
higher antioxidant activity is related to the phenolics like hydrolysable tannins, punicalagins, anthocyanins,
and phenolic acids found in non-edible parts of pomegranates (peel, carpellary membranes, etc.).
Additionally, with regards to maceration, it is observed that the process had an at least two-fold diminishing
effect on the antioxidant activity of pomegranate juice. Such decrease in the antioxidant activity of the MAJ
sample may be due to the degradation of the anthocyanins, which is more probable during maceration.
Volatile Composition of the Pomegranate Juice Samples
Pomegranate juices have been reported to have low quantities of volatiles leading to a less intense aroma
[30]. To investigate the effects of different juice extraction methods on the aromatic profile of cv. Caner
pomegranate juice samples, liquid–liquid extraction was performed to obtain volatile compounds from three
juice samples in the present study. A total of 34 volatile compounds including mainly alcohols, esters, and
terpenes were identified and quantified. The total aroma composition of the samples was determined in the
range of 710.7 and 1872.0 µgL−1 with the MAJ having the highest volatile concentration. These results infer
that juice extraction processes had a substantial effect on both concentration and composition of the volatile
compounds. Alcohols were the dominant chemical group both quantitatively and qualitatively in the AJ and
MAJ samples while ketones were detected in higher amounts in HPJ sample. 1-Hexanol was predominant in
aril and macerated juices with amounts ranging 185–508 µgL−1 whereas 2,6-di(t-butyl)-4-hydroxy-4-
methyl-2,5-cyclohexadien-1-one had the highest concentration with a value of 405 µgL−1 in the MAJ
sample. 1-Hexanol is a sixcarbon aliphatic alcohol generally found in different parts of pomegranates and
their products [35,42–44]. C6 alcohols are generally produced by the lipoxygenase-hydroperoxide lyase
metabolic pathways. This compound was reported to contribute to green, grass, and fruity attributes in
pomegranate juices [43,45]. The amount of 1-hexanol was found to be higher in the AJ (185 µgL−1 ) than
the HPJ (53.5 µgL−1 ) juice sample while the MAJ had the highest value (508 µgL−1 ). Similarly,
Mphahlele et al. [40] determined that juices obtained from arils plus seeds had higher 1-hexanol
concentration than juices obtained from whole or halved fruits. In another study, maceration of juice with

International Conference on
RAW MATERIALS TO PROCESSED FOODS 03-04 June 2021, Turkey
35
Arbutus unedo L. distillate into pomegranate liquors caused increases in the amount of 1-hexanol level from
1.14 to 5.58 mg 100 mL−1 , which was originally absent in the distillate. These literature data are in
agreement with our results in the way that the juice exposed to maceration exhibited the highest
concentration of this compound. Another important six-carbon alcohol was determined to be (Z)-3-hexen-1-
ol in all three juice samples in the present study. This compound was also found in relatively higher amounts
in other pomegranate juices providing a strong fresh green odor due to its higher odor activity value [46].
This compound was also determined by Vazquez-Araujo et al. [47] in fresh and commercial pomegranate
juices from the USA. Ketones were the second crucial group of volatiles in all samples in the current study.
Among them, 2,6-di(t-butyl)-4-hydroxy-4-methyl-2,5-cyclohexadien-1-one was detected for the first time in
pomegranate juice in this current study as volatile compound to the best knowledge of the authors. It was
also reported to exist in fermented soy sauce and white strawberry (Fragaria chiloensis) and characterized by
caramel odor [48,49]. On the other hand, 2-Nonanone was detected only in the HPJ sample. This was also
reported to be an odor active compound responsible for cheesy, fruity, floral, and green attributes in
pomegranate samples [43,46]. In addition, this compound was detected in cv. Wonderful pomegranate juices
obtained with the peels [43]. Other important aromatic compounds in the juice samples were found to be
terpenes and esters (Table 4). Terpenes are secondary metabolites synthesized from isoprene units. Three
terpenes were detected including linalool, α-terpineol, and p-cymen-8-ol while αterpineol was common in all
three samples. This compound was also found in Chinese, American, South African, and other Turkish
pomegranate juices displaying floral and fruity attributes [29,43,46,50]. Besides α-terpineol, linalool and p-
cymen-8-ol were also reported to be detected in minor levels in different cvs. pomegranate juices [45–52].
With regard to esters, in the present study, (Z)-3-hexenyl acetate and isopulegol acetate were detected in
minor amounts. In previous studies, (Z)-3-hexenyl acetate was reported to be formed as a result of the
conversion of its corresponding six-carbon alcohols [53]. This compound was also previously reported in
different Spanish pomegranate juices and attributed to the green, sweet, and banana odor notes [28,52].
Butyrolactone was the only lactone compound found in all juice samples in the present study. This lactone is
responsible for sweet caramel odor and was also reported to be found in cv. Wonderful pomegranates [43].
In the current study, β-Ionone is a norisoproneoid typical to berries and was found only in trace levels in aril
and halved pomegranate juice samples. This compound was also reported to be found in some Spanish
pomegranate juices by Vazquez-Araujo et al. [47].
Sensory Analysis
Nine sensory attributes were utilized to describe the flavor of pomegranate juice samples: Pulpy, aroma,
color, sourness, sweetness, astringency, fruity, floral notes, and general impression. Pulpy was an attribute
present in all samples ranging from 3.8 and 5.6. This finding is similar to the data presented by Vazquez-
Araujo et al. [47] for pomegranate juice macerated with albedo homogenate. The sweet, sour, floral, and
astringency attributes of the samples were found to be very similar and no statistically significant difference
was found. HPJ (halved pomegranate juice) samples were characterized by more intense fruity and floral
odors. Floral note values were found to be the lowest among all sensory attributes (3.0–3.4) similar to the
data reported by Vazquez-Araujo et al. [47]. The largest statistically significant differences (p < 0.05) were
for aroma, color, and general impression attributes in the present study. The HPJ sample was less pulpy, but
it had high scores in all other attributes as compared to the other two samples, and it was also determined to
be the most preferred sample by panelists with the highest general impression score.
CONCLUSION
This study was the first detailed approach to elucidate volatiles, anthocyanins, sugars, organic acids, and
antioxidant properties of juices of Caner cultivar pomegranate fruits obtained from three different juice
extraction methods (halved pomegranate juice, HPJ, aril juice, AJ, and macerated aril juices, MAJ). The
experimental results clearly showed that these compounds in all juice samples were significantly altered by

International Conference on
RAW MATERIALS TO PROCESSED FOODS 03-04 June 2021, Turkey
36
the applied juice extraction method. The total quantity of the aroma compounds was detected to be increased
as a result of the macerating process (MAJ sample). 1-Hexanol and (Z)-3-hexen-1-ol were the main volatiles
in all juice samples. When the three juice samples were compared in terms of volatiles, it was found that
MAJ was quite rich in terms of these compounds compared to the HPJ and AJ samples. Among the volatile
compounds, 2,6-di(t-butyl)-4-hydroxy-4- methyl-2,5-cyclohexadien-1-one was determined for the first time
in this study as volatile compounds in pomegranate juices to the best knowledge of the authors. The main
anthocyanins were found as cyanidin-3,5-diglucoside followed by delphinidin-3,5-diglucoside in all three
juice samples. In contrast to the volatiles, it was found that all of the anthocyanin components of the MAJ
sample were significantly decreased during maceration due to the degradation of these compounds. Sensory
analysis revealed that the general impression of the HPJ sample was higher as compared to the AJ and MAJ
samples.
REFERENCES
1. Rinaldi, M.; Caligiani, A.; Borgese, R.; Palla, G.; Barbanti, D.; Massini, R. The effect of fruit processing
and enzymatic treatments on pomegranate juice composition, antioxidant activity and polyphenols content.
LWT-Food Sci. Technol. 2013, 53, 355–359.
2. TUIK. Turkish Statistical Institute, Production of Fruit Crops. Available online: https://data.tuik.gov.tr
(accessed on 24 December 2020).
3. Kaplan, M.; Hayek, T.; Raz, A.; Coleman, R.; Dornfeld, L.; Vaya, J.; Aviram, M. Pomegranate juice
supplementation to atherosclerotic mice reduces macrophage lipid peroxidation, cellular cholesterol
accumulation and development of atherosclerosis. J. Nutr. 2001, 131, 2082–2089.
4. Calín-Sánchez, Á.; Figiel, A.; Hernández, F.; Melgarejo, P.; Lech, K.; Carbonell-Barrachina, Á.A.
Chemical composition, antioxidant capacity, and sensory quality of pomegranate (Punica granatum L.) arils
and rind as affected by drying method. Food Bioprocess Technol. 2013, 6, 1644–1654.
5. Cano-Lamadrid, M.; Lech, K.; Michalska, A.; Wasilewska, M.; Figiel, A.; Wojdyło, A.; Carbonell-
Barrachina, Á.A. Influence of osmotic dehydration pre-treatment and combined drying method on physico-
chemical and sensory properties of pomegranate arils, cultivar Mollar de Elche. Food Chem. 2017, 232, 306–
315.
6. Casanova, E.; García-Mina, J.M.; Calvo, M.I. Antioxidant and antifungal activity of Verbena officinalis L.
leaves. Plant Foods Hum. Nutr. 2008, 63, 93–97.
7. Shaygannia, E.; Bahmani, M.; Zamanzad, B.; Rafieian-Kopaei, M. A review study on Punica granatum L.
J. Evid. Based Complement. Altern. Med. 2016, 21, 221–227.
8. Cano-Lamadrid, M.; Calín-Sánchez, Á.; Clemente-Villalba, J.; Hernández, F.; Carbonell-Barrachina,
Á.A.; Sendra, E.; Wojdyło, A. Quality parameters and consumer acceptance of jelly candies based on
pomegranate juice “Mollar de Elche”. Foods 2020, 9, 516.
9. Bomben, J.L.; Bruin, S.; Thijssen, H.A.; Merson, R.L. Aroma recovery and retention in concentration and
drying of foods. In Advances in Food Research, 20th ed.; Chichester, C.O., Mrak, E.M., Stewart, G.F., Eds.;
Academic Press: New York, NY, USA, 1973; Volume 20, pp. 1–111.
10. Cadwallader, K.R.; Tamamoto, L.C.; Sajuti, S.C. Aroma components of fresh and stored pomegranate
(Punica granatum L.) juice. In Flavors in Noncarbonated Beverages; Da Costa, N., Cannon, R., Eds.;
American Chemical Society: Washington, DC, USA, 2010; pp. 93–101.
11. Beaulieu, J.C.; Lloyd, S.W.; Preece, J.E.; Moersfelder, J.W.; Stein-Chisholm, R.E.; Obando-Ulloa, J.M.
Physicochemical properties and aroma volatile profiles in a diverse collection of California-grown
pomegranate (Punica granatum L.) germplasm. Food Chem. 2015, 181, 354–364.
12. Mousavinejad, G.; Emam-Djomeh, Z.; Rezaei, K.; Khodaparast, M.H.H. Identification and quantification
of phenolic compounds and their effects on antioxidant activity in pomegranate juices of eight Iranian
cultivars. Food Chem. 2009, 115, 1274–1278.
13. Nuncio-Jáuregui, N.; Cano-Lamadrid, M.; Hernández, F.; Carbonell-Barrachina, Á.A.; Calín-Sánchez, Á.

International Conference on
RAW MATERIALS TO PROCESSED FOODS 03-04 June 2021, Turkey
37
Comparison of fresh and commercial pomegranate juices from Mollar de Elche cultivar grown under
conventional or organic farming practices. Beverages 2015, 1, 34–44.
14. Gil, M.I.; Garcia-Viguera, C.; Artes, F.; Tomas-Barberan, F.A. Changes in pomegranate juice
pigmentation during ripening. J. Sci. Food Agric. 1995, 68, 77–81.
15. Kostka, T.; Ostberg-Potthoff, J.J.; Briviba, K.; Matsugo, S.; Winterhalter, P.; Esatbeyoglu, T.
Pomegranate (Punica granatum L.) extract and its anthocyanin and copigment fractions-free radical
scavenging activity and influence on cellular oxidative stress. Foods 2020, 9, 1617.
16. Melgarejo, P.; Martínez, J.J.; Hernández, F.; Martínez, R.; Legua, P.; Oncina, R.; Martinez-Murcia, A.
Cultivar identification using 18S–28S rDNA intergenic spacer-RFLP in pomegranate (Punica granatum L.).
Sci. Hortic. 2009, 120, 500–503.
17. Lee, H.S.; Coates, G.A. Quantitative study of free sugars and myo-inositol in citrus juices by HPLC and
a literature compilation. J. Liq. Chromatogr. Relat. Technol. 2000, 14, 2123–2141.
18. Kelebek, H.; Selli, S. Evaluation of chemical constituents and antioxidant activity of sweet cherry
(Prunus avium L.) cultivars. Int. J. Food Sci. Technol. 2011, 46, 2530–2537.
19. Kelebek, H.; Selli, S.; Sevindik, O. Screening of phenolic content and antioxidant capacity of Okitsu
mandarin (Citrus unshui Marc.) fruits extracted with various solvents. J. Raw Mater. Process. Foods 2020, 1,
7–12.
20. Selli, S.; Kelebek, H. Aromatic profile and odour-activity value of blood orange juices obtained from
Moro and Sanguinello (Citrus sinensis L. Osbeck). Ind. Crops Prod. 2011, 33, 727–733.
21. Keser, D.; Gamze, G.; Kelebek, H.; Keskin, M.; Soysal, Y.; Sekerli, Y.E.; Arslan, A.; Selli, S.
Characterization of aroma and phenolic composition of carrot (Daucus carota ‘Nantes’) powders obtained
from intermittent microwave drying using GC-MS and LC-MS/MS. Food Bioprod. Process. 2020, 119, 350–
359.
22. Sevindik, O.; Guclu, G.; Bombai, G.; Rombolá, A.D.; Kelebek, H.; Selli, S. Volatile compounds of cvs
Magliocco Canino and Dimrit grape seed oils. J. Raw Mater. Process. Foods 2020, 1, 47–54.
23. Zaouay, F.; Mena, P.; Garcia-Viguera, C.; Mars, M. Antioxidant activity and physico-chemical
properties of Tunisian grown pomegranate (Punica granatum L.) cultivars. Ind. Crops Prod. 2012, 40, 81–
89.
24. Ozgen, M.; Durgaç, C.; Serçe, S.; Kaya, C. Chemical and antioxidant properties of pomegranate cultivars
grown in the Mediterranean region of Turkey. Food Chem. 2008, 111, 703–706.
25. Rajasekar, D.; Akoh, C.C.; Martino, K.G.; MacLean, D.D. Physico-chemical characteristics of juice
extracted by blender and mechanical press from pomegranate cultivars grown in Georgia. Food Chem. 2012,
133, 1383–1393.
26. Vardin, H.; Fenercioglu, H. Study on the development of pomegranate juice processing technology:
Clarification of pomegranate ˇ juice. Food Nahrung. 2003, 47, 300–303.
27. Vázquez-Araújo, L.; Chambers, I.V.; EAdhikari, K.; Carbonell-Barrachina, A.A. Physico-chemical and
sensory properties of pomegranate juices with pomegranate albedo and carpellar membranes homogenate.
LWT-Food Sci. Technol. 2011, 44, 2119–2125.
28. Melgarejo, P.; Calín-Sánchez, Á.; Vázquez-Araújo, L.; Hernández, F.; Martínez, J.J.; Legua, P.;
Carbonell-Barrachina, Á.A. Volatile composition of pomegranates from 9 Spanish cultivars using headspace
solid phase microextraction. J. Food Sci. 2011, 76, 114–120.
29. Guler, Z.; Gul, E. Volatile organic compounds in the aril juices and seeds from selected five pomegranate
(Punica granatum L.) cultivars. Int. J. Food Prop. 2017, 20, 281–293.
30. Calín-Sánchez, Á.; Martínez, J.J.; Vázquez-Araújo, L.; Burló, F.; Melgarejo, P.; Carbonell-Barrachina,
Á.A. Volatile composition and sensory quality of Spanish pomegranates (Punica granatum L.). J. Sci. Food
Agric. 2011, 91, 586–592.
31. Melgarejo, P.; Salazar, D.M.; Artes, F. Organic acids and sugars composition of harvested pomegranate
fruits. Eur. Food Res. Technol. 2000, 211, 185–190.

International Conference on
RAW MATERIALS TO PROCESSED FOODS 03-04 June 2021, Turkey
38
Effect of quinoa and germinated wheat flour in physicochemical,
textural and sensory properties of cupcakes
Negin Javaheripoura, Lida Shahsavani Mojarrada, Shadi Mehdikhania, Yaser Inanloob, Ali Rafec
aDepartment of Food Science and Technology, Shahr-e-Qods Branch, Islamic Azad University, Tehran, Iran
bDepartment of Food Science and Technology, Faculty of Food Industry, Karaj University of Applied Science, Karaj,
Iran cDepartment of Food Processing, Research Instituteof Food Science and Technology, POBox: 91735-147, Mashhad,
Iran
*E-mail: [email protected]
ABSTRACT
The effect of quinoa flour addition along with germinated wheat flour on the physicochemical,
textural, sensory and stability of cupcakes as a convenience product for celiac disorders were
investigated. The cupcakes containing quinoa flour exhibited more hardness, elasticity and water activity
than the control cupcake. The textural attributes revealed that the cupcakes with quinoa flour along with
germinated wheat flour were statistically different from those with either quinoa flour or germinated wheat
flour as well as the control cupcake. Moreover, cupcakes with quinoa flour had greater acceptance and
preference. In addition, L* demonstrated a high correlation with porosity relative to chemical and textural
properties and can therefore be used as a parameter for the prediction of the stiffness and elasticity of
formulated products by image processing. As it is more convenient to calculate L* in food production, it may
be advised to use cupcakes prepared with QF and GWF to estimate the textural properties. Cupcakes
formulated with composite flours containing 15% of quinoa flour exhibited acceptable technological and
sensorial attributes. Consequently, the study also showed that the introduction of QF into germinated wheat
flour contributes to sensory and microbiological advantages in cupcakes that extend the cupcakes' shelf life
and is recommended as a proper alternative for celiac disorders.
Keywords: Pseudocereals; Quinoa; Germinated wheat flour; Texture: Celiac.
International Conference on
RAW MATERIALS TO PROCESSED FOODS 03-04 June 2021, Turkey
39
Effect of Pasteurization on Interaction of Bioactive Compounds in Pomegranate-
Sweet Orange Mix Juice
Bhoite Anjali Ashokrao1, Gaikwad Nilesh Nivruti3, Sathe Shivaji Jagannath2*, Banerjee Kaushik4,
Dashrath Oulkar4, Zarine Khan4
1Department of Food Safety Quality and, Nutrition MITSoFT, MITADT University, MS, India. 2Department of Microbiology, Shardabai Pawar College, Baramati, MS India.
3 ICAR-National Research Centre on Pomegranate, Kegaon, Solapur, MS, India 4National Grape Research Institute, Manjri farm, Solapur Road, Pune, India
*E-mail: [email protected]
ABSTRACT
The present study deals with the effect of pasteurization on pomegranate, sweet orange and mixed juice of
pomegranate and sweet orange (70:30). Thermal effect on TPC, FRAP antioxidant content, DPPH %
inhibition, anthocyanins, and ascorbic acid content were analysed. Colour of juices and the microbial load
were also analysed using standard methods. For mixed juice, interaction factor (IF) was determined by
Gawlik-Dziki method. In all juice samples at high-temperature pasteurization, treatments rise in TPC and
antioxidant content was observed. while a decrease in anthocyanin ascorbic acid was reported in all juice
samples. The Pearson Correlation Coefficient values of TPC and antioxidant activity for pomegranate juice
and mixed juice were found as 0.77 and 0.95, respectively. The IF factor study showed a synergistic effect.
No microbial load was found in high pasteurization heat treatments above 70oC. Further, profiling of
pomegranate juice performed by advance highresolution Ultra-performance Liquid chromatography revealed
the presence of significant health beneficial phenolic compounds in mixed juice (kaempferol, caffeic acid, p-
coumaric acid and ferulic acid, narirutin, naringin, hesperidin, neohesperidin, Apigenin 6-C-glucoside). The
identification of all phenolic compounds was based on the detection of the precursor ion and one
characteristic fragment ion, each with less than 5 ppm of mass error.
Keywords: Bioactive components, Interaction factor, Pasteurization, UHPLC
International Conference on
RAW MATERIALS TO PROCESSED FOODS 03-04 June 2021, Turkey
40
Texture and Color Evaluation of Dough and Tortillas Elaborated by Adding
Solids from Nixtamalization Waste
Francisco Guzmán-Rodríguez1*, Ruth Peña-Reyes1, Lorena Gómez-Ruíz1, Gerardo Ramírez-
Romero1, Alma E. Cruz-Guerrero1
1Departamento de Biotecnología, Universidad Autónoma Metropolitana-Iztapalapa, Av. San Rafael Atlixco 186, Col.
Vicentina, México D.F. 09340, México.
*E-mail: [email protected]
ABSTRACT
Nixtamalization or alkaline cooking, is a procedure that provides adequate textural characteristics to maize
products like dough and tortilla, but implies a high energy input and releases a considerable volume of waste
effluent (nejayote). In this work, the effect of nixtamalization temperature (60 and 90 °C) and the addition of
solids from nejayote, on textural properties and on the color of corn dough and tortillas, were studied. It was
observed that after nixtamalization at 60 °C the textural properties of corn products did not show a
significant difference compared to those processed at 90 °C. Regarding the addition of solids from nejayote,
it was observed that the textural properties and the color of the dough and tortillas were not modified, neither
at 60 nor at 90 °C, obtaining products with the same attributes as the commercial products. Due to that,
considerable energy savings in the process and a decrease in solids of the waste effluents, can be achieved.
Keywords: maize products, nixtamalization, texture, waste effluent
International Conference on
RAW MATERIALS TO PROCESSED FOODS 03-04 June 2021, Turkey
41
Novel Extraction Techniques for Natural Bioactive Compounds
Hasene Keskin Çavdar
Gaziantep University, Department of Food Engineering Faculty, 27310, Gaziantep-TURKEY
*E-mail: [email protected], 034233172319
ABSTRACT
Interest in natural bioactive compounds has greatly increased in the last decade. Natural bioactives are
physiologically active components and provide desirable health benefits, reducing the risk of chronic disease
and the process of carcinogenesis. Bioactive compounds can be extracted from natural sources such as
plants, food by-products, algae, and microalgae and utilized for development of nutraceuticals and functional
foods. Bioactive compounds in different commercial sectors such as pharmaceutical, food and chemical
industries require most appropriate and standard method to extract these active components. One of the
major challenges is to extract these biomolecules from their respective natural sources. Traditional solvent
extraction is very time consuming and require relatively large amount of solvents. Moreover, heat applied
during solvent evaporation can damage thermolabile bioactive compounds. Additionally, the safety of
residual organic solvents in the final product is being questioned. Recently, novel extraction techniques such
as ultrasound-assisted extraction, enzyme-assisted extraction, microwave-assisted extraction, supercritical
fluid extraction, pulsed electric field extraction and pressurized liquid extraction have been developed for the
extraction of bioactive compounds from plants in order to overcome the mentioned shortcomings of the
conventional solvent extraction. These methods are better suited for the extraction of thermolabile bioactive
compounds, which is not the case with the conventional methods. These novel methods provide shortened
extraction time, reduced solvent consumption, improved extraction yields, and enhanced quality of the
extracts. At present, some of those techniques are available at both analytical and industrial scale throughout
the globe. This present review is aimed to summarize the novel extraction methods along with their principal
mechanism for extracting bioactive compounds from the mentioned sources.
Keywords: Bioactive compounds, extraction techniques, novel developments
1. INTRODUCTION
Bioactives are metabolites synthesized by plants for self defence and other purposes and have the potential to
be used by humans for a variety of applications. There is growing interest of consumers towards food
bioactives that provide beneficial effects to humans in terms of health promotion and reduction in disease
risk (Kumar et al., 2017). Evidence is growing that use of bioactives might help to promote optimal health
and reduce the risk of chronic diseases such as cancer, coronary heart disease, stroke and Alzheimer’s
disease. Bioactives are obtained selectively from plants as specialty chemicals and can be used as
nutraceuticals, processed foods to complement a balanced diet or as drug leads (Puri et al., 2012).
Phytochemicals can be extracted from natural sources such as plants, food by-products, algae, and
microalgae and utilized for development of nutraceuticals and functional foods.
The low content of active molecules in the source material and the complexity of raw material makes it
necessary to find alternative methods of effective extraction (Marathe, 2017). One of the main challenges is
to extract these biomolecules from their respective natural sources. Different techniques have been reported
on these aspects in the literature, each having their own advantages and disadvantages. The choice of
technique mainly depends on the type of raw material, environmental concerns, process conditions, and
future applications of the bioactives (Marathe, 2017). Conventional solvent-based extraction of bioactives
often suffers from low extraction yields, requires long extraction times and the final product often contains
traces of organic solvents, which decrease the product quality. Thus, the development of an effective and
selective method for bioactive compound extraction is important (Puri et al., 2012). This review describes

International Conference on
RAW MATERIALS TO PROCESSED FOODS 03-04 June 2021, Turkey
42
the utilization of different novel extraction techniques for extraction of bioactives from plants.
2. METHODS USED FOR BIOACTIVE COMPOUND EXTRACTION
Several methods have been developed to improve extraction of bioactive compounds which include various
extraction techniques. The novel extraction techniques are discussed in the following sections (Joana Gil-
Chávez et al., 2013).
2.1. Solvent Extraction
Solvent extraction is used to obtain certain compounds from different materials such as fungi, algae and
microalgae, and, more commonly, plants. Basically, pretreated raw material is exposed to different solvents,
which takes up compounds of interest and also other agents (flavors and colorings). Samples are usually
centrifuged and filtered to remove solid residue, and the extract could be used as additive, food supplement
or be destined for the preparation of functional foods (Joana Gil-Chávez et al., 2013). Solvent extraction is
beneficial compared to other methods due to low processing cost and ease of operation. However, this
method uses toxic solvents, requires an evaporation/concentration step for recovery, and usually requires
large amounts of solvent and extended time to be carried out. Moreover, the possibility of thermal
degradation of natural bioactive components cannot be ignored due to the high temperatures of the solvents
during the long times of extraction. Solvent extraction has been improved by other methods such as
Soxhlet’s, ultrasound, or microwave extraction and supercritical fluid extraction in order to obtain better
yields (Kumar et al., 2017).
2.2. Microwave-Assisted Extraction (MAE)
MAE is a relatively new extraction technology which has been widely applied in a variety of natural
bioactive compounds with many advantages over conventional extraction techniques including lower
environmental pollution, higher extraction efficiency and shorter extraction time (Joana Gil-Chávez et al.,
2013).
A microwave is referred to as a nonionizing electromagnetic radiation that has a frequency of 300 MHz–300
GHz (Altemimi et al., 2017). The moisture, when heated up within the plant cell due to microwave effect,
evaporates and generates high pressure on the cell wall and results in swelling of the plant cell. This pushes,
stretches, and consequently ruptures the cell wall. These facilitate leaching of active constituents from the
cells to the solvent, thereby enhancing the yield of bioactive components. This phenomenon could be
intensified as the solvent is impregnated into the plant matrix at a high heating efficiency of the microwave
(Danlami Jibrin et al., 2014). Generally, elevated temperatures result in improved extraction efficiencies.
However, for the extraction of thermolabile compounds, high temperatures may cause the degradation of
extracts. In this case, the chosen power during MAE has to be set correctly to avoid excess temperatures,
leading to possible solute degradation (Wang & Weller, 2006) Open-vessel microwave extraction at
atmospheric pressure condition is better suited to thermolabile species (e.g., organometals) since it uses low
temperatures relative to closed-vessel systems (de Castro, 2012). More research is needed to investigate the
interaction between microwaves, and plant materials and solvents (Wang & Weller, 2006).
By considering economical and practical aspects, MAE is a strong novel extraction technique for the
extraction of nutraceuticals (Wang & Weller, 2006). However, MAE still uses organic solvents, such as
hexane, and therefore cannot be considered as a green technology. Furthermore, compared with other
modern extraction techniques, an additional stage (filtration or centrifugation) is required for the removal of
solid residues (Danlami Jibrin et al., 2014). Moreover, in order to be considered in industrial applications at
least two important limitations must be improved including i) the recovery of nonpolar compounds and ii)
the modification of the chemical structure of target compounds which may alter their bioactivity and limit
their application (Joana Gil-Chávez et al., 2013).
International Conference on
RAW MATERIALS TO PROCESSED FOODS 03-04 June 2021, Turkey
43
2.3. Ultrasonic-Assisted Extraction (UAE)
Ultrasound-assisted extraction has been used in diverse applications of food-processing technology to extract
bioactive compounds from plant materials. Ultrasound, with levels greater than 20 kHz, is used to disrupt
plant cell walls, which helps improve the solvent’s ability to penetrate the cells and obtain a higher extraction
yield. UAE can use a low operating temperature through processing, maintaining a high extract quality for
compounds (Altemimi et al., 2017). Ultrasound-assisted extraction may be a promising alternative to
conventional solvent extraction enhancing extraction efficiency and extraction rate, reducing extraction
temperature, and increasing the choice ranges of solvents. Therefore, use of ultrasound-assisted extraction is
advisable for thermolabile compounds, which may be altered under Soxhlet operating conditions due to the
high extraction temperature. However, it should be noted that since ultrasound generates heat, it is important
to accurately control the extraction temperature. The sonication time should also be considered carefully as
excess of sonication can damage the quality of extracts (Wang & Weller, 2006). Furthermore, pressure
frequency, moisture content of sample, milling degree, particle size and solvent are also very important
factors in order to obtain efficient and effective ultrasound-assisted extraction. UAE have also been
incorporated along with various classical techniques as they are reported to enhance the efficiency of a
conventional system (Azmir et al., 2013).
2.4. Pressurized Liquid Extraction (PLE)
Pressurized liquid extraction is a relative new technology for extraction of phytochemicals under high
temperature and pressure (Dai & Mumper, 2010). This method is known by several names; pressurized fluid
extraction, accelerated fluid extraction, enhanced solvent extraction, and high-pressure solvent extraction
(Azmir et al., 2013).
The temperature and pressure conditions utilized in PLE are within the ranges of 50–200 °C and 3.5–20
MPa, respectively. The elevated pressure causes the solvent temperature to rise above the normal boiling
point temperature. The increase in temperature tends to accelerate the extraction rate by increasing solubility
and mass transfer rate (Danlami et al., 2014). High temperature and pressure improve analyte solubility and
the desorption kinetics from the matrices. Therefore, extraction solvents including water which show low
efficiency in extracting phytochemicals at low temperatures may be much more efficient at elevated PLE
temperatures (Dai & Mumper, 2010). Also, the increased temperature reduces the viscosity and surface
tension of solvents, helping them to spread evenly over the biological matrix and improve the extraction rate
(Danlami et al., 2014). The high pressure helps the extraction cells to be filled faster and forces liquid into
the solid matrix. These new techniques allow a faster extraction in which less amount of solvents are used
and higher yields are obtained in comparison with traditional solvent extractions (Joana Gil-Chávez et al.,
2013). Therefore, extraction solvents including water which show low efficiency in extracting
phytochemicals at low temperatures may be much more efficient at elevated PLE temperatures (Dai &
Mumper, 2010). In some cases, pressurized hot water is employed as a solvent for extraction rather than an
organic solvent. This method is called pressurized hot water extraction or subcritical water extraction
(Danlami et al., 2014). The use of PLE allows the attainment of food-grade extracts obtained only when
water or other GRAS (generally recognized as safe) solvents, such as ethanol are used (Joana Gil-Chávez et
al., 2013).
The extraction of natural bioactive compounds by PLE has been demonstrated in numerous studies which
have presented several approaches to optimize the extraction conditions or evaluated their efficiency
compared with other methods. Despite the advantages over conventional methods, this method is not found
to be suitable for thermolabile compounds as high temperature can have deleterious effects on their structure
and functional activity (Joana Gil-Chávez et al., 2013). Moreover, this method has other disadvantes such as
(a) selectivity is achieved only by varying the solvent type, which tends to be exhaustive and may thus lead
to nonselective extractions; (b) postextraction cleanup is necessary; and (c) nowadays, it is used only for
analytical purposes because it has not yet been up-scaled (Danlami et al., 2014).
International Conference on
RAW MATERIALS TO PROCESSED FOODS 03-04 June 2021, Turkey
44
2.5. Supercritical Fluid Extraction (SFE)
Supercritical carbon dioxide (SC–CO2) extraction has received significant attention in the last few years as a
promising alternative to conventional solvent extraction for extracting biologically active compounds as it
offers a number of advantages, including high extraction efficiency, short extraction time and lack of residue
problems (Sahena et al., 2009).
SC-CO2 extraction has attracted a lot of interest because carbon dioxide (CO2) is an inert, low-cost with high
purity, nontoxic, and environmentally-friendly solvent that permits extraction at low temperatures and
comparatively low pressures. The extraction temperature as low as 30 °C and absence of oxygen and light
make this method attractive for the extraction of heat sensible compounds avoiding thermal degradation and
decomposition of possible labile compounds. In addition, CO2 can evaporate instantly when exposed to
atmospheric conditions (Danlami et al., 2014). Therefore, SFE can eliminate the concentration process,
which usually is time-consuming (Brusotti et al., 2014). In addition, this molecule is environmentally
friendly and “generally recognized as safe” (GRAS) by FDA (U.S. Food and Drug Administration) and
EFSA (European Food Safety Authority) (Joana Gil-Chávez et al., 2013).
During the process of extraction, raw material is placed in an extraction container equipped with temperature
and pressure controllers to maintain the required conditions. Following this, the extraction container is
pressurized with the fluid by a pump. Once the fluid and dissolved compounds are transported to separators,
the products are collected through a tap located in the lower part of the separators. Finally, the fluid is
regenerated and cycled or released to the environment (Kumar et al., 2017). Before SC-CO2 extraction,
vegetable substrates are commonly subjected to mechanical pretreatments to improve the rate and yield of
the extraction process. The pretreatments may have multiple purposes, including releasing of solutes from
cells, facilitating solvent flow through the packed bed, and increasing substrate load onto extraction vessels.
One frequently used treatment for high-oil seeds is prepressing to reduce the oil content (Singh, 2012). The
extraction efficiency and the characteristics of the products are affected by several parameters, such as
particle size and moisture content of the feed material, extraction temperature and pressure, solvent flow rate,
extraction time, and the use of a cosolvent (Temelli, 2009). However, because of its low polarity, CO2 is less
effective in extracting highly polar compounds from their matrices. For this reason, the use of other solvent
compounds is needed in order to enhance solubility and the selectivity of the process and they must be added
only in small quantities. Ethanol is recommended as a co-solvent in SFE because of its lower toxicity and
miscibility in CO2, although its applications is limited due to its unfavorable properties with respect to safety
and environmental considerations (Joana Gil-Chávez et al., 2013).
2.6. Enzyme-assisted extraction (EAE)
The application of enzymes for complete extraction of bioactives without the use of solvents is an attractive
alternative (Puri et al., 2012). Enzyme-assisted extraction offers safe, green, and novel approach for the
extraction of bioactives (Marathe, 2017). It is based on the ability of enzymes to catalyze reactions, under
mild processing conditions, in aqueous solutions (Kumar et al., 2017).
Plant cell walls contain polysaccharides such as cellulose, hemicellulose, and pectins which act as barriers to
the release of intracellular substances. Some enzymes such as cellulase, β-glucosidase, xylanase, β-
gluconase, and pectinase help to degrade cell wall structure and depolymerize plant cell wall
polysaccharides, facilitating the release of linked compounds. Hence, these enzymes have been proposed as
tools to optimize the extraction of compounds from plant (Joana Gil-Chávez et al., 2013). In the EAE
process, the operational conditions such as temperature of reaction, pH of system, enzyme concentration,
particle size of substrate, and time of extraction are important.
Several researchers have reported this method as a best choice for extraction of bioactives from various
sources. Enzyme-assisted extraction has the advantages of (1) Higher extraction yields by breaking down the
complex structure of raw material, (2) Removal of unwanted components of raw material selectively, (3)
International Conference on
RAW MATERIALS TO PROCESSED FOODS 03-04 June 2021, Turkey
45
High catalytic efficiency and preservation of the original efficacy of natural products. (4) Reduction in the
time of extraction and volume of solvent used (Marathe, 2017). However, enzyme-assisted extraction of
bioactive compounds from plants has potential commercial and technical limitations: (i) the cost of enzymes
is relatively expensive for processing large volumes of raw material; (ii) currently available enzyme
preparations cannot completely hydrolyze plant cell walls, limiting extraction yields of compounds,
including the extraction of stevioside; (iii) enzyme-assisted extraction can be difficult to scale up to industrial
scale because enzymes behave differently as environmental conditions such as the percentage of dissolved
oxygen, temperature and nutrient availability vary. However, if the above limitations can be overcome, then
enzyme-based extraction could provide an opportunity to not only increase extraction yields, but also to
enhance product quality by enabling the use of milder processing conditions such as lower extraction
temperatures (Puri et al., 2012).
2.7. Pulsed-Electric Field (PEF) Extraction
The application of pulsed electric fields for bioactive compound extraction from plants has received
increasing interest during the last 10 years (Shorstkii, 2017). This minimally invasive method allows
avoidance of undesirable changes in a biological material (Boussetta, 2012). Pulsed electric field processing
is a non-thermal food processing technology based on the application of short pulses of high voltage through
a food product, whether in semi-solid or liquid form, which is placed between two electrodes. This process is
carried out at either low or moderate temperature and is a promising non-thermal extraction technique
(Sotelo et al., 2015).
PEF can increase mass transfer during extraction by destroying membrane structure of plant materials for
enhancing extraction and decreasing extraction time. PEF has been applied to improve release of intracellular
compounds from plant tissue with the help of increasing cell membrane permeability. PEF treatment at a
moderate electric field (500 and 1000 V/cm; for 10−4–10−2 s) is found to damage cell membrane of plant
tissue with little temperature increase. Due to this reason, PEF can minimize the degradation of heat sensitive
compounds (Azmir et al., 2013). The application of electroporation through PEF offers a great potential for
extraction purposes. The main advantages of PEF pretreatment are those of the non-thermal extraction even
at high electric field strength (E > 20–30 kV/cm) due to its short pretreatment time (10−5–10−2 s). This
improves extraction rate and extraction yields. Generally, the PEF pretreatment requires lower energy
consumption compared to mechanical fractionation and thermal pretreatments. With no or little addition of
organic solvents or enzymes, extraction assisted by PEF pretreatment is usually conducted in green solvent
such as water or ethanol (Yu et al., 2016).
3. CONCLUSION
The present review indicates the use of various novel technologies adapted for the extraction of bioactive
compounds which can be used as nutraceuticals, dietary supplements and ingredients in functional foods.
This review is focused on the principles and mechanisms of green and safe techniques such as enzyme-
assisted extraction, ultrasonic-assisted extraction, microwave-assisted extraction, supercritical fluid
extraction, pressurized liquid extraction, pulsed electric field extraction as an alternative to traditional solvent
extraction in which enviromentally troublesome organic solvents are used. These methods are better suited
for the extraction of thermolabile bioactive compounds, which is not the case with the conventional methods.
At present, some of those techniques are available at both analytical and industrial-scale throughout the
globe. The further developments and optimisations in novel technologies may provide innovative approaches
to increase the production of specific active compounds for use as nutraceuticals or as ingredients in
functional foods. Moreover, detailed economic analysis of these extraction techniques and researches are
required for the design and scale-up of these new extraction methods to enhance their lab scale and
commercial uses.
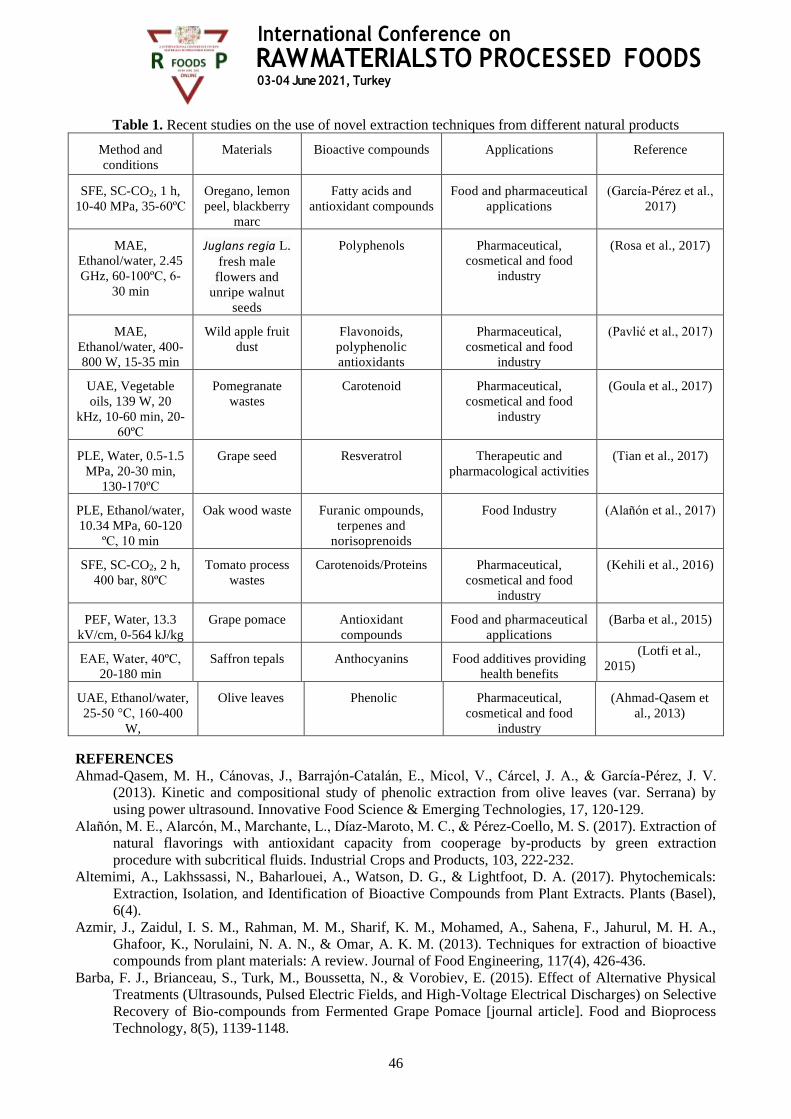
International Conference on
RAW MATERIALS TO PROCESSED FOODS 03-04 June 2021, Turkey
46
Table 1. Recent studies on the use of novel extraction techniques from different natural products
Method and
conditions
Materials Bioactive compounds Applications Reference
SFE, SC-CO2, 1 h,
10-40 MPa, 35-60ºC
Oregano, lemon
peel, blackberry
marc
Fatty acids and
antioxidant compounds
Food and pharmaceutical
applications
(García‐Pérez et al.,
2017)
MAE,
Ethanol/water, 2.45
GHz, 60-100ºC, 6-
30 min
Juglans regia L.
fresh male
flowers and
unripe walnut
seeds
Polyphenols Pharmaceutical,
cosmetical and food
industry
(Rosa et al., 2017)
MAE,
Ethanol/water, 400-
800 W, 15-35 min
Wild apple fruit
dust
Flavonoids,
polyphenolic
antioxidants
Pharmaceutical,
cosmetical and food
industry
(Pavlić et al., 2017)
UAE, Vegetable
oils, 139 W, 20
kHz, 10-60 min, 20-
60ºC
Pomegranate
wastes
Carotenoid Pharmaceutical,
cosmetical and food
industry
(Goula et al., 2017)
PLE, Water, 0.5-1.5
MPa, 20-30 min,
130-170ºC
Grape seed Resveratrol Therapeutic and
pharmacological activities
(Tian et al., 2017)
PLE, Ethanol/water,
10.34 MPa, 60-120
ºC, 10 min
Oak wood waste Furanic ompounds,
terpenes and
norisoprenoids
Food Industry (Alañón et al., 2017)
SFE, SC-CO2, 2 h,
400 bar, 80ºC
Tomato process
wastes
Carotenoids/Proteins Pharmaceutical,
cosmetical and food
industry
(Kehili et al., 2016)
PEF, Water, 13.3
kV/cm, 0-564 kJ/kg
Grape pomace Antioxidant
compounds
Food and pharmaceutical
applications
(Barba et al., 2015)
EAE, Water, 40ºC,
20-180 min
Saffron tepals Anthocyanins Food additives providing
health benefits
(Lotfi et al.,
2015)
UAE, Ethanol/water,
25-50 °C, 160-400
W,
Olive leaves Phenolic Pharmaceutical,
cosmetical and food
industry
(Ahmad-Qasem et
al., 2013)
REFERENCES
Ahmad-Qasem, M. H., Cánovas, J., Barrajón-Catalán, E., Micol, V., Cárcel, J. A., & García-Pérez, J. V.
(2013). Kinetic and compositional study of phenolic extraction from olive leaves (var. Serrana) by
using power ultrasound. Innovative Food Science & Emerging Technologies, 17, 120-129.
Alañón, M. E., Alarcón, M., Marchante, L., Díaz-Maroto, M. C., & Pérez-Coello, M. S. (2017). Extraction of
natural flavorings with antioxidant capacity from cooperage by-products by green extraction
procedure with subcritical fluids. Industrial Crops and Products, 103, 222-232.
Altemimi, A., Lakhssassi, N., Baharlouei, A., Watson, D. G., & Lightfoot, D. A. (2017). Phytochemicals:
Extraction, Isolation, and Identification of Bioactive Compounds from Plant Extracts. Plants (Basel),
6(4).
Azmir, J., Zaidul, I. S. M., Rahman, M. M., Sharif, K. M., Mohamed, A., Sahena, F., Jahurul, M. H. A.,
Ghafoor, K., Norulaini, N. A. N., & Omar, A. K. M. (2013). Techniques for extraction of bioactive
compounds from plant materials: A review. Journal of Food Engineering, 117(4), 426-436.
Barba, F. J., Brianceau, S., Turk, M., Boussetta, N., & Vorobiev, E. (2015). Effect of Alternative Physical
Treatments (Ultrasounds, Pulsed Electric Fields, and High-Voltage Electrical Discharges) on Selective
Recovery of Bio-compounds from Fermented Grape Pomace [journal article]. Food and Bioprocess
Technology, 8(5), 1139-1148.
International Conference on
RAW MATERIALS TO PROCESSED FOODS 03-04 June 2021, Turkey
47
Boussetta, N., Reess, T., Vorobiev, E., Lanoisellé, J. L. (2012). Pulsed Electrical Discharges: Principles and
Application to Extraction of Biocompounds. In D.-W. Sun (Ed.), Enhancing Extraction Processes in
the Food Industry (pp. 145-172). CRC Press.
Brusotti, G., Cesari, I., Dentamaro, A., Caccialanza, G., & Massolini, G. (2014). Isolation and
characterization of bioactive compounds from plant resources: the role of analysis in the
ethnopharmacological approach. Journal of Pharmaceutical and Biomedical Analysis, 87, 218-228.
Dai, J., & Mumper, R. J. (2010). Plant Phenolics: Extraction, Analysis and Their Antioxidant and Anticancer
Properties. Molecules, 15(10), 7313.
Danlami Jibrin, M., Arsad, A., Ahmad Zaini Muhammad, A., & Sulaiman, H. (2014). A comparative study
of various oil extraction techniques from plants. In Reviews in Chemical Engineering (Vol. 30, pp.
605).
Danlami, J. M., Arsad, A., Zaini, A., Abbas, M., & Sulaiman, H. (2014). A comparative study of various oil
extraction techniques from plants. Reviews in Chemical Engineering, 30(6), 605-626.
de Castro, M. D. L., Priego-Capote, F. (2012). Microwave-Assisted Extraction. In D.-W. Sun (Ed.),
Enhancing Extraction Processes in the Food Industry (pp. 85-122). CRC Press.
García‐Pérez, J. S., Robledo-Padilla, F., Cuellar-Bermudez, S. P., Arévalo-Gallegos, A., Parra-Saldivar, R.,
Zavala-Yoe, R., Ramirez-Mendoza, R. A., & Iqbal, H. M. N. (2017). Thermodynamics and statistical
correlation between supercritical-CO2 fluid extraction and bioactivity profile of locally available
Mexican plants extracts. The Journal of Supercritical Fluids, 122, 27-34.
Goula, A. M., Ververi, M., Adamopoulou, A., & Kaderides, K. (2017). Green ultrasound-assisted extraction
of carotenoids from pomegranate wastes using vegetable oils. Ultrasonics Sonochemistry, 34, 821-
830.
Joana Gil-Chávez, G., Villa, J. A., Fernando Ayala-Zavala, J., Basilio Heredia, J., Sepulveda, D., Yahia, E.
M., & González-Aguilar, G. A. (2013). Technologies for Extraction and Production of Bioactive
Compounds to be Used as Nutraceuticals and Food Ingredients: An Overview. Comprehensive
Reviews in Food Science and Food Safety, 12(1), 5-23.
Kehili, M., Schmidt, L. M., Reynolds, W., Zammel, A., Zetzl, C., Smirnova, I., Allouche, N., & Sayadi, S.
(2016). Biorefinery cascade processing for creating added value on tomato industrial by-products from
Tunisia. Biotechnology for Biofuels, 9(1), 261.
Kumar, K., Yadav, A. N., Kumar, V., Vyas, P., & Dhaliwal, H. S. (2017). Food waste: a potential
bioresource for extraction of nutraceuticals and bioactive compounds [journal article]. Bioresources
and Bioprocessing, 4(1), 18.
Lotfi, L., Kalbasi-Ashtari, A., Hamedi, M., & Ghorbani, F. (2015). Effects of enzymatic extraction on
anthocyanins yield of saffron tepals (Crocos sativus) along with its color properties and structural
stability. Journal of Food and Drug Analysis, 23(2), 210-218.
Marathe, S. J., Jadhav, S. B. , Bankar, S. B. , Singhal, R. S. . (2017). Enzyme-Assisted Extraction of
Bioactives. In M. Puri (Ed.), Food Bioactives Extraction and Biotechnology Applications (pp. 171-
201). Springer.
Pavlić, B., Naffati, A., Hojan, T., Vladić, J., Zeković, Z., & Vidović, S. (2017). Microwave-assisted
extraction of wild apple fruit dust—production of polyphenol-rich extracts from filter tea factory by-
products. Journal of Food Process Engineering, 40(4), e12508-n/a, Article e12508.
Puri, M., Sharma, D., & Barrow, C. J. (2012). Enzyme-assisted extraction of bioactives from plants. Trends
in Biotechnology, 30(1), 37-44.
Rosa, R., Tassi, L., Orteca, G., Saladini, M., Villa, C., Veronesi, P., Leonelli, C., & Ferrari, E. (2017).
Process Intensification by Experimental Design Application to Microwave-Assisted Extraction of
Phenolic Compounds from Juglans regia L. Food Analytical Methods, 10(3), 575-586.
Sahena, F., Zaidul, I., Jinap, S., Karim, A., Abbas, K., Norulaini, N., & Omar, A. (2009). Application of
supercritical CO2 in lipid extraction–a review. Journal of Food Engineering, 95(2), 240-253.
Shorstkii, I., Mirshekarloo, M. S., Koshevoi, E. (2017). Application of Pulsed Electric Field for Oil
Extraction from Sunflower Seeds: Electrical Parameter Effects on Oil Yield. Journal of Food Process
Engineering, 40(1), e12281, Article e12281.
Singh, R. K., Avula, R. Y. (2012). Supercritical Fluid Extraction in Food Processing. In D.-W. Sun (Ed.),
Enhancing Extraction Processes in the Food Industry (pp. 195-222). CRC Press.
Sotelo, K. A., Hamid, N., Oey, I., Gutierrez-Maddox, N., Ma, Q., & Leong, S. Y. (2015). Effect of pulsed
electric fields on the flavour profile of red-fleshed sweet cherries (Prunus avium var. Stella).
International Conference on
RAW MATERIALS TO PROCESSED FOODS 03-04 June 2021, Turkey
48
Molecules, 20(3), 5223-5238.
Temelli, F. (2009). Perspectives on supercritical fluid processing of fats and oils. The Journal of Supercritical
Fluids, 47(3), 583-590.
Tian, Y., Wang, Y., Ma, Y., Zhu, P., He, J., & Lei, J. (2017). Optimization of Subcritical Water Extraction of
Resveratrol from Grape Seeds by Response Surface Methodology. Applied Sciences, 7(4), 321.
Wang, L., & Weller, C. L. (2006). Recent advances in extraction of nutraceuticals from plants. Trends in
Food Science & Technology, 17(6), 300-312.
Yu, X., Gouyo, T., Grimi, N., Bals, O., & Vorobiev, E. (2016). Pulsed electric field pretreatment of rapeseed
green biomass (stems) to enhance pressing and extractives recovery. Bioresource Technology, 199,
194-201.
International Conference on
RAW MATERIALS TO PROCESSED FOODS 03-04 June 2021, Turkey
49
Development and Characterization of an Exopolysaccharide -Functionalized
Acid Whey Cheese Using Lactobacillus delbrueckii ssp. bulgaricus
Sara Carrero-Puentes1,2, Carlos Fuenmayor2, Carlos Jiménez-Pérez1, Francisco Guzmán-
Rodríguez1, Lorena Gómez-Ruiz1, Gabriela Rodríguez-Serrano1, Sergio Alatorre-Santamaría1,
Mariano García-Garibay1,3, Alma E. Cruz-Guerrero1
1Departamento de Biotecnología, Universidad Autónoma Metropolitana-Iztapalapa, Av. San Rafael Atlixco 186, Col.
Vicentina, México D.F. 09340, México. 2Instituto de Ciencia y Tecnología de Alimentos, Universidad Nacional de Colombia. Av. Cra. 30 # 45-03 Ed. 500C,
111321. Bogotá, Colombia. 3Departamento de Ciencias de la Alimentación, Universidad Autónoma Metropolitana-Lerma. Av. Hidalgo Poniente
46, Col. La Estación, CP 52006, Lerma de Villada, Estado de México, México.
E-mail: [email protected]
ABSTRACT
Lactobacillus delbrueckii ssp. bulgaricus NCFB 2772 was employed to develop functional acid whey cheese
(requesón) added with in situ produced exopolysaccharide (EPS) and tested as a carrier of the commercial
probiotic Lactobacillus paracasei ssp. paracasei. The optimum temperature of EPS biosynthesis by the
NCFB 2772 strain at pH 4.6 was 37 °C (0.274 mg / mL of whey). Four different requesón formulations were
prepared and analyzed in terms of texture properties and color. Addition of EPS significantly increased the
obtained yields, and improved some texture parameters such as hardness, elasticity, and adhesiveness.
However, colorimetric assays demonstrated that the addition of EPS and a commercial probiotic slightly
affected the L* value, obtaining products with less luminosity. The present study supports utilization of acid
whey wastes to obtain functional cheese such as requesón in which the EPS component can improve not only
processing yields but also its sensorial characteristics.
Keywords: cheese, exopolysaccharide, Lactobacillus casei, Lactobacillus delbrueckii

International Conference on
RAW MATERIALS TO PROCESSED FOODS 03-04 June 2021, Turkey
50
Chapatti (Flat Bread) Characteristics as Affected by Onion Peel Powder
Nabia Siddiqui1, Tahira Mohsin Ali1*, Abid Hasnain1
1Departmenrt of Food Science and Technology, University of Karachi, Karachi, 75270, Pakistan.
*Email: [email protected], 92-322-2481568
ABSTRACT
The novel approach was made by the addition of onion peel in the form of dried onion peel powder (OPP) in
the preparation of chapatti (unleavened flat bread). The OPP was added at (1-3)% level in chapatti. For all
doughs with and without OPP, G' (storage modulus) was found to be higher than G'' (loss modulus) and
exhibited pseudoplastic behavior. The crude fiber content in chapattis significantly increased from 1.75% to
4.09%, respectively. The OPP added chapatti also showed improved antioxidant properties due to rise in the
phenolic and flavonoid content. The OPP added chapattis required lower tearing force and had reduced
elasticity compared to control ones. Chapatti incorporated with OPP also demonstrated longer shelf life.
Thus, this waste could be utilized as a source of bioactive constituents possessing antioxidant and
antimicrobial properties due to the presence of phenols. Besides phenols, it is also a rich source of fiber.
Thus, for the very first time, onion peel powder was supplemented in the making of flatbread chapattis, being
a staple food in many South Asian countries.
Keywords: Antioxidant, chapatti, fiber, Onion peel

International Conference on
RAW MATERIALS TO PROCESSED FOODS 03-04 June 2021, Turkey
51
Rheological, Textural and Digestibility Characteristics of Chapatti as Affected by
Incorporation of Type 4 Resistant Starch Prepared from Sorghum and Corn
Starch
Faiza Shaikh1, Tahira Mohsin Ali1*, Saqib Arif2, Lubna Raza3, Abid Hasnain1
1 Food Science and Technology, University of Karachi, Karachi, 75270, Pakistan 2 Food Quality and Safety Research Institute, Pakistan Agricultural Research Council (PARC), University of Karachi
Campus, 75270, Pakistan 3Dow Medical College, DUHS, Karachi, Pakistan
*Email: [email protected], 92-322-2481568
ABSTRACT
RS4 is a functional ingredient possessing physiological benefits and desirable functional properties. The
conventional fibers like cereal brans increase fiber content of food but adversely affects sensory profile.
Therefore, the objective of this study was to incorporate corn and sorghum based resistant starch i.e.
RS4 (starch citrates) in chapatti up to 15%. RS4 substitution produced dough that was stronger and resistant
to shear. The corn based RS4 dough exhibited elastic behaviour throughout the frequency range while
sorghum based dough at 15% exhibited viscous behaviour at higher frequency. The % critical strain of corn
and sorghum at 10% RS4 dough was significantly higher than control. The chapattis produced were soft and
extensible, having low glycemic index (pGI). The predicted glycemic index (pGI) of chapattis decreased
from 57.25 to 44.97, with significant decrease being found in sorghum based chapatti. The RS4 incorporated
chapattis had similar sensory acceptance compared to that of control. With the incorporation of RS in
processed foods, the nutritional profile of the products will improve as well as it will make a healthy diet.
This study provided an insight of the resistant starch (RS4) incorporation in wheat flour-based chapatti that is
an important part of south-asian daily diets. Moreover, it will help in the incorporation of RS in other wheat-
based products such as breads, cakes, biscuits, tortillas etc. at commercial level.
Keywords: Chapatti, glycemic index, resistant starch, wheat flour
International Conference on
RAW MATERIALS TO PROCESSED FOODS 03-04 June 2021, Turkey
52
Oleuropein Extraction from Leaves of Three Olive Varieties (Olea europaea L.):
Antioxidant and Antimicrobial Properties of Purified Oleuropein and
Oleuropein Extracts
Semra Topuz1*, Mustafa Bayram1
1 Deparment of Food Engineering, Faculty of Engineering and Architecture, Tokat Gaziosmanpaşa University,
Department of Food Engineering, 60250, Tokat, Turkey
*E-mail: [email protected], +903562521600/2886
ABSTRACT
Olive leaf which is one of the by-products of olive tree cultivation and olive processing industry, is a
potential source of phenolic compounds. The most dominant phenolic compound in olive leaf is oleuropein.
In this study, it was aimed to extract, purify oleuropein from leaves of different olive varieties and determine
antioxidant and antimicrobial activity. For this purpose, olive leaf crude extract, partially purified oleuropein
and purified oleuropein were obtained from leaves of Domat, Edremit, Trilye olive tree varieties. Oleuropein
amount of olive leaf products ranged between 215.26-958.22 mg/g and the highest oleuropein content was
found in Domat. Amount of oleuropein in olive leaf products was increased depend on purification processes
(approximately 90% purity). Total phenolic content in terms of gallic acid and oleuropein ranged between
102.36-325.02 mg GAE/g and 308.06-915.33 mg OE/g, respectively. Antioxidant activities of olive leaf
products ranged between 104.83-456.50 mg TE/g (ABTS) and 109.27-456.93 mg TE/g (DPPH),
respectively. There is an increase in antioxidant activities of products obtained purificiation processes. MIC
values for Escherichia coli O157:H7, Listeria monocytogenes, Salmonella Typhimurium and Staphylococcus
aureus cultures ranged between 1:1 (50 mg/mL) to 1:64 (0.781 mg/mL). S. aureus is more sensitive to these
products compared to other microorganisms, whereas E. coli O157: H7 is more resistant than other
microorganisms. In conclusion, crude extracts and oleuropein purified from these crude extracts have
potential to extend shelf life of food products due to their determined antioxidant and antimicrobial activities.
Keywords: Oleuropein, Purification, Olive leaf, Antimicrobial, Antioxidant

International Conference on
RAW MATERIALS TO PROCESSED FOODS 03-04 June 2021, Turkey
53
Total Phenolic and Antioxidant Bioaccessibilities of Cookies Enriched with Bee
Pollen
Ayse Neslihan DUNDAR1
Department Food Engineering, Bursa Technical University, Bursa, Turkey
Corresponding author’s telephone:+90 2243003501, fax:+90 2243003419,
E-mail: [email protected]
ABSTRACT
The purpose of this study was to investigate the use of bee pollen (5, 10%, 15%) as a natural and functional
ingredient in cookies. Evaluation of physicochemical and sensory properties with total phenolic and
antioxidant capacities, using ABTS and CUPRAC methods, in extractable, hydrolysable and bioaccesible
fractions of enriched cookies was studied. With the addition of pollen, the moisture and carbohydrate
content of the cookies decreased, while the ash, total protein and total fat content increased. Parallel to the
increased addition of pollen, spread ratio (SR), diameter, the browning index, a * and b * values and
hardness of the cookies increased, whereas L* values decreased. Total phenolic contents of the enriched
cookies were determined as 352.70-401.13 mg/100 g, of which 92.27-93.16% were hydrolysable phenolic
content, only 8.55-9.26% of the total phenolic contents were bioaccesible. The highest TEACABTS and
TEACDPPH results were 88.01 ± 0.79 and 147.24 ± 0.62 µmol Trolox / g (15% pollen addition), respectively,
and were higher than the control sample. More than 88% of the total antioxidant capacity values were
detected as hydrolyzable fractions and bioaccessibility fraction values were very low as in total phenolic
content. In addition, the cookies produced with the addition of bee pollen were accepted in terms of their
sensory properties, and the 10% bee pollen added cookies were most liked by the evaluators. In the light of
the information obtained, it can be said that bee pollen is an ingredient that can improve the quality criteria
while improving the functional properties of the cookies.
Keywords: Bee pollen, cookie, hydrolysable fraction, bioaccesiblity

International Conference on
RAW MATERIALS TO PROCESSED FOODS 03-04 June 2021, Turkey
54
Cloud Point Extraction of Lutein and β-carotene from Spinach Waste
Bahar Er, Gökhan Durmaz*
Department of Food Engineering, Inonu University, 44280 Malatya, Turkey
Tel: +904223774793, Fax: +904223410046
*E-mail: [email protected]
ABSTRACT
In this study, it was aimed to extract lutein and β-carotene from spinach waste using aqueous solutions of
nonionic surfactants by cloud point extraction (CPE) technique. In accordance with this purpose; parameters
such as appropriate surfactant type and concentration, phase separation temperature and time, salt
concentration have been optimized. In the preliminary trials to see the effect of HLB value of various
nonionic surfactants on extraction performance, the best results were obtained with Tween series surfactants
having high HLB values. The most suitable surfactant for extraction was determined as Tween 40. Optimum
extraction conditions; The surfactant and salt concentration were determined as 10%, the incubation
temperature as 70˚C, and the incubation time as 40 minutes. Lutein and β-carotene content in the cloud point
extract obtained in the pre-determined optimum conditions were quantified by a HPLC system. In parallel,
the efficiency of the CPE method in terms of carotenoid extraction from spinach wastes was determined by
comparing to that of obtained with methanol:acetone mixture. Recovery rates with the CPE technique were
determined as 66.76% for lutein and 149.89% for β-carotene. The results obtained showed that with the CPE
technique, carotenoids from the food matrix can be obtained at a high rate by using aqueous solutions of non-
ionic surfactants without requiring an additional recovery or purification step.
Keywords: β-carotene, Cloud point, Green solvents, Lutein, Spinach
This study was supported by Inonu University Scientific Projects Coordination Unit (Project ID: 2281)
International Conference on
RAW MATERIALS TO PROCESSED FOODS 03-04 June 2021, Turkey
55
LC-DAD-ESI-MS/MS Characterization of Phenolic Compounds in Wines from
Vitis vinifera ‘Shesh i bardhë’ and ‘Vlosh’ Cultivars
Dritan Topi1*, Hasim Kelebek2, Gamze Guclu3, Serkan Selli3
1Department of Chemistry, Faculty of Natural Sciences, University of Tirana, Tirana, Albania 2Department of Food Engineering, Faculty of Engineering, Adana Alparslan Turkes Science and Technology
University, Adana, Turkey 3Department of Food Engineering, Faculty of Agriculture, Cukurova University, Adana, Turkey
*E-mail: [email protected]; +355692982522
ABSTRACT
Phenolic compounds in white wines produced by cv. Shesh i bardhë, and red wines produced by cv. Vlosh,
two native grape cultivars of Albania, were investigated by using Liquid Chromatography-Diode Array
Detection-Electrospray Ionization-Tandem Mass Spectrometry (LC-DAD-ESI-MS/MS). A total of 32
phenolic compounds including phenolic acids, flavan-3-ols, flavonols and stilbenes were identified in both
wines, with flavanols the main family contributing to total phenolics, from 45.3 % to 89.9 %. Gallic acid,
procyanidin dimer and trans-caftaric acid were found main compounds in both wines. Significant differences
have been found depending on the region and vintage. It was observed that total phenolic content in wines
from Durrësi region clearly stand higher compared to wines originating from Tirana region. As a result,
significant variations were found among the cultivars in terms of the phenolic profiles and phenolic
compounds of the Shesh i bardhë wines was much higher compared to the Vlosh wines.
Keywords: Shesh i bardhë cv., white wine, Vlosh cv., red wine, phenolic compounds, flavonols, resveratrol,
Albania.
INTRODUCTION
Grapevine (Vitis spp.) is globally known as one of the essential fruit species, evidenced in the production of
wine, grape juice, and other food formulations (Torregrosa et al., 2015). Its annual world production reached
more than 79 million tons in 2018, being one of the world's largest fruit crops, while wine production over
29 million tones (OIV, 2019). Produced by must fermentation of grape, wine is considered a product of high
commercial importance (Markoski et al., 2016). It contains polyphenols such as anthocyanins, flavonols and
stilbenes (resveratrol), which originate mainly from red grapes seeds and skins (Flamini et al., 2013).
Polyphenols are secondary metabolites, which based on their chemical structure are divided into two major
groups: flavonoid and non-flavonoid compounds (Waterhouse, 2002). These natural metabolites arise from
either the shikimate pathway or 'polyketide' acetate/malonate pathway, or both, producing monomeric and
polymeric phenols (Lattanzio, Kroon, Quideau & Treutter, 2008). The flavonoids’ group comprise different
flavones, flavonols, flavanones, flavanols, anthocyanins, chalcones, and dihydrochalcones (Waterhouse,
2002; Kennedy, 2008), while non-flavonoids include phenolic acids, and stilbenes (Fernandes et al., 2017).
A complex relationship between the factors such as temperature, sunlight, soil, water availability and
physiological process of the vine variety influence the wine quality (Lattanzio, Kroon, Quideau & Treutter,
2008; Kelebek, Canbas, Jourdes & Teissedre, 2010). Sensory characteristics such as wines’ color, flavor,
astringency, and hardness; are directly associated with phenolics, or through their interaction with other wine
constituents (El Khaland et al., 2018). Wine phenolics are used as markers of wine quality and authenticity
(Merkyte, Longo, Windisch & Boselli, 2020). These compounds have been found to associate with positive
effects on health, presenting protective or therapeutic effects on many degenerative and aging-related
diseases such as cancer and cardiovascular diseases (Guerrero, García-Parrilla, Puertas, & Cantos-Villar,
2009; Fernandes et al., 2017).

International Conference on
RAW MATERIALS TO PROCESSED FOODS 03-04 June 2021, Turkey
56
Shesh i bardhë is a native grape variety, widely planted in Albania, used in the production of one of the high-
quality dry white wines. Western regions of the country, especially to Durrësi and Tirana present main area
of this grape cultivar. The grapevine variety Vlosh, is planted in Vlora region, and produce a light red wine
(Susaj, Susaj & Duhanaj, 2018). According to our acknowledge, the influence of vineyard location on the
phenolic content of Shesh i bardhë and Vlosh wines and how these factor affects the quality of wines have
been never investigated and reported. Therefore, the aims of this research were to detect possible differences
in phenolics composition and wine quality manufactured with wines of the Shesh i bardhë and Vlosh wines,
according to cultivar, vintage and region. Red wine is the primary source of resveratrol isomers (trans- and
cis-) and in its glucoside forms (piceid = resveratrol 3-O-β-glucoside). Resveratrol is the parent molecule of a
family of polymers named viniferins (Rosario-Bronze, Duarte, & Matias, 2012). The grapevine variety,
climate conditions, phytosanitary conditions, and wine storage duration, are some of the influencing factors
to the resveratrol content (Radovic, Tesevic, Kodzulovic & Maras, 2015).
Several epidemiological studies support a positive association between red wine consumption and human
health. The potent antioxidant activity of phenolic compounds in red wine has been proposed as an
explanation for the French paradox (Guerrero, García-Parrilla, Puertas, & Cantos-Villar, 2009).
Consumption of wine polyphenols reduces total plasma cholesterol and/or LDL cholesterol, which plays a
role in the development of atherosclerosis. Phenolic compounds exhibit health-promoting effects associated
with skin protection, antioxidant, antibacterial, anticancer, anti-inflammatory, and anti-diabetic activities, as
well as hepato-protective, cardio-protective, and neuroprotective effects and other health benefits. Disease
prevention is related to the potent antioxidant capacity of polyphenols in neutralizing the adverse effects of
reactive oxygen species (ROS) (Friedman, 2014; Nassiri-Asl & Hosseinzadeh, 2016). Also, wine
consumption is related to reducing the incidence of several cancers, such as renal, gastrointestinal, lung, and
prostate cancers (Jose et al., 2014). A positive association between wine consumption and obesity has been
claimed, with positive effects on Neurological Diseases by reducing the incidence of dementia and
Alzheimer’s diseases (Fernandes et al., 2017).
Several studies with a focus on trans-resveratrol have shown its ability to modulates lipid metabolism by
protecting lipoproteins from oxidative damage and anticancer, antioxidant, anti-inflammatory, and
cardioprotective properties, as well as the ability to inhibit platelet aggregation (Guerrero, García-Parrilla,
Puertas, & Cantos-Villar, 2009; El Khawand et al., 2018). Nevertheless, these promising effects of
resveratrol support the contention that moderate wine consumption is health-promoting (Fernandes, 2017).
Flavonols of Vitis vinifera red grape cultivars occur as three glycosylated series (3-O-glucosides, 3-O-
galactosides, and 3-O-glucuronides) of the six possible flavonoid structures, according to the B-ring
substitution pattern (kaempferol, quercetin, isorhamnetin, myricetin, laricitrin, and syringetin). They are
yellow pigments classified as flavonoid phenolics located in the grape berry skins, where they are involved
in UV screening, with their biosynthesis being light-dependent. They are identified as one of the best
phenolics with antioxidant activity in wine, especially in white wines (Hermosín-Gutiérrez, Castillo-Munoz,
Gomez-Alonso & Garcia-Romero, 2011).
MATERIALS AND METHODS
Chemicals
HPLC-grade methanol, acetonitrile, and formic acid (Merck, Darmstadt, Germany) were used after filtration
through a 0.45-mm pore size membrane. Protocatechuic acid, procyanidins B1, B2, B3 and B4, resveratrol,
all of them were purchased from Extrasynthese (Genay, France). Gallic acid, caftaric acid, coutaric acid,
caffeic acid, fertaric acid, p-coumaric acid, gallocatechin, quercetin, quercetin-3-O-galactoside, quercetin-3-
O-glucoside, kaempferol-3-O-glucoside, isorhamnetin-3-O-glucoside, and (+)-catechin and (‒)-epicatechin
were purchased from Sigma Chemical Co. (St. Louis, MO, USA).
Wine samples

International Conference on
RAW MATERIALS TO PROCESSED FOODS 03-04 June 2021, Turkey
57
Wine samples analyzed in this study were supplied by wine producers, produced during 2017 and 2018
harvests from vineyards located in three Albanian geographical regions: Vlora (Vlosh cv.), Tirana and
Durrësi (Shesh i bardhë cv.). The Shesh i bardhë grape cv is widespread to hilly location across Central
Albania. Vineyards is present in hilly locations which reach up to 200 m above sea level. Durresi and Tirana
regions constitute the most intensive areas of V. vinifera cultivation, located in the Adriatic Sea coastline.
Meanwhile, Vlosh cv. is present in the Vlora region, situated in the Southwestern Albania, shoring the
Adriatic and Ionian seas. Altogether, three regions are classified as Csa according to Köppen and Geiger
climate classification system (Kottek et al., 2006). With specificities on climatic indicators among them
presented in Table 1. Vineyards’ locations of the regions: Vlora (40.49o N, 19.46o E), Tirana (41.36o N,
19.68o E), Durrësi (41.30o N, 19.50o E).
Table 1: Climatic indicators for Durrësi-Tirana regions and Vlora region (Kottek et al., 2006; DWD, 2021).
Durrësi Tirana Vlora
Annual daily average temperatures (oC) 15.9 15.2 17.0
Daily mean temperatures for January (oC) 8.1 6.7 9.5
Daily mean temperatures for Warmest month, August (oC) 23.9 24.0* 24.5
Annual average precipitation (mm) 1245 1266 995
Lowest monthly precipitation (July) (mm) 31 42 9
Highest monthly precipitations (November) (mm) 186 172 192
Sunny days (days) 284 237 245
*July is the warmest month to Tirana region.
Wine samples were taken directly from the wineries and were kept in glass bottles, dark place at 4oC before
chemical analysis.
Meteorological data comprising vine regions
According to the official EU viticulture classification (EU, 2008), Albania falls into the Climatic Zone C (the
warmest) (Figure 1), with three sub-zones C IIIB, C IIIA, and C II based on the viticulture vocation and
wine-naming for each zone (WVS, 2018).
• C IIIB European viticulture zone – covering the coastal and low-hilly western Albania. This zone rises to
400 m elevation and encompasses coastal plains. The yearlong mean temperatures are 15-16oC, the
coldest month, January (5.6-7.5oC), the hottest month July, (26.4oC), with the minimum temperature (-
5oC), and the days with frost is 5-6 days/year.
• C IIIA European viticulture zone – Hilly and pre-mountainous regions, away from the sea influence.
This zone includes areas between 400-800 m elevations and includes hilly pre-mountainous areas, far
from the sea effects. The yearlong mean temperature is 12-13oC, the coldest month, January (2-4oC), the
hottest month, July (25oC),
• C II European viticulture zone – Mountainous areas present in South to North linearity, especially the
Eastern regions of the country, with elevations over 800 m. The yearlong mean temperature (10-11oC),
the coldest month, January (0.5-2oC), and the hottest month, July, (19-20oC), the minimum temperature
(-13oC), days with frost (35-45 days/year).
The solar radiance for these regions is Vlora with 2790 hours, Durrësi with 2600 hours, belonging to the
CIIIB European Viticulture Subzone, while Tirana with 2560 hours belongs to the CIIIA European
Viticulture Subzone (WVS, 2018).
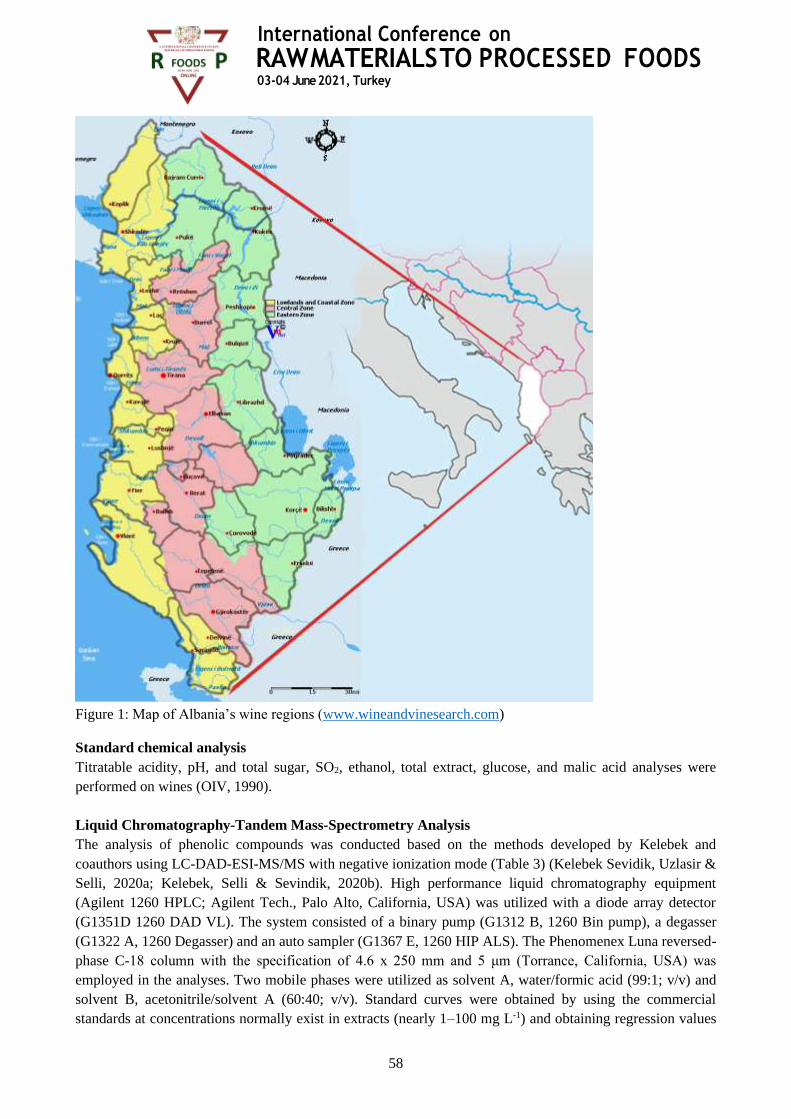
International Conference on
RAW MATERIALS TO PROCESSED FOODS 03-04 June 2021, Turkey
58
Figure 1: Map of Albania’s wine regions (www.wineandvinesearch.com)
Standard chemical analysis
Titratable acidity, pH, and total sugar, SO2, ethanol, total extract, glucose, and malic acid analyses were
performed on wines (OIV, 1990).
Liquid Chromatography-Tandem Mass-Spectrometry Analysis
The analysis of phenolic compounds was conducted based on the methods developed by Kelebek and
coauthors using LC-DAD-ESI-MS/MS with negative ionization mode (Table 3) (Kelebek Sevidik, Uzlasir &
Selli, 2020a; Kelebek, Selli & Sevindik, 2020b). High performance liquid chromatography equipment
(Agilent 1260 HPLC; Agilent Tech., Palo Alto, California, USA) was utilized with a diode array detector
(G1351D 1260 DAD VL). The system consisted of a binary pump (G1312 B, 1260 Bin pump), a degasser
(G1322 A, 1260 Degasser) and an auto sampler (G1367 E, 1260 HIP ALS). The Phenomenex Luna reversed-
phase C-18 column with the specification of 4.6 x 250 mm and 5 μm (Torrance, California, USA) was
employed in the analyses. Two mobile phases were utilized as solvent A, water/formic acid (99:1; v/v) and
solvent B, acetonitrile/solvent A (60:40; v/v). Standard curves were obtained by using the commercial
standards at concentrations normally exist in extracts (nearly 1–100 mg L-1) and obtaining regression values

International Conference on
RAW MATERIALS TO PROCESSED FOODS 03-04 June 2021, Turkey
59
(r2) greater than 0.995. In case of the reference compound absence, the calibration of similar substances was
employed by taking the molecular weight correction factor into account. The limits of quantification (LOQ)
and limits of detection (LOD) were computed by utilizing the S/N ratio values (signal to noise) of 10 and 3,
respectively.
RESULTS AND DISCUSSION
Chemical composition of wines
The chemical compositions of wines from both regions are summarized in Table 2. Titratable acidity, pH,
and sugar composition of must was in accordance with previous studies carried out on Vranac wines
(Dordevic et al, 2018). However, there were significant differences in the mean values of chemical
composition of the wines in relation to regions and years. In the literature, It was reported that in white wines
varies between 209.5 and 285.5 mg L-1, (Waterhouse, 2002), while for the red wine, the values vary between
1200 – 1800 mg L-1 (Proestos, Bakogiannis, Komaitis, 2012).
Table 2: Chemical parameters of wines produced by both grape cultivars in different years.
Type Shesh i bardhë Shesh i bardhë Vlosh
Durrësi region Tirana region Vlora region
Production year 2017 2018 2017 2018 2017 2018
Volatile acidity (gL-1) 0.33 0.21 0.50 0.42 0.40 0.52
Acidity (gL-1) 6.6 6.0 5.1 5.4 5.1 5.6
Free SO2 / total SO2 (mg L-
1) 8/36 6/33 11/40 12/38 12/40 12/45
Alcohol (% Vol) 12.10 13.20 12.90 13.02 12.00 12.20
Total sugars (G/F) (gL-1) 0.14 0.84 0.21 0.67 0.24 0.42
Total extracts (gL-1) 21 24.9 22 23.5 22.9 25.3
Specific gravity (g/ml) 0.9925 0.9926 0.9913 0.9918 0.9910 0.9915
Phenolic composition of wines
The identified compounds, depending on different families, with the information by HPLC-DAD-ESI-
MS/MS analysis: retention time, λmax in the ultraviolet region, molecular ion, main fragment ions in MS/MS
were given in Table 3. A total of 32 phenolic compounds were identified and characterized in wine samples,
including phenolic acids, hydroxybenzoic acids, flavanols, flavonols, and stilbenes. The phenolic content of
wines was presented in Table 4. When the total amount of these compounds was evaluated, it was found that
Shesh i bardhë (527.32-633.15 mg L-1) wines from the Durrësi region have a higher phenolic content
compared to the Tirana region (162.17-175.32 mg L-1). It has been also determined that Shesh i bardhë wines
have approximately 2 times higher phenolic potential than Vlosh wines.
Phenolic acids
Phenolic acids are a class of non-flavonoid phenolic compounds present in wines. Twelve phenolic acids
were detected in both wine cultivars (Table 4). As can be seen, Shesh i bardhë wines contained more
phenolic acids than Vlosh wines. The major phenolic acid in wines is gallic acid. Gallic acid is a naturally
abundant plant phenolic compound. It is present in seeds as free gallic acid and as an ester attached to
procyanidin polymers. It is also present in grape stems and may be increased by whole cluster fermentations.
Gallic acid was the most abundant phenolic acid in both Shesh i bardhë (26.60-380.16 mg L-1) and Vlosh
wines (30.70-118.15 mg L-1) (Table 4). These results are comparable with Greece red wines (10.9–46.3 mg
L-1) (Kalithraka et al., 2007), red wines from Italy (13.6–90.5 mg L-1) (Gambelli & Santaroni, 2004) and

International Conference on
RAW MATERIALS TO PROCESSED FOODS 03-04 June 2021, Turkey
60
Chianti wines from Tuscany (57.0 mg L-1) produced by Sangiovese and Trebbiano cvs. (Burns et al., 2000),
Merlot red wines (84.8 mg L-1) from Sicily (La Torre et al., 2006), Montepulciano red wine (58.3 mg L-1)
(Minussi et al., 2003), Cabernet-Sauvignon red wines (70.8 mg L-1), from Bulgaria (Burn et al., 2000),
Spanish red wine (27.2 mg L-1) produced by grape cv. Listan Negro (Rodriguez-Delgado, Gonzalez, Perez-
Trujillo & Garcia-Montelongo, 2002), Turkey red wines (30.5 mg L-1) produced by Merlot cv. (Kilinc &
Kalkan, 2003). Weidner et al. (2013) have found that V. vinifera seeds contain considerable quantities of
gallic acid in addition to other phenolic acids. These results are much higher compared with GA levels found
in Italian white wines (3.5 mg L-1) produced by Pinot Grigio cv according to Minussi et al. (2003), Spanish
white wines from Canary Islands (0.5 mg L-1), or French wines (2.0 mg L-1) from Chardonnay cv
(Rodriguez-Delgado et al., 2001).
The content of tartaric esters of hydroxycinnamic acid esters in all the white wines decreased in the
following order: trans-caftaric acid > trans-coutaric acid > trans-caffeic acid > trans-fertaric acid. The trans-
isomeric contents were found higher compared to the cis-isomers (Table 4). These trends are in accordance
with the literature (Burns et al., 2000; Pajovic-Scepanovic, Wendelin, Raicevic & Eder, 2019). trans-
Caftaric acid content in the Shesh i bardhë white wines varied between 36.44–37.98 mg L-1 and 37.19–45.79
mg L-1, from Durrësi and Tirana regions, respectively. In contrast, the trans-coutaric acid content was 7.77
mg L-1in 2017 from Durrësi region. Trans-caftaric acid levels to white wines from the Durrësi region were
higher compared to the Tirana region. The ‘trans-coutaric acid’ to ‘trans-caftaric acid’ ratio has been
proposed as a good indicator of the varietal origin of the wines (Gómez-Alonso, García-Romero, &
Hermosín-Gutiérrez, 2007). The content of trans-caffeic acid in Shesh i bardhë white wines were found in
the interval 4.89±0.08 to 7.55±0.2 mg L-1originating from the Durrësi region. Our data are comparable with
Italian white wines Greco di Tufo (Minussi et al., 2003) or French white wine Chardonnay (Teissedre &
Landrault, 2000).
Another important phenolic acid is determined in wines as protocatechuic acid. The highest level was found
in the Vlosh region’s wines (15.05±0.24 mg L-1). In contrast, the highest concentration to Shesh i bardhë
white wines belonged to the 2018 vintage from Tirana region (6.82±0.11 mg L-1), even though these levels
were comparable among Durrësi and Tirana regions. Regarding Vlosh red wines, when compared with other
publications, protocatechuic acid levels were higher compared to Italian red wines produced by
Montepulciano cv. (7.2 mg L-1) (Minussi et al. 2003), or French red wine produced by Egiadola cv. (5.0 mg
L-1) (Teissedre & Landrault, 2000), while referring to other publications, such as Italian red wine produced
by Barbera cv. (2.6 mg L-1) (Minussi et al. 2003), or red wines, from the region of Sicily Merlot cv. (3.2 mg
L-1) (La Torre et al., 2006) French red wines produced by Syrah cv (2.0 mg L-1) (Teissedre & Landrault,
2000). Protocatechuic acid levels from Shesh i bardhë white wines compared with published data results on
white wines resulted higher than French Chardonnay white wines (Teissedre & Landrault, 2000), much
higher when compared to Italian white wines produced by Greco di Tufo grape cv. (1.1 mg L-1), or Pinot
Grigio (0.1 mg L-1) (Minussi et al., 2003), as well as Spanish white wines (0.5 mg L-1) (Rodriguez-Delgado
et al., 2001).
The p-coumaric acid levels found to highest 1.29±0.02 mg L-1from both 2017 and 2018 vintages to the Shesh
i bardhë white wines from the Tirana region. The total phenolic acid content in the Shesh i bardhë white
wines studied was 106.63-109.416 mg L-1in wine samples from the Tirana region, to 465.44–576.1077 mg L-
1in wine samples from Durrësi region. Also, total phenolic acids varied from 106.63±0.17 mg L-1originating
from the Tirana region of 2017 vintage to 109.41±0.17 mg L-1from the Durrësi region of 2018 vintage.
The caffeic acid content to wines varied between 4.89-7.55 mg L-1in Shesh i bardhë wines and 6.12-10.54
mg L-1(Vlosh wines). These findings are in line with Burns et al., (2000) Italian red wines Sangiovese-
Trebbiano (5.5 mg L-1), Gambelli & Santaroni, (2004) Montepulciano-Troia red wine from Puglia region of
Italy, and Spanish Listan negro red wine (Rodriguez-Delgado, Gonzalez, Perez-Trujillo & Garcia-
Montelongo 2002). As well as lower compared to French red wine Pinot Noir from (19.1 mg L-1) (Burns et
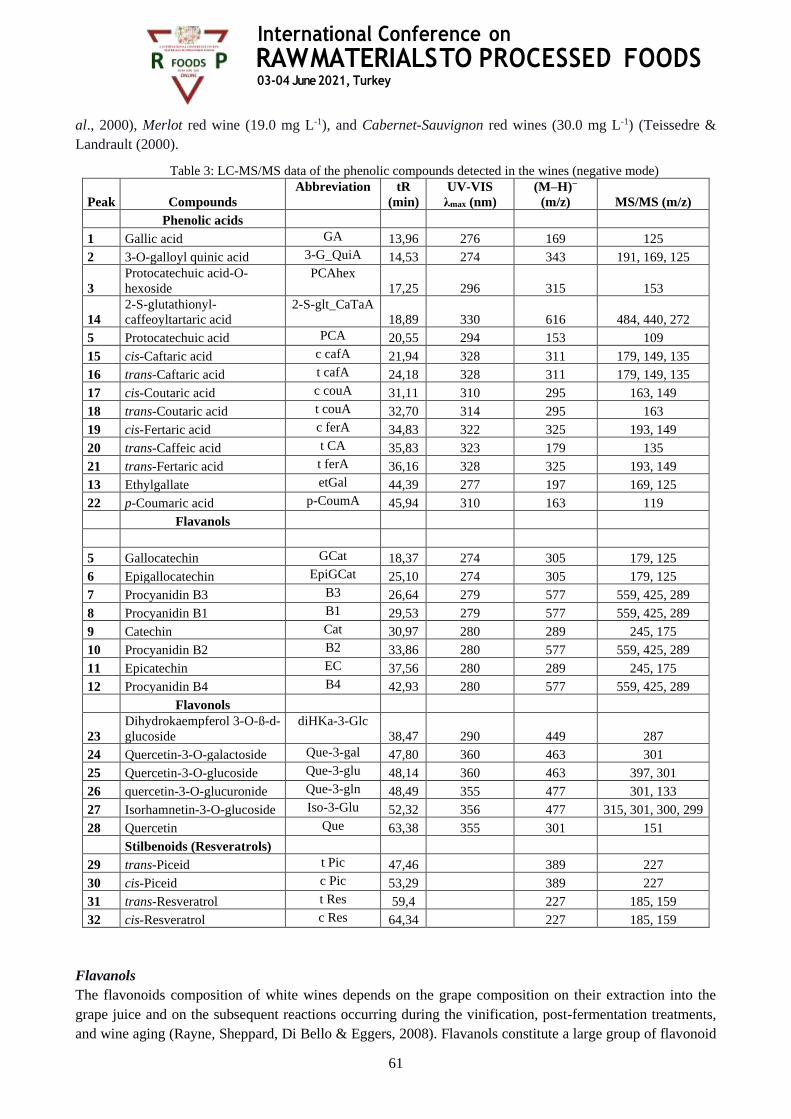
International Conference on
RAW MATERIALS TO PROCESSED FOODS 03-04 June 2021, Turkey
61
al., 2000), Merlot red wine (19.0 mg L-1), and Cabernet-Sauvignon red wines (30.0 mg L-1) (Teissedre &
Landrault (2000).
Table 3: LC-MS/MS data of the phenolic compounds detected in the wines (negative mode)
Peak Compounds
Abbreviation tR
(min)
UV-VIS
λmax (nm)
(M–H)−
(m/z) MS/MS (m/z)
Phenolic acids
1 Gallic acid GA 13,96 276 169 125
2 3-O-galloyl quinic acid 3-G_QuiA 14,53 274 343 191, 169, 125
3
Protocatechuic acid-O-
hexoside
PCAhex
17,25 296 315 153
14
2-S-glutathionyl-
caffeoyltartaric acid
2-S-glt_CaTaA
18,89 330 616 484, 440, 272
5 Protocatechuic acid PCA 20,55 294 153 109
15 cis-Caftaric acid c cafA 21,94 328 311 179, 149, 135
16 trans-Caftaric acid t cafA 24,18 328 311 179, 149, 135
17 cis-Coutaric acid c couA 31,11 310 295 163, 149
18 trans-Coutaric acid t couA 32,70 314 295 163
19 cis-Fertaric acid c ferA 34,83 322 325 193, 149
20 trans-Caffeic acid t CA 35,83 323 179 135
21 trans-Fertaric acid t ferA 36,16 328 325 193, 149
13 Ethylgallate etGal 44,39 277 197 169, 125
22 p-Coumaric acid p-CoumA 45,94 310 163 119
Flavanols
5 Gallocatechin GCat 18,37 274 305 179, 125
6 Epigallocatechin EpiGCat 25,10 274 305 179, 125
7 Procyanidin B3 B3 26,64 279 577 559, 425, 289
8 Procyanidin B1 B1 29,53 279 577 559, 425, 289
9 Catechin Cat 30,97 280 289 245, 175
10 Procyanidin B2 B2 33,86 280 577 559, 425, 289
11 Epicatechin EC 37,56 280 289 245, 175
12 Procyanidin B4 B4 42,93 280 577 559, 425, 289
Flavonols
23
Dihydrokaempferol 3-O-ß-d-
glucoside
diHKa-3-Glc
38,47 290 449 287
24 Quercetin-3-O-galactoside Que-3-gal 47,80 360 463 301
25 Quercetin-3-O-glucoside Que-3-glu 48,14 360 463 397, 301
26 quercetin-3-O-glucuronide Que-3-gln 48,49 355 477 301, 133
27 Isorhamnetin-3-O-glucoside Iso-3-Glu 52,32 356 477 315, 301, 300, 299
28 Quercetin Que 63,38 355 301 151
Stilbenoids (Resveratrols)
29 trans-Piceid t Pic 47,46 389 227
30 cis-Piceid c Pic 53,29 389 227
31 trans-Resveratrol t Res 59,4 227 185, 159
32 cis-Resveratrol c Res 64,34 227 185, 159
Flavanols
The flavonoids composition of white wines depends on the grape composition on their extraction into the
grape juice and on the subsequent reactions occurring during the vinification, post-fermentation treatments,
and wine aging (Rayne, Sheppard, Di Bello & Eggers, 2008). Flavanols constitute a large group of flavonoid

International Conference on
RAW MATERIALS TO PROCESSED FOODS 03-04 June 2021, Turkey
62
compounds, while quantitatively, they are the most abundant secondary metabolites of grape berries. This
group is comprised not only by monomers but also oligomers and polymers, extracted during winemaking,
like condensed tannins or proanthocyanidins (PAs), being a major qualitative factor in red wines because of
their implication in color stability, astringency, and bitterness (Huang, Cheynier & Terrier, 2008).
Nine flavanols; 3-O-galloyl quinic acid, gallocatechin, epigallocatechin, procyanidin B3, procyanidin B1,
catechin, procyanidin B2, epicatechin, procyanidin B4. As shown in Table 4, wines obtained from the
Durrësi region contained more flavanols than wines obtained from the Tiran region. Moreover, their
concentrations were higher for the 2017 vintage in the region than in the 2018 vintage. Among the flavanols,
3-O-galloyl quinic acid was the most abundant in wines. 3-O-galloyl quinic acid in Shesh i bardhë white
wines found 54.17±0.85 mg L-1and 37.18±0.59 mg L-1for 2017 and 2018 vintage, respectively, from the
Durrësi region. These levels resulted in much lower in white wine samples from the Tirana region for both
the 2017 and 2018 vintage (Table 4). Meanwhile, other gallotannins like gallocatechin, epigallocatechin was
found in lower levels. So, gallocatechin levels to the Durrësi region resulted in the interval 2.77-4.00 mg L-1,
while from the Tirana region, these levels resulted in the interval 1.92-2.64 mg L-1. Epigallocatechin levels in
wine samples from the Durrësi region belonged to the interval 1.89-3.92 mg L-1, while these values resulted
in lower wine samples from the Tirana region (0.58-1.79 mg L-1). Comparison among gallotannins in Vlosh
red wines found that the highest content belonged to 3-O-galloyl quinic acid 6.46±0.10 mg L-1to 9.13±0.14
mg L-1for 2017 and 2018 vintage, respectively (Table 4). Gallocatechin was found in lower levels, 5.02±0.08
mg L-1in 2017 vintage and 5.79±0.09 mg L-1in 2018 vintage. Epigallocatechin levels resulted in much lower
levels. On Vlosh red wine, these results were found lower compared to red wines (2.8 mg L-1) from Spain (de
Pascual-Teresa et al., 2000). Ethyl gallate levels resulted in wide range values on white wines Shesh i bardhë
(3.89±0.06 and 72.37±1.14 mg L-1) including two regions, while in Vlosh red wine, these values were found
in the interval 3.70±0.06 to 28.34±0.45 mg L-1.
Catechin and epicatechin, two low molecular weight flavanols, were found in all the studied wine samples.
The overall catechin levels were found higher compared to the epicatechin in all white and red wines. Their
levels in Shesh i bardhë white wines from Durrësi region (8.75±0.14 mg L-1) from 2017 vintage and
15.34±0.59 mg L-1for 2018 vintage, was lower compared to Tirana region, 16.79±0.26 mg L-1and 17.48±0.28
mg L-1for 2017 and 2018 vintage, respectively (Table 4). Our results show that catechin levels are higher
than Italian Pinot Grigio (0.6 mg L-1) and Greco di Tufo cv. (4.9 mg L-1) white wines (Minussi et al., 2003),
Spanish white wines (1.0 mg L-1) (de Pascual-Teresa et al., 2000). Meanwhile, they were found lower than
French white wines (28.3 mg L-1) (Vitrac et al., 2002). The crucial role of catechin in red wines astringency
and bitterness has been widely described (Kelebek, Canbas, Jourdes & Teissedre, 2010).
Epicatechin levels, the second flavanol, in Shesh i bardhë wines originating from Durrësi region, were found
in 1.48±0.02 mg L-1and 3.06±0.05 mg L-1for 2017 and 2018 vintage, respectively, compared to white wines
from Tirana region, 3.35±0.05 mg L-1and 3.89±0.06 mg L-1for 2017 and 2018 vintage, respectively,
indicating not a significant difference among two regions. Compared to reported data, the epicatechin
concentrations are higher than reported Italian white wines Pinot Grigio cv. (0.3 mg L-1), and Greco di Tufo
cv (2.8 mg L-1) according to Minussi et al. (2003), or French white wines ranging from 0.7-1.2 mg L-1(Arts
et al., 2000), but in lower contents in French white wines (33.8 mg L-1) according to Vitrac et al. (2002).
The catechin levels in Vlosh red wines was found at 11.79±0.19 mg L-1and 13.79±0.22 mg L-1 for the 2017
and 2018 vintage, respectively (Table 4). Meanwhile, the epicatechin concentrations were 3.82±0.06 mg L-
1and 4.63±0.07 mg L-1for the 2017 and 2018 vintage, respectively. Our results, regarding the catechin levels,
are in line with those on Italian red wines (3.5-5.00 mg L-1) published by Goldberg et al. (1995), but lower to
other red wines from Spain (17.8 mg L-1) (de Pascual-Teresa et al., 2000), Italian Montepulciano red wine
(14.0 mg L-1) (Minussi et al. (2003), and French Cabernet-Sauvignon red wine Teissedre & Landrault

International Conference on
RAW MATERIALS TO PROCESSED FOODS 03-04 June 2021, Turkey
63
(2000). Compared to published data, the epicatechin levels resulted lower than French red wines (32.9 mg L-
1) (Vitrac et al., 2002), Spanish red wines 9.2-14.8 mg L-1 (Rodriguez-Delgado, Gonzalez, Perez-Trujillo &
Garcia-Montelongo, 2002), or Italian wines 32.3-69.2 mg L-1 (La Torre et al., 2006).
Table 4: Phenolic compounds in Shesh i bardhë white wine and Vlosh red wine according to regions
and the production’ year (mg L-1)
Shesh i bardhë Vlosh
Durrësi region Tirana region Vlora region
Peak Phenolic acids 2017 2018 2017 2018 2017 2018
1 Gallic acid 380.16±5.99 291.14±4.59 27.50±0.43 26.60±0.42 30.71±0.48 118.15±1.86
2 3-O-galloyl quinic acid 54.17±0.85 37.18±0.59 8.86±0.14 11.16±0.18 6.46±0.10 9.13±0.14
3
Protocatechuic acid-O-
hexoside 4.27±0.07 3.93±0.06 1.64±0.03 0.99±0.02 7.11±0.11 7.76±0.12
14
2-S-glutathionyl-
caffeoyltartaric acid 3.24±0.05 4.96±0.08 2.96±0.05 3.12±0.05 0.63±0.01 0.77±0.01
5 Protocatechuic acid 4.15±0.07 8.81±0.14 5.87±0.09 6.82±0.11 6.99±0.11 15.05±0.24
15 cis-Caftaric acid 0.79±0.01 1.84±0.03 1.40±0.02 1.48±0.02 3.50±0.06 2.65±0.04
16 trans-Caftaric acid 37.98±0.60 45.79±0.72 36.44±0.57 37.19±0.59 98.97±1.56 100.79±1.59
17 cis-Coutaric acid 1.72±0.03 2.89±0.05 2.10±0.03 2.08±0.03 4.19±0.07 4.48±0.07
18 trans-Coutaric acid 7.77±0.12 5.43±0.09 6.16±0.10 6.13±0.10 10.27±0.16 13.36±0.21
19 cis-Fertaric acid 0.45±0.01 0.24±0.00 0.18±0.00 0.18±0.00 0.19±0.00 0.34±0.01
20 trans-Caffeic acid 4.89±0.08 7.55±0.12 5.60±0.09 5.61±0.09 6.12±0.10 10.54±0.17
21 trans-Fertaric acid 3.00±0.05 3.85±0.06 2.89±0.05 2.86±0.05 3.12±0.05 5.37±0.08
13 Ethylgallate 72.37±1.14 50.61±0.80 3.73±0.06 3.89±0.06 3.70±0.06 28.34±0.45
22 p-Coumaric acid 1.15±0.02 1.22±0.02 1.29±0.02 1.29±0.02 1.03±0.02 2.05±0.03
Total Phenolic acids 576.10±1.58 465.44±1.20 106.63±0.17 109.41±0.17 182.98±0.41 318.76±0.59
Flavanols
4 Gallocatechin 4.00±0.06 2.77±0.04 1.92±0.03 2.64±0.04 5.02±0.08 5.79±0.09
6 Epigallocatechin 3.92±0.06 1.89±0.03 0.58±0.01 1.79±0.03 0.51±0.01 0.10±0.00
7 Procyanidin B3 15.75±0.25 17.00±0.27 15.30±0.24 15.75±0.25 30.76±0.48 28.03±0.44
8 Procyanidin B1 10.98±0.17 13.17±0.21 10.93±0.17 10.98±0.17 20.92±0.33 17.80±0.28
9 Catechin 8.75±0.14 15.34±0.24 16.79±0.26 17.48±0.28 11.79±0.19 13.79±0.22
10 Procyanidin B2 4.50±0.07 1.40±0.02 2.12±0.03 4.50±0.07 3.84±0.06 5.17±0.08
11 Epicatechin 1.48±0.02 3.06±0.05 3.35±0.05 3.89±0.06 3.82±0.06 4.63±0.07
12 Procyanidin B4 5.25±0.08 3.48±0.05 0.87±0.01 5.25±0.08 1.80±0.03 1.34±0.02
Total flavanols 54.63±0.07 58.12±0.10 51.86±0.11 62.28±0.10 78.46±0.17 76.64±0.15
Flavonols
23
Dihydrokaempferol 3-O-
ß-d-glucoside 1.60±0.03 1.84±0.03 2.35±0.04 2.29±0.04 6.16±0.10 2.98±0.05
24
Quercetin-3-O-
galactoside 0.02±0.00 0.01±0.00 0.03±0.00 0.01±0.00 2.19±0.03 2.35±0.04
25 Quercetin-3-O-glucoside 0.06±0.00 0.21±0.00 0.08±0.00 0.08±0.00 7.47±0.12 8.97±0.14
26
Quercetin-3-O-
glucuronide 0.56±0.01 1.30±0.02 0.73±0.01 0.72±0.01 7.76±0.12 13.96±0.22
27
Isorhamnetin-3-O-
glucoside 0.14±0.00 0.10±0.00 0.08±0.00 0.13±0.00 0.98±0.02 1.91±0.03
28 Quercetin 0.01±0.00 0.03±0.00 0.04±0.00 0.03±0.00 7.59±0.12 5.27±0.08
Total Flavonols 2.39±0.04 3.49±0.06 3.32±0.05 3.25±0.05 32.15±0.51 35.43±0.56
Stilbenoids
(Resveratrols)
29 trans-Piceid 0.01±0.00 0.07±0.00 0.11±0.00 0.03±0.00 0.23±0.00 0.45±0.01
30 cis-Piceid 0.01±0.00 0.13±0.00 0.04±0.00 0.13±0.00 0.13±0.00 0.40±0.01
31 trans-Resveratrol 0.00±0.00 0.05±0.00 0.14±0.00 0.14±0.00 0.19±0.00 0.36±0.01
32 cis-Resveratrol 0.00±0.00 0.02±0.00 0.07±0.00 0.08±0.00 0.14±0.00 0.05±0.00
Total Resveratrols 0.03±0.00 0.27±0.00 0.37±0.01 0.38±0.01 0.68±0.01 1.26±0.02
TOTAL PHENOLICS 633.15±9.98 527.32±8.31 175.32±2.76 162.17±2.56 294.28±4.64 432.09±6.81
International Conference on
RAW MATERIALS TO PROCESSED FOODS 03-04 June 2021, Turkey
64
Four procyanidins B1, B2, B3, and B4, were analyzed in both white and red wine samples. Also, for Shesh i
bardhë white wines, these contents decreased in the following order Procyanidin B3 > Procyanidin B1 >
Procyanidin B4 > Procyanidin B2; while their order for Vlosh red wine Procyanidin B3 > Procyanidin B1 >
Procyanidin B2 > Procyanidin B4, changed among Procyanidin B4 and Procyanidin B2. The most abundant
from procyanidin dimers, Procyanidin B3, resulted in all Shesh i bardhë white wines, despite the vintage and
the region origin, 15.30±0.24 mg L-1to 17.00±0.27 mg L-1, with the maximum levels to wines samples
belonging to 2018, vintage from Durrësi region.
Procyanidin B3 levels in Shesh i bardhë white wines were much higher than French Chardonnay white wine
(0.2 mg L-1) (Tessedre & Laundrault, 2000). Similarly, the concentration of the procyanidins B1 in Shesh i
bardhë white wines were found in the interval 10.93±0.17 mg L-1to 13.17±0.21 mg L-1, with the maximum
amount in white wines from Durrësi region. These amounts were found much higher than that on Spanish
white wines, 0.3 mg L-1(de Pascual-Teresa et al., 2000). The Procyanidin B2 and B4 were found in much
lower concentrations in both Shesh i bardhë white wine and Vlosh red wines.
Procyanidin B2 levels on Shesh i bardhë white wines were found in higher levels than other publications on
French white wines, 0.3 mg L-1(Tessedre & Laundrault, 2000), or Spanish white wines, 0.1 mg L-1(de
Pascual-Teresa et al., 2000). Procyanidin B4 levels on Shesh i bardhë wine were higher than that published
by Teissedre & Landrault (2000) and de Pascual-Teresa et al. (2000).
Procyanidin B3 in Vlosh red wines was found in 28.03±0.44 mg L-1to 30.76±0.48 mg L-1, with the maximum
belonging to the 2018 vintage. Procyanidin B3 was found in similar levels to French red wines, Merlot (25.0
mg L-1) and Syrah (25.0 mg L-1) (Teissedre & Landrault, 2000), while in lower levels, compared to other red
wines such as French Cabernet-Sauvignon (44.0 mg L-1) and Grenache, 80.0 mg L-1(Tessedre & Laundrault,
2000). The concentration of the procyanidins B1 was found in 17.80±0.28 mg L-1to 20.92±0.33 mg L-1from
the 2017 and 2018 vintage, respectively (Table 4). Compared with that of French Merlot (50.0 mg L-1), and
Cabernet-Sauvignon (99.0 mg-1) red wines, according to Teissedre & Landrault (2000), as well as Italian
Merlot red wines (La Torre et al., 2006).
Procyanidin B2 levels on Vlosh red wine were similar to that published by de Pascual-Teresa et al. (2000),
while in much lower levels compared with results published by Tessedre & Landrault (2000) such as French
red wine Merlot (447.0 mg L-1), Cabernet-Sauvignon (53.0 mg L-1), Syrah (90.0 mg L-1), or Italian Merlot
(42.4 mg L-1) red wines.
Procyanidin B4 levels on Vlosh red wine much lower with data published by Teissedre & Landrault, 2000)
on French red wine Merlot (45.0 mg L-1), Cabernet-Sauvignon (53.0 mg L-1), or Syrah (20.0 mg L-1).
The maximum levels on the total HBA and flavonols to Shesh i bardhë white wines from the Durrësi region
resulted in 569.74 ±8.98 mg L-1from 2018 vintage; meanwhile, the total HBA and flavonols levels from the
Tirana region was 111.73 ±1.76 mg L-1belonging to 2017 vintage years.
The maximum levels on the total HBA and flavonols to the Vlosh red wine resulted in 255.05± 4.02 mg L-
1from the 2018 vintage.
Comparison among gallotannins found that the highest content belonged to 3-O-galloyl quinic acid in Shesh i
bardhë white wines found 54.17±0.85 mg L-1and 37.18±0.59 mg L-1for 2017 and 2018 vintage, respectively,
from Durrësi region. These levels resulted in much lower in white wine samples from the Tirana region, for
both 2017 and 2018 vintage (Table 4). Meanwhile, other gallotannins like gallocatechin, epigallocatechin
were found in lower levels. So, gallocatechin levels to the Durrësi region resulted in the interval 2.77-4.00
mg L-1, while from the Tirana region, these levels resulted in the interval 1.92-2.64 mg L-1. Epigallocatechin

International Conference on
RAW MATERIALS TO PROCESSED FOODS 03-04 June 2021, Turkey
65
levels in wine samples from the Durrësi region belonged to the interval 1.89-3.92 mg L-1, while these values
resulted in lower in wine samples from the Tirana region (0.58-1.79 mg L-1). Comparison among
gallotannins in Vlosh red wines found that the highest content belonged to 3-O-galloyl quinic acid 6.46±0.10
mg L-1to 9.13±0.14 mg L-1for 2017 and 2018 vintage, respectively (Table 4). Gallocatechin was found in
lower levels, 5.02±0.08 mg L-1for 2017 vintage, and 5.79±0.09 mg L-1to 2018 vintage. Epigallocatechin
levels resulted in much lower levels. These results, on Vlosh red wine, were found lower compared to red
wines (2.8 mg L-1) from Spain (de Pascual-Teresa et al., 2000). Ethylgallate levels resulted in wide range
values on white wines Shesh i bardhë (3.89±0.06 mg L-1and 72.37±1.14 mg L-1) including two regions, while
in Vlosh red wine, these values were found in the interval 3.70±0.06 mg L-1to 28.34±0.45 mg L-1.
Catechin ([M−H]−, m/z 289) and epicatechin ([M−H]−, m/z 289), two low molecular weight flavanols were
found present in all the studied wine samples. The overall catechin levels were found higher compared to the
epicatechin, in all white and red wines. The catechin levels in Shesh i bardhë white wines from Durrësi
region (8.75±0.14 mg L-1) from 2017 vintage and 15.34±0.59 mg L-1 for 2018 vintage, was lower compared
to Tirana region, 16.79±0.26 mg L-1and 17.48±0.28 mg L-1 for 2017 and 2018 vintage, respectively (Table 4).
Our results show that catechin levels are higher compared to Italian Pinot Grigio (0.6 mg L-1) and Greco di
Tufo cv. (4.9 mg L-1) white wines (Minussi et al., 2003), Spanish white wines (1.0 mg L-1) (de Pascual-
Teresa et al., 2000). Meanwhile they were found lower compared to French white wines (28.3 mg L-1)
(Vitrac et al., 2002). The crucial role of catechin in red wines astringency and bitterness has been widely
described (Kelebek, Canbas, Jourdes & Teissedre, 2010).
Epicatechin levels, the second flavanol, in Shesh i bardhë wines originating from Durrësi region, were found
in 1.48±0.02 mg L-1 and 3.06±0.05 mg L-1 for 2017 and 2018 vintage, respectively, compared to white wines
from Tirana region, 3.35±0.05 mg L-1 and 3.89±0.06 mg L-1 for 2017 and 2018 vintage, respectively,
indicating not a significant difference among two regions. Compared to reported data, the epicatechin
concentrations are higher than reported Italian white wines Pinot Grigio cv. (0.3 mg L-1), and Greco di Tufo
cv (2.8 mg L-1) according to Minussi et al. (2003), or French white wines ranging from 0.7-1.2 mg L-1(Arts
et al., 2000), but in lower contents in French white wines (33.8 mg L-1) according to Vitrac et al. (2002).
The catechin levels in Vlosh red wines was found at 11.79±0.19 and 13.79±0.22 mg L-1 for the 2017 and
2018 vintage, respectively (Table 4). Meanwhile, the epicatechin concentrations were 3.82±0.06 mg L-1 and
4.63±0.07 mg L-1 for the 2017 and 2018 vintage, respectively. Our results, regarding the catechin levels, are
in line with those on Italian red wines (3.5-5.00 mg L-1) published from Goldberg et al. (1995), but lower to
other red wines from Spain (17.8 mg L-1) (de Pascual-Teresa et al., 2000), Italian Montepulciano red wine
(14.0 mg L-1) (Minussi et al. (2003), and French Cabernet-Sauvignon red wine Teissedre & Landrault
(2000). Compared to published data, the epicatechin levels resulted in lower than French red wines (32.9 mg
L-1) (Vitrac et al., 2002), Spanish red wines 9.2-14.8 mg L-1 (Rodriguez-Delgado, Gonzalez, Perez-Trujillo &
Garcia-Montelongo, 2002), or Italian wines 32.3-69.2 mg L-1 (La Torre et al., 2006).
Four procyanidins B1, B2, B3, and B4, were analyzed in both white and red wine samples. Also, for Shesh i
bardhë white wines, these contents decreased in the following order Procyanidin B3 > Procyanidin B1 >
Procyanidin B4 > Procyanidin B2; while their order for Vlosh red wine Procyanidin B3 > Procyanidin B1 >
Procyanidin B2 > Procyanidin B4, changed among Procyanidin B4 and Procyanidin B2. The most abundant
from procyanidin dimers, Procyanidin B3, resulted in all Shesh i bardhë white wines, despite the vintage and
the region origin, 15.30±0.24 mg L-1to 17.00±0.27 mg L-1, with the maximum levels to wines samples
belonging to 2018, vintage from Durrësi region.
Procyanidin B3 levels in Shesh i bardhë white wines were much higher compared to French Chardonnay
white wine (0.2 mg L-1) (Tessedre & Laundrault, 2000).

International Conference on
RAW MATERIALS TO PROCESSED FOODS 03-04 June 2021, Turkey
66
Similarly, the concentration of the procyanidins B1 in Shesh i bardhë white wines were found in the interval
10.93±0.17 mg L-1to 13.17±0.21 mg L-1, with the maximum amount in white wines from Durrësi region.
These amounts were found much higher compared with that on Spanish white wines, 0.3 mg L-1 (de Pascual-
Teresa et al., 2000).
The procyanidin B2 and B4 were found in much lower concentrations in both Shesh i bardhë white wine and
Vlosh red wines.
Procyanidin B2 levels on Shesh i bardhë white wines were found in higher levels compared with other
publications on French white wines, 0.3 mg L-1 (Tessedre & Laundrault, 2000), or Spanish white wines, 0.1
mg L-1 (de Pascual-Teresa et al., 2000). Procyanidin B4 levels on Shesh i bardhë wine was higher with that
published by Teissedre & Landrault (2000) and de Pascual-Teresa et al., (2000).
Procyanidin B3 in Vlosh red wines was found in 28.03±0.44 mg L-1to 30.76±0.48 mg L-1, with the maximum
belonging to the 2018 vintage. Procyanidin B3 was found in similar levels to French red wines, Merlot (25.0
mg L-1) and Syrah (25.0 mg L-1) (Teissedre & Landrault, 2000), while in lower levels, compared to other red
wines such as French Cabernet-Sauvignon (44.0 mg L-1) and Grenache, 80.0 mg L-1 (Tessedre & Laundrault,
2000). The concentration of the procyanidins B1 was found in 17.80±0.28 mg L-1 to 20.92±0.33 mg L-1 from
the 2017 and 2018 vintage, respectively (Table 4). Compared with that of French Merlot (50.0 mg L-1), and
Cabernet-Sauvignon (99.0 mg L-1) red wines, according to Teissedre & Landrault (2000), as well as Italian
Merlot red wines (La Torre et al., 2006).
Procyanidin B2 levels on Vlosh red wine were similar with that published by de Pascual-Teresa et al. (2000),
while in much lower levels compared with results published by Tessedre & Landrault (2000) such as French
red wine Merlot (447.0 mg L-1), Cabernet-Sauvignon (53.0 mg L-1), Syrah (90.0 mg L-1), or Italian Merlot
(42.4 mg L-1) red wines.
Procyanidin B4 levels on Vlosh red wine much lower with data published by Teissedre & Landrault, 2000)
on French red wine Merlot (45.0 mg L-1), Cabernet-Sauvignon (53.0 mg L-1) or Syrah (20.0 mg L-1).
The maximum levels on the total HBA and flavonols to Shesh i bardhë white wines from the Durrësi region
resulted in 569.74 ±8.98 mg L-1from 2018 vintage, meanwhile, the total HBA and flavonols levels from the
Tirana region, was 111.73 ±1.76 mg L-1belonging to 2017 vintage years.
The maximum levels on the total HBA and flavonols to the Vlosh red wine resulted in 255.05± 4.02 mg L-1,
from the 2018 vintage.
Flavonols
Flavonols are yellow pigments that contribute directly to the color of white wines, while their presence in red
wines is masked by anthocyanins, the red pigments (Castillo-Munoz, Gómez-Alonso, García-Romero, &
Hermosín-Gutiérrez, 2007). Regarding the group of flavonols, quercetin derivatives are the main components
present in the white wines (De Beer, Joubert, Gelderblom & Manley, 2005).
Flavonol profiles consist of a mixture of flavonol 3-O-glycosides and free flavonol aglycones released from
their 3-O-glycosides hydrolysis compared with those of their grapes (Hermosín-Gutiérrez, Castillo-Munoz,
Gomez-Alonso & Garcia-Romero, 2011). Six flavonols were detected in both analyzed wine samples:
dihydrokaempferol 3-O-b-D-glucoside, quercetin-3-O-glucuronide, quercetin-3-O-galactoside, quercetin-3-
O-glucoside, isorhamnetin-3-O-glucoside, and quercetin. In Shesh i bardhë wines, the highest concentration
was dihydrokaempferol 3-O- -D-glucoside ([M−H]−, m/z 449) originating in the Tirana region, 2.35±0.04
mg L-1 and 2.29±0.04 mg L-1in 2017 and 2018 vintages, respectively. Quercetin-3-O-glucuronide ([M−H]−
International Conference on
RAW MATERIALS TO PROCESSED FOODS 03-04 June 2021, Turkey
67
detected at m/z 477) was the second flavonols found in the highest concentrations with the highest
concentration (1.30±0.02 mg L-1) belonging to white wine samples from the 2018 vintage originating from
the Durrësi region. Quercetin ([M−H]− detected at m/z 301) was found in trace amount in the interval 0.01-
0.04 mg L-1. This finding is consistent with Ragusa et al. (2017) that have presented a study on Italian wines
from the Apulia region. The total flavonols content resulted in similar range with wine samples originating
from both regions, with the highest level belonged to the Durrësi region, 3.49±0.06 mg L-1 to 2018 vintage.
Similar levels to Shesh i bardhë white wine from the Tirana region, 3.25 ±0.05 to 3.32 ±0.05 mg L-1, were
detected in 2017 and 2018 vintage years, respectively.
Total flavonols were found in the interval 32.15±0.51 mg L-1 to 34.43±0.56 mg L-1 from the 2017 and 2018
vintage of Vlosh wines. Quercetin levels in Vlosh red wine resulted in line with data presenting Bulgarian red
wines Merlot (7.7 mg L-1), Cabernet Sauvignon (7.3 mg L-1) (Tsanova-Savova & Ribarova, 2002), Spanish
Tempranillo red wine (Burns et al., 2000), French red wine (5.8 mg L-1) and Spanish Cabernet Sauvignon
(6.3 mg L-1) McDonald et al. (1998). Meanwhile, these data resulted lower compared to Montepulciano red
wine from the Molise region, Italy (11.6 mg L-1) (Gambelli & Santaroni, 2004), as well as Sangiovese and
Trebbiano cv. (17.5 mg L-1) (Burns et al., 2000) Pinot noir from France (12.5 mg L-1) (Burns et al., 2000).
Among flavonols, both white wines (Shesh i bardhë) and red wine (Vlosh) contained only the quercetin
aglycone. In contrast, kaempferol, isorhamnetin as well as quercetin was detected in their glycosidic units, as
isorhamnetin-3-O-hexoside ([M−H]− detected at m/z 477) and quercetin-3-O-glucuronide ([M−H]− detected
at m/z 477). The concentrations of berry flavonols in the resulting wines depend on the grape variety,
cultural practices, and environmental factors (Mattivi et al., 2006). Partial hydrolysis reactions decrease
concentrations of derived 3-O-glycosides in favor of the corresponding aglycones during the storage of the
wine (Castillo-Muñoz et al., 2007). These results are consistent with the literature (Budic-Leto et al., 2017).
The total flavonols resulted in 32.15 ±0.51 mg L-1 and 35.43± 0.56 mg L-1 in the 2017 and 2018 vintage
years.
Stilbenoids
The main stilbenes found in grapes are trans-resveratrol and cis-resveratrol (3,5,4’-trihydroxystilbene)
together with two resveratrol glucosides, cis-piceid, and trans-piceid (Flamini & De Rosso, 2018). Analysis
of Vlosh red wine samples presented trans-resveratrol glucosides as the dominant forms of stilbenes for all
the studied wines in both vintages, as confirmed by literature (Kostandinovic et al., 2012; Ragusa et al.,
2017). Trans-piceid (m/z 389) content was found 0.23 mg L-1 and 0.45 mg L-1 for the 2017 and 2018 vintage,
respectively. The second most abundant stilbenes were the cis-piceid (m/z 389), 0.13 mg L-1, and 0.40 mg L-1
in 2017 and 2018 vintages, respectively. Trans-resveratrol (m/z 227) was found 0.19 mg L-1 to 0.36±0.01 mg
L-1 in 2017and 2018 vintage, respectively.
The total resveratrol content was found 0.68 ±0.01 mg L-1 and 1.26± 0.02 mg L-1 in the 2017 and 2018
vintage years, respectively. These results were in line with those presented in Montenegrin Vranac wines,
1.00- 5.70 mg L-1 (Pajovic-Stepanovic, Wendelin, Raicevic & Eder 2019), Greek red wines 0.0–9.72 mg L-1
(Kallitraka, Mamalos & Makris, 2007) and Spanish red wines ranging between and 0.4–5.2 mg L-1,
(Monagas, Suarez, Gomez-Cordoves & Bartolome, 2005). In red wine, the concentrations of the trans-
isomer, which is the dominant form, generally range between 0.10 and 15 mg L–1 (Rosario-Bronze, Duarte &
Matias, 2012). The levels of trans-resveratrol in Vlosh red wine were found in lower levels compared to
Italian red wines (3 mg L-1) from the Apulia region (Ragusa et al. 2017), or trans-resveratrol in red wines
from Serbia (0.11 to 1.69 mg L-1). Vranac red wine, the maximum value of 0.84 mg L-1; from Pino noir red
wines, with trans-resveratrol levels, found 1.31 mg L-1 (Dekic et al., 2008), or North Macedonia red wines
with higher concentrations of trans-piceid (4.65 ± 0.46 mg L-1), trans-resveratrol 1.49 ± 0.06 mg L-1
International Conference on
RAW MATERIALS TO PROCESSED FOODS 03-04 June 2021, Turkey
68
produced by Merlot cv, while the trans-piceid 2.24 ± 0.08 mg L-1from Vranac cv. (Kostandinovic et al.,
2012).
Shesh i bardhë wine samples revealed the presence of four stilbenes, cis- and trans-resveratrol, and their
glucosides, cis- and trans-piceid. The trans-resveratrol was the most abundant (0.14 mg L-1) among stilbenes
from the 2017 vintage, belonging to the Tirana region. The cis-piceid resulted in 0.13±0.00 mg L-1. The total
resveratrol content varied between 0.03 - 0.27 mg L-1 from the Durrësi region, while 0.37 - 0.38 ±0.01 mg L-1
to 2017, from the Tirana region, by concluding that white wines from Tirana region resulted in a higher
content of stilbenes. Trans-resveratrol content is similar to white wines, 0.005-0.57 mg L-1, from Greece
(Gerogiannaki-Christopoulou, Athanasopoulos, Kyriakidis & Spanos, 2006), Italian white wines (0.1-0.3 mg
L-1) from the Apulia region (Ragusa et al. 2017), white wines from Serbia with a range from 0.11 to 0.34 mg
L-1, (Cvejic et al., 2010), and Montenegrin wines with trans-resveratrol glucosides varied 0.06-0.21 mg L-1
(Pajovic-Stepanovic, Wendelin, Raicevic & Eder, 2019).
CONCLUSION
This study presents information on the phenolics composition from wines produced by two grape cvs. Shesh
i bardhë and Vlosh. Information about the characteristics of red and white wines from Albania may help
national authorities to control wine authenticity, as well as to develop PDO protection certifications intended
by the wine sector. The results obtained from the 2017 and 2018 vintage suggest that white wines produced
from grape cv. Shesh i bardhë, show high content of flavanols, flavonols, phenolic acid and stilbenes in
samples from Durrësi terroir, up to 633.15 mg L-1, compared to Tirana terroir, up to 175.32 mg L-1. Also,
dihydrokaempferol-3-O-b-D-glucoside was the most abundant flavonol, procyanidin B3 was the most
abundant flavanol, trans-caftaric acid was the most dominant phenolic acid, and trans-resveratrol among
stilbenes, in Shesh i bardhë white wines. The total phenolics to Vlosh red wine resulted from 294.28 ±4.64
mg L-1 to 432.09 mg L-1 of two vintage years, 2017 and 2018. In Vlosh red wines, quercetin-3-O-D-glucoside
was the most abundant flavonol; the most abundant flavanol was found Procyanidin B3; trans-caftaric acid
was the most abundant phenolic acid, and trans-piceid among stilbenes. Studying wines fermented by local
grape cultivars will contribute to the global wines database and increase the perspective of local viticulture in
Albania.
REFERENCES
1) Budic-Leto, I., Zdunic, G., Gajdos-Kljusuric, J., Mucalo, A., & Vrhovsek, U. (2017). Differentiation
between Croatian dessert wine Prosek and dry wines based on phenolic composition. Journal of Food
Composition and Analysis, 62, 211-216. doi.org/10.1016/j.jfca.2017.05.015.
2) Burns, J., Gardner, P. T., O’Neil, J., Crawford, S., Morecroft, L., McPhail, D. B., Crozier, A. (2000).
Relationship among antioxidant activity, vasodilatation, and phenolic content of wines. Journal of
Agricultural and Food Chemistry, 48, 220–230. doi: 10.1021/jf9909757.
3) Castillo-Muñoz, N., Gómez-Alonso, S., García-Romero, E., & Hermosín-Gutiérrez, I. (2007). Flavonol
profiles of Vitis vinifera red grapes and their Single-Cultivar Wines. Journal of Agricultural and Food
Chemistry, 55(3), 992–1002. doi: 10.1021/jf062800k.
4) Cvejic, J., Djekic, S., Petrovic, A., Atanackovic, M., Jovic, S., Brceski, I., & Gojkovic-Bukarica, L.
(2010). Determination of trans- and cis-Resveratrol in Serbian Commercial Wines. Journal of
Chromatographic Science, 48, 229-234. doi: 10.1093/chromsci/48.3.229.
5) De Beer, D., Joubert, E., Gelderblom, W. C. A., Manley, M. (2005). Changes in the phenolic
composition and antioxidant activity of Pinotage, Cabernet Sauvignon, Chardonnay and Chenin Blanc
wine during bottle ageing. South African Journal of Enology and Viticulture, 26, 6-15.
doi.org/10.21548/26-1-2112.
International Conference on
RAW MATERIALS TO PROCESSED FOODS 03-04 June 2021, Turkey
69
6) Dekic, S., Milosavljević, S., Vajs, V., Jović, S., Petrović, A., Nikićević, N., Manojlović, V., Nedović, V.,
& Tešević, V. (2008). Trans- and cis-resveratrol concentration in wines produced in Serbia. Journal of
Serbian Chemical Society, 73/11, 1027–1037. doi: 10.1093/chromsci/48.3.229.
7) Dordević, N., Novaković, M., Pejin, B., Zivković, M. Savić, A. et al. (2018). An insight into chemical
composition and biological activity of Montenegrin Vranac red wine. Scientia Horticulturae, 230, 142-
148. doi.org/10.1016/j.scienta.2017.11.033.
8) EC 479. (2008). On the common organisation of the market in wine, amending Regulations (EC) No
1493/1999, (EC) No 1782/2003, (EC) No 1290/2005, (EC) No 3/2008 and repealing Regulations (EEC)
No 2392/86 and (EC) No 1493/1999. Official Journal of the European Union, L148/1.
9) El Khawand, T., Courtois, A., Valls, J., Richard, T. & Krisa, S. (2018). A review of dietary stilbenes:
sources and bioavailability. Phytochemistry Reviews, 17/5, 1007-1029. DOI: 10.1007/s11101-018-9578-
9.
10) Fernandes, I., Pérez-Gregorio, R., Soares, S., Mateus, N. & de Freitas, V. (2017). Wine Flavonoids in
Health and Disease Prevention. Molecules, 22, 292, doi: 10.3390/molecules22020292.
11) Flamini, R., Mattivi, F., Rosso, M.D., Arapitsas, P., Bavaresco, L., (2013). Advanced knowledge of three
important classes of grape phenolics: anthocyanins, stilbenes and flavonols. International Journal of
Molecular Sciences, 14(10), 19651–19669.
12) Flamini, R. & De Rosso, M. (2018). High-Resolution Mass Spectrometry and Biological Properties of
Grapevine and Wine Stilbenoids. In: Studies in Natural Products Chemistry, Edited by Atta-ur-Rahman.
Vol. 61. pp. 175-210. doi.org/10.1016/B978-0-444-64183-0.00005-1.
13) Friedman, M. (2014). Antibacterial, Antiviral, and Antifungal Properties of Wines and Winery
Byproducts in Relation to Their Flavonoid Content. Journal of Agriculture and Food Chemistry, 62(26),
6025−6042. doi.org/10.1021/jf501266s.
14) Gambelli, L. & Santaroni, G.P. (2004). Polyphenols content in some Italian red wines of different
geographical origins. Journal of Food Composition and Analysis, 17, 613–618.
doi.org/10.1016/j.jfca.2003.09.010.
15) Gerogiannaki-Christopoulou, M., Athanasopoulous, P., Kyriakidis, N., & Spanos, M. (2006). Trans-
resveratrol in wines from the major Greek white and red varieties. Food Control, 17, 700–706.
doi.org/10.1016/j.foodcont.2005.04.006.
16) Goldberg, D. M., Karumanchiri, E., Ng. A., Yan, J., Diamandis, E. P., & Soleas, G. J. (1995). Assay of
resveratrol glucosides and isomers in wine by direct-injection High-Performance Liquid
Chromatography. Journal of Chromatography A, 708/1, 89-98. doi.org/10.1016/0021-9673(95)00368-
W.
17) Guerrero, R. F., García-Parrilla, M. C., Puertas, B., & Cantos-Villar, E. (2009). Wine, Resveratrol and
Health: A Review. Natural Product Communications, 4/5, 1934578X0900400. doi:
10.1177/1934578X0900400503.
18) Hermosín-Gutiérrez, I., Castillo-Muñoz, N., Gómez-Alonso, S. & García-Romero, E. (2011). Flavonol
profiles for Grape and Wine Authentication. In: Progress in Authentication of Food and Wine. Eds.
Ebeler, S., Takeoka, G., Winterhalter, P. American Chemical Society: Washington, DC, USA. Pp. 113-
129. doi: 10.1021/bk-2011-1081.ch008.
19) Huang, Y-F., Cheynier, V. & Terrier, N. (2012). Shedding Light on the Black Boxes of the
Proanthocyanidin Pathway with Grapevine. In: Recent Advances in Polyphenol Research, Volume 3.
Edited by V. Cheyner, P. Sarni-Manchado and S. Quideau, John Wiley & Sons Ltd. pp. 162-190.
doi.org/10.1002/9781118299753.ch7.
20) INSTAT (2019). Agricultural statistics 2018. http://www.instat.gov.al/media/5937/njoftim-p%C3%ABr-
media-statistikat-e-bujq%C3%ABsis%C3%AB-2018.pdf. (Assessed on March 1, 2020).

International Conference on
RAW MATERIALS TO PROCESSED FOODS 03-04 June 2021, Turkey
70
21) Kallitraka, S., Mamalos, A., Makris, D. P. (2007). Differentiation of young red wines based on
chemometrics of minor polyphenolic constituents. Journal of Agriculture and Food Chemistry, 55,
3233–3239. doi: 10.1021/jf070114v.
22) Kelebek, H., Canbas, A., Jourdes, M. & Teissedre, P.L. (2010). Characterization of colored and colorless
phenolic compounds in Öküzgözü wines from Denizli and Elazig regions using HPLC-DAD–MS.
Industrial Crops and Products, 31, 499–508. doi: 10.1016/j.indcrop.2010.01.012.
23) Kelebek, H., Selli, S., Sevindik, O. (2020b). Screening of phenolic content and antioxidant capacity of
Okitsu mandarin (Citrus unshui Marc.) juice extracted with various solvents. Journal of Raw Materials
and Processed Foods, 1, 7-12.
24) Kelebek, H., Sevindik, O., Uzlasir, T., Selli, S. (2020a). LC-DAD/ESI MS/MS characterization of fresh
and cooked Capia and Aleppo red peppers (Capsicum annuum L.) phenolic profiles. European Food
Research Technology, 246, 1971–1980. Doi: 10.1007/s00217-020-03548-2.
25) Kostadinovic, S., Wilkens, A., Stefova, M., Ivanova, V., Vojnoski, B., Mirhosseini, H. & Winterhalter,
P. (2012). Stilbene levels and antioxidant activity of Vranec and Merlot wines from Macedonia: Effect
of variety and enological practices. Food Chemistry, 135, 3003–3009. DOI:
10.1016/j.foodchem.2012.06.118.
26) Kottek, M., Grieser, J., Beck, C., Rudolf, B. and Rubel, F. (2006). World Map of the Köppen-Geiger
climate classification updated. Meteorologische Zeitschrift, 15(3), 259-263. DOI: 10.1127/0941-
2948/2006/0130.
27) Lattanzio, V., Kroon, P. A., Quideau, S. & Treutter, D. (2008). Plant Phenolics – Secondary Metabolites
with Diverse Functions. In: Recent Advances in Polyphenol Research, Volume 1. Edited by F. Daayf
and V. Lattanzio. Blackwell Publishing Ltd. pp. 7-21. doi.org/10.1002/9781444302400.ch1.
28) Markoski, M. M., Garavaglia, J., Oliveira, A., Olivaes, J., & Marcadenti, A. (2016). Molecular
Properties of Red Wine Compounds and Cardiometabolic Benefits. Nutrition and metabolic insights, 9,
51–57. https://doi.org/10.4137/NMI.S32909.
29) Mattivi, F., Guzzon, R., Vrhovšek, U., Stefanini, M., Velasco, R. (2006). Metabolite profiling of grape:
flavanols and anthocyanins. Journal of Agriculture and Food Chemistry, 54, 7692–7702.
doi.org/10.1021/jf061538c.
30) Merkyte, V., Longo, E. Windisch, G. & Boselli, E (2020). Phenolic Compounds as Markers of Wine
Quality and Authenticity, Foods, 9, 1785; doi:10.3390/foods9121785.
31) Minussi, R. C., Rossi, M., Bologna, L., Cordi, L., Rotilio, D., Pastore, G. M., Duran, N. (2003). Phenolic
compound and total antioxidant potential of commercial wines. Food Chemistry, 82, 409-416.
doi.org/10.1016/S0308-8146(02)00590-3.
32) Monagas, M., Suarez, R., Gómez-Cordovés, C., Bartolomé, B. (2005). Simultaneous determination of
non-anthocyanin phenolic compounds in red wines by HPLCDAD/ESI-MS. American Journal of
Enology and Viticulture, 56, 139–147.
33) Nassiri-Asl, M., Hosseinzadeh, H. (2016). Review of the Pharmacological Effects of Vitis vinifera
(Grape) and its Bioactive Constituents: An Update. Phytotherapy Research, 30(9), 1392-403. doi:
10.1002/ptr.5644.
34) OIV (2005). Compendium of International Methods of Wine and Must Analysis, Paris, International
Organisation of Vine and Wine, 2005 ed.
35) Pajovic-Scepanovic, R., Wendelin, S., Raičević, D. & Eder, R. (2019). Characterization of the phenolic
profile of commercial Montenegrin red and white wines. European Food Research and Technology. doi:
10.1007/s00217-019-03330-z.
36) Proestos, C., Bakogiannis, A., Komaitis, M. (2012). Determination of Phenolic Compounds in Wines.
International Journal of Food Studies, 1, 33-41.
International Conference on
RAW MATERIALS TO PROCESSED FOODS 03-04 June 2021, Turkey
71
37) Radović, B. Tešević, V. Kodžulović V. and Maraš, V. (2015). Resveratrol concentration in Vranac
wines. Vitis, 54 (Special Issue), 169–171. doi.org/10.5073/vitis.2015.54.
38) Ragusa, A., Centonze, C., Grasso, M. E., Latronico, M. F., Mastrangelo, P. F., & Sparascio, F., (2017).
A Comparative Study of Phenols in Apulian Italian Wines. Foods, 6, 24. doi:10.3390/foods6040024.
39) Rayne, S., Sheppard, S., Di Bello, T., Eggers, N. J. (2011). Chromatic characteristics and optically
derived compositional descriptors of micro-oxygenated wines from Vitis vinifera cv Merlot and Cabernet
Sauvignon. Food and Bioprocess Technology, 4(2), 254-265. doi.org/10.1007/s11947-008-0152-0.
40) Rodriguez-Delgado, M. A., González, G., Pérez-Trujillo, J. P. & García-Montelongo, F. J. (2002).
Trans-resveratrol in wines from the Canary Islands (Spain). Analysis by high performance liquid
chromatography. Food Chemistry, 76/3, 371-375. Doi: 10.1016/S0308-8146(01)00258-8.
41) Rodriguez-Delgado, M. A., Malovana, S., Perez, J. P., Borges, T., Montelongo, F. J. G. (2001).
Separation of phenolic compounds by high-performance liquid chromatography with absorbance and
fluorimetric detection. Journal of Chromatography A, 912, 249-257. doi: 10.1016/s0021-
9673(01)00598-2.
42) Rosario-Bronze, M., Duarte, C., & Matias, A. (2012). Stilbenes and Resveratrol. In: Handbook of
Analysis of Active Compounds in Functional Foods. Eds: L.M.L. Nollet and F. Toldrá. 1-st edition, CRC
Press, Boca Raton, pp. 349-378. doi: 10.1201/b11653-22.
43) Susaj, L., Susaj, E. & Duhanaj, G. (2018). Albanian Viticulture and Wine production. Albanian Journal
of Agricultural Sciences, Special edition - Proceedings of ICOALS, Tirana, Albania.
44) Torregrosa, L., Vialet, S., Adivèze, A., Iocco-Corena, P. & Thomas, M. R. (2015). Grapevine (Vitis
vinifera L.). In: Agrobacterium Protocols: Volume 2, Methods in Molecular Biology, Kan Wang (ed.),
vol. 1224, Springer Science+Business Media, New York, USA. DOI: 10.1007/978-1-4939-1658-0_15.
45) Vitrac, X., Monti, J. P., Vercauteren, J., Deffieux, G. & Mérillon, J. M. (2002). Direct liquid
chromatographic analysis of resveratrol derivatives and flavanonols in wines with absorbance and
fluorescence detection. Analytica Chimica Acta, 458/1, 103-110. Doi: 10.1016/S0003-2670(01)01498-2.
46) Waterhouse, A. L. (2002). Wine Phenolics. Annals of the New York Academy of Sciences. 957, 21–36.
Doi: 10.1111/j.1749-6632.2002.tb02903.x.
47) Weidner, S., Rybarczyk, A., Karamać, M., Król, A., Mostek, A., Grębosz, J., Amarowicz, R. (2013).
Differences in the phenolic composition and antioxidant properties between Vitis coignetiae and Vitis
vinifera seeds extracts. Molecules, 18, 3410–3426. Doi: 10.3390/molecules18033410.
48) WVS. Wine and Vine Search: Albania’s Wine Regions. www.wineandvinesearch.com. (Retrieved on
October 3rd, 2020).

International Conference on
RAW MATERIALS TO PROCESSED FOODS 03-04 June 2021, Turkey
72
Effect of Storage on Fatty Acid Composition of Hazelnut (Corylus avellana L.)
Varieties Cultivated in Turkey
Haşim Kelebek1, Zeynep Ergün*2, Türkan Uzlaşır1
1 Department of Food Engineering Faculty of Engineering Adana Alparslan Türkeş Science and Technology University
Adana, Turkey
2* Department of Bioengineering Faculty of Engineering Adana Alparslan Türkeş Science and Technology University
Adana, Turkey *E-mail: [email protected], +90 553 259 73 89
ABSTRACT
This paper aimed to study the effect of storage on the fatty acids profile of Hazelnut (Corylus avellana L.).
14 different hazelnut cultivars (cavcava, çakildak, ince kara, kalın kara, kara fındık, kargalak, kuş, mincane,
palaz, sivri, tombul, uzun musa, yassi badem, and yuvarlak badem), grown in Turkey and harvested in 2018,
2019, and 2020 were used as samples. The first two samples were stored in room conditions. The oils were
extracted in 2020. The major fatty acids were oleic acid and linoleic acid in 42 samples. The results of the
analysis showed that the fatty acid profiles of hazelnut cultivars were affected by storage. However, this
effect varied according to the cultivars and fatty acids, and the changes did not show a specific characteristic.
The biggest deviations were also observed in oleic acid and linoleic acid, while the deviation of the
palmitoleic acid was the smallest. It was also revealed that storage had negative effects on the nutritional
quality of hazelnut kernels.
Keywords: Corylus avellana L., Effect of Storage, Fatty Acid Composition, Turkey

International Conference on
RAW MATERIALS TO PROCESSED FOODS 03-04 June 2021, Turkey
73
The Effect of Maturation Status on Fatty Acid Profile of Xanthium strumarium
L. Oil
Mozhgan ZARIFIKHOSROSHAHI 1*, Zeynep ERGÜN2
1 Department of Horticulture, Faculty of Agriculture, Cukurova University, Adana, Turkey 2 Department of Bioengineering Faculty of Engineering Adana Alparslan Türkeş Science and Technology University
Adana, Turkey
E-mail: [email protected], +90 507 037 30 05
ABSTRACT
Cocklebur is a very precious medicinal plant due to its biochemical contents with antioxidant, antimicrobial,
and antioxidants. Besides these properties, it can be evaluated as a source of energy. Cocklebur seeds and
seed oil is not edible and contains 67% more biomass than cotton. Therefore, it can be evaluated as a
sustainable energy source. Recently, the use of cocklebur as biodiesel makes this plant a point of interest for
researchers. However, more studies are needed for evaluating factors that affect the quality of this kind of oil
for desire application. The fatty acid profile of matured and immature oil of cocklebur pulp with seeds from
Osmaniye province in Turkey was investigated in this study. Although the main fatty acid in the immature
sample was linoleic acid with 55.36%, its amount (5.41%) decreased sharply in mature sample oil. Despite
Linoleic acid, mature cocklebur oils had higher concentrations of oleic acid (50.17%), palmitic acid
(27.38%), and stearic acid (9.35%). These results showed that maturation status significantly affected the
concentration and rates of fatty acids in studied Cocklebur. This study will help international researchers on
the evaluation of qualified seed oils for application both in industry and biodiesel production.
Keywords: Biodiesel, fatty acids, maturation status, Xanthium strumarium L.
International Conference on
RAW MATERIALS TO PROCESSED FOODS 03-04 June 2021, Turkey
74
Olive By Products: Low-Cost, Renewable Source of High Added Value Phenolic
Compounds and Their Biological and Functional Activities
Mohamed BOUAZIZ
Institut Supérieur de Biotechnologie de Sfax, Université de Sfax, BP “1175”, 3038, Sfax, Tunisia
E-mail: [email protected]
ABSTRACT
Phenolic compounds, present in plants, are an essential part of the human diet due to their antioxidant
properties. These compounds posses an aromatic ring bearing one or more hydroxyl groups and their
structures may range from that of a simple phenolic molecule to that of a complex high-molecular weight
polymer. Olive oil and olive by-products are the major sources of phenolic compounds in the Mediterranean
countries. Indeed, Olea europaea L. organs and by-products such as: leaves, olive mill wastewater, wood,
stems and roots represent a major disposal problem for the industry concerned, but they are also promising
sources of phenolic compounds which have been associated with numerous in vivo and in vitro biological
activities and used for traditional medicinal purposes. In fact, olive oil and some of its by-products has been
the subject of investigations and have proven to be effective sources of phenolic antioxidants. Principally,
biological activities and characteristic flavour and aroma are due to the presence of unique bioactive
compounds both in olives and extra virgin olive oil phenolic compounds such as oleuropein, hydroxytyrosol,
verbascoside and derivatives etc., and tocopherols and carotenoids. Several factors, such as agronomical
conditions, climate, and level of ripening, olive cultivar and type of production process have the main effects
on the profile and activities of bioactive compounds. Accumulating evidence suggests that EVOO may have
health benefits; it can be considered as an example of a functional food containing a variety of biologically
active phenolic components that may contribute to its overall therapeutic characteristics. This chapter
highlights the potential of olive oil and selected by-products as a source of phenolic compounds and their
biological and functional properties.

International Conference on
RAW MATERIALS TO PROCESSED FOODS 03-04 June 2021, Turkey
75
Assessment of Acrylamide in Potato Chips and French Fries Consumed by the
Romanian Population
Adriana Laura Mihai1*, Mioara Negoiță1, Gabriela Andreea Horneț1
1 National Research & Development Institute for Food Bioresources- IBA Bucharest, 6 Dinu Vintilă Street, District 2,
Bucharest, 021102, Romania
*E-mail: [email protected], 031-620.58.33
ABSTRACT
The aim of this study was to estimate the acrylamide (AA) content of potato-based products consumed by the
Romanian population and AA intake by consuming such products. 16 samples of potato chips (PC) from the
market, 8 French fries ready-to-eat (FF) samples from fast-foods and 34 households FF samples were
analyzed for AA content by using the GC-MS/MS and color parameters. The mean AA content of PC, FF
from fast-food and prepared in households was 386.67, 149.55, and 530.32 µg/kg, respectively. 19% of the
PC samples exceeded the benchmark level of 750 µg/kg set by EC (2017). 50% of FF samples prepared in
households exceeded the established benchmark level of 500 µg/kg, while all FF ready-to-eat samples from
fast-food had an AA content below the threshold level. A linear correlation between the AA level and the
color parameters L*, a*, and ΔE* was found for FF samples prepared in households, with the linear
correlation coefficients (R) ranging between 0.80 – 0.85. No correlation was found between AA content and
color parameters for PC and FF from fast-food samples. The contribution to the total exposure to AA by
consumption of PC and FF was calculated to be 45 - 73% of the maximum value estimated by EFSA (0.6
µg/kg b.w./day). In order to ensure consumers’ safety, food industry producers should control the AA
content for the food products delivered to the market. Moreover, consumers should apply appropriate
preparation and frying practices in their households, in accordance with the recommendations for reducing
the level of AA in FF.
Keywords: Acrylamide, fast-food, household, potato-based products
Acknowledgments
This study was achieved through Core Programme (PN 19 02), with the support of the Ministry of Research
and Innovation (MCI), contract 22N/2019, project PN 19 02 03 01.

International Conference on
RAW MATERIALS TO PROCESSED FOODS 03-04 June 2021, Turkey
76
Volatiles of Canned Tuna Fish and The Effects of Different Parameters
Mehmet Yetişen1, Serkan Selli2*
1Department of Food Engineering, Faculty of Engineering, Nigde Omer Halisdemir University, Nigde, Turkey 2Department of Food Engineering, Faculty of Agriculture, Cukurova University, Adana, Turkey
*E-mail: [email protected]
Phone: + (90) 322 338 6173. Fax: + (90) 322 338 6614.
ABSTRACT
Tuna is one of the most important commercial fish species due to its economical and high nutritional values.
There are many species of fish, which are eaten raw, used in home-cooked dishes and subject to various
industrial activities, such as canning. Tuna processing methods are mainly freezing, cooking, smoking, and
canned after heat treatment. The species used for canning are mainly yellowfin, skipjack and albacore tuna.
The flavor components of tuna vary depending on the processing method. The different temperature
conditions applied in tuna canning productions significantly affect the aroma profiles of tuna. The aroma is
one of the main indicators on which consumers judge the fish’s freshness. Fish flavour quality is changing
rapidly according to the freshness of the product, and therefore, sensory analysis of the flavouring is used by
consumers, researchers and the fishing industry as a whole to evaluate the quality of fish. Each species of
fish has a tender and distinctive aroma, which can be influenced by processing technology, post production
and storage methods. Volatile compounds derived from lipid are produced mainly by oxidative-enzymatic
reactions and autoxidation of lipids. These are important compounds in fish which give its aroma. Therefore,
this review highlights the impact of various parameters on volatiles of canned tuna for use in future studies.
Keywords: Volatiles, canned tuna, freezing, cooking, smoking, aroma
INTRODUCTION
Tuna is one of the most commercial fish species, due to its excellent economic and nutritional benefits. It can
be consumed raw, evaluated under culinary or even industrial processes such as canning. The main
processing methods for tuna are freezing, cooking, smoking and canning after being thermally processed
(Miao et al., 2017). Generally, the species used for canning are yellowfin, skipjack and albacore tuna (Zhang
et al., 2019). Tuna is one of the most widely consumed fish in terms of international seafood production (8%)
and is sold commercially all over the world (4.3 million tonnes) (Kumar & Kocour, 2015). Tuna has a lot of
differences compared to other fish in terms of growth rate, size, lifespan, maturity age and spawning period.
Species which are restricted to tropical and sub-tropical areas (skipjack and yellowfin tuna) are distinguished
by their small to medium size, quick growth, and early ripening. The bluefin tuna, instead, shows the
characteristics of a highly variable life with a longer spawning period and a shorter lifetime compared to
other tuna species (Fromentin and Fonteneau, 2001). Skipjack tuna has a black and purplish blue upper part
and 4 to 6 stripes on the abdomen. Their body shapes are longitudinally round. While these fish prefer waters
with a temperature about 25°C during their larval stage, they deserve to live in water at a temperature around
15°C when they reach the growth stage. The depth distribution ranges from about 260 meters from the
surface during the day, they live near surface waters. The skipjack spawns all year long in subtropical waters,
but it gets shorter and further away from the equator. Female skipjack tuna with a fork length of 41 to 87 cm
can lay anywhere between 80,000 and 2 million eggs (FAO, 2020a).
As important commercial species, In 2018, the primary target of purse seine fishing in the Eastern Pacific
Ocean was Katsuwonus pelamis with 289,000 tons (IATTC 2019). In China, large quantities of fish by-
products are produced during processing of canned tuna production, including flakes, skin, heads, and
viscera, and compounds such as collagens, gelatines, and bioactive peptides are obtained from these bones,
heads, and black muscles (Yang et al., 2019; Liu et al., 2015; Chi et al., 2015). Yellowfin tuna is the second

International Conference on
RAW MATERIALS TO PROCESSED FOODS 03-04 June 2021, Turkey
77
tuna species mostly consumed worldwide and responsible for 27% of the total world catch (ISSF, 2015).
Yellowfin tuna reached a maximum length of 208 cm and a maximum weight of 176.4 kg. The black and
dark blue color and the silver-colored belly characterize the Yellowfin tuna. Anal and dorsal fins are light
yellow in color. These fish usually feed on fish, squid and crustaceans. Although their breeding season is
known as summer, they actually multiply all year long (FAO, 2020b).
Seafood is nutritionally rich in protein, omega-3 fatty acids, unsaturated fatty acids, vitamins, micro and
macronutrients, and their consumption by humans is increasing worldwide (Pieniak et al., 2010). Fish
consumption reduces chronic noncommunicable diseases such as cardiovascular disease, mental disorders,
rheumatoid arthritis, as well as several cancers, and promotes normal neuronal development in children (Di
Giuseppe et al., 2014; Swanson et al., 2012; Virtanen et al., 2008). Moreover, the consumption of omega-3
fatty acid has proved its role in preventing irregular heart rhythms, controlling rheumatoid arthritis and
suppressing breast cancer (Geusens et al., 1994; Belch and Muir, 1998; Nair et al., 1997; Rose and Connolly,
1990 Rose, 1997). Omega-3 fatty acids such as eicosapentaenoic acid (EPA; 20: 5n-3) and docosahexaenoic
acid (DHA; 22: 6n-3) have major health benefits: for brain and retina development and the prevention of
coronary artery disease (Swanson et al., 2012; FAO / WHO, 2010). Omega3 fatty acids that cannot be
synthesized in the body are recommended to be taken from diets and food (Plourde and Cunnane, 2007).
In this review, the effects of different processing parameters (such as production techniques, temperature,
drying, cooking, smoking and freezing) on the aroma compounds of canned tuna have been compiled, since
no such study has been conducted in the literature before.
VOLATILES OF CANNED TUNA
The canning process is one of the most important methods of preserving fish for a long time. Canned fish
and fish products play a crucial role in human diet. Fish species possess different nutrient compositions and
they become stable when the fish is subjected to thermal treatments during canning process. According to a
report, lean fish is not recommended in the canning process, since the meat breaks down under high
temperatures, thereby losing both its taste and texture (Aberoumand, 2014). The aroma changes during the
canning process depending on compounds derived from lipid oxidation and thermal degradation of
carbohydrates, or the compounds originating from other reactions such as Strecker degradation and the
Maillard reaction. The principal changes occur due to sterilization during the canning process which results
in the release of furans, nitrogenous compounds, branched aldehydes and sulphur compounds (De Quirós et
al., 2001). The canning process improves the organoleptic properties of fish obtained from canned silver.
Canned smokes as well as minced fish from cans possess a marked increase of taste and color. The overall
acceptance is gradually declines in all groups of canned fish (Khallaf et al., 1997). In the canning process,
both enzymes and bacteria population should be permanently inactivated by heat treatments and when no
reinfection or negative interaction takes place with the container, heat-processed fish can be kept for a very
long time. On the other hand, a number of adverse effects also exist in the canning process, such as, loss of
essential nutrients, release of unwanted compounds, browning, deterioration of lipids and proteins
(Lukoshkina and Odoeva, 2003).
Temperature, used in seafood processing, has an enormous influence on the type and quantities of aroma and
aroma-active compounds (Moreira et al., 2013). A number of studies have been conducted to aroma and
aroma-active compounds from various cooked fish and other types of marine products (Milo et, al., 1993;
Tao et al., 2014). Volatile compounds produced by oxidation during heat treatments of fish have been
identified in several reports (Medina et al. 1999). De Quirós et al. (2001), identified the volatile compounds
present in fresh and preserved sea urchins (Paracentrotus lividus, Lamarck) and reported that the sterilization
process gave rise to significant changes in the profile of volatile compounds.
2.1. The effect of different production techniques on volatile composition of fish
2.1.1. Effect of drying

International Conference on
RAW MATERIALS TO PROCESSED FOODS 03-04 June 2021, Turkey
78
Drying is known to be a crucial parameter to prolong the shelf-life of fresh fish and other fishery products. It
is possible for fishes to be maintained by solar drying, which focuses on reducing the water content to reduce
or stop the activity of microorganisms (Farid et al. 2014). By long exposure to sunlight, fish may be
oxidized, which can contribute to a reduction in nutrient quality and to increased health risks for consumers
(Smida et al. 2014). Apart from health risk and nutritional loss, organoleptic character (such as aroma, color,
texture etc.) of fish affects substantially from drying conditions. Aroma normally characterises foods sensory
properties, and plays an important role when evaluating nutritional qualities and freshness (Diez-Simon et
al., 2019; Dominguez et al., 2019). Previous studies have proven that most volatile compounds in dried meat
products originate from fat oxidation (Kawai & Sakaguchi, 1996; Toldrá, 1998; Chung et al., 2007; Czerner
et al., 2011). Furthermore, most of these substances are unstable and may undergo further reactions during
storage in order to form other stable substances and chemical reactions intermediated by enzymes and micro-
organisms continue to produce adverse volatile substances which effect the quality and limit the shelf life of
the products (Jia et al., 2019; Shi et al., 2019). So far, most studies have focused on aroma changes during
dried fish processing or storage (Ganguly et al., 2017; Leduc et al., 2012; Roseiro et al., 2017). In a recent
study, Zhang et al. (2020) focused on the alterations of volatile compounds in dried fish at 4°C and 25°C
during storage were investigated by HS-GC-IMS fingerprinting in combination with principal component
analysis (PCA). In the 4°C stored samples, the most important volatile compounds were 3-methyl butanal,
dimethyl ketone, and hexanal; whereas hexanal, 1-octan-3-ol, and 3- methyl butanal were the dominant
compounds of dry cured fish stored at 25°C while butyl methyl ketone was only seen at 25°C. According to
results of this study, the PCA differentiated the samples clearly with respect to their storage temperature and
time. Moretti et al. (2017) studied the chemical changes and volatile formation during processing and
maturation of a traditional salted fresh inland fish product (Alosa fallax lacustris). The researchers observed
a sharp increase in volatile compounds of fresh fish to 9, 40, 70 and 100 days maturated and salted samples
and the total aroma concentrations were showed a positive correlation with the drying process. In the light of
these information, the process of drying is probably the critical stage of the quality of fish and fishery
products, assisted by the fact that there are higher levels of volatile substances and malondialdehyde
associated with rapid oxidation.
2.1.2. Effect of cooking
There are a number of uses of heating in fish processing, including cooking, baking, grilling, and roasting
(Boonsumrej et al., 2007). Heat is an important parameter in the processing of fish for the purpose of
improving flavour and taste, and to extend the shelf-life of fish and seafood products. Tuna flavour varies
greatly depending upon the processing method used. Although quality features are very important for the
economic value of tuna, there is very little information about the volatile and non-volatile compounds in tuna
meat over the canning process (Zhang et al., 2019). It is well known that the heating process leads to changes
in the complex taste patterns of fish meat. It is estimated that these changes are caused by proteolytic and
lipolytic reactions. The changing aroma profile correlates with the taste changes that have been observed
after exposure to heat in tuna meat. Various studies have been carried out on the quality characteristics of
species of fish affected by heat treatment. An earlier study characterized the volatile composition of boiled
and steamed red mullet (Mullus barbatus) (Salum et al., 2017). According to results, hexanal and 2-
phenoxyethanol compounds were found in raw fish samples while 3-hydroxybutan-2-one, 2,3-octadienone,
(E,E)- 2,4-heptadienal, linalool, γ-butyrolactone, 1- methylpyrrolidin-2-one, 2H-furan-5-one and pyrrolidin-
2-one were detected in cooked fish samples. Another research focused on the effects of different cooking
practices to characterize lipid compositions and volatile profiles of farmed and wild sea bass (Dicentrarchus
labrax) (NievaEchevarría et al., 2018). According to results, pyrroles, alkylpyrazines, alkylthiophenes and 2-
ethylpyridine compounds were detected only in oven-baked samples. In addition, it was determined that
farmed sea bass had richer aromatic compounds than wild samples. Similarly, in the study of Zhang et al.
(2019), the effect of the two major tuna-fish canning operations (steam boiling and canning) on the volatile
and non-volatile compounds of tuna was determined. Regarding to the result of the study, 35, 35 and 34
volatile compound have been detected in raw, cooked, and canned tuna patterns respectively. Among these
volatiles hydrocarbons and aldehydes have been identified as the most common compounds in all processes.
The main contributors to raw tuna flavors were found to be decanal, nonanal, octanal, and (E)‐2‐nonenal,
with their green and fatty properties. Another remarkable finding of this study was the release of 2-
pentylfuran (green beans), 2‐ethylfuran (rubber, baking) and heptanal (dry fish) during the steam cooking
process. Moreover, 2-methyl-3-furanthiol, which contains a fleshy aromatic note also known as an important
International Conference on
RAW MATERIALS TO PROCESSED FOODS 03-04 June 2021, Turkey
79
aromatherapy component, only found in canned tuna (Zhang et al., 2019). Another published study focused
on the relationship between the composition of volatile compounds in the bigeye tuna (Thunnus obesus) and
the variability through processing temperatures. In this study, Sun et al. (2013) examined the volatile
compounds of tuna fish by means of HS-SPMEGC-MS” before and after exposure to temperatures of 70°C
to 150°C. Researches mentioned that the relative amount of aldehydes, ketones, alcohols, hydrocarbons and
heterocyclic compounds increased rapidly with increasing heating temperature. In another study, the
oxidation of fish under thermal processing has been investigated using a static head-space gas
chromatographic system to determine their volatile production. Various process temperatures and periods
have been analysed to simulate the conditions in industrial fish treatment. According to results, acetaldehyde,
propanal, heptane, 2-ethylfuran, pentanal and hexanal were the most important volatile compounds. The
results showed that 2- ethylfurane can be considered as a marker aroma compound to identify the oxidative
stability of fish muscle during heat treatments (Medina et al., 1999).
2.1.3. Effect of smoking
Heat treatments decrease the water activity of fish flesh and this provides an excellent preservation via
deactivation of microbial organisms. Thus, minimization of spoilage increases the conservation and so
availability of fish for consumers. The smoking is also known as a kind of preservation method providing
heat and antimicrobial smoke chemicals such as formaldehydes and phenols, which act as
antimicroorganisms providing and opportunity for the fish to produce a unique colour and excellent flavour
(Longwe & Kapute, 2016). Changes that arise from the smoking of fish are hard to maintain, especially for
heat sensitive nutrient (Adenike, 2014). The smoking does not only give food a particular taste, color and
flavor, but also improves its conservation due to the dehydrating, bactericidal and antioxidant properties. The
smoking technique is commonly applying to fish as either in cold (28-32°C) or hot (70-80°C) conditions
(Alasalvar et al., 2011). Salmon is the most common fish subjected to smoking process in the fish industry.
Many aromatic compounds of smoked salmon can be traced back to smoke from wood. A further part of the
smoked salmon flavour can either be attributed to the combination of odors of raw fish and an evolution of
fish flesh flavoring according to the conditions of the smoking process. In an earlier study the volatile
compounds in raw and smoked salmon were studied using two gas chromatography-olfactometry (frequency
detection and odorant intensity) and gas chromatography mass spectrometry. For fresh salmon, 49 odorous
compounds were identified, and 74 for smoked salmon. In particular, phenolic compounds may be used as
indicators of smoke development and process intensity. Once smoked salmon aromatic characteristics and
their origin are known, it will become easier to adapt the method of smoking (Varlet, et al., 2006). In another
study, Mansur et al. (2002) detected that smoked and baked salmon had twice as many volatile compounds
as raw salmon. Among all the processes, smoking is considered the highest aroma components followed by
baking, canning, surimi samples (kamaboko and chikuwa), drying and finally salting. In another study,
Cardinal et al. (2006) investigated the association between odor characteristics and smoking parameters on
smoked herring. The impact of three smoking temperatures (16, 24 and 32 °C) on both traditional as well as
liquid smoke atomization has been tested. The findings highlight clear discrimination between products, as
some of the odor characteristics are particularly related to smoking. A further study aimed to determine that
volatile compounds in cold-smoked salmon products is identified by using gas chromatography in order to
determine their suitability for the identification of these compounds quickly as indicators to forecast sensory
quality. Smoked salmon odor contributed to guaiacol, cooked potato, and mushroom odors characteristic of
degradation of fish fats, and sweet odors associated with the microbial metabolites 3- methylbutanal and 3-
hydroxybutanone were the strongest odors. Studies show that smoke-related compounds like furfural,
phenol, guaiacol and 4- methyl guaiacol are useful indicators for differentiating between products made by
different manufacturers that implement different handling and smoking techniques (Jónsdóttir et al., 2008).
In another study, Stołyhwo et al. (2006) showed that the typical smoke taste was largely linked with the
phenolic compounds in the smoke. Wood smoking compounds that are most active in traditional smoking are
pyrogallol, resorcine, 4- methylguaiacol, and less active are syringol and guaiacol.
2.1.4. Effect of freezing
Freezing is one of the commonly used preservation methods in fresh fish and other seafood. If fish are
freezing, however, the result may be physical, chemical and enzymatic changes which ultimately lead to the
tissue being in an undesirable state (Magnusse et al., 2008). Texture, flavour and color are some of the
effects on quality that are present in frozen foods. Freezing rates, methods of thawing, and different
International Conference on
RAW MATERIALS TO PROCESSED FOODS 03-04 June 2021, Turkey
80
temperatures are some of the factors affecting the magnitude of quality loss (Pourshamsian et al., 2012). The
effect that freezing and thawing have on the muscles of frozen fish is a matter for the researchers to consider
in order to determine the preservation conditions and textural characteristics of fish products (Díaz‐Tenorio
et al., 2007). The processing of frozen fish might result in a protein deformity. As soon as protein is
denatured, the muscle structure, water holding capacity, color and aroma of frozen fish and fish products are
affected, because muscle protein is the main factor for its structural properties (Sriket et al., 2007; Chavan et
al., 2008). The freezing of fish results in the loss of important characteristics of quality, with increasing
toughness and the formation of large ice crystals. Fish size, shape, and location (extra-cellular or
intracellular) are known to have an influence on food quality (Mackie, 1993; Howgate, 1977). Biochemical
modifications (mainly in lipids) due to frozen storage are likely to have a significant impact on the sensory
properties of fish. In salmon the formation of volatile lipid oxidation products is demonstrated during deep-
freeze storage, and free fatty acids derived from lipid hydrolysis are more important for the decay during
deep-freeze storage of trout when compared to lipid oxidation (Milo & Grosch, 1996; Refsgaard et al., 1998;
Ingemansson et al., 1995). According to study of Iglesias et al. (2009), volatile profile of fresh and frozen-
thawed from Italian and Spanish cultured gilthead sea bream fish during 266 days of deep freeze storage
were investigated by using SPMEGC-MS methodology. The results showed that aldehydes exhibited the
highest peak ranges during deep refrigeration. On the other hand, the volatile composition of Italian fish
started to increase after just 6 days of refrigeration. However, after 62 days of frozen storage, the first
significant increase in volatility was observed in Spanish samples. In a prior study by Refsgaard et al. (1998)
reported that the quantities of free fatty acids and lipid hydroperoxides present in fresh salmon could be used
to forecast the sensory quality during the storage process. According to the study of Milo & Grosch (1996),
the amount of (E,Z) -2.6- nonaddienal, (Z) -3-hexenal, and (Z,Z) -3, 6- nodienal compounds increased as a
result of storage of salmon at -13ºC for 26 weeks. Similar study by Farmer et al. (1997) showed that there
has been no significant change in salmon smell or taste stored at -24°C for 33 weeks. In another research by
Refsgaard et al. (1998)reported that not only volatile oxidation products account for significant sensory
changes during deep-freeze storage of salmon, but other less volatile compounds could also contribute to the
increased intensity of offflavor compounds. In the previous study, Alasalvar et al. (2005) investigated that
bream and wild bream were compared for differences in their volatile components a storage period of 23
days in the ice. According to results, a total of 60 volatile compounds have been identified in culture and 78
in wild sea bream. During the whole storage period, the relative concentrations of several compounds
(trimethylamine, piperidine, methanethiol, dimethyldisulfide, dimethyl trisulfide, 1-penten-3- ol, 3-methyl-1-
butanol and acetic acid) keep increasing and can serve as indicators as to the quality of the bream.
CONCLUSION
Fish is not only a popular nutritious water animal but also a food source. For processing that in compliance
with the protocol, it represents a reasonable percentage of the food being consumed. Different kinds of
processes have an effect on the aroma compounds of fish. When the effects of all processes applied to fish in
general on aroma compounds are examined, it is understood that aldehydes and hydrocarbons are the
predominant volatile compounds. As a result, consumer preference for fish rich in aroma compounds
depends entirely on the best conditions for processing and storing fish.
REFERENCES
Aberoumand, A. (2014). Studies on the effects of processing on food quantity of two selected consumed
marine fishes in Iran. International Food Research Journal, 21(4), 1429.
Adenike, O. M. (2014). The effect of different processing methods on the nutritional quality and
microbiological status of cat fish (Clarias lezera). Journal of Food Processing and Technology, 5(6).
Alasalvar, C., Miyashita, K., Shahidi, F., & Wanasundara, U. (Eds.). (2011). Handbook of seafood quality,
safety and health applications. John Wiley & Sons.
Alasalvar, C., Taylor, K. A., & Shahidi, F. (2005). Comparison of volatiles of cultured and wild sea bream
(Sparus aurata) during storage in ice by dynamic headspace analysis/gas chromatography− mass
spectrometry. Journal of agricultural and food chemistry, 53(7), 2616-2622.
Bai, J., Baker, S. M., Goodrich‐Schneider, R. M., Montazeri, N., & Sarnoski, P. J. (2019). Aroma Profile
Characterization of Mahi‐Mahi and Tuna for Determining Spoilage Using Purge and Trap Gas
Chromatography‐Mass Spectrometry. Journal of Food Science, 84(3), 481-489.
Belch, J. J. F., & Muir, A. (1998). n-6 and n-3 essential fatty acids in rheumatoid arthritis and other
International Conference on
RAW MATERIALS TO PROCESSED FOODS 03-04 June 2021, Turkey
81
rheumatic conditions. Proceedings of the Nutrition Society, 57(4), 563-569.
Benjakul, S., Mad-Ali, S., Senphan, T., & Sookchoo, P. (2018). Characteristics of biocalcium from pre-
cooked skipjack tuna bone as affected by different treatments. Waste and Biomass Valorization,
9(8), 1369-1377.
Bhaskaran, T. V., Nithin, C. T., Srinivasa Gopal, T. K., Bindu, J., & Ravishankar, C. N. (2018). Identifcation
of volatile organic compounds with reference to water activity in salt cured and sun dried Indian
mackerel (Rastrelliger kanagurta) by Headspace Gas Chromatography and Mass Spectrometry (HS-
GCMS).
Boonsumrej, S., Chaiwanichsiri, S., Tantratian, S., Suzuki, T., & Takai, R. (2007). Effects of freezing and
thawing on the quality changes of tiger shrimp (Penaeus monodon) frozen by air-blast and cryogenic
freezing. Journal of Food Engineering, 80(1), 292-299.
Cardinal, M., Cornet, J., Serot, T., & Baron, R. (2006). Effects of the smoking process on odour
characteristics of smoked herring (Clupea harengus) and relationships with phenolic compound
content. Food chemistry, 96(1), 137-146.
Cha, Y. J., & Cadwallader, K. R. (1998). Aroma-active compounds in skipjack tuna sauce. Journal of
Agricultural and Food Chemistry, 46(3), 1123-1128.
Chavan, B. R., Basu, S., & Kovale, S. R. (2008). Development of edible texturised dried fish granules from
low-value fish croaker (Otolithus argenteus) and its storage characteristics. Chiang Mai Journal of
Science, 1, 173-182.
Chi, C. F., Hu, F. Y., Wang, B., Li, Z. R., & Luo, H. Y. (2015). Influence of amino acid compositions and
peptide profiles on antioxidant capacities of two protein hydrolysates from skipjack tuna
(Katsuwonus pelamis) dark muscle. Marine Drugs, 13(5), 2580-2601.
Chung, H. Y., Yeung, C. W., Kim, J. S., & Chen, F. (2007). Static headspace analysis-olfactometry (SHA-O)
of odor impact components in salted-dried white herring (Ilisha elongata). Food Chemistry, 104(2),
842-851.
Czerner, M., Tomás, M. C., & Yeannes, M. I. (2011). Ripening of salted anchovy (Engraulis anchoita):
development of lipid oxidation, colour and other sensorial characteristics. Journal of the Science of
Food and Agriculture, 91(4), 609-615.
De Quirós, A. R. B., López-Hernández, J., González-Castro, M., De la Cruz-Garcia, C., & Simal-Lozano, J.
(2001). Comparison of volatile components in fresh and canned sea urchin (Paracentrotus lividus,
Lamarck) gonads by GC– MS using dynamic headspace sampling and microwave desorption.
European Food Research and Technology, 212(6), 643-647.
Di Giuseppe, D., Crippa, A., Orsini, N., & Wolk, A. (2014). Fish consumption and risk of rheumatoid
arthritis: a doseresponse meta-analysis. Arthritis research & therapy, 16(5), 446.
Díaz‐Tenorıo, L. M., García‐Carreño, F. L., & Pacheco‐Aguılar, R. A. M. Ó. N. (2007). Comparison of
freezing and thawing treatments on muscle properties of whiteleg shrimp (Litopenaeus vannamei).
Journal of Food Biochemistry, 31(5), 563-576.
Diez-Simon, C., Mumm, R., & Hall, R. D. (2019). Mass spectrometry-based metabolomics of volatiles as a
new tool for understanding aroma and flavour chemistry in processed food products. Metabolomics,
15(3), 1-20.
Domínguez, R., Pateiro, M., Gagaoua, M., Barba, F. J., Zhang, W., & Lorenzo, J. M. (2019). A
comprehensive review on lipid oxidation in meat and meat products. Antioxidants, 8(10), 429.
Edirisinghe, R. K., Graffham, A. J., & Taylor, S. J. (2007). Characterisation of the volatiles of yellowfin tuna
(Thunnus albacares) during storage by solid phase microextraction and GC–MS and their
relationship to fish quality parameters. International journal of food science & technology, 42(10),
1139-1147. FAO, (2020a).
Food and Agriculture Organization of the United Nations, Fisheries and Aquaculture Department,
Katsuwonus pelamis (Linnaeus, 1758) http://www.fao.org/fishery/species/2494/en
FAO, (2020b). Food and Agriculture Organization of the United Nations, Fisheries and Aquaculture
Department, Thunnus albacares (Bonnaterre, 1788). http://www.fao.org/fishery/species/2497/en
FAO/WHO, 2010 Report of the Joint FAO/WHO Expert Consultation on the Risks and Benefits of Fish
Consumption. Rome, 25-29 January 2010.
Farid, F. B., Latifa, G. A., Nahid, M. N., & Begum, M. (2014). Effects of Sun‒drying on proximate
composition and pH of Shoal fish (C. striatus; Bloch, 1801) treated with Salt and Salt‒turmeric
storage at Room Temperature (27° C‒30° C). Journal of Agriculture and Veterinary Science, 7(9), 1-

International Conference on
RAW MATERIALS TO PROCESSED FOODS 03-04 June 2021, Turkey
82
8.
Farmer, L. J., McConnell, J. M., & Graham, W. D. (1997). Flavor characteristics and lipid composition of
Atlantic salmon.
Fromentin, J. M., & Fonteneau, A. (2001). Fishing effects and life history traits: a case study comparing
tropical versus temperate tunas. Fisheries Research, 53(2), 133-150.
Ganguly, S., Mahanty, A., Mitra, T., Raman, R. K., & Mohanty, B. P. (2017). Volatile compounds in hilsa
(Tenualosa ilisha, Hamilton) as detected by static headspace gas chromatography and mass
spectrometry. Journal of Food Processing and Preservation, 41(6), e13212.
Geusens, P., Wouters, C., Nijs, J., Jiang, Y., & Dequeker, J. (1994). Long‐term effect of omega‐3 fatty acid
supplementation in active rheumatoid arthritis. Arthritis & Rheumatism: Official Journal of the
American College of Rheumatology, 37(6), 824-829.
Howgate, P., Mackie, P. R., Whittle, K. J., & Farmer, J. (1977). Petroleum tainting in fish. Rapports et
Procès-Verbaux des Réunions du Conseil Permanent International pour l'Exploration de la Mer.
IATTC (2019) Tunas, billfishes and other pelagic species in the eastern Pacific Ocean in 2018 Inter-
Am Trop Tuna Comm Fish Status Rep 17 La Jolla CA USA
Iglesias, J., Medina, I., Bianchi, F., Careri, M., Mangia, A., & Musci, M. (2009). Study of the volatile
compounds useful for the characterisation of fresh and frozen-thawed cultured gilthead sea bream
fish by solid-phase microextraction gas chromatography–mass spectrometry. Food Chemistry,
115(4), 1473-1478.
Ingemansson, T., Kaufmann, P., & Ekstrand, B. (1995). Multivariate evaluation of lipid hydrolysis and
oxidation data from light and dark muscle of frozen stored rainbow trout (Oncorhynchus mykiss).
Journal of Agricultural and Food Chemistry, 43(8), 2046-2052.
Ishiguro, K., Wakabayashi, H., & Kawaguchi, H. (2001). Changes in volatile compounds during smoking
process and evaluation of major aroma constituents of dried bonito (katuo-bushi). Journal of the
Japanese Society for Food Science and Technology (Japan). ISSF, (2015). ISSF tuna stock status
update, 2015: status of the world fisheries for tuna. ISSF Tech. Rep. 03A, 1-96.
International Conference on
RAW MATERIALS TO PROCESSED FOODS 03-04 June 2021, Turkey
83
Reduced Salt Spanish Style Green Table Olives (cv. Chalkidiki) Preserved in
Flavored Olive Oil
Maria Papapostolou1, Fani Th. Mantzouridou1,2, Maria Z. Tsimidou1,2
1Laboratoty of Food Chemistry and Technology (LFCT), School of Chemistry, Aristotle University of Thessaloniki
(AUTh), 54124 Thessaloniki, Greece 2Natural Products Research Center of Excellence (NatPro-AUTH), Center of Interdisciplinary Research and Innovation
(CIRI-AUTH), 57001 Thessaloniki, Greece
E-mail: [email protected], Tel.: +302310997792
ABSTRACT
The study aimed at examining whether olive oil flavored with essential oils (EOs) can be used as a
preservation means for reduced salt Spanish style green table olives (cv. Chalkidiki). Traditional green table
olives (cv. Chalkidiki) are an asset among Greek products exported to Europe and elsewhere. Due to their
high salt content (fermentation and storage in brine), research efforts focus on reformulation strategies that
will balance lower salt content, safety and consumer acceptance. Response surface methodology was applied
to organize experimentation and assess data. The EOs used (oregano, lemon balm and bay laurel) are known
for their antimicrobial properties and are common seasoning materials for food preparations and salads in the
Greek cuisine. Oregano EO is known for the presence of strong antioxidants and antimicrobials such as
thymol and carvacrol whereas lemon balm and bay laurel EOs are known for their strong antimicrobial
activity due to a variety of non-phenolic terpenoids. The time span set in the experimental design was 1 to 12
month(s). Microbiological parameters (pathogens and fermentation-related microbes), color and firmness
attributes, were the responses examined in this experimental design that aimed at extending the effort to
introduce a tailor-made reduced salt table olives product into the market. Each EO was found to exert a
preservative role to maintain microbiological quality of the new product not in expense to its appearance
attributes, which were maintained at desirable values. Oregano EO had a profound role against pathogens.
Lemon balm and bay laurel EOs were found to be important for yeast population control. The results are
promising toward the efforts of the local industry to adopt current global nutritional priorities and consumer
preferences for natural preservatives.
Keywords: Essential oils, flavored olive oil, olives cv. Chalkidiki, Spanish style reduced salt green table olives
References:
1. Mastralexi, A., Mantzouridou, F. T., & Tsimidou, M. Z. (2019). Evolution of safety and other quality parameters
of the Greek PDO table olives “Prasines Elies Chalkidikis” during industrial scale processing and storage.
European Journal of Lipid Science and Technology, 121(3), 1800171.
2. WHO, Guideline: Sodium Intake for Adults and Children, Geneva, Switzerland, 2012.
Acknowledgment: This research has been co‐financed by the European Union and Greek national funds through the
Operational Program Competitiveness, Entrepreneurship and Innovation, under the call RESEARCH – CREATE –
INNOVATE (project code: T1EDK-04174)
International Conference on
RAW MATERIALS TO PROCESSED FOODS 03-04 June 2021, Turkey
84
Application of Response Surface Methodology (RSM) to Optimize the
Concentrations of Essential Oils in Olive Oil Used as a Preservation Means for
Reduced Salt Green Table Olives
Maria Papapostolou1, Fani Th. Mantzouridou1,2, Maria Z. Tsimidou1,2
1Laboratoty of Food Chemistry and Technology (LFCT), School of Chemistry, Aristotle University of Thessaloniki
(AUTh), 54124 Thessaloniki, Greece 2Natural Products Research Center of Excellence (NatPro-AUTH), Center of Interdisciplinary Research and Innovation
(CIRI-AUTH), 57001 Thessaloniki, Greece
E-mail: [email protected], Tel.: +302310997792
ABSTRACT
RSM is applied to study the relationships between independent (factors) and dependent variables (responses)
with the main objective to obtain an optimal response. This statistical approach is widely used to optimize
food manufacturing processes (e.g. extraction). The central composite design (CCD) is typically used to
build a second-order model for the response variable in a cost-effective way, ensured by less experimental
runs. In the present study, a CCD was adopted to examine the optimum combination of concentrations of
specific essential oils (EOs) used as preservative agents in a tailor-made reduced salt table olives product.
Olive oil served as the EO carrier. As factors, the concentrations of the EOs used (oregano, lemon balm and
bay laurel) and time of storage under vacuum were set. Selection of EOs levels (oregano: 0-1%, w/w; lemon
balm and bay laurel: 0-0.5%, w/w each) to prepare the flavored olive oils was based on minimum inhibitory
concentration (MIC) values for pathogens and fermentation-related microbes as well as olfactory thresholds
of EOs major volatiles. The annual production of table olives determined the time span of the experiment
(time: 1-12 months). Second-order models were fitted to the experimental data of Staphylococcus, lactic acid
bacteria, yeasts, chroma (C*), hue (h*) and firmness responses. The simplified form of models showed that:
(a) oregano EO was determinant for the safety of the product, (b) lemon balm and bay laurel EOs managed
to control the yeast population while (c) appearance attributes remained almost unaffected. The predicted
values for the responses after applying the optimization approach, seem encouraging toward the direction of
the production of tailor-made reduced salt table olives preserved under mild conditions.
Keywords: Essential oils, food safety, reduced-salt table olive preservation, response surface methodology
References:
Yolmeh, M., & Jafari, S. M. (2017). Applications of response surface methodology in the food industry processes.
Food and Bioprocess Technology, 10(3), 413-433.
Acknowledgment: This research has been co‐financed by the European Union and Greek national funds through the
Operational Program Competitiveness, Entrepreneurship and Innovation, under the call RESEARCH – CREATE –
INNOVATE (project code: T1EDK-04174)

International Conference on
RAW MATERIALS TO PROCESSED FOODS 03-04 June 2021, Turkey
85
Reduction or Partial Substitution of NaCl: What Effects Sensory and
Biochemical Properties of Semi-Hard Cheeses
Bord, C1, Loudiyi1, M, Aït-Kaddour A1.
1Université Clermont Auvergne, INRAE, VetAgro Sup, UMRF, 15000 Aurillac, France
Tel: +33 (0)4 73 98 13 78, Fax: +33 (0)4 73 98 13 90 [email protected]
ABSTRACT
Salt plays a fundamental role in human physiology, but an excessive intake can generate various diseases
(e.g. hypertension). In the recent decades, the NaCl reduction has become a priority for the public health and
a challenge for the food industries and particularly in dairy industry because cheese has a high sodium
content.
In this study, the impact NaCl reduction or its partial substitution with KCl on sensory and biochemical
properties was investigated on semi-hard cheeses (Cantal-type cheese a traditional French cheese). Five
formulations of cheeses were manufactured using 2% (Wt/Wt) salt content in the following proportions:
C100 (100% NaCl- control cheese), R50 (50% NaCl), R25 (25%NaCl), S50 (50:50 NaCl:KCl), S25 (75
NaCl:25KCl) and ripened for 30 days. Biochemical parameters (e.g. dry matter, chloride content, protein,
fat) were measured by standard methods and sensory features (i.e. appearance, aroma, taste and texture) were
evaluated by a trained panel on a 10 cm-unstructured scale intensity.
After using different statistical methods (e.g. PCA, ANOVA) the results demonstrated that salt content of
cheeses affected sensory properties, in particular, texture and visual features. In comparison to the control,
R25 cheese showed the lowest firmness and the highest melting, sticky and dry texture. Regarding the salty
perception, substituted cheese had a similar salty taste compared to the control cheese (C100). On the
contrary, R25 and S50 cheeses presented lower saltiness. Moreover, several biochemical parameters
(proteolysis, mineral content-Ca, P or K-) were affected by the reduction or the substitution of Na content.
Overall, despite of some observed modifications on the biochemical characteristics, the NaCl reduction in
cheese with partial substitution at a level of 25% and 50% by KCl may be a suitable alternative to preserve
cheeses standard sensory qualities.
Keywords: Semi-hard cheeses; salty perception, sensory properties, biochemical parameters

International Conference on
RAW MATERIALS TO PROCESSED FOODS 03-04 June 2021, Turkey
86
Delineation of Molecular Structure Modification of Camel Milk and Cow Milk
Mixtures during Coagulation by 2D-cross Correlation Spectroscopy Coupled
with Molecular Fluorescence Spectroscopy
Oumayma Boukria1, El Mestafa El Hadrami1, Jasur Safarov2, Shakhnoza Sultanova2, Françoise
Leriche3, Abderrahmane Aït-Kaddour3*
1Applied Organic Chemistry Laboratory, Sciences and Techniques Faculty, Sidi Mohamed Ben Abedallah University,
BP 2202 route d’Immouzer, Fès, Morocco 2Tashkent state technical university named after Islam Karimov, 100095, 2, str. Universit, Tashkent, Uzbekistan
3Université Clermont Auvergne, INRAE, VetAgro Sup, UMRF, F-63370, Lempdes, France
*E-mail: [email protected]
ABSTRACT
Synchronous fluorescence spectroscopy (SFS) coupled with two-dimensional correlation spectroscopy
(2DCOS) was employed to evaluate the impact of five mixture ratios of camel’s milk (CaM) and cow’s milk
(CM) (100% CaM, 75%CaM:25%CM, 50%CaM:50%CM, 25% CaM:75%CM and 100% CM) in order to
appraise the development of a rapid, accurate and feasible analysis method to monitor milk and to distinguish
between molecular structure difference in the milk formulations during coagulation. This study demonstrated
that 2DCOS-SFS is a successful strategy to discriminate milk mixtures and to monitor molecular structure
modifications during coagulation process. The dissimilarities among the different formulations are clearly
observed on the synchronous 2DCOS-SFS. In addition, according to the cross-peak symbols in synchronous
and asynchronous spectra, the response speed of modification in riboflavin, protein and vitamin A
corroborated with common coagulation phenomena usually reported during chymosin coagulation (360 nm -
riboflavin/lumichrome- > 450 nm -riboflavin- > 403 nm -aldehydes and amino acids - > 298 nm –
tryptophan- > 322 nm-vitamin A-).
Keywords: milk, mixture, spectroscopy, two-dimensional correlation spectroscopy
International Conference on
RAW MATERIALS TO PROCESSED FOODS 03-04 June 2021, Turkey
87
Biofilms Obtained from an Enriched Arabinoxylan Fraction. Estimation of
Thermodynamic Parameters by Thermal Analysis
Yari Jaguey-Hernández1, Araceli Castañeda-Ovando1, Karina Aguilar-Arteaga2, Luis Guillermo
González-Olivares1, Javier Añorve-Morga1, Nelly Cruz-Cansino3
1Chemistry Department, Universidad Autonoma del Estado de Hidalgo, Carr. Pachuca-Tulancingo km 4.5, 42184,
Mineral de la Reforma, Hgo., Mexico 2Agro-Industrial Engineering Department, Universidad Politécnica de Francisco I. Madero, Carr. Tepatepec-San Juan
Tepa km 2, 42660, Francisco I. Madero, Hgo., Mexico 3Nutrition Department, Universidad Autonoma del Estado de Hidalgo, Circuito Ex Hacienda La Concepción
S/N, Carr. Pachuca-Actopan, 42160, San Agustín Tlaxiaca, Hgo., Mexico. [email protected]
ABSTRACT
Biopolymers have gained importance as a raw material to develop sustainable materials, due to their natural
origin. Biopolymers from vegetable origin, like polysaccharides, can be extracted from by-products of the
food industry. Brewers' spent grain (BSG) is a by-product of the brewing industry, which is rich in
hemicellulose, including arabinoxylans (AXs). AXs have the capacity to form films, with properties that
favor their use in pharmaceutical, cosmetic, and food industry, as coating or support materials, or matrices
for release of compounds. However, the thermal stability of these films is needed to take advantage of their
properties, in order to be used in a certain temperature range, and without the risk of decomposition.
Therefore, the aim of this work was to evaluate the thermal stability of thermoplastic films prepared from a
fraction rich in AX (BSG-AX) obtained from by brewers' spent grain (BSG). For this, several films were
formulated, in which, plasticizers (polyethylene glycol and glycerol) were added to increase their
decomposition temperature. The thermograms were obtained, subsequently, the pyrolysis evaluation was
carried out near decomposition temperature (258.17-309.83°C) and the kinetic was analyzed using the Coats-
Redfern model, showing that the experimental curves were adjusted to first-order and second-order.
Additionally, activation energy (Ea), Gibbs free energy, enthalpy and entropy were calculated from this
model. According to the results, the thermoplastic films showed greater thermal stability than the films
prepared only with BSG-AX; in fact, the plasticizer addition improves the stability of the films, due to
increase their activation energy by up to 43%.
Keywords: Arabinoxylans, Biofilms, Thermal stability, Thermogravimetric analysis.
International Conference on
RAW MATERIALS TO PROCESSED FOODS 03-04 June 2021, Turkey
88
Delineation of Molecular Structure Modification During Coagulation of Mixed
Camel and Cow Milk by Mid-Infrared Spectroscopy and Parallel Factor
Analysis
Boukria, O., Wang, J., Safarov, J., Gharsallaoui, A., Leriche, F., El Hadrami, E. M., Aït-Kaddour, A
1A Applied Organic Chemistry Laboratory, Sciences and Techniques Faculty, Sidi Mohamed Ben Abedallah University,
BP 2202 route d’Immouzer, Fès, Morocco. 2University of Lyon, Université Claude Bernard Lyon 1, CNRS, LAGEPP UMR 5007, 43 Bd 11 Novembre 1918, 69622,
Villeurbanne, France. 3Tashkent state technical university named after Islam Karimov, 100095, 2, str. Universit, Tashkent,
Uzbekistan 4Université Clermont-Auvergne, INRAE, VetAgro Sup, F-63370 Lempdes, France.
Tel: (33) 4 73 98 13 78, [email protected]
ABSTRACT
Molecular structure modifications of camel milk (CaM) and cow milk (CM) mixtures during coagulation
were investigated combining mid-infrared (MIR) spectroscopic monitoring with Parellel Factor Analysis
(PARAFAC) and particle size measurements. To evaluate the structure evolution at a molecular level, five
different milk formulations were prepared using the following volume fractions of CaM in the mixtures:
100%, 75%, 50%, 25%, and 0%. Regarding MIR spectroscopy, wavelength ranges located between 3000–
2800 cm–1 corresponding to fatty acids, 1700 and 1500 cm−1 related to amide I and II bands and 1500–900
cm−1 region called fingerprint region were considered for the characterization of milk coagulation kinetics.
MIR spectroscopy with PARAFAC allowed identifying the modifications at a molecular level depending on
the coagulation time and milk composition. This was also confirmed by canonical correlation analysis (CCA)
that showed a high correlation level between the casein particle size distributions and MIR spectra measured
during coagulation.
Keywords: Coagulation, Milk, MIR Spectroscopy, PARAFAC analysis, Particle size.
International Conference on
RAW MATERIALS TO PROCESSED FOODS 03-04 June 2021, Turkey
89
Functional Food Formulated with Food Industry By-Product
Meric Simsek1*, Özge Süfer1
1 Department of Food Engineering, Osmaniye Korkut Ata University, Osmaniye, Turkey
E-mail: [email protected], Telephone: 0328-827-1000/3661, fax: 0328-825-0097
ABSTRACT
The valorization of fruit or vegetable by-products particularly in cereal products has been growingly
increasing and attracting the interest of researchers and food producers. Olive pomace has been well known
its bioactive and both soluble and non-soluble fiber content. Therefore, this study aimed at formulating the
breadstick with olive pomace which was the by-product of olive oil processing and analyzed the effects of
olive pomace addition on the physicochemical, bioactive and sensorial properties of product. While the
control breadstick was formulated with wheat flour, other formulations was obtained with the replacement of
wheat flour with olive pomace at the ratio of 5, 7.5 and 10 %. Olive pomace preparation involved its
obtainment from olive oil plant, drying under sun and grinding. Final olive pomace had 10.03 ± 0.01% of
moisture content, 4.60 ± 0.04% of ash content and 15.78 ± 0.02% of fat content and 57.96 ± 1.26% of total
dietary fiber (on wet basis). Total phenolic content was determined using Folin-Ciocalteu method and
antioxidant activity was detected by 1,1-diphenyl-2-picrylhydrazyl (DPPH) test. The addition of olive
pomace reduced L* and b* of products and increased significantly total phenolic content and antioxidant
activity. The highest total phenolic content and antioxidant activity was found as 1.04 ± 0.09 mg gallic acid
equivalent, GAE/g dry matter, DM and 8.14 ± 0.23 µmol trolox equivalent, TE/g DM in product containing
10% olive pomace. In sensorial analysis, products with 10% olive pomace resulted in lower scores in terms
of taste, color, appearance, and as well overall acceptability compared to products containing 5 and 7.5%
olive pomace. As a result, the use of olive pomace in foods has a great potential to produce functional foods.
Keywords: Bioactive, by-product, functional food
International Conference on
RAW MATERIALS TO PROCESSED FOODS 03-04 June 2021, Turkey
90
An Assessment of Using Pea and Brown Rice Proteins to Formulate Flexitarian
and Vegan Burger Patties
Burcu Öztürk-Kerimoğlu*, Şimal Bakınay, İrem Nur Öget
Food Engineering Department, Engineering Faculty, Ege University, 35100, Bornova, Izmir, Turkey
*E-mail: [email protected]
ABSTRACT
The present research focused on the development of vegan and flexitarian burger patty formulations utilizing
pea protein (PP) and brown rice protein (BRP). Five different formulations were prepared as follows: A
control formulation that contained 100% beef (C), two flexitarian formulations that contained 50% beef +
50% PP (F-PP) and 50% beef + 35% PP + 15% BRP (F-PPR), and two vegan formulations that contained
100% PP (V-PP) and 70% PP + 30% BRP (V-PPR). Higher moisture content was recorded in V-PP samples
compared with C samples, and the addition of BRP was effective to decrease moisture (p < 0.05). F-PPR and
V-PPR samples had the highest protein content among treatments (p < 0.05). The lowest fat content
belonged to V-PPR patties (p < 0.05). The lowest L* value belonged to C patties while V-PPR patties gave
the highest L* values (p < 0.05). a* values of the samples generally did not differ except F-PPR samples,
while the highest b* values were recorded in vegan groups (p < 0.05). Vegan patties had lower hardness,
springiness, cohesiveness, and chewiness compared with that of control samples (p < 0.05). Addition of BRP
to vegan formulations resulted in a harder texture when compared with using PP alone (p < 0.05). V-PP and
V-PPR patties showed higher moisture and fat retention and lower diameter reduction, while F-PP patties
had higher cook yield compared to that of C patties (p < 0.05). Cook yield of V-PPR samples was also higher
than that of C samples (p < 0.05). Although texture scores of C patties were the highest among samples and
flavor of C samples was also higher than in vegan samples (p < 0.05), no differences were obtained in
appearance, juiciness, and overall impression scores. Consequently, the findings of the study were
encouraging for the development of flexitarian and vegan burger patties by utilization of PP enriched with
BRP that could provide products having nutritious and technological advantages as well as acceptable
sensory quality.
Keywords: meat analog, healthier meat products, sustainable diet, vegetable protein, non-meat protein
INTRODUCTION
The human population across the world is increasing exponentially with each passing year, and it is
estimated that the global population will rise to ten billion by 2050 (Hellwig et al., 2020). Within this
context, the necessity of providing sustainable, nutritious, and high value-added foods that will protect both
the environment and the life of other living creatures comes to the fore. The world’s first scientific targets on
healthy and sustainable food systems were determined by the EAT-Lancet Commission in 2019, a diet under
the name of “planetary health diet” was designed within the scope of these goals, and the daily consumption
ranges of each food group were defined in this diet. The main purpose of this diet is to increase the amount
of high-quality vegetable protein consumed and to reduce animal origin foods (Bánáti, 2020).
Despite the fact that meat is a major source of high biological valued proteins, valuable nutrients, and various
health-promoting compounds such as bioactive hydrolysates, connective tissue components, conjugated
linoleic acids, and antioxidants (Öztürk and Serdaroğlu, 2017), it could not be regarded as a sustainable food
source. Animal-based protein is mentioned as problematic since increased numbers of livestock could cause
water depletion, climate changes, disruption of phosphorus cycle, nitrogen cycle, and biodiversity, as well as
could seriously influence human health and animal welfare (Michel et al., 2021). Therefore, the multifaceted

International Conference on
RAW MATERIALS TO PROCESSED FOODS 03-04 June 2021, Turkey
91
pressure on animal meat production has encouraged many consumers to reduce meat consumption in their
diets. Besides, today further-processed meat products are less preferred by consumers due to high amounts of
animal fat, cholesterol, saturated fatty acids, and additives that could trigger certain health risks (Öztürk and
Serdaroğlu, 2017). In this context, consumers have started to change their eating habits by adopting new diet
styles. Considering all the factors mentioned above, it is necessary to substitute meat and meat-origin
ingredients by utilizing healthy and nutritious non-meat protein sources.
Individuals who desire to completely stop or limit their meat consumption adopt different diets. Vegan
consumers are “strict vegetarians”. Veganism is defined as a lifestyle and a nutrition form in which any
animal products including secondary ones (egg, milk, and their products) cannot be used and consumed
(Tunçay, 2018). Apart from this, a sizeable group of people who limits their meat intake yet still include
meat in their diets. Those flexibly vegetarian individuals are called “flexitarians” (Rosenfeld et al., 2020).
Pea protein (PP) is an emerging alternative to soy protein due to its high adaptability, hypo-allergenicity, and
high functionality, and is often used in combination with other sources to improve the nutritional and textural
properties of meat analogs (Boukid, 2020). Legumin and visillin, which constitute 65-80% of the total
proteins in peas show high emulsifying properties (Liang and Tang, 2013). Brown rice protein (BRP) is
another important alternative as a high-quality protein source, having a total amount of amino acids around
78%, and 36% of the proteins in its structure consist of essential amino acids and 18% of branched-chain
amino acids (Kalman, 2014).
In the light of the above-mentioned information, no study has yet been conducted regarding the utilization of
PP and BRP to substitute meat in burger patty formulations. Therefore, the present work aimed to investigate
the chemical, physical, technological, textural, and sensory quality of vegan and flexitarian burger patties
formulated with PP enriched with BRP.
MATERIAL AND METHODS Post-rigor aitchbone was purchased from a local butcher located in Izmir (Turkey) and transported to the
laboratory maintaining the cold chain. Granular PP (Veggy®, 66.5% protein, 16.9% carbohydrate, 7.6% lipid,
4.5% fiber) was provided from Vegan Dükkan (Istanbul, Turkey) while BRP concentrate (80% protein, 3.8%
fiber, 3.8% carbohydrate, 3.5% lipid) was purchased from Proteinocean Food Co. (Ankara, Turkey). Smoke
flavor, yeast extract, and garlic powder were supplied from Smart Chemicals Co. (Izmir, Turkey), soy
protein was supplied from Kimbiotek Chemicals Co. (Istanbul, Turkey), and red beetroot powder was
purchased from Sultanveli Organic Food Market (Izmir, Turkey). The rest of the ingredients and spices were
bought from local market. All the chemicals used in the analysis were analytical grade (Merck KGaA,
Germany).
Experimental design and production of burger patties In the trial, five different burger patty formulations were prepared. Accordingly, a control treatment (C)
containing 100% beef was formed, and flexitarian and vegan treatments were prepared by replacing beef
with 50% or 100% vegetable proteins. In those treatments, PP was used either alone (50%) or in combination
with BRP (35% PP plus 15% BRP). In the production of the C group, minced beef (3 mm) was mixed with
olive oil, salt, spices, and other ingredients in a food processor (Vorwerk, Termomix, Germany) at 200 rpm
for 2.5 min. Except for the C group, hot water (1:3) was added to PP to obtain a protein paste to be further
used in flexitarian and vegan treatments. For the production of flexitarian groups, minced meat and PP paste
were firstly mixed at 100 rpm for 1 min. Afterward, breadcrumbs (10%), soy protein isolate (8%), onion
powder (1.5%), olive oil (1.5%), salt (1.5%), red beetroot powder (0.2%), garlic powder (0.15%), yeast
extract (0.15%), smoke flavor (0.1%), sugar (0.1%), and other spices (7.5%) were added, and mixing was
continued at 200 rpm for 2 min. Meanwhile, vegan groups were prepared by mixing the PP paste with other
ingredients at 200 rpm for 2 min. In the formulations enriched with BRP, this protein was mixed with the PP
paste at 200 rpm for 2 min prior to the addition of other ingredients. After that, the rest of the ingredients
were added, and mixing was carried out as mentioned above. After all the processes, water was added to
each formulation in the amount determined as a result of preliminary trials, and mixing was done at 200 rpm
for an additional 2.5 min.
The dough obtained was portioned using stainless steel molds (9 cm diameter and 1.5 cm height). The patties
were then cooked in a fan oven heated at 165°C on non-flammable and non-stick baking papers until the core

International Conference on
RAW MATERIALS TO PROCESSED FOODS 03-04 June 2021, Turkey
92
temperature reached 73°C. The samples were then immediately cooled to room temperature and afterward
were kept at 4°C before the analysis.
Methods Total moisture (oven drying), protein (Kjeldahl), and ash (dry combustion) contents were determined
according to AOAC (2012). Total fat content was analyzed by chloroform-methanol extraction (Flynn and
Bramblett, 1975). Total carbohydrate content was proportionally calculated over the chemical composition.
pH value was measured using a portable pH-meter (WTW pH 330i/SET, Germany). CIELAB color
parameters (luminosity-L*, redness-a*, and yellowness-b*) were measured using a portable colorimeter
(Konica Minolta, CR-200, Japan). Hardness (N), springiness (mm), cohesiveness, and chewiness (N × mm)
of the samples (3×3×1.5 cm) were determined with a TA-XT2 texture analyzer (Stable Micro Systems, UK)
using a post-test speed of 2 mm/s, a crosshead speed of 1 mm/s, and a test speed of 1 mm/s with 30 kg of a
load cell.
Moisture retention, fat retention, cooking yield, and reduction in diameter were calculated according to
Serdaroğlu et al. (2018) for assessment of technological quality. Sensory evaluation was performed with 8
trained panelists who were asked to score the samples in terms of appearance, texture, flavor, juiciness, and
overall impression on a five-grade scoring scale. Patties were served warmed to panelists after they with
randomly coded 3-digit numbers.
Data were statistically analyzed using SPSS statistical package program (IBM, version 21.0, USA). The
intergroup comparison of the means was achieved with one‐way analysis of variance (ANOVA), and
Duncan’s Post-hoc test was used significance was determined. Probability values (p < 0.05) were considered
statistically significant.
RESULTS and DISCUSSION
Chemical composition The proximate composition and pH of the patties are presented in Table 1. V-PP samples had higher
moisture content than C samples, whilst the lowest moisture was recorded in F-PPR (p < 0.05). In both
flexitarian and vegan treatments, the addition of BRP was effective to decrease moisture (p < 0.05), which
could be attributed to the increase in dry matter content. Accordingly, F-PPR and V-PPR patties had the
highest protein content among treatments (p < 0.05). This result was a good indicator of protein enhancement
when BRP was introduced to both flexitarian and vegan formulations. Similarly, Razavizadeh et al. (2019)
reported increased protein content in vegan burger patties formulated with fermented soy press cake (okara).
The lowest fat content belonged to vegan patties with PP and BRP, and carbohydrate content was also higher
in that samples compared with C (p < 0.05), while the rest of the samples had similar fat and carbohydrate
contents when compared with control samples. Ash content of the samples did not differ from each other.
Flexitarian and vegan samples solely including PP had higher pH values compared with others (p < 0.05),
but the addition of BRP led to a decrement in pH values. pH values of PP treatments were in agreement with
Moreno et al. (2020) who stated that PP isolate suspensions had pH values close to neutral.
Table 1: Chemical Composition and pH of the Burger Patties
Treatments* Moisture (%) Protein (%) Fat (%) Ash (%) Carbohydrate (%) pH
C 55.44b±0.70 19.33b±0.07 13.20ab±1.24 2.43±0.19 9.60b±0.76 6.33c±0.02
F-PP 56.47ab±1.22 17.47c±0.30 13.11ab±1.26 2.42±0.21 10.53ab±0.59 6.69a±0.05
F-PPR 46.07d±1.19 26.48a±0.63 14.61a±1.00 2.18±0.26 10.65ab±1.48 6.37c±0.09
V-PP 57.61a±0.83 17.23c±0.18 11.61b±0.19 2.41±0.07 11.13ab±1.01 6.76a±0.02
V-PPR 50.72c±1.14 25.69a±1.71 9.65c±0.62 2.20±0.18 11.74a±0.16 6.55b±0.05
*C: Control treatment consisted of 100% beef, F-PP: Flexitarian treatment consisted of 50% beef + 50% PP, F-PPR: Flexitarian treatment consisted
of 50% beef + 35% PP + 15% BRP, V-PP: Vegan treatment consisted of 100% PP, V-PPR: Vegan treatment consisted of 70% PP + 30% BRP.
Data was presented as mean ±standard deviation. a, b, c, d: Different letters within the same column represent a significant difference (p<0.05).
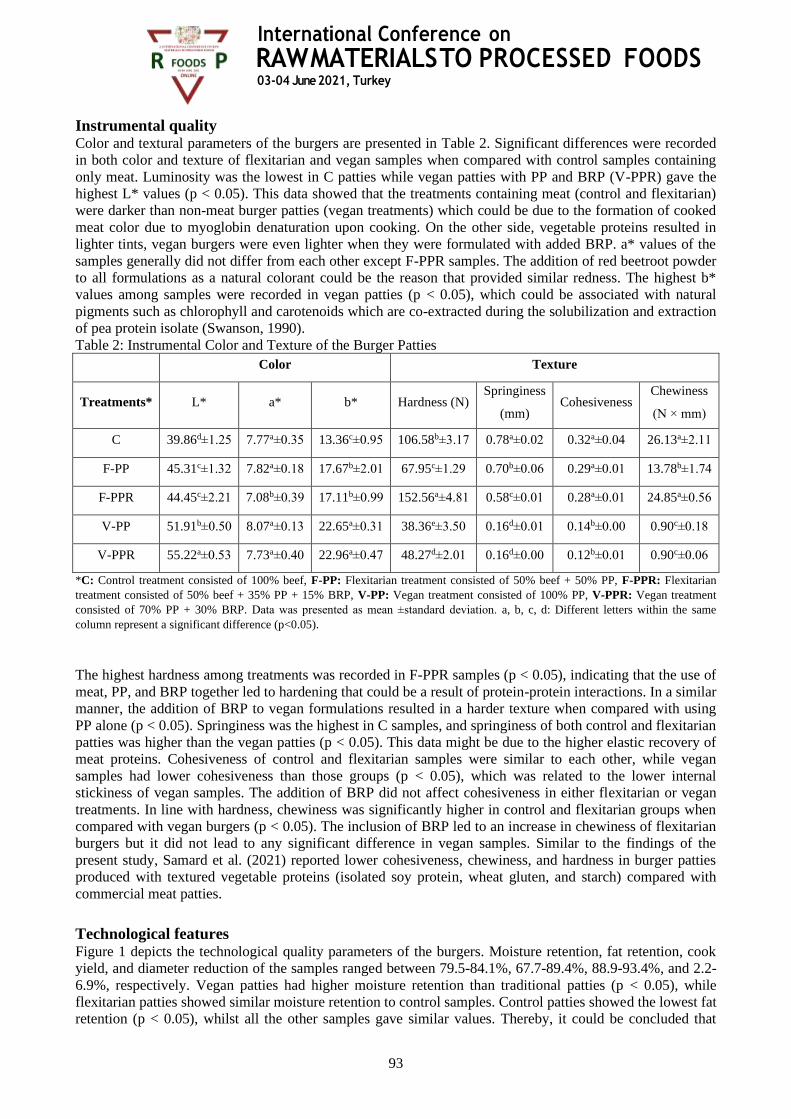
International Conference on
RAW MATERIALS TO PROCESSED FOODS 03-04 June 2021, Turkey
93
Instrumental quality
Color and textural parameters of the burgers are presented in Table 2. Significant differences were recorded
in both color and texture of flexitarian and vegan samples when compared with control samples containing
only meat. Luminosity was the lowest in C patties while vegan patties with PP and BRP (V-PPR) gave the
highest L* values (p < 0.05). This data showed that the treatments containing meat (control and flexitarian)
were darker than non-meat burger patties (vegan treatments) which could be due to the formation of cooked
meat color due to myoglobin denaturation upon cooking. On the other side, vegetable proteins resulted in
lighter tints, vegan burgers were even lighter when they were formulated with added BRP. a* values of the
samples generally did not differ from each other except F-PPR samples. The addition of red beetroot powder
to all formulations as a natural colorant could be the reason that provided similar redness. The highest b*
values among samples were recorded in vegan patties (p < 0.05), which could be associated with natural
pigments such as chlorophyll and carotenoids which are co-extracted during the solubilization and extraction
of pea protein isolate (Swanson, 1990).
Table 2: Instrumental Color and Texture of the Burger Patties
Color Texture
Treatments* L* a* b* Hardness (N) Springiness
(mm) Cohesiveness
Chewiness
(N × mm)
C 39.86d±1.25 7.77a±0.35 13.36c±0.95 106.58b±3.17 0.78a±0.02 0.32a±0.04 26.13a±2.11
F-PP 45.31c±1.32 7.82a±0.18 17.67b±2.01 67.95c±1.29 0.70b±0.06 0.29a±0.01 13.78b±1.74
F-PPR 44.45c±2.21 7.08b±0.39 17.11b±0.99 152.56a±4.81 0.58c±0.01 0.28a±0.01 24.85a±0.56
V-PP 51.91b±0.50 8.07a±0.13 22.65a±0.31 38.36e±3.50 0.16d±0.01 0.14b±0.00 0.90c±0.18
V-PPR 55.22a±0.53 7.73a±0.40 22.96a±0.47 48.27d±2.01 0.16d±0.00 0.12b±0.01 0.90c±0.06
*C: Control treatment consisted of 100% beef, F-PP: Flexitarian treatment consisted of 50% beef + 50% PP, F-PPR: Flexitarian
treatment consisted of 50% beef + 35% PP + 15% BRP, V-PP: Vegan treatment consisted of 100% PP, V-PPR: Vegan treatment
consisted of 70% PP + 30% BRP. Data was presented as mean ±standard deviation. a, b, c, d: Different letters within the same
column represent a significant difference (p<0.05).
The highest hardness among treatments was recorded in F-PPR samples (p < 0.05), indicating that the use of
meat, PP, and BRP together led to hardening that could be a result of protein-protein interactions. In a similar
manner, the addition of BRP to vegan formulations resulted in a harder texture when compared with using
PP alone (p < 0.05). Springiness was the highest in C samples, and springiness of both control and flexitarian
patties was higher than the vegan patties (p < 0.05). This data might be due to the higher elastic recovery of
meat proteins. Cohesiveness of control and flexitarian samples were similar to each other, while vegan
samples had lower cohesiveness than those groups (p < 0.05), which was related to the lower internal
stickiness of vegan samples. The addition of BRP did not affect cohesiveness in either flexitarian or vegan
treatments. In line with hardness, chewiness was significantly higher in control and flexitarian groups when
compared with vegan burgers (p < 0.05). The inclusion of BRP led to an increase in chewiness of flexitarian
burgers but it did not lead to any significant difference in vegan samples. Similar to the findings of the
present study, Samard et al. (2021) reported lower cohesiveness, chewiness, and hardness in burger patties
produced with textured vegetable proteins (isolated soy protein, wheat gluten, and starch) compared with
commercial meat patties.
Technological features Figure 1 depicts the technological quality parameters of the burgers. Moisture retention, fat retention, cook
yield, and diameter reduction of the samples ranged between 79.5-84.1%, 67.7-89.4%, 88.9-93.4%, and 2.2-
6.9%, respectively. Vegan patties had higher moisture retention than traditional patties (p < 0.05), while
flexitarian patties showed similar moisture retention to control samples. Control patties showed the lowest fat
retention (p < 0.05), whilst all the other samples gave similar values. Thereby, it could be concluded that
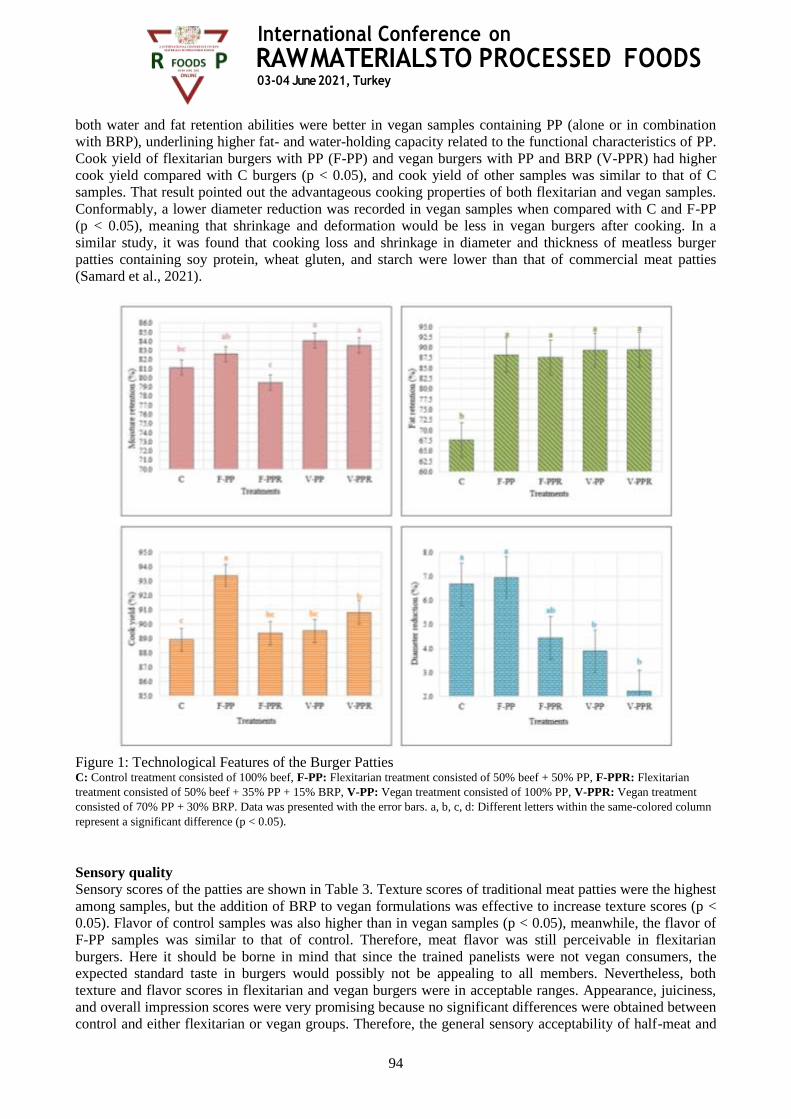
International Conference on
RAW MATERIALS TO PROCESSED FOODS 03-04 June 2021, Turkey
94
both water and fat retention abilities were better in vegan samples containing PP (alone or in combination
with BRP), underlining higher fat- and water-holding capacity related to the functional characteristics of PP.
Cook yield of flexitarian burgers with PP (F-PP) and vegan burgers with PP and BRP (V-PPR) had higher
cook yield compared with C burgers (p < 0.05), and cook yield of other samples was similar to that of C
samples. That result pointed out the advantageous cooking properties of both flexitarian and vegan samples.
Conformably, a lower diameter reduction was recorded in vegan samples when compared with C and F-PP
(p < 0.05), meaning that shrinkage and deformation would be less in vegan burgers after cooking. In a
similar study, it was found that cooking loss and shrinkage in diameter and thickness of meatless burger
patties containing soy protein, wheat gluten, and starch were lower than that of commercial meat patties
(Samard et al., 2021).
Figure 1: Technological Features of the Burger Patties C: Control treatment consisted of 100% beef, F-PP: Flexitarian treatment consisted of 50% beef + 50% PP, F-PPR: Flexitarian
treatment consisted of 50% beef + 35% PP + 15% BRP, V-PP: Vegan treatment consisted of 100% PP, V-PPR: Vegan treatment
consisted of 70% PP + 30% BRP. Data was presented with the error bars. a, b, c, d: Different letters within the same-colored column
represent a significant difference (p < 0.05).
Sensory quality
Sensory scores of the patties are shown in Table 3. Texture scores of traditional meat patties were the highest
among samples, but the addition of BRP to vegan formulations was effective to increase texture scores (p <
0.05). Flavor of control samples was also higher than in vegan samples (p < 0.05), meanwhile, the flavor of
F-PP samples was similar to that of control. Therefore, meat flavor was still perceivable in flexitarian
burgers. Here it should be borne in mind that since the trained panelists were not vegan consumers, the
expected standard taste in burgers would possibly not be appealing to all members. Nevertheless, both
texture and flavor scores in flexitarian and vegan burgers were in acceptable ranges. Appearance, juiciness,
and overall impression scores were very promising because no significant differences were obtained between
control and either flexitarian or vegan groups. Therefore, the general sensory acceptability of half-meat and
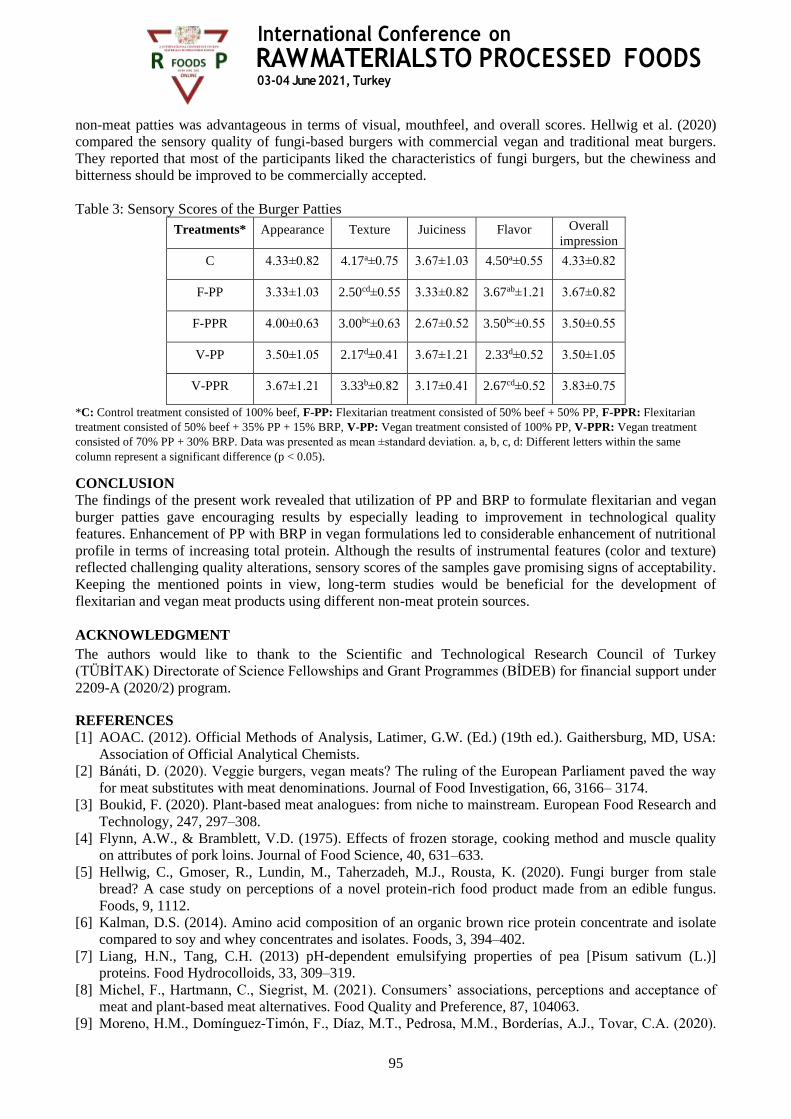
International Conference on
RAW MATERIALS TO PROCESSED FOODS 03-04 June 2021, Turkey
95
non-meat patties was advantageous in terms of visual, mouthfeel, and overall scores. Hellwig et al. (2020)
compared the sensory quality of fungi-based burgers with commercial vegan and traditional meat burgers.
They reported that most of the participants liked the characteristics of fungi burgers, but the chewiness and
bitterness should be improved to be commercially accepted.
Table 3: Sensory Scores of the Burger Patties
Treatments* Appearance Texture Juiciness Flavor Overall
impression
C 4.33±0.82 4.17a±0.75 3.67±1.03 4.50a±0.55 4.33±0.82
F-PP 3.33±1.03 2.50cd±0.55 3.33±0.82 3.67ab±1.21 3.67±0.82
F-PPR 4.00±0.63 3.00bc±0.63 2.67±0.52 3.50bc±0.55 3.50±0.55
V-PP 3.50±1.05 2.17d±0.41 3.67±1.21 2.33d±0.52 3.50±1.05
V-PPR 3.67±1.21 3.33b±0.82 3.17±0.41 2.67cd±0.52 3.83±0.75
*C: Control treatment consisted of 100% beef, F-PP: Flexitarian treatment consisted of 50% beef + 50% PP, F-PPR: Flexitarian
treatment consisted of 50% beef + 35% PP + 15% BRP, V-PP: Vegan treatment consisted of 100% PP, V-PPR: Vegan treatment
consisted of 70% PP + 30% BRP. Data was presented as mean ±standard deviation. a, b, c, d: Different letters within the same
column represent a significant difference (p < 0.05).
CONCLUSION
The findings of the present work revealed that utilization of PP and BRP to formulate flexitarian and vegan
burger patties gave encouraging results by especially leading to improvement in technological quality
features. Enhancement of PP with BRP in vegan formulations led to considerable enhancement of nutritional
profile in terms of increasing total protein. Although the results of instrumental features (color and texture)
reflected challenging quality alterations, sensory scores of the samples gave promising signs of acceptability.
Keeping the mentioned points in view, long-term studies would be beneficial for the development of
flexitarian and vegan meat products using different non-meat protein sources.
ACKNOWLEDGMENT
The authors would like to thank to the Scientific and Technological Research Council of Turkey
(TÜBİTAK) Directorate of Science Fellowships and Grant Programmes (BİDEB) for financial support under
2209-A (2020/2) program.
REFERENCES
[1] AOAC. (2012). Official Methods of Analysis, Latimer, G.W. (Ed.) (19th ed.). Gaithersburg, MD, USA:
Association of Official Analytical Chemists.
[2] Bánáti, D. (2020). Veggie burgers, vegan meats? The ruling of the European Parliament paved the way
for meat substitutes with meat denominations. Journal of Food Investigation, 66, 3166– 3174.
[3] Boukid, F. (2020). Plant-based meat analogues: from niche to mainstream. European Food Research and
Technology, 247, 297–308.
[4] Flynn, A.W., & Bramblett, V.D. (1975). Effects of frozen storage, cooking method and muscle quality
on attributes of pork loins. Journal of Food Science, 40, 631–633.
[5] Hellwig, C., Gmoser, R., Lundin, M., Taherzadeh, M.J., Rousta, K. (2020). Fungi burger from stale
bread? A case study on perceptions of a novel protein-rich food product made from an edible fungus.
Foods, 9, 1112.
[6] Kalman, D.S. (2014). Amino acid composition of an organic brown rice protein concentrate and isolate
compared to soy and whey concentrates and isolates. Foods, 3, 394–402.
[7] Liang, H.N., Tang, C.H. (2013) pH-dependent emulsifying properties of pea [Pisum sativum (L.)]
proteins. Food Hydrocolloids, 33, 309–319.
[8] Michel, F., Hartmann, C., Siegrist, M. (2021). Consumers’ associations, perceptions and acceptance of
meat and plant-based meat alternatives. Food Quality and Preference, 87, 104063.
[9] Moreno, H.M., Domínguez-Timón, F., Díaz, M.T., Pedrosa, M.M., Borderías, A.J., Tovar, C.A. (2020).
International Conference on
RAW MATERIALS TO PROCESSED FOODS 03-04 June 2021, Turkey
96
Evaluation of gels made with different commercial pea protein isolate: Rheological, structural and
functional properties. Food Hydrocolloids, 99, 105375.
[10] Öztürk, B., Serdaroğlu, M. (2017). A rising star prebiotic dietary fiber: Inulin and recent applications
in meat products. Journal of Food and Health Science, 3, 12–20.
[11] Razavizadeh, S., Salaseviciene, A., Alencikiene, G., Vaiciulyte-Funk, L. (2019). Soy-based vegan
burger: from waste to production. X International Agriculture Symposium, Agrosym 2019, Jahorina,
Bosnia and Herzegovina, 3-6 October 2019, 1395–1399.
[12] Rosenfeld, D.L., Rothgerber, H., Tomiyama, A.J. (2020). From mostly vegetarian to fully
vegetarian: Meat avoidance and the expression of social identity. Food Quality and Preference, 85,
103963.
[13] Samard, S., Maung, T.T., Gu, B.Y., Kim, M.H., Ryu, G.H. (2021). Influences of extrusion
parameters on physicochemical properties of textured vegetable proteins and its meatless burger patty.
Food Science and Biotechnology, 30, 395–403.
[14] Serdaroğlu, M., Kavuşan, H.S., İpek, G., Öztürk, B. (2018). Evaluation of the quality of beef patties
formulated with dried pumpkin pulp and seed. Korean Journal for Food Science of Animal Resources,
38, 1–13.
[15] Swanson, B.G. (1990). Pea and lentil protein extraction and functionality. Journal of the American
Oil Chemists’ Society, 67, 276–280.
[16] Tunçay, G.Y. (2018). Health-wise vegan/vegetarianism (in Turkish). Eurasian Journal of Health
Sciences, 1, 25–29.

International Conference on
RAW MATERIALS TO PROCESSED FOODS 03-04 June 2021, Turkey
97
Characterization of Citrus Latifolia by-products (peel and
pomace) and their incorporation effect on the quality of cookies
Ali Tahira, Aliza Zulfiqarb, Miral Javedc*, Nayyar Iqbald, Muhammad Asif Ismaild
a Allied Health Sciences Department, Superior University Lahore, Pakistan bInstitute of Home and Food sciences, Government College University, Faisalabad, Pakistan
c College of Biosystem Engineering and Food Science, Zhejiang University, Hangzhou, P.R. China d College of Food Science and Technology, Huazhong Agricultural University, Wuhan, P.R. China
*E-mail: [email protected]
ABSTRACT
The current study was performed on the waste valorisation of Citrus latifolia. The work evaluated
the chemical composition, phytochemicals and antinutritional properties of Citrus latifolia (CL) peel and
pomace powder. The peel and pomace powders were added in formulation of functional cookies to
investigate the physical and sensory parameters. Four different treatments of CL peel and
pomace were designed by replacing dough as 0%, 5%, 15% and 25% respectively for preparation of cookies.
The cookies were baked at lower temperature 50 oC for long time period (75 min) to prevent the nutritional
loss. The chemical composition results revealed that CL peel powder have more mineral content,
phytochemical and antinutritional composition (P<0.05). This research work is novel in food industry as
nutritional perspectives by using citrus latifolia by-products as natural carrier and reduced the load of citrus
waste.
Keywords: Citrus Latifolia, Functional properties, Cookies, Hadonic Scale, Phytochemicals

International Conference on
RAW MATERIALS TO PROCESSED FOODS 03-04 June 2021, Turkey
98
Liposomal encapsulation of omega-3 and lipoic acid conjugate for cow milk
fortification
Pintu Choudhary, Sayantani Dutta, Moses JA, C. Anandharamakrishnan*
Computational Modelling and Nanoscale Processing Unit, Indian Institute of Food Processing Technology, Ministry of
Food Processing Industries, Government of India, Thanjavur 613005, India
*Email: [email protected]
ABSTRACT
α-Linolenic acid (ALA) and α-lipoic acid (LA) are well known bioactives. However, they are susceptible
to oxidation. The present study was conducted to encapsulate chia oil as the source of ALA and LA, together
in a liposomal formulation, to protect these biomolecules. LA inclusion complex with hydroxyl propyl β-
cyclodextrin exhibited encapsulation efficiency of 86.09±2.17%. The inclusion complex
was characterized using FTIR, NMR, and DSC. Nanoliposome formulated with LA inclusion complex
and chia oil showed encapulation efficiency of 80.24±0.49% and 76.38±0.58%, respectively, with an average
particle size of 52.19±7.0 nm, and moderate repulsion among the particles. Cow milk fortified with LA and
chia oil nanoliposome showed supplementation of 236.16 mg LA and 719.52 mg ALA in one serving (240
mL) of milk. This fortification would contribute to the functionality of cow milk, by improving its nutritional
attributes even further than naturally present.
Keywords: α-lipoic acid, α-linolenic acid, inclusion complex, nanoliposomes, milk fortification
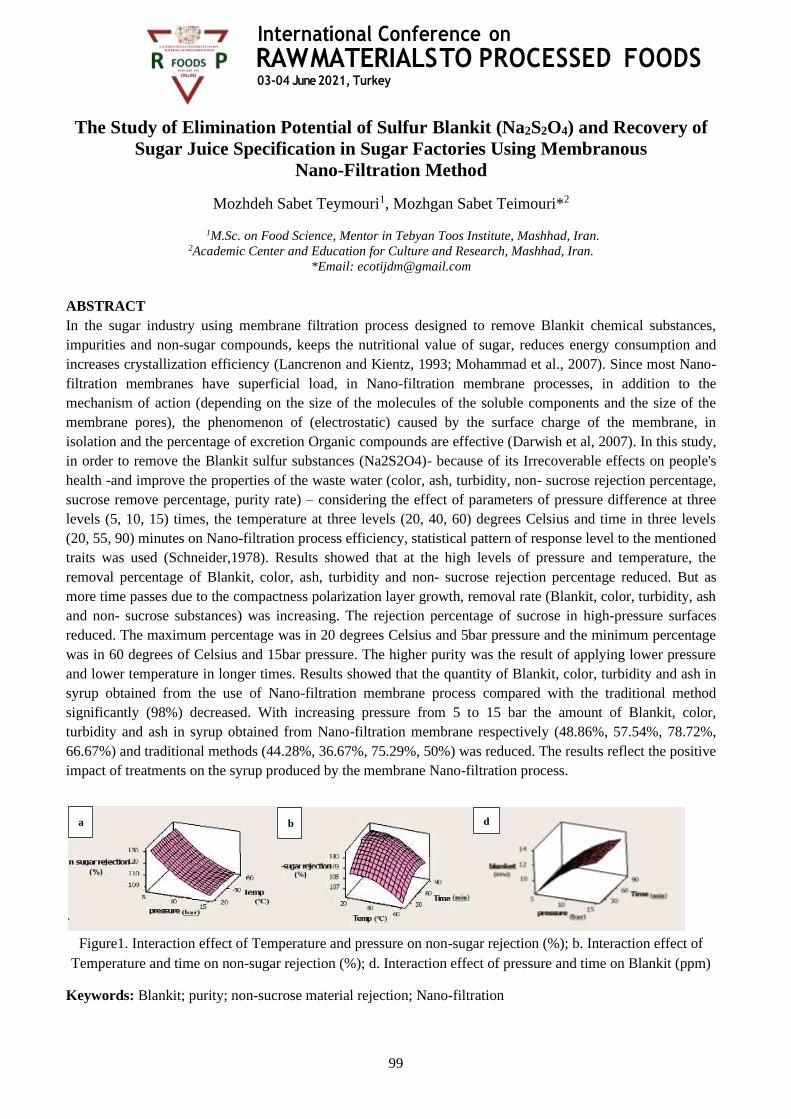
International Conference on
RAW MATERIALS TO PROCESSED FOODS 03-04 June 2021, Turkey
99
The Study of Elimination Potential of Sulfur Blankit (Na2S2O4) and Recovery of
Sugar Juice Specification in Sugar Factories Using Membranous
Nano-Filtration Method
Mozhdeh Sabet Teymouri1, Mozhgan Sabet Teimouri*2
1M.Sc. on Food Science, Mentor in Tebyan Toos Institute, Mashhad, Iran.
2Academic Center and Education for Culture and Research, Mashhad, Iran.
*Email: [email protected]
ABSTRACT
In the sugar industry using membrane filtration process designed to remove Blankit chemical substances,
impurities and non-sugar compounds, keeps the nutritional value of sugar, reduces energy consumption and
increases crystallization efficiency (Lancrenon and Kientz, 1993; Mohammad et al., 2007). Since most Nano-
filtration membranes have superficial load, in Nano-filtration membrane processes, in addition to the
mechanism of action (depending on the size of the molecules of the soluble components and the size of the
membrane pores), the phenomenon of (electrostatic) caused by the surface charge of the membrane, in
isolation and the percentage of excretion Organic compounds are effective (Darwish et al, 2007). In this study,
in order to remove the Blankit sulfur substances (Na2S2O4)- because of its Irrecoverable effects on people's
health -and improve the properties of the waste water (color, ash, turbidity, non- sucrose rejection percentage,
sucrose remove percentage, purity rate) – considering the effect of parameters of pressure difference at three
levels (5, 10, 15) times, the temperature at three levels (20, 40, 60) degrees Celsius and time in three levels
(20, 55, 90) minutes on Nano-filtration process efficiency, statistical pattern of response level to the mentioned
traits was used (Schneider,1978). Results showed that at the high levels of pressure and temperature, the
removal percentage of Blankit, color, ash, turbidity and non- sucrose rejection percentage reduced. But as
more time passes due to the compactness polarization layer growth, removal rate (Blankit, color, turbidity, ash
and non- sucrose substances) was increasing. The rejection percentage of sucrose in high-pressure surfaces
reduced. The maximum percentage was in 20 degrees Celsius and 5bar pressure and the minimum percentage
was in 60 degrees of Celsius and 15bar pressure. The higher purity was the result of applying lower pressure
and lower temperature in longer times. Results showed that the quantity of Blankit, color, turbidity and ash in
syrup obtained from the use of Nano-filtration membrane process compared with the traditional method
significantly (98%) decreased. With increasing pressure from 5 to 15 bar the amount of Blankit, color,
turbidity and ash in syrup obtained from Nano-filtration membrane respectively (48.86%, 57.54%, 78.72%,
66.67%) and traditional methods (44.28%, 36.67%, 75.29%, 50%) was reduced. The results reflect the positive
impact of treatments on the syrup produced by the membrane Nano-filtration process.
Figure1. Interaction effect of Temperature and pressure on non-sugar rejection (%); b. Interaction effect of
Temperature and time on non-sugar rejection (%); d. Interaction effect of pressure and time on Blankit (ppm)
Keywords: Blankit; purity; non-sucrose material rejection; Nano-filtration
a b d
International Conference on
RAW MATERIALS TO PROCESSED FOODS 03-04 June 2021, Turkey
100
Investigation of the Bio-Dynamic Commands Use Effect on Mucilage Content
and Germination Behavior in 3 Ecotype of Basil (Ocimum Sp.)
Mozhgan Sabet Teimouri1
1 Academic Center and Education for Culture and Research, Mashhad, Iran.
E-mail: [email protected]
ABSTRACT
One of the most popular and useable of Aromatic plants are kinds of Basilica (Ocimum sp., Lamiaceae). This
genius has different characteristics in behavior germination. Biodynamic agriculture is a new science in the
research and especially, the position of stars and planet relative to each other, position of moon around the
earth and seasonal change and Solar and lunar eclipses (Steiner, 1924). We must to demonstrative of this
theory. In this experiment, we want to record the effect of based on tow calendars (biodynamic and
Astronomic) on 3 ecotype of Basilica seed germination. The based on this experiment randomized block
design with 3 replications. We use 50 seeds in Falcon tube (value=15ml) and record the weight and value of
seed in tube. Then added 5ml of water in tube and shacked after moisturized and control and record of
Mucilage value and another behavior of seed germination in lab condition. Results showed that different
position of some planets such as moon and Mars and Jupiter had the highest effect, positive and significant
effect on mucilage percent (p>95%), germination speed and length of root. Therefore, we could be express
the lunar position had the highest effect on root length of local type and the lowest effect on purple basil.
Mucilage percentage of seed coat in green basil had the highest content relative to another ecotype and this
content was significant (p>95%). Then, the best suggest for produce of mucilage from the basil seeds, the
best time is the first quadrature of moon.
Keywords: Basil; Bio-dynamic; Germination; Mucilage; ecotype
International Conference on
RAW MATERIALS TO PROCESSED FOODS 03-04 June 2021, Turkey
101
Phytochemical Analysis of Phenolic Compounds, Antioxidant and Anti-
Acetylcholinesterase Activities of Extracts from Eight Populations
of Jatropha curcas L.
Wafa Ghnimia, b, c; Amadou Dickoa; Mohamed Larbi Khoujab, Héla El Ferchichi Ouarda b, c*
a Laboratory of Chemistry and Physics Multi-scale Approach of Complex Environments, (LCP-A2MC), Lorraine
University, 1 Bd Arago-57078 Metz, France. b National Institute for Research in Rural Engineering Water and Forestry, BP N10, Ariana-2080, Tunisia.
c Carthage University, Faculty of Sciences of Bizerta, Jarzouna-7021, Bizerta, Tunisia.
E-mail: [email protected]
ABSTRACT
This study was conducted to evaluate, the phytochemical composition of leaves and roots of eight
populations of Jatropha curcas. Levels of total phenolic contents, total flavonoids, and condensed tannins of
methanolic extracts were determined by UV-spectrophotometer. Some phenolic compounds were identified
and quantified by RP-HPLC (reverse phase HPLC). Epicatechin, naringin, rutin, vitexin, and p-coumaric
acid were detected. GC–MS analysis revealed that the jatropha oils contained mainly the palmitoleic,
palmitic, stearic, oleic, and linoleic acids. The antioxidant properties of leaves, roots, and oils of jatropha
showed that the best results were obtained for the leaves extracts of Suriname (P8) (IC50 = 8.4 µg/ml by
DDPH test and IC50 = 0.55mg/ml by ABTS test). Besides, the anti-acetylcholinesterase activity of leaves and
roots extracts of J. curcas was investigated revealing that these extract were effective against the
acetylcholinesterase enzyme (AChE). Compared to the galantamine (IC50 = 0.55±0.02 µg/ml), the most
promising extracts were the leaves extracts of Mato Grosso Brazil (P5) (IC50 = 0.54 µg/ml), Vale do
Jequitinhonha Brazil (P7) (IC50 = 0.47 µg/ml), and Suriname (P8) (IC50 = 0.57 µg/ml). These results indicate
that these extracts could be used as natural antioxidant source and in the treatment of the Alzheimer disease
too, since they may contribute to increase acetylcholine in cholinergic neurons.
Keywords: Jatropha curcas; anti-acetylcholenesterase; Alzheimer disease; antioxidant activity; RP-HPLC;
GC-MS; phenolic compounds.
International Conference on
RAW MATERIALS TO PROCESSED FOODS 03-04 June 2021, Turkey
102
Optimization Of Iron-Oligofructose Formulation On Wheat Flour Of A High
Extraction Rate On Dough Rheological Properties
Georgiana Gabriela Codină1*, Adriana Dabija1, Silviu Gabriel Stroe1, Sorina Ropciuc1
1 Faculty of Food Engineering, Stefan cel Mare University of Suceava, Romania
E-mail: [email protected]; [email protected]
ABSTRACT
The aim of this study was to optimize the iron (FE) and oligofructose (OF) content in order to obtain wheat
flour dough of a high extraction rate with the best rheological properties by using response surface
methodology. The wheat flour used in this study was of a strong one for bread making with the fallowing
chemical composition: 14.3% moisture content, 1.25% ash content, 14.3% protein content and 35% wet
gluten content. The levels used for oligofructose variable were between 2.5 and 10% and for iron ions from
lactate salt were between 3 and 5 mg/100g wheat flour. The dough rheological properties were analyzed by
using the Farinograph, Alveograph Amylograph, Falling Number and Rheofermentograph properties
devices. The response surface methodology (RSM) using central composite rotatable design (CCRD) was
used for optimization. Dough development time, dough tenacity, extensibility, gelatinization temperature
decreased with the increase level of oligofructose and iron addition. Iron salt from the lactate form presented
a significant negative effect on dough development time and extensibility. Oligofructose presented a
negative effect on water absorption and degree of softening and a positive one on dough stability and peak
viscosity.
Keywords:wheat flour, rheological properties, oligofructose, iron salt, optimization

International Conference on
RAW MATERIALS TO PROCESSED FOODS 03-04 June 2021, Turkey
103
Phytochemical Evaluation and Antimicrobial Activity of Selected Pigmented
Plants: Garcinia mangostana, Clitoria ternatea, Ardisia colorata var elliptica and
Syzygium cumini
Noriham A.1,2*, Siti Azima A. M.,2 Manshoor, N.3,4
1Malaysia Institute of Transport (MITRANS), Universiti Teknologi MARA, 40450 Shah Alam, Selangor, Malaysia 2Department of Food Science and Technology, Faculty of Applied Sciences, Universiti Teknologi MARA, 40450 Shah
Alam, Selangor, Malaysia 3Atta-ur-Rahman Institute for Natural Product Discovery (AuRIns), Universiti Teknologi MARA, 42300 Puncak Alam,
Selangor, Malaysia 4Faculty of Pharmacy, Universiti Teknologi MARA, 42300 Puncak Alam, Selangor, Malaysia
+6012-3317037, +603-55442344
*E-mail: [email protected]
ABSTRACT
Phytochemical compounds in plants are the backbone of antimicrobial activity and natural pigment, therefore
are gaining interest as natural preservatives and colourants in food industry to replace the synthetic ones. In
recent years, because of the great consumer awareness and concern regarding synthetic chemical additives,
foods preserved with natural additives have become very popular. There are concerns about using synthetic
chemical additives because of the reported negative effects on human health. Hence, the main objectives of
this study were to evaluate the phytochemicals and antimicrobial activity of selected pigmented plants
namely, Garcinia mangostana peel, Clitoria ternatea flower, Ardisia colorata var elliptica fruit and Syzygium
cumini fruit. The phytochemicals presences in the selected pigmented plants were determined based on the
phytochemical screening and reverse phase high performance liquid chromatography (RP-HPLC) analysis,
while antimicrobial activity analysis was carried out using the disc diffusion technique. Phytochemical
screening revealed that Garcinia mangostana peel exhibited strongest indications for the presence of
flavonoid, leucoanthocyanidin, quinone, tannin and anthocyanidin as compared to the other three pigmented
plants studied. Findings from RP-HPLC analysis revealed that Garcinia mangostana peel possessed
significantly high (p<0.05) amount of phenolic compositions which consists of protocatechuic acid, vanillic
acid, chlorogenic acid, p-coumaric acid, ferulic acid, quercetin, rutin, epicatechin, catechin and cyanidin 3-
sophoroside. The antimicrobial activity analysis also showed that among the four pigmented plants studied,
Garcinia mangostana peel exhibited the strongest inhibition on the fungi Aspergillus niger and gram positive
bacteria i.e. Bacillus cereus, Bacillus subtilis and Staphylococcus aureus with minimum inhibitory zone of
6.50 mm, 8.50 mm, 6.70 mm, and 7.20 mm, respectively. Therefore, our results suggested that the
antimicrobial activity of Garcinia mangostana peel was associated with their specific phenolic compounds.
From a practical point of view, Garcinia mangostana peel may be a good candidate for functional foods and
pharmaceutical applications.
Keywords: antimicrobial activity, phytochemical, pigmented plant, RP-HPLC.

International Conference on
RAW MATERIALS TO PROCESSED FOODS 03-04 June 2021, Turkey
104
The Effects of Hydrocolloids on The Physical Properties of Sponge Cakes
Noorlaila, A.1, Nor Hasanah, H.1, Anida, Y.1
1Dept of Food Science and Technology, Faculty of Applied Sciences, Universiti Teknologi MARA, 40450 Shah Alam,
Selangor, Malaysia
Noorlaila, A. Tel: +60193644550, Fax: +60355435559
E-mail: [email protected]
ABSTRACT
The suitability of hydrocolloids as an improver in bakery products is still doubtful. The rheological
characteristics (flow behaviour and viscoelasticity) of batter were studied to relate with the physical
properties (volume, texture and microstructure) of sponge cake. The effect of xanthan gum (XG) and
hydroxypropylmethylcellulose (HPMC) on cake volume, hardness and sensory evaluation scores of baked
sponge cakes were investigated. Batter density and specific gravity were significantly (p<0.05) correlated
with volume of cake (r batter density= -0.64 and r specific gravity = -0.70). Low complex viscosity was observed in
hydrocolloids cake during heating at 25-95°C. Hydrocolloids cakes (both XG and HPMC) had significant
(p<0.05) low volume compared to control cake. Consistency index and viscosity were significantly (p<0.05)
correlated with hardness (r Consistency index =0.71; r Viscosity =0.63), which able to determine the crumb texture of
sponge cake. For sensory evaluation, sponge cake containing xanthan gum was less preferred by the
panellists compared to other sponge cake formulations since it presented the lowest mean score in overall
acceptability (6.25).
Keywords: Hydrocolloids, Physical properties, Xanthan gum, Sponge cake
International Conference on
RAW MATERIALS TO PROCESSED FOODS 03-04 June 2021, Turkey
105
The Stability of Mayonnaise Model System Incorporated with Black Cumin
(Nigella sativa) Seed Oil
Intan Nursyakila Zainal Abidin1, Anida Yusoff1
Faculty of Applied Sciences, Universiti Teknologi MARA, 40450, Shah Alam, Selangor, Malaysia
E-mail: [email protected]
ABSTRACT
Incorporation of black cumin (Nigella sativa) seed oil (BCSO) (0.5%, 1.0%, 1.5% and 2.0%) in palm oil in
dispersion phase of mayonnaise model system is believed can preserve health by delivering beneficial
bioactive compound within the BCSO known as thymoquinone. The physical analyses of mayonnaise model
system involved the viscosity measurement using viscometer while the stability analyses included
parameters such as: mean droplet size (D32), droplet size distribution (DSD), creaming index (CI) and
dispersion stability by using lumifuge analyzer. The oxidative rancidity test involved rancimat analysis and
peroxide value (PV). All mayonnaise model systems showed no visible separation of oil until the end of
storage day (day 28) in creaming index and these results were well correlated with creaming stability
analysis. Significant changes (p<0.05) were observed in oil mean droplets size (D32) for all mayonnaise
model systems ranged from 4.14 µm to 6.43µm until the end of storage period. The droplet size distribution
of mayonnaise model systems showed unimodal distribution up to day 21. Viscosity analyses indicated that
there was a significance decrease (p<0.05) in viscosity of mayonnaise model system over time. The addition
of BCSO in all mayonnaise model system shows no significant different in peroxide value and induction
time measured at 110˚C and 120˚C in rancimat analysis. Thus, show no development of oxidative rancidity
in mayonnaise model system over time.
Keywords: black cumin (Nigella sativa) seed oil, mayonnaise, oxidative rancidity, stability
International Conference on
RAW MATERIALS TO PROCESSED FOODS 03-04 June 2021, Turkey
106
Development of slow melting dietary fiber-enriched ice cream formulation using
bacterial cellulose and inulin
Janifer Raj Xavier*, Karna Venkata Ramana
Defence Food Research Laboratory, Defence Research and Development Organization, Mysore, India
*E-mail: [email protected]
ABSTRACT
Effect of addition of bacterial cellulose (BC) and inulin on properties such as melting rate, over run, and
sensory properties of ice cream was investigated. BC-supplemented ice creams were characterized by a
significant reduction in the melting rate, while inulin contributed to enhance the over run and sensory
properties. Sensory perceptions varied for BC at 17% and 30% (wet weight) when compared to inulin
addition at 0.7% and 1.4% (dry weight). Eight formulations of ice cream were prepared, varying inulin
concentration (0.7 and 1.4 g/100 g), BC concentration (17 and 30 g/100 g), and additional water (13.6
ml/100 ml) and two control samples were prepared. An interaction effect among BC, inulin, and additional
water content was found for tested parameters. According to the model obtained, the ice cream formulation
with 17 g/100 g BC and 1.4 g/100 g inulin observed significant differences for reduction in melting rate and
increased fiber content.

International Conference on
RAW MATERIALS TO PROCESSED FOODS 03-04 June 2021, Turkey
107
Screening of the antioxidant, nutritional, physical and functional properties of
bran obtained from six Indian wheat cultivars
Reshma Saroj, Vinti Singh, Radha Kushwaha, Monika Singh, Devinder Kaur*
Center of Food Technology, University of Allahabad, Allahabad, India
*E-mail: [email protected]
ABSTRACT
In this research paper, the proximate, antioxidant, functional, color, and scanning electron microscopy
properties bran were screened in six different cultivars of wheat viz. HUW-234, PBW-373, WH-1105, PBW-
502, HD-2967, and PBW-343. The results showed that carbohydrates ranged from 66.74% to 83.94%,
proteins 3.45%–17.73%, fats 0.16%–3.16% among the wheat bran of different cultivars, and dietary fiber
content ranged from 39.38% to 44.70%. The DPPH content of wheat bran ranged from 5.74% to 9.14% and
the decreasing order for a radical scavenging activity was WH-1105 > PBW-502 > HUW-234 > HD-2967 >
PBW-373 > PBW-343 between cultivars. The imperative of water absorption capacity was high in PBW-373
and minimum in HUW-234. Swelling capacity was found to increase with increasing temperature (50–90°C).
The whiteness and yellowness Index values were found higher in cultivar HD-2967. The bran is being used
for the production of functional food products which able to prevent various degenerative diseases.
International Conference on
RAW MATERIALS TO PROCESSED FOODS 03-04 June 2021, Turkey
108
Determination of Catechol in Water Extract of Tea using CPE Modified with
Banana tissue
Nevila Broli, Loreta Vallja, Alma Shehu, Majlinda Vasjari*
Department of Chemistry, Faculty of Natural Sciences, University of Tirana
*E-mail: [email protected]
ABSTRACT
Tea, one of the most popular consumed worldwide beverages, is known to be rich in polyphenols, more
particularly in catechin and catechol. Carbon paste electrode modified with banana crude tissue for
determination of catechol in green tea was developed. Polyphenol oxidase enzyme that is present in banana
fruit tissue was immobilized into carbon paste electrode CPE-B and the analytical performance of the
biocomposit is investigated. The electrochemical properties were assessed by using square wave
voltammetry in phosphate buffer 0.1 M, pH 7 using standard solutions of catechol. This biosensor exhibits a
high sensitivity 2.32 µA/mg and a low detection limit 0.1 mg/L. The linear zone between peak high and
catechol concentration was found from 1.4 to 15.7 mg/L with correlation coefficient 0.9990. Reproducibility
of the signal obtained in 1.4 mg/L catechol resulted with relative standard deviation 3.6 % (n=4). The
storage stability was also studied; the biosensor retained successively 85% and 75% of its initial response
after 24 and 40 days. The biosensor was applied for the determination of catechol in green tea samples using
two extraction methods (by water solution (141 ± 8.3 mg/L) and phosphate buffer solution (478.5±6.8
mg/L). The calculated recovery was between 89% and 92%, proving that the proposed CPE-B biosensor can
be an alternative analytical tool for determination of catechol in tea.
Keywords: Green tea, carbon paste biosensor, crude tissue, PPO enzyme, catechol, square wave
voltammetry.

International Conference on
RAW MATERIALS TO PROCESSED FOODS 03-04 June 2021, Turkey
109
Nutraceuticals and Functional Foods from Agri-Horticulture Waste of Indo-
Argentina
Dhan Prakash1,*, Charu Gupta1, Monica Azucena Nazareno2
1Amity Institute for Herbal Research & Studies, Amity University-UP, Sector-125, Noida-201313 (India)
2Laboratorio de Antioxidantes Procesos Oxidativos, Centro de Investigacin Transferencia de Santiago del Estero
(CITSE-CONICET), Universidad Nacional de Santiago del Estero (UNSE) Av. Belgrano (S) 1912, 4200 – Santiago
del Estero (Argentina)
*Email: [email protected]
ABSTRACT
Fruits, vegetables, cereals, legumes and other food processing wastes are produced in large
quantities. Waste utilization from food processing industries is highly indispensable and challenging
task all over the world. Studies have proved that the agri-horticultural wastes are rich source of
valuable phytochemicals and nutrients that can serve as a potential source of nutraceuticals and
functional foods, and can be beneficial as adjuvant in the management of several health issues like
ageing, hypertension, cancer, cardiovascular and other degenerative diseases. The full utilization of
agri-horticultural produce is in demand all over the world including Argentina and India to implement
low-waste technology in their agribusiness. Several scientific studies have shown that these wastes
could be considered as valuable by-products in the form of phytochemicals of nutraceutical importance if
they are treated scientifically and technically. Research proved generation of important phytochemicals,
antioxidants, dietary-fiber, food ingredients like pectin, natural colour, vitamins, antibiotics and
proteases apart from ethanol or biogas from agri-horticultural waste.
Agri-horticultural waste are cost effective natural sources of various phytochemicals like phenols
(tannins, lignins, anthocyanins, isoflavones, flavonones, flavanoids), isoprenoid derivatives (terpenoids,
carotenoids, saponins, tocotrienols, tocopherols, terpenes), ascorbic acid, oligosaccharides, non-starch
polysaccharides, fatty acid and structural lipids (n-3 PUFA, CLA, MUFA, sphingolipids, lecithins),
amino acid derivatives, microbes, probiotics, prebiotics, and minerals. Phytochemicals play key role in
human health as antioxidants, antibacterial, antifungal, anti-inflammatory, anti-allergic, antispasmodic,
chemo-preventive, hepato-protective, hypolipidemic, neuro-protective, hypotensive agents, preventing
aging, diabetes, osteoporosis, cancer and heart diseases, induce apoptosis, diuretic, CNS stimulant,
analgesic, protects from UVB-induced carcinogenesis, immuno-modulator and carminative.
Keywords: Agri-horticultural waste, Health benefits, Phytochemicals, Antioxidants, Nutraceutical,
Functional foods

International Conference on
RAW MATERIALS TO PROCESSED FOODS 03-04 June 2021, Turkey
110
Effect of CMC and Guar Gum on Oil Absorption and Sensory Quality of
Banana (Musa acuminate) Fritters During Repeated Frying
Norizzah Abd Rashid1, Maryam ‘Afifah Abdul Latif1, Zaibunnisa Abdul Haiyee1, Anida Yusoff1,
Maimunah Sanny2
1Faculty of Applied Sciences, Universiti Teknologi MARA, 40450 Shah Alam, Selangor, Malaysia 2Faculty of Food Science and Technology, Universiti Putra Malaysia, 43400 UPM, Selangor, Malaysia
Tel: 603-55444476; Fax: 603-55435559;
E-mail: [email protected].
ABSTRACT
This study aims to determine the effects of carboxymethyl cellulose (CMC) and guar gum on the oil uptake
and acceptability of banana fritters during repeated deep fat frying. Banana of variety “Awak” was deep fried
intermittently in cooking oil for 6 hour daily without oil replenishment over 3 consecutive day at 170±5°C.
The moisture, oil content and color were evaluated at first and every 10th frying cycles whereas the texture
and sensory acceptability of banana fritters were evaluated only at the first frying cycle. Results indicated
that the moisture and oil content of banana fritters were dependent on the frying cycles. The oil content
increased while the moisture decreased with increased in frying cycles. There was significant reduction
(p<0.05) in oil content of banana fritters dipped in batter containing guar gum compared to CMC and
control. The highest reduction in oil content was banana fritters dipped in batter containing guar gum
(73.20%) compared to CMC (62.77%). Guar gum treated banana fritters also had significantly (p<0.05) the
highest moisture content (54.27%). The lightness value decreased with increased in frying cycle and 1% guar
gum treated fritters had the lowest value. The treated banana fritters especially guar gum significantly
increase the crust hardness (9.42N) compared to control (2.32N). No significant different (p<0.05) in the
appearance, color, oiliness and taste between control and treated fritters. Despite the crispiness and overall
acceptability of control and treated fritters were different, there is a potential of adding CMC and guar gum
into the batter to reduce oil absorption in banana fritters.
Keywords: Banana fritters, CMC, Guar gum, Oil absorption

International Conference on
RAW MATERIALS TO PROCESSED FOODS 03-04 June 2021, Turkey
111
Effect of Adding Muskmelon (Cucumis melo L.) Fruit on Physico-Chemical
Properties and Sensory Attributes of Yoghurt
J. A. Ali Wala, Ibtisam E. M. El Zubeir*
Department of Dairy Production, Faculty of Animal Production, University of Khartoum, P. O. Box 321, Khartoum,
Sudan
E-mail: [email protected]
ABSTRACT
Muskmelon (Cucumis melo L.) or cantaloupes is a rich source of vitamins, carbohydrates, sugars and protein,
it was used as dessert and also eaten alone. This study is done with the objective of evaluating the effect of
adding muskmelon either before or after processing of the yoghurt. It was also meant to assess some of the
chemical constituents (total solids, fat, protein and ash contents), acidity and sensory attributes (flavor, color,
texture, taste and overall acceptability) of muskmelon yoghurt. Fresh raw whole cow milk (6 liters) was
obtained from Khartoum University farm. The cow’s milk was first examined for chemical composition
before the processing. Then the milk was heated at 95℃ for 1 minute and cooled to 45℃. The milk was
divided into 3 portions; in the first the slices of muskmelon (3%) were added before the incubation (45℃) of
yoghurt and in the second the slices of muskmelon were added after the incubation, while the third portion
was kept as a control (plain yoghurt). The starter culture was added at a rate of 3% and mixed well with the
milk and other ingredients and then the different yoghurt samples were prepared and distributed into plastic
bags (150 ml). The yoghurt samples were stored in a refrigerator (5-8 ℃ for 10 days) and the physico-
chemical analysis and sensory evaluations were carried out on day 2, 5 and 10. The data showed non-
significant (P>0.05) variations in the physico-chemical content of plain (control) yoghurt and those to which
the muskmelon was added before or after incubation. Also the result indicated non-significant variations for
total solids, fat and ash content during the storage period of yoghurt, while significantly (P≤0.01) higher
values were found for protein (2.86%) and acidity (0.72%) at day 2 of storage period. Similarly significant
differences were found for flavor and texture (P<0.05) and taste and overall acceptability (P<0.01) of
yoghurt. This study concluded that when adding slices of muskmelon to yoghurt, it is recommended to be
done before incubation in order to give better flavor and overall acceptability and to avoid the high level of
acid taste.
Keywords: Muskmelon slices, fruit yoghurt, incubation, chemical content, sensory properties, storage
International Conference on
RAW MATERIALS TO PROCESSED FOODS 03-04 June 2021, Turkey
112
Storage of Herbal Raw Materials
Narzullaev M.S., Jumaev B.M., Khudoyberdiev M.A.
Tashkent State Technical University, 100095, str. University 2, Tashkent, Uzbekistan
E-mail: [email protected]; +99893 569-02-88
ABSTRACT
Herbal medicinal raw materials, if harvested in due time and dried correctly, but stored in inappropriate
conditions, i.e. exposed to direct sunlight, high temperature and high humidity, it can become damp,
moldy. As a result, the medicinal raw material loses its normal appearance and basic active substances in
connection with their decomposition, therefore, both pharmacological properties and therapeutic effect.
Therefore, medicinal raw materials should be stored in appropriate (clean, well-ventilated, dry and
protected from direct sunlight) windows on shelves in a packaged form. We must try to prevent rodents
and barn pests from attacking medicinal raw materials. Poisonous, highly odorous essential oil and
carbohydrate-rich medicinal raw materials, which are often attacked by rodents and insects, should be
stored separately.
Keywords: storage, drying, herbal medicinal raw materials

International Conference on
RAW MATERIALS TO PROCESSED FOODS 03-04 June 2021, Turkey
113
Monosaccharide Removal and Effects of Komagataeibacter Xylinus
Fermentation on Antioxidant Capacity and Flavor Profile of Chinese Wolfberry
Juice
Tianzhen Zhang1,2, Yuqing Shen1,2, Senjia Zhang1,2, Zexiong Xie3,4, Xiyu Cheng5, Wenchao Li1,2,
Cheng Zhong1,2* 1State Key Laboratory of Food Nutrition & Safety, Tianjin University of Science & 8 Technology, 300457 Tianjin, PR
China 2Key Laboratory of Industrial Fermentation Microbiology (Ministry of Education), Tianjin University of Science &
Technology, 300457 Tianjin, PR China 3Frontier Science Center for Synthetic Biology and Key Laboratory of Systems Bioengineering (Ministry of Education),
School of Chemical Engineering and Technology, Tianjin University, 300072 Tianjin, PR China 4Collaborative Innovation Center of Chemical Science and Engineering (Tianjin), School of Chemical Engineering and
Technology, Tianjin University, 300072 Tianjin, PR China 5College of Life Sciences and Bioengineering, School of Science, Beijing Jiaotong 18 University, 100044 Beijing, P.R.
China
ABSTRACT
Chinese wolfberry is a widely used traditional medicine-food homology plant with diverse functions.
However, as Chinese wolfberry contains abundant monosaccharides, it cannot be consumed by diabetics and
obese people, which reduces its health and commercial value. To remove monosaccharide, raw Chinese
wolfberry juice was fermented by Komagataeibacter xylinus. Glucose was exhausted after 10 days, and
maximum 3.145g/L bacterial cellulose was obtained. The total organic acid and amino acid concentration
increased from 2974.32 mg/100 mL and 409.19 mg/100 mL to 4217.7 mg/100 mL and 655.1 mg/100 mL,
respectively. Fermentation promoted the generation of esters, volatile acids, aldehydes and ketones, but no
observed change in polysaccharide concentration was detected. Fermentation enhanced the contents of
flavonoid and polyphenol, and antioxidant ability was also increased.
Keywords: Chinese wolfberry; monosaccharides removal; flavor components; active ingredients;
Komagataeibacter xylinus

International Conference on
RAW MATERIALS TO PROCESSED FOODS 03-04 June 2021, Turkey
114
Drying Herbal Raw Materials
Kanaeva R.N., Samandarov D.I., Yulibayev M.
Tashkent State Technical University, 100095, str. University 2, Tashkent, Uzbekistan
E-mail: [email protected]; +99893 569-02-88
ABSTRACT
Drying is one of the important stages in the procurement of vegetable medicinal raw materials. The
purpose of this work is to ensure subsequent long-term storage of raw materials without changing the
composition and content of biologically active substances. Timely and proper drying of the collected raw
materials will ensure the production of high-quality medicinal raw materials. The time interval from the
moment of collection to the start of drying should be minimal. This is because the biochemical processes
in the freshly picked plant and its individual parts not only do not stop, but rather, their intensity increases
markedly, which leads to a significant decrease in the content of active substances. In conditions of lack of
water, enzyme systems cannot exhibit high activity. At the same time, the possibility of the activity of
microorganisms and fungi is limited, which prevents decay and moldiness of medicinal plant materials.
Keywords: raw materials, drying, herbal
International Conference on
RAW MATERIALS TO PROCESSED FOODS 03-04 June 2021, Turkey
115
Development of Cakes with Almond Baru Flour: Characteristics and Their
Correlations with the Texture Profile Analysis
Ana Flávia Ramos, Gabriela R. Lemos Mendes, Fabiane Neves Silva, Renato Souza Cruz, Geany Peruch
Camilloto, Bruna Mara Aparecida de Carvalho, William James, Nogueira Lima, Milton Nobel Cano Chauca,
Janaína Teles de Faria, Juliana Pinto de Lima, Sérgio Henrique Sousa Santos, Igor Viana Brandi*
Universidade Federal de Minas Gerais, Instituto de Ciências Agrárias
*E-mail: [email protected]
ABSTRACT
Baru (Dipteryx alata Vog.) is a native fruit from Brazilian Cerrado. It has an important contribution to the
nutritional profile of the products manufactured with them, but the influence of the addition of Baru in
bakery products on technological properties still a rare explore. The aim of this study was to evaluate of
cakes developed with almond Baru flour. Cakes were manufactured with 20, 40, 60 and 80% of replacement
of almond Baru flour by wheat flour. The Baru flour obtained showed high content of protein and lipids (2.8
and 47-fold greater than wheat flour, respectively). The formulation with 80% of baru flour and 20% wheat
flour showed 30.3% of protein and 72.1% of lipids. The correlation analysis showed that the Baru flour is a
great option to increase protein and lipids, but occasioned harder, more chewy texture and less cohesive and
springiness texture into the product.
Keywords: Baru; cakes; texture; nutritional value.

International Conference on
RAW MATERIALS TO PROCESSED FOODS 03-04 June 2021, Turkey
116
The Comparison Effect of Hydro Alcoholic and Hydro Distilation Extract of
Melissa officinalis o Acne and Pimple
Giti Sabet Teymouri1, Mozhgan Sabet Teimori 2*
1Tebyan Toos Institute, Mashhad, Iran
2 Research Academic member of ACECR, Mashhad, Iran
Email: [email protected]
ABSTRACT
One of the famous plants in Lamiacae family is Melissa officinalis and this is the most important herbs for
health and Medicine. Possitive effects of melissa recorded to pharmacopet global and get sertificate
registered (Ben Erick and vinck, 1956). This plant has positive treatment effect and introduce in the german
drag commission. Melisa has 2 grades in both of professional Europ commission of medicenal plantes and
WHO. Melisa has rosmarinic acid and flavenoid and fenolic acid (Jayman and Rezaiee, 2006). These
components have thitning and rejonation effect on skin. Also, it has monoterpen and dyterpen that there are
anti bactrial and skin cratolisasion (Hadji Akhondi and Baligh, 2014). Essential oil of Melisa has good complex
with sebom, so it can decrease inflimantory and pain of acne affect. The first produced of hydrodistilation
extract of melisa. There for we use 30 gr. Of dry leaves and stems of melisa in 500 m.lit. of distiled water.
For hydro alcoholic extract we use 150 gr of dry matter (leaves and stems) in 500 m.lit. of etilic alcohol 25
degrees during 10 days. Then alcoholic extract mixed in 5 values of water. Client were 20 person and 3
month were under experiment. Treatments were 3-5 times spreyed on skin. The results showed that all
clients get the best result of this treatment. After apply of water extract of melisa, we observed 75% of clients
improved the skin pore, 65% of clients get the improved neurogical problems and infectional Acne and 92%
Recovery of Hyper secretion of Sebaceous glands. We observed same results about treatments effect of
Hydro Alcoholic extracts. 75% recovery of clients improved the skin pore, 95% of clients get the improved
neurogical problems and infectional Acne and 90% recovery of Hyper secretion of Sebaceous glands. These
results showed that the best effects of using Melisa extract and value of applying on some skin problems.
References
• Ben Erick, F.V. and vinck, M. 1956. Medicinal plants of the world: an illustrated scientific guide to important medicinal
plants and their uses.
• Jayman. K. And Rezaiee, M.B. 2006. Essential oil, distilation apparateuses, Test methods of Essential oils and retention
indices in essential oil analysis.
• Hadji Akhondi, A. Baligh, N. 2004. Practical Guidance of Medicinal plants. AZAD University pub.
• Heydari, M.R. and norouzadeh, R. 2014. Medicinal plants, Nursıng and patient education. Jame Negar Pub.

International Conference on
RAW MATERIALS TO PROCESSED FOODS 03-04 June 2021, Turkey
117
Advances in Extracting and Understanding the Bioactivities of Marine
Organism Peptides: A Review
Qing-Hao Jina, Ding-Xin Pengb, Zhou-Jun Zhenga*
a Zhejiang Ocean University, Donghai Science and Technology College, Zhejiang, Zhoushan, 316000, P.R. China b Food and Pharmacy College, Zhejiang Ocean University, Zhejiang, Zhoushan 316022, P.R. China
ABSTRACT
Marine organisms are important foods for humans. Marine organisms contain large amounts of high-quality
proteins. Biologically functional peptides have great potential for use as functional foods and drugs, in which
can be extracted from marine organisms. Biologically functional peptides with anticancer, anticoagulant,
anti-diabetic, antihypertensive, antimicrobial, anti-oxidant, and cholesterol-lowering activities have been
described. It is very difficult to screen, extract, and purify biologically active substances from marine
organisms, particularly using traditional chemical methods. Here, recent advances in extracting peptides
from marine organisms are reviewed and the biological activities of various marine organism peptides are
summarized.
Keywords: Peptides, Marine organisms, Biological activities, Extraction, Purification

International Conference on
RAW MATERIALS TO PROCESSED FOODS 03-04 June 2021, Turkey
118
Investigating the Effect of the Maltodextrin Gel Usage on Oil Cake
Formulation
M. Zelanvar*, B. Ghiasi Tarzi, P. Damanafshan
Department of Food Science and Technology of Islamic Azad University, Sciences & Research Branch,
Hesarak, Tehran
E-mail: [email protected]
ABSTRACT
The aim of this research was investigating the effect of the maltodextrin gel usage on oil cake formulation.
The specific volume of dough as well as physicochemical properties of the cake including height, moisture,
tissue and sensory properties of the product were evaluated. The obtained results cleared that increasing the
amount of maltodextrin gel resulted in reduction of the specific volume of the dough. The results of the test
conducted on the cake revealed that increasing the amount of maltodextrin gel increased the height of the
cake samples. Also, making use of maltodextrin gel increased the moisture content of the cake samples. The
results related to texture test also showed a decrease in texture stiffness as a result of increasing maltodextrin
gel. So, maltodextrin gel increased texture softness compared to the blank sample. The results related to
sensory evaluation showed that the sample containing 3% maltodextrin gels achieved the highest score by
the sensory evaluators in terms of taste, color and texture. The findings of overall desirability also exhibited
the desirable conditions of the sample containing 3% maltodextrin gel in all the testable properties.
Keywords: Cake, Maltodextrin Gel, Physicochemical Properties. Hygiene
International Conference on
RAW MATERIALS TO PROCESSED FOODS 03-04 June 2021, Turkey
119
Identification of Fungal Species from Turkish Mold-ripened Cheeses and the
Morphological and Genetic Diversity of Penicillium roqueforti Isolates*
Hatice Ebrar Kırtıl, Banu Metin
Department of Food Engineering, Faculty of Engineering and Natural Sciences, Istanbul Sabahattin Zaim University,
Istanbul, Turkey
E-mail: [email protected], Tel: +90212 692 9820
ABSTRACT
In this study, we aimed to identify the filamentous fungi of Turkish mold-ripened cheeses and spesify the
morphological and genetic diversity of Penicillium roqueforti isolates. We identified 148 filamentous fungi
isolated from traditional cheese samples (n=62) comprising Konya Kuflu Tulum, Erzurum Kuflu Civil, Divle
Cave Tulum, Karaman Tulum, Kars Kuflu Chechil, Sivas-Zara Tulum and Rize-Ardesen Golot using
internal transcribed spacer (ITS) region or beta-tubulin (benA) gene. These isolates mainly consisted of
Penicillium roqueforti (81%) in addition to other Penicillium species, P. biforme, P. crustosum, P. paneum,
P. nordicum, P. brevicompactum, P. roseomaculatum, and P. solitum, and other species isolated such as
Alternaria alternata, Albifimbria verrucaria, Cladosporium cladosporioides, Cladosporium macrocarpum,
and Talaromyces kabodanensis. Fingerprinting analyses were conducted using rep-PCR (GTG5 primer) and
RAPD-PCR (M13 primer). The primers were discriminative at the species level. While one distinctive band
in 2750 bp was obtained in RAPD-PCR, rep-PCR resulted in an identical pattern for all P. roqueforti isolates
except a single isolate. PCR-screening for the Wallaby and CheesyTer loci (horizontal gene transfer regions)
demonstrated the presence of both loci in all 120 P. roqueforti isolates besides P. biforme, and P. solitum.
The mating type distribution of P. roqueforti isolates was skewed in favor of MAT1-2 (95%). Morphological
investigation of P. roqueforti isolates were also conducted on four different media, potato dextrose agar
(PDA), yeast extract sucrose agar (YES), malt extract agar (MEA) and oatmeal agar (OA). Future studies
will include the use of microsatellites for further information about the genetic diversity of P. roqueforti
isolates.
Keywords: Mold-ripened cheeses, filamentous fungi, Penicillium roqueforti, diversity
*This work was supported by the Scientific and Technological Research Council of Turkey (TUBITAK)
grant number 119O314.
International Conference on
RAW MATERIALS TO PROCESSED FOODS 03-04 June 2021, Turkey
120
Impact of Low phHon The Textural and Structural Characteristic of Canned
Meatballs (Rista)
Sajad Ahmad Mir, Shoib Mohmad Wani*
Department of Food Science and Technology, University of Kashmir, Hazratbal Srinagar-190006, India
*E-mail: [email protected]
ABSTRACT
Traditional canned meatballs (rista) pretreated with varying concentrations of lactic
acid (LA) were evaluated for physicochemical, microbial load, textural, structural and
sensory parameters. LA was used at the level of 0% (control), 0.5% (LA1), 1% (LA2) and 1.5% (LA3).
Among treated rista, LA3 maintained a significantly lower value (P≤0.05) of FFA (1.17%), TBARS (0.75 mg
MDA/kg), peroxide (7.22 meq/kg), tyrosine (2.74 mg/100 g) and carbonyl content (6.06 nmol/mg protein) at
the 12 months of the storage period. During the 12-month storage period, the pH of LA3 was the lowest (4.7)
compared to the control rista (6.3). The total plate count (TPC) of the control rista was found
as log10 cfu/g (4.39), while in the case of LA1, LA2 and LA3 the TPC was log10 cfu/g 2.11, 2.03 and 1.51
respectively. Treated rista exhibited significantly higher (P≤0.05) sensory and textural scores throughout the
storage period.
Keywords: Meat, Meatballs, Meat preservation, Rista, Lactic acid

International Conference on
RAW MATERIALS TO PROCESSED FOODS 03-04 June 2021, Turkey
121
Novel Methods for The Extraction of Bioactive Components and Essential Oils
from Foods
Ishrat Majid*1, Shafat Khan1,2, Madhuresh Dwevedi2, Aamir Hussain Dar1
1Department of Food Technology, Islamic University of Science & Technology, Awantipora, Kashmir (India),
Department of Food Process Engineering 1,2National Institute of Technology Rourkela
*E-mail: [email protected]
ABSTRACT
The extraction of bioactive compounds from natural food sources via novel non-conventional methods is
gaining popularity due to their numerous advantages over conventional methods. In this review article
conventional (e.g. Soxhlet extraction, hydro distillation (water distillation, steam distillation), combined
water and steam distillation, maceration, cohobation, enfluerage and heating reflux extraction and non-
conventional ultrasound-assisted extraction (UAE), microwave-assisted extraction (MAE), high-pressure
(HP), pressurized liquid extraction (PLE), negative pressure cavitations assisted extraction (NPCE),
subcritical water extraction (SWE), supercritical fluid extraction (SFE), enzyme-assisted extraction (EAE),
pulsed electric field assisted extraction (PEF) and accelerated solvent extraction (ASE) method of extraction
has been discussed with more emphasis on nonconventional/green extraction methods. The use of hybrid
novel techniques for extraction has proven to be more effective method of extraction. The bioactive
compounds extracted by novel techniques have great potential in functional food market as they are extracted
under mild processing conditions. Further research is required to evaluate these green extraction techniques
in terms of their safety, scalability, consumer acceptability, challenges, legal aspects and potential feasibility.
Keywords: Green extraction; negative pressure cavitations; subcritical; enzyme-assisted; accelerated solvent

International Conference on
RAW MATERIALS TO PROCESSED FOODS 03-04 June 2021, Turkey
122
Moderation of Polyphenol Composition in The Cranberry Extract Powders by
Spray Drying Parameters and Carrier Addition
Michalska-Ciechanowska Anna1,2,*, Wojdyło Aneta2, Kramek Diana2, Brzezowska Jessica2,
Hendrysiak Aleksandra 2, Majerska Joanna3
1Institute of Animal Reproduction and Food Research of the Polish Academy of Sciences, Division of Food Science,
Department of Chemistry and Biodynamics of Foods, Tuwima 10 Str., 10-748 Olsztyn, Poland 2Wrocław University of Environmental and Life Sciences, the Faculty of Biotechnology and Food Sciences, Department
of Fruit, Vegetable and Plant Nutraceutical Technology, Chełmońskiego 37 Str., 51-630 Wrocław, Poland 3Wrocław University of Environmental and Life Sciences, the Faculty of Life Sciences and Technology, Institute of
Agricultural Engineering, Chełmońskiego 37a Str., 51-630 Wrocław, Poland *Anna Michalska-Ciechanowska, tel: +48 71 320 7712, fax.: +48 71 320 7707, e-mail: [email protected]
ABSTRACT
Vaccinium macrocarpon L. is an exceptional source of bioactives including polyphenols responsible for its
relatively high antioxidant properties. The composition of these constituents influences the taste of cranberry
fruit, being unattractive to consumers especially in a fresh form. For this reason, the conversion of cranberry
into novel food ingredients or nutraceuticals produced from cranberry juice extracts in the form of powder
has become of high interest. Such transformation requires processing that significantly influences the
composition of polyphenolics. One of the promising approaches to obtain cranberry extract powders is spray
drying. Taking the above into consideration, the study aims at the evaluation of different inlet air
temperatures and application of carrier, i.e., inulin, on the quality of the spray-dried powder in order to
provide recommendations for its production.
Application of the inlet air temperature ranged from 150 C to 190 C during spray drying of cranberry juice
extract enabled for the obtainment of powders without and with the addition of inulin (freeze drying
technique was used as a control). In the powders, four major groups of polyphenolic compounds were
identified: flavonols, anthocyanins, phenolic acids, and flavan-3-ols. The inlet air temperature of spray
drying significantly affected the polyphenolics content in cranberry extract powders and the changes were
different when the inulin was added, pointing a strong role of carrier on the retention of selected groups of
polyphenols during drying. The content of polyphenols in spray-dried cranberry extract powders were
similar or even higher when compared to freeze drying (control), indicating that this drying technique can be
successfully applied for the production of cranberry powders.
This work was funded by the National Science Centre (Poland) on the basis of the agreement number
2016/23/D/NZ9/02671.
Keywords: cranberry, extracts, polyphenols, spray drying
International Conference on
RAW MATERIALS TO PROCESSED FOODS 03-04 June 2021, Turkey
123
Effect of Jam and Marmalade Processing and Storage on Phytochemical
Properties of Currant Cultivars (Ribes Spp.)
Esra Esin Yucel1*, Cemal Kaya1
1 Tokat Gaziosmanpasa University, Faculty of Engineering and Natural Sciences,
Department of Food Engineering, 60250, Tokat, Turkey
*E-mail: [email protected]
ABSTRACT
Currant fruits are recognized as being an important dietary source of health-related compounds,
such as anthocyanins and ascorbic acid. In this study, changes in phytochemical properties of different
currant (red, black, Ojebyn) cultivars while processing them into jam and marmalade and throughout the
storage were investigated. Total phenolics content (TPC), total antioxidant capacity (TEAC and FRAP), total
anthocyanins (TA), polymeric color (PC) and hydroxymethylfurfural (HMF) analyses were performed in
fresh currant fruits at the beginning of the storage. Also, the same analyses were carried out on jams and
marmalades at the end of 6-month storage period. Decreases were observed in TPC, TEAC, FRAP and TA
values of jam and marmalade samples of all types of currant varieties at the end of the storage. At the end of
6-month storage period, average TPC values varied between 405.74 -657.51 μg GAE/g; TEAC values
between 9.47 - 19.07 μmol TE/g; FRAP values between 7.97- 17.44 μmol TE/g and TA values varied
between 26.08 - 341.09 μg cy-3 glu/g. Ojebyn blackcurrant (OBC) jam and marmalade samples had the
greatest values at the end of 6-month storage.
Keywords: Antioxidant capacity, FRAP, polymeric color, TEAC

International Conference on
RAW MATERIALS TO PROCESSED FOODS 03-04 June 2021, Turkey
124
Effect of Endogenous Lipids and Proteins on the Antioxidant and Pasting
Properties of Sorghum bicolor Flour
Emmanuel Anyachukwu Irondi*, Adekemi Esther Adewuyi, Tolulope Muktar Aroyehun
Department of Biochemistry, Kwara State University, Malete, P.M.B. 1530, Ilorin, Nigeria *E-mail: [email protected], +2348034870657
ABSTRACT
The functionality of flour, including its bioactivities and industrial applications, reflects its chemical
constituents, which may exist either in free or bound state. Hence, this study evaluated the effect of
endogenous lipids and proteins on the antioxidant and pasting properties of Sorghum bicolor flour (SBF).
Different portions of SBF were defatted, deproteinized, or defatted and deproteinized, to remove the
endogenous lipids and proteins. The raw (control) and treated flours were analyzed for phytochemicals (total
phenolics, tannins, flavonoids, saponins and anthocyanins) levels, antioxidant activities (ABTS*+ and DPPH*
scavenging activities, reducing power and Fe2+ chelating capacity), starch and amylose contents, and pasting
properties. The raw flour contained high levels of the phytochemicals tested and exhibited potent antioxidant
activities. However, defatting (DF), deproteinization (DP), and defatting and deproteinization (DF-DP)
significantly (p < 0.05) reduced the levels of the phytochemicals and antioxidant activities of the flour, with
DF-DP resulting in the highest reduction. The starch and amylose contents of the flour increased
significantly as a result of DF, DP and DF-DP. This was accompanied with an increase of the trough
viscosity and peak time of the flour, but a decrease of the peak and breakdown viscosities. Therefore,
endogenous lipids and proteins may enhance the antioxidant and pasting properties of SBF; removing them
from the flour is not recommended.
Keywords: Antioxidant activities, Endogenous lipids and proteins, Pasting properties, Sorghum bicolor flour

International Conference on
RAW MATERIALS TO PROCESSED FOODS 03-04 June 2021, Turkey
125
First Principles Study of Structural and Electronic, Properties of Scxga1-Xn
Alloys
Beloufa Nabil1, Benazouzi Aicha2
1Laboratoire de Micro et Nanophysiques (LaMiN), Oran ENP, BP 1523, El M’Naouer, 31000, Oran
2Centre universitaire de Relizane, Département des sciences exacte, BP 48000, Bormadia, 048000 Relizane, Algeria
E-mail: [email protected], [email protected]
ABSTRACT
Using the first principles total energy calculations within the full-potential linearize muffin-tin orbitals
méthod, we have investigated the structural and electronic properties of ScxGa1-xN alloys, with Sc
concentration varying from 0% up to 100%, in zinc blend structure (the ground state configuration of GaN)
and in rocksalt structure (the ground state configuration of ScN).It is found that for Sc concentrations equal
or less than 0.25%, the favored structure is zinc blend, while for Sc concentrations greater than 0.25%, the
favored structure is rocksalt. It is also found that for zinc blend crystals, the fundamental gap is large and
direct. For the rocksalt crystals the fundamental gap is small and indirect.
Keywords: ScxGa1-xN, LMTO, LDA, zinc blend structure, rocksalt structure
International Conference on
RAW MATERIALS TO PROCESSED FOODS 03-04 June 2021, Turkey
126
The Effect of Different Fermentation Temperatures on Şalgam Quality
Mehmet Ali Cirak1, Bilal Agirman1, Huseyin Erten1
1Department of Food Engineering, Faculty of Agriculture, Cukurova University, Adana, Turkey
*E-mail: [email protected]
ABSTRACT
In this study, the effect of different fermentation temperatures on physical, chemical, microbiological and
sensorial characteristics of şalgam was evaluated. Şalgam produced by traditional method and five different
temperatures (15 °C, 20 °C, 25 °C, 30 °C and 35 °C) were applied during carrot (main) fermentation.
Fermentation time was shortened with increased temperature. Fermentation was successfully completed in
15 days for experiment performed at 35 °C, while it was terminated in 22 days for the trial at 15 °C. pH and
total acidity levels (as lactic acid) of şalgam ranged from 3.59 to 3.85 and from 5.45 g/L to 8.23 g/L at the
final product, respectively. Total anthocyanin and total phenolic contents of şalgam diminished with rising
temperature. The highest total anthocyanin (as cyanidine-3-glycoside) and total phenolic content (as gallic
acid equivalent) were determined as 201. 45 mg/L and 845.43 mg/L in experiment conducted at 15 °C,
respectively. Colour scores of produced şalgams were assessed according to CIELAB colour system.
Darkness of the şalgam decreased with increasing temperature, while redness value increased with rising
temperature. The lowest L* (the highest darkness) and the highest a* (highest redness) values were
determined in şalgam produced at 15 °C and 35 °C, respectively. From a microbiological point of view, it
has been determined that lowering the fermentation temperature does not have any negative effect on the
growth of microorganisms and a notable number of lactic acid bacteria and yeast was detected in all
experiments. According to the sensorial analysis (scoring and preference test) şalgam produced at 15 °C was
clearly the most favoured one while the şalgam produced at highest temperature (35 °C) was the least
preferred. As a conclusion, lessening fermentation temperature of şalgam to 15 °C positively influenced the
most of the quality parameters of şalgam.
Keywords: Black carrot, Fermentation, Lactic acid, Şalgam, Temperature

International Conference on
RAW MATERIALS TO PROCESSED FOODS 03-04 June 2021, Turkey
127
Characterization of Aroma-Aroma Active Compounds of Qvevri White Wines
Produced from Ketengömlek Grapes with Gas Chromatography–Mass
Spectrometry–Olfactometry (GC–MS–O)
Müge Canatar1,2, Merve Darıcı1, Turgut Cabaroğlu1*
1 Department of Food Engineering, Faculty of Agriculture, Cukurova University, 01330 Adana, Turkey 2 Department of Food Technology, Manavgat Vocational School, Akdeniz University, 07600 Antalya, Turkey
E-mail: [email protected], Phone: +90 530 178 15 01
ABSTRACT
The Qvevri Wine, produced in amphorae in which alcoholic fermentation and the aging of wine occur is
getting popular among many winemakers in Georgia, Europe and Turkey as well. In this study, the white
wine was produced by spontaneous fermentation without using special yeast and any chemicals. The
Ketengömlek grape, a local variety from ancient times in the Cappadocia Region, was used for making
wines. The quality characteristics of this wine were determined. The aroma and aroma active compounds of
this qvevri white wine have been qualitatively and quantitatively studied for the first time by using gas
chromatography-mass spectrometry-olfactometry (GC-MS-O) and the findings obtained have been compared
with the wine produced by the commercial method.
A total of 62 aroma compounds (283 mg/L) including esters (16), alcohols (16), acids (9), lactones (5), the
C-6 compounds (4), phenols (8), ketones (2), terpene (1) and N-compound (1) were identified and quantified
in the qvevri wine. The wine produced by commercial method consists of alcohols (13), esters (13), acids
(10), lactones (4), the 6-C compounds (3), phenols (2), ketone (1), aldehyde (1) and N-compound (1) had 48
aroma compounds at the concentrations of 203.4 mg/L. In both wine samples, alcohols and esters were the
predominant compounds in terms of number and amount. The qvevri wine came to the forefront with the
notes of earthy, mineral, mushroom, honey, linden and sherry among determined 19 aroma active
compounds. In the commercial wine 14 aroma active compounds giving floral, fruity, rose and linden scents
were identified.
Keywords: amphorae, aroma compounds, olfactometry, qvevri wine

International Conference on
RAW MATERIALS TO PROCESSED FOODS 03-04 June 2021, Turkey
128
Comparison of Volatile Compounds in Sesame Oil and Sesame Cake Extract
Berfu GELEN1, Serkan SELLİ2
1Department of Food Technology, Adana Vocational School, Çukurova University, Çukurova,01170 Adana, Turkey.
2Department of Food Engineering, Faculty of Agriculture, Çukurova University, Balcali,01330 Adana, Turkey.
Presenter’s telephone: +90 322 226 41 60, fax: +90 322 226 4974
E-mail: [email protected]
ABSTRACT
Sesame (Sesamum indicum) is one of the most important oilseed crops (due to its high level of
lipid) in the world. In recent years, consumers' demand for this oil has increased due to the positive effects
on human health. Cold press oils are seed oils obtained without changing the quality of the oil and processed
only mechanically (such as pressing). These oils can only be purified by water, filtration or centrifugation.
Therefore, they preserve their beneficial ingredients. Sesame seeds have high amounts of fat, protein,
mineral, phenolic and volatile components. In addition to these components of sesame seeds, the obtained
sesame oil, sesame cake and shell also contain a high proportion of these components. The sesame cake is
a by-product of the edible oil industry which could be recovered and used as a value added product.
In this study, it was aimed to compare volatile compounds in cold press sesame oil and its cake extract.
The volatile compounds were extracted using purge and trap extraction and identified by gas
chromatography–mass spectrometry (GC–MS). The main volatile compounds were composed of aldehydes,
alcohols, terpenes, pyrazines, ketones, furans and lactones in the samples. In oil samples, these compounds
were identified as the dominant aroma group and a significant reduction was found in the amount of these
compounds in the sesame cake samples. Among these, hexanal was found in high level in sesame oil while it
was not found in cake extract.
Keywords: sesame, sesame oil, aroma compounds, volatile compounds
INTRODUCTION
Sesame (Sesamum indicum) is an oil-bearing plant that contains %50-60 oil and %25 protein in its seeds
(Dong et al., 2012; Li et al.,2016). This plant, whose homeland is thought to be Asia or East Africa, has been
cultivated since ancient times. Today, although the sesame production is widespread, the leading sesame
producers are Sudan, Venezuela, India, Nigeria, China, Mexico and Burma. In Turkey, sesame is grown
mainly in Southeast Anatolia, Mediterranean, Aegean and Marmara regions (Arslan et al., 2018). World
sesame production is approximately 3.5 million tons per year. Sudan is the country that produces the most
sesame seeds (981000 tons) in the world. In Turkey sesame oil production is 33600 tons in 2018
(FAOSTAT, 2018). Sesame seeds and oils are rich in health beneficial components. Sesame seeds contain
high amounts of oil, protein, mineral substances, phenolic compounds and volatile compounds. In general,
oil can be obtained from sesame in two different ways as from roasted or unroasted seeds. To preserve the
beneficial and delicate compounds like volatiles in seeds, cold press is generally preferred in obtaining the
oil. Aroma is one of the most important criteria that determines the quality and consumer acceptability of a
food product. The overall aroma of sesame oil significantly depends on the roasting conditions, oil extraction
conditions, and the changes in the relative concentrations of the volatiles. The aroma profile of sesame oil is
closely related to its manufacturing processes as mentioned previously (Tamura et al., 2011; Dong et al.,
2012). Applied processes like roasting in obtaining sesame oil were reported to have a favorable effect on the
volatile compounds such as pyrazines, furans and other thermally driven compounds (Shimoda et al., 1997).
International Conference on
RAW MATERIALS TO PROCESSED FOODS 03-04 June 2021, Turkey
129
Dong et al. (2012), investigated the roasting effect on the volatiles of sesame oil and reported that the process
had an increasing effect on pyrazines, furans and sesamol compounds.
There is limited information in the literature on comparison of volatile compounds between cold press
sesame oil and sesame cake extract. Therefore in this study, it was aimed to compare volatile compounds in
cold press sesame oil and its cake extract by the application of purge and trap extraction and GC-MS
characterization.
MATERIALS AND METHODS
Materials
Cold pressed sesame oil and sesame cake were purchased from a local producer in Adana, Turkey. The
standard aroma compounds were purchased from Sigma-Aldrich (Steinheim, Germany). Dichloromethane,
was supplied by Merck (Darmstadt, Germany). All chemicals and solvents used in this study were of
analytical and chromatography grade.
Methods
Extraction and Analysis of Volatile Compounds
The aroma compounds of sesame oil and its cake were determined by purge and trap (PT) method. The PT
extraction process consisted of a source of nitrogen controlled by a flow-meter (LZT 4-M, Union-Tek
Instrument, China). The needle of the source of N2 and the cartridge were installed through the septum to
purge and trap the aroma compounds. The temperature of the vial sample was controlled by a thermostat, 3
ml of sample transferred into a 20 ml vial, then the sample was pre-incubated at the extraction temperature
(60ºC) for 10 min. (Sonmezdag, Kelebek, and Selli, 2018).
GC-MS analysis of volatile compounds
The GC system consisted of an Agilent 6890 equipped with a flame ionization detector (FID), and an Agilent
5973N – mass selective detector (MSD). Aroma compounds were separated on a DB-Wax (30 m x 0.25 mm,
0.5 μm thickness; J&W Scientific, Folsom, CA). A total of 3 μL of extract was injected each time in pulsed
splitless (40 psi; 0.5 min) mode. The injector and FID were set at 270 and 280 °C, respectively. The flow rate
of carrier gas (helium) was 1.5 mL/min. The oven temperatures was first increased from 50 to 200 °C at a
rate of 5 °C/min and then to 260 °C at 8 °C/min with a final hold at 260 °C for 5 min. The mass detector was
operated in scan mode, with electronic impact ionization energy of 70 eV. The GC–MS interface and
ionization source temperatures were set at 250 and 180 °C, respectively. Identification and quantification
were performed in full scan mode scanning a mass range of m/z 30–300 at 2.0 scan/s. The compounds were
identified by comparing their mass spectra output with those in Wiley 9 and NIST 11 mass spectral data
libraries and an in-house library created from previous laboratory studies using similarity searching of MS
fragmentation (Selli and Kelebek, 2011). Compounds were taken into account if they had a similarity match
of at least 80% with the MS fragmentation in the databases. The chromatogram obtained was analysed, and
each peak was checked by determining the per cent area on the chromatogram, the retention time, the
spectrum and the base peak and then referring to the characteristic mass spectra of compounds listed on the
National Institute of Standards and Technologies (NIST) using the software of Agilent ChemStation. Each
sample was analysed in triplicate. Linear Retention Indices (LRI) was calculated Linear retention index
calculated on DB-WAX capillary column.
RESULTS AND DISCUSSION
Volatile composition of samples
It is very important to choose the most suitable method for the determination of aroma compounds. Purge
and trap extraction method gave the best results among the another tried-and-tested methods (Liquid-liquid
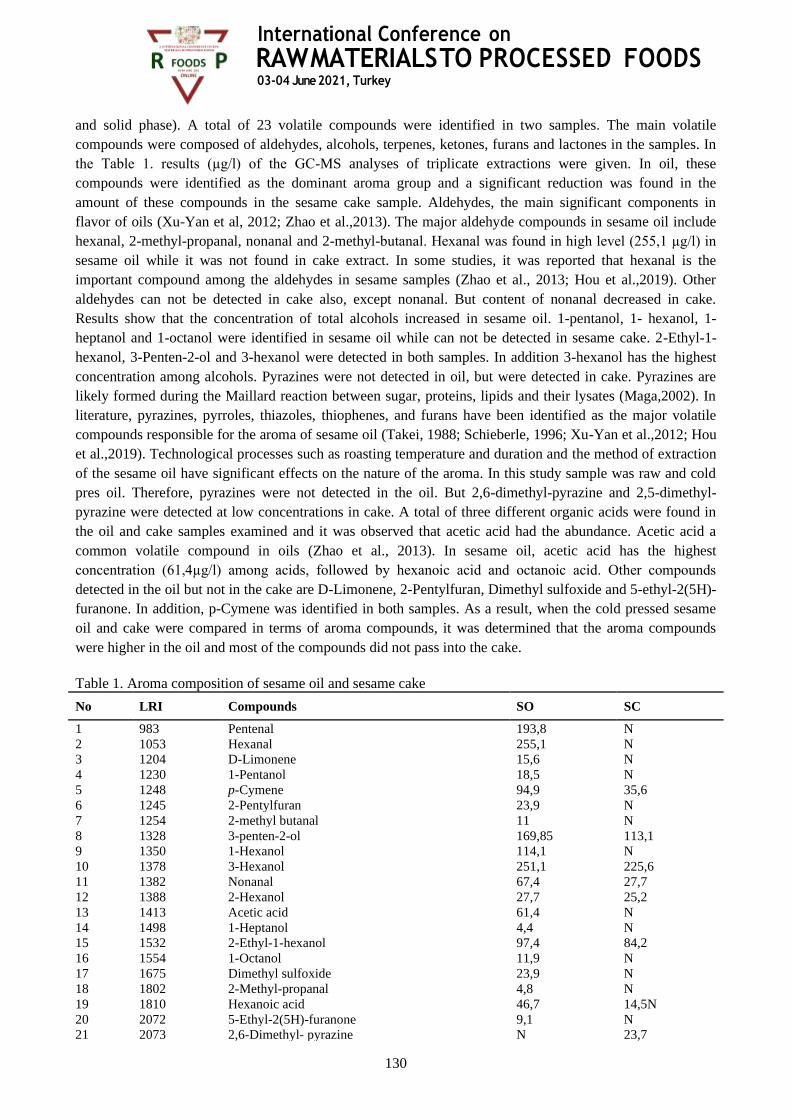
International Conference on
RAW MATERIALS TO PROCESSED FOODS 03-04 June 2021, Turkey
130
and solid phase). A total of 23 volatile compounds were identified in two samples. The main volatile
compounds were composed of aldehydes, alcohols, terpenes, ketones, furans and lactones in the samples. In
the Table 1. results (µg/l) of the GC-MS analyses of triplicate extractions were given. In oil, these
compounds were identified as the dominant aroma group and a significant reduction was found in the
amount of these compounds in the sesame cake sample. Aldehydes, the main significant components in
flavor of oils (Xu-Yan et al, 2012; Zhao et al.,2013). The major aldehyde compounds in sesame oil include
hexanal, 2-methyl-propanal, nonanal and 2-methyl-butanal. Hexanal was found in high level (255,1 µg/l) in
sesame oil while it was not found in cake extract. In some studies, it was reported that hexanal is the
important compound among the aldehydes in sesame samples (Zhao et al., 2013; Hou et al.,2019). Other
aldehydes can not be detected in cake also, except nonanal. But content of nonanal decreased in cake.
Results show that the concentration of total alcohols increased in sesame oil. 1-pentanol, 1- hexanol, 1-
heptanol and 1-octanol were identified in sesame oil while can not be detected in sesame cake. 2-Ethyl-1-
hexanol, 3-Penten-2-ol and 3-hexanol were detected in both samples. In addition 3-hexanol has the highest
concentration among alcohols. Pyrazines were not detected in oil, but were detected in cake. Pyrazines are
likely formed during the Maillard reaction between sugar, proteins, lipids and their lysates (Maga,2002). In
literature, pyrazines, pyrroles, thiazoles, thiophenes, and furans have been identified as the major volatile
compounds responsible for the aroma of sesame oil (Takei, 1988; Schieberle, 1996; Xu-Yan et al.,2012; Hou
et al.,2019). Technological processes such as roasting temperature and duration and the method of extraction
of the sesame oil have significant effects on the nature of the aroma. In this study sample was raw and cold
pres oil. Therefore, pyrazines were not detected in the oil. But 2,6-dimethyl-pyrazine and 2,5-dimethyl-
pyrazine were detected at low concentrations in cake. A total of three different organic acids were found in
the oil and cake samples examined and it was observed that acetic acid had the abundance. Acetic acid a
common volatile compound in oils (Zhao et al., 2013). In sesame oil, acetic acid has the highest
concentration (61,4µg/l) among acids, followed by hexanoic acid and octanoic acid. Other compounds
detected in the oil but not in the cake are D-Limonene, 2-Pentylfuran, Dimethyl sulfoxide and 5-ethyl-2(5H)-
furanone. In addition, p-Cymene was identified in both samples. As a result, when the cold pressed sesame
oil and cake were compared in terms of aroma compounds, it was determined that the aroma compounds
were higher in the oil and most of the compounds did not pass into the cake.
Table 1. Aroma composition of sesame oil and sesame cake
No LRI Compounds SO SC
1 983 Pentenal 193,8 N
2 1053 Hexanal 255,1 N
3 1204 D-Limonene 15,6 N
4 1230 1-Pentanol 18,5 N
5 1248 p-Cymene 94,9 35,6
6 1245 2-Pentylfuran 23,9 N
7 1254 2-methyl butanal 11 N
8 1328 3-penten-2-ol 169,85 113,1
9 1350 1-Hexanol 114,1 N
10 1378 3-Hexanol 251,1 225,6
11 1382 Nonanal 67,4 27,7
12 1388 2-Hexanol 27,7 25,2
13 1413 Acetic acid 61,4 N
14 1498 1-Heptanol 4,4 N
15 1532 2-Ethyl-1-hexanol 97,4 84,2
16 1554 1-Octanol 11,9 N
17 1675 Dimethyl sulfoxide 23,9 N
18 1802 2-Methyl-propanal 4,8 N
19 1810 Hexanoic acid 46,7 14,5N
20 2072 5-Ethyl-2(5H)-furanone 9,1 N
21 2073 2,6-Dimethyl- pyrazine N 23,7
International Conference on
RAW MATERIALS TO PROCESSED FOODS 03-04 June 2021, Turkey
131
22 2075 2,5-dimethyl-pyrazine N 17,5
23 2083 Octanoic acid 58,4 15,2
*LRI: Linear retention index calculated on DB-WAX capillary column; N: Not found; The results are the means of %
peak areas obtained from 3 different injections.
**SO: Sesame oil; SC: Sesame cake
CONCLUSIONS
It was aimed to compare volatile compounds in cold press sesame oil and its cake extract. Total of 23 aroma
compounds with the majority of aldehydes were identified in samples. Hexanal was found dominantly in all
samples and as a result of pressing, it was observed that this compound did not pass into cake. In the light of
the findings, it was determined that the amount of volatile compounds in sesame oil was higher than the
cake. The resulting data might be useful for the pressing process, improvement of product flavor and
increase of consumer acceptability.
REFERENCES
Arslan, H., Ekin, Z., & Hatipoglu, H. (2018). Performances of sesame genotypes (Sesamum indicum L.) with
different seed shell colors in semi-arid climate conditions. Fresenius Environmental Bulletin, 27,
8139-8146.
Barboni, T., Muselli, A., Luro, F., Desjobert, J. M., & Costa, J. (2010). Influence of processing steps and
fruit maturity on volatile concentrations in juices from clementine, mandarin, and their hybrids.
European Food Research and Technology, 231(3), 379-386.
Dong, X.Y., Li, P.P., Wei, F., Jiang, M.L., Zhao, Y.Z., Li, G.M., Chen, H., & Zhao, Y.D. (2012). The impact
of processing on the profile of volatile compounds in sesame oil. European Journal Lipid Science
Technology, 114, 277-286.
FAO, (2019). Food and Agriculture Organisation. Detailed information, available at:
http://www.fao.org/faostat/en/#data/TM
Hou, L., Zhang, Y., & Wang, X. (2019). Characterization of the volatile compounds and taste attributes of
sesame pastes processed at different temperatures. Journal of Oleo Science, 68(6), 551-558.
Li, H.X., Liang, J.W., Song, Y.L., Fu, G.M.i., Rao, Y.L., & Wan., Y. (2016). Analysis of fatty acid
composition and volatile components in cold-pressed sesame oil after controlled thermal oxidation.
Modern Food Science and Technology. 32, 276-282.
Maga, J.A. (2002). Pyrroles in foods. Journal of Agricultural Food Chemistry. 29, 691-694.
Shimoda, M., Nakada, Y., Nakashima, M., & Osajima, Y. (1997). Quantitative comparison of volatile flavor
compounds in deep-roasted and light-roasted sesame seed oil. Journal of Agricultural and Food
Chemistry, 45(8), 3193-3196.
Sonmezdag, A. S., Kelebek, H., Selli, S. (2018). Pistachio oil (Pistacia vera L. cv. Uzun): Characterization of
key odorants in a representative aromatic extract by GC-MS-olfactometry and phenolic profile by
LC-ESI-MS/MS. Food Chemistry,240,24–31.
Sonmezdag, A. S., Kesen, S., Amanpour, A., Guclu, G., Kelebek, H., Selli, S. (2019). LC-DAD-ESI-MS/MS
and GC-MS profiling of phenolic and aroma compounds of high oleic sunflower oil during deep-fat
frying. Journal of Food Processing and Preservation, 43(3).
Tamura, H., Fujita, A., Steinhaus, M., Takahisa, E., Watanabe, H., & Schieberle, P. (2011). Assessment of
the aroma impact of major odor-active thiols in pan-roasted white sesame seeds by calculation of
odor activity values. Journal of Agricultural and Food Chemistry, 59(18), 10211-10218.
Zhou, Q., Geng, F., Deng, Q., Huang, F., Wang, J. (2019). Dynamic analysis of polar metabolites and
volatile compounds in sesame seeds during roasting. Cereal Chemistry, 96,358–369.
International Conference on
RAW MATERIALS TO PROCESSED FOODS 03-04 June 2021, Turkey
132
Larvicidal Activity on Culex pipiens L. Fourth Instar and Phytochemical
Characteristics of Aqueous Extracts from Leaves and Roots of Two Species
from the Genus Plantago: Plantago major L. and Plantago lagopus L.
Anwar BOUALI1*,; Héla EL FERCHICHI OUARDA1
1Université de Carthage; Faculté des Sciences de Bizerte; Département des Sciences de la Vie; Laboratoire de de Plant
Toxicology & Environmental Microbiology
ABSTRACT
Nowadays, a large number of aromatic and medicinal plants have very important biological properties that
have many applications in various fields, as industry, medicine, food additive… Among these plants we can
mention the Plantaginaceae family and precisely the genus Plantago which has several biological activities,
this is due to its richness in various secondary metabolites (polyphenols, etc.), among these activities we can
cite antioxidant activity, antiviral activity, and reduction of the immunosuppressive effects of anticancer
drugs. However, there has been no previous research on the insecticidal activities of extracts of the genus
Plantago in the world. Indeed, the larvicidal activity of aqueous extracts from leaves and roots from
Plantago major L. and Plantago lagopus L. were evaluated on fourth instars of Culex pipiens L. Plant
material was collected in two regions of Tunisia, Beja and Bizerte. Differences of toxicity between P. major
leaves extracts according to geographical origin resulted insignificant during the observation period. While
leaves extracts from P. lagopus collected in Bizerte resulted more toxic compared to those of Beja up to 12
h, nonetheless differences became not significant at 24 h. Distinct figures ensued for root extracts, as
geographical origin influenced toxicity and P. lagopus extract from roots collected in Bizerte yielded a
significantly greater mortality compared to those from Beja, even at the last observation. With respect to leaf
extract concentration, larvae mortality levels at the last survey were similar for both species. ranging from
80 to 100% with 50 and 100 ppm, respectively. As a general role, with 10 and 25 ppm the extracts of P.
major leaves resulted more effective. Root extracts had a lower toxicity, and mortality after 24 h ranged
between 20 and 60% with the highest values attained with 100 ppm of P. lagopus extract. The median lethal
concentration (LC50) was about 1.50 %. Quantitation of total polyphenols, flavonoids and condensed tannins,
evidenced clear differences between species, organs, and geographical origin. Indeed, root and leave extracts
from P. major collected in Beja owned higher concentrations compared to those from Bizerte. While, for P.
lagopus leaves extracts the ones from Beja had the highest concentrations. These preliminary results pave the
way to develop a novel natural bioside to control mosquito. In addition, we have found that there is a good
correlation between the larvicidal activity and the content of phenolic compounds, which allows us to
conclude that they are partly responsible for this larvicidal activity.
Keywords: Plantago major L.; Plantago lagopus L.; Mosquito; Total polyphenols, Flavonoids; Condensed
tannins; Larvicidal activity
International Conference on
RAW MATERIALS TO PROCESSED FOODS 03-04 June 2021, Turkey
133
Influence of the Carrier Type and Drying Methods on the Physico-Chemical
Properties of Sustainable Powders Gained from Chokeberry Pomace Extracts
Hendrysiak Aleksandra, Michalska-Ciechanowska Anna*, Wojdyło Aneta, Brzezowska Jessica
Wrocław University of Environmental and Life Sciences, the Faculty of Biotechnology and Food Sciences, Department
of Fruit, Vegetable and Plant Nutraceutical Technology, Chełmońskiego 37 Str., 51-630 Wrocław, Poland; tel: +48 71
320 7712, fax.: +48 71 320 7707, E-mail: [email protected]
ABSTRACT
Chokeberry is one of the richest plant-based source of bioactives, mainly polyphenols. Its processing
generates a considerable amount of by-products that could be used for recovering of those constituents with
proven health-promoting properties. One of the ways to preserve polyphenols from chokeberry by-products
its obtainment of extracts and their conversion into easy-to-handle form of sustainable powders. Such
conversion is a complicated process and requires numerous processing steps (extraction, application of
carrier, selection of drying techniques and its parameters) that will modify the initial composition of raw
material. The study aims at evaluation of influence of addition of maltodextrin, inulin, and trehalose (10%;
w/w) and drying techniques (freeze- and vacuum drying at 60 C and 90 C) on the polyphenols content and
antioxidant capacity of chokeberry pomace extract powders.
Powders gained after vacuum drying had lower moisture content and water activity when compared to
products gained after freeze drying. The bulk density was lower in case of powders obtained after freeze-
drying, except products gained with trehalose. In this case, the increase in temperature of vacuum drying
resulted in higher values of bulk density. In powders, 3 major groups of polyphenolic compounds were
identified: anthocyanins, flavonols, and phenolic acids. When the drying techniques were concerned, freeze-
drying caused the highest retention of polyphenols, regardless the carrier applied for their preparation. In
case of application of selected carrier, the highest retention of sum of identified polyphenols was noted for
powders gained after freeze-drying with the addition of maltodextrin and trehalose, whereas inulin resulted
in the highest content of polyphenols when vacuum drying at 60 C was used. Thus, the type of carrier and
drying techniques had a strong influence on the physical properties and significantly influence the retention
of polyphenolics in powders.
The research is co-financed under the individual student research project „Młode umysły – Young Minds Project” from
the subsidy increased for the period 2020–2025 in the amount of 2% of the subsidy referred to Art. 387 (3) of the Law
of 20 July 2018 on Higher Education and Science, obtained in 2019.
Keywords: chokeberry, extracts, polyphenols, drying

International Conference on
RAW MATERIALS TO PROCESSED FOODS 03-04 June 2021, Turkey
134
Experimental Studies of the Drying Process of Plant Materials
Jasur Safarov, Gani Dadayev
Tashkent State Technical University, 100095, Str. University 2, Tashkent, Uzbekistan
E-mail: [email protected]; +99893 569-02-88
ABSTRACT
The developed solar water heating dryer is designed for food and pharmaceutical companies to produce
high-quality products - dried and concentrated extracts of vegetables, fruits and herbs, as well as syrups,
mashed potatoes and dry concentrates with the preservation of biologically active substances and healthy
ingredients based on local raw materials. Experimental studies were performed on a laboratory solar-water
convective heating unit and curves were obtained for the duration and temperature of the drying process of
medicinal plants. Based on the results of experimental studies of the dehydration process in a laboratory
unit, an engineering methodology has been developed for calculating the design and technological
parameters of an industrial solar-water convective installation. A comparative analysis of the behavior of
the constituent extractives of medicinal plants, as well as the ash content and final moisture content of
medicinal plants under the implementation of various drying methods, was carried out.
Keywords: solar water heating dryer, medicinal plants.

International Conference on
RAW MATERIALS TO PROCESSED FOODS 03-04 June 2021, Turkey
135
Antiglycation Potential of Freeze-Dried Powders Obtained from Different Fruit
Fractions
Jessica Brzezowska, Anna Michalska-Ciechanowska, Aleksandra Hendrysiak
1 Wrocław University of Environmental and Life Sciences, the Faculty of Biotechnology and Food Sciences, Department
of Fruit, Vegetable and Plant Nutraceutical Technology, Chełmońskiego 37 Str., 51-630 Wrocław, Poland
Presenter: Jessica Brzezowska, tel: +48 71 320 7721, E-mail: [email protected]
ABSTRACT
Fruit powders, due to their versatile applications, are increasingly consumed as food additives in everyday
people diets. However, there is a significant lack in the literature on the biological properties of such
products. One of them is the ability to inhibit the formation of advanced glycation end products (AGEs)
formed during the glycation reaction in the human body, particularly damaging in conditions of diabetes and
other civilization diseases.
For this reason, this study aimed to evaluate the antiglycation activities (Bovine Serum Albumin (BSA)-
glucose, BSA- methylglyoxal (MGO), and MGO-arginine model systems) in vitro of powders obtained from
four different fractions (fruit, pomace, juice and sugar-free extract) of blackcurrant, Japanese quince, haskap
berry and rosehip fruits. The total polyphenolic content (TPC) as well as antioxidant capacity (ABTS and
FRAP assay) was also examined.
The antiglycation activities of fruit powders are affected by the specific chemical composition of each type
of fruit as well as the fraction type. Interestingly, in the case of BSA-glucose model the formation of
fluorescent AGEs was more influenced by the fruit composition, while for the other models it was the
fraction type. Among the analysed fruits, the highest antiglycation activity was observed in haskap berry and
Japanese quince powders. Comparing the different fractions, the most effective inhibitor of AGEs formation
proved to be the powdered sugar-free extract rich in polyphenolics, while the powders obtained from pomace
showed the lowest antiglycation activity, except for rosehip in the BSA-glucose model. Here, it was the
powdered juice that showed the lowest inhibition values. Furthermore, strong correlations were found
between the antiglycation activity determined by BSA-MGO and MGO-arginine and the antioxidant capacity
as well as TPC. Therefore, the type of fruit and its fractions significantly influence the antiglycation potential
of freeze-dried powders.
The work was financially supported by the National Science Centre (NCN), Poland, on the basis of the
agreement no. 2019/35/N/NZ9/03208.
Keywords: fruit powders, Advanced Glycation End products, polyphenols, antioxidant capacity

International Conference on
RAW MATERIALS TO PROCESSED FOODS 03-04 June 2021, Turkey
136
A Comparison of the Acid Gelation Properties of Nonfat Cow, Sheep and Goat
Milks with Standardized Protein Contents
Çağım Akbulut Çakır*, Ergül Teker
Department of Food Science, Harran University, Sanliurfa, Turkey
*E-mail: [email protected]
ABSTRACT
Acid gelation of the milk is essential for the production of many dairy products that involve fermentation
such as yogurt. Previous studies showed major differences between cow, sheep and goat milk yogurts.
However, there is not much study that compares acid gelation and gel properties of standardized cow, sheep
and goat milks. In this study we standardized the total protein, total solids and fat contents of the cow, sheep
and goat milks; and after heat treatment we used Glucono Delta Lactone (GDL) for slow acidification to
mimic the fermentation process. Acid coagulation was monitored by measuring the turbidity and viscosity in
every 10 min. and change in the pH was measured every min. throughout the incubation. Chemical
composition (total solids, fat, protein, casein, bound and soluble Ca, P, Fe, Mg, K, Na), pH, acidity, SDS-
PAGE analysis of the milk samples and viscosity, serum separation and SEM images of the acidified milk
gels revealed several differences between standardized cow, sheep and goat milk samples and their acidified
milk gels. During the incubation highest decrease in pH observed with cow milk while sheep milk pH was
higher and was above pH 4.6 at the end of incubation. Cow milk gels had the highest viscosity, lowest serum
separation and more homogenous microstructure. Sheep milk gels had a lower viscosity than the cow milk
and goat milks formed the weakest acid gels of all. Results showed that, although the total protein and dry
matter content of milk samples were standardized, acid coagulation properties of milk samples showed
dramatic differences. These differences were likely as a result of the differences between proteins,
particularly the different ratio and amounts of caseins (αs1, αs2, β and κ) and serum proteins found in the
different milk types and differences in heat induced interactions between caseins and serum proteins.
Keywords: Cow milk, Sheep milk, Goat milk, Acid coagulation
International Conference on
RAW MATERIALS TO PROCESSED FOODS 03-04 June 2021, Turkey
137
The Use of Torulaspora delbrueckii Yeast for the Production of Beer
Firuze Kayadelen1, Bilal Agirman1, Huseyin Erten1
1Department of Food Engineering, Faculty of Agriculture, Cukurova University, Adana, Turkey
E-mail: [email protected]
ABSTRACT
In this study, the effect of utilization of five different Torulaspora delbrueckii (Y1018, Y1026, Y1013,
Y1031, C134V4) strains in combination with the lager type Saccharomyces cerevisiae on physical, chemical,
microbiological, aroma composition and sensory profile of beer were examined. Ethyl alcohol fermentations
were completed in 12 days and specific gravity of beers were ranged from 1.005 g/cm3 to 1.007 g/cm3 at the
end of the fermentation. Ethyl alcohol content of produced beers was changed between 5.46 % (v/v) and 5.93
% (v/v), while the highest alcohol amount was obtained by using single culture of S. cerevisiae (control).
The pH and total acidity (as lactic acid) level of beers was ranged from 4.27 to 4.41 and 0.30 g/L to 0.34 g/L,
respectively. At the end of the fermentation, the highest Saccharomyces and non-Saccharomyces yeast
numbers were determined in experiment that used the mixture of strain C134V4 with S. cerevisiae as 6.84
log cfu/mL and 6.79 log cfu/mL, respectively. The lowest total yeast number were detected in control group
as 6.11 log cfu/ml, while minimum number of non-Saccharomyces yeast was found as 5 log cfu/ml in beer
produced with the mixture of strain Y1018 and S. cerevisiae. The prominent compounds among the aroma
compounds of beer were determined as acetaldehyde, n-propanol, 3-methyl-1-butanol, 2-methyl-1-butanol,
ethyl acetate, isoamyl acetate, free 2,3-butanedione and free 2,3-pentanedione. It was ascertained that the
total amount of higher alcohols and esters were higher in all mixed culture samples than control group. In
terms of sensory evaluation, beer produced with mixed culture of S. cerevisiae and T. delbrueckii Y1031 was
the most preferred one characterized to be high in hop aroma and full-bodied. As a result, it was
demonstrated that the use of Torulaspora delbrueckii as a non-conventional yeast in mixed fermentations
with S. cerevisiae was effective on beer quality.
Keywords: Aroma, Beer, Ethyl acetate, Fermentation, Non-Saccharomyces, Sensory
International Conference on
RAW MATERIALS TO PROCESSED FOODS 03-04 June 2021, Turkey
138
Sensory Lexicon and Major Volatiles of Rakı Using Descriptive Analysis and
GC-FID-MS
Merve Darıcı1*, Koray Özcan1,2, Duygu Beypinar2, Turgut Cabaroglu1
1Department of Food Engineering, Faculty of Agriculture, University of Çukurova, Adana, Turkey 2Mey Alkollü İçkiler San.ve Tic. A.Ş., Büyükdere Cad. Bahar Sok. No:13 River Plaza Kat:25 34394 Şişli, İstanbul,
Turkey.
Presenter’s phone: +90 322 338 61 73 (114), fax: + 90 322 338 66 14, E-mail: [email protected]
ABSTRACT
Rakı is a traditional and Protected Designation of Origin (PDO) alcoholic beverage that is distilled from
grape distillate, suma with aniseed (Pimpinella anisum) in copper pot stills in Turkey. This study focused on
the development of a sensory lexicon, the creation of a sensory wheel and determination of major volatiles
by GC-FID-MS for Rakı. 37 Rakı samples representing different producers within the various style and
quality categories were used for volatile and sensory evaluation. The experts identified 78 attributes and
references for the lexicon. The main attributes were spicy, anise, sweet, resinous, fruity, dry fruit, floral,
head&tail aroma and white colour. The Rakı sensory wheel was created to provide a graphical display of its
sensory attributes, with three sensory modalities. For validation of the lexicon, 18 Rakı samples were
evaluated using descriptive analysis. The results were subjected to principal component analysis (PCA) to
examine the relationship of the Rakı samples with the defined sensory attributes. The PCA results show that
there is a significant relationship between the Rakı categories and sensory terms and flavour intensities. The
GC-MS analyses depicted the following major volatile compounds n-propanol, 2-methyl-1-propanol, 2 and
3-methyl-1-butanol, ethyl acetate, acetal, acetaldehyde, trans-anethol and estragol. Grape distillate based
total volatiles ranged between 104.7-220.9 g/hl PA and the anise based total volatiles ranged 1029.5-2118.6
mg/L in Rakı. This is the first study in the literature to determine the sensory lexicon and sensory wheel of
the distilled beverages of Rakı. The characterization and presentation of the product using its most distinctive
sensory descriptors are important tool and can be used for the industry, marketing, consumer education and
for scientists researching Rakı products. These findings can help to define and improve new styles of
products and maintain the quality of existing ones.
Keywords: Rakı, Volatiles, Lexion, Sensory Wheel, Descriptive Analysis
International Conference on
RAW MATERIALS TO PROCESSED FOODS 03-04 June 2021, Turkey
139
Modeling of Hibiscus Anthocyanins Transport to Apple Tissue During
Ultrasound Assisted Vacuum Impregnation
Cüneyt Dinçer1,2
1Akdeniz University, Food Safety and Agricultural Research Center, Antalya, Turkey 2Akdeniz University, Finike Vocational School, Antalya, Turkey
Phone: 90 242 227 44 00 /2598, e-mail address: [email protected]
ABSTRACT
This study reports the mathematical modeling of hibiscus anthocyanins transport to apple tissues under
various vacuum impregnation (VI) conditions (Control, VI 100, 250, and 500 mbar; ultrasound-assisted VI
100, 250 and 500 mbar). Azuara, Peleg, Diffusive, Z & L and Weibull mathematical models were used to
describe the water gain and anthocyanin gain’s mass transfer kinetics. Azuara model successfully described
the kinetic parameters of mass transfer during impregnation treatment. The equilibrium anthocyanin (AG∞)
and water gain (WG∞) values predicted by the Azuara model varied between 38.4001-58.2536 and 24.0863-
33.0245 mg/kg, respectively. Anthocyanin and water diffusion coefficients of the samples ranged between
0.406x10⁻⁹, -1.68x10⁻⁹, 0.117x10⁻⁹ and 0.715x10⁻⁹ m2/s, respectively. Ultrasound treatment increased
moisture and anthocyanin gain during vacuum impregnation. At the end of the 30 min process, the highest
anthocyanin content was determined as 38.85 mg/kg in samples treated ultrasound-assisted vacuum at 100
mbar.
Keywords: Apple, anthocyanin, modeling, ultrasound, vacuum impregnation
International Conference on
RAW MATERIALS TO PROCESSED FOODS 03-04 June 2021, Turkey
140
Phytochemicals, Antioxidant Attributes and Larvicidal Activity of Mercurialis
annua L. (Euphorbiaceae) Leaf Extracts against Tribolium confusum (Du Val)
Larvae (Coleoptera; Tenebrionidae)
Rania Ben Nasr 1,2*, Amadou Dicko 1, Hela El Ferchichi Ouarda2
1 Laboratoire de Chimie et de Physique—Approches Multi-échelles des Milieux Complexes (LCP-A2MC)1, Boulevard
Arago, CEDEX 03, 57078 Metz, France ; [email protected] 2 Laboratory of Plant Toxicology & Environmental Microbiology, Faculty of Science of Bizerte, University of Carthage,
Zarzouna 7021, Tunisia; [email protected]
* Correspondence: [email protected]
ABSTRACT
This study reports the link between larvicidal activity and the phytochemical composition of male and female
leaf extracts of Mercurialis annua L. (M. annua) from four Tunisian regions: Bizerte, Jandouba, Nabeul and
Beja. Their antioxidant activity was evaluated using DPPH (2, 2-diphenyl-1-picrylhydrazyl) assays. Phenolic
compounds were identified and quantified using liquid chromatography coupled with a UV detector and
mass spectrometry (LC-UV-ESI/MS). Higher antioxidant activity (AOA) was found in the leaves of male
plant extracts than of female ones. The leaves of male and female plant extracts from Bizerte exhibited the
highest AOA: 22.04 and 22.78 mg Trolox equivalent/g dry matter (mg TE/g DM), respectively. For both
sexes, plant extracts from Beja had the lowest AOA with 19.71 and 19.67 mg TE/g DM for male and female
plants, respectively. Some phenolic compounds such as narcissin, gallocatechin, rutin, epigallocatechin and
epicatechin were identified and quantified using LC-MS, which highlighted the abundance of narcissin and
rutin in the male leaves of M. annua. We noted that the interaction between the sex of plants and the
provenance had a significant effect on TFC (F = 6.63; p = 0.004) and AOA (F = 6.53; p = 0.004) assays, but
there was no interaction between sex and origins for TPC (F = 1.76; p = 0.19). The larvicidal activity of
aqueous leaf extracts of M. annua against Tribolium confusum (Du Val) (T. confusum), an insect pest of flour
and cereal seeds, showed that the mortality could reach 100% after 48 h of exposure in the Bizerte region.
The LC50 values for the leaf extract were low in Bizerte, with 0.003 and 0.009 g/mL for male and female
plants, respectively, succeeded by Jandouba, which displayed 0.006 and 0.0 24 g/mL for male and female
plants, respectively. Nabeul showed 0.025 g/mL for male plants and 0.046 g/mL for female plants and Beja
showed 0.037 and 0.072 g/mL for male and female plants, respectively. This is the first time that a study has
revealed a negative correlation between the antioxidant activity and the larvicidal activity of the leaf extracts of
M. annua with the following correlation coefficients of Pearson: r = −0.975 and r = −0.760 for male and female
plants, respectively.
Keywords: Mercurialis annua L.; antioxidant activity; LC-MS; larvicidal activity

International Conference on
RAW MATERIALS TO PROCESSED FOODS 03-04 June 2021, Turkey
141
Targeted Quality Evaluation of Hard Wheat: Application of Solvent Retention
Capacity Test with Supplementary Solvents
Senay Simsek1
1North Dakota State University, Department of Plant Science, Fargo, North Dakota, USA
E-mail: [email protected], 701-231-7737
ABSTRACT
Solvent retention capacity (SRC) is a solvation test for wheat flour in which functional contributions of
different polymeric components are predicted based on their swelling behavior with different diagnostic
solvents. SRC can be used for all wheat classes but has been used largely for soft wheat flours. Hard wheat
and strong gluten flours require a better determination of glutenin and gliadin contributions since products
made from these flours are dependent on gluten functionality. The SRC test was conducted according to
AACCI method 56-11.01 utilizing the supplementary solvents: 55% aqueous ethanol, 0.75% sodium dodecyl
sulfate (SDS), 0.006% sodium metabisulfite (MBS), and 0.75% SDS + 0.006% MBS. The ethanol solvent is
related to gliadin content. MBS promotes the thiol-disulfide exchange for glutenins, and the SDS with or
without MBS is relevant to the alignment of glutenin macropolymers. Commercial flours and hard red spring
(HRS) wheat flours from different varieties were evaluated for quality and SRC. Traditional and
supplemental solvents were able to discriminate between commercial flour samples of different types. The
supplementary solvents were able to provide additional information about the quality of HRS wheat flours.
Samples with higher protein content had higher ethanol SRC and higher MBS SRC. The SDS SRC showed a
decreasing trend for samples with higher protein content. The flour samples had a wide range of quality
attributes that could be evaluated and selected based on the use of the supplementary SRC solvents. Often,
HRS flour will have similar protein contents, but the quality of the protein will be critical to the end-use
quality of the flour. A more detailed evaluation of protein quality can determine end-use applications for
HRS wheat flours. Understanding the interaction of these solvents with the polymeric components of the
flour will allow for a targeted evaluation of hard wheat flour quality.
Keywords: Hard wheat, Quality tests, Solvent retention capacity, Supplementary solvents
References: AACC-I. 2009. AACC International approved methods of analysis. AACC International. http://methods.aaccnet.org/ Accessed:
02/20/2019.
Kweon, M., Slade, L., & Levine, H. 2011. Solvent retention capacity (SRC) testing of wheat flour: Principles and value in
predicting flour functionality in different wheat‐based food processes and in wheat breeding—A review. Cereal Chemistry, 88(6),
537-552.
Miklus, M., Kweon, M., Slade, L., & Levine, H. (2003). An expanded solvent retention capacity method to extend prediction of
end-use potential of wheat flours. AACCI Annual Meeting. Portland, OR
International Conference on
RAW MATERIALS TO PROCESSED FOODS 03-04 June 2021, Turkey
142
A Sensory Observation at a House for Different Fish Species Stored at Room
Temperature
Zafer Ceylan1*, Oktay Tomar2, Abdullah Çağlar2, Turgay Çetinkaya3
1 Department of Gastronomy and Culinary Arts, Faculty of Tourism, Van Yüzüncü Yıl University, 65000 Van, Turkey 2 Faculty of Agriculture, Kocaeli University, 41285 Kocaeli, Turkey
3 Food Processing Department, Armutlu Vocational School, Yalova University, 77500, Yalova, Turkey
*Corresponding author: [email protected]
ABSTRACT
Total mesophilic bacteria count, pH, TVBN values, texture, and sensory (taste, odor, color, and texture)
analysis are the main significant factors to observe quality changes of seafood. However, the consumers do
not have a chance to make microbiological and chemical analyses. Therefore, the consumers pay should
attention to sensory properties or characteristics of fish meat when they buy it. After harvesting or cutting,
the changes in odor, color, and texture of stored fish meat should be known and revealed to the consumers.
In this study sensory changes of four fish products (red mullet: RM, horse mackerel: HM, bluefish: BF,
gilthead seabream: GS) were monitored every hour from the initial hour at room temperature (23±3°C). The
overall acceptance results of the study showed that RM, HM, BF, and GS samples were unacceptable at 12th,
11th, 15th, and 17th hours, which can be seen also from visual analysis by photographs. The obtained results
will give knowledge to the consumers regarding the maximum possible storage period of these samples at
room temperature.
Keywords: Fish Quality, Sensory Analysis, Odor, Color, Texture
INTRODUCTION Food is a unique source for humankind to sustain a healthy life. Therefore, after harvesting, some food
preservation methods are applied to prevent rapid spoilage. In this respect, seafood can be evaluated as a
highly perishable food; especially their preservation is the most critical issue for the consumers. In this
regard, some preservation methods can be costly while some of them need less cost (Ceylan, 2019). For
example, food irradiation is one of the widely used food preservation methods, which limits rapid microbial
spoilage (Ceylan and Ozogul, 2020). Food additives mostly chemical origins are preferred to provide food
safety. Natural-based ones such as nisin cause high costs in a food preservation system (Ceylan and Mol,
2015). Different food packaging applications such as modified atmospheric packaging (MAP), vacuum
packing, and some basic sealing applications can be utilized to provide food safety and delay chemical,
sensory, and especially microbiological spoilage.
Besides these mentioned conventional food preservation methods, novel techniques have been tried and
used. In this sense, nanotechnology applications (nanoparticles, nanofibers, nanoencapsulation,
nanoemulsions, nanoliposomes), time-temperature indicators (TTIs), cold plasma applications, and some
microencapsulation applications have been treated with some food products (Yazgan et al., 2017; Gülgün F.
Ünal Şengör et al., 2018; Ceylan, 2019; Cetinkaya et al., 2021). Different biopolymers, bioactive materials,
essential oils, or bacteriocins could be successfully used. In addition to novel methods, some cooking
methods like sous vide could be tested for better preservation in ready-eat foods (Ceylan et al., 2018; Uçar,
2020; Park et al., 2020).
As could be seen from the mentioned above, large scope of food preservation methods could be used to delay
the rapid spoilage (sensory, chemical, etc.). Especially, for meat and meat products like fish, total mesophilic
bacteria, pH, TMA, TVBN, TBA, texture, and sensory (taste, odor, color, and texture) analysis are very
significant to reveal the quality changes (Ceylan et al., 2018; G.F. Ünal Şengör et al., 2019; Durmus, 2020).
On the other hand, the consumers do not have any chance to analyze them. Therefore, the consumers pay
attention to their sensory properties or characteristics while buying something from the markets or wholesale
markets. After harvesting or cutting, the changes in odor, color, and texture of fish meat samples stored at
room temperature conditions should be known and revealed for the consumers.

International Conference on
RAW MATERIALS TO PROCESSED FOODS 03-04 June 2021, Turkey
143
The aim of the study is to reveal the sensory changes in different (small and bigger) fish species stored at
room temperature for the consumers. The obtained knowledge can be shared with the consumers who want
to consume fish samples under these conditions.
MATERIAL AND METHODS All food samples were obtained as fresh from an international supermarket in Istanbul. The present study
consists of four fish species (gilthead seabream: GS, red mullet: RM, horse mackerel: HM, bluefish: BF).
Four of the fish species (GS, RM, HM, and BF) were placed at room temperature (23±3°C). The samples
stored at room temperature were analyzed per hour for 18 hours. To reveal the consumer awareness at home
conditions, sensory characteristics were summarized as odor, texture, color, and overall acceptance. Sensory
scores for all parameters were applied between 0-10 points. But, 5 points were accepted as the limit value for
the rejection (Ceylan et al., 2018). Also, all sensory changes were supported by using visual photographic
images. Collected data were subjected to analysis of variance (ANOVA) in order to determine the sensory
quality changes. GraphPad Prism software (California Corporation, USA) was applied to reveal significant
differences between groups by ANOVA. Once a significant (p<0.05) main effect was obtained, mean values
of the samples were further analyzed using the Tukey’s multiple range comparison test.
RESULTS AND DISCUSSION
Red Mullet Overall sensory evaluation of red mullet samples placed at room temperature are presented in Figure 1. As
known; the storage of RM samples at room temperature is an undesired event. Unfortunately, it is widely
known that these storage or sales conditions are applied for fish samples in different cities of our country.
Although RM is a small species of fish, it has a well economic value. So, the importance of household
applications for food safety has been reported with the present study. On the initial day of the experimental
period for RM samples, odor, color, texture scores were found to be 9.80, 9.82, and 9.82, respectively.
Depending on the increase of storage period, deterioration for the mentioned parameters was clearly
observed (p<0.05). After 12th, 12th, and 13th hours for odor, color, and texture, respectively, RM samples
were defined as unacceptable. Moreover, the initial overall acceptability of RM samples was 9.78. The RM
samples were observed as unacceptable with 4.76 scores at the 12th hour of the experimental period (p<0.05).
Besides chemical, physical and sensory changes in fish meat, microorganism activity beginning after rigor
mortis in fish meat is the main factor, which limits the shelf life of fish. In this regard, especially,
psychrophilic and mesophilic bacteria play a key role in the fish spoilage (Ceylan et al., 2020). As could be
seen from the figure of RM samples, the consumers can use this study as a guiding document for the
evaluation of RM samples.

International Conference on
RAW MATERIALS TO PROCESSED FOODS 03-04 June 2021, Turkey
144
Figure 1: Statistical overall score results of RM samples with initial and 14th hour photographs
Horse Mackerel In Figure 2, overall sensory evaluation of HM samples at room temperature can be seen from statistical
results. Although HM is also small species of fish, it has been widely preferred by consumers in Turkey. So,
the importance of household applications for horse mackerel is also presented in this study. On the initial day
of the experimental period for horse mackerel samples, odor, color, texture scores were found to be 9.64,
9.72, and 9.64, respectively. Furthermore, the overall acceptability of HM samples on initial day was 9.64.
With the increase of the storage period, deterioration was observed for the mentioned parameters (p<0.05).
The HM samples were observed as unacceptable with 4.794 scores at the 11th hour of the experimental
period (p<0.05). On the other hand, odor, color, and texture were defined as unacceptable after the 12th, 12th,
and 10th hour respectively.

International Conference on
RAW MATERIALS TO PROCESSED FOODS 03-04 June 2021, Turkey
145
Figure 2: Statistical overall score results of HM samples with initial and 11th hour photographs
There are different studies related to HM in the previous literatures. In this respect, according to the
result of sensory evaluation of frozen HM, wild and cultured hot-smoked HM samples had 7 months of
shelf-life (Koral et al., 2015). This is an actually expected result for the frozen and smoked samples. In the
case of placing the samples at room temperature, extreme sensory quality changes could be observed.
Bluefish Overall score results of BF samples stored at room temperature are presented in Figure 3 with statistical
figures and photos. On the initial day of the experimental period for BF samples, odor, color, texture scores
were found to be 9.86, 9.76, and 9.72, respectively. From 0. hour to 16th hour on the increase of storage
period, deterioration for the mentioned parameters was clearly observed (p<0.05). After 15th, 13th, and 13th
hours for odor, color, and texture, respectively, BF samples were defined as unacceptable. The initial overall
acceptability of BF samples was 9.84. However, they evaluated as unacceptable with 3.92 scores at the 15th
hour of the experimental period (p<0.05).
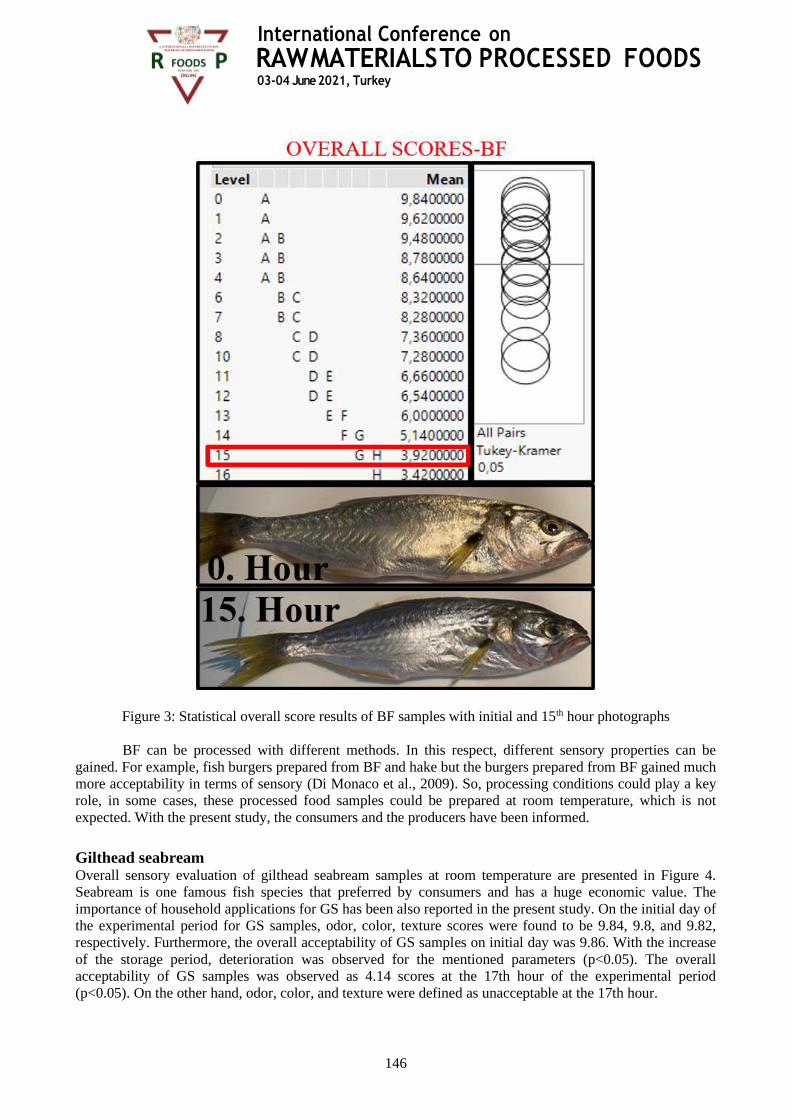
International Conference on
RAW MATERIALS TO PROCESSED FOODS 03-04 June 2021, Turkey
146
Figure 3: Statistical overall score results of BF samples with initial and 15th hour photographs
BF can be processed with different methods. In this respect, different sensory properties can be
gained. For example, fish burgers prepared from BF and hake but the burgers prepared from BF gained much
more acceptability in terms of sensory (Di Monaco et al., 2009). So, processing conditions could play a key
role, in some cases, these processed food samples could be prepared at room temperature, which is not
expected. With the present study, the consumers and the producers have been informed.
Gilthead seabream Overall sensory evaluation of gilthead seabream samples at room temperature are presented in Figure 4.
Seabream is one famous fish species that preferred by consumers and has a huge economic value. The
importance of household applications for GS has been also reported in the present study. On the initial day of
the experimental period for GS samples, odor, color, texture scores were found to be 9.84, 9.8, and 9.82,
respectively. Furthermore, the overall acceptability of GS samples on initial day was 9.86. With the increase
of the storage period, deterioration was observed for the mentioned parameters (p<0.05). The overall
acceptability of GS samples was observed as 4.14 scores at the 17th hour of the experimental period
(p<0.05). On the other hand, odor, color, and texture were defined as unacceptable at the 17th hour.

International Conference on
RAW MATERIALS TO PROCESSED FOODS 03-04 June 2021, Turkey
147
Figure 4: Statistical overall score results of GS samples with initial and 17th hour photographs
GS is bigger fish as compared to the other fish samples. Therefore, it has different properties
connective tissues, skin, and eyes, than others. Furthermore, with image analysis, some quality changes in
GS could be observed (G.F. Ünal Şengör et al., 2019). As stated by (Ceylan et al., 2018), After 5 days of
cold storage, putrid and fishy odor in control samples stored at 4±1°C was determined by sensory
assessment. In the present study, at 17th hour, the GS samples were not fit for human consumption in terms
of sensory evaluation.
CONCLUSION Shelf life and quality of seafood are important for consumers. Total mesophilic bacteria count, pH, TVBN
values, TMA values are the main parameters to observe quality changes of seafood. However, these
analyses are time-consuming and could be expensive as many materials are needed for experiments. To
International Conference on
RAW MATERIALS TO PROCESSED FOODS 03-04 June 2021, Turkey
148
overcome this issue, sensory analysis can be seen as an important quality parameter. Sensory evaluation
provides information about the shelf life of fish products in a short time and does not cost any money. So, the
consumers can determine sensory characteristics such as odor, color, and texture by the naked eye in a short
period of time. For this reason, in the present study sensory evaluation of 4 fish products is examined by
odor, color, texture scores at room temperature. From initial day, samples were scored and photographed
until they reach the unacceptable score of 5. Results showed that GS had higher scores compared to other
samples at the 11th hour (overall acceptability:7.3) and was accepted as consumable even after 16 hours.
However, RM and HM samples were evaluated as inconsumable on the 12th and 11th hour, respectively.
Color change, oil sealing, drying on the surface can be seen clearly by visual photography at the end of
storing time. Furthermore, a bad odor (4.5 on 12th hour) has been observed for HM. These lower scores for
RM and HM are attributed to the weight and size of the samples as they were smaller than GS and BF. The
overall acceptance results of the study showed that RM, HM, BF, and GS samples were unacceptable at 12th,
11th, 15th, and 17th hours, which can be seen also from visual analysis by photographs. Longer shelf life for
GS could be attributed to the thick skin layer which preserves it from deterioration compared to other
samples. Drying on the surface and textural deterioration can be clearly seen in the photograph for BF. On
the 15th hour, odor, color, texture, and overall scores (3.98, 4.5, 4.54, and 3.92 respectively) showed that BF
was also had longer shelf life than RM and HM. When all results evaluated together it is highly
recommended consuming small fish species such as RM and HM less than 12 hours of storage time. On the
other hand, fish species with bigger size and weight such as GS could be consumed up to the 17th hour. The
obtained results in this study will give important knowledge to consumers regarding the average shelf life of
small and big fish species at room temperature.
REFERENCES [17] Ceylan, Z., (2019). A new cost-effective process for limitation of microbial growth in fish fleshes:
Wrapping by aluminum foil coated with electrospun nanofibers. Journal of Food Safety. 39, e12697.
https://doi.org/10.1111/jfs.12697
[18] Ceylan, Zafer., Ozogul, Y., Irradiation technology. In Innovative Technologies in Seafood
Processing. (pp. 115–129), Taylor&Franchis, Boca Raton, FL: CRC Press, 2019.
[19] Ceylan, Z., Mol, S., (2015). Nisin and seafood. Ege Journal of Fisheries and Aquatic Sciences. 32,
115-120. https://doi.org/10.12714/egejfas.2015.32.2.08
[20] Yazgan, H., Ozogul, Y., Durmuş, M., Balikçi, E., Gökdoğan, S., Uçar, Y., Aksun, E. T.,
(2017). Effects of Oil-in-Water Nanoemulsion Based on Sunflower Oil on the Quality of
Farmed Sea Bass and Gilthead Sea Bream Stored at Chilled Temperature (2 ± 2°C). Journal of
Aquatic Food Product Technology. 26, 979-992.
https://doi.org/10.1080/10498850.2017.1366610 [21] Ünal Şengör, Gülgün F., Balaban, M. O., Ceylan, Z., Doğruyol, H., (2018). Determination of shelf
life of gilthead seabream (Sparus aurata) with time temperature indicators. Journal of Food Processing
and Preservation. 42, e13426. https://doi.org/10.1111/jfpp.13426
[22] Cetinkaya, T., Mendes, A. C., Jacobsen, C., Ceylan, Z., Chronakis, I. S., Bean, S. R., & García-
Moreno, P. J., (2021). Development of kafirin-based nanocapsules by electrospraying for encapsulation
of fish oil. LWT. 136, 110297. https://doi.org/10.1016/j.lwt.2020.110297
[23] Ceylan, Z., Unal Sengor, G. F., Basahel, A., Yilmaz, M. T., (2018). Determination of quality
parameters of gilthead sea bream (Sparus aurata) fillets coated with electrospun nanofibers. Journal of
Food Safety. 38, e12518. https://doi.org/10.1111/jfs.12518
[24] Uçar, Y., (2020). Nisin applications in seafood. Yuzuncu Yil University Journal of Agricultural
Sciences. 30, 639 - 651 https://doi.org/10.29133/yyutbd.726727
[25] Park, C. H., Lee, B., Oh, E., Kim, Y. S., Choi, Y. M., (2020). Combined effects of sous-vide cooking
conditions on meat and sensory quality characteristics of chicken breast meat. Poultry Science. 99(6),
3286-3291. https://doi.org/10.1016/j.psj.2020.03.004
[26] Durmus, M., (2020). The effects of nanoemulsions based on citrus essential oils (orange, mandarin,
grapefruit, and lemon) on the shelf life of rainbow trout (Oncorhynchus mykiss) fillets at 4 ± 2°C.
Journal of Food Safety. 40, e12718. https://doi.org/10.1111/jfs.12718
[27] Ceylan, Z., Meral, R., Kose, S., Sengor, G., Akinay, Y., Durmus, M., Ucar, Y., (2020). Characterized
nano-size curcumin and rosemary oil for the limitation microbial spoilage of rainbow trout fillets. LWT.
International Conference on
RAW MATERIALS TO PROCESSED FOODS 03-04 June 2021, Turkey
149
134, 109965. https://doi.org/10.1016/j.lwt.2020.109965
[28] Koral, S., Tufan, B., Başçınar, N., Köse, S., (2015). Quality changes and shelf-life of cultured and
wild hot-smoked mediterranean horse mackerel (Trachurus mediterraneus, steindachner, 1868) at frozen
storage (-20±2°C). Turkish Journal of Fisheries and Aquatic Sciences. https://doi.org/10.4194/1303-
2712-v15_2_37
[29] Di Monaco, R., Cavella, S., Masi, P., Sevi, A., Caroprese, M., Marzano, A., Conte, A., Del Nobile,
M. A., (2009). Blue fish burgers: Nutritional characterisation and sensory optimisation. International
Journal of Food Science and Technology. 44, 1634-1641. https://doi.org/10.1111/j.1365-
2621.2009.01945.x
[30] Ünal Şengör, G.F., Balaban, M. O., Topaloğlu, B., Ayvaz, Z., Ceylan, Z., & Doğruyol, H. (2019).
Color assessment by different techniques of gilthead seabream (Sparus aurata) during cold storage. Food
Science and Technology, 39, 696-703. https://doi.org/10.1590/fst.02018
International Conference on
RAW MATERIALS TO PROCESSED FOODS 03-04 June 2021, Turkey
150
Effect of Cultivar and Maturity on Functional Properties, Low Molecular
Weight Carbohydrate and Antioxidant Activity of Jackfruit Seed Flour
Radha Kushwaha1, Neha Taslim Fatima1, Monika Singh1, Vinti Singh1, Seeratpreet Kaur2, Vinita
Puranik1, Rajendra Kumar3, Devinder Kaur1*
1 Centre of Food Technology, University of Allahabad, Allahabad, India
2 Department of Food Science and Technology, Khalsa College, Amritsar, India
3 Uttar Pradesh Council of Agriculture and Research, Lucknow, India
*E-mail: [email protected]
Nutritional Values in Fresh Beans
Leyla İdikut1*, Esra Odabaşıoğlu1, Duygu Uskutoğlu1, Gülay Zulkadir2
1Kahramanmaraş Sütçü Imam University, Faculty of Agriculture, Department of Agronomy,46100 Kahramanmaras,
Turkey 2Mersin University, Applied Technology and Management School of Silifke, Mersin, Turkey
*Corresponding author: [email protected]
ABSTRACT
Beans are used extensively in human nutrition as fresh, canned and dried. Since the bean plant is a plant that
growing mild climate, it is affected by hot and cold climates. While it is generally grown as the first crop on
the Mediterranean coasts in the spring season or in the summer season in places where altitude is high, 11
bean varieties were investigated as a second crop in 2018 in Kahramanmaraş conditions and the nutritional
values of fresh beans were examined. In this study Protein, Ca (Calcium), Mg (Magnesium), K (Potassium),
P (Phosphorus), ADF (Acid Detergent Insoluble Fiber), ADP (Acid Detergent Insoluble Protein), NDF
(Neutral Detergent Insoluble Fiber) ratios of fresh bean varieties were researched. It has been recorded as
Protein (20.00-22.92%), Ca (0.30-0.90%), Mg (0.21-0.31%), P (0.39-0.43%), K (3.00-3.61%) ADF (20.07-
26.31%), NDF (27.17-33.68%) ratios of bean varieties. As a result of the research carried out, it was
concluded that the bean plant planted in July or August can be harvested as green beans, and there will be
problems in obtaining dry grains due to the cooling of the weather.
Keywords: Bean Varieties, Nutritional Content, Second Crops
INTRODUCTION
People need proteins of vegetable and animal origin for quality, adequate and balance nutrition in the world.
A large part of the world population cannot get enough protein due to the high price of proteins of animal
origin and cannot be provided for various reasons and limiting of cereals proteins in terms of some amino
acids. The utilizable of legumes which are not restricted by amino acids the accordimg to the price of animal
proteins, plays an active role in eliminating the protein deficit in the nutrition of developing countries as an
alternative source. Legumes have an important place in terms of nutrition, the absolute essential lysine amino
acid, calcium, phosphorus, iron, B1, B2 vitamins and minerals, with a protein content of 18-31.6%. It should
be emphasized the requirement of including to an important product group, due to reduces the risk of cancer
with its antioxidant content, also and cardiovascular diseases and diabetes diseases for reasons such as low
International Conference on
RAW MATERIALS TO PROCESSED FOODS 03-04 June 2021, Turkey
151
cholesterol content, high fiber content and low-fat content. Vegetable proteins and carbohydrates of human
and animal nutrition are provided from legumes 22% and 7%, 38% and 5% in the world respectively. The
legumes should be considered to in the more efficient and economical in solving the nutritional problem and
eliminating the protein deficit in nutrition. In other words, legumes constitute the protein source of 2 billion
people in the world (Adak ve ark., 2010). The bean plant, which is in the legume group, is an important field
plant that is consumed in large quantities in Turkey and in the world, because of its high nutritional value,
being traded as fresh, canned and dry, an indispensable food of kitchens. Beans, whose homeland is South
America, were brought to Europe at the beginning of the 16th century, its agriculture increased over time and
began to be grown in almost every part of the world. Bean cultivation in Turkey, on the other hand, dates
back to about 250 years ago (Nemli 2013).
Today, when the popularity of environmentalism and sustainable agriculture is increasing, legume plants
increase their nutrient intake from the soil, while forming in root nodosites, by connecting the free nitrogen
of the air to their roots thanks to the Rhizobium bacteria, they meet their own needs and leave some nitrogen
to the next plant (Rurangwa et al., 2018). Nitrogen binding capacity is generally around 5-20 kg / ha per year
and may vary depending on the variety and environmental conditions (Şehirali, 1998). For this reason,
legumes are seen as a good crop rotation plants. Rotation of the bean plant with other field crops plays an
important role in the reduction of fertilizer and energy use in arable land and thus in the reduction of
greenhouse gas emissions (Stagnari ve ark. 2017). Legumes reduce the use of commercial nitrogen
fertilizers, enrich the soil with organic matter, aerate the soil and increase the water holding capacity of the
soil, as well as providing an economic advantage by obtaining two products a year for plants including crop
rotation. Legumes also play an important role in animal nutrition, as the stalk and straw are low in cellulose.
The high level of digestion of crude proteins (78%) in the stems and cereals of beans compared to grains
encourages the increase in production (Azkan, 1999). This increase also creates additional feed resources,
with its protective effect on agricultural lands. The use of plant residues as feed constitutes another positive
contribution for animal production. In addition to nitrogen and protein sources, bean seeds contain calcium,
potassium, phosphorus, magnesium, copper, zinc, iron, sulfur and manganese (Suarez-Martinez ve ark.,
2016).
Bean cultivation is carried out by farmers in every region where climatic conditions allow. The bean is stake-
rooted, it has a temperate climate loving, very sensitive to cold. The bean plant requires a soil temperature of
at least 8 ° C for germination, an optimum germination temperature of 18 ° C and a growth temperature of
20-25 ° C. The yield decreases are take place due to the slowing down of the development at a temperature
below 15 ° C during the development period and the prevention of fertilization above 32 ° C (Porch and
Jadn, 2001). The bean plant is generally grown in the spring (as the first product) in places with a
Mediterranean climate. The quality criteria of the fresh broad beans of 11 bean varieties were examined,
different from the knowledge of the ability of the beans to be adapted and to contribute to the plant to be
planted in winter by making autumn (as a second crop) cultivation in Kahramanmaraş region.
.
MATERIALS AND METHODS In the study; Önceler, 98, Göynük 98, Yunus 90, Topçu, Alberto, Aras 98, Bermaz, Noyanbey 98, Akman
98, Göksun and Karacaşehir 98 were used as materials. Bean varieties were obtained from Agricultural
Research Institutes and private companies. The research was conducted in 2018 in Kahramanmaraş province,
which is 568 m above sea level, which has the effect of the Mediterranean climate. The minimum (23.2,
21.0, 14.6, 9.2 0C), maximum (36.8, 34.7, 26.4, 17.6 0C), average temperature (29.1, 27.2, 19.8, 2.7 0C)
average humidity (48.3%, 38.4, 51.5, 66.7%) and precipitation (4, 8, 45, 70 mm) values for August,
September, October and November covering the months of the study were recorded respectively (Anonim,
2018). Soil properties, saturation, pH, salt, lime, organic matter, potassium, phosphorus values were
determined, respectively 85.80%, 7.28, 0.30%, 1.00%, 2.08%, 266.8 mg/kg, 10.46 mg/kg for 0-30 cm depth,
86.35, 7.31, 0.26%, 1.10%, 1.79%, 291.7 mg/kg, 4.92 mg/kg for 30-60 cm depth, 83.60, 7.30 0.23%, 2.90%,
1.23%, 293.9 mg/kg, 3.65mg/kg for a depth of 60-90 cm (Anonim, 2019). The soil structure of the trial area
has a slightly alkaline and clayey structure, medium level of organic matter, slightly salty and sufficient lime,
phosphorus and potassium. Wheat plant was grown as a preveous plant in the experimental area. After the
wheat harvest, the field was plowed. After being plowed with second-class agricultural tools before planting,
the roller was pulled and made ready for planting. The research was planted with hand on 7 August 2018, in

International Conference on
RAW MATERIALS TO PROCESSED FOODS 03-04 June 2021, Turkey
152
4 rows, in three replications, on 5-meter-long plots with 50 cm row spacing and on 10 cm intra spacing.
Before planting, 6 kg / da phosphorus and 2.3 kg / da nitrogen fertilizer were applied. With the completion of
the planting, the drip irrigation system was established and irrigation was carried out. When the plants
reached a height of 15 cm, 3.7 kg / da nitrogen fertilizer was applied. Hoeing was done 3 times manually, for
weed control. The drip irrigation system has been irrigated 12 times about 7 hours throughout, since there is
almost no rainfall in August and September that during the period when the bean plant continues its
development. The middle two rows of each parcel were harvested for observations, measurements and
analysis on November 6-10, due to insufficient climatic conditions for the dry harvest of bean varieties. The
pods of the harvested bean varieties were separated and kept in the oven at 105 ° C for 72 hours and dried
pods into flour. Nutritional analysis of 48 samples taken as flour were made using the WINISI package
program on the FOSS 6500 NIR system device in laboratory. In this study Protein, Ca (Calcium), Mg
(Magnesium), K (Potassium), P (Phosphorus), ADF (Acid Detergent Insoluble Fiber), ADP (Acid Detergent
Insoluble Protein), NDF (Neutral Detergent Insoluble Fiber) ratios of fresh bean varieties were researched. In
the statistical analysis of the results obtained in the study, the means of the variety were compared using the
SAS package program, analysis of variance according to the Anova procedure, and the means according to
the Duncan (P <0.05) multiple test.
RESULTS AND DISCUSSION The averages of protein, Ca (Calcium), Mg (Magnesium), K (Potassium) of 11 fresh bean varieties were
given in Table 1, the other averages of P (Phosphorus), ADF (Acid Detergent Insoluble Fiber), ADP (Acid
Detergent Insoluble Protein), NDF (Neutral Detergent Insoluble Fiber) ratios of 11 fresh bean varieties were
given in Table 2.
Table 1. Averages and groups of nutritional values of fresh bean varieties
varieties Protein * Calcium ** Magnesium * Potassium **
Karacaşehir 98 22.92 a 0.90 a 0.31 a 3.00 c
Bermaz 20.00 c 0.44 bc 0.24 b 3.55 a
Önceler 98 21.62 ab 0.50 bc 0.22 b 3.38 abc
Akman 98 22.19 ab 0.53 b 0.26 ab 3.09 bc
Topçu 21.43 abc 0.45 bc 0.22 b 3.46 ab
Noyanbey 98 21.28 bc 0.46 bc 0.21 b 3.57 a
Göksun 20.72 bc 0.30 c 0.23 b 3.61 a
Göynük 98 21.17 bc 0.53 b 0.24 b 3.20 abc
Aras 98 20.69 bc 0.59 b 0.26 ab 3.28 abc
Yunus 90 22.15 ab 0.50 bc 0.22 b 3.56 a
Alberto 21.69 ab 0.39 bc 0.23 b 3.59 a
** : p < 0.01; *: p < 0.05
Protein (P)
It was determined that the protein values of the bean varieties examined in Table 1 vary between 20.00% and
22.92%. It was observed that there was a statistically significant difference in protein values among bean
varieties. In terms of protein value, it was recorded that the highest was obtained from Karacaşehir 98 variety
with 22.92% and the lowest from Bermaz variety with 20.00% and the two varieties made a statistically
significant difference from each other. The values protein of Akman 98, Yunus 90, Alberto, Öneler 98,
varieties were 22.19%, 22.15%, 21.69%, 21.62%. While these cultivars were placed in the same transition
group and statistically were not made a significant difference from the Karacaşehir 98 variety, but it were
seen to make a difference from Bermaz cultivar. It was detemined that there were statistically significant
difference between the varietie of Karacaşehir 98 with Aras 98, Göksun, Göynük 98, Noyanbey 98 and
Topçu varieties in terms of protein. These cultivars with other cultivar among was no significant difference
except for Karacaşehir cultivar.
Results from previous researchers' studies were reported that Gülümser et al. (2005) found that the protein
ratio in the grain was between 20.27-23.15% as a result of the boron application on foliar and soil in the
International Conference on
RAW MATERIALS TO PROCESSED FOODS 03-04 June 2021, Turkey
153
Black Sea Region, Ülker (2008) found that the protein ratio in the grain was between 18.53-27% as a result
of harvesting in two different locations in the Central Anatolia ecological conditions, In finding of Kahraman
(2008) in Konya region, the protein ratio in broad beans in 3 different planting times for two years was
between 20.11-28.59%, in study of Demir (2011) in Ordu region changed between 18.18-23.6% after the
harvest of green bean varieties, Kuyucuoğlu (2016) found that protein rate varied between 20.17-23.15% in
broad beans in Konya ecological conditions. It was stated that the protein value varied between 17.75-
23.60% of 6 bean varieties with three years by of Kazydup et al. (2017) Previous research were shown that
the protein ratios could differ according to the climatic factors, temperature, planting time and the amount of
fertilizer applied, although the protein values are characteristic of the variety(Peterson et al. 2005; Johanson
et al. 2003; Kazydup et al. 2017)).
Calcium (Ca)
It was observed that there was a statistically significant difference in calcium values among bean varieties. It
was determined that there were 3 different groups in terms of Ca values in bean varieties and their values
varied between 0.30-0.90%. The highest Ca value was obtained from Karacaşehir 98 variety with 0.90% and
it was significant difference than other ten bean varieties. Aras 98 with 0.59%, Akman 98 and Göynük 98
with 0.53% were in the second group and these varieties had statistically significant differences between
Karacaşehir 98 and Göksun varieties that was third group, but not were statistically significant difference
among other varieties. The lowest value in terms of Ca value was observed in Göksun variety with 0.30%.
Önceler 98, Yunus 90, Noyanbey 98, Topçu, Bermaz and Alberto varieties did not create statistically
significant differences among themselves, but formed the transition group between the second and third
groups (Table 1).
Demir (2011) found that the calcium content of the fresh bean varieties was between 0.36-0.69% after the
harvest in the Ordu region, and Kahraman (2008) found that the calcium content in the fresh bean was
between 0.01.0.19% in three different planting times for two years in the Konya region. Ca concentration
was affect by environmental and genetic factors in dry bean seed (Moraghan and Grafton, 1997). As can be
understood from the previous findings, it is understood that the calcium ratio is affected by environmental
factors as well as the variety feature (Moraghan and Grafton, 1997). Calcium is a requirement element for
humans and animals. The Ca need of human body, fattening animals, cattle for day are 0.8-0.9, 20-22,20-30
g respectively (Demirci 2016; Işık 1996; Sevgican 1996).
Magnesium (Mg)
In the bean varieties used in the study, it was determined that 2 different groups were formed in terms of Mg
values that varied between 0.21-0.31%. The highest Mg value was observed in Karacaşehir 98 variety with
0.31%. The lowest Mg value was obtained from Noyanbey 98 variety with 0.21%. Noyanbey 98 variety with
Önceler 98, Yunus 90, Topçu, Alberto, Göksun, Göynük 98, Bermaz varieties were place in the same group.
While Noyanbey 98 variety created statistically significant differences with Karacaşehir 98 varieties, it was
observed that there was no significant statistical difference with other varieties in terms of Mg. It was noted
that Akman 98 and Aras 98 varieties were in a transition group with 0.26% and statistically wasn't differ
significantly from the Karacaşehir 98 variety. Mg value is different according to the varieties. The actual
performance of cultivar depends on the environmental conditions (Saleh et all., 2018). Kahraman (2008)
determined that the Mg ratio in pods varied between 0.01% and 0.13% for 3 different planting times and two
years in Konya region. Demir (2011) determined, the Mg ratio varied between 0.17-0.29% with the grinding
of the broad bean after the harvest of the green bean varieties in Ordu region. Calcium, Mg and K were been
the main cations of common bean. Mg or K concentrations had lower variable than Ca concentration
(Moraghan and Grafton, 1997).
Potassium (K)
In this study, the K values examined in different bean varieties varied between 3.00-3.61%. The highest K
value was found in Göksun variety with 3.61%. In terms of K value, the lowest value is seen in Karaçaşehir
International Conference on
RAW MATERIALS TO PROCESSED FOODS 03-04 June 2021, Turkey
154
98 variety with 3.00%. While Karacaşehir 98 variety did not create statistically significant difference with
Önceler 98, Aras 98, Göynük 98 and Akman 98 varieties, it was determined that there was statistically
significant difference between other cultivars. It was noted that Göksun variety with Alberto, Noyanbey 98,
Yunus 90, Bermaz varieties were place in the same group, and these cultivars waren't statistical differences
with Karacaşehir and Akmam 98.
Kahraman (2008) noted that the K ratio in pods varied between 0.11-2.03% in two years and 3 different
planting times in Konya ecological conditions. Demir (2011) reported that the K content of green bean
varieties varied between 1.19-2.44% in his study in Ordu region. Potassium content of dry bean varied
between 14.2 to 18.4 g kg-1 in two regions with fifty genotypes made study by Mario Paredes et al (2009).
Table 2. Averages and groups of nutritional values of fresh bean varieties
varieties
Phosphorus
**
Acid
Detergent
Insoluble Fiber
**
Acid Detergent
Insoluble
Protein
Neutral
Detergent
Insoluble Fiber
**
Karacaşehir 98 0.43 a 26.31 a 0.68 33.68 a
Bermaz 0.39 b 24.61 ab 0.59 31.60 ab
Önceler 98 0.39 b 24.06 abc 0.53 33.16 a
Akman 98 0.40 b 23.61 abc 0.57 32.74 ab
Topçu 0.40 b 22.92 bcd 0.48 30.02 abc
Noyanbey 98 0.41 b 22.89 bcd 0.52 30.33 abc
Göksun 0.40 b 22.62 bcd 0.50 30.60 abc
Göynük 98 0.39 b 22.00 bcd 0.50 30.37 abc
Aras 98 0.40 b 21.66 bcd 0.52 30.66 abc
Yunus 90 0.40 b 20.39 cd 0.50 28.56 bc
Alberto 0.40 b 20.07 d 0.49 27.17 c
** : p < 0.01; *: p < 0.05
Phosphorus (P)
In terms of the P value in the pods of the bean varieties used in the experiment, it was determined that 2
groups were formed and the values varied between 0.39-0.43%. The highest P value was obtained from
Karacaşehir 98 variety with 0.43% and it was recorded that there was a statistically significant difference
from other varieties. In terms of P value, the lowest value was obtained from Bermaz, Önceler 98 and
Göynük 98 varieties with 0.39%. The lowest value was followed by Alberto, Akman 98, Yunus 90, Topçu,
Aras 98, Göksun with 0.40% Noyanbey 98 with 0.41%, they were had the same group and made a
significant difference compared to the Karacaşehir 98 variety.
Kahraman (2008) determined that the P ratio in pods varied between 0.10-0.53% for three different planting
times and two years in Konya ecological conditions. In study of Demir (2011) determined that the P values
of the green bean varieties changed between 0.38-0.85% with the grinding of the broad bean after the harvest
in Ordu region. P value is different according to the varieties. The actual performance of any cultivar
depends on how its genetic parameters interact with the environmental conditions (Saleh et all., 2018).
Acid Detergent Insoluble Fiber (ADF)
The ADF values in pods of the bean varieties studied varied between 20.07-26.31%. The highest ADF value
of 26.31% was obtained from Karacaşehir 98 variety. In terms of ADF value, it was determined that Topçu,
Noyanbey 98, Göksun, Göynük 98, Aras 98 varieties were in the same transition group and differed
International Conference on
RAW MATERIALS TO PROCESSED FOODS 03-04 June 2021, Turkey
155
statistically from Karacaşehir 98 variety, and did not create statistically significant difference between other
varieties. The lowest ADF value was recorded in Alberto cultivar with 20.07%. It was determined that
Alberto cultivar made statistically significant differences with Karacaşehir 98, Bermaz, Öneler 98 and
Akman 98 varieties, but not statistically significant difference between other cultivars.
According to roughage quality standards, it is known that the best quality class was below 31% of ADF, the
first class was between 31-35% and the lowest roughage value was (5th class) 45% upper (Güney 2016).
Kobal Bekar et al. (2019) found that the highest amount of ADF among the pole bean genotypes varied
between 29.75-28.38% and the lowest was 19.28% in Black Sea conditions. Since ADF values are used as an
important criterion in determining the quality of the feed, the ADF values in previous studies on other plants;
the dried hay yield of soybeans was 26.56-34.61% ADF in Kayseri conditions as Akıncı (2019) finding.
Yalçınkaya (2019) determined that the dried plants from fresh grass samples taken during flowering period
from meadow pasture taxons was 15.39-31.56% ADF in the Southeastern Anatolia Region. In finding of
Kavak (2019) was determined the meadow pasture vegetations varied between 12.53-34.5% ADF in the
Southeastern Anatolia Region. Aydoğan et al. (2014) noted the ecological conditions of Konya varied
between 28.63% and 33.12% ADP in different shape times in artificial pastures. As understood from
previous studies, it is understood that the ADF value creates differences according to the plant type, the
development level and the time of taking the material taken, the climate and soil structure and the structure
of the taxonomy. Since the high ADF value will decrease the best quality class, the values we achieved
shows that it is of very good quality.
Acid Detergent Insoluble Protein (ADP)
The ADP ratios in pods of different bean varieties as second crop grown were no statistically significant
differences in terms of varieties. It was noted that the highest value was obtained from Karacaşehir 98 with
0.68% and the lowest value was obtained from Topçu variety with 0.48%, where the average values varied
between 0.48 and 0.68%. Kavak (2019) determined that the ADP values of some astragalus taxonomy varied
between 0.64-1.40% in Southeastern Anatolia Region. The finding of Başbağ (2018) was cited that ADP
values of forage crop in the flowering period varied between 0.08-0.63% in the ecological conditions of
Diyarbakır. It was showed that the values in the literature as previous research were differ according to the
acquisition time of the material and the structure of the taxonomy.
Neutral Detergent Insoluble Fiber (NDF)
The NDF value in pods of bean varieties tested as the second crop varied between 27.17-33.68%. It was
recorded that the highest NDF value was in Karacaşehir 98 variety with 33.68%, followed by Önceler 98
variety with 33.16% and was in the same group. Akman 98, Bermaz, Aras 98, Göksun, Göynük 98,
Noyanbey 98 and Topçu varieties in terms of NDF values were in the transition group and as statistically no
were significant differences with the varieties of Karacaşehir 98 and Previous 98. The lowest value in terms
of NDF value was noted in Alberto cultivar with 27.17%. It was determined that Alberto cultivar made
statistically significant differences with Karacaşehir 98, Previous 98, Akman 98 and Bermaz varieties, but
not statistically significant difference between other cultivars. According to roughage quality standards, it
was known that the best quality class was 40% below, the first class had between 40-46% and the lowest
roughage value had 65% upper in terms of NDF (Güney 2016). NDF values are used as an important
criterion in determining the quality of the feed. Kobal Bekar et al. (2019) found the highest value of NDF
between 36.53-36.01% and the lowest NDF as 29.10% on the pole bean genotypes at the Black Sea
Agricultural Research Institute. Dried hay yield of soybeans was 38.43-44.85% NDF in Kayseri conditions
as Akıncı (2019) finding. Yalçınkaya (2019) determined that the dried plants from fresh grass samples taken
during flowering period from meadow pasture taxonomy was 28.28-49.04% NDF in the Southeastern
Anatolia Region. Beycioğlu (2016) found that the NDF content of cowpea plant as dry grass varied between

International Conference on
RAW MATERIALS TO PROCESSED FOODS 03-04 June 2021, Turkey
156
24.51-42.55% NDF in Kahramanmaraş conditions. Kaplan et al. (2014) determined that the NDF values on
pea grains varied between 18.65-36.48% NDF. Since the increase in the NDF ratio will decrease the
digestion rate, the findings obtained in our study are more digestible. Based on the previous studies, it is seen
that it creates differences according to the plant type, the development level of the material taken and the
time of taking it, the climate and soil structure and the structure of the taxonomy.
CONCLUSION
In the study investigating the cultivation possibilities of 11 bean varieties as a second crop in the agricultural
areas left empty after the wheat harvest in the Kahramanmaraş region with the Mediterranean climate, the
nutritional values of the green bean pods used as vegetables were examined. The fact that the protein values
of bean varieties grown as a second crop are between 20-23% will make a great contribution to human
nutrition. Good ADF, ADP and NDF values obtained in terms of feed values were increased the protein
value together with the cereal group plants, so also the feed resources would be increased in the regions with
Mediterranean climate. Considering that it contributes to the soil in terms of organic agriculture and that it
leaves free nitrogen for the plant to be planted after it, it is suggested that fresh bean cultivation can be done
as the pre-plant of winter plants in the summer season. The second crop bean cultivation will contribute to
the scarcity of literature in terms of the characteristics examined and will guide the future studies.
ACKNOWLEDGEMENT
This study was financially supported by Kahramanmaras Sutcu Imam University Scientific Research Fund
(Project number : 2018/5-9 YLS)
REFERENCES
[1] Adak MS, Güler M, Kayan N. (2010). Edible legumes production increasing opportunities, Turkey
Agricultural Engineering VII. Technical Congress, 11-15 January 2010, Ankara. Proceedings Book I
p: 329-341.
[2] Nemli S. (2013). Determination of mapping with DNA markers controlled some agronomic characters of
economic important on bean (Phaseolus vulgaris L.). Doctoral Thesis, Ege University Institute of
Science and Technology, Izmir.
[3] Rurangwa, E., Vanlauwec, B., Gille, K. E. (2018). Benefits of inoculation, P fertilizer and manure on
yields of common bean and soybean also increase yield of subsequent maize. Agriculture, Ecosystems
and Environment 261: 219–229.
[4] Şehirali, S., (1972). Formation of sex cells in dwarf bean (Phaseolus vulgaris L.), fertilization biology
and the effects of air temperature on yield. A.Ü. Faculty of Agriculture. Publications 609, Scientific
Research and Reviews 352, Ankara.
[5] Stagnari, F., Maggio, A., Galieni, A., Pisante, M., (2017). Multiple benefits of legumes for agriculture
sustanainability. Chem Biol Technol Agric 4:2. https://doi.org10.1186/s40538-016-0085-1.
[6] Azkan, N. (1999). Food Grain Legumes. Uludağ University, Faculty of Agriculture, Department of Field
Crops.
[7] Suarez-Martineza SE, Ferriz-Martíneza RA, Campos-Vegab R, Elton-Puentea JE, Torre Carbota K,
García-Gascaa T. (2016). Bean Seeds: Leading Nutraceutical Source for Human Health. CyTA –
Journal of Food, 14(1): 131–137
[8] Porch, T.G, Jahn, M.M., (2001). Effects of high temperature stress on microsporogenesis in heat
sensitive and heat tolerant genotypes of phaseolus vulgaris. Plant, Cell and Environment, 24:723-731.
DOI:10.1046/j. 1365-3040.2001.00716. xCorpus ID:85601079
[9] Anonymous, (2018a). Republic of Turkey Ministry of Forestry and Water Affairs Kahramanmaraş
Meteorology Regional Directorate.
[10] Anonymous, (2018b). Kahramanmaraş Sütçü İman University. Agricultural of Faculty, Soil science and
International Conference on
RAW MATERIALS TO PROCESSED FOODS 03-04 June 2021, Turkey
157
Plant nutrition Laboratory Akıncı, Y. (2019). Determination of herbage yield and ouality of different
soybean varieties, M.S. thesis, Erciyes Univ. Institute of Basic and Applied Sciences 52p. Kayseri-
Turkey
[11] Gülümser, A., Odabaş, M.S., Özturan, Y. (2005). The effect of soil and foliar applied boron at different
rates on yield and yield components of common bean (Phaseolus vulgaris L.). Akdeniz University
Journal of Agriculture Faculty, 18(2), 163-168.
[12] Ülker, M. (2008). Determination of some agricultural and quality characters of common beans
(Phaseolus vulgaris L.) genotypes in Central Anatolian Ecological Condition. M.S. thesis, Selçuk
Univ. Institute of Basic and Applied Sciences 81p. Konya-Turkey.
[13] Kahraman, A. (2008). Determination of genetic differences and some quality characteristics of the
dwarf dry bean (Phaseolus Vulgaris L.) populations grown In Konya Province. M.S. thesis, Selçuk
Univ. Institute of Basic and Applied Sciences 68p. Konya-Turkey.
[14] Demir, C. (2011). Determination of Chracterisation of Green Bean Types (Phaseolus vulgaris L.)
Groving in Ordu ProvinceM.S. thesis, Ordu Univ. Institute of Basic and Applied Sciences. 72p. Ordu-
Turkey
[15] Kuyucuoğlu, S. (2016). Effect of different sowing times on agronomical characteristics of some 'seker'
type bean genotypes. M.S. thesis, Selçuk Univ. Institute of Basic and Applied Sciences 71s. Konya-
Turkey.
[16] Kazydub, N., Pinkal, A., Marakayeva, Т., Kuzmina, S., Korobeinikova, M., Kotsyubinskaya, O. (2017).
Chemical composition of seeds and green beans of common bean varieties, breeded in Omsk State
Agrarian University under conditions of southern forest-steppe zone of Western Siberia. Agronomy
Research 15(5), 1918–1927, https://doi.org/10.15159/AR.17.065.
[17] Peterson D.M, Wesenberg D.M, Burrup D.E, Eriickson C.A(2005). Relationships among agronomic
traits and grain composition in oat genotypes grown in different environments. Crop Science 45 (4):
1249-1255. https://doi.org/10.2135/cropsci2004.0063.
[18] Johansson E, Prieto-Linde M.L, Svensson G., Jonsson J.O. (2003). Influences of cultivar, cultivation
year and fertilizer rate on amount of protein groups and amount and size distribution of mono- and
polymeric proteins. Journal Agricultural Sience. 140: 275-284
https://doi.org/10.1017/S0021859603003162
[19] Moraghan, J.T., and K.F. Grafton. (1997). Accumulation of Ca in bean cultivars differing in seed size.
J. Sci. Food Agric. 74:251-256.
[20] Demirci, M. (2016). Food Chemistry Book. Food Technology Association ISBN 975-97146-2-0.
[21] Isık, N. (1996). Ankara University Faculty of Agriculture Publications. No: 1444. Textbook: 425. 2nd
Edition. Ankara.
[22] Sevgican, F. (1996). Ege University Faculty of Agriculture Publications. No: 524. Textbook. Bornova /
İzmir.
[23] Saleh, S., Liu, G., Liu,M., Ji, Y., He, H. Gruda, N. (2018). Effect of Irrigation on Growth, Yield, and
Chemical Composition of Two Green Bean Cultivars. Horticulturae, 4, 3;
doi:10.3390/horticulturae4010003.
[24] Mario Paredes, C., Viviana Becerra, V., Juan Tay, U. (2009). Inorganic nutritional composition of
common bean (Phaseolus vulgaris L.) genotypes race chile. Chilean Journal Of Agricultural Research,
69(4):486-495.
[25] Güney, M., Bingöl, N,T., Aksu, T. (2016). Relative feed value (RFV) and relative forage quality (RFQ)
used in the classification of forage quality, Atatürk Üni. Journal of Veterinary Sciences, 11(2) :254-
258. DOI:10.17094/avbd.50526
[26] Kobel, Bekar, N., Sağlam, N., Balkaya, A., (2019) Evaluation of variation of in terms of pod quality
and pod traits of some snap bean genotypes. YYU J AGR SCI, 2019, 29(1): 127-135
[27] Determination of herbage yield and ouality of different soybean varieties. M.S. thesis, Erciyes Univ.
International Conference on
RAW MATERIALS TO PROCESSED FOODS 03-04 June 2021, Turkey
158
Institute of Basic and Applied Sciences 52p. Kayseri-Turkey
[28] Yalçınkaya, H. (2019). Determination of quality characteristics of some vicia taxa growing in meadow-
pastures and natural vegetations in the Southeastern Anatolia Region of Turkey. M.S. thesis, Dicle
Univ. Institute of Basic and Applied Sciences 66p. Diyarbakır-Turkey.
[29] Kavak, B. (2019). Determination of quality characteristics of some astragalus taxa growing in meadow-
pastures and natural vegetations in the Southeastern Anatolia Region of Turkey. M.S. thesis, Dicle
Univ. Institute of Basic and Applied Sciences 61s. Diyarbakır-Turkey.
[30] Aydoğan, S., Işık, Ş., Şahin, M., Akçacık, G., Hamzaoğlu, S., Doğan, Ş., Küçükcongar, M., Ateş, S.
(2014). Determination of effect of different cutting times on nutrional composition of forage crops.
Selçuk Tar. Bil. Derg. 1(2): 45-49.
[31] Kaplan, M., Kökten, K., Arslan, M., Özdemir, S., Seydoşoğlu, S. (2014). Comparison of Forage
Contents of Different Forage Pea (Pisum arvense) Genetypes, 5. Turkey 5th Seed Congress with
International Participation and Sectoral Business Forum, Diyarbakır, Türkiye : 363-368
[32] Başbağ, M., Çaçan, E., Sayar, S, M. (2018). Determining feed quality values of some grass species and
assessments on relations among the traits with biplot analysis method. Tarla Bitkileri Merkez
Araştırma Enstitüsü Dergisi, 27 (2): 92−101.
[33] Beycioğlu, T. (2016). The effect of different interrow and intrarow distances implementation on yield
components of cowpea (Vigna unguiculata (L.) walp) plant in Kahramanmaraş conditions. M.S.
thesis, Kahramanmaras Sutcu Imam Univ. Institute of Basic and Applied Sciences, 76p.
Kahramanmaras-Turkey.
[34] Kaplan, M., Kökten, K., Arslan, M., Özdemir, S., Seydoşoğlu, S. (2014). Comparison of forage
contents of different forage pea (Pisum arvense) Genetypes, 5. Turkey 5th Seed Congress with
International Participation and Sectoral Business Forum, Diyarbakır, Türkiye : 363-368.

International Conference on
RAW MATERIALS TO PROCESSED FOODS 03-04 June 2021, Turkey
159
The Impact of Various Sowing Applications on Nutritional Value of Quinoa Dry
Herb
Gülay Zulkadir1, Leyla İdikut2
1Mersin University, Applied Technology and Management School of Silifke, Mersin, Turkey 2Kahramanmaraş Sütçü Imam University, Faculty of Agriculture, Department of Agronomy, Kahramanmaras, Turkey
Presenter’s e-mail address: [email protected]
ABSTRACT
The present study aimed to determine the availability of the quinoa plant residues, which is mostly grown as
grain crops as fodder and the impact of various cultivation applications on nutritional value. For this purpose,
the Ca, DM , K, Mg, P, protein content, tetany and milk fever incidences of the post-harvest residues of the
quinoa plant, cultivated in different sowing times and with various row spacing applications, were
investigated. Thus, it was determined that the Ca, DM , K, Mg, P, protein content, tetany and milk fever
incidences content in quinoa straw were 0.933-3.330%; 91.080-87.937%; 0.730-2.237%; 0.200- 1.240%;
0.223-0.303%; 4.403-6.980%; 0.166-2.669 meq, and 3.352-12.268 meq. The study findings demonstrated
that the quinoa straw mineral content and balance were suitable for use as an alternative fodder source.
However, due to the high milk fever incidence, it was concluded that mono and intensive use of quinoa straw
may be risky.
Keywords: Milk fever, plant density, protein, sowing time, tetany

International Conference on
RAW MATERIALS TO PROCESSED FOODS 03-04 June 2021, Turkey
160
Dioxins as Environmental Pollutants
Eyad Aoudeh1, Emel Oz1, Fatih Oz1
1Atatürk University, Agriculture Faculty, Food Engineering Department, Erzurum, Turkey.
Tel: +904422312644, Fax: +904422313858, E-mail: [email protected]
ABSTRACT
Dioxins and dioxin-like compounds are highly toxic, widespread, and stable environmental pollutants, which
could be found almost everywhere in the environment throughout the world. The dioxin term is often used to
refer to a group of substances structurally and chemically related to the polychlorinated dibenzo-p-dioxins
(PCDD) and polychlorinated dibenzofurans (PCDF). Polychlorinated biphenyls (PCB), which share similar
structures and toxic properties, are called dioxin-like compounds. There are about 420 congeners of dioxin
and dioxin-like compounds. Dioxins are often originated in human activities. They generally occur as an
undesirable by-product during industrial processes. Only a tiny part of dioxins is of natural origin. High
levels of dioxins were reported in soils, sediments, and some foods. Because of their hydrophobic nature and
slow degradation properties in the environment, they tend to accumulate in the food chain, especially in fatty
tissues such as dairy products, eggs, meat, and fish. Dioxins are among the most dangerous chemicals that
exhibit potential risks to human health and the environment. Human exposure to high levels of dioxins may
negatively affect the development of the nervous system and reproductive function, disrupt the immune and
endocrine systems, and cause cancer. 2,3,7,8-tetrachlorodibenzo-para-dioxin (TCDD) has been considered
the most toxic congener. It has been classified as a carcinogen based on limited evidence in humans and
sufficient evidence in experimental animals (Group 1) by the International Agency for Research on Cancer
(IARC). In the present study, the structure and properties of dioxin and dioxin-like compounds, their sources,
their distribution, and potential toxicity have been reviewed.
Keywords: Dioxin, dioxin-like compounds, polychlorinated dibenzo-p-dioxins, polychlorinated dibenzo
furans, polychlorinated biphenyls, health, environment

International Conference on
RAW MATERIALS TO PROCESSED FOODS 03-04 June 2021, Turkey
161
Black Garlic in the Food Industry
Eyad Aoudeh1, Emel Oz1, Fatih Oz1
1Atatürk University, Agriculture Faculty, Food Engineering Department, Erzurum, Turkey.
Tel: +904422311625, Fax: +904422315878, E-mail: [email protected]
ABSTRACT
Black garlic is a type of garlic product produced by heating fresh garlic under controlled temperature (60–
90°C) and humidity (80–90%) for a while (> 1 month). Many chemical and physicochemical changes occur
during the production process, which results in a new derivative with a darker color, softer texture, and
sweeter taste and does not release the strong off-flavor of fresh garlic. In addition, many sulfur-containing
compounds are formed during production, which contribute to health benefits. Literature data indicate that
black garlic and its extracts exhibited antioxidant, antimicrobial, antiobesity, hepatoprotective, anti-
inflammatory, antiallergic, and anticancer activities. However, the production conditions (temperature,
humidity, and period) strongly affect the black garlic quality and bioactivity. Minimizing the unpleasant taste
and odor of black garlic compared to fresh garlic and its enhanced bioactivity, it becomes a popular food
item in high-end cuisine and many food products. Black garlic and/or its extracts were added to various types
of food products such as sponge cake, bread, jam, jelly, yogurt, candies, ice creams, sausage, and meatballs.
Herein, some properties and health benefits of black garlic and its application in the food industry, especially
meat products, have been reviewed.
Keywords: black garlic, bioactivity, food industry
International Conference on
RAW MATERIALS TO PROCESSED FOODS 03-04 June 2021, Turkey
162
Antifungal Activities of Essential Oils Against Mycotoxigenic Fungal Agent
Fusarium incarnatum, Causal Disease Agent of Pepper Fruit Rot
Soner Soylu1*, Mehmet Atay2, Merve Kara1, Aysun Uysal3, Emine Mine Soylu1, Şener Kurt1
1Department of Plant Protection, Faculty of Agriculture, Hatay Mustafa Kemal University, 31034 Antakya, Hatay,
Turkey 2Department of Plant Protection, Faculty of Agricultural Sciences and Technologies, Adıyaman University, 02040
Adıyaman, Turkey 3Centre for Implementation and Research of Plant Health Clinic, Hatay Mustafa Kemal University, 31034 Antakya,
Hatay, Turkey
*E-mail: [email protected]; +90 542 3235120; Fax: +90 326 2455832
ABSTRACT
Chilli pepper (Capsicum annuum L.), is one of the most commercially important, widely grown and
consumed vegetables in Turkey. During a survey conducted from June to September of 2017, C. annuum
plants showing typical fruit rot symptoms were observed in several inspected fields and local
retailers/bazaars in the Hatay province of Turkey. Among the 40 isolates obtained, six isolates caused typical
disease symptoms on artificially inoculated pepper fruits. Based on morphological characteristics of fungal
structures and molecular analysis, all isolates were identified as Fusarium incarnatum (Desm.) Sacc. 1886.
To our knowledge, this is the first report of fruit rot disease on chilli pepper caused by potentially
mycotoxigenic fungal agent Fusarium incarnatum in Turkey. Antifungal activities of six different essential
oils (EOs) were evaluated against mycelial growth inhibition fungal agent. The complete mycelial growth
inhibition was recorded at the relatively low concentrations used for EOs of Origanum syriacum (4.0 µl petri-
1) followed by Thymbra spicata (6.0 µl petri-1) and Thymus vulgaris (6.0 µl petri-1). Essential oils of
Foeniculum vulgare, Laurus nobilis and Eucalyptus camaldulensis have showed antifungal activities against
fungal isolate at the relatively higher concentrations used (20.0-25.0 µl petri-1). Higher antifungal efficacies
of essential oils of Thyme-like plants against fungal agent suggesting their use in different food technologies
as biopresevative.
Keywords: Pepper, Fruit rot, Essential oils, Antifungal, Fusarium incarnatum
International Conference on
RAW MATERIALS TO PROCESSED FOODS 03-04 June 2021, Turkey
163
Antioxidant Potential of Milk Obtained from the Most Important Breeds of
Dairy Cattle in Poland
Jolanta Król*, Aneta Brodziak, Magdalena Stobiecka
Institute of Quality Assessment and Processing of Animal Products, University of Life Sciences in Lublin, Akademicka
13 St., 20-950 Lublin, Poland
*E-mail: [email protected]
ABSTRACT
Consumption of food products which are natural sources of antioxidants improves the body’s antioxidant
status and reduces the risk of a number of civilization diseases. One such product is milk, which contains a
number of bioactive substances with antioxidant activity, including whey proteins and vitamins. Whey
proteins, mainly β-lactoglobulin (β-LG), have the highest antioxidant status of all proteins in the human diet.
Among vitamins, the most important antioxidant in milk is vitamin E, which activity prevents lipid
peroxidation by scavenging singlet oxygen or oxidizing cholesterol. The aim of the study was to determine
variation in the antioxidant potential of milk depending on the breed of cow and the feeding season.
Individual milk samples were collected from cows of the Simmental (SM) and Holstein-Friesian (HF) breeds
during two feeding seasons – winter (W) and summer (S). In the summer season, the cows grazed in a
pasture and additionally received haylage, hay, and concentrate feed. In the winter season maize silage was
introduced to the diet. A total of 275 milk samples were collected, i.e. 120 from SM cows (60 in each season
– W and S) and 155 from HF cows (75 in season W and 80 in season S). The following determinations were
made in all samples: content of crude protein, fat, lactose, and dry matter (Infrared Milk Analyzer; Bentley
Instruments, USA), casein (AOAC, 2000), and somatic cell count (Somacount 150; Bentley Instruments,
USA). In addition, in samples in which SCC did not exceed 400,000 cells/ml, the content of selected whey
proteins, i.e. α-lactalbumin (α-LA), β-lactoglobulin (β-LG), lactoferrin (Lf), and serum albumin (BSA), as
well as fat-soluble vitamins (A, D3 and E) was determined by RP-HPLC using a ProStar 210 system (Varian,
USA). Cholesterol content was determined by spectrophotometry (Varian Cary BIO, USA; wavelength 570
nm), and total antioxidant status (TAS) using tests (Randox Laboratories Ltd, UK). In addition, the degree of
antioxidant protection (DAP) was calculated as the molar ratio between antioxidants and oxidants according
to Pizzoferrato et al. (2007). Milk from SM cows, irrespective of the production season, had significantly
(p≤0.01) higher content of crude protein and casein than the milk of HF cows. It also had significantly
(p≤0.05) higher levels of bioactive compounds, i.e. whey proteins (except for BSA) and vitamins. It should
be emphasised that milk obtained in the pasture season was a significantly (p≤0.01) richer source of
bioactive substances, irrespective of the breed of cow. Significant (p≤0.01) differences in TAS and DAP
were also shown between seasons, in favour of the pasture season. In addition, significant positive
correlations were obtained between TAS and the content of vitamins A and E and of β-LG, which indicates
that the content of these compounds largely determines the antioxidant potential of milk. DAP was positively
(p≤0.01) correlated with TAS and negatively (p≤0.01) with cholesterol content. Importantly, the higher TAS
and DAP values during the pasture season ensure greater stability and quality of milk and dairy products.
Keywords: degree of antioxidant protection, milk, total antioxidant status
International Conference on
RAW MATERIALS TO PROCESSED FOODS 03-04 June 2021, Turkey
164
Change in the Antioxidant Activity and Total Phenolics with Thermal Treatment
and Incorporation Way of Pistacia Terebinthus in Ice cream
Çağım Akbulut Çakır*, Metehan Ergenekon
Department of Food Science, Harran University, Sanliurfa, Turkey
*E-mail: [email protected]
ABSTRACT
Pistacia terebinthus belongs to the same family with Pistacia vera and contains many bioactive compounds
having antioxidant, antimicrobial, anti-inflammatory and cytotoxic activities. Although P. vera is a common
flavor used in ice-cream in Turkey, P. terebinthus consumption is limited to being a snack food or coffee-
like drink. In this study P. terebinthus is added to the ice-cream after heat treatment at different temperatures
(A: 0, B: 100, C: 125 and D: 140°C for 20 min.). Unheated and heated P. terebinthus seeds were milled, hard
shells were removed and added to the ice-cream mix before pasteurization of the mix. Change in the
antioxidant activity and phenolic content of P. terebinthus due to any possible interactions with milk proteins
and sugar when heating the ice-cream mix is also examined by comparing the control P. terebinthus solution
with milk solutions (9% milk powder, 10% sugar) where P. terebinthus is added before and after heating the
milk solution to 80°C for 1 min. Stage of adding P. terebinthus didn’t appear to influence total phenolics and
antioxidant activity according to ABTS assay. DPPH test showed a slight decrease in antioxidant activity
when it is added to milk solution and heated together, however that was statistically insignificant.
Antioxidant activity and total phenolics were determined by DPPH, ABTS assays and Folin-Ciocalteau total
phenolics assay. The physical, chemical and sensory properties of ice creams (A, B, C and D) were
compared with control (K) that doesn’t contain P. terebinthus. Adding P. terebinthus to ice-cream reduced
its pH, lengthened its melting time, however didn’t affect its viscosity as compared to K. Heat treatment of
P. terebinthus increased its total phenolics and antioxidant activity. Highest antioxidant activity and total
phenolics were observed at ice-cream C. Sensory evaluation was also found the C better in terms of general
acceptability.
Keywords: Ice cream, Pistachia terebinthus, Antioxidant activity, Heat treatment

International Conference on
RAW MATERIALS TO PROCESSED FOODS 03-04 June 2021, Turkey
165
Differently Structured Systems as a Carrier for the Bioactive Sea Buckthorn
Pomace Extract
Greta Švermickaitė, Viktorija Eisinaitė, Petras Rimantas Venskutonis, Daiva Leskauskaitė
Kaunas University of Technology, Department of Food Science and Technology, Radvilenu pl 19, Kaunas, LT-50254,
Lithuania
E-mail: [email protected], +37065413707
ABSTRACT
The objective of this study was to produce differently structured aerogels as a carrier for the bioactive sea
buckthorn pomace extract intended for food applications. Kognac glucomannan cryogels were produced with
different concentrations (0.2, 0.3 and 0.4 M) of sodium carbonate by applying a subsequent lyophilization
process. Whey protein alcogels (20 %) were prepared by removing pore fluid using supercritical CO2 drying.
The aerogels were analyzed by their morphology, encapsulation efficiency and antioxidant capacity of
extract.
The properties of konjac glucomannan cryogels depended on the concentration of sodium carbonate used for
deacetylation. The pores in the konjac glucomannan aerogels were irregular in shape and the decrease in total
pore volume (0.026 to 0.019 cc/g) as well as surface area (12.39 to 11.40 m2/g) after increasing the carbonate
concentration was observed. Meanwhile, pores in the whey protein alcogels were spherical with a total pore
volume of 0.135 cc/g. Cognac glucomannan cryogels were found to have better encapsulation efficiency
properties of hydrophilic sea buckthorn pomace extract (17 to 20%) in comparison with whey protein
alcogels (0.05 to 0.36 %). It was observed that the antioxidant binding capacity of the extract encapsulated in
both type aerogels increased during storage. However, whey protein aerogels presented higher antioxidant
capacity (48 to 150 µc) than kognac glucomannan (70 to 181 µc).
The obtained aerogels (especially kognac glucomannan-based ones) showed potential to be applied in food
industry as a carrier of bioactive sea buckthorn pomace extract.
Keywords: food-design, encapsulation, aerogels, structure, sea buckthorn
International Conference on
RAW MATERIALS TO PROCESSED FOODS 03-04 June 2021, Turkey
166
Chemical Composition and Functional Properties of Cynara cornigera Lindley
Shoot System Extract
Melis Sumengen Ozdenefe1*, Hatice Aysun Mercimek Takci2, Fikret Buyukkaya Kayis3
1Department of Biomedical Engineering, Faculty of Engineering, Near East University, 99138, Nicosia, North Cyprus
via Mersin 10 Turkey 2 Department of Molecular Biology and Genetics, Faculty of Art and Sciences, Kilis 7 Aralık University, 79000, Kilis,
Turkey 3 Central Research Laboratory, Adıyaman University, 02040, Adıyaman, Turkey
*E-mail: [email protected]
ABSTRACT
The aim of this study is to explore the chemical composition and potentiality (such as antimicrobial,
antioxidant and antidiabetic substances) of Cynara cornigera L. shoot system extract harvested from the
Turkish Republic of Northern Cyprus. Methanolic extract of C. cornigera shoot system displayed no
antibacterial effect on all tested microorganisms. Although the methanolic extract possessed a significant
radical scavenging activity for TPC, TFC, DPPH˙, ferric reducing capacity, metal chelating and
phosphomolybdenum assay, it did not show any antidiabetic activity. In addition, no essential oil was
determined in the chemical composition of the extract. These results indicated that the presence of
antioxidant substances of shoot system extract of C. cornigera can be effective against harmful effects of
free radicals. Due to this property, its use in human nutrition in Northern Cyprus becomes even more
important.
Keywords: Antidiabetic, Antimicrobial, Antioxidant activity, Cynara cornigera, methanol, Northern Cyprus
1. INTRODUCTION
Cynara cornigera is a wild edible plant, belonging to family Asteraceae, originating from Mediterranean
countries. This plant is mostly grown in some regions of Mediterrranean countries such as Egypt, Libya and
Cyprus (Sonnante et al., 2007; Ahmida, 2011; Elsayed et al., 2012; Hegazy et al., 2015). It is known as
‘Hostes’, ‘Gafurez’ and ‘Diken Otu’ in Northern Cyprus among the local people. It is a dwarf, perennial,
prickly plant having about 30 cm height with numerous base leaves. Its flower head is up to 5 cm with off-
white color. It is collected mostly in winter and early spring season. Its stem and receptacle organs are used
for human diet. Thorns of the plant must be peeled before being consumed by humans. Then it should be cut
into small pieces. It is washed with water before cooking. Its stew is made either plain or with potatoes/dried
bean. The boiled meal of the cowpea - Hostes mixture is made and it can be also fried with eggs and cooked
with meat (Kaya Yıldırım, 2010; Yilmaz et al., 2012).
Various plants having therapeutic activity, less toxic and not side effects are consumed by people all over the
world (Elsayed et al., 2012). Family of Asteraceae is accepted as a crucial family of plants with strong
hypoglycemic effects (antidiabetic activity) and hepatoprotective activities. It involves abundantly the
natural antioxidants, mostly polyunsaturated fatty acids, vitamins such as C, K, α-tocopherol and β-carotene.
It is also rich in polyphenols, especially caffeoylquinic acids and luteolin. (Ahmida, 2011; El Sohafy et al.,
2016). Since the ancient times, the members of this family which are rich in phenolic compounds, have been
used in herbal medicine for their beneficial and therapeutic effects. Phenolic compounds play a crucial role
against cancer, cardiovascular diseases, osteoporosis, diabetes mellitus and neurodegenerative diseases for
human nourishment (El Sohaimy, 2014).

International Conference on
RAW MATERIALS TO PROCESSED FOODS 03-04 June 2021, Turkey
167
Cynara cornigera is used for treatment of several diseases including hepatitis, hyperlipidemia, hepatobiliary
dysfunction, digestive complaints, irritable bowel syndrome, hyperlipoproteinemia, obesity, dyspeptic
disorder, diabetes mellitus, liver complaints and for improving liver regeneration after partial hepatectomy in
folk medicine in different Mediterranean countries (Ahmida, 2011; Elsayed et al., 2012; Hegazy et al., 2015).
Environmental pollution, polluted waters, radiation, heavy metals, pesticides and oxygen metabolism in
living cells are known to cause the formation of free radicals in the human body. Free radicals are source of
many diseases, especially cancer. Antioxidants protect the human body against all harms caused by free
radicals. Therefore, the significance of food products including antioxidants should be known and they
should be consumed in order to obviate the spread of many diseases.
Other point is the emerging pathogenic microorganisms resistant to antibiotics and reduced effectiveness of
these antibiotics. Currently, many studies are proceed to find influential solutions against drug-resistant
microorganisms all over the world. The discovery of new antimicrobial substances originating from plants
leads to new approaches to minimize antibiotic resistance and provides to benefit in preventing side effects
caused by antibiotic resistance for human health (Sumengen Özdenefe et al., 2018; Sumengen Ozdenefe et
al., 2020).
Diabetes mellitus is a metabolic disorder that affects many people around the world. In recent years, the
incidence of diabetes has increased in all countries and many studies have been carried out in this area
(Ahmida, 2011).
The absence of studies on the Cynara cornigera in Northern Cyprus or Turkey makes this study unique and
worthwhile. This research therefore aims to investigate chemical and functional properties of methanolic
shoot system extract of C. cornigera.
2. MATERIALS AND METHODS
2.1. Collection and Preparation of Plant Material
Stem and leaves of C. cornigera were collected from the Kyrenia region of Northern Cyprus in February
2020. Total wet weight of samples was 5300 grams. The collected shoot system was cleaned by paper towel.
The shoot system was cut into small parts with a knife and dried in an oven at 50ºC for 6 hours. Total dry
weight of samples was 720 grams. The dried samples were powdered and stored at +4°C refrigerator for
further analysis.
2.2. Extraction
The shoot system of C. cornigera was extracted by the methanol (1:10 [w/v]) under shaking conditions for
72 hours at room temperature. 10 g of Cynara cornigera L. shoot system was used for extraction. Then,
extract was filtered by Wattman No. 4 paper. The extract was kept refrigerated at +4ºC for chemical
composition and biological analyses.
2.3. Antimicrobial Activity
Antimicrobial activity of extract was carried out on Mueller Hinton Agar (MHA) by the standard method
(Owusu et al., 2021) following Kirby-Bauer disk diffusion method according to the Clinical Laboratory
Standard Institute (CLSI) guidelines (CLSI, 2012). The turbidity of the overnight bacterial cultures were
adjusted to 0.5 McFarland standard reference range. 10 µL of the each microbial suspension was taken with
a pipette and transferred to Mueller Hinton agar and then spreaded homogeneously on the surface with a
wooden cotton applicator stick. The sterile antimicrobial blank discs impregnated with 20 μL of the extract
were placed away from each other. Following the inoculation, the plates were incubated at 37ºC for 12-24 h.
Then, the inhibition zones around the discs were evaluated.
6 different commercial antibiotics including Erythromycin (E; 15 µg/disc) for Salmonella typhimurium
ATCC 14028 and Escherichia coli ATCC 25922; Penicillin (P; 10 units/disc) for Bacillus cereus ATCC
11778; Methicillin (M; 5 µg /disc) for Staphylococcus aureus ATCC 25923 and Polymxin B (PB, 300
unit/disc) for Pseudomonas aeruginosa ATCC 27853 were tested as the positive controls. Methanol was
used as negative control.
International Conference on
RAW MATERIALS TO PROCESSED FOODS 03-04 June 2021, Turkey
168
2.4. Total phenolic (TPC) and flavonoid content (TFC)
The total phenolic content was performed by Folin-Ciocalteu’s colorimetric method as gallic acid
equivalents (mg GAE)/g (Stankovic, 2011). The total flavonoid content was determined by Sharm and Vig
(2013) method as mg of routine equivalent (mg RE)/g.
2.5. Gas chromatography headspace analyses
For determining of essential oil composition in extract, 3 g dried and powdered shoot system sample was
analyzed using gas-chromatography coupled with headspace system After optimization processes, headspace
conditions were detected as follows: Sample volume (µL): 1; incubation time (min): 30; incubation
temperature (°C): 80; syringe temperature (°C): 80. HP-5 MS capillary column with mass selective detector
7890B GC-5977MSD (Agilent, Santa Clara, USA) were used in the analysis. The GC conditions were set as
follows; initial column temperature at 50°C for 2 min, then ramped to 150 °C at 10 °C/min and held at same
temperature for 5 min. Thereafter, temperature was raised gradually to 240°C at same condition and kept at
for 5 min. Samples were injected automatically with split ratio 50:1 (Sevindik, 2020) Components were
identified by electronic NIST14 library (2014 version). Percent amounts (%) of each component in sample
were calculated from total peaks area by apparatus software.
2.6. Antioxidant Activity Analyses
2.6.1. DPPH˙ radical scavenging capacity
Free radical scavenger method declared by Blois (1958), Ucan Turkmen and Mercimek Takci, (2018) is
based on turning colorless of the 1,1-diphenyl-2-picryl-hydrazil (DPPH˙) reagent solution depending the
electron or proton-transfer ability of samples. For this analysis, 100 µL of the extract was added to 3.9 mL of
DPPH˙ reagent (0.025 g/L in methanol) solution prepared in methanol (0.1 mM). For allowing the chemical
reaction, this mixture was incubated at room temperature in the dark for 30 min. Following incubation, the
absorbance of the mixture was spectrophotometrically measured at 517 nm (Biochrom, Libra S60, B,
England) against methanol blank DPPH˙ scavenging activity is expressed as Trolox equivalent (mg TE/g).
2.6.2. Ferric Reducing Capacity Assay (FRAP)
In this assay, the reducing Fe3+ to Fe2+ capability of antioxidant substances in extract was tested (Oyaizu,
1986). The absorbance of Prussian blue color formed by adding FeCl3 in reaction mixture was measured. In
brief, the extract (1 mL) was mixed with 2.5 mL of 0.2 M sodium phosphate buffer (pH 6.6) and 2.5 mL of
1% potassium K3Fe(CN)6. This reaction solution was incubated at 50ºC for 20 min. To terminate the activity,
10% TCA was added and the mixture was centrifuged at 2500 rpm for 10 min. The equal volume of distilled
water and 0.5 mL FeCl3 (0.1%) were added to 2.5 mL of supernatant. The absorbance of reaction mixture
was measured at 700 nm (Biochrom, Libra S60, B, England). Reducing capacity of extract is expressed as
Trolox equivalents (µg TE/g).
2.6.3. Metal chelating activity
Fe2+ chelating activity of extract was performed according to method described by Dinis et al. (1994). This
method is based upon the competition of metal-binding compounds in the extract with ferrozine, a strong
iron chelating agent. The compounds having high metal ions binding capacity avoid the red Fe2+/ferrozine
complex formation. Briefly, 3.7 mL distilled water and 100 μL of 2 mM FeCl2 were added to 1 mL of
extract. After incubated at room temperature for 30 min, 200 μL of 5 mM ferrozine solution was added to the
reaction and mixed through 10 min. And the absorbance of reaction mixture was measured at 562 nm
(Biochrom, Libra S60, B, England). Chelating activity was expressed as % inhibition using following
equation.
% chelating activity = (1–(Asample/Acontrol)) x 100
2.6.4. Phosphomolybdenum method
The total antioxidant capacity was determined as spectrophotometrically by using the phosphomolybdenum
method (Zengin et al., 2014). 3 mL of reactive solution (0.6 M sulfuric acid, 28 mM sodium phosphate, and
4 mM ammonium molybdate) was mixed with 300 µL extract rapidly. After incubation at 95°C for 90

International Conference on
RAW MATERIALS TO PROCESSED FOODS 03-04 June 2021, Turkey
169
minutes, the absorbance was measured at 695 nm (Biochrom, Libra S60, B, England). Total antioxidant
capacity was expressed as equivalents of trolox (µg/TE g). Each spectrophotometric analysis was repeated at
least three times.
2.7. Antidiabetic activity
For α-amylase assay, the test tube including 1 mL extract, 1 mL of starch solution (1% w/v) and 1 mL of 20
mM sodium phosphate buffer (pH:6.9) was incubated at 37°C for 5 min. Thereafter, 1 mL of α-amylase
solution was started the reaction by adding into this tube. The reaction was stopped with 1 mL of color
reagent prepared with 5.31 M sodium potassium tartrate solution, 2 M NaOH and 96 mM 3,5-dinitrosalicylic
acid solution after 30 min. This mixture was boiled for 5 min and the absorbance was measured at 540 nm
(Biochrom, Libra S60, B, England) (Başyiğit, et al. 2020).
For α-glucosidase assay, a volumetric flask including 10 µL of extract and 40 μL of α-glucosidase enzyme
solution was incubated at 37°C for 5 min. Then, 950 μL of 0.7 mM 4-nitrophenyl-α-D-glucopyranoside
solution containing 100 mM NaCl and 50 mM phosphate buffer was added into this flask. After incubation at
37°C for 15 min, the reaction was stopped by adding 1000 μL of 0.5 M Tris. The absorbance was measured
at 400 nm (Biochrom, Libra S60, B, England) (Güngör Bilen, 2004). All antidiabetic activitiy analyses were
performed three repetitions.
3. RESULTS
In this study, extract of Cynara cornigera shoot system was not demonstrated the antibacterial activity
against all tested microorganisms. Negative control was not shown any inhibitory effect on all tested strains
(Table 1). Commercial Penicillin, Erythromycin, and Polymxin B showed antibacterial activity towards
Bacillus cereus ATCC 11778, Salmonella typhimurium ATCC 14028, Escherichia coli ATCC 25922 and
Pseudomonas aeruginosa ATCC 27853, respectively. On the contrary, Methicillin did not demonstrate
antibacterial activity against Staphylococcus aureus ATCC 25923. The total phenolic, total flavonoid
content, antioxidant and antidiabetic activity results of Cynara cornigera methanol shoot extract was shown
in Table 2. TPC and TFC values were calculated as 0.176mg GAE/g and 0.1038mg RE/g, respectively.
DPPH˙ radical scavenging activity of extract was evaluated by comparing it with the standard antioxidant
activity of Trolox equivalent (mg TE/g). DPPH˙ of extract was determined as 86.2% (0.55 mg TE/g). Results
of reducing capacity of Fe3+, metal chelating activity and phosphomolybdenum assay were calculated as
14.1µg TE/g, 91.4% and 53.54µg TE/g, respectively. These results indicated that the existence of antioxidant
substances of extract could be efficient towards the damaging effects of free radicals. α-amylase and α-
glucosidase activities of extract were not detected. Table 3 shows the identified compounds their retention
times and area percentages by gas chromatography headspace analysis. In GC/MS, 18 compounds were
identified using the NIST14 mass spectra library and the main active constituents were ethylene oxide
(51.30%), acetaldehyde (31.58%), pentanal (4.87%), hexanal (3.1%), formic acid, methyl ester (CAS)
(2.55%) and isobutyraldehyde (1.85%). These results indicated that chemical composition of extract not
include any essential oil.
Table 1 Diameter of the inhibition zone (mm) of Cynara cornigera extract
Cynara cornigera
extract
Positive Control Negative
Control
Bacillus cereus ATCC
11778
- 40 (Penicillin) -
Staphylococcus aureus
ATCC 25923
- - (Methicillin) -
Salmonella typhimurium
ATCC 14028
- 16 (Erythromycin) -
Pseudomonas aeruginosa
ATCC 27853
- 20 (Polymxin B) -
Escherichia coli ATCC
25922
- 16 (Erythromycin) -
(-) represents a no inhibition zone against microorganism.

International Conference on
RAW MATERIALS TO PROCESSED FOODS 03-04 June 2021, Turkey
170
Table 2 The total phenolic, total flavonoid content, antioxidant and antidiabetic activities of
Cynara cornigera methanol shoot extract
Cynara cornigera methanol shoot extract
Total phenolic content (mg GAE/g) 0.176±0.005
Total flavonoid content (mg RE/g) 0.1038±0.001
DPPH (% / mg TE/g) 86.2±0.001 / 0.55±0.001
Ferric reducing capacity (µg TE/g) 14.1±0.957
Metal (Fe2+) chelating activity (%) 91.4±0.069
Phosphomolybdenum (Total
antioxidant capacity) (µg TE/g)
53.54±0.099
α-amylase activity ND
α-glucosidase activity ND Values are mean ± Standard deviation (SD) of three replicate analyses. ND: Not detected.
Table 3 The retention time (min) and percentage (%) of chemical composition of Cynara cornigera
methanol shoot extract
Compound Cynara cornigera methanol shoot extract
Retention time (min) %
Ethylene oxide 2.366 51.30
Carbon dioxide 2.366/2.476 51.30/31.58
Acetaldehyde 2.476 31.58
Isobutyraldehyde 3.973 1.85
1-Propanol 4.884 2.55
Methyl formate 4.884 2.55
Formic acid, methyl ester (CAS) 4.884 2.55
Butanal, 3-methyl- 5.134 4.87
Pentanal 5.134/6.003 4.87/0.80
Hexanal 7.487 3.11
1-Penten-3-ol 8.618 0.34
Furan, 2-pentyl 9.732 0.49
1-Pentanol 9.966 0.39
Acetic acid 12.728 1.22
2-Furan-carboxaldehyde 13.087 0.94
Furfural 13.087 0.94
Butanoic acid, 3-methyl 15.510 0.54
1,2-Hydrazinedicarboxaldehyde 15.510 0.54
4. DISCUSSION
Two Gram-positive, three Gram-negative bacterial strains were tested for antimicrobial activity of the
Cynara cornigera shoot system methanol extract. Extract did not show antibacterial activity against all tested
microorganisms.
El Sohaimy (2014), reported methanol extracts of globe (Cynara cardunculus L) and baby artichoke (Cynara
scolymus) which showed antimicrobial activity against Proteus vulgaris ATCC 6830 (2.63±0.15 and
3.42±0.32 cm), Escherichia coli 0-143 (2.76±0.21 and 3.54±0.25 cm), Staphylococcus aureus 0006
(1.75±0.13 and 3.45±0.19 cm), Klebsiella pneumonia 8961 (1.60±0.14 and 2.12±0.16 cm) and Bacillus
subtilis ATCC 6633 (1.86±0.23 and 2.67±0.26 cm), respectively. The MIC of methanol extract of globe and
baby anzio artichoke were determined as 100 and 75 mg/ml, respectively. Methanol extract of Cynara
International Conference on
RAW MATERIALS TO PROCESSED FOODS 03-04 June 2021, Turkey
171
scolymus was more effective than Cynara cardunculus L. extract against all tested bacterial strains (El
Sohaimy, 2014). Falleh et al. (2008) reported that the methanolic leaf extract of Cynara cardunculus L.
showed antibacterial activity against S.aureus ATCC 25923 (25.7±0.6 mm) and E.coli ATCC 35218 (22.3
mm). In addition, leaf extract showed inhibitory effect on tested other microorganisms such as S. epidermidis
CIP 106510 (20.3 mm), Micrococcus luteus NCIMB 8166 (21.7±0.6 mm), E. feacalis ATCC 29212
(16.3±0.6 mm), L. monocytogenes ATCC 19115 (9.3±0.6 mm), P. aeruginosa ATCC 27853 (13.7±0.6 mm).
The leaf extract did not have any inhibitory effect against Salmonella typhimurium LT2 (Falleh et al., 2008).
In the study of Zhu et al. (2004) the n-butanol fraction of Cynara scolymus L. leaf extract showed more
antimicrobial activities than that of chloroform and ethyl acetate fractions against B. subtilis, S. aureus, A.
tumefaciens, M. luteus, E. coli, S. typhimurium and P. aeruginosa. 2.5 mg/mL of ethyl acetate fraction did
not show any inhibitory effect to all tested microorganisms. Similary, any inhibitory effect did not observe
for chloroform fraction in same concentration except Bacillus subtilis. M. luteus, S. typhimurium and P.
aeruginosa were resistance to 2.5 mg/mL concentration of n-butanol fraction. In addition, M. luteus and P.
aeruginosa were resistant to 5 mg/mL chloroform fraction. S. aureus, A. tumefaciens and P. aeruginosa were
also resistant to 5 mg/mL concentration of ethyl acetate fraction. Briefly, only P. aeruginosa was resistant to
the 2.5, 5 and 10 mg/mL concentration of ethyl acetate fraction of leaf extract.
The EtOAc extract of C. cardunculus displayed the most effective antibacterial activity, followed by the
EtOH, CHCl3, water and n-BuOH extracts. S. typhimurium was found to be the most resistant. However, E.
coli was the most sensitive against all tested extracts (Kukic et al., 2008). In the study of El Sohaimy (2014),
Falleh et al. (2008), Kukic et al., (2008) extracts exhibited antibacterial activity against E. coli, S. aureus and
P.aeruginosa. However, no inhibition zone against E. coli, S. aureus and P. aeruginosa was observed in the
methanolic extract in this our study. Antibacterial activity result of Cynara cornigera extract against S.
typhimurium and P. aeruginosa was similar to the results of Kukic et al. (2008), Zhu et al. (2004) and Falleh
et al. (2008). Since there was no previous research on the antibacterial activity of Cynara cornigera
methanol extract, the authors could not compare the results against same species. For this reason, a
comparison has been made with studies conducted with different species of the same genus.
Nowadays it is accepted that phenolics make the greatest contribution to the antioxidant activity of plant
foods. Therefore, it is important to determine the phenolic content of the extract. TPC and TFC results of
Cynara cornigera methanol shoot extract was determined as 0.176±0.005 mg GAE/g and 0.1038±0.001 mg
RE/g, respectively. The TPC and TFC results obtained from the several studies with different species of the
Cynara genus are given following. According to Stumpf et al. (2020) TPC (TPC is referred to as not total
phenolic content but total phenolic concentration in their study, mg GAE g-1 DM) and total flavonoids (%
DM) of leaves of globe artichoke (Cynara cardunculus var. scolymus L.) were determined by Ph. Eur
(extraction according to European Pharmacopoeia), UAE (ultrasound assisted extraction) and HW (hot water
extraction) extracts. TPC and total flavonoids values of Ph. Eur., UAE and HW extracts were as 32.7±1.8,
31.9±1.7, 29.5±1.8, 0.68±0.04, 0.60±0.03 and 0.53±0.03, respectively. Salem et al. (2017) reported that
maximum TPC value of Cynara scolymus L. leaves extract was obtained in EtOH extract with 54.54±1.26
mg GAE/g DW. TPC values of ethyl acetate, aqueous, butanol and hexane extracts were determined as
53.07±0.47, 49.49±0.39, 41.66±2.23 and 39.91±9.36 mg GAE/g DW, respectively. TFC values of extract
were 12±0.83 and 8.19 ± 0.6 mg CE/g DW for EtOH and hexane extracts. The total phenolic content (TPC)
of globe artichoke (Cynara cardunculus L) and baby anzio (Cynara scolymus) species of methanol extract
were reported as 30.70±1.87 and 38.31±0.96 mg GAE/g DW (El Sohaimy, 2014). Lutz et al. (2011) revealed
that total phenolics (TP) concentration of mature and baby artichokes (Cynara scolymus L.) in AE (Aqueous
extract) and HE (hydroalcoholic extract) extracts. TP of mature and baby artichokes were detected as
5.40±0.13 and 4.55±0.14 mg TAE/100 g d.w., whereas the values of HE was 5.76±0.09 and 5.93±0.15 mg
TAE/100 g d.w., respectively. In other study, leaf and seed methanolic extracts of Cynara cardunculus L.
were declared the total polyphenol content as 14.79 and 14.33 mg GAE/g DW). However, flower extract was
6.96 mg GAE/g DW. Flavonoid content of leaf, seed and flower extracts were 9.08, 9.78 and 5.58 mg CE/g
DW, respectively (Falleh et al., 2008).
Total phenolic contents of EtOAc, n-BuOH, EtOH, H20 and CHCl3 extracts of Cynara cardunculus whole
involucral bracts were determined as 0.203±0.018, 0.062±0.019, 0.050±0.010, 0.046±0.007 and 0.026±0.002

International Conference on
RAW MATERIALS TO PROCESSED FOODS 03-04 June 2021, Turkey
172
mg of gallic acid equivalent/mg dry weight, respectively (Kukic et al., 2008). The total phenol content of
different parts of five artichoke varieties (Cynara cardunculus L. var. scolymus (L.) Fiori) were notified by
Fratianni et al. (2007). TPC values of receptacle, inner, intermediate, outer bracts and leaves were reported
with ranging from 3.09-1.32, 8.03-2.33, 1.74-0.50, 1.79-0.51 to 2.30-052 mM/g. Similar to our results,
literature data indicate that different species of the genus of Cynara have different amount of phenolic
content.
DPPH˙ of Cynara cornigera methanol shoot extract was determined as 86.2%. Furthermore, results of ferric
reducing capacity, metal chelating activity and phosphomolybdenum assay were detected 14.1µg TE/g,
91.4% and 53.54µg TE/g, respectively. Determination of antioxidant activity was done with applying similar
and different methods in previous studies. Antioxidant capacity of Cynara cardunculus var. scolymus L. was
determined by using the oxygen radical absorbance capacity (ORAC) assay. ORAC values of Ph.Eur., UAE
and HW extracts were 524±30, 518±30 and 442±27 µmol TE/g DM, respectively (Stumpf et al., 2020). The
antioxidant activity of Artichoke Leaves Extracts (ALE) was performed by using four different methods.
Results of the EtOH extract of C. scolymus of DPPH, ABTS, FRAP and β-carotene test were found 94.23%,
499.43 mmol Trolox/g DW, 527.79 µmol Fe2+ DW and 70.74%, respectively (Salem et al., 2017).
Free radical scavenging activity, reduction capability, superoxide anion scavenging activity, metal chelating
activity, total antioxidant capacity (ABTS) of Cynara cornigera methanol extract were determined by
Hegazy et al. (2016). Compound 1 displayed both a great metal chelating activity and a high total antioxidant
capacity (ABTS) compared with 2-7 as well as the standard butylated hydroxytoluene. Free radical
scavenging activity (DPPH) of compounds 2, 4, and 6 exhibited approximately the same inhibition level as
96% with an even greater activity than BHT. The ferric reduction capability of compound 4 and 6 were
exhibited a significant reducing power at 5 µg/mL. In superoxide anion scavenging activity assay, compound
6 achieved the most influential scavenging activity as 100% at 20 and 40 μg/mL concentrations rather than
BHT which has lowest effect at all concentrations.
El Sohaimy (2014) reported that the antioxidant activity of globe and baby anzio artichoke methanol extracts
were determined by DPPH-Free radical scavenging activity. IC50 of globe artichoke extract was
55.12±0.31% in concentration of 75 µg/ml, while IC50 of baby anzio artichoke extract was 49.52±0.16%.
The antioxidant activity of leaf extracts of the wild artichoke (Cynara cornigera) was analysed by using
DPPH radical scavenging activity. 80% methanol, ethyl acetate fractions, compound 1 (luteolin 7-O-
glucoside) and compound 3 (luteolin -7- O-rutinoside) displayed the maximal antioxidant activities as
88.46%, 89.77%, 90.2% and 90.5%, respectively (Elsayed et al., 2012). The antioxidant activites of the
aqueous and hydroalcoholic extracts in mature raw and baby raw of Cynara scolymus L. were found
30.50±0.14, 5.02±0.17, 28.46±0.33 and 22.97±0.39% (Lutz et al., 2011). These values were lower than of
methanol extract of this study. Falleh et al. (2008) were evaluated the antioxidant activity of Cynara
cardunculus L. organs extracts by free radical-scavenging and superoxide anion-scavenging activities
methods. The authors reported that seeds extract possessed the highest DPPH as compared to leaves and
flowers. IC50 values of seeds, leaves and flowers were 23, 53 and 118, respectively. Antioxidant activity of
Cynara cardunculus extracts were examined using the ferric reducing antioxidant power assay (FRAP) and
DPPH radical assay. FRAP values of EtOAc, n-BuOH, EtOH, H2O and CHCl3 extracts were 0.38±0.01,
0.36±0.01, 0.35±0.01, 0.34±0.01 and 0.12±0.02 µmol Fe2+/mg DW, respectively. On the other hand, SC50
(the concentration of extracts that caused 50% of neutralization) values of EtOAc, n-BuOH, EtOH and H2O
extracts for DPPH were revealed 21.50±1.87, 127.10±0.88, 157.00±0.16 and 173.15±0.65 µg/ml,
respectively. The SC50 value of CHCl3 extract did not achieve 50% of DPPH·neutralisation at the highest
concentration tested. Authors determined that EtOAc extract had the strongest activity among all extracts
(Kukic et al., 2008). When this study was compared with previous studies according to antioxidant results, it
was determined that the results of Salem et al. (2017), Hegazy et al. (2016) and Elsayed et al. (2012) were
consistent with the results of this study.
Cynara cornigera shoot system methanol extract was not exhibited any antidiabetic activity. Unlike the
above-mentioned studies, there is an in vivo study. The different findings regarding the antidiabetic effect of
C. cornigera extract have been reported by Ahmida. The author informed that antidiabetic activity of
aqueous extract of the roots of Cynara cornigera in alloxan-induced experimental diabetes mellitus.
International Conference on
RAW MATERIALS TO PROCESSED FOODS 03-04 June 2021, Turkey
173
Application of aqueous extract (1.5 g/kg) and glibenclamide (10 mg/kg) orally in diabetic rats were resulted
in a apparent reduction on blood glucose level from 330.80±10.11 mg/dLto 229.70±7.94 and 195.50±6.53
mg/dL for extract and glibenclamide, respectively. Additionally, serum insulin levels (from 18.00±1.23
µL/mL to 27.00±1.19 and 32.00±1.73 µL/mLfor extract and glibenclamide, respectively) and liver glycogen
content (from 14.80±1.10 mg/gto 33.65±1.96 and 39.10±2.47 mg/g for extract and glibenclamide,
respectively) were reclaimed through Cynara cornigera aqueous extract (Ahmida, 2011).
To our knowledge, this is the first study regarding the chemical composition of C. cornigera shoot system.
For this reason, the authors discussed chemical substances of its to the other Cynara species. Hadaruga et al.
(2009) expressed that β-cubebene was the main compound in flowers, stem and root extracts (38%, 39% and
25%, respectively) of C. scolymus L.; (E)-2-hexenal was the major biocompound (20%) in leaf extract. A
previous study reported that 25 compounds were identified of which hexadecanoic acid (27.6%), methyl
hexadecanoate (9.3%) and methyl 9,12-octadecadienoate (12.6%) in flowers extract of C. cardunculus L.
(Mucaji et al., 2001). Dabbou et al. (2017) identified sesquiterpenes hydrocarbons as the main chemical class
of C. scolymus in particular β-selinene, followed by β-caryophyllene. In the other study, Saucier et al. (2014)
found a total of 130 compounds including oxygenated monoter-penes, sesquiterpenes, oxygenated
sesquiterpenes, norisoprenoids, lactones, alcohols, ketonesand aldehydes in C. scolymus L. leaves. Similar to
previous study, Nassar et al. (2013) observed 37 compounds in the volatile oil, the majority including mono
and sesquiterpenes for C. scolymus L. methanol extract.
In conclusion, these findings demonstrated that phenolics and flavonoids are a key factor for the antioxidant
activity of Cynara cornigera extract. The present paper is the first study which describes the identification of
chemical constituents of the C. cornigera methanolic shoot extract. Our results related to antioxidant activity
of the extract are emphasized the importance of its consumption as a beneficial food product and the
traditional medicinal usage of Cynara cornigera.
REFERENCES
[1] Sonnante, G., Vittoria Carluccio, A., Vilatersana, R., Pignone, D. (2007). On the origin of artichoke and
cardoon from the Cynara gene pool as revealed by rDNA sequence variation. Genetic Resources and
Crop Evolution, 54, 483–495.
[2]Ahmida, M. (2011). Antidiabetic, Antihyperlipedemic and Antioxidant Effects of Aqueous Extract of the
Cynara cornigera in Alloxan-induced Experimental Diabetes Mellitus. International Journal of
Pharmacology, 7(7), 782–789. https://doi.org/10.3923/ijp.2011.782.789
[3] Elsayed, S.M., Nazif, N.M., Hassan, R.A., Hassanein, H.D., Elkholy, Y.M., Gomaa, N.S., Shahat, A.A.
(2012). Chemical and Biological Constituents from the Leaf Extracts of the Wild Artichoke (Cynara
cornigera). International Journal of Pharmacy and Pharmaceutical Sciences, 4(5), 396–400.
[4] Hegazy, A.K., Ezzat, S.M., Qasem, I.B., Ali-Shtayeh, M.S., Basalah, M.O., Ali, H.M., Hatamleh, A.A.
(2015). Diversity of Active Constituents in Cichorium endivia and Cynara cornigera Extracts. Acta
Biologica Hungarica, 66(1), 103–118.
[5] Kaya Yıldırım, F. (2010). Kuzey Kıbrıs’ın Faydalı Bitkilerinin Kullanım Alanlarının Araştırılması. MSc
Thesis. Near East University, Nicosia, Northern Cyprus.
[6] Yilmaz, N., Alas, T., Abak, K., Gücel, S., Kaya Yildirim, F. (2012). Wild Edible Plants of North Cyprus
and Their Traditional Use. Acta Horticulturae, 960, 129–133.
[7] El Sohafy, S.M., Metwally, A.M., Omar, A.A., Amer, M.E., Radwan, M.M., Abdel-Kader, M.S., El
Toumy, S.A., ElSohly, M.A. (2016). Cornigerin, a new sesqui-lignan from the hepatoprotective fractions
of Cynara cornigera L. Fitoterapia, 115, 101–105.
International Conference on
RAW MATERIALS TO PROCESSED FOODS 03-04 June 2021, Turkey
174
[8] El Sohaimy, S.A. (2014). Chemical Composition, Antioxidant and Antimicrobial Potential of Artichoke.
The Open Nutraceuticals Journal, 7(1), 15–20.
[9] Sümengen Özdenefe, M., Muhammed, A., Süer, K., Güler, E. Mercimek Takcı, H.A. (2018).
Determination of Antimicrobial Activity of Corchorus olitorius Leaf Extracts. Cyprus Journal of Medical
Sciences, 3, 159–163.
[10] Sumengen Ozdenefe, M., Tanoglu, F., Suer, K., Guler, E., Mercımek Takcı, H.A. (2020). Antioxidant
and antimicrobial activity of Ficus sycomorus fruit and leaf extracts. Marmara Medical Journal, 33(3),
133–140.
[11] Owuso, E., Ahorlu, M.M., Afutu, E., Akumwena, A., Asare, G.A. (2021). Antimicrobial activity of
selected medicinal plants from a Sub-Saharan African Country against bacterial pathogens from post-
operative wound ınfections. Medical Sciences, 9(2), 23.
[12] CLSI, (2012). Performance Standards for Antimicrobial Disk Susceptibility Tests, Approved Standard
(7th ed.). CLSI document M02-A11, Clinical and Laboratory Standards Institute, 950 West Valley Road,
Suite 2500, Wayne, Pennsylvania 19087, USA.
[13] Stanković, M.S. (2011). Total phenolic content, flavonoid concentration and antioxidant activity of
Marrubium peregrinum L. extracts. Kragujevac Journal of Science, 33, 63–72.
[14] Sharma, S., Vig, A.P. (2013). Evaluation of in vitro antioxidant properties of methanol and aqueous
extracts of Parkinsonia aculeata L. leaves. The Scientific World Journal, 1, 2–7.
[15] Sevindik, B. (2020). Stability of volatile compounds of Turkish saffron (Crocus sativus) after one-year
storage. Journal of Raw Materials to Processed Foods, 1(2), 72-79.
[16] Blois, M. S. (1958). Antioxidant determinations by the use of stable free radical. Nature, 1199–1200.
[17] Ucan Turkmen, F., Mercimek Takci, H.A. (2018). Ultraviolet-C and ultraviolet-B lights effect on black
carrot (Daucus carota ssp. sativus) juice. Journal of Food Measurement and Characterization. 12, 1038-
1046.
[18] Oyaizu, M. (1986). Studies on product of browning reaction - Antioxidative activities of products of
browning reaction prepared from glucose amine. The Japanase Journal of Nutrition and Dietetics, 44(6),
307–315.
[19] Dinis, T.C., Madeira, V.M., & Almeida, L.M. (1994). Action of phenolic derivatives (acetaminophen,
salicylate, and 5-aminosalicylate) as inhibitors of membrane lipid peroxidation and assay peroxyl radical
scavengers. Archives of Biochemistry and Biophysics, 315(1), 161–169.
[20] Zengin, G., Sarikurkcu, C., Aktumsek, A., Ceylan. R. (2014). Sideritis galatica Bornm.: A source of
multifunctional agents for the management of oxidative damage, Alzheimer’s’s and diabetes mellitus.
Journal of Functional Foods, 11, 538–547.
[21] Başyiğit, B., Sağlam, H., Köroğlu, K., Karaaslan, M. (2020). Compositional analysis, biological
activity, and food protecting ability of ethanolic extract of Quercus infectoria gall. Journal of Food
Processing and Preservation, 44, e14692. https://doi.org/10.1111/jfpp.14692
[22] Güngör Bilen, Z. (2004). Antidiabetik etkili bitkilerde α-glukozidaz inhibitörleri. T.C. İstanbul
Üniversitesi, Yüksek Lisans Tezi.
[23] Falleh, H., Ksouri, R., Chaieb, K., Karray-Bouraoui, N., Trabelsi, N., Boulaaba, M., Abdelly, C. (2008).
Phenolic composition of Cynara cardunculus L. organs, and their biological activities. Comptes Rendus
Biologies, 331(5), 372–379.

International Conference on
RAW MATERIALS TO PROCESSED FOODS 03-04 June 2021, Turkey
175
[24] Zhu, X., Zhang, H., Lo, R. (2004). Phenolic compounds from the leaf extract of artichoke (Cynara
scolymus L.) and their antimicrobial activities. Journal of Agricultural and Food Chemistry, 52(24),
7272–7278.
[25] Kukic, J., Popovic, V., Petrovic, S., Mucaji, P., Ciric, A., Stojkovic, D., Sokovic, M. (2008).
Antioxidant and antimicrobial activity of Cynara cardunculus extracts. Food Chemistry, 107(2), 861–
868.
[26] Stumpf, B., Künne, M., Ma, L., Xu, M., Yan, F., Piepho, H.P., Honermeier, B. (2020). Optimization of
the extraction procedure for the determination of phenolic acids and flavonoids in the leaves of globe
artichoke (Cynara cardunculus var. scolymus L.). Journal of Pharmaceutical and Biomedical Analysis,
177, ID112879.
[27] Salem, M.B., Affes, H., Athmouni, K., Ksouda, K., Dhouibi, R., Sahnoun, Z., Hammami, S., Zeghal,
K.M. (2017). Chemicals compositions, antioxidant and anti-ınflammatory activity of Cynara scolymus
leaves extracts and analysis of major bioactive polyphenols by HPLC. Himdawi Evidence-Based
Complementary and Alternative Medicine ID4951937.
[28] Lutz, M., Henriquez, C., Escobar, M. (2011). Chemical composition and antioxidant properties of
mature and baby artichokes (Cynara scolymus L.), raw and cooked. Journal of Food Composition and
Analysis, 24(1), 49–54.
[29] Fratianni, F., Tucci, M., De Palma, M., Pepe, R., Nazzaro, F. (2007). Polyphenolic composition in
different parts of some cultivars of globe artichoke (Cynara cardunculus L. var. scolymus (L.) Fiori).
Food Chemistry, 104(3), 1282–1286.
[30] Hegazy, M.E.F., Ibrahim, A.Y., Mohamed, T.A., Shahat, A.A., El Halawany, A.M., Abdel-Azim, N.S.,
Alsaid, M.S., Pare, P.W. (2016). Sesquiterpene Lactones from Cynara cornigera: Acetyl Cholinesterase
Inhibition and In Silico Ligand Docking. Planta Medica, 82(1-2), 138–146.
[31] Hadaruga, N.G., Hadaruga, D.I., Tatu, C, Gruia, A., Costescu, C., Lupea, A.X. (2009). Multivariate
analysis (PCA) in Compositae biocompounds class. Journal of Agroalimentary Processes and
Technologies, 15(2), 201-210.
[32] Mucaji, P., Mucajiova, I., Nagy, M., Grancai, D. (2001). Chemical composition of the flower oil of
Cynara cardunculus L. Journal of Essesntial Oil Research, 13, 357-358 (September/October 2001).
[33] Dabbou, S., Dabbou, S., Flamini, G., Peiretti, P. G., Pandino, G., Helal, A.N. (2017). Biochemical
characterization and antioxidant activities of the edible part of globe artichoke cultivars grownm in
Tunisia. International Journal of Food Properties, 20(S1), S810-S819.
[34] Saucier, C., dos S. Polidoro, A., dos Santos, A.L.K., Schneider, J , B. Caramao, E., A., Jacques, R.
(2014). Comprehensive two-dimensional gas chromatography with mass spectrometry applied to the
analysis of volatiles in artichoke (Cynara scolymus L.) leaves. Industrial Crops and Products, 62, 507-
514.
[35] Nassar, M.I. , Mohamed, T.K. , Elshamy, A.I. , El-Toumy, S.A., Abdel Lateef, A.M., Farrag, A.R.
(2013). Chemical constituents and anti-ulcerogenic potential of the scales of Cynara scolymus (artichoke)
heads. Journal of the Science of Food and Agriculture, 93, 2494-2501.

International Conference on
RAW MATERIALS TO PROCESSED FOODS 03-04 June 2021, Turkey
176
Quality Evaluation of Pumpkin (Cucurbita Pepo) Powder Produced Using Three
Different Drying Methods
Dandago, Munir Abba*1, and Abubakar, Rukayya 2
1,2Department of Food Science and Technology, Faculty of Agriculture and Agricultural Technology, Kano University
of Science and Technology, Wudil Kano State, Nigeria.
E-mail: [email protected], +234 816 1733 527,
ABSTRACT
Matured pumpkins (Cucurbita pepo) are sweet with orange flesh rich in β-Carotene. They are valuable
sources of functional components such as carotenoids, lutein and selenium but underutilised. Pumpkin has
potential as food and industrial crop. Poor postharvest handling contributed to wastage during bumper.
Value-added products such as pumpkin powder will create shelf stable product with appreciable keeping
quality. Pumpkins were cleaned, cut and peeled. The seeds were scrapped off and flesh cut into uniform
sizes. Samples were blanched in hot water at 95°C for 1 minute, drained and cooled to room temperature.
They were then dried using three different methods (cabinet, tent and open sun). The dried samples were
grounded into powder using laboratory mill and sieved using 125-micron mesh. The samples were evaluated
for proximate composition, functional properties, microbial and sensory qualities. Proximate analysis results
showed relatively low moisture content across all methods. The moisture content of the powders ranged from
4.690±0.410 to 85.42±1.66 with cabinet dryer having the least moisture of 4.690±0.410. Samples were within
limits for safe storage. Cabinet dried sample had the highest protein, crude fibre, ash and β carotene
compared to others. The results indicated that increase in drying temperature are accompanied by decreases
in the water solubility, water and oil absorption capacities of the resulting powders. Tent and sun-dried
samples had better functional properties. Results of microbial analyses revealed low bacterial and fungal
counts with two samples (fresh and cabinet dried) recording no fungal growth. Results of sensory evaluation
of Miyar taushe prepared from the samples with fresh sample serving as control revealed that cabinet dried
pumpkin powder had good sensory quality in terms of colour, taste, flavour and acceptability. Good quality
pumpkin powder rich in nutrients with good sensory qualities that could be utilised for culinary purposes
could be produced using cabinet dryer.
Keywords: Drying, Pulp, Pumpkin, Powder
International Conference on
RAW MATERIALS TO PROCESSED FOODS 03-04 June 2021, Turkey
177
Grain Quality Characteristics of Local Popcorn Populations
Leyla İdikut1, Duygu Uskutoğlu1*, Songül Çiftçi1, Melek Selenay Gökçe1, Enes Hakan Seçilmiş1
1Department of Field Crops, Faculty of Agriculture, Kahramanmaraş Sütçü İmam University, 46000 Kahramanmaraş,
Turkey
*E-mail: [email protected]
ABSTRACT
Popcorn is a healthy consumption material because it has low calories. Popcorn has an important place in
human nutrition due to its popping property and the nutrients it contains. In this study, seventeen local
popcorn populations and three registered popcorn varieties were grown as second crops in 2019 under
Kahramanmaraş conditions and their some quality characteristics were investigated. In this study, ash, oil,
moisture, protein and starch ratios were determined in the grain samples that were ground into flour,
thousand grain weights and popping volume of each population were determined. According to the results of
this research, thousand grain weights of local popcorn populations were found between 210.44 – 97.43 g and
the highest thousand grain weight value was obtained from Ordu Kabartur population. The ash rate in the
grain was found between 1.73-1.48% and the highest value was recorded in Nermin Cin popcorn variety. Fat
ratio was found between 6.69-4.35% and the highest value was obtained from Çanakkale Red population.
The moisture content in the grain was between 10.99-10.33% and the highest value was found in Ordu
Çatalpınar population. Protein ratio is between 10.66-8.88% and statistically no difference was observed
between the populations. The starch rate in the grain was found between 67.11-61.65% and the highest starch
rate was obtained from Samsun White. In the study, the popping volumes of popcorn varied between 28 and
7.33 cm3 g-1. In the research, Samsun bafra Kasu line had the highest popping volume with 28 cm3 g-1, while
the Ordu Perşembe Kovanlı line had the lowest popping volume with 7.33 cm3 g-1.
Keywords: Popcorn, Quality Charecteristics, Ash, Protein, Starch
INTRODUCTION
People, plants and animals living on the soil constantly explore their environment and provide a living space
for themselves. Humans, the most intelligent of these creatures, use the animals and plants around them to
shape them and use them for their own welfare and nourishment. The increasing human population increases
the need for plant and animal foods. Grain group plants are at the top of the herbal products used by people
most in the world. At the same time, the most fed product for animals are cereals. For this reason, studies on
cereal crops from past to present maintain their continuity.
Cereal plants known as Gramineae family are divided into two groups as cool and warm climate cereals
according to the climates in which they are grown. While cool climate cereals show the largest distribution
area in the world, the cultivation of hot climate cereals with higher temperature demand is more limited than
cool climate cereals. Corn, which is included in the Maydeae tribe of the Gramineae family, is a C4 plant
that can make the best use of solar energy and gives the highest yield in a short time. The corn plant has
seven varietal groups due to the fact that it forms different grain shapes in its evolution. Horsetooth corn,
hard corn, popcorn and sugar corn varieties of corn plant are cultivated economically (Kırtok, 1998). The
economic usage areas of maize differ according to the varieties. Pop corn has popping ability. It has been
determined that the temperature permeability and mechanical strength of the popcorn grain is 2.2-2.9 times
higher than the other corn varieties, increasing the burst quality (Silva et al. 1993). Since popcorn poping
when it is heated, it has become a snack that is loved by people. Popcorn (Zea mays L. everta Sturt.) is the
maize which has the hardest and smallest grains. It has a short vegetation period, is generally considered as a
snack and finds buyers at high prices.(Özkaynak and Samancı 2003). A significant part of the world's
popcorn production is in the USA. Consumption of popcorn, which is mostly consumed in the USA, is also
increasing in our country. Popcorn is a preferred food item in terms of nutrition because of the vitamins and
International Conference on
RAW MATERIALS TO PROCESSED FOODS 03-04 June 2021, Turkey
178
minarets it contains. It is a good dietary product with its satiating and stomach acid absorbing feature (Ülger,
1998).
Due to the growing has a short periot and high yield of the corn plant, commercial companies had to
constantly develop new corn varieties. Local maize populations and gene resources are destroyed by
manipulate the genes of maize (İdikut et al., 2012) ). The spread of hybrid varieties, the use of too many
inputs and the increasing commercialization rate in agriculture have narrowed the production area of local
plant species. Although highly productive hybrid varieties are predominate, local varieties are still cultivated
in some areas.Local corn varieties have generally succeeded in yielding products in adverse conditions by
completing their natural selection in their environment. Even within themselves, the characteristics of having
different genetic variations can complement each other's deficiencies and be superior to commercial varieties
in terms of some characteristics (Allard and Bradshaw, 1964). For this reason, studies that will protect the
gene resources of our local varieties should be supported for the transfer of next generations.
Agricultural practices differ according to regional conditions. These differences are due to climate, soil and
water sources. For this reason, agricultural practices are planned according to regional conditions. In some
regions, climatic conditions allow corn to be grown as a monoculture, while in some regions it allows it to be
grown as a second crop after the main crop. When the areas with irrigation facilities are evaluated for second
crop corn, it contributes to animal production due to the use of stubble residues left in the field for grazing
(Sarikurt and Bengisu 2020).
Although the yield of commercial varieties is higher than local varieties (Özkaynak and Samancı, 2003),
local genotypes are more resistant to adverse conditions. Due to the necessity of protecting local populations
and maintaining agriculture, 20 popcorn varieties were grown as a second crop in Kahramanmaraş region,
which has a Mediterranean climate, and grain quality characteristics were examined.
MATERIAL AND METHOD
As research material, 2 commercial varieties (Ant cin, Nermin cin) and local popcorn population obtained
from different regions of Turkey were used. The grain material used in the research was named after the
region from which it was obtained. In the research, Ant (1), Çanakkale Red (2), Samsun Yellow (3), Ordu
Çatalpınar (4), Edirne White (5), Tokat Erbağ (6), Çanakkale White (7), Çanakkale Yellow (8). ), Sakarya
Han Village (9), Samsun Bafra Kasu Village (10), Nermin (11), Balıkesir (12), Kadirli (13), Ordu Perşembe
Kovanlı Village (14), Balıkesir White (15), Ordu Kargan Tepealan (16), Ordu Çamaş Giden District (17),
Samsun White (18), Ordu Kabartur Çukurca Mahallesi (19), Composite 13 (20) genotypes were used. A total
of 20 maize genotypes were grown in Kahramanmaraş conditions in the second crop growing season
(between June and September) in 2019.
The minimum temperatures for the months of June and October 2019, in which the experiment was
conducted, were 19.9 0C, 21.80 0C , 29.30C, 17.7 0C, maximum temperatures 35.9 0C, 36.6 0C, 38 0C, 35.2 0C, average temperatures 27.2 0C, 28.4 0C. , 29.3 0C, 26.0 0C, 21.30 0C humidity were 50.1%, 49.8%, 50.5%,
43.3%, and the average precipitation was recorded as 5.2, 0.2, 0, 1, 174.60, respectively,. It has been
determined that the experimental area has a clayey texture, rich in useful potassium, calcareous, neutral and
medium organic matter soil. The experiment was planted on 19.06.2019 according to the randomized blocks
experimental design with three replications, 70 cm row spacing and 20 cm row spacing in 4 rows. 18-46
DAP fertilizer was applied with sowing, so that 6 kg net phosphorus fertilizer per decare. When the plant
was 50 cm tall, urea fertilizer was applied so that a total of 25 kg nitrogen per decare was dropped. Tractor
hoe was applied to the plants in the experimental area twice and the plants were watered 9 times during the
growing period.The trial was sprayed twice for the for the corn worm. The data obtained at the end of the
research were analyzed using the SAS statistical program according to the ANOVA method. The means of
the features that differed statistically significantly were grouped according to the Duncan multiple
comparison test.
FINDINGS AND DISCUSSION
In the research, thousand grain weight, ash, oil, moisture, protein,starch ratios and popping volume of
popcorn genotypes were examined. Except for the protein content in the grain, other properties showed
significant differences.
Table 1. The averages and groups of thousand grain weight (g), ash (%), oil (%), moisture (%), protein

International Conference on
RAW MATERIALS TO PROCESSED FOODS 03-04 June 2021, Turkey
179
(%),starch (%) and popping volume (cm3 g-1) of local popcorn genotypes.
Genotypes Thousand
Grain
Weight
(g)
Ash (%) Oil (%), Moisture
(%)
Protein (%) Starch (%) Popping
volume
(cm3 g-1)
**
1.Ant cin 190.53 a 1.610 a-
d
5.93 a-c 10.73 a-d 9.35 a 64.09 ab 21.00 b-d
2.Çanakkale K. 97.43 e 1.686 a-
c
6.696 a 10.33 d 9.64 a 63.01 ab 18.53 ef
3.Samsun Sarı 148.30 b 1.593 a-
d
5.95 a-c 10.65 a-d 9.34 a 64.76 ab 19.00 de
4.Ordu
Çatalpınar
184.68 a 1.566 a-
d
6.353 ab 10.99 a 9.49 a 65.05 ab 9.26 ıj
5.Edirne Beyaz 185.05 a 1.603 a-
d
4.41 bc 10.94 ab 9.59 a 64.47 ab 13.60 h
6.Tokat Erbağ 117.14 c-
e
1.596 a-
d
5.13 a-c 10.70 a-d 10.44 a 64.75 ab 15.06 gh
7.Çanakkale
Beyaz
128.69 b-
d
1.720 ab 4.79 a-c 10.70 a-d 10.66 a 63.51 ab 22.20 b
8.Çanakkale sarı 125.53 b-
e
1.483 d 4.35 c 10.45 b-d 10.00 a 66.07 ab 26.53 a
9.Sakarya han
köyü
141.88 b-
c
1.706 ab 6.16 a-c 10.45 a-d 10.47 a 61.65 b 16.66 fg
10.Samsun B.
Kasu
100.95 de 1.566 a-
d
6.496 a 10.79 a-d 9.33 a 64.15 ab 28.00 a
11.Nermin Cin 136.35 bc 1.730 a 6.06 a-c 10.80 a-d 10.59 a 63.21 ab 20.20 b-e
12.Balıkesir Cin 136.99 bc 1.616 a-
d
6.22 a-c 10.67 a-d 9.82 a 62.91 ab 19.33 c-e
13.Kadirli Cin 144.29 bc 1.626 a-
d
5.45 a-c 10.85 a-c 10.09 a 64.22 ab 21.53 cb
14.Ordu P.
Kovanlı
195.56 a 1.506 cd 4.99 a-c 10.38 cd 9.10 a 66.47 a 7.33 j
15.Balıkesir
Beyaz
139.92 bc 1.553 b-
d
5.12 a-c 10.56 a-d 9.40 a 67.10 a 20.33 b-e
16.Ordu K.
Tepealn
205.36 a 1.623 a-
d
5.95 a-c 10.33 d 9.49 a 63.18 ab 9.73 ı
17.Ordu Ç.
Giden
188.99 a 1.643 a-
d
6.433 a 10.69 a-d 10.01 a 63.71 ab 9.73 ı
18.Samsun
Beyaz
107.43 de 1.503 cd 4.97 a-c 10.83 a-d 8.88 a 67.11 a 19.13 de
19Ordu K.
Çukurca
210.44 a 1.576 a-
d
5.56 a-c 10.70 a-d 10.09 a 64.23 ab 8.53 ıj
20. Kompozit 13 143.05 bc 1.553 a-
d
5.89 a-c 10.65 a-d 9.53 a 65.10 ab 20.00 b-e
3.1. Thousand Grain Weight (g)
Differences between genotypes were found to be statistically significant in terms of thousand grain weight
(p<0.01). It was determined that the thousand grain weights of local popcorn genotypes varied between
210.44 g - 97.43 g, the highest value was 210.44 g in genotype 19, and the lowest value was in genotype 2
with 97.43 g. Genotype number 19 with the highest thousand grain weight was statistically included in the
same group with genotypes 1, 4, 5, 14, 16, and 17, and it was determined that these genotypes differ
significantly from other genotypes. Genotype 3 formed a second group with a weight of 148.30 g, and there
International Conference on
RAW MATERIALS TO PROCESSED FOODS 03-04 June 2021, Turkey
180
was a statistically significant difference between other genotypes except for genotypes 7, 8, 9, 11, 12, 13, 15
and 20. While the genotype 2, which has the lowest thousand grain weight, did not make a significant
difference between the genotypes 6, 8, 10 and 18, and there was a statistical difference between the other
genotypes. The thousand-grain weight of Nermin Cin, Ant Cin 98 and Composite 13 local commercial
varieties were 136.99, 190.53 g and 143.05 g (Table 1). The thousand-grain weights of some of the local
popcorn population showed higher values than the registered local varieties. From the researches made with
a thousand grain weight of popcorn as the first crop; Özkaynak and Samancı (2003) found the highest 114.8
g in 15 popcorn lines and 115.2 g in crosses, İdikut et al. (2021) determined the thousand grain weights of
popcorn genotypes between 181.06-127.12 g, Marques et al. (2015) reported that it was between 131.43-
137.99 g, and Kahramanoğlu (2019) found that between 241.81 g and 149.06 g. In the study conducted as the
second crop more variation was recorded than the results obtained by previous researchers. The excess of
variation is a genetic gain. This may be due to the large number of varieties used and the fact that they were
grown as a second crop.
3.2. Ash (%)
In this study carried out with local popcorn genotypes, ash values were found between 1.730 and 1.483. The
highest value was observed in genotype 11, while the lowest value was observed in genotype 8. The ash
ratios of Nermin Cin, Ant Cin 98 and Composite 13 local commercial varieties were found to be 1.730,
1.610 and 1.553. The genotype 11 with the highest ash content created a significant difference between the
genotype 8 which has the lowest ash value and the genotypes 14, 15, 18.
3.3. Oil (%)
In the study, the oil values in the popcorn grain were found in the range of 6.69 – 4.35%. While genotype 2
has the highest oil value with 6.69%, it is followed by genotype 10 with 6.49%. Genotype 17 took the third
place with a rate of 6.43%. It has been reported that the genotypes in the first three ranks are in the same
group. It was determined that genotype 8 had the lowest fat ratio with 4.35% and formed a different group.
The other 16 genotypes were included in the transitional groups between these two groups (Table 1).
Ratkovic and Dumanovic (1993) determined the lowest oil rate in popcorn and the highest rate in standard
type in 6 hybrid maize. İdikut et al. (2021) reported that the oil ratio of the local gin corn genotypes used in
their research was between 3.003-6.650%. Kahraman (2016) stated that the fat ratio in the second product
varied between 3.0-4.6%. Although it is expected that the oil ratios are low in the popcorn genotypes, the
variation is also important due to the local population.
3.4. Moisture (%)
The moisture values of the study were found in the range of 10.99 – 10.33. It was observed that the highest
moisture value was in genotype 4 (10.99) and the lowest moisture value was in genotype 2 (10.33%). It was
noted that the varieties formed two main groups in terms of moisture content and the other varieties were in
the transition groups between these two main groups. Storage humidity is expected to be 13-14% in cereals
under normal conditions. The results obtained are the expected result, as the low moisture content of popcorn
contributes positively to the popping feature.
3.5. Protein (%)
There was no statistically significant difference between genotypes in terms of protein content in grain. In
this study carried out with local popcorn varieties, the protein ratio in the grain was found to be in the range
of 10.59 -8.88. The genotype with the highest protein content was found as 11, and the genotype with the
lowest protein ratio was found as 18. In Nermin Cin, Ant Cin 98 and Composite 13 varieties, the protein
ratios were determined as 10.59%, 9.35% and 9.53%. Some of the local popcorn populations were found to
have a much higher protein content than registered local varieties (Table 1). Banarjee et al. (2004), in their
study in India, the protein content was found to be 9.19% on average, İdikut et al. (2021) found the protein
ratio between 8.435-16.650% in their study with local popcorn genotypes and Kahramanoğlu (2019) found
the protein ratio between 11.40% and 9.30%. Taş (2020) reported that they found the protein ratios of the
second crop of maize to be between 7.67–14.5% in their study which is conducted in Şanlıurfa conditions. It
was observed that the findings obtained in previous studies supported the findings of this study. The protein
ratio of the corn varieties used for feed or oil is important, the popcorn grain is mostly used as a snack.
International Conference on
RAW MATERIALS TO PROCESSED FOODS 03-04 June 2021, Turkey
181
3.6. Starch (%)
When the popcorn genotypes were examined in terms of starch ratio, it was determined that the differences
between the genotypes were statistically significant (p<0.01). The starch ratio of the local popcorn genotypes
used in the study varied between 67.11 and 61.65%. It was recorded that genotypes 18, 15, 14 had the
highest starch ratio with 67.11, 67.10, 66.47 % values, respectively, and they were in the same group. The
lowest starch ratio was seen in genotype 9 with 61.65%. The other 16 genotypes were in the same group and
formed the transition group between these two groups. Starch ratios were determined as 63.21%, 64.09 and
65.10% for Nermin Cin, Ant Cin 98 and Composite 13. Some of the local popcorn populations have been
found to have higher starch values than registered local varieties. (Table 1). Sweley et al. (2012) reported
that the starch rate in the grain was between 61.5-65.3%, Aliu et al. (2012) showed that the starch content in
the grain varied between 67.39-72.15%, Yu et al., (2015) found that 72% starch content in waxy corn and
30% in super sweet corn, İdikut et al. (2021) reported that the starch ratio in grain for the first crop varied
between 76.76 - 80.17%. The starch value obtained in the study was below the values obtained by other
researchers due to its cultivation as a second product. Variety, precipitation, temperature, soil type and
growth conditions sometimes can be more effective than genetic conditions in affecting starch properties in
grains (Beckles and Thitisaksakul, 2014; Lu et al., 2015).
3.7. Popping Volume (cm3 g-1)
When the popcorn lines were examined according to the burst volume criterion, the difference between the
lines was found to be statistically significant at the level of 1%. In the study, the popping volumes of popcorn
varied between 28 and 7.33 cm3 g-1. In the research, Samsun bafra Kasu line had the highest explosion
volume with 28 cm3 g-1, while the Ordu Perşembe Kovanlı line had the lowest explosion volume with 7.33
cm3 g-1. Öztürk et al. (2016) reported that they found the popcorn volume to be between 8.31 cm3 g-1 at the
lowest and 29.30 cm3 g-11 at the highest.
CONCLUSION
As a result, as can be seen from the examined characteristics, it was noted that the local popcorn populations
had higher values for some characteristics than the local commercial varieties Nermin Cin, Ant Cin and
Composite 13. Obtaining variations in terms of examined traits is important in terms of genetic diversity.
Growing as a second crop in the center of Kahramanmaraş, where the Mediterranean climate is dominant,
will also contribute to the increase in the cultivation area. Due to the genetic diversity of local genotypes,
their high adaptation to the environment in which they are grown, and their being valuable breeding
materials, it is necessary to ensure their breeding and continuity. In addition, local varieties have an
indispensable genetic material diversity in breeding studies. It is thought that the study with local genotypes
is important and will be important in terms of leading the genotype development and breeding studies.
REFERENCES
[1] Kırtok, Y., 1998. Corn Production and Use. Kocaoluk Printing and Publisher, Istanbul,1998.
[2] Silva, W.J.D., Vidal, B.C., Martins, M.E.Q., Vargas, H., Pereira, A.C., Zerbetto, M., & Miranda, L.C. M.
(1993). What Makes Popcorn Pop. Nature, 362 (6419), 417.
[3] Özkaynak E, Samancı B 2003. Cin Egypt (Zea mays everta Sturt.) Lines and Polling Hybrids
In terms of Yield and Yield-Related Feature Comparison. Akdeniz University Agriculturel Faculty
Journal 16 (1): 35-42.
[4] Ülger, A. C., 1998. The Effect Of Different Nitrogen Doses and Row Spacing on Grain Yield and
Some Agricultural Properties in Popcorn (Zea mays everta Sturt.); Çukurova University Journal of the
Faculty of Agriculture, 13 (1): 155-164.
[5] İdikut, L., Yilmaz, A., Yürürdurmaz, C. And Çölkesen, M., 2012. Local Determination of Morphological
and Agricultural Characteristics of Gin Corn Genotypes Journal of Biological Sciences Research, 5(2):
p.63-69.
[6] Allard, R. W. And Bradshaw, A.D., 1964. Implications of genotype-environment interactions in applied

International Conference on
RAW MATERIALS TO PROCESSED FOODS 03-04 June 2021, Turkey
182
plant breeding. Crop Sci. 4, 503-508
[7] Sarikurt, B., Bengisu, G., (2020). Diyarbakir irrigated conditions II. Determination of yield and relations
between some agricultural characters and characters in some corn varieties grown as a crop European
Journal of Science and Technology, 18, 243-247.
[8] İdikut, L., Önem, M., ve Zülkadir, G., (2021) Determination of Quality Criteria of Local Gin Corn (Zea
mays everta) Populations Cultivated in Sumbas District Conditions. KSU J. Agric Nat 24(1): 122-129.
[9] Marques OJ, Filho PSV, Scapim CA, Bonato CM, Okumura RS, LucianoIvano da Silva L, Soares de
Souza R 2015. Sowing Time of Popcorn During the Summer Harvest Under Supplemental Irrigation in
Ferralic Nitisol and Subtropical Climate. Australian Journal of Crop Science, 9(5): 413-423.
[10] Ratkovic S, Dumanovic J 1991. Distribution of Oil Content in the Maize Ear. Savremena
Poljoprivreda, 39 (3) : 19-25.
[11] Banerjee M.; Singh, S. N. 2003. Effect of Nitrogen and Plant Population on Yield Components and
Yield of Popcorn Varieties of Maize. Annals of Agricultural Research, 24 (4): 968-970.
[12] Sweley JC, Rose DJ, Jackson DS 2012. Hybrid and Environment Effects on Popcorn Kernel
Physiochemical Properties and Their Relationship to Microwave Popping Performance. Journal of
Cereal Science, 55(2) : 188-194.
[13] Aliu S, Rusinovci I, Fetahu S, Simeonovska E 2012. Genetic Diversity and Correlation Estimates for
Grain Yield and Quality Traits in Kosovo Local Maize (Zea mays L.) Populations. Acta Agricultural
Slovenica, 99 (2): 121-128.
[14] Lu T, Cui L, Zhou Y, Zhu C, Fan D, Gong H, Zhao Q, Zhou C, Zhao Y, Lu D, et al (2015)
Transcriptome-wide investigation of circular RNAs in rice. RNA 21: 2076–2087.
[15] Beckles D., and Thitisaksakul M. (2014). How environmental stress affects starch composition and
functionality in cereal endosperm. Starch/Stärke 2014, 66, 58–71.
[16] Öztürk, A., Erdal, Ş., Pamukçu, M., Boyaci, H.F.,Sade, B.(2016). Determination of some quality traits
and relationships among trait in popcorn inbred lines. Derim, 2016, 33 (1):119-130.
International Conference on
RAW MATERIALS TO PROCESSED FOODS 03-04 June 2021, Turkey
183
Development of Special Designed Meatballs Technology
Tanase (Butnariu) Luiza-Andreea1, Andronoiu Doina-Georgeta1, Nistor Oana-Viorela1, Mocanu
Gabriel-Danut1, Barbu Vasilica-Viorica1, Botez Elisabeta1
1Dunarea de Jos University of Galati, Faculty of Food Science and Engineering, 111 Domneasca Street, 800201,
Galati, Romania
Presenter’s telephone: +40749389174, E-mail: [email protected]
ABSTRACT
Pregnant and breastfeeding women require special nutrition needs. To come to their aid, this study was
conducted in order to develop a novel food product. Four variants of pork and turkey meatballs, with lemon
balm (Melissa officinalis L.) and wild thyme (Thymus serpyllum l.) aqueous extracts were obtained. These
extracts were used due to their antioxidant, antibacterial and galactogenic potential, as well as for flavouring
purpose. The traditional frying of meatballs, which leads to unhealthy compounds, was replaced with baking
(180 °C for 36 minutes) or steam cooking (100°C for 15 minutes).
The obtained meatballs were further analysed for a complete characterisation. The functionality of the plants
extracts was proved by flavonoids and total polyphenols content, as well as by the antioxidant activity,
determined by DPPH assay. When trans-anethole and estragole standard were used for the FT-IR
determination, similar peaks were obtained. The acceptance of the consumers was investigated by sensorial
analysis, sustained by instrumental determination of colour and texture. The best antioxidant activity was
shown by the meatballs containing lemon balm extract. In these samples the highest amounts of flavonoids
were determined, both for pork and turkey meatballs. Contrary, polyphenols registered the greatest
concentration in the samples containing wild thyme extract. From the colour point of view, the baked pork
meatballs registered the best intensity of red and yellow colour, making them the most appreciated by the
consumers. In the same time, steam treatment determined a smoother texture, with an increased juiciness,
both for pork and turkey samples.
In conclusion, this study revealed that pork and turkey meat, with added lemon balm and wild thyme
aqueous extracts, could be successfully used to obtain meatballs for special destination. All samples
presented very good acceptability, but the complexity of this issue is given by the subjective considerations
of each consumer.
Keywords: antioxidant activity, consumers acceptability, galactogogue potential, meatballs

International Conference on
RAW MATERIALS TO PROCESSED FOODS 03-04 June 2021, Turkey
184
The Development of Melon Sorbets with Acacia or Lavender Syrup
Nistor Oana-Viorela1, Andronoiu Doina-Georgeta1, Tanase (Butnariu) Luiza-Andreea1, Mocanu
Gabriel-Danut1, Barbu Vasilica-Viorica1, Botez Elisabeta1
1Dunarea de Jos University of Galati, Faculty of Food Science and Engineering, 111 Domneasca Street, 800201,
Galati, Romania
Presenter’s telephone: +40723835310, e-mail address: [email protected]
ABSTRACT
Sorbet is known since ancient times being considered the ancestor of ice-cream, recognized for its specific
structure and texture. These issues could be obtained by using a fine-dispersed comminution of fruits and
freezing.
The aim of this paper is to develop a healthy melon sorbet with acacia or lavender syrup addition. For this
goal were used three melon varieties (Medena Rosa, Honeydew Green Flesh and Ducral) and two types of
syrup obtained from acacia and lavender flowers with brown sugar. The samples were prepared by mixing
the melon with the syrup, then the mix was put into an ice-cream machine for 10 minutes until the sorbet was
prepared. The samples were stored at -18°C in a freezer for 24 hours. After that, the samples were analyzed
by the phytochemicals, overrun, melting down, color, textural, confocal and sensorial analysis. It seems that
the lavender syrup has accelerated the melting time (90 min.) reported to the samples with acacia syrup (110
min.). The total carotenoids, lycopene, polyphenols and flavonoids were influenced by the melon variety, the
highest values being gained by Honeydew Green Flesh. Similarly, the color measurements (L*-55.57 and b*-
19.99) and the sensorial attributes analysis determined that this variety was the dominant one. A double
penetration test was applied in order to investigate the sorbet texture parameters (firmness, adhesiveness,
cohesiveness and springiness). The texture analysis shows that the addition of acacia or lavender syrup did
not significantly affect the texture parameters, while the raw material did. Medena Rosa melon variety
induced the firmest texture and the lowest cohesiveness. Therefore, the quality of the sorbet samples depends
on the melon variety more than on syrup addition.
Keywords: acacia, lavender, melon, sorbet, syrup
International Conference on
RAW MATERIALS TO PROCESSED FOODS 03-04 June 2021, Turkey
185
Effects of Different Drying Methods on the Physicochemical and Antioxidant
Content of ‘Cempedak’ (Artocarpus integer L.) Powder
Mhoneswari Gopinathan1, Yus Aniza Yusof2-3, Liew Phing Pui1*
1Department of Food Science with Nutrition, Faculty of Applied Sciences, UCSI University, Kuala Lumpur, Malaysia
2Department of Process and Food Engineering, Faculty of Engineering, Universiti Putra Malaysia, Selangor, Malaysia 3Laboratory of Halal Services, Halal Products Research Institute, Universiti Putra Malaysia, Selangor, Malaysia
*E-mail: [email protected]
ABSTRACT
“Cempedak” is an aromatic fruit, which can be converted into powder with a longer shelf life. The effects of
different drying methods (spray-drying, freeze-drying, convection oven-drying, and vacuum-drying) on
“cempedak” powders produced were evaluated in their physicochemical properties (moisture content, water
activity, wettability, flowability, water solubility index, hygroscopicity, and degree of caking). In addition,
the color and antioxidant content (carotenoid and DPPH scavenging activity) of “cempedak” powder were
determined as well. The process yield of convection oven-dried “cempedak” powders is higher (62.98%) as
compared to spray-dried powder (25.08%). On the contrary, the total color change for freeze-dried powder is
lesser (12.31) compared to other drying methods. The scavenging activity of freeze-dried powder had the
greatest antioxidant effect, which is 52.12% at 50 μg/ml, while the carotenoid content of freeze-dried powder
is 15.83 mg/g. Freeze-drying can produce higher quality “cempedak” powder as compared to spray-drying,
convection oven-drying, and vacuum-drying.
International Conference on
RAW MATERIALS TO PROCESSED FOODS 03-04 June 2021, Turkey
186
Prediction and Qualitative Analysis of Sensory Perceptions over Temporal
Vectors Using Combination of Artificial Neural Networks and Fuzzy Logic:
Validation on Indian Cheese (Paneer)
Kartikey Chaturvedi1, Sucheta Khubber2, Siddhartha Singha3, Himanshu Goel1, Francisco J. Barba4,
Kalyan Das1
1Department of Basic and Applied Sciences, National Institute of Food Technology Entrepreneurship and Management,
Sonipat, India 2Center of Innovative and Applied Bioprocessing, Mohali, India
ABSTRACT
The present study investigated the feedforward-backpropagation artificial neural network (ANN)
architectures to predict the sensory scores at different moisture levels (40%–50%) of paneer. Paneer was
produced aseptically and packed in low density polyethylene (LDPE) bags, in a semi-organized commercial
dairy plant. Samples were evaluated at regular intervals (8 days) for biochemical content and microbial
counts, while subjected every day for sensory evaluation. Three layered (input-hidden-output) ANN was able
to produce similar sensory responses using biochemical and microbiological data, for both single (best
combination 10-7-1; R2 ≈ 0.99) and conjugated (10-9-4; R2 ≈ 0.97) parameters for an extent of 25 sensory
output nodes (10-35-25; R2 ≈ 0.90). The comparison of ANN and predicted sensory scores using linear
regression model (with R2 = 0.99) suggests that paneer at 42%–44% and 47%–49% moisture was best for
consumption as fresh and for storage. The developed method for predicting and analyzing sensory data of
produced paneer opens new possibilities for improving food product's likeness.
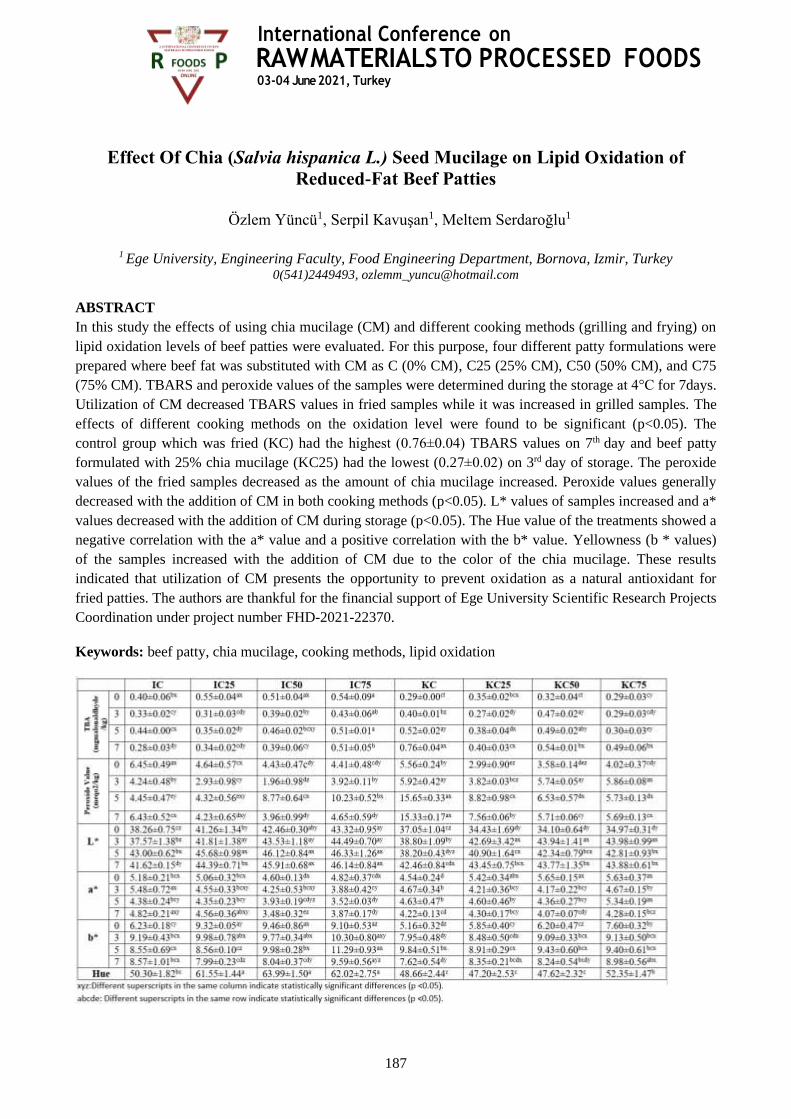
International Conference on
RAW MATERIALS TO PROCESSED FOODS 03-04 June 2021, Turkey
187
Effect Of Chia (Salvia hispanica L.) Seed Mucilage on Lipid Oxidation of
Reduced-Fat Beef Patties
Özlem Yüncü1, Serpil Kavuşan1, Meltem Serdaroğlu1
1 Ege University, Engineering Faculty, Food Engineering Department, Bornova, Izmir, Turkey 0(541)2449493, [email protected]
ABSTRACT
In this study the effects of using chia mucilage (CM) and different cooking methods (grilling and frying) on
lipid oxidation levels of beef patties were evaluated. For this purpose, four different patty formulations were
prepared where beef fat was substituted with CM as C (0% CM), C25 (25% CM), C50 (50% CM), and C75
(75% CM). TBARS and peroxide values of the samples were determined during the storage at 4°C for 7days.
Utilization of CM decreased TBARS values in fried samples while it was increased in grilled samples. The
effects of different cooking methods on the oxidation level were found to be significant (p<0.05). The
control group which was fried (KC) had the highest (0.76±0.04) TBARS values on 7th day and beef patty
formulated with 25% chia mucilage (KC25) had the lowest (0.27±0.02) on 3rd day of storage. The peroxide
values of the fried samples decreased as the amount of chia mucilage increased. Peroxide values generally
decreased with the addition of CM in both cooking methods (p<0.05). L* values of samples increased and a*
values decreased with the addition of CM during storage (p<0.05). The Hue value of the treatments showed a
negative correlation with the a* value and a positive correlation with the b* value. Yellowness (b * values)
of the samples increased with the addition of CM due to the color of the chia mucilage. These results
indicated that utilization of CM presents the opportunity to prevent oxidation as a natural antioxidant for
fried patties. The authors are thankful for the financial support of Ege University Scientific Research Projects
Coordination under project number FHD-2021-22370.
Keywords: beef patty, chia mucilage, cooking methods, lipid oxidation

International Conference on
RAW MATERIALS TO PROCESSED FOODS 03-04 June 2021, Turkey
188
Aroma Enhancement of Ocimum basilicum L. via Drought Stress Induced by
Polyethylene Glycol (PEG)
Başar SEVİNDİK1*, Onur SEVİNDİK2,3, Serkan SELLİ4
1 University of İzmir Demokrasi, Vocational School of Higher Education, 35140, İzmir, Turkey 2 Cukurova University Central Research Laboratory (CUMERLAB), 01330, Adana, Turkey
3 Adana Alparslan Turkes Science and Technology University, Faculty of Engineering, Department of Food Engineering, 01250,
Adana, Turkey 4 Cukurova University, Faculty of Agriculture, Department of Food Engineering, 01330, Adana, Turkey
*E-mail: [email protected]
ABSTRACT
Drought is a well-known stress factor that inhibits growth period and productivity and effects the release of
secondary metabolites from the plants resulting the aroma enhancement. The present study was aimed to
examine the effect of applied drought stress using different rates of PEG 6000 (polyethylene glycol) solution,
on morphology, stomatal openness, chemical structure and volatile profile of basil (Ocimum basilicum L.).
Expectedly the highest shoot and root lengths observed at Control (16.2 cm) and 15% PEG treatments (7.5
cm) respectively. Stomatal openness apparently closed with increasing rate of drought. Release of volatile
compounds from the basil leaves was increased with the increased rate of the applied drought stress and
aroma profile of dominant volatiles. Terpenes were found to be the most abundant chemical group and their
concentrations altered significantly with PEG treatments. Methyleugenol was detected as the major terpene
in control, 5% PEG, 10% PEG samples while linalool was the prominent compound in 15% PEG sample.
FTIR spectrum supported the GC results being differentiated significantly particularly in the fingerprint
region (below 1400 cm-1).
Keywords: Basil, Volatile, Aroma enhancement, Polyethylene glycol, FTIR, SEM

International Conference on
RAW MATERIALS TO PROCESSED FOODS 03-04 June 2021, Turkey
189
Effect of Ultrasound -Assisted Extraction Application on Total Phenolic
Substance, Catechin and Caffein Amounts of
Green Tea (Camellie sinensis) Extract
Emine Ateş1, Cemal Kaya2, Esra Esin Yücel2, Mustafa Bayram2
1 Tokat Gaziosmanpaşa University, Institute of Science, Department of Food Engineering, TOKAT
2 Tokat Gaziosmanpaşa University, Faculty of Engineering and Architecture, Department of Food Engineering, TOKAT
*E-mail: [email protected]
ABSTRACT
In this study, it was aimed to investigate the changes in the amount of water soluble dry matter (ºBriks), total
phenolic substance, caffeine and some important catechins of green tea extracts obtained by using ultrasound
technique. For this purpose; different tea: water ratios (5: 100; 10: 100) and brewing times (5, 10 and 20
minutes) at 70 ° C were applied and the obtained green tea extracts were treated with tannase enzyme. The
water-soluble dry matter content of green tea extracts was determined between 1.30-3.65.6 ºBrix. Due to the
increase in the brewing time and the tea: water ratio, there is usually an increase in the water soluble dry
matter values, the highest ºBriks value (3.65 ºBriks) was measured in the extract obtained in 20 minutes
brewing at 70 ° C with 10: 100 tea water ratio and applied tannase enzyme. The total phenolic content of the
extracts ranged from 2.68-3.87 g GAE / 100 g dry green tea. The highest total phenolic content (3.87 g GAE
/ 100 g dry green tea) was determined at 10: 100 tea: water ratio, 20 min at 70 ° C and applied tannase
extract. The caffeine, EGC, EGCG, EC, ECG amounts of the extracts according to tea: water ratio, brewing
time and tannase enzyme usage varied respectively; 609.44-1212.11 mg/L; 42.68-130.13 mg/L; 39.57-
145.44 mg/L; 2.42-9.86 mg/L; 5.52-117.66 mg/L. When compared with the control samples, EGCG and
ECG amounts of the extracts decreased and the amount of EGC and EC increased depending on the enzyme
application.
Keywords: Catechin, Green tea, phenolic substance, tannase
International Conference on
RAW MATERIALS TO PROCESSED FOODS 03-04 June 2021, Turkey
190
Effect of Modified Atmosphere Packaging on Quality Parameters of Fresh-cut
‘Deveci’ Pears
Gozde Oguz-Korkut*, Sumeyra Kucukmehmetoglu, Gurbuz Gunes
Department of Food Engineering, Faculty of Chemical and Metallurgical Engineering, Istanbul Technical University,
34469 İstanbul, Turkey
*E-mail: [email protected]
ABSTRACT
‘Deveci’ is a popular local cultivar of pears in Turkey. There is potential for developing fresh-cut pear
product from this cultivar but no information on respiration rate and modified atmosphere packaging of
fresh-cut ‘Deveci’pears exist in literature. Respiration rate of fresh-cut pears (Pyrus communis L. cv
‘Deveci’) were determined as a function of O2 and CO2 concentration at 4°C and the data were fit to
Michaelis-Menten type enzyme kinetic models. A modified atmosphere package was designed based on
optimum O2 and CO2 leves at which aerobic respiration rate was minimum. Fresh-cut pears were dipped in a
solution containing 1% citric acid + 1% calcium chloride for 5 minutes to prevent softening and enzymatic
browning. They were packaged under 2.15% O2+8.70% CO2 equilibrium atmosphere and stored at 4°C for 8
days. In the equilibrium gas concentration, O2 consumption rate (RO2) and CO2 production rate (RCO2) were
calculated as 0.98 ml O2 kg-1 h-1 and 1.98 ml CO2 kg-1 h-1, respectively. It was found that the most suitable
model for the respiration rates was the no-inhibition model. The Km values in the model was calculated as
30.23 and 26.25 for RO2 and RCO2, respectively. The high Km values indicated that the respiration rate of
fresh-cut 'Deveci' pear slices was low. Packaging and storage time did not have a significant effect on total
soluble solid, pH and titratable acidity of the fresh-cut pears throughout storage. The firmness of pear slices
was measured as 6.9 N in the control samples, while it was 13.6 N in MA packaged samples at the end of the
storage period. Modified atmosphere packaging resulted in a lower total color change, a*-value, chroma
value, and a higher hue angle and L*-value compared to air-controls during 8 days of cold storage. In
conclusion, the modified atmosphere packaging preserved the quality parameters very well during a short
term storage period.
Keywords: Fresh-Cut Pear, Modified Atmosphere Packaging, Respiration Rate, Quality
International Conference on
RAW MATERIALS TO PROCESSED FOODS 03-04 June 2021, Turkey
191
Migration of Lead and Cadmium from Ceramic Kitchenware and Estimation of
Sampling Uncertainty
Ruya Bulut1, Perihan Yolci Omeroglu1,2, Busra Acoglu1, Elif Koc Alibasoglu1*
1Bursa Uludag University, Faculty of Agriculture, Food Engineering Department, 16059, Gorukle Campus, Bursa,
Turkey. 2Bursa Uludag University, Science and Technology Application and Research Center, 16059, Gorukle Campus, Bursa,
Turkey
+90 507 787 25 91, E-mail: [email protected]
ABSTRACT
The aims of this study were (i) to evaluate the existing analysis capacity for lead and cadmium leached from
ceramic articles, (ii) to determine the migration of lead and cadmium from glazed ceramic kitchenware sold
on Turkish market, (iii) to estimate the sampling uncertainty. Traditional ceramic cooking ware in brown
color (from thirteen sales point) and Chinese breakfast hollowware (in blue, white and pink colors) (from one
sale point) were purchased randomly from different sales points located in Bursa in 2018. From each site, six
identical samples were taken (totally n=96). Ceramic articles were subjected to the migration conditions
specified in the European Union Directive 84/500/EEC, and the amount of lead and cadmium was determined
with the inductively coupled plasma and mass spectrometry. It was found that the current analytical method
can quantify lower levels of the metals with acceptable method performance parameters. The amount of lead
and cadmium that migrated from all ceramic articles were far below the current permissible limits set in the
legislation. Relative sampling uncertainty was estimated as 66.2% and this result was thought to be caused by
heterogeneity between the articles sampled from the same lot. This study can be regarded as a case
surveillance study by providing updated data that can be used by authorities to make risk assessments on
consumer health.
Keywords: Ceramic articles, cadmium, heavy metals, lead, migration, sampling uncertainty
References (Optional):
European Commission (1984). Commission regulation on the approximation of the laws of the Member States relating to ceramic
articles intended to come into contact with foodstuffs (84/500/EEC). https://eur-lex.europa.eu/eli/dir/1984/500/oj. Accesed 4 October
2020
European Commission (2004). Commission regulation 2004a on materials and articles intended to come into contact with food and
repealing directives 80/590/EEC and 89/109/EEC. https://eur-lex.europa.eu/eli/reg/2004/1935/oj Accesed 4 October 2020
International Conference on
RAW MATERIALS TO PROCESSED FOODS 03-04 June 2021, Turkey
192
Characterization of Volatile Composition of Mint and Oregano Obtained from
Different Drying Methods
Nurten Cengiz1,2, Gamze Guclu2, Shakhnoza Sultanova3, Onur Sevindik2, Abhijit Tarawade3,
Hasim Kelebek1, Serkan Selli2,4*, Jasur Safarov3*
1Department of Food Engineering, Faculty of Engineering and Natural Sciences, Adana Alparslan Turkes Science and
Technology University, 01110, Adana, Turkey 2Department of Food Engineering, Faculty of Agriculture, Cukurova University, 01330, Adana, Turkey
3Department of Food Engineering, Faculty of Mechanical Building, Tashkent State Technical University named after
Islam Karimov, 100095, University str. 2, Tashkent, Uzbekistan 4Department of Nutrition and Dietetics, Faculty of Health Sciences, Cukurova University, 01250, Adana, Turkey
*E-mail: [email protected]; [email protected]
ABSTRACT
Folia mentha piperitae and Herba origani tytthanthi are endemic mentha species from the Republic of
Uzbekistan. In the present study, volatile compounds of mint and origano samples dried by three methods
(water heating infrared convective drying (WHICD), convective drying (CD), infrared drying (IRD)) were
investigated using the HS-SPME-GC-MS technique. The volatile components of the samples consist of
terpenes, esters, ketones, alcohols, furans, aldehydes, and aromatic hydrocarbons. Terpenes were the
predominant aroma group in all the studied samples. Among the drying methods, WHICD provided better
results compared to other methods for preserving volatiles. Herba origani tytthanti had higher amounts of p-
cymene, thymol and carvacrol, while menthone, L-menthol, limonene, and eucalyptol were found abundantly
in Folia mentha piperitae samples.
Keywords: Folia mentha piperitae, Herba origani tytthanthi, combined drying, volatile compounds, HS-
SPME-GC-MS
INTRODUCTION
Aromatic plants have been widely used in food, perfumes, pharmaceutical, and natural cosmetic products
since ancient times (Baatour et al., 2010; Sonmezdag et al., 2017). The cultivation and export of aromatic
plants are constantly increasing because of the bioactive compounds they contain. The Lamiaceae plant
family is also referred to as the Labiatae family and is one of the most various and widespread plants in the
world in terms of ethnomedicine and its medicinal value based on the volatile oils content (Venkateshappa &
Sreenath, 2013).
Mint (Mentha ssp.) is one of the most significant members of the Lamiaceae family. This genus has been
used for its characteristic aroma throughout human history (Venkateshappa & Sreenath, 2013; Masi et al.,
2017). It is widespread mainly in Europe, Asia, South Africa, Australia, and the United States (Almeida et
al., 2012; Cirlini et al., 2016). Mentha is widely used in food, cosmetics, and medicines (Silva & Camara,
2013; Bokic et al., 2020). Among the Mentha species, pepermint (Mentha piperita L.), cornmint (Mentha
arvensis L.) and spearmint (Mentha spicata L.) are commonly used as spices (Díaz-Maroto et al., 2003; Masi
et al., 2017).
Herba origani tytthianthi is a medicinal plant native to the Republic of Uzbekistan (Ait-Kaddour et al., 2019;
Abderrahmane et al., 2019). Origanum is from the Lamiaceae or Labiatae family. Origanum, another
important genus of the Lamiaceae family, is used in flavoring foods and traditional medicine due to its

International Conference on
RAW MATERIALS TO PROCESSED FOODS 03-04 June 2021, Turkey
193
pharmacological properties (Ali et al., 2020). Origani tytthanthum is especially used in Central Asian folk
medicine in the treatment of gastritis, colitis, bronchitis, and pneumonia (Dzumayev et al., 1999) Origanum
species are commonly found in North Africa, the Eastern Mediterranean, and Siberia (Ali et al., 2020).
Because of its composition and properties, both fresh and dried origanum has been used for flavor in fish,
meat, vegetables, and wine since the 7th century BC (Altintas et al., 2013; Matlok et al., 2020).
Drying is one of the most common techniques used to increase food stability, to extend shelf life, and to
prevent biochemical reactions that could alter the organoleptic characterics. The volatile compounds lost
during drying is not only mainly dependent on the drying air temperature and time, but also on the biological
properties of the plants (Altaf et al., 2020; Rajkumar et al., 2020; Yildiz et al., 2021). Volatile compounds are
the most sensitive ingredients in the food drying process (Sellami et al., 2011).
Volatile compounds are important because they effect food quality and consumer preferences (Yildiz et al.,
2021). The volatile extract of aromatic herbs consists of monoterpene hydrocarbons, sesquiterpene
hydrocarbons, aliphatic hydrocarbons, aldehydes, ketones, acids, and esters (Mondello et al., 2005; Altaf et
al., 2020). The most important of volatile compounds for mentha is carvone, limonene, 1,8-cineole,
menthone, menthol and eucalyptol; according to previous study data, the main volatile compounds of origani
include thymol and carvacrol (Díaz-Maroto et al., 2003; Altintas et al., 2013; Cirlini et al., 2016; Sonmezdag
et al., 2016).
The extant literature contains many studies examining the effects of different drying techniques such as
oven, freezing, sun, shade, vacuum, and microwave drying on the characteristic properties of mentha and
origano such as color, aroma, antioxidant activity, and total phenolic compounds (Ozer et al., 2018). It is
important to determine the correct drying method without losing the medicinal and aromatic properties of the
plants. Therefore, this study was conducted to determine the volatile compounds of the fresh and dried mint
and oregano samples utilizing headspace solid-phase microextraction gas chromatography-mass
spectrometry (HS-SPME/GC-MS). Several drying procedures were applied to commercial and wild herbs
including convective drying, infrared drying, and the combined version of these two named water heating
infrared convective drying to evaluate the effects of drying on volatiles.
MATERIALS AND METHODS
Samples
Mint is cultivated in Uzbekistan and Asian mint grows in almost all regions of the country on the banks of
the irrigation ditches and other humid places from the foothills to the middle belt of the mountains. All aerial
organs of peppermint contain essential oil: leaves up to 2.75%, inflorescences up to 6%, and stems up to
0.3%. The main components of the oil are menthol 40-70%, menthone 10-25%, pulegon, mentofuran, and
esters of menthol and acetic and valeric acids (Mukhamedjanov et al., 2017). The oil is colorless with a
yellowish or greenish tint as well as a refreshing, pleasant taste and smell. For medicinal purposes, the aerial
part – the grass (leaves) – is collected during the budding or flowering of the plant and then dried.
Oregano grows on rocky slopes and pebbles in the lower and middle belt of the mountains in the Tashkent,
Fergana, Samarkand, and Surkhandarya regions of Uzbekistan. The nutritional value of oregano is as
follows: calorie content – 24.8 kcal, proteins – 1.5 g, carbohydrates – 5 g, dietary fiber – 0.5 g, organic acids
– 0.1 g, water – 90 g, mono- and disaccharides – 4 g, starch - 0.5 g, ash – 1 g. Oregano also contains the
following vitamins: A – 0.1 mg, PP – 0.5 mg, B1 (thiamine) – 0.03 mg, B2 (riboflavin) – 0.03 mg, C – 10
mg, and PP (neocene equivalent) – 0.749 mg. The content of macro- and microelements includes: Ca – 40
mg, Mg – 30 mg, Na – 70 mg, K – 260 mg, P – 50 mg, Fe – 0.5 mg, and I - 9 μg (Mukhamedjanov et al.,
2017). As a medicinal purpose, the aerial part is collected in the grass during the flowering of the plant and

International Conference on
RAW MATERIALS TO PROCESSED FOODS 03-04 June 2021, Turkey
194
then dried.
To conduct a study on drying mint and oregano, we collected the aerial part of the leaves during the month of
June germinated on the territory of the specialized forestry in the Namangan region of Uzbekistan. Multiple
experiments were carried out to investigate the optimal drying method and technology. For each repetition of
the experiment, 10 kg of mint and oregano were loaded.
Drying methods
This study used the water heating infrared convective drying, convective drying, and infrared drying
methods. The drying methods are explained in detail below.
Water Heating Infrared Convective Drying (WHICD)
Freshly cut Folia menthae piperitae and Herba origani tytthanthi were sorted from weeds and other
impurities were cleaned. They were cut with a size of 5 cm and folia menthae piperitae was pre-dried in the
shade in the open air for one to two hours to reduce initial humidity. It is kept away from direct sunlight to
preserve the biologically active material of the samples. Before drying, sliced samples pieces are evenly
placed in stainless steel mesh pallets, each with a useful area of 0.8 m2 and a depth of 5 cm. The drying
process of folia menthae piperitae and finely colored Herba origani tytthanthi were carried out by supplying
a coolant (bottom to top) at a temperature of 45-55 °C for 120-180 and 110-120 min., respectively.
A convective water heater intensifies the technological process of drying plant materials from medicinal
herbs, tubers, fruits, and flowers. It has several advantages like saving up to 80-90% of biologically active
substances and receiving good quality products with improved presentation and chemical composition.
Additionally, this drying technique contributes to energy and resource conservation by not using any
flue gases or solid fuel.
Convective Drying (CD)
Sampling and preprocessing was done in the same way as WHICH. Before drying, sliced samples pieces
were evenly placed in stainless steel mesh pallets, each with a useful area of 0.8 m2 and a depth of 5 cm.
Drying of Folia menthae piperitae was carried out by supplying hot air at 90 °C for 280-300 min., while
drying of finely colored Herba origani tytthanthi was done by supplying a coolant at 90 °C for 260-280 min.
The advantage of this method is its simplicity, the ability to vary the temperature of the dried material. The
temperature gradient is directed in the opposite direction to the moisture content gradient, which inhibits the
removal of moisture from the material. This feature can be attributed as the disadvantage of the method.
Infrared Drying (IRD)
Sampling and preprocessing was done in the same way as WHICH. Before drying, sliced samples pieces
were evenly placed in stainless steel mesh pallets, each with a useful area of 0.8 m2 and a depth of 5 cm. The
drying process of Folia menthae piperitae and finely colored Herba origani tytthanthi were carried out by
supplying infrared rays with a temperature of 75 °C for 220-250 and 180-190 min., respectively.
Advantages of the method are the ability to regulate and maintain the temperature inside the product. The
disadvantages include the contact of the product with oxygen contained in the air; overheating of the surface
due to the temperature gradient; possible formation of a hard crust on the surface; increase in cost due to the
use of electricity.
Volatile Compounds Analysis
HS-SPME-Procedure
International Conference on
RAW MATERIALS TO PROCESSED FOODS 03-04 June 2021, Turkey
195
The volatile fraction of mentha and origani samples were characterized following the protocol of Silva &
Camara (2013) with minor modifications. One-gram samples were placed into a 20 mL SPME glass vial. A
2 cm long 50/30 µm PDMS/DVB-CAR fiber was utilized for analysis. First, the glass vial was kept in the
headspace heater block for 10 min. at 40 °C before incubation. Then, it was extraction for 60 min. at 40 °C.
After extraction, the fibre was inserted into the injector port of the GC–MS system equipped with a
quadrupole mass analyser where the metabolites were thermally desorbed in the splitless mode at 250 °C for
six min. and transferred directly to the analytical capillary column. Each analysis was done in triplicate.
GC–MS analysis conditions
The identifications and amounts of the volatiles were carried out by using “Agilent 6890N” gas
chromatography (Wilmington, Delaware, USA) and the associated mass spectrometer “Agilent 5975B VL
MSD” (Wilmington, Deleware, USA). The separation of volatiles was performed using a DB-WAX capillary
column (60 m × 0.25 mm × 0.25 μm). Column temperature was programmed to be set as the following:
waiting for three min. to 60°C, then increasing by 2°C/ min. to 220°C, and subsequently increasing by 3°C/
min. to 245°C and remained constant at this temperature for 20 min.. Helium was utilized as a carrier gas
(pure:99.99 %, flow rate: 1.5 mL/ min.) with an injector and detector temperature of 250°C. Volatile
compounds were identified based on the retention index, reference aroma compounds, and mass spectra
using a commercial database of spectra (Wiley 6, Flavor 2L, NBS 75 k) (Sonmezdag et al., 2018). These
compounds were quantified utilizing the internal standard (2-octanol; 41.5 μg/kg and 2-methylbutylacetate
41.5 μg/kg). Response factors were calculated based on the intensity ratio of each compound to internal
standards and ratios of peak areas were corrected by using each volatile’s response factor (Sevindik et al.,
2020, Kelebek et al., 2015). The means and standard deviations were calculated for the GC analyses in
triplicate.
Statistical data analysis
Data were evaluated by analysis of variance (ANOVA) using SPSS 18.0 (SPSS Inc., Chicago, Illinois,
USA). Additionally, XLSTAT software (Addinsoft, New York City, NewYork, USA) was utilized for the
principal component analysis (PCA).
Result and Discussion
Volatile compounds of the samples
A total of 36 and 48 aroma compounds were determined in the Herba origani tytthianthi and Folia mentha
piperitae samples, respectively. The aroma components of the samples consisted of terpenes, esters, ketones,
alcohols, furans, aldehydes, and aromatic hydrocarbons. In all examples, terpenes make up most of the
aroma compounds.
L-menthol (40.8-51.19%), menthone (27.89-36.66%), eucalyptol (4.0-6.04%), limonene (1.15-4.15%),
piperitone (3.31-4.12%) and carvone (0.83-1.27%) are the predominant compounds in Folia mentha
piperitae. These molecules give the product characteristic odors such as mint, phenolic, and floral aromas.
The results of this study supported previously published data on the content of menthol and menthone in
Mentha species (Salehi et al., 2018; Bokic et al., 2020). Mokhtarian et al. (2020) found that menthone is the
main compound in Mentha piperita L. via new solar drying methods. In addition, Hassanpouraghdam and
Hassani (2014) in their study investigating the impact of drying methods on volatile compounds of Mentha
pulegium L. found that menthone has a higher amount in sun drying. In our study, the amount of mentone
was found to be higher in the WHICD method compared to other drying methods.
Mint has a different flavor due to the existence of menthol, an alcoholic terpene. This compound is known as
the primary aromatic compound and is used in medicine for gastrointestinal ailment (Cirlini et al., 2016). In

International Conference on
RAW MATERIALS TO PROCESSED FOODS 03-04 June 2021, Turkey
196
our example, L-menthol was 40.18% in the main product, while the highest value (51.19%) was achieved in
the IRD. Also, while the main compound in our sample is L-menthol, Mokhtarian et al. (2020) reported that
the principal compound in fresh Iranian peppermint sample is isomenthol. However, L-menthol has not been
detected in other mint studies (Silva & Camara, 2013; Cirlini et al., 2016; Ghani & Rowshan, 2017).
Limonene and eucalyptol are other important aroma compounds in Folia mentha piperitae. The amounts of
these compounds are higher with the WHICD method compared to other drying methods and are
approximately the same as fresh produce. In addition, as determined in previous studies, monoterpenes were
detected in small amounts in our samples as follows: Sabinene, β-myrcene, α-terpinene, γ-terpinene, p-
cymene, terpinolene, β-caryophyllene, α-terpineol, isoborneol, viridiflorol, citronellal, linalool, isopulegone,
(E)-calamenene, (+)-spathulenol, thymol and carvacrol (Díaz-Maroto et al., 2003; Shah & Mello, 2004; Park
et al., 2016).
Ghani & Rowshan, (2017) found the compound (Z)-jasmone between 2.8 and 0.8% in their study on the
endemic mint (Mentha mozaffarianii Jamzad) of Iran. In our study, while this compound was not detected in
the source product, it was found in the samples between 0.07 and 0.10 % in the WHICD, CD, and IRD
drying methods.
Another aroma group determined in mentha samples are alcohols. These compounds are (Z)-3-hexenol, 3-
octanol, benzyl alcohol, and phenethyl alcohol. Aldehydes ((E)-2-hexenal, benzaldehyde) were also
determined in Folia mentha piperitae even in low contents. While (E)-2-hexenal and (Z)-3-hexenol
compounds were not detected in the source product in our study, it was found in the WHICD, CD, and IRD
drying methods. (E)-2-Hexenal and (Z)-3-hexenol are the compounds responsible for the “fresh green” odor
by leaves. They are composed due to a defense mechanism against mechanical damage (Silva & Camara,
2013).
In the present study, the predominant compounds in Herba origani tytthanthi are as follows (Table 2):
Carvacrol (16.49-24,41%), thymol (13.15-24.07%), menthone (15.39-21.45%), p-cymene (5.43-25.30%), L-
menthol (6.27-13.51%), eucalyptol (3.04-3.98%), isomenthone (2.71-3.86%), β-caryophyllene (0.98-1.25%),
1-octen-3-ol (0.99-1.72), piperitone (0.62-1.30%), and α-terpinene (0.32-1.15%).
In previous studies, thymol, carvacrol, and p-cymene were found as the principal compounds of origani
samples (Figiel et al., 2010; Tepe et al., 2016; Ozer et al.; 2018). In our study, p-cymene is the dominant
compound in the source product and in the sample dried using the WHICD method. Thymol and carvacrol
compounds are the predominant compounds in samples dried by the CD and IRD method. Similarly, Yousif
et al. (2000) found that concentration of p-cymene in fresh oregano was significantly reduced in all three
drying methods.
The aroma of oregano is mainly determined by one of the thymol and carvacrol or both of its compounds
(Yousif et al., 2000; Di Cesare et al., 2004). Venskutonis (1997) reported that when thyme (Thymus vulgaris
L.) and sage (Salvia officinalis L.) dried at 60 °C rather than 30 °C, significant decreases were observed in
the concentrations of the aroma compounds of these herbs. In addition, Di Cesare et al. (2004) reported that
the highest contents of thymol and carvacrol were found in unblanched oregano that was dried at 35°C.
Furthermore, Calvo-Irabien et al. (2009) found that carvacrol has a higher rate when drying under the shade
in the Mexican oregano. However, the effect of a certain drying technique on the retention of the aroma
compound is unpredictable as it varies with the plant (Di Cesare et al., 2004).
As determined in previous studies, some compounds such as 1-octen-3-ol, (E)-2-hexenal, L-menthol, β-
International Conference on
RAW MATERIALS TO PROCESSED FOODS 03-04 June 2021, Turkey
197
caryophyllene, α-terpineol, piperitone, α-terpinene, linalool, limonene, camphene, α-phellandrene, β-
myrcene, carvone, and bisabolene are present in small amounts in our samples (Dzumayev et al., 1999;
Yousif et al., 2000; Di Cesare et al., 2004, Figiel et al., 2010).
CONCLUSIONS
In the present study, the impact of three different drying methods on volatile compounds of dried mentha and
origani samples originating from Uzbekistan were studied for the first time in this investigation. Very limited
work has been available in this context, particularly on the volatile compounds of Uzbekistan’s medicinal
and aromatic plants. Drying is an effective method for the preservation of these plants. A total of 36 and 48
volatiles were determined in the Herba origani tytthianthi and Folia mentha piperitae samples, respectively.
The WHICD (water heating infrared convective drying) process provided the shortest drying time with the
lowest drying temperature and similar volatile compounds with the source product compared to other
methods. In the Folia mentha piperitae, the amount of menthone, eucalyptol, and limonene were determined
to be approximately the same with the main product by drying with the WHICD method. At the same time, it
was determined that the amounts of p-cymene, thymol, carvacrol, α-terpinene and terpinolene obtained by
this drying method in Herba origami tytthanthi were the same as the source product. According to the
findings, the WHICD method resulted in better preservation of volatile compounds followed by the IRD and
CD methods. The shorter drying time and lowest drying temperature of the WHICD method makes it a better
choice compared to the other two studied drying methods.
REFERENCES
Abderrahmane, A. K., Safarov, Z. E., & Sultanova, S. A. (2019). Authentication of medical herbals by
multispectral analysis. Chemical Technology, Control and Management, 2019(1), 25-29.
Ali, H., Al-Khalifa, A. R., Aouf, A., Boukhebti, H., & Farouk, A. (2020). Effect of nanoencapsulation on
volatile constituents, and antioxidant and anticancer activities of Algerian Origanum glandulosum
Desf. essential oil. Scientific Reports, 10(1), 1-9.
Almeida, P. P., Mezzomo, N., & Ferreira, S. R. (2012). Extraction of Mentha spicata L. volatile compounds:
evaluation of process parameters and extract composition. Food and Bioprocess Technology, 5(2),
548-559.
Altaf, A., Zhu, X., Zhu, M., Aleem, M., Saeed, A., Gull, S., ... & Zada, A. (2020). Study of volatiles from
fresh and dried eucalyptus (Eucalyptus citriodora) and spearmint (Mentha spicata) leaves using gas
chromatography (GC-FID). Pakistan Journal of Agricultural Sciences, 57(5), 1469-1479.
Altintas, A., Tabanca, N., Tyihák, E., Ott, P. G., Móricz, Á. M., Mincsovics, E., & Wedge, D. E. (2013).
Characterization of volatile constituents from Origanum onites and their antifungal and antibacterial
activity. Journal of AOAC International, 96(6), 1200-1208.
Baatour, O., Kaddour, R., Wannes, W. A., Lachaal, M., & Marzouk, B. (2010). Salt effects on the growth,
mineral nutrition, essential oil yield and composition of marjoram (Origanum majorana). Acta
Physiologiae Plantarum, 32(1), 45.
Bokić, B. S., Rat, M. M., Kladar, N. V., Anačkov, G. T., & Božin, B. N. (2020). Chemical diversity of
volatile compounds of mints from southern part of Pannonian plain and Balkan Peninsula–new
data. Chemistry & Biodiversity, 17(8), e2000211.
Calvo-Irabien, L. M., Yam-Puc, J. A., Dzib, G., Escalante-Erosa, F., & Peña-Rodriguez, L. M. (2009). Effect
of postharvest drying on the composition of Mexican oregano (Lippia graveolens) essential
oil. Journal of Herbs, Spices & Medicinal Plants, 15(3), 281-287.
Cirlini, M., Mena, P., Tassotti, M., Herrlinger, K. A., Nieman, K. M., Dall’Asta, C., & Del Rio, D. (2016).
Phenolic and volatile composition of a dry spearmint (Mentha spicata L.) extract. Molecules, 21(8),
1007.
Di Cesare, L. F., Forni, E., Viscardi, D., & Nani, R.C. (2004). Influence of drying techniques on the volatile

International Conference on
RAW MATERIALS TO PROCESSED FOODS 03-04 June 2021, Turkey
198
phenolic compounds, chlorophyll and colour of oregano (Origanum vulgare L. ssp. prismaticum
gaudin). Italian Journal of Food Science, 16(2), 165-175.
Díaz-Maroto, M. C., Pérez-Coello, M. S., Gonzalez Vinas, M. A., & Cabezudo, M. D. (2003). Influence of
drying on the flavor quality of spearmint (Mentha spicata L.). Journal of Agricultural and Food
Chemistry, 51(5), 1265-1269.
Dzumayev, K. K., Tkachenko, K. G., Zenkevich, I. G., & Tsibulskaya, I. A. (1999). Essential oils of
Origanum tytthanthum Gontsch. produced from plants grown in Southern Uzbekistan. Journal of
Essential Oil Research, 11(5), 593-598.
Figiel, A., Szumny, A., Gutiérrez-Ortíz, A., & Carbonell-Barrachina, A.A. (2010). Composition of oregano
essential oil (Origanum vulgare) as affected by drying method. Journal of Food Engineering, 98(2),
240-247.
Ghani, A., & Rowshan, V. (2017). Comparative study of volatile constituents from two iranian endemic mint
(Mentha mozaffarianii Jamzad) ecotypes. Journal of Essential Oil Bearing Plants, 20(5), 1293-1301.
Hassanpouraghdam, M. B., & Hassani, A. (2014). Oven and conventional drying methods affect volatile oil
content and composition of Mentha pulegium L. Journal of Essential Oil Bearing Plants, 17(2), 346-
352.
Kelebek, H., Selli, S., Gubbuk, H., & Gunes, E. (2015). Comparative evaluation of volatiles, phenolics,
sugars, organic acids and antioxidant properties of Sel-42 and Tainung papaya varieties. Food
Chemistry, 173, 912-919.
Matłok, N., Stępień, A. E., Gorzelany, J., Wojnarowska-Nowak, R., & Balawejder, M. (2020). Effects of
organic and mineral fertilization on yield and selected quality parameters for dried herbs of two
varieties of oregano (Origanum vulgare L.). Applied Sciences, 10(16), 5503.
Masi, E., Caparrotta, S., Taiti, C., Ieri, F., Fiume, P., Moselhy, N., Mancuso, S., & Romani, A. (2017).
Characterization of volatile compounds in Mentha spicata L. dried leaves. Advances in Horticultural
Science, 31(2), 89-96.
Mokhtarian, M., Kalbasi-Ashtari, A., & Xiao, H. W. (2020). Effects of solar drying operation equipped with
a finned and double-pass heat collector on energy utilization, essential oil extraction and bio-active
compounds of peppermint (Mentha Piperita L.). Drying Technology, 21:1-27.
Mondello, L., Casilli, A., Tranchida, P.Q., Dugo, P., & Dugo, G. (2005). Comprehensive two‐dimensional
GC for the analysis of citrus essential oils. Flavour and Fragrance Journal, 20(2), 136-140.
Ozer, Z., Kiliç, T., Selvi, S., & Pasa, C. (2018). Effect of different drying methods and development stages
on the essential oil chemical composition of aerial parts of Origanum vulgare L. subsp. hirtum (link)
Letsw. Journal of Essential Oil Bearing Plants, 21(5), 1403-1409.
Park, Y. J., Baskar, T. B., Yeo, S. K., Arasu, M. V., Al-Dhabi, N. A., Lim, S. S., & Park, S. U. (2016).
Composition of volatile compounds and in vitro antimicrobial activity of nine Mentha
spp. SpringerPlus, 5(1), 1-10.
Rajkumar, G., Rajan, M., Araujo, H. C., Jesus, M. S., Leite Neta, M. T. S., Sandes, R. D. D., & Narain, N.
(2020). Comparative evaluation of volatile profile of tomato subjected to hot air, freeze, and spray
drying. Drying Technology, 39(3), 383-391.
Salehi, B., Stojanović-Radić, Z., Matejić, J., Sharopov, F., Antolak, H., Kręgiel, D., Sen, S., Sharifi-Rad, M.,
Acharya, K., Sharifi-Rad, R., & Martorell, M. (2018). Plants of genus Mentha: From farm to food
factory. Plants, 7(3), 70.
Safarov, J. E., Sultanova, S. A., Dadayev, G. T. & Samandarov D.I. (2019). Method for drying fruits of rose
hips. International Journal of Innovative Technology and Exploring Engineering, 9(1), 3765-3768.
Sellami, I. H., Wannes, W. A., Bettaieb, I., Berrima, S., Chahed, T., Marzouk, B., & Limam, F. (2011).
Qualitative and quantitative changes in the essential oil of Laurus nobilis L. leaves as affected by
different drying methods. Food Chemistry, 126(2), 691-697.
Sevindik, O., Guclu, G., Bombai, G., Rombolá, A.D., Kelebek, H., & Selli, S. (2020). Volatile compounds of
International Conference on
RAW MATERIALS TO PROCESSED FOODS 03-04 June 2021, Turkey
199
cvs Magliocco Canino and Dimrit grape seed oils. Journal of Raw Materials to Processed Foods, 1,
47–54.
Shah, P. P., & Mello, P. M. D. (2004). A review of medicinal uses and pharmacological effects of Mentha
piperita. Natural Product Radiance, 3(4), 214-221.
Silva, C. L., & Câmara, J. S. (2013). Profiling of volatiles in the leaves of Lamiaceae species based on
headspace solid phase microextraction and mass spectrometry. Food Research International, 51(1),
378-387.
Sonmezdag, A. S., Kelebek, H., & Selli, S. (2017.) Identification of aroma compounds of Lamiaceae species
in Turkey using the purge and trap technique. Foods, 6(2), 10.
Sonmezdag, A. S., Kelebek, H., & Selli, S. (2016). Characterization of aroma-active and phenolic profiles of
wild thyme (Thymus serpyllum) by GC-MS-Olfactometry and LC-ESI-MS/MS. Journal of Food
Science and Technology, 53(4), 1957-1965.
Sonmezdag, A. S., Kelebek, H., & Selli, S. (2018). Pistachio oil (Pistacia vera L. cv. Uzun): characterization
of key odorants in a representative aromatic extract by GC-MS-olfactometry and phenolic profile by
LC-ESI-MS/MS. Food Chemistry, 240, 24-31.
Tepe, B., Cakir, A., & Sihoglu Tepe, A. (2016). Medicinal uses, phytochemistry, and pharmacology of
Origanum onites (L.): A review. Chemistry & Biodiversity, 13(5), 504-520.
Venkateshappa, S. M., & Sreenath, K. P. (2013). Potential medicinal plants of Lamiaceae. American
International Journal of Research in Formal, Applied and Natural Sciences, 1(3), 82-87.
Venskutonis, P. R. (1997). Effect of drying on the volatile constituents of thyme (Thymus vulgaris L.) and
sage (Salvia officinalis L.). Food Chemistry, 59(2), 219-227.
Yildiz, G., Cox, G., & Moran, L. (2021). Identification of aroma compounds of dried and fresh thyme
(Thymus Vulgaris L.) by Gas Chromatography-Olfactometry and Gas Chromatography-Mass
Spectroscopy analysis. Latin American Applied Research-An International Journal, 51(1), 51-55.
Yousif A. N., Durance T. D., Scaman C. H., & Girard B. (2000). Headspace volatiles and physical
characteristics of vacuum-microwave, air, and freeze-dried oregano (Lippia berlandieri Scahuer).
Journal of Agricultural and Food Chemistry, 65, 926.

International Conference on
RAW MATERIALS TO PROCESSED FOODS 03-04 June 2021, Turkey
200
Elucidation of Retro-and Orthonasal Aroma Differences of
Biscuits (panis biscoctus) Using Artificial Masticator
Ahmet Salih Sonmezdag1*, Clement Cataneo2, Cécile Rannou2, Serkan Selli3,
Carole Prost2
1Department of Nutrition and Dietetics, Faculty of Health Sciences, Mugla Sitki Kocman University, Mugla, Turkey
2Lunam University, Oniris, UMR CNRS 6144 “GEPEA –Flavour Group”, Nantes F-44322, France 3Department of Food Engineering, Faculty of Agriculture, Cukurova University, Turkey
* E‒mail: [email protected]
ABSTRACT
The present study aimed to define the interest in using a mastication simulator to understand the release of
aroma compounds of biscuits in the mouth. The development of aroma compounds during artificial, human
mastication and without masticated samples of veritable biscuits was determined. Then, the evaluations of
aroma compounds in different types of biscuits were studied. A total of 32 compounds were identified in the
veritable sample while 36 were identified in both sugar-free and organic samples. The aldehydes and
pyrazines, were the main chemical groups in the samples. The number of aroma compounds in the
biscuit samples revealed essential changes during mastication and increased about 2,5 times. Additionally,
the presence of artificial and human saliva showed a similar effect. They increased the number of volatiles
while influencing some volatile groups either by increasing the quantity of ketones or decreasing acids,
alcohols, and aldehydes.
Keywords: Biscuits, Orthonasal/retronasal aroma, Artificial mouth, HS-SPME, GC-MS
INTRODUCTION
Biscuits has been a traditional and an important food across the world contributing to
food consumption. The word ‘biscuit’ derives from panis biscoctus that has the Latin meaning ‘twice
cooked’ and refers to hard dry bread produced to be stored and consumed at sea. The roots of the biscuit can
be traced back as long ago as the Romans. Early biscuits were made from just flour, water, and salt and were
not tasty as a food source (Manley, 2000). However today, modern biscuits have developed both in terms of
the types, tastes, and the times of day we consume them. Looking at the markets, the product
emerges as a staple food, snacks, luxury gifts, dietary products, infant food, as well as dog and cat food.
Also, health professionals recommend that they be eaten in small quantities as part of various diets such
as infant nutrition, high energy diets, food avoidance for religious beliefs, and vegetarianism or
veganism (Smith, 2007; Purlis, 2010).
Like many bakery products, biscuits are high in fats and carbohydrates. These
properties contribute to improvement of its technological and organoleptic character. In the luxury or snack
food industry, customers must really like the flavors and textures otherwise they will turn to other food
products (Smith, 2007). The aroma of biscuits originates from different resources and reactions. One of them
is the ingredients of the product. The others come from lipid oxidation, fermentation and cooking (Manley,
2000; Pasqualone et al., 2015). It is worth noting that the main aromas are related to the Maillard reaction
between amino acids and reducing sugars (Poinot, Arvisenet, Grua-Priol, Fillonneau, & Prost,
2009; Pasqualone et al., 2015).
A complex mixture of chemical groups is mainly responsible in bakery products such
as those found in biscuits, breads, crackers, and cakes that consist of pyrazines, pyrroles, ketones, lactones,

International Conference on
RAW MATERIALS TO PROCESSED FOODS 03-04 June 2021, Turkey
201
furans, aldehydes, alcohols, esters, and acids (Purlis, 2010; Pasqualone et al., 2015; Poinot, Arvisenet, Grua-
Priol, Fillonneau, & Prost, 2009; Dury‐Brun, Fournier, Pernin, & Guichard, 2007; Rega, Guerard, Delarue,
Maire, & Giampaoli, 2009) . However, the release of aroma compounds through the consumption of food
depends on volatile composition, structure, and in-mouth phenomena. The first perception of food intake
occurs through inhalation when sniffing as odorants enter the nasal cavity through the external nares
(orthonasal aroma) (Van Ruth, & Roozen, 2000; Genovese, Piombino, Gambuti, & Moio, 2009). Food
aromas are perceived during consumption when the odorants interact with receptors by traveling from the
mouth to the nasal cavity via the nasopharynx and the lungs
(retronasal aroma) (Ruijschop, Boelrijk, Burgering, de Graaf, & Westerterp-Plantenga, 2009; Welge-
Lüssen, Husner, & Wolfensberger, 2009). The sensation of the retronasal aroma is different from
the orthonasal aroma, even though they involve the same mechanisms.
These orthonasal/retronasal differences are specific to each odorant or subject and the differences are due to
the act of mastication (Linforth, Martin, Carey, Davidson, & Taylor, 2002).
The mechanisms of mastication are complex and link both the orofacial muscles and the tongue.
The processes are an important part of the intake of food solids and can be considered as a pre-digestion step.
During mastication, food can be subjected to substantial changes and generally the surface area of
the food increases, interacts with saliva, and is exposed to air in the mouth, thus enhances the release of the
flavors (Burdach, & Doty, 1987; Haring, 1990; Van Ruth, Roozen, Cozijnsen, 1994).
Some instrumental methods have been developed to study volatile compounds released from food
during consumption and are called either ‘‘artificial mouths” or ‘‘mastication simulators”. This equipment is
considered a useful way to determine individual key odorants present in samples(Arvisenet et
al., 2008; Roberts, & Acree, 1995, Van Ruth, & Buhr, 2004). Different model mouth systems have
been invented and used by several authors to study liquid (Van Ruth, Buhr,
2004) or viscous (Odake, Roozen, Burger, 2000) model products and also ‘semi-solid’ natural food
stuffs such as vegetables (Van Ruth, & Roozen 2000; Farneti et al., 2013; Van
Ruth, Roozen, & Cozijnsen, 1995;) and bakery products (Poinot, Arvisenet, Grua-
Priol, Fillonneau, & Prost, 2009; Onishi, Inoue, Araki, Iwabuchi, & Sagara, 2012). Finally, to the best of our
knowledge, no data is present in the extant literature about the effect of saliva on the release of aromas on
dry and starch-rich food such as biscuits using mastication simulators.
Therefore the main objectives of the present article were: i) to determine the conditions of the human mouth
while mastication of biscuit and duplicate it with an artificial mouth device, ii) to define
the flavor development during mastication in the artificial and human mouth to verify if the artificial mouth
reflects human mouth conditions iii) to characterize and compare the volatile compounds in the different
types of biscuits Furthermore, the HS-SPME method to obtain an aroma extract was optimized.
MATERIALS AND METHODS
Biscuit samples. Three types of commercial biscuits (veritable/VR, sugar-free/SF, and
organic/OR) produced by different companies were purchased in Nantes/France. The biscuits were the most
preferred type of ‘petit beurre’ by customers according to Rannou et al. (2017). Ingredients in the VR
were wheat flour 73.4%, sugar, butter 13.6%, skimmed milk powder 1.3%, salt, baking powder, oleic
sunflower oil, and acid corrector; in the SF were wheat flour 69%, sweetener, butter, sunflower oil, wheat
starch, baking powders, egg yolks, salt, and semi-skimmed milk; and in the OR: whole wheat flour 78%,
refined cane sugar, oleic sunflower oil 8.5%, raising powder, and rosemary extract. From each type, several
samples were purchased, and they were randomly selected for the experiments performed. The samples were
coded with three-digit codes.
Chemicals. Artificial saliva was prepared according to van Ruth et al. (2010) by dissolving in 500
mL of water (purified by a Milli-Q system, Millipore Corp., Molsheim, France), 2,604 g of NaHCO3 (Merck,
Darmstadt, Germany), 0,4385 g of NaCl (Fluka, Steinheim, Germany), 0,2385 g of KCl (Merck, Darmstadt,

International Conference on
RAW MATERIALS TO PROCESSED FOODS 03-04 June 2021, Turkey
202
Germany), 0,2205 g of CaCl2, 2H2O (Merck, Darmstadt, Germany), 0,6845 g of K2HPO4, 3H2O (Panreac,
Barcelona, Spain), 1,08 g of mucin (Sigma, Saint Louis, USA), and 6,25 g of porcin 50000 units α-amylase
(Sigma, Saint Louis, USA) (pH adjusted to 7) (Van Ruth, Roozen, & Cozijnsen, 1995). NaN3 (Sigma, Saint
Louis, USA) was also added at 0.5%. This preservative allowed the use of a single solution of artificial saliva
for each part of the study. The standards of aroma compounds were purchased from Sigma-Aldrich
(Steinheim, Germany, St Louis, MO, USA). All chemicals and solvents used in this study were of analytical
and chromatography grade purity.
In vivo analysis. Quantity of biscuit. The procedure of the in vivo analyses were performed
according to Arvisenet et al. (2008). Each measurement was carried out in triplicate for each subject, and a
ratio was calculated between the average amount of water (i.e. the volume of the mouth) and the average
weight of the biscuit pieces. This ratio was then used to determine the biscuit quantity to introduce into the
artificial mouth container for each experiment.
Biscuit/saliva ratio. Saliva quantity was determined as follows: saliva weight= total weight - biscuit weight -
rinsing water weight.
Collection of bolus. Six people (two males and four females aged between 22 and 50) were asked to eat
a piece of biscuit, chew it ordinarily, and then spit out the bolus at the point when swallowing would
normally have been triggered. The experiment was carried out 15 minutes before analysis was undertaken.
In vitro analysis. The artificial mouth comprised a sample container (600 mL), a notched plunger
and variable-speed motors which controlled precisely the speed of compression and the rotation movements.
The notched plunger comprised 20 lines of sharp teeth, 3 mm in height. The container was maintained at
37oC. While food was broken down, N2 flowed through the device at a sequential rate to reproduce the
phenomenon of breathing. The gas flowed in at 0.2 L s-1 and stopped for a few seconds at regular intervals.
To respect the weight of biscuit / mouth volume measured in the humans, 20 g of biscuits were placed into
the container. In the human mouth, the average ratio of biscuits to artificial saliva had previously been found
to be 2/1. Therefore, 15 mL of artificial saliva was applied to the biscuits pieces in the container through the
artificial masticator. At the end of the mastication, 5 ml of the artificial saliva was taken back to replicate
the swallowing phenomenon.
Image analysis. Analyses were performed to check the similarity of the bolus after both experiments
in the human and the artificial mouth. The image of the resulting biscuits from the imaging system was
obtained with a CCD camera (Canon G10 with 6,1-30,5mm, 1:2 8-4,5 optic lens) equipped
with Rundock (Cleaver Scientific). The experiment was carried out according to Arvisenet et al. (2008).
Extraction of aroma compounds. Headspace solid phase micro-extraction (HS-SPME) was used to
extract volatile compounds from the biscuit samples. A 660 mg sample was weighed in a 20 mL vial.
Volatile compounds were then extracted on a CAR/PDMS SPME fiber (10 mm long, 75 μm film
thickness; Supelco, Bellefonte, PA, USA) and placed in the headspace of the vial for 30 min at 37 oC. Five
aroma compounds were used to assess the optimization ofhe HS-SPME method and to check
the ability of repeating the method. They were chosen because they belong to different chemical groups.
They are presented in Table 1. For optimization, all extractions were carried out in duplicate using the VR
sample masticated in the simulator with saliva.
To evaluate the development of the aroma through mastication, five different implementations were
carried out prior to the extraction of the aroma using the VR sample. At first, the aroma was extracted from
the whole sample uncrushed (UN), secondly, the crushed sample was extracting using a mortar
(CRH), thirdly, the sample was artificially masticated in the presence of water (W), fourthly, the sample was
artificially masticated in the presence of artificial saliva (SAL), and finally, the human masticated sample
was used for extraction (HM).
GC-FID, GC-MS analyses of aroma compounds. HS-SPME extracts of the biscuits were analyzed
by gas chromatography (GC; Agilent Technologies 7890N, Wilmington, DE, USA) coupled with a mass
International Conference on
RAW MATERIALS TO PROCESSED FOODS 03-04 June 2021, Turkey
203
spectrometer (MS; Agilent Technologies, 5973 Network, Wilmington, DE, USA) and a flame ionization
detector (FID). Volatile compounds were desorbed into the injection port of the chromatograph
(splitless mode for 6 min at a temperature of 230 °C) and separated on a DB-Wax column (length 30 m,
internal diameter 0.25 mm, film thickness 0.5 μm). Helium was used as the carrier gas at constant pressure
(124 kPa). The oven temperature was programmed for 35 (5 min) at 50 °C at 5°C·min −1, then for 50 at 210
°C (5 min) at 5°C·min -1. Effluent from the end of the GC column was split 1:2 between the MS and the FID,
Peak areas were integrated using MSD Chemstation software (Agilent Technologies). Mass spectra were
recorded in electron impact mode (70 eV) between a mass range of 33 to 300 m/z at a scan rate of 2.7
scan·s−1.
Statistical analyses. The data of the present study was subjected to analysis of variance and
principal component analysis using the XLStat for Windows (Addinsoft, New York, New York, USA).
RESULTS AND DISCUSSION
In vivo and image analysis. The mean ratio measured between mouth volume and biscuit weight
was 0.033 mg mL-1 while between saliva and masticated biscuit mass it was 0.5 according to the in vivo
analysis. The analysis is essential to obtain the representative masticated matrix with similar characteristics
to those of human mastication (Burdach, & Doty 1987). As for image analysis, the
samples used were those obtained after in vitro and artificial mouth mastication. Triplicate images (512x512
pixels and 5x5 cm) were acquired for each sample. Then the images were converted to gray scale. One of the
most appropriate methods, grey level occurrence matrix was used to evaluate the textural descriptors; the
energy, entropy, and contrast (Arvisenet et al., 2008). According to the results obtained, no statistical
differences were found among the samples for the descriptors (p<0.05).
Optimization of HS-SPME condition. HS-SPME conditions were determined based on literature
with some modification (Pasqualone et al., 2014). The Y-axis was given as relative peak area based on
sample amount. The extraction temperature was set to 37oC during the entire experiment to avoid
degradation in substances by saliva and to mimic the temperature of the mouth. An increase in the peak areas
with extraction time was detected. An extraction timeof 30 minutes was set to avoid any sample changes
during the testing time under the presence of saliva (Lecanu, Ducruet, Jouquand, Gratadoux, & Feigenbaum,
2002). After the extraction time was fixed, the amount of the extracted sample was evaluated. As could be
observed the peak areas steadily decreased with the increasing sample amount. The best relative area/sample
ratio was obtained with the extraction carried out with the 1g sample. On the basis of the results, the optimal
condition was set to 1g of sample with 30 minutes of extraction time at 37oC. The
extraction conditions showed that the method allowed volatile extraction with acceptable repeatability.
Volatile compounds of biscuits.
Retro-and orthonasal aroma composition of VR sample. The aroma analysis of the biscuit samples
by HS-SPME using GC-MS and profound research of the chromatograms resulted in standard and tentative
identification of numerous aroma substances. To define the development of the aroma through artificial and
human mastication, a VR sample was subjected to five different implementations (UN, CRH, W, SAL, and
HM) prior to extraction. The evaluation made without mastication (UN, CRH) would be closer to
the orthonasal aroma and masticated samples (W, SAL, and HM) would be represented as
the retronasal aroma. With the artificial masticator, it is possible to evaluate
the retronasal aroma in an orthonasal manner (Arvisenet, Billy, Royer, & Prost, 2006). A total of 41
compounds were identified in the VR sample. The release of the aroma compounds differed quantitatively
and qualitatively with implementations. Previous studies have also exposed the effect of crushing and
mastication on aroma release (Van Ruth, & Buhr, 2004). After thefficiency of the artificial mastication was
determined, the biscuits samples obtained using the artificial masticator with saliva were analyzed. A total of
32 compounds were determined in the VR while 36 compounds were found in both SF and OR samples. The
International Conference on
RAW MATERIALS TO PROCESSED FOODS 03-04 June 2021, Turkey
204
volatiles were categorized according to their chemical structure: acids, alcohols, aldehydes, benzene, ester,
furans, hydrocarbons, ketones, lactones, phenol, pyrazines, pyrrole, and terpenes. The Maillard reaction
contributed several volatile compounds: Strecker aldehydes, furan compounds, and pyrazines. All the
chemical classes showed statistical differences (p<0.05).
With regard to the effect of the implementation, to assess the possibility of differentiating the
mastication and crushing process taking into account the aromatic profile, we applied a multivariate
statistical analysis using the individual percentage of aroma compounds in each of the chemical groups. The
variables were designated for the PCAs and the clarified variance was 83,85% (factor 1, 64,27%, factor 2,
19,58%). The application of the PCA algorithms provided two distinct groups in the sample. The first group
represented the result of the UN and CRH sample and the second group was characterized by W, HM, and
SAL. The first group positively associated with PC1 (hydrocarbons, acids, lactones, and alcohols), whereas
the second was associated with PC2 (aldehydes, furans, pyrroles, pyrazines, and ketones) in the VR sample.
When the implementations were individually checked, only HM and SAL appeared to be located in the same
quadrant and very close to each other. The result showed that human mastication was successfully duplicated
by the artificial mastication with saliva.
The profiles of the CRH and UN sample were very similar although the raw data showed the
expected trend of more volatiles from CRH. It appeared to affect only the amount of volatiles released not
the pattern of the profile. The number of detected compounds was seven and that increased to 13 with the
crushing implementation. Despite the increase in the number of the sample, normalized profiles showed less
variation within the chemical groups. Acids, alcohols, aldehydes and lactones were the main chemical groups
and consisted of 99% of the total area of the compounds in both the UN and CRH sample. The increase in
the number of the sample was due to the increase in the surface area of the
samples (Ingham, Linforth, & Taylor 1995). The cellular structure may also have been destroyed as a result
of the crushing conditions releasing even more volatiles (Arvisenet, Billy, Royer, & Prost 2006).
The number of aroma compounds in the sample revealed essential changes during mastication and
increased about 2.5 times. The breakdown of the food matrix during mastication enhances flavor release as
well as retronasal odor perception.14-16 Additionally, the retronasal aroma of some food while in the mouth
has been determined to be very different from the orthonasal perception (Baldy, 1995). Also, as opposed to
liquids, dilution and hydration are significant aspects of the retronasal flavor release from low moisture
foods (Clawson, Linforth, Ingham, & Taylor 1996). The result showed that the addition of water and the
associated change in the physical form of the biscuit did affect the release of volatiles. The polarity of the
aroma compounds may explain this formation; the least of the polar compounds were released from the
water first and the volatiles with the highest polarity were released last resulting in an increase in non-polar
compounds in the composition and a decrease in polar aroma
compounds (Ingham, Linforth, & Taylor 1995). However, SAL and HM had similar and greater
composition than the W sample. Van Ruth et al. (2000) depicted that the alteration of artificial saliva
composition regarding replacement of human α-amylase by porcine α-amylase did not alter the aroma
release significantly. The presence of artificial and human saliva increased the number of the volatiles and
influenced volatile groups either by increasing their quantity (ketones) or decreasing it (acids, alcohols, and
aldehydes). As a mucus, proteinaceous and enzymatic solution, saliva could also transform aroma by
emulsification or by breaking down starch or esters via the action of mucin and α-
amylase (Hussein, Kachikian, & Pidel 1983). These enzymatic reactions accompanied by oxidation may be
accelerated when mastication mixes parts of the food and combines in the presence of air. The influencing
effect would be much better for biscuits that had to be broken up to allow the release of the
flavor compound (Roberts, Acree, 1995). However, the decrease could be due to the fact that α-amylase can
affect aroma release as protein as well as having enzymatic effects. Many studies have shown that proteins
diminish aroma release (Le Thanh, Thibeaudeau, Thibaut, Voilley, 1992; O'Keefe, & Wilson, 1991).
Additionally, in the research investigating the saliva flow effect on the release of aroma, it has
International Conference on
RAW MATERIALS TO PROCESSED FOODS 03-04 June 2021, Turkey
205
been shown that the level of aldehyde content decreases with an increasing saliva flow (Harrison, 1998).
Thus, in the present study, the decrease in the aldehyde content could be due to contact between the
sample and saliva during the extraction period. Poinot et al. (2009) examined the aroma compounds of bread
samples using an artificial mouth system. The researchers determined that additions of
saliva cause changes in the aroma profile of the sample. Similar to our research, the acetic acid and ethyl
alcohol contents were reduced by the presence of saliva. In addition, no significant differences was observed
in pyrazines with the addition of saliva, similar to Lasekan (2013). The author determined that after
incubation of the samples with saliva there had been no change in the amount of pyrazines.
Aroma composition of three types of biscuits. The VR sample is a classic ‘petit beurre’ biscuit. A
total of 32 compounds were identified in the sample. Of all aroma compounds detected in the VR sample, the
main group both qualitatively and constitutively were the aldehydes. The compounds have low odor
threshold values, therefore, they have a potential significant effect on the aroma characterization of
biscuits (Pasqualone et al 2015). A total of eight aldehyde compounds were detected representing 40% of all
the aroma compounds. The main formation pathways of aldehydes are lipid oxidation and the Maillard
reaction. The reaction mainly occurs during the baking of biscuits. Many volatile compounds are formed
during the reaction; pyrazine, furans, pyrroles, and aldehydes. Strecker degradation occurring during
the Maillard reaction allows the formation of volatile aldehydes from amino
acids. Strecker aldehydes arise from isoleucine, leucine, and phenylalanine (Pasqualone et al.,
2014). Isovaleraldehyde, 2-methylbutanal and furfural were the main aldehyde compounds but hexanal was
also the other important compound in biscuits. Hexanal is generated at ambient temperature from oxidation
of linoleic acid in biscuits (Cognat, Shepherd, Verrall, Stewart, 2014) However, it is also the most abundant
volatile found in the rancid profile of bakery products (Purcaro, Moret, & Conte 2008). Pyrazines
quantitatively were the other important chemical group. The compounds mainly odors arising from cooking,
roasting, and burning (Schieberle, & Grosch.39 A total of nine pyrazine compounds were detected. Methyl
pyrazine was the featured compound followed by pyrazine and ethyl pyrazine. The compounds constituted
24% of the total aroma compounds from the sample. With six compounds, ketones were the other
chemical group. These compounds are generally responsible for the perception of off-odors and accumulate
with the peroxidation of unsaturated fatty acids to form intermediate hydroperoxides from morestable
secondary products that are subsequently derived (Heiniö, Oksman-Caldentey, Latva-
Kala, Lehtinen, & Poutanen 2001).
The sugar-free biscuit sample is the other type of ‘petit beurre’. A total of 36 aroma compounds were
detected in the SF sample. Different from the VR, the ratio of the pyrazine compounds (17%) was less than
the other samples in SF. Regarding its recipe, the SF sample has a lower sugar content than the other sample
leading to a lesser amount of the precursor for the Maillard reaction. All the chemical groups detected in the
VR sample were also identified in SF, however some new compounds were identified in SF such as ester,
terpene, and phenol. Concerning ester, only one compound was detected: the acetic acid ethyl ester. The
primary formation pathway of the compound is Fischer esterification. Within this reaction, ethanol and acetic
acid react to generate the compound. It can be obtained at room temperature but increasing temperature also
increases the yield of formation (Schieberle, 2005; Abuilaiwi, A.; Laoui, Al-Harthi, Atieh, 2010). When the
ingredients of the SF sample were checked, it was not possible to detect any of the precursors. It was thought
that the compounds reacted to generate the formation of acetic acid ethyl ester and cleavages. The terpene
compound, dL-limonene, was detected in the sample. The compound is not one of the typical volatiles of
biscuits. The compound is a monoterpene with a citrusy odor and is a major component of the oil extracted
from citrus peels. The compounds are widely used in the food industry to give the product its
aroma (Selli, & Kelebek, 2011).
The OR sample was the last type studied of the ‘petit beurre’ group. A total of 36 compounds were
detected in the sample. Among all the aroma compounds, aldehydes were the main chemical groups. Nine
aldehydes were detected and hexanal was overwhelmingly the main compound (20%). In the OR sample, the

International Conference on
RAW MATERIALS TO PROCESSED FOODS 03-04 June 2021, Turkey
206
ratio of the aldehydes (45%) was the highest among the samples. It could be due to the fact that only
sunflower oil was used in the OR samples, whereas a mix of mostly butter and sunflower oils were used as
ingredients in the VR and SF. Oils could be the main source of the aldehydes due to the high content of the
oleic and linoleic acid contents. Decomposition of hydroperoxides produced by lipoxygenase-
catalysed oxidation of unsaturated fatty acids is known to be a major pathway for aldehydes (Smith,
King, & Min, 2007; Wardlaw, & Snook, 1990). Pyrazines were the other main chemical groups. A total of
10 pyrazines were detected comprising about 21% of the sample. The ratio of the pyrazines was also higher
than in the other samples. The used wheat bran in the sample is about seven-times richer in proteins
than wheat flour (Peterson, Johnson, Mattern 1986). As previously mentioned, the substitute is one of the
main precursors of the pyrazines (Schieberle 2005). It was thought that this could be the reason for the
increase in the quantity of pyrazines. Additionally, α-pinene compound was identified only in the OR
sample. The compound is a monoterpene and the rosemary herb (Rosmarinus officinalis), one of the
ingredients in the sample, rich in this moneterpene (Szumny, Figiel, Gutiérrez-Ortíz, & Carbonell-
Barrachina 2010).
CONCLUSION
The results obtained in this study showed that the overall aroma compositions of the three types of ‘petit
beurre’ were similar to each other but differences were due to the ingredients that were used. The products of
the Maillard reaction, especially aldehydes and pyrazines, were the main chemical compounds in the
samples. The number of aroma compounds in the biscuit samples revealed essential changes during
mastication and increased about 2.5 times. Additionally, the result showed that human mastication was
successfully duplicated by the artificial masticator using saliva, and they increased the number of volatiles
while influencing some of the volatile groups either by increasing their quantity (ketones) or decreasing it
(acids, alcohols, and aldehydes). Thus, the artificial mouth would be particularly useful to study whether
there is a difference between orthonasal and retronasal perception of dry and starch-rich foods.
REFERENCES
Abuilaiwi, F. A., Laoui, T., Al-Harthi, M., & Atieh, M. A. (2010). Modification and functionalization of
multiwalled carbon nanotube (MWCNT) via fischer esterification. Arabian Journal for Science and
Engineering, 35, 37-48.
Arvisenet, G., Billy, L., Royer, G., & Prost, C. (2006). Role of mastication on the release of apple volatile
compounds in a model mouth system. Developments in Food Science, 43, 465-468.
Arvisenet, G., Billy, L., Poinot, P., Vigneau, E., Bertrand, D., & Prost, C. (2008). Effect of apple particle
state on the release of volatile compounds in a new artificial mouth device. Journal of Agricultural
and Food Chemistry, 56, 3245-3253.
Baldy, M., (1995). How the nose knows. I. A short primer on anatomy and physiology. American Wine
Society, 27, 3-8.
Bezman, Y., Mayer, F., Takeoka, G. R., Buttery, R. G., Ben-Oliel, G., Rabinowitch, H. D., & Naim,
M. (2003). Differential effects of tomato (Lycopersicon esculentum Mill) matrix on the volatility of
important aroma compounds. Journal of Agricultural and Food Chemistry, 51, 722-726.
Burdach, K. J., & Doty, R. L. (1987). The effects of mouth movements, swallowing, and spitting
on retronasal odor perception. Physiology & Behavior, 41, 353-356.
Clawson, A. R., Linforth, R. S., Ingham, K. E., & Taylor, A. J. (1996). Effect of hydration on release of
volatiles from cereal foods. LWT - Food Science and Technology, 29, 158-162.
Cognat, C., Shepherd, T., Verrall, S. R., & Stewart, D. (2014). Relationship between volatile profile and
sensory development of an oat-based biscuit. Food Chemistry, 160, 72-81.

International Conference on
RAW MATERIALS TO PROCESSED FOODS 03-04 June 2021, Turkey
207
Dury‐Brun, C., Fournier, N., Pernin, K., Guichard, E., & Voilley, A. (2007). A new approach to studying
sponge cake aroma after storage in treated paper and plastic packaging by direct gas
chromatography–olfactometry (D‐GC–O). Flavour and Fragrance Journal, 22, 255-264.
Farneti, B., Alarcón, A. A., Cristescu, S. M., Costa, G., Harren, F. J., Holthuysen, N. T., & Woltering, E.
J. (2013). Aroma volatile release kinetics of tomato genotypes measured by PTR-MS following
artificial chewing. Food Research International, 54, 1579-1588.
Genovese, A., Piombino, P., Gambuti, A., & Moio, L. (2009). Simulation of retronasal aroma of white and
red wine in a model mouth system. Investigating the influence of saliva on volatile compound
concentrations. Food Chemistry, 114, 100-107.
Haring, P. (1998). Flavour release: from product to perception. Flavour science and technology.
Harrison, M. Effect of breathing and saliva flow on flavor release from liquid foods. Journal of Agricultural
and Food Chemistry, 46(7), 2727-2735.
Heiniö, R.-L., Oksman-Caldentey, K.-M., Latva-Kala, K., Lehtinen, P., & Poutanen, K. (2001). Effect of
drying treatment conditions on sensory profile of germinated oat. Cereal Chemistry, 78, 707-714.
Hussein, M., Kachikian, R., & Pidel, A. (1983). Analysis for flavor residuals in the mouth by gas
chromatography. Journal of Food Science, 48, 1884-1885.
Ingham, K. E., Linforth, R. S., & Taylor, A. J. (1995). The effect of eating on aroma release from mint‐
flavoured sweets. Flavour and Fragrance Journal, 10, 15-24.
Lecanu, L., Ducruet, V., Jouquand, C., & Gratadoux, J. J., Feigenbaum, (2002). A. Optimization of
headspace solid-phase microextraction (SPME) for the odor analysis of surface-ripened
cheese. Journal of Agricultural and Food Chemistry, 50, 3810-3817.
Le Thanh, M., Thibeaudeau, P., Thibaut, M., & Voilley, A. (1992). Interactions between volatile and non-
volatile compounds in the presence of water. Food Chemistry, 43, 129-135.
Lasekan, O. A. (2013). comparative analysis of the influence of human salivary enzymes on odorant
concentration in three palm wines. Molecules, 18, 11809-11823.
Linforth, R., Martin, F., Carey, M., Davidson, J., & Taylor, A. J. (2002). Retronasal transport of aroma
compounds. Journal of Agricultural and Food Chemistry, 50, 1111-1117.
Manley, D. (2000). Technology of biscuits, crackers and cookies, 4th Edition, Woodhead
Publishing, Cambridge CB21 6AH, UK, , 1-8.
Odake, S., Roozen, J. P., & Burger, J. J. (2000). Flavor release of diacetyl and 2-heptanone from cream style
dressings in three mouth model systems. Bioscience, Biotechnology, and Biochemistry, 64, 2523-
2529.
O'Keefe, S. F., Wilson, L. A., Resurreccion, A. P., & Murphy, P. A. (1991). Determination of the binding of
hexanal to soy glycinin and. beta.-conglycinin in an aqueous model system using a headspace
technique. Journal of Agricultural and Food Chemistry, 39, 1022-1028.
Onishi, M., Inoue, M., Araki, T., Iwabuchi, H., & Sagara, Y. (2012). A PTR-MS-based protocol for
simulating bread aroma during mastication. Food and Bioprocess Technology, 5, 1228-1237.
Pasqualone, A., Bianco, A. M., Paradiso, V. M., Summo, C., Gambacorta, G., & Caponio,
F. (2014). Physico-chemical, sensory and volatile profiles of biscuits enriched with grape marc
extract. Food Research International., 65, 385-393.
Pasqualone, A., Bianco, A. M., Paradiso, V. M., Summo, C., Gambacorta, G., Caponio, F. & Blanco,
A. (2015). Production and characterization of functional biscuits obtained from purple wheat. Food
Chemistry, 180, 64-70.
Peterson, C., Johnson, V., & Mattern, P. (1986). Influence of cultivar and environment on mineral and
protein concentration of wheat flour, bran, and grain. Cereal Chemisrty, 63, 183-186.
Poinot, P., Arvisenet, G., Grua-Priol, J., Fillonneau, C., & Prost, C. (2009). Use of an artificial mouth to
study bread aroma. Food Research International, 42, 717-726.

International Conference on
RAW MATERIALS TO PROCESSED FOODS 03-04 June 2021, Turkey
208
Purcaro, G., Moret, S., & Conte, L. (2008). HS–SPME–GC applied to rancidity assessment in bakery
foods. European Food Research and Technology, 227, 1-6.
Purlis, E. (2010). Browning development in bakery products–A review. Journal of Food Engineering., 99,
239-249.
Rannou, C., Courcoux, P., Catanéo, C., Fillonneau, C., Thébaudin, J.-Y., Le Bail, A., & Prost,
C. (2017). Combination of paired preference test and comparative CATA to assess preference and
drivers of liking for consumers 12th Pangborn Sensory Science Symposium, Providence RI, USA.
Rega, B., Guerard, A., Delarue, J., Maire, M., & Giampaoli, P. (2009). On-line dynamic HS-SPME for
monitoring endogenous aroma compounds released during the baking of a model cake. Food
Chemistry, 112, 9-17.
Roberts, D. D., & Acree, T. E. (1995). Simulation of retronasal aroma using a modified headspace technique:
investigating the effects of saliva, temperature, shearing, and oil on flavor release. Journal of
Agricultural and Food Chemistry, 43, 2179-2186.
Ruijschop, R. M., Boelrijk, A. E., Burgering, M. J., de Graaf, C. & Westerterp-Plantenga, M.
S. (2009). Acute effects of complexity in aroma composition on satiation and food intake. Chemical
Senses., 35, 91-100.
Schieberle, P., & Grosch, W. (1987). Quantitative analysis of aroma compounds in wheat and rye bread
crusts using a stable isotope dilution assay. Journal of Agricultural and Food Chemistry, 35(2), 252-
257.
Schieberle, P. (2005). The Carbon Module Labeling (CAMOLA) Technique: A Useful Tool for Identifying
Transient Intermediates in the Formation of Maillard‐Type Target Molecules. Annals of the New
York Academy of Sciences, 1043, 236-248.
Selli, S., & Kelebek, H. (2011). Aromatic profile and odour-activity value of blood orange juices obtained
from Moro and Sanguinello (Citrus sinensis L. Osbeck). Industrial Crops and Products., 33, 727-
733.
Smith, S. A., King, R. E., & Min, D. B. (2007). Oxidative and thermal stabilities of genetically modified
high oleic sunflower oil. Food Chemistry, 102, 1208-1213.
Szumny, A., Figiel, A., Gutiérrez-Ortíz, A. & Carbonell-Barrachina, Á. A. (2010). Composition of rosemary
essential oil (Rosmarinus officinalis) as affected by drying method. Journal of Food Process
Engineering, 97, 253-260.
Van Ruth, S., & Roozen, J. (2000). Influence of mastication and saliva on aroma release in a model mouth
system. Food Chemistry, 71, 339-345.
Van Ruth, S. M., & Buhr, K. (2004). Influence of mastication rate on dynamic flavour release analysed by
combined model mouth/proton transfer reaction–mass spectrometry. International Journal of Mass
Spectrometry, 239, 187-192.
Van Ruth, S., Roozen, J., & Cozijnsen, J. (1994). Comparison of dynamic headspace mouth model systems
for flavour release from rehydrated bell pepper cuttings. Developments in Food Science, 35, 59-64.
Van Ruth, S. M., Roozen, J. P., & Cozijnsen, J. L. (1995). Volatile compounds of rehydrated French beans,
bell peppers and leeks. Part 1. Flavour release in the mouth and in three mouth model systems. Food
Chemistry, 53, 15-22.
Wardlaw, G., & Snook, J. (1990). Effect of diets high in butter, corn oil, or high-oleic acid sunflower oil on
serum lipids and apolipoproteins in men. The American Journal of Clinical Nutrition, 51, 815-821.
Welge-Lüssen, A., Husner, A., Wolfensberger, M., & Hummel, T. (2009). Influence of simultaneous
gustatory stimuli on orthonasal and retronasal olfaction. Neuroscience Letters, 454, 124-128.

International Conference on
RAW MATERIALS TO PROCESSED FOODS 03-04 June 2021, Turkey
209

International Conference on
RAW MATERIALS TO PROCESSED FOODS 03-04 June 2021, Turkey
210
Investigation of Fatty Acid Composition Including Trans Fatty Acids and Erucic
Acid in Selected Salty Snack Foods
Tugba Ozdal1, Perihan Yolci Omeroglu2
1Istanbul Okan University, Faculty of Engineering, Department of Food Engineering, 34959, Akfirat-Tuzla-Istanbul,
Turkey. 2Bursa Uludag University, Faculty of Agriculture, Food Engineering Department, 16059, Gorukle Campus, Bursa,
Turkey.
Tel: +90 216 677 16 30 Fax: +90 216 677 16 47, E-mail: [email protected]
ABSTRACT
The objectives of the present study were to determine and evaluate fatty acid composition of a selection of
salty snacks present on markets in Turkey with a reliable chromatographic method; to evaluate trans fatty
acid (TFA) and erucic acid contents in terms of food safety, and to check “TFA-free” statement on the label
with current legislation. Based on the method verification study, the performance criteria of the analytical
methods used was found acceptable. Even though the highest level of total fat was found in the potato chips,
puff and popcorn category, the saturated fatty acids were higher (p < 0.05) in crackers category. Palmitic
acid was predominant for cracker and grissini groups, whereas oleic acid showed higher prevalence for the
last group. None of the sample prevailed food safety risk regarding erucic acid and TFA. Moreover, the
declaration on the label for TFA was verified with the analytical results.
Keywords: Fatty acid composition, GC-FID, trans fatty acid, snack foods

International Conference on
RAW MATERIALS TO PROCESSED FOODS 03-04 June 2021, Turkey
211
The Use of Arugula and Barberry Extracts as Nitrite Alternative in Heat-treated
Fermented Sausages
Hilal Can, Burcu Sarı, Hülya Serpil Kavuşan*, Meltem Serdaroğlu
Ege University, Engineering Faculty, Food Engineering Department, Bornova, Izmir, Turkey
*E-mail: [email protected]
ABSTRACT
The aim of this study was to evaluate the effect of arugula and barberry extracts as nitrite source on color
parameters, nitrosomyoglobin, total pigment, residual nitrite and nitrate content in heat treated fermented
sausages. For this purpose, heat treated fermented sausages were formulated with 150 ppm nitrite (N), 2.73
g/kg arugula extract (AE) or 2.73 g/kg arugula extract plus 4.83g/kg barberry extract (ABE). Control sample
without nitrite or extracts was also prepared (C). Thereby, five different formulations were prepared with
three replications. ABE samples had the highest nitrosomyoglobin content followed by N and AE. Total
pigment contents recorded as 109.03, 152.23, 122.80 and 139.65 for C, N, AE, and ABE treatments,
respectively. While the lightness values of the C, N and AE samples increased in the third month, L* values
ABE samples decreased. L* values of samples ranged between 34.52- 41.81 throughout 3 months of storage
and storage had an increasing effect on L* values. It was observed that the L* values C and N treatments
increased in the third month of storage. On day 0 and at the end of the storage the highest a* value was
measured in N treatment (Table 1). The lowest a* values were recorded in C samples formulated without
nitrite or nitrite alternatives. No significant changes were observed in a* values of ABE during storage.
Yellowness value (b*) of N treatment was lower than other counterparts. N treatment has the highest residual
nitrite content initially as expected. Residual nitrate concentration of samples was highest in ABE samples
and the lowest in C samples. As conclusion both arugula and barberry extracts exhibit an opportunity to use
as nitrite alternative, however, addition of pre-conversion nitrate in arugula extract to nitrite should be
studied. The authors are thankful for the financial support of Ege University Scientific Research Projects
Coordination under project number FGA-2020-22148.
Keywords: Arugula, barberry, nitrite alternative, fermented sausage
International Conference on
RAW MATERIALS TO PROCESSED FOODS 03-04 June 2021, Turkey
212
A comparative study on physicochemical properties and in vitro bioaccessibility
of bioactive compounds in rosehip (Rosa canina L.) infusions treated by non-
thermal and thermal treatments
Gulay Ozkan1,2, Tuba Esatbeyoglu2, Esra Capanoglu1*
1Department of Food Engineering, Faculty of Chemical and Metallurgical Engineering, Istanbul Technical University,
34469 Maslak, Istanbul, Turkey 2Institute of Food Science and Human Nutrition, Gottfried Wilhelm Leibniz University of Hannover, Am Kleinen Felde
30, 30167 Hannover, Germany
*E-mail: [email protected]
ABSTRACT
The aim of this present study was to compare the effects of non-thermal food processing technologies with
thermal treatment on physicochemical properties, in vitro bioaccessibility and antioxidant activity of
bioactive compounds in rosehip (Rosa canina L.) infusions.
For this purpose, high pressure processing (HPP) at 600 MPa for 5 min, pulsed electric field (PEF) with 5
and 15 kJ/kg specific energy inputs at 1 and 3 kV/cm electric field strength and thermal treatment (TT) at 85
℃/10 min were applied. According to the results, processing method significantly affected the content and
bioaccessibility of phenolic compounds, and antioxidant activity in rosehip extracts. It appears that the
highest retention of total phenolics (TPC) and flavonoids (TFC) were achieved by the TT (2278 mg
GAE/100 g dw and 3728 mg RE/100 g dw, respectively) and HPP treatment with a pressure of 600 MPa for
15 min (2268 mg GAE/100 g dw and 3695 mg RE/100 g, respectively). These findings are in line with the
results of antioxidant activities of the samples measured by CUPRAC and DPPH assays. On the other hand,
TT, HPP treatment at 600 MPa/5 min and PEF treatment with 5 and 15 kJ/kg energy input at 1 kV/cm
electric field strength resulted with a higher recovery of TPC, TFC and antioxidant activity after
gastrointestinal digestion.
Overall, a glance at the results reveals that HPP and PEF technologies can be used as alternative processing
methods in the production of functional foods with enhanced nutritional value.
International Conference on
RAW MATERIALS TO PROCESSED FOODS 03-04 June 2021, Turkey
213
Development of mucilage powder from Basella rubra and
elderly products application
Teerawan Suwan*, Nopparat Muangma, Benyapa Soponpattarin, Nattakan Jakkranuhwat
Faculty of Agro-industry, King Mongkut’s University of Technology North Bangkok, Thailand
*Tel.: +66-88-252-9341, E-mail: [email protected]
ABSTRACT
This research aims at developing mucilage powder from Basella rubra as a new choice of elderly product.
Factorial design used for investigate the effect of maltodextrin to soy protein ratio and inlet temperature. The
optimal spray dried condition was 38.5: 1.5 maltodextrin to soy protein ratio at 130 oC of inlet temperature.
The mucilage powder had 0.323 of water activity, 3.94±0.32% moisture content, the total phenolic content
6.26±0.01 mgGAE/g and 26.34±2.87% DPPH inhibition. Then, the mucilage powder was applied by mixed
50% w/v with three beverages, namely of drinking water, orange juice and tea. The results shown that
Basella rubra mucilage powder increased beverage viscosity in level 2 (Nectar-like; 51-350 cP). The total
phenolic content was 2.02±0.10, 2.72±0.08 and 2.76±0.10 mgGAE/mL and antioxidant scavenging activity
were 45.18±0.85, 43.57±1.52 and 46.19±0.92 %DPPH inhibition for drinking water, orange juice and tea,
respectively. According to these results, the Basella rubra mucilage powder could be offering choices for
dysphagia elderly who require modified for textures with antioxidant.
Keywords: Antioxidant activity, Basella rubra, Elderly, Mucilage, Phenolic compound, Spray dried

International Conference on
RAW MATERIALS TO PROCESSED FOODS 03-04 June 2021, Turkey
214
Changes in the Bioaccessibility of Polyphenols in Fruits and Vegetables
Subjected to Freezing Process
Senem Kamiloglu1*
1Science and Technology Application and Research Center (BITUAM), Bursa Uludag University, 16059 Gorukle,
Bursa, Turkey
*E-mail: [email protected]
ABSTRACT
Recently, reduced access to markets and restaurants due to the COVID-19 outbreak has led to increased
consumption of frozen foods while people stay safe at home and seek healthy products that do not deteriorate
for a long time. Freezing is an effective method to preserve nutritional and physical properties of fruits and
vegetables while extending their shelf life. A diet rich in fruits and vegetables has been attributed to lower
incidence of chronic diseases, which has been linked to the presence of bioactive compounds, particularly
polyphenols. The availability of polyphenols following digestion is critical as several studies have pointed
out that the bioaccessibility of polyphenols would influence their potential benefits on health. One of the
factors affecting the bioaccessibility of polyphenols is food processing. Considering the above, in this paper
the changes in the bioaccessibility of polyphenols in fruits and vegetables that are subjected to freezing
process were discussed. Although the findings of the literature were contradictory, majority of the studies
showed that bioaccessibility of polyphenols from fruits and vegetables were similar or higher than that of
fresh fruits and vegetables. Overall, the current paper emphasized that freezing process may be an effective
approach for preservation of bioaccessible polyphenols in fruits and vegetables.
Keywords: In Vitro Digestion, Colonic Fermentation, Industrial Freezing, Flavonoids, Phenolic Acids
1. INTRODUCTION
Consumption of fruits and vegetables appears to be inversely related to the incidence of chronic diseases
such as cardiovascular disease, obesity, type 2 diabetes, and neurodegenerative diseases. The potential health
beneficial effects of fruits and vegetables has been linked to the presence of bioactive compounds,
particularly polyphenols (Costa et al., 2017; Cory et al., 2018; Serino and Salazar, 2019). Polyphenols are
plant secondary metabolites that possess antioxidant, anti-inflammatory (Zhang and Tsao, 2016),
antimicrobial (Daglia, 2012), and anticancer (Niedzwiecki et al., 2016) properties. Taking into account the
number of phenol rings and the structural elements binding these rings to each other, polyphenols can be
classified as (i) flavonoids, (ii) phenolic acids, (iii) stilbenes, and (iv) lignans (D’Archivio et al., 2007;
Grootaert et al., 2015) (Figure 1).

International Conference on
RAW MATERIALS TO PROCESSED FOODS 03-04 June 2021, Turkey
215
Figure 2: Classification of Major Classes of Dietary Polyphenols (Grootaert et al., 2015)
As fruits and vegetables are perishable, an efficient preservation method is necessary to extend the shelf life
and protect the nutritional and physical characteristics of these commodities. Freezing is one of the most
widely utilized food processing methods that reduces the deterioration rate of fruits and vegetables by
decreasing enzymatic and microbial activities, respiration and oxidation (Bilbao-Sainz et al., 2019). On the
other hand, previous studies in the literature have indicated that freezing process may affect the polyphenol
content of fruits and vegetables (Mazzeo et al., 2015; Paciulli et al., 2015).
The term “bioaccessibility” refer to the potential portion or fraction of a nutrient that is released from the
food matrix and available for absorption in the intestine in relation to the total initial content (Montiel-
Sánchez et al., 2021). Only polyphenols liberated from the food matrix by digestive enzymes and microbiota
are bioaccessible in the intestine and thus possibly bioavailable (Kamiloglu, 2019a). To investigate the
gastrointestinal behavior of dietary components, in vitro methods mimicking digestion processes are
commonly employed. Even though clinical trials are the “gold standard” for answering diet related issues, in
vitro gastrointestinal digestion models have benefits of being fast, cheap, and less labor intensive, as well as
being free of ethical constraints (Alminger et al., 2014).
Considering the above, the aim of this paper was to provide an overview of the findings on the changes in the
bioaccessibility of polyphenols in fruits and vegetables subjected to freezing process. Below, the effect of
freezing process on the contents of total phenolics, flavonoids and anthocyanins as well as individual
flavonoids and phenolic acids in fruits and vegetables are discussed in detail.
2. POLYPHENOLS IN FRUITS AND VEGETABLES
2.1. Total Phenolics, Flavonoids and Anthocyanins
The bioaccessibility of total phenolics in apples (Dalmau et al., 2017), beetroot (Dalmau et al., 2019) and
strawberry (Kamiloglu, 2019a) was reduced after freezing (up to 67%), whereas frozen green beans
(Kamiloglu, 2019c) and spinach (Kamiloglu, 2020) contained significantly higher bioaccessible total
phenolics compared to fresh vegetables (23-58%) (p<0.05). The differences observed among different
commodities might be related to the fact that the studies on the bioaccessibility of total phenolics in apples
and beetroot were determined only after gastric digestion, while for green beans and spinach phenolic
bioaccessibility was calculated after intestinal digestion. For the measurement of total phenolic content,
majority of the studies in the literature employed Folin-Ciocalteu method, which has the benefits of being
simple, robust, and reproducible, as well as not requiring a specific equipment. On the other hand, this assay
also has some drawbacks. Along with phenolic compounds, other reducing agents such as citric acid,
ascorbic acid, simple sugars, or certain amino acids can interfere with the assay, and consequently the results
Polyphenols
Flavonoids P henolic Acids S tilbenes Lignans
(C6-C3-C6) (C6-C2-C6) (C 6-C3)2
e.g. Resveratrol e.g. Secoisolariciresinol
Matairesinol
Hydroxybenzoic acids Hydroxycinnamic acids
(C6-C1) (C 6-C3)
e.g. Gallic acid e .g. Caffeic acid
p-hydroxybenzoic acid Ferulic acid Protocatechuic acid p-coumaric acid
Vanilic acid S inapic acid
Syringic acid
Flavonols Flavones F lavanones F lavanols Isoflavones Anthocyanidin
e.g. Quercetin e.g. Apigenin e.g. Naringenin e.g. Catechin e.g. Genistein e .g. Cyanidin
Myricetin Luteolin Hesperitin Epicatechin Daidzein Delphinidin
Kaempferol Eriodictyol G lycitein M alvidin Pelargonidin
Peonidin
International Conference on
RAW MATERIALS TO PROCESSED FOODS 03-04 June 2021, Turkey
216
might be overestimated. Moreover, the assay is carried out in an aqueous medium, therefore the
measurement of lipophilic phenolics could be limited (Capanoglu et al., 2021). Therefore, it is recommended
to also perform chromatographic analysis before drawing conclusions.
The total flavonoid content of frozen green beans (Kamiloglu, 2019c), spinach (Kamiloglu, 2020) and
strawberry (Kamiloglu, 2019a) were found to be higher than that of fresh fruits and vegetables after in vitro
gastrointestinal digestion (28-149%) (p<0.05), while the bioaccessibility of total flavonoids in apples was
reduced after individual quick freezing (IQF) process (20%), which was statistically not significant
(Kamiloglu, 2019b). Aluminium chloride assay, which is carried out to determine the total flavonoid content
of fruit and vegetables, is not fully specific to flavonoids. In addition to flavonoids, phenolic acids could also
react in the assay, whereas majority of the flavonoids excluding flavanols, react poorly in the assay (Ho et
al., 2012). Hence, as indicated above, flavonoids should be analysed using chromatographic methods in order
to obtain more reliable results.
The total monomeric anthocyanin content of frozen strawberries was reported to be significantly higher than
that of fresh ones after in vitro gastrointestinal digestion (65-86%) (p<0.05) (Kamiloglu, 2019a). Freezing
disrupts the food matrix due to the development of ice crystals, and these alterations in the matrix could
result in cell wall maceration and enhance the extraction of bioactives during digestion (Oliveira et al.,
2016).
2.2. Flavonoids
Flavonoids are low molecular weight compounds, composed of 15 carbon atoms, placed in a C6−C3−C6
configuration. The structure is comprised of two aromatic rings, connected by a three−carbon bridge, often in
a heterocyclic ring form. Six distinct subclasses, namely flavonols, flavanols, flavones, flavanones,
isoflavones and anthocyanidins, arise from alterations in the substitution model of the heterocyclic ring
(Tennant et al., 2014) (Figure 1).
The most common subgroup of the flavonoids are the flavonols. The main dietary flavonol aglycones are
quercetin and kaempferol, which often occur as O-glycosides. Berries, apples, onion, broccoli, kale, cabbage,
tea, and red wine are among the major dietary sources of flavonol aglycones and O-glycosides (Kamiloglu et
al., 2019). A recent study investigating the effect of different freezing methods on the bioaccessibility of
strawberry polyphenols using an in vitro gastrointestinal digestion model showed that both conventional and
IQF processes decreased the amount of bioaccessible quercetin 3-glucuronide (40-54%) (p<0.05)
(Kamiloglu, 2019a). On the other hand, in another study evaluating the bioaccessibility of polyphenols in
fresh and frozen strawberries (Balasooriya et al., 2020), conflicting results were reported. While the
bioaccessible quercetin was increased by 38% for fasted state of in vitro gastrointestinal digestion, in fed
state quercetin was not detected in frozen strawberries that were grown under elevated carbon dioxide and
temperature (Balasooriya et al., 2020). Similarly, a study evaluating the bioaccessibility of polyphenols in
fresh and frozen apples using an in vitro gastrointestinal digestion model, also reported that bioaccessible
quercetin glycosides were diminished after industrial freezing processes, probably due to the removal of
apple peels that contains the majority of flavonols (Kamiloglu, 2019b). Although statistically not significant,
the amount of bioaccessible kaempferol 3-glucoside increased (18-28%) after both conventional and
industrial freezing of strawberries. However, freezing reduced the bioaccessible kaempferol 3-
coumaroylglucoside significantly (59-64%) (p<0.05). It is possible that kaempferol 3-coumaroylglucoside
might be cleaved to kaempferol 3-glucoside during digestion process (Kamiloglu, 2019a).
Anthocyanins are water-soluble pigments that give several fruits, vegetables, roots, cereals, and legumes
their red, purple, and blue color. Anthocyanins are present as glycosides of their respective aglycone
anthocyanidins. The most abundant anthocyanidins are cyanidin, malvidin, delphinidin, peonidin,
pelargonidin, and petunidin (Kamiloglu et al., 2015). Kamiloglu (2019a) and Balasooriya et al. (2020)
investigated the bioaccessibility of anthocyanins from strawberry after different freezing processes. As a
result, Kamiloglu (2019) reported increases in the bioaccesibility of pelargonidin 3-glucoside (86-129%)
(p<0.05), the major anthocyanin present in strawberries, whereas Balasooriya et al. (2020) reported
decreased bioaccessibility of pelargonidin 3-glucoside both at fed and fasted states (16-25 and 5-13%,
respectively). Balasooriya et al. (2020) further applied a colonic fermentation model following
gastrointestinal digestion, which revealed up to 55% reduced amount of bioaccessible pelargonidin 3-
glucoside (p<0.05). On the other hand, the bioaccessibility of tyrosol, which has been reported to be the
major microbial metabolite derived from pelargonidin 3-glucoside in strawberry after colonic fermentation
International Conference on
RAW MATERIALS TO PROCESSED FOODS 03-04 June 2021, Turkey
217
(López de las Hazas et al., 2017) increased (16-36%) in frozen strawberries (Balasooriya et al., 2020). The
trend observed for other minor anthocyanins present in strawberries varied. Conventional freezing increased
the bioaccessibility of cyanidin 3-glucoside (13%) and pelargonidin 3-rutinoside (100%) (p<0.05). However,
after IQF process, bioaccessible cyanidin 3-glucoside was reduced (44%) and pelargonidin 3-rutinoside did
not change significantly. Furthermore, pelargonidin 3-malonylglucoside diminished after both conventional
freezing and IQF processes. It is possible that freezing might have caused the cleavage of pelargonidin 3-
malonylglucoside and to pelargonidin 3-glucoside (Kamiloglu, 2019a).
Epicatechin and catechin are abundant flavanols in fruits, chocolate, red wine, and tea (Manach et al., 2004).
Studies investigating the effect of freezing processes on the bioaccessibility of flavanols are very limited.
According to the study of Kamiloglu (2019b), IQF process increases the bioaccessible amount of epicatechin
by 47% (p<0.05). Similarly, another study investigating the effect of industrial freezing process on the
bioaccessibility of spinach polyphenols concluded that, IQF process enhanced the bioaccessibility of
individual flavonoids by 15% (Kamiloglu, 2020). In addition to the compounds discussed above, the
bioaccessibility phlorizin present in apples was reported to reduce by 71% as a result of industrial freezing
(p<0.05).
2.3. Phenolic Acids
Phenolic acids include hydroxycinnamic acids with a three-carbon side chain (caffeic, p-coumaric, ferulic
and sinapic) and hydroxybenzoic acids with a C6–C1 structure (gallic, protocatechuic, 4-hydroxybenzoic,
vanillic, and syringic) (Balasundram et al., 2006). Hydroxycinnamic acids are present in high concentrations
in berries and coffee, while tea and many fruits are rich sources of hydroxybenzoic acids (D'Archivio et al.,
2007). The total phenolic acid content of frozen spinach was found to be 16% higher than that of fresh
spinach after in vitro gastrointestinal digestion (Kamiloglu, 2020). However, chlorogenic acid, a well-known
hydroxycinnamic acid with quinic acid found in apples, was reported to be significantly less bioaccessible
when apples are subjected to freezing process (66%) (p<0.05). Similarly, the bioaccessibility of caffeic acid
was also reduced significantly after industrial freezing process of apples (42%) (p<0.05) (Kamiloglu, 2019b).
On the other hand, the majority of the findings reporting the bioaccessibility of p-coumaric acid derivates in
strawberries revealed drastic reductions after freezing process. Although the results obtained regarding the
bioaccessibility of ferulic acid derivatives in frozen strawberries varied, majority of the findings suggested
reduced bioaccessibility, which is in parallel with the results obtained for p-coumaric acid derivates
(Kamiloglu, 2019a; Balasooriya et al., 2020).
The changes in the bioaccessibility of polyphenols in fruits and vegetables subjected to freezing process are
summarized in Table 1.

International Conference on
RAW MATERIALS TO PROCESSED FOODS 03-04 June 2021, Turkey
218
Table 1: Changes in the bioaccessibility of polyphenols in fruits and vegetables subjected to freezing process
Product Variety Treatment Model Result(s) Reference
Apple
(Malus domestica)
Granny Smith Freezing in liquid
nitrogen at −196°C
In vitro gastric digestion at
37°C for 3 h
Total Phenolic Content: 67% ↓*
Dalmau et al.,
2017
Industrial freezing (IQF)
at −22°C
In vitro gastrointestinal
digestion at 37°C for 2 h
for each stage
Total Phenolic Content: 6% ↑
Total Flavonoid Content: 20% ↓
Epicatechin: 47% ↑*
Quercetin 3-galactoside: 100% ↓*
Quercetin 3-glucoside: 100% ↓*
Quercetin 3-xyloside: 100% ↓*
Quercetin 3-arabinoside: 100% ↓*
Quercetin 3-rhamnoside: 100% ↓*
Phlorizin: 71% ↓*
Chlorogenic acid: 66% ↓*
Caffeic acid: 42% ↓*
Kamiloglu,
2019b
Beetroot
(Beta vulgaris)
Conditiva Freezing in liquid
nitrogen at −196°C,
−80°C and −20°C
In vitro gastric digestion at
37°C for 3 h
−196°C:
Total Phenolic Content: 57% ↓*
−80°C:
Total Phenolic Content: 44% ↓*
−20°C:
Total Phenolic Content: 46% ↓*
Dalmau et al.,
2019
Green beans
(Phaseolus vulgaris)
Gina Industrial freezing (IQF)
at −22°C
In vitro gastrointestinal
digestion at 37°C for 2 h
for each stage
Total Phenolic Content: 23% ↑*
Total Flavonoid Content: 149% ↑*
Kamiloglu,
2019c
Spinach
(Spinacia oleracea L.)
El real Industrial freezing (IQF)
at −22°C
In vitro gastrointestinal
digestion at 37°C for 2 h
for each stage
Total Phenolic Content: 58% ↑*
Total Flavonoid Content: 28% ↑*
Individual flavonoids: 15% ↑
Phenolic acids: 16% ↑
Kamiloglu, 2020

International Conference on
RAW MATERIALS TO PROCESSED FOODS 03-04 June 2021, Turkey
219
Table 1 (continues): Changes in the bioaccessibility of polyphenols in fruits and vegetables subjected to freezing process
Product Variety Treatment Model Result(s) Reference
Strawberry
(Fragaria x ananassa
Duch.)
Tiago Conventional freezing at
−20°C and industrial
freezing (IQF) at −22°C
In vitro gastrointestinal
digestion at 37°C for 2 h
for each stage
Conventional Freezing:
Total Phenolic Content: 5% ↓
Total Flavonoid Content: 33% ↑*
Total Monomeric Anthocyanin Content: 86% ↑*
Quercetin 3-glucuronide: 54% ↓*
Kaempferol 3-glucoside: 18% ↑
Kaempferol 3-coumaroylglucoside: 64% ↓*
Cyanidin 3-glucoside: 13% ↑
Pelargonidin 3-glucoside: 129% ↑*
Pelargonidin 3-rutinoside: 100% ↑*
Pelargonidin 3-malonylglucoside: 100% ↓*
p-Coumaroylhexose: 41% ↓
Ferulic acid hexose derivative: 100% ↑
Ellagic acid deoxyhexoside: 14% ↑
Industrial Freezing (IQF):
Total Phenolic Content: 1% ↓
Total Flavonoid Content: 46% ↑*
Total Monomeric Anthocyanin Content: 65% ↑*
Quercetin 3-glucuronide: 40% ↓*
Kaempferol 3-glucoside: 28% ↑
Kaempferol 3-coumaroylglucoside: 59% ↓*
Cyanidin 3-glucoside: 44% ↓
Pelargonidin 3-glucoside: 86% ↑*
Pelargonidin 3-rutinoside: -
Pelargonidin 3-malonylglucoside: 100% ↓*
p-Coumaroylhexose: 36% ↓
Ferulic acid hexose derivative: -
Ellagic acid deoxyhexoside: 5% ↓
Kamiloglu,
2019a

International Conference on
RAW MATERIALS TO PROCESSED FOODS 03-04 June 2021, Turkey
220
Table 1 (continues): Changes in the bioaccessibility of polyphenols in fruits and vegetables subjected to freezing process
Product Variety Treatment Model Result(s) Reference
Strawberry
(Fragaria x ananassa
Duch.)
San Andreas Conventional freezing at
−20°C
In vitro gastrointestinal
digestion at fed and fasted
state at 37°C for 2 and 3 h
for gastric and intestinal
digestion + colonic
fermentation at 37°C for 24
h
Gastrointestinal digestion:
Fed state:
Quercetin: 3-100% ↓*
Pelargonidin 3-glucoside: 16-25% ↓
Pelargonidin 3-rutinoside: 55% ↑* to 2% ↓
p-Coumaric: 4-12% ↓
Ferulic acid: 3-100% ↓*
p-Coumaroyl: 30-100% ↓*
Fasted state:
Quercetin: 38% ↑ to 100% ↓*
Pelargonidin 3-glucoside: 5-13% ↓
Pelargonidin 3-rutinoside: 11-76% ↑*
p-Coumaric acid: 11% ↓ to 12% ↑
Ferulic acid: 3-16% ↑
p-Coumaroyl: 8% ↓ to 13% ↑
Colonic fermentation:
Fed state:
Pelargonidin 3-glucoside: 53-55% ↓*
Tyrosol: 36% ↑ to 49% ↓*
p-Coumaric acid: 36% ↑ to 52% ↓*
Ferulic acid: 29-53% ↓*
Fasted state:
Pelargonidin 3-glucoside: 5-54% ↓*
Tyrosol: 16-35% ↑*
p-Coumaric acid: 56% ↑* to 15% ↓
Ferulic acid: 13-33% ↓*
Balasooriya et
al., 2020
↑: increase; ↓: decrease; -: no change; *: significantly different (p<0.05)
International Conference on
RAW MATERIALS TO PROCESSED FOODS 03-04 June 2021, Turkey
221
CONCLUSION
Although the findings of the literature were contradictory, majority of the studies showed that
bioaccessibility of polyphenols from fruits and vegetables were similar or higher than that of fresh fruits
and vegetables. Therefore, freezing may be a good approach to preserve the bioaccessible polyphenols in
fruits and vegetables. Nevertheless, in this paper only the influence of freezing process is discussed, the
variations in the polyphenol content during frozen storage should be covered further to establish the
optimized conditions for enhanced bioaccessibility of polyphenols in fruits and vegetables. In addition, in
vivo studies are also required to understand the bioaccessibility polyphenols from frozen fruits and
vegetables.
REFERENCES
[31] Costa, C., Tsatsakis, A., Mamoulakis, C., Teodoro, M., Briguglio, G., Caruso, E., Tsoukalas, D.,
Margina, D., Dardiotis, E., Kouretas, D., & Fenga, C. (2017). Current evidence on the effect of dietary
polyphenols intake on chronic diseases. Food and Chemical Toxicology, 110, 286-299.
[32] Cory, H., Passarelli, S., Szeto, J., Tamez, M., & Mattei, J. (2018). The role of polyphenols in
human health and food systems: A mini-review. Frontiers in Nutrition, 5, 87.
[33] Serino, A., & Salazar, G. (2019). Protective role of polyphenols against vascular inflammation,
aging and cardiovascular disease. Nutrients, 11(1), 53.
[34] Zhang, H., & Tsao, R. (2016). Dietary polyphenols, oxidative stress and antioxidant and anti-
inflammatory effects. Current Opinion in Food Science, 8, 33-42.
[35] Daglia, M. (2012). Polyphenols as antimicrobial agents. Current Opinion in Biotechnology, 23,
174-181.
[36] Niedzwiecki, A., Roomi, M.W., Kalinovsky, T., & Rath, M. (2016). Anticancer efficacy of
polyphenols and their combinations. Nutrients, 8, 552.
[37] D’Archivio, M., Filesi, C., Di Benedetto, R., Gargiulo, R., Giovannini, C., & Masella, R. (2007).
Polyphenols, dietary sources and bioavailability. Annali Dell’Istituto Superiore Di Sanita, 43(4), 348-
361.
[38] Grootaert, C., Kamiloglu, S., Capanoglu, E., & Van Camp, J. (2015). Cell systems to investigate
the impact of polyphenols on cardiovascular health. Nutrients, 7(11), 9229-9255.
[39] Bilbao-Sainz, C., Sinrod, A., Powell-Palm, M. J., Dao, L., Takeoka, G., Williams, T., Wood, D.,
Ukpai, G., Aruda, J., Bridges, D.F., Wu, V.C.H., Rubinsky, B. & McHugh, T. (2019). Preservation of
sweet cherry by isochoric (constant volume) freezing. Innovative Food Science & Emerging
Technologies, 52, 108-115.
[40] Mazzeo, T., Paciulli, M., Chiavaro, E., Visconti, A., Fogliano, V., Ganino, T., & Pellegrini, N. (2015).
Impact of the industrial freezing process on selected vegetables-Part II. Colour and bioactive
compounds. Food Research International, 75, 89-97.
[41] Paciulli, M., Ganino, T., Pellegrini, N., Rinaldi, M., Zaupa, M., Fabbri, A., & Chiavaro, E. (2015).
Impact of the industrial freezing process on selected vegetables-Part I. Structure, texture and
antioxidant capacity. Food Research International, 74, 329-337.
[42] Montiel-Sánchez, M., García-Cayuela, T., Gómez-Maqueo, A., García, H. S., & Cano, M. P. (2021).
In vitro gastrointestinal stability, bioaccessibility and potential biological activities of betalains and
phenolic compounds in cactus berry fruits (Myrtillocactus geometrizans). Food Chemistry, 342,
128087.
[43] Kamiloglu, S. (2019a). Effect of different freezing methods on the bioaccessibility of strawberry
polyphenols. International Journal of Food Science & Technology, 54(8), 2652-2660.
[44] Alminger, M., Aura, A.M., Bohn, T., Dufour, C., El, S., Gomes, A., Karakaya, S., Martinez-Cuesta,
M., McDougall, G., & Requena, T. (2014). In vitro models for studying secondary plant metabolite
digestion and bioaccessibility. Comprehensive Reviews in Food Science and Food Safety, 13(4), 413-
436.
[45] Dalmau, M. E., Bornhorst, G. M., Eim, V., Rosselló, C., & Simal, S. (2017). Effects of freezing,
freeze drying and convective drying on in vitro gastric digestion of apples. Food Chemistry, 215, 7-16.

International Conference on
RAW MATERIALS TO PROCESSED FOODS 03-04 June 2021, Turkey
222
[46] Dalmau, M. E., Llabrés, P. J., Eim, V. S., Rosselló, C., & Simal, S. (2019). Influence of freezing on
the bioaccessibility of beetroot (Beta vulgaris) bioactive compounds during in vitro gastric
digestion. Journal of the Science of Food and Agriculture, 99(3), 1055-1065.
[47] Kamiloglu, S. (2019c). Changes in green bean phenolics, flavonoids and antioxidant capacity during
industrial freezing process and in vitro gastrointestinal digestion. Academic Food Journal, 17(2), 176-
184.
[48] Kamiloglu, S. (2020). Industrial freezing effects on the content and bioaccessibility of spinach
(Spinacia oleracea L.) polyphenols. Journal of the Science of Food and Agriculture, 100(11), 4190-
4198.
[49] Capanoglu, E., Kamiloglu, S., Demirci Cekic, S., Sozgen Baskan, K., Avan, A.N., Uzunboy, S., &
Apak, R. (2021). Antioxidant Activity and Capacity Measurement. In H.M. Ekiert, K.G. Ramawat & J.
Arora (Eds.), Plant Antioxidants and Health (pp. 1-66). Springer, Cham.
[50] Kamiloglu, S. (2019b). Evaluation of polyphenol bioaccessibility in fresh and frozen apples and apple
pomace. The Journal of Food, 44(3), 409-418.
[51] Ho, Y. C., Yu, H. T., & Su, N. W. (2012). Re-examination of chromogenic quantitative assays for
determining flavonoid content. Journal of Agricultural and Food Chemistry, 60(10), 2674-2681.
[52] Oliveira, A., Alexandre, E. M., Coelho, M., Barros, R. M., Almeida, D. P., & Pintado, M. (2016).
Peach polyphenol and carotenoid content as affected by frozen storage and pasteurization. LWT-Food
Science and Technology, 66, 361-368.
[53] Tennant, D. R., Davidson, J., & Day, A. J. (2014). Phytonutrient intakes in relation to European fruit
and vegetable consumption patterns observed in different food surveys. British Journal of
Nutrition, 112(7), 1214-1225.
[54] Kamiloglu, S., Tomas, M., Capanoglu, E. (2019). Dietary flavonols and O-glycosides. In J. Xiao, S.D.
Sarker & Y. Asakawa (Eds.), Handbook of Dietary Phytochemicals (pp. 1-40). Springer, Singapore.
[55] Balasooriya, H., Dasanayake, K., & Ajlouni, S. (2020). Bioaccessibility of micronutrients in fresh and
frozen strawberry fruits grown under elevated carbon dioxide and temperature. Food Chemistry, 309,
125662.
[56] Kamiloglu, S., Capanoglu, E., Grootaert, C., & Van Camp, J. (2015). Anthocyanin absorption and
metabolism by human intestinal Caco-2 cells—A review. International Journal of Molecular
Sciences, 16(9), 21555-21574.
[57] Lopez de las Hazas, M. C., Mosele, J. I., Macià, A., Ludwig, I. A., & Motilva, M. J. (2017). Exploring
the colonic metabolism of grape and strawberry anthocyanins and their in vitro apoptotic effects in HT-
29 colon cancer cells. Journal of Agricultural and Food Chemistry, 65(31), 6477-6487.
[58] Manach, C., Scalbert, A., Morand, C., Rémésy, C., & Jiménez, L. (2004). Polyphenols: food sources
and bioavailability. The American Journal of Clinical Nutrition, 79(5), 727-747.
[59] Balasundram, N., Sundram, K., & Samman, S. (2006). Phenolic compounds in plants and agri-
industrial by-products: Antioxidant activity, occurrence, and potential uses. Food Chemistry, 99(1),
191-203.

International Conference on
RAW MATERIALS TO PROCESSED FOODS 03-04 June 2021, Turkey
223
Study on the Ozone Treatment Process on the Bacteria Damaging Nutritive
Fruits
Sathya, R.1, 1Showkat Ahmed, L.1, MubarakAli, D.1,2, Jung-Wan Kim2*
1School of Life Sciences, B.S. Abdur Rahman Crescent Institute of Science and Technology
Chennai – 600048, India
2Division of Bioengineering, Incheon National University, Republic of Korea
*E-mail: [email protected]
ABSTRACT
The objective of the study is to evaluate the effect of ozone treatment (OTRE) process on the bacteria
affecting fruits, apple and pomegranate in particular. In this study, ozone was given continuously for 60
min and after every 10 min of interval. Secondly, the use of ozone in cycle, where the ozonized sample was
taken after 30 min of continuous exposure followed by a 5 min break, which constituted an exposure time
for 60 min. The bacterial cell count affecting the apple was decreased from 1.5×10⁸ to 1.2×10³ CFU.mL-1
after 30 min and from 1.5×10⁸ to 80 CFU.mL-1 after 60 min. The bacterial cell count affecting
pomegranate was decreased from 1.5×10⁸ to 2.0×10³ CFU.mL-1 after 30 min and from 1.5×10⁸ to
0.9×10² CFU.mL-1 after 60 min. OTRE process is a rapid, better solution to preserve them from diseases
causing bacteria and enhance their durability against spoilage.
Keywords: Ozonation, Apples, Pomegranates, Bacteria, Colony Forming Unit
International Conference on
RAW MATERIALS TO PROCESSED FOODS 03-04 June 2021, Turkey
224
Research on Solar Water Heating Drying Plant for Drying Medicinal Plants
Shaxnoza Abduvaxitovna Sultanova*, Tojiniso Tursunboyevna Raxmanova
Tashkent state technical university, 100095, str. University 2, Tashkent, Uzbekistan
*E-mail: [email protected]; +99893 506-22-00
ABSTRACT
Scientists at TSTU have developed a solar water heating dryer. The developed solar water heating dryer
is designed for food and pharmaceutical companies to produce high-quality products - dried and
concentrated extracts of vegetables, fruits and herbs, as well as syrups, mashed potatoes and dry
concentrates with the preservation of biologically active substances and healthy ingredients based on
local raw materials. Experimental studies were performed on a laboratory solar-water convective heating
unit and curves were obtained for the duration and temperature of the drying process of medicinal plants.
Based on the results of experimental studies of the dehydration process in a laboratory unit, an
engineering methodology has been developed for calculating the design and technological parameters of
an industrial solar-water convective installation. A comparative analysis of the behavior of the
constituent extractives of medicinal plants, as well as the ash content and final moisture content of
medicinal plants under the implementation of various drying methods, was carried out.
Keywords: solar water heating dryer, medicinal plants, drying

International Conference on
RAW MATERIALS TO PROCESSED FOODS 03-04 June 2021, Turkey
225
Investigation of Gluten-free Cake Production from Poppy Seed (Papaver
somniferum L.) Pulp: TOPSİS Application
Tugba Dedebas1*, Meryem Goksel Sarac2
1Afyon Kocatepe University, Bolvadin Vocational College, Afyon, Turkey 2Sivas Cumhuriyet University, Yıldızeli Vocational College, Sivas, Turkey
*E-mail: [email protected]
ABSTRACT
Poppy seed (Papaver somniferum L.) is a widely used product whose oil is extracted by the cold press
method since seeds has high oil content. After oil extraction, poppy pulp is obtained as a waste with a high
protein content but not utilized in any way. In this study, the possibilities of using poppy seed pulp in
gluten-free cake production were investigated. For this purpose, rice flour and poppy pulp combinations
(contain of 25, 50, 75 and 100% poppy seed pulp) were prepared in the cake formulation and 4 different
cakes were produced as gluten-free. Color values, the amount of ash, dry matter and protein, volume and
symmetry index, cooking efficiency, textural and sensory properties of gluten-free cakes were determined.
As a result of the analysis, it was determined that the addition of poppy pulp decreased the L* value in the
cake samples and the cakes were darker, but addition poppy seed pulp was occurred softer cakes. On the
other hand, it was determined that the volume index values were 28, 30, 28 and 26 mm respectively, and
the cooking efficiency decreases with the addition of poppy pulp. TOPSIS method, one of the Multi-criteria
Decision Making Techniques, was applied in order to determine the most preferred cake for sensory
analysis. According to the TOPSIS model result, the most preferred sample was the cake containing 25%
poppy seed pulp. Poppy seed pulp can be used as an alternative food ingredient for food preparation.
Keywords: cake, gluten-free, poppy pulp, sensory, texture, TOPSIS
1. INTRODUCTION
Celiac patients are the individuals, who are intolerant to gluten which is a wheat protein, and they should
not consume wheat-containing products (Sicherer and Sampson 2014). The disease develops as damage in
the mucosa of the small intestine (De Arcangelis et al., 2020).
In celiac patients, the villi in the structure of intestine do not fulfill their function and the intestinal
absorption does not occur appropriately. On the other hand, in presence of gluten, also the flatulence and
digestion problems that are called gluten intolerance and develop as a result of consuming gluten-
containing foods can be seen (Yılmaz and Koca, 2020). The individuals struggling and diagnosed with
celiac disease constitute 0.6-1% of the global population (Fasano et al., 2003; Hamdani et al., 2020). Gluten
is responsible for the viscoelastic properties (Gujral & Rosell, 2004; Hamdani et al., 2020) Besides, it
is emphasized that the main structure of the products made of wheat flour is formed by gluten (Ammar et
al., 2021).
Among the wheat products, the cakes consumed as a snack are among the popular products. The market
size of cakes, which are mainly composed of flour, egg, sugar, and oil, is believed to reach 75 billion USD
in year 2023 (Xu et al., 2020). The cakes are classified according to content, shape, and baking methods. In
recent periods, producers started to produce gluten-free cakes for people with gluten sensitivity In general,
the production of gluten-free cakes is made using rice flour and the protein network doesn’t form due to
gluten deficiency (Roman et al., 2019). Studies are carried out on ensuring the optimal product formulation

International Conference on
RAW MATERIALS TO PROCESSED FOODS 03-04 June 2021, Turkey
226
and shape because cake quality problems occur in gluten-free cake production due to the lack of gluten
(Tsatsaragkou et al., 2015; Saeidi ve al., 2018; Tuta Şimşek, 2019)
Poppy (Papaver somniferum L.) plant is an industrial plant that is widely used in the food industry
(Cibulková et al., 2014). Poppy seeds are generally used in bakery food, sauce, cake, and dessert
production and oil production (López et al., 2018). On the other hand, besides their anti-cancer and anti-
tumor effects, it is known that poopy and its oil have positive effects on diabetes (Higashi and Setoguchi,
2000). Moreover, thanks to its high protein content, poppy recently became a material for products that are
enriched with herbal proteins. Poppy seeds are in form of oil, filling (bakery products), and paste
(breakfast). Poppy pulp is obtained as a result of oil production. Poopy pulp is rich in protein and dietary
fiber. Its high protein content drew interest from the aspect of the potential effects of poppy pulp on the
product formulations.
Within the scope of the present study, gluten-free cake formulation development studies were carried out
for celiac patients and individuals preferring to consume nutrient-rich products. In this study, four cakes
containing 25%, 50%, 75%, and 100% poppy pulp in their rice flour - poppy pulp mixture were prepared
and the product characteristics were determined using physicochemical, textural, and sensorial analyses.
Moreover, TOPSIS which is one of the multi-criteria decision-making methods was used in interpreting the
analysis results.
2. MATERIAL and METHODS
2.1. Material
Gluten-free rice flour, herbal oil, sugar, baking powder, egg, and vanilla used in the production of gluten-
free cake were obtained from the local stores. Poppy pulp was purchased from the companies producing
opium oil and used after grinding.
2.2. Gluten-free Cake Production
In producing the gluten-free cakes, the poppy pulp obtained as a result of cold-pressed opium oil was
mixed with rice flour at 25%, 50%, 75%, and 100% concentrations, and four different cake formulations
were prepared. In preparing the cake mixture, the cake formulation obtained from the preliminary studies
was used. For this purpose, 270 g poppy pulp and rice flour mixtures, 260 g sugar, 120 ml sunflower oil,
300 ml milk, 110 g egg, 2.5 g baking powder, and 2.5 g vanilla were used. The cake mixture was baked in
muffin mold at 180°C temperature for 25 minutes. After the baking process, the cakes were cooled and
removed from the molds.
2.3. Physicochemical Analyses
Since the poppy pulp added to the formula has high protein and dietary fiber content, ash (AOAC, 1995),
moisture (AOAC, 2005), and protein (AOAC, 1990) contents of the gluten-free cakes were determined
using the relevant formulas. Color values of the gluten-free cakes containing poppy pulp at different
concentrations were determined using a color-meter (Konica Minolta, model CR-400, Mississauga, ON,
Canada) expressed as of L*, a*, and b* values. Volume index, symmetry index, and uniformity index
values of gluten-free cakes were calculated using AACC (2000) methods.
2.4. Textural Analyses
The textural profiles of gluten-free cakes prepared using four different formulations were determined using
a textural analysis device (T.A.HD Plus Stable Micro Systems, İngiltere) with P/36R cylindrical probe. The
test configuration was set as follows: pretest speed=1 mm/s, test speed= 5 mm/s, strain rate =75%, and
strain force= 5 g. Hardness (N), cohesiveness, springiness (g.cm), gumminess and chewiness values of
gluten-free muffin cake samples were determined.
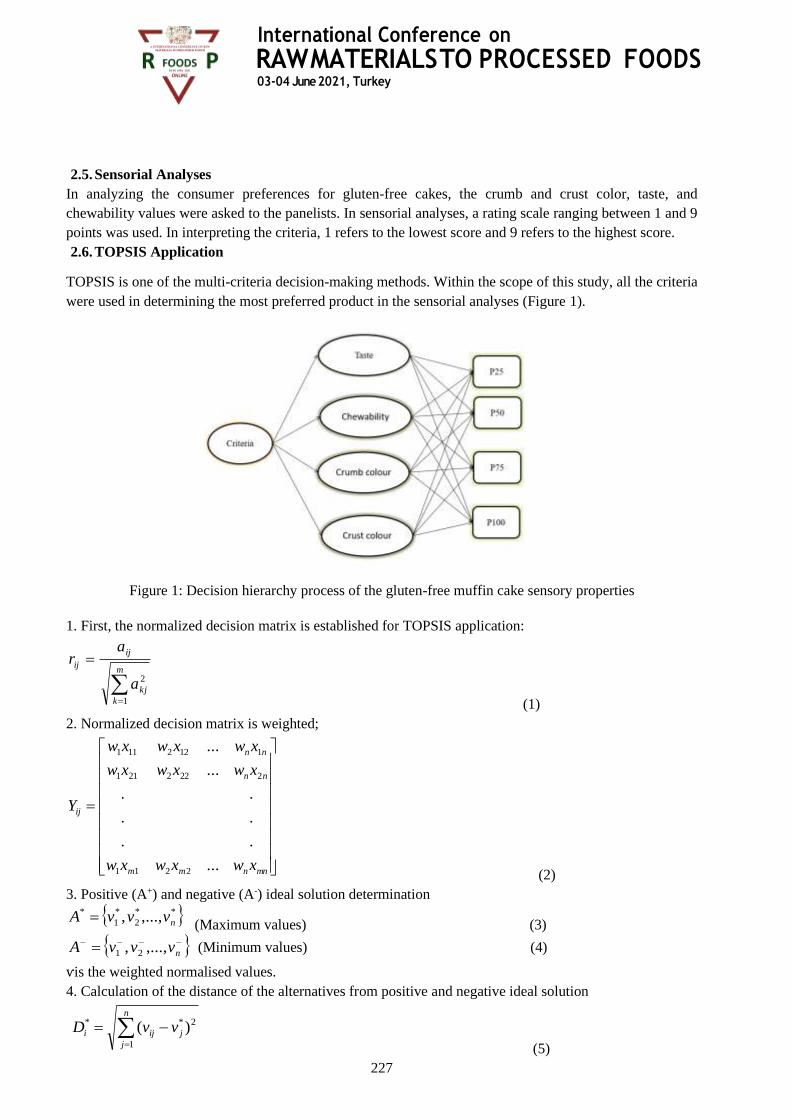
International Conference on
RAW MATERIALS TO PROCESSED FOODS 03-04 June 2021, Turkey
227
2.5. Sensorial Analyses
In analyzing the consumer preferences for gluten-free cakes, the crumb and crust color, taste, and
chewability values were asked to the panelists. In sensorial analyses, a rating scale ranging between 1 and 9
points was used. In interpreting the criteria, 1 refers to the lowest score and 9 refers to the highest score.
2.6. TOPSIS Application
TOPSIS is one of the multi-criteria decision-making methods. Within the scope of this study, all the criteria
were used in determining the most preferred product in the sensorial analyses (Figure 1).
Figure 1: Decision hierarchy process of the gluten-free muffin cake sensory properties
1. First, the normalized decision matrix is established for TOPSIS application:
=
=m
k
kj
ij
ij
a
ar
1
2
(1)
2. Normalized decision matrix is weighted;
=
mnnmm
nn
nn
ij
xwxwxw
xwxwxw
xwxwxw
Y
...
..
..
..
...
...
2211
2222211
1122111
(2)
3. Positive (A+) and negative (A-) ideal solution determination
**
2
*
1
* ,...,, nvvvA = (Maximum values) (3)
−−−− = nvvvA ,...,, 21 (Minimum values) (4)
ѵis the weighted normalised values.
4. Calculation of the distance of the alternatives from positive and negative ideal solution
=
−=n
j
jiji vvD1
2** )(
(5)
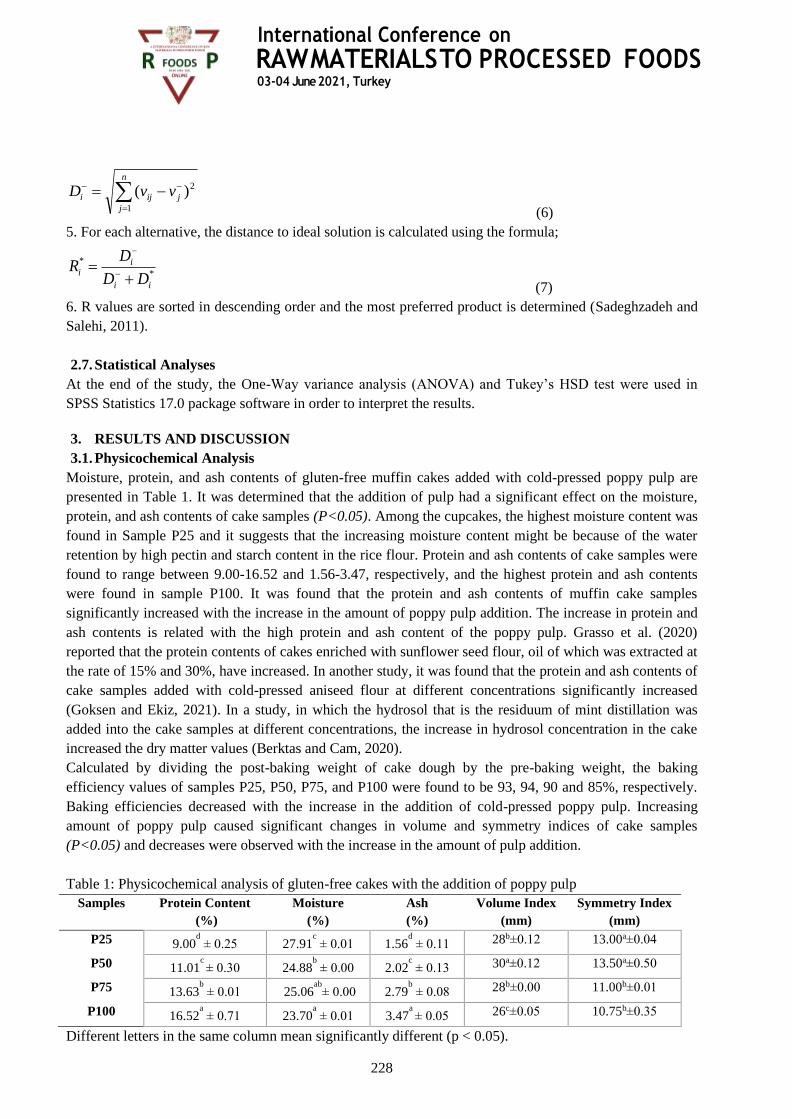
International Conference on
RAW MATERIALS TO PROCESSED FOODS 03-04 June 2021, Turkey
228
=
−− −=n
j
jiji vvD1
2)(
(6)
5. For each alternative, the distance to ideal solution is calculated using the formula;
*
*
ii
ii
DD
DR
+=
−
−
(7)
6. R values are sorted in descending order and the most preferred product is determined (Sadeghzadeh and
Salehi, 2011).
2.7. Statistical Analyses
At the end of the study, the One-Way variance analysis (ANOVA) and Tukey’s HSD test were used in
SPSS Statistics 17.0 package software in order to interpret the results.
3. RESULTS AND DISCUSSION
3.1. Physicochemical Analysis
Moisture, protein, and ash contents of gluten-free muffin cakes added with cold-pressed poppy pulp are
presented in Table 1. It was determined that the addition of pulp had a significant effect on the moisture,
protein, and ash contents of cake samples (P<0.05). Among the cupcakes, the highest moisture content was
found in Sample P25 and it suggests that the increasing moisture content might be because of the water
retention by high pectin and starch content in the rice flour. Protein and ash contents of cake samples were
found to range between 9.00-16.52 and 1.56-3.47, respectively, and the highest protein and ash contents
were found in sample P100. It was found that the protein and ash contents of muffin cake samples
significantly increased with the increase in the amount of poppy pulp addition. The increase in protein and
ash contents is related with the high protein and ash content of the poppy pulp. Grasso et al. (2020)
reported that the protein contents of cakes enriched with sunflower seed flour, oil of which was extracted at
the rate of 15% and 30%, have increased. In another study, it was found that the protein and ash contents of
cake samples added with cold-pressed aniseed flour at different concentrations significantly increased
(Goksen and Ekiz, 2021). In a study, in which the hydrosol that is the residuum of mint distillation was
added into the cake samples at different concentrations, the increase in hydrosol concentration in the cake
increased the dry matter values (Berktas and Cam, 2020).
Calculated by dividing the post-baking weight of cake dough by the pre-baking weight, the baking
efficiency values of samples P25, P50, P75, and P100 were found to be 93, 94, 90 and 85%, respectively.
Baking efficiencies decreased with the increase in the addition of cold-pressed poppy pulp. Increasing
amount of poppy pulp caused significant changes in volume and symmetry indices of cake samples
(P<0.05) and decreases were observed with the increase in the amount of pulp addition.
Table 1: Physicochemical analysis of gluten-free cakes with the addition of poppy pulp
Samples Protein Content
(%)
Moisture
(%)
Ash
(%)
Volume Index
(mm)
Symmetry Index
(mm)
P25 9.00d ± 0.25 27.91
c ± 0.01 1.56
d ± 0.11 28b±0.12 13.00a±0.04
P50 11.01c ± 0.30 24.88
b ± 0.00 2.02
c ± 0.13 30a±0.12 13.50a±0.50
P75 13.63b ± 0.01 25.06
ab± 0.00 2.79
b ± 0.08 28b±0.00 11.00b±0.01
P100 16.52a ± 0.71 23.70
a ± 0.01 3.47
a ± 0.05 26c±0.05 10.75b±0.35
Different letters in the same column mean significantly different (p < 0.05).
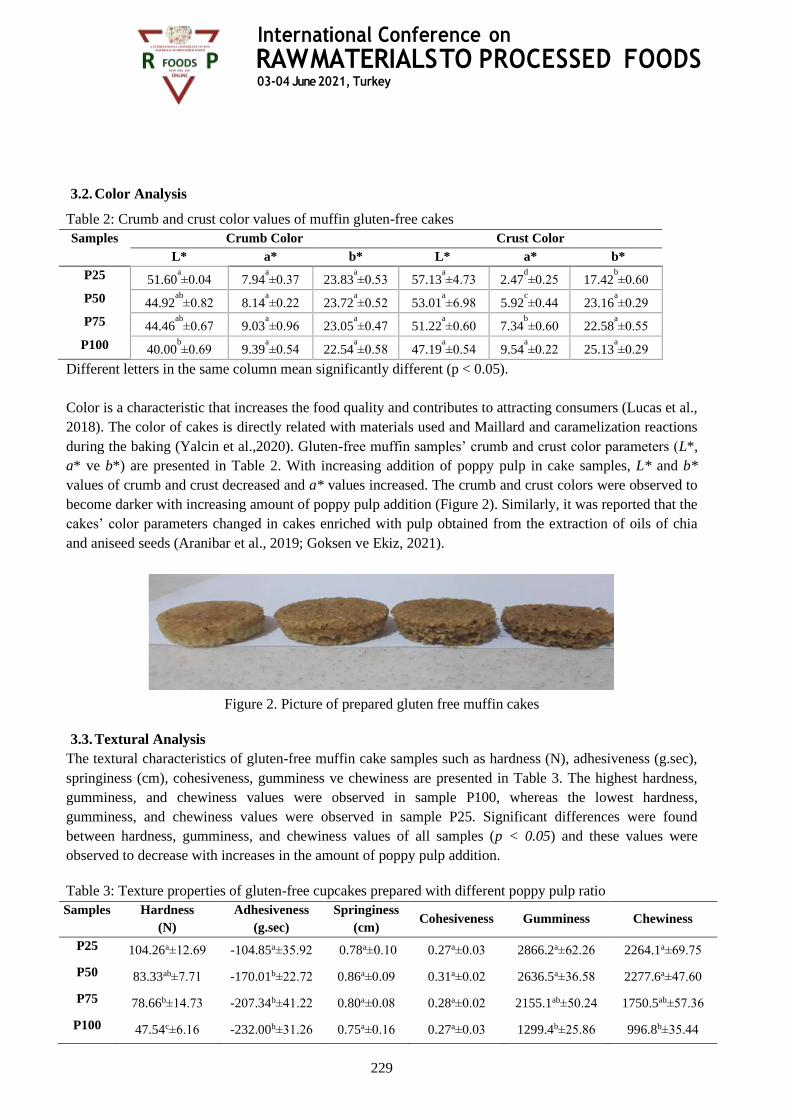
International Conference on
RAW MATERIALS TO PROCESSED FOODS 03-04 June 2021, Turkey
229
3.2. Color Analysis
Table 2: Crumb and crust color values of muffin gluten-free cakes
Samples Crumb Color Crust Color
L* a* b* L* a* b*
P25 51.60a±0.04 7.94
a±0.37 23.83
a±0.53 57.13
a±4.73 2.47
d±0.25 17.42
b±0.60
P50 44.92ab
±0.82 8.14a±0.22 23.72
a±0.52 53.01
a±6.98 5.92
c±0.44 23.16
a±0.29
P75 44.46ab
±0.67 9.03a±0.96 23.05
a±0.47 51.22
a±0.60 7.34
b±0.60 22.58
a±0.55
P100 40.00b±0.69 9.39
a±0.54 22.54
a±0.58 47.19
a±0.54 9.54
a±0.22 25.13
a±0.29
Different letters in the same column mean significantly different (p < 0.05).
Color is a characteristic that increases the food quality and contributes to attracting consumers (Lucas et al.,
2018). The color of cakes is directly related with materials used and Maillard and caramelization reactions
during the baking (Yalcin et al.,2020). Gluten-free muffin samples’ crumb and crust color parameters (L*,
a* ve b*) are presented in Table 2. With increasing addition of poppy pulp in cake samples, L* and b*
values of crumb and crust decreased and a* values increased. The crumb and crust colors were observed to
become darker with increasing amount of poppy pulp addition (Figure 2). Similarly, it was reported that the
cakes’ color parameters changed in cakes enriched with pulp obtained from the extraction of oils of chia
and aniseed seeds (Aranibar et al., 2019; Goksen ve Ekiz, 2021).
Figure 2. Picture of prepared gluten free muffin cakes
3.3. Textural Analysis
The textural characteristics of gluten-free muffin cake samples such as hardness (N), adhesiveness (g.sec),
springiness (cm), cohesiveness, gumminess ve chewiness are presented in Table 3. The highest hardness,
gumminess, and chewiness values were observed in sample P100, whereas the lowest hardness,
gumminess, and chewiness values were observed in sample P25. Significant differences were found
between hardness, gumminess, and chewiness values of all samples (p < 0.05) and these values were
observed to decrease with increases in the amount of poppy pulp addition.
Table 3: Texture properties of gluten-free cupcakes prepared with different poppy pulp ratio
Samples Hardness
(N)
Adhesiveness
(g.sec)
Springiness
(cm) Cohesiveness Gumminess Chewiness
P25 104.26a±12.69 -104.85a±35.92 0.78a±0.10 0.27a±0.03 2866.2a±62.26 2264.1a±69.75
P50 83.33ab±7.71 -170.01b±22.72 0.86a±0.09 0.31a±0.02 2636.5a±36.58 2277.6a±47.60
P75 78.66b±14.73 -207.34b±41.22 0.80a±0.08 0.28a±0.02 2155.1ab±50.24 1750.5ab±57.36
P100 47.54c±6.16 -232.00b±31.26 0.75a±0.16 0.27a±0.03 1299.4b±25.86 996.8b±35.44

International Conference on
RAW MATERIALS TO PROCESSED FOODS 03-04 June 2021, Turkey
230
Different letters in the same column mean significantly different (p < 0.05).
3.4. Sensorial Analysis
The sensorial analysis results of gluten-free muffin cake samples’ taste, chewability, and crumb and crust
colors are illustrated in Figure 3 using spider-web diagram. With an increase in the amount of poppy pulp
addition, the most preferred sample in terms of crumb and crust color and taste was found to be sample
P100. From the aspect of chewability, samples P25 and P50 were found to be the most preferred samples.
Increasing amount of pulp addition caused a decrease in chewability. According to the sensorial analysis
results, it was proven that added functional muffins were preferable in terms of crust color and taste.
Figure 3: Sensory attributes of muffins
3.5. TOPSIS Application
Obtained from the TOPSIS application used for sensorial analyses of gluten-free cakes, the positive and
negative distance and the R values used in sorting are presented in Table 4.
Table 4: Distance from positive (D+), negative (D−) and ratio values of each alternative for technique for
order preference by similarity to ideal solution (TOPSIS) techniques
In TOPSIS analysis, the highest R value refers to the most preferred product. Considering all the criteria,
the most preferred product after the weighting was found to be the sample P25, followed by P50, P75, and
Alternative D+ D- R
P25 0.01 0.09 0.86
P50 0.06 0.04 0.36
P75 0.09 0.02 0.16
P100 0.09 0.02 0.15
International Conference on
RAW MATERIALS TO PROCESSED FOODS 03-04 June 2021, Turkey
231
P100.
4. CONCLUSION
In this study, poppy pulp was added into rice flour, which is used in gluten-free cake production, at
different concentrations. Poppy pulp is a product that has high protein content and is rich in nutrients.
Protein content of gluten-free cakes increased with the increase in the amount of pulp. Since the poppy pulp
is a dark-colored material, the color values of cakes changed with increasing amount of poppy pulp
addition. On the other hand, softer cakes were obtained with increasing amount of pulp addition and
volume and symmetry indices were observed to decrease. As a result of TOPSIS assessment after the
sensorial analysis, the most preferred sample was found to be P25. Especially for their high protein content,
the poppy pulps used in the present study was found to be an important additive for supporting the foods
consumed by individuals having special nutrition preferences, especially the celiac patients. Poppy pulp
can be used in production of different gluten-free products together with alternative product raw materials
and the effects can be investigated by experimentally investigating the product formulations of other food
groups.
5. REFERENCES
1. AACC. (2000). Approved methods of the American Association of Cereal Chemists (10th ed.). St.
Paul, MN: Author. Methods: 10–91, 44–19, 46–13, 55–30, 56–11.
2. Ammar, I., Gharsallah, H., Brahim, A.B., Attia, H., Ayadi, M.A., Hadrich, B., Imène Felfoul, I.,
(2021). Optimization of gluten‐free sponge cake fortified with whey protein concentrate using mixture
design methodology. Food Chemistry, 343, 128457.
3. Aranibar, C., Aguirre, A., Borneo, R., (2019). Utilization of a by-product of chia oil extraction as a
potential source for value addition in wheat muffins. Journal of Food Science Technology, 56(9),
4189–4197.
4. AOAC. (1990). International: Official methods of analysis (15th ed.). Washington, DC: AOAC
International.
5. AOAC. (1995). Official methods of analysis. Association of official analytical chemists. Official
methods, 985.14. Gaithersburg, MD.
6. AOAC Official Method 930.15. (2005). Official methods of analysis of AOAC international (18th
ed.). AOAC International.
7. Berktaş, S., Çam, M. (2020). Nane (Mentha piperita L.) distilasyonundan arta kalan hidrosolün kek
üretiminde değerlendirilmesi. Harran Tarım ve Gıda Bilimleri Dergisi, 24(1): 17-25. DOI:
10.29050/harranziraat.590827
8. Cibulková, Z., Čertík, M., Dubaj, T., (2014). Thermooxidative stability of poppy seeds studied by non-
isothermal DSC measurements. Food Chemistry, 150, 296-300.
9. De Arcangelis, E., Cuomo, F., Trivisonno, M.C., Marconi , E., Messia, M.C., (2020). Gelatinization
and pasta making conditions for buckwheat gluten-free pasta. Journal of Cereal Science, 95,103073.
10. Fasano, A., Berti, I., Gerarduzzi, T., Not, T., Colletti, R.B., Drago, S., Elitsur, Y., Green, P.H.R.,
Guandalini, S., Hill, I.D., Pietzak, M., Ventura, A., Thorpe, M., Kryszak, D., Fornaroli, F.,
Wasserman, S.S., Murray, J.A., Karoly Horvath, K., (2003). Prevalence of celiac disease in at-risk and
not-at-risk groups in the United States: A large multicenter study. Archives of Internal Medicine, 163,
286–292.
11. Gökşen, G., Ekiz, H.İ., (2021). Use of aniseed cold-pressed by-product as a food ingredient in muffin
formulation. LWT—Food Science and Technology, 148, 111722.
International Conference on
RAW MATERIALS TO PROCESSED FOODS 03-04 June 2021, Turkey
232
12. Grasso, S., Liu, S., Methven, L., (2020). Quality of muffins enriched with upcycled defatted sunflower
seed flour. LWT—Food Science and Technology, 119, 108893.
13. Gujral, H. S., Haros, M., Rosell, C. M. (2004). Improving the texture and delaying staling in rice flour
chapati with hydrocolloids and α-amylase. Journal of Food Engineering, 65, 89–94.
14. Higashi, S., Setoguchi, T., (2000). Hepatic arterial injection chemotherapy for hepatocellular
carcinoma with epirubicin aqueous solution as numerous vesicles in iodinated poppy-seed oil
microdroplets: clinical application of water-in-oil-in-water emulsion prepared using a membrane
emulsification technique. Advanced Drug Delivery Reviews, 45 (1), 57-64.
15. López, P., Pereboom-de Fauw, D.PKH., Mulder, P.P.J., Spanjer, M.,de Stoppelaar, J., Mol, H.G.J., de
Nijs, M., (2018). Straightforward analytical method to determine opium alkaloids in poppy seeds and
bakery products, Food Chemistry, 242, 443-450.
16. Lucas, B.F., de Morais, M.G., Santosa, T.D., Costaa, J.A.V., (2018). Spirulina for snack enrichment:
Nutritional, physical and sensory evaluations. LWT - Food Science and Technology 90, 270–276.
17. Roman, L., Belorio, M., Gomez, M., (2019). Gluten-free breads: the gap between research and
commercial reality. Comprehensive Reviews in Food Science and Food Safety, 18 (3), 690-702.
18. Sadeghzadeh, K., Salehi, M.B., (2011). Mathematical analysis of fuel cell strategic technologies
development solutions in the automotive industry by the TOPSIS multi-criteria decision making
method. International Journal of Hydrogen Energy, 36(20), 13272-13280.
19. Saeidi, Z., Nasehi, B., Jooyandeh, H., (2018). Optimization of gluten-free cake formulation enriched
with pomegranate seed powder and transglutaminase enzyme. Journal of Food Science Technology,
55, 3110–3118.
20. Scott, H., Sicherer, M., Hugh, A., Sampson M.D.,(2014). Food allergy: Epidemiology, pathogenesis,
diagnosis, and treatment. Journal of Allergy and Clinical Immunology, 133, 291-307.
21. Tuta Şimşek, S., (2019). Vacuum-combined baking to enhance quality properties of gluten-free cake:
Multi-response optimization study. LWT—Food Science and Technology, 116, 108557.
22. Tsatsaragkou, K., Papantoniou, M., Mandala, İ., (2015). Rheological, physical, and sensory attributes
of gluten‐free rice cakes containing resistant starch Journal of Food Science Technology, 80 (2), E341-
E348, 1-9.
23. Yalcin, E., Ozdal, T., Gok, I., (2021). Investigation of textural, functional, and sensory properties of
muffins prepared by adding grape seeds to various flours. Journal of Food Processing and
Preservation, 00:e15316,
24. Yılmaz, V.A., Koca, İ., (2020). Development of gluten-free corn bread enriched with anchovy flour
using TOPSIS multi-criteria decision method. International Journal of Gastronomy and Food Science,
22, 100281.
25. Xu, J., Zhang, Y., Wang, W., Li, Y., (2020). Advanced properties of gluten-free cookies, cakes, and
crackers: A review. Trends in Food Science & Technology, 103, 2020, Pages 200-213.
International Conference on
RAW MATERIALS TO PROCESSED FOODS 03-04 June 2021, Turkey
233
Investigation of Sensorial and Physicochemical Properties of Yoghurt Colored
with Phycocyanin of Spirulina platensis
Rıdvan ARSLAN1, Salih AKSAY1*
1Department of Food Engineering, Mersin University, TURKEY
*E-mail: [email protected]
ABSTRACT
Pigments obtained from microalgae, which can be used as food and food additives thanks to their rich
nutritional content, are used as colorants in many foods. In this study, the sensorial and physicochemical
properties of yoghurt colored with phycocyanin from Spirulina platensis were investigated. Spirulina in
three different concentrations (0.5%, 1.0% and 1.5% and a control without Spirulina) was added to the milk
used for yoghurt, and phycocyanin pigment has been transferred to the milk. Then, the sensorial properties
(appearance, color, flavor and general acceptability), general composition (moisture, protein, fat,
carbohydrate and ash content) and color values (L*, a*, b*, ΔE, Chroma, h°) of yoghurt produced were
measured. The highest sensory score of preference was obtained by 0.5% Spirulina added colored yoghurt.
Protein content of colored yoghurt increased in proportionally with added Spirulina powder and was
measured as 29.25 g/100g DM in 0.5% Spirulina added yogurt. Increase in Spirulina content, it caused
decrease in L*, a* and b* values and increase in ΔE value. L*, a*, b*, ΔE, Chroma and h° values of
yoghurt colored with 0.5 % Spirulina were measured as 76.86, -5.29, -3.23, 13.45, 4.64 and 0.55,
respectively. Overall, it can be concluded that Spirulina can be used to enrich yoghurt as a natural
functional ingredient due to its high nutrient and pigment content.
Keywords: Spirulina platensis, Yoghurt, Phycocyanin, Physicochemical properties, Sensory properties

International Conference on
RAW MATERIALS TO PROCESSED FOODS 03-04 June 2021, Turkey
234
Purification and Charecterisation of Polyphenoloxidase from Myrtle Berries
(Myrtus Communis L.)
Fırat Çınar1, Salih Aksay1
1Department of Food Engineering, Engineering Faculty, Mersin University, Mersin, Turkey
*E-mail: [email protected]
ABSTRACT
Myrtle (Myrtus communis L.) is belonging to the family of Myrtaceae and is mostly distributed in
Mediterranean Region and is also called as “Murt”, “Hambeles” or “adi mersin” in Turkey. While fruit is
white and pulpy at the beginning of maturity ripened fruit can turn into blue-black color. Browning reaction
because of polyphenol oxidase (PPO) can be observed in plant that is rich in phenolic substances. In this
study, optimum temperature, optimum pH, substrate spesifity, thermal stability of polyphenol oxidase
partially purified from white myrtle berries and effect of inhibitors on enzyme activity was investigated.
Cathechol was used as substrate. Optimum pH and temperature were found as 6.8 and 30 °C respectively
for myrtle PPO while Km and Vmax values were calculated as 3.34 mM and 4.1 unit. In thermal
inactivation studies at 60, 70, and 80 °C reaction rate constants (k) were found as 0.0282, 0.526 and 0.1117
minute-1, thermal half-life times (t1/2) were calculated as 24.6, 13.2 and 6.2 minute, and decimal reduction
time (D-value) were calculated as 81.6, 43.8 and 20.6 minute, respectively. Activation energy (Ea) and Z-
value were calculated as 67.2 kj.mol-1 and 33.4C, respectively. Similar inactivation ratios from 40 % to
100 % were observed for both inhibitors of ascorbic acid and disulphite at 0.01-10 mM concentration.
Keywords: Myrtus Communis L., Polyphenol Oxidase, Kinetic Parameters, Thermal Stability, Purification
Acknowledgment: This study was supported by the Research Fund of Mersin University in Turkey with
Project Number: 2017-2-TP2-2604.

International Conference on
RAW MATERIALS TO PROCESSED FOODS 03-04 June 2021, Turkey
235
The Effects of Ultraviolet Light Application on the Quality of Kaymak (Clotted
Cream) During Storage Period
Gamze Sonkaya1, Müge Urgu-Öztürk1, Gülten Tiryaki Gündüz1, Duygu Kışla1, Sevcan Ünlütürk2,
Nurcan Koca1*
1Ege University, Engineering Faculty, Food Engineering Department, 35100, Izmir, Turkey
2Izmir Institute of Technology, Food Engineering Department, 35430, Izmir, Turkey
*E-mail: [email protected]
ABSTRACT
Ultraviolet light (UV-C) application, one of the non-thermal technology, finds widespread use in the dairy
industry to provide safety and extend shelf life. It can be considered as an effective method for controlling
post-processing contamination by surface application in dairy products. Kaymak, a traditional Turkish
cream, can be contaminated with undesirable microorganisms especially during the hardening process
carried out at ambient conditions. This study aimed to determine the effects of UV-C light application on
the quality changes of kaymak during the storage period. The surfaces of samples were exposed to UV-C
light from 20 cm height and at 0.8, 1.6 and 3.2 m/min band speeds (equaled to 1.419, 2.797, 5.697 kJ/m2
doses, respectively) using a specially designed continuous UV-C disinfection system. Also, control sample
not treated with light was used for comparison. pH values of samples decreased whereas titratable acidity
increased during the storage period which could be due to the lactic acid fermentation. The slight changes
in the color parameters (L*, a* and b* values) affected by UV-C light application and storage period were
obtained, which were not noticeable by the eye. The degree of lipid oxidation (both peroxide and
thiobarbituric acid reactive substances) significantly increased with the application of high UV-C light
doses, as well as the storage time. UV-C application decreased the visible mold and yeast growth on the
surface of kaymak samples compared to the control samples. The off-flavour perceived in the highest UV
light dose did not change during storage. As a result, UV-C light can be used to reduce the mold and yeast
growth and extend the shelf life of kaymak, but it accelerates the oxidative potential and the off-flavor
perception. Therefore, applied light doses should be selected considering the sensorial and oxidative
aspects of high-fat dairy products before the industrial application.
Keywords: UV-C Light, Kaymak, Lipid Oxidation, Sensory Aspects
Acknowledgment: The authors are grateful for the financial support provided for the project 117O294 by
the Scientific and Technological Research Council of Turkey (TUBITAK)
International Conference on
RAW MATERIALS TO PROCESSED FOODS 03-04 June 2021, Turkey
236
A Sensory Observation for Cold Stored Beef Steak and Norway Salmon
Zafer Ceylan1*, Oktay Tomar2, Abdullah Çağlar2, Turgay Çetinkaya3
1 Department of Gastronomy and Culinary Arts, Faculty of Tourism, Van Yüzüncü Yıl University, 65000, Van, Turkey 2 Faculty of Agriculture, Kocaeli University, 41285, Kocaeli, Turkey
3 Food Processing Department, Armutlu Vocational School, Yalova University, 77500, Yalova, Turkey
*E-mail: [email protected]
ABSTRACT
Cold preservation is one of the conventional methods that protect red meat and fish meat for longer shelf
life. In this regard, storage in refrigeration temperature is a critical cold preservation way for meat hygiene
and safety. Some quality parameters such as total mesophilic bacteria count, pH, total volatile basic
nitrogen, or trimethylamine values can be investigated to estimate the shelf life of meat during cold storage.
On the other, after purchasing the meat products, consumers can also evaluate sensory properties like odor,
color, and texture in a short time to observe physical quality changes. For this reason, this study, it is aimed
to determine sensory changes of beefsteak and Norway salmon products every 6 hours from the initial hour
at refrigerated temperature (4±2°C). According to overall acceptability scores, beefsteak and Norway
salmon samples were defined as unacceptable at 72nd and 60th hours which are supported by visual
photographs. Results of this study showed that consumers may gain knowledge regarding color, odor, and
textural changes in course of time and average storage period of these two cold stored products.
Keywords: Beef Steak, Norway Salmon, Sensory Analysis, Odor, Color, Texture
INTRODUCTION
Meat and meat products have an important place in health and nutrition. With an increase in the human
population, demand for this kind of product has been also increasing. In terms of popular meat products,
consumption of red meat and fish meat is of great importance to ensure a healthy and balanced diet (Tosun
and Demirbaş, 2012). Steak is generally sliced boneless piece of red meat with high protein, which often
grilled or pan-fried. On the other hand, salmon is a healthy fish with polyunsaturated fatty acids, special
carotenoid pigment astaxanthin, and vitamin D. (Haq et al. 2017). Although fish meat can spoil more
quickly than red meat regardless of the type of meat, food safety must be ensured from slaughtering or
harvesting to the fork. Food safety can be defined as a set of measures taken to prevent physical, chemical,
biological, and all kinds of damages to food (Anonymous, 2004; Ceylan et al., 2021). To ensure food
safety for raw food, different preservation methods are generally applied. In these methods, cold
preservation is one of the most widely used methods (Maddock, 2012; Xiong 2017; Ceylan et al. 2021).
Although cold preservation increases the shelf life, it also has limited time to protect the meat. When meat
shelf-life is going to be expired, spoilage is going to have occurred. The spoilage is caused by the microbial
growth in meat by bacteria, resulting in the release of metabolites. Such as volatile organic compounds
alcohols, aldehydes, ketones, fatty acids, esters, and sulfur compounds. Volatile organic compounds formed
as a result of microbial growth during meat storage cause odor and when their concentration increases
significantly, which can draw the product below the sensory acceptable level (Soncin et al. 2007; Casaburi
et al., 2015; Ceylan et al. 2021). In this respect, sensory evaluation of meat products is a significant
parameter to understand freshness and estimate if it should be consumed. For his reason, in this study
characteristic change of two raw products (beef steak and Norway salmon) in terms of odor, texture, color,

International Conference on
RAW MATERIALS TO PROCESSED FOODS 03-04 June 2021, Turkey
237
and overall acceptability scores has been investigated to estimate shelf life.
MATERIAL AND METHODS
Beefsteak and Norway salmon samples were obtained from an international supermarket in Istanbul. They
were stored at refrigerated conditions (4±2°C) and were analyzed per 6 hours until the sensory scores
reached low values. To reveal consumer awareness at home conditions, sensory properties were
investigated in terms of odor, texture, color, and overall acceptance. Sensory scores were applied between
0-9 points and 4 points were accepted as the limit value for the rejection (Ceylan et al., 2018). Furthermore,
changes in course of time were supported by using visual photographic images. Collected data were
subjected to analysis of variance (ANOVA) to determine the sensory quality changes. GraphPad Prism
software (California Corporation, USA) was applied to reveal significant differences between groups by
ANOVA. Once a significant (p<0.05) main effect was obtained, the mean values of the samples were
further analyzed using Tukey’s multiple range comparison tests.
RESULT AND DISCUSSION
Beef Steak
One of the most important parameters in determining the quality of red meat is the initial quality of the raw
material. In Figure 1, the overall acceptability evaluation of steak samples every 6 hours can be seen from
statistical results. On the initial day of the experimental period odor, color, texture scores were found to be
8.94, 8.98, and 8.96, respectively (all data not shown). Furthermore, the overall acceptability on the initial
day was 8.98. The overall score values were >8 in the first 24 hours (p>0.05). Although there is a slight
decrease, high scores showed the freshness of the product. After the 30th hour, overall scores values
decreased faster, and statistically significant differences were observed (p<0.05). On hours 60th, 66th,
72nd, and 78th overall scores were 4.62, 4.06, 3.84, and 3.46, respectively. The beef steak was observed as
unacceptable with 3.84 scores at the 72nd hour of the storage period (p<0.05). On the other hand, odor,
color, and texture were defined as 4.62, 3.46, and 3.86 at the 72nd hour, respectively.
Figure 1: Statistical overall acceptability score results of steak in every 6 hours.
All Pairs Tukey-Kramer test results and visual photographs of steak with initial, and 78th-hour photographs
are presented in Figure 2. As could be seen from the Figure steak had bright, shining pinky color with
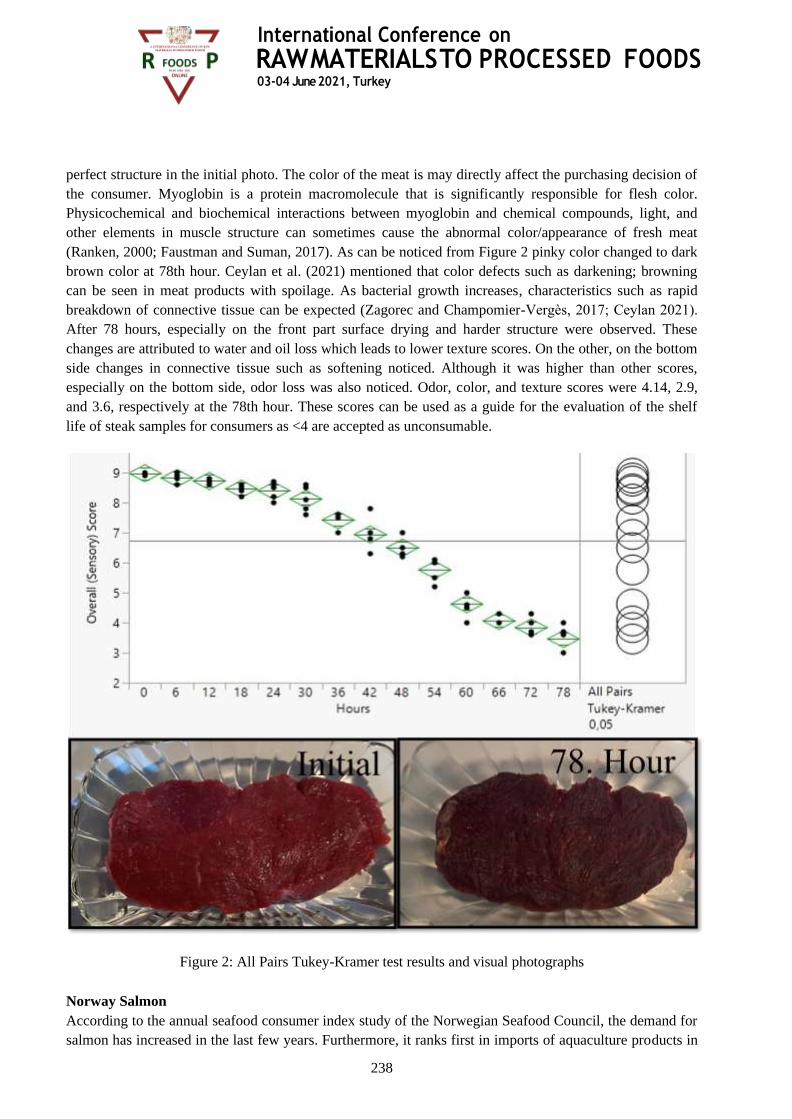
International Conference on
RAW MATERIALS TO PROCESSED FOODS 03-04 June 2021, Turkey
238
perfect structure in the initial photo. The color of the meat is may directly affect the purchasing decision of
the consumer. Myoglobin is a protein macromolecule that is significantly responsible for flesh color.
Physicochemical and biochemical interactions between myoglobin and chemical compounds, light, and
other elements in muscle structure can sometimes cause the abnormal color/appearance of fresh meat
(Ranken, 2000; Faustman and Suman, 2017). As can be noticed from Figure 2 pinky color changed to dark
brown color at 78th hour. Ceylan et al. (2021) mentioned that color defects such as darkening; browning
can be seen in meat products with spoilage. As bacterial growth increases, characteristics such as rapid
breakdown of connective tissue can be expected (Zagorec and Champomier-Vergès, 2017; Ceylan 2021).
After 78 hours, especially on the front part surface drying and harder structure were observed. These
changes are attributed to water and oil loss which leads to lower texture scores. On the other, on the bottom
side changes in connective tissue such as softening noticed. Although it was higher than other scores,
especially on the bottom side, odor loss was also noticed. Odor, color, and texture scores were 4.14, 2.9,
and 3.6, respectively at the 78th hour. These scores can be used as a guide for the evaluation of the shelf
life of steak samples for consumers as <4 are accepted as unconsumable.
Figure 2: All Pairs Tukey-Kramer test results and visual photographs
Norway Salmon
According to the annual seafood consumer index study of the Norwegian Seafood Council, the demand for
salmon has increased in the last few years. Furthermore, it ranks first in imports of aquaculture products in

International Conference on
RAW MATERIALS TO PROCESSED FOODS 03-04 June 2021, Turkey
239
Turkey. Therefore, consumers should pay attention to shelf life during storage. Cold preservation is the
most simple and common way to increase shelf life (Gram and Huss, 1996). On the initial day of the
experimental period odor, color, texture scores were found to be 8.94, 8.96, and 8.94, respectively (all data
not shown). The initial overall acceptability score found as 8.92 and changes every 6 hours can be seen in
Figure 3. During cold preservation storage, overall scores decreased slowly in the first 30 hours (p<0.05).
However, from the 36th hour to the 60th hour there was a ~3.4 point decrease (p>0.05). Norway salmon
was observed as unacceptable with 3.82 scores at the 60th hour of the storage period (p<0.05). Compared
to beef steak, there was a 12-hour difference in terms of acceptability. On the other hand, odor, color, and
texture scores were defined as 4.22, 3.94, and 3.9 at the 60th hour.
Figure 3: Statistical overall acceptability score results of Norway salmon in every 6 hours
All Pairs Tukey-Kramer test results and visual photographs of Norway salmon with initial, and 66th-hour
photographs are presented in Figure 4. The skin color of fish is an important quality indicator and affects
purchase decisions, because consumers initially accept or reject food based on its color (Unal Sengör et al.,
2019). Shining color with fat streaks in the initial photo showed that the sample was fresh and had a high
color score (8.96). Color changes of the skin of the fish can be evaluated to identify the freshness of the
product (Unal Sengör et al., 2019). With a closer look at the image at the right, a color change is clearly
noticeable after the 60th hour. This showed that there is a color deterioration with decreasing freshness.

International Conference on
RAW MATERIALS TO PROCESSED FOODS 03-04 June 2021, Turkey
240
Figure 4: All Pairs Tukey-Kramer test results and visual photographs
Salmon oil contains 75% triglycerides as the main ingredient, 17% diglycerides, and monoglycerides as
minor ingredients. Overall, monounsaturated fatty acids (MUFA) and polyunsaturated fatty acids (PUFA)
are reported to be 44% and 34%, respectively (Cascant et al. 2018). So Norway salmon can be considered
with a high rate of fat. After 60 hours oil loss noticed which also resulted in drying on the skin on the front
side. Texture scores significantly decreased with drying. Odor loss and defects have also occurred with
degradation. This may result from the presence of various volatile compounds and their combinations.
When biogenic amine production and gas formation starts to increase, the formation of bad odor can be
observed (Zagorec and Champomier-Vergès, 2017; Ceylan 2021). Odor, color, and texture scores were
3.62, 3.42, and 3.4, respectively at the 66th hour.
CONCLUSION
Odor, color, and texture parameters for the consumers come to the fore to estimate the shelf life of the
product. Microbial growth may lead to the sensory deterioration of steak and salmon products. In this case,
it affects the consumer's liking and may also create some defects in terms of food safety. Therefore, the
importance of household applications for beefsteak and Norway salmon presented in this study. Sensory
evaluation of these products is examined by odor, color, texture scores at refrigeration temperature. From
International Conference on
RAW MATERIALS TO PROCESSED FOODS 03-04 June 2021, Turkey
241
the initial day, samples were scored and photographed until they reach the unacceptable score of 4. Results
showed that beefsteak had higher scores compared to Norway salmon and was accepted as consumable at
66th hour. However, Norway salmon was evaluated as inconsumable on the 60th hour. Color change, oil
sealing, drying on the surface can be seen clearly by visual photography at the end of storing time.
Furthermore, a bad odor (3.62 on 66th hour) has been observed lower side of Norway salmon. For the steak
drying on surface and color darkening observed on the surface of the product when compared to the initial
time. The results of this study provided an important idea about the shelf life of these two product products.
REFERENCES [1] Tosun, D., Demirbaş, N., (2012). Türkiye'de Kırmızı Et ve Et Ürünleri Sanayiinde Gıda Güvenliği
Sorunları ve Öneriler. Uludağ Üniversitesi Ziraat Fakültesi Dergisi, 26, 93-102.
[2] Haq, M., Getachew, A.T, Saravana, P.S., Cho, Y-J., Park, S-K., Kim, M-J., et al. Effects of process
parameters on EPA and DHA concentrate production from Atlantic salmon by-product oil:
Optimization and characterization. Korean Journal of Chemical Engineering. 34, 2255-64.
[3] Ceylan, Zafer., Yaman, Mustafa., Çetinkaya, Turgay. Et ve Et Ürünleri, Sağlıklı Mutfak, Detay
Yayıncılık, Ankara, 2021.
[4] Anonim., (2004). T.C. Resmi Gazete, Gıdaların Üretimi, Tüketimi ve Denetlenmesine Dair Kanun
Hükmünde Kararnamenin Değiştirilerek Kabulü Hakkında Kanun. Kanun No: 5179.
[5] Maddock, R., Meat and Meat Products. in: H. Y.H. (Ed.), Handbook of Meat and Meat Processing,
Edited by Y. H. Hui, CRC Press, 6000 Broken Sound Parkway NW, Suite 300, Boca Raton, Florida,
2012.
[6] Xiong, Y.L. The Storage and Preservation of Meat: I-Thermal Technologies. in: Lawrie’s Meat
Science: Eighth Edition, Woodhead Publishing, Edited by Fidel Toldrá, Abington Hall, Abington,
Cambridge, CB1 6AH, England, 2012.
[7] Casaburi, A., Piombino, P., Nychas, G.J., Villani, F., Ercolini, D., (2015). Bacterial populations and the
volatilome associated to meat spoilage. Food Microbiology, 45, 83–102.
[8] Soncin, S., Chiesa, L.M., Cantoni, C., Biondi, P.A., (2007). Preliminary study of the volatile fraction in
the raw meat of pork, duck and goose. Journal of Food Composition and Analysis, 20, 436–439.
[9] Ceylan, Z., Unal Sengor, G. F., Basahel, A., Yilmaz, M. T., (2018). Determination of quality
parameters of gilthead sea bream (Sparus aurata) fillets coated with electrospun nanofibers. Journal of
Food Safety. 38, e12518.
[10] Ranken, M.D. Handbook Of Meat Product Technology. Blackwell Science Ltd, Oxford, London,
2000.
[11] Faustman, C., Suman, S.P., The Eating Quality of Meat: I-Color. in: Lawrie’s Meat Science: Eighth
Edition, Woodhead Publishing, Edited by Fidel Toldrá, Abington Hall, Abington, Cambridge, CB1
6AH, England, 2017.
[12] Zagorec, M., Champomier-Vergès, M.C. Meat Microbiology and Spoilage. in: Lawrie’s Meat
Science: Eighth Edition, Woodhead Publishing, Edited by Fidel Toldrá, Abington Hall, Abington,
Cambridge, CB1 6AH, England, 2017.
[13] Gram, L., Huss, H. H., (1996). Microbiological spoilage of fish and fish products. International
journal of food microbiology, 33, 121-137.
[14] Ünal Şengör, G. F., Balaban, M. O., Topaloğlu, B., Ayvaz, Z., Ceylan, Z., Doğruyol, H., (2019).
Color assessment by different techniques of gilthead seabream (Sparus aurata) during cold
storage. Food Science and Technology, 39, 696-703.

International Conference on
RAW MATERIALS TO PROCESSED FOODS 03-04 June 2021, Turkey
242
[15] Cascant MM, Breil C, Fabiano-Tixier AS, Chemat F, Garrigues S, de la Guardia M., (2018).
Determination of fatty acids and lipid classes in salmon oil by near infrared spectroscopy. Food
chemistry. 239, 865-871.
International Conference on
RAW MATERIALS TO PROCESSED FOODS 03-04 June 2021, Turkey
243
Optimization of Tray Dryer Drying Parameters of Hacıhaliloğlu Apricot Using
Response Surface Methodology
Hamza Bozkir1*, Ahsen Rayman Ergün2, Asuman Adali2, Mehmet Güldane1
1Sakarya University of Applied Sciences, Food Processing Department, Pamukova Vocational School, Sakarya,
TURKEY 2Ege University, Engineering Faculty, Food Engineering Department, Izmir, TURKEY
*E-mail: [email protected], [email protected]
ABSTRACT
Drying of fruits and vegetables reduces storage, packaging, and transport costs, making them
microbiologically and chemically more stable. This study aimed to investigate the effects of drying
temperature and air velocity on some quality characteristics of apricot. The drying parameters were
optimized response surface methodology. Pretreatments were performed at temperatures of 60, 70, and
80°C and air velocity of 1, 1.5, and 2 m/s with a face-centered composite design. Total phenolic content,
total carotenoid content, pH, total titratable acidity, bulk density, and color values of dried apricot were
determined. Changes in the drying rate, rehydration capacity and L* values in response to independent
variable parameters were evaluated. The optimum drying conditions (75.18°C and 2.0 m/s) were
experimentally verified. As a result, the drying rate and rehydration capacity of apricot increased depending
on the increase in temperature and air velocity. In addition, low temperature and low air velocity values
caused a significant decrease in lightness. The optimum conditions provided better preservation of the
parameters (drying rate, rehydration, L*) studied to commercialize dried apricots.
Keywords: Dried apricot, Lightness, Drying rate, Response surface methodology, Tray dryer
International Conference on
RAW MATERIALS TO PROCESSED FOODS 03-04 June 2021, Turkey
244
Production of Orange Juice Concentrate Using Conventional and Microwave
Vacuum Evaporation: Thermal Degradation Kinetics of Bioactive Compounds
and Color Values
Hamza Bozkir1*, Yeliz Tekgül2
1Sakarya University of Applied Sciences, Food Processing Department, Pamukova Vocational School, Sakarya,
TURKEY 2Aydın Adnan Menderes University, Food Processing Department, Kösk Vocational School, Aydın, TURKEY
*E-mail: [email protected]
ABSTRACT
This study aimed to concentrate orange juice using the microwave vacuum evaporation and the rotary
evaporation at different absolute pressures (20, 31, and 47 kPa) and investigate the effects of different
concentration techniques on degradation kinetics of vitamin C, total phenolic content, total carotenoid
content, and color values. The microwave vacuum evaporation significantly raised the evaporation rate
compared to the rotary evaporation. It was determined that the microwave vacuum evaporation and the
rotary evaporation at 80°C required 21 and 42 min, respectively. Total soluble solid changes during the
microwave vacuum evaporation and the rotary evaporation processes were fitted to six different empirical
models with R2 range between 0.915 and 0.998. The results showed that degradation rate constants for
vitamin C, total phenolic content, and total carotenoid content of orange juices concentrated using the
rotary evaporation were higher significantly than the microwave vacuum evaporation. It was determined
that the degradation rate constants of the L*, a*, b*, and ∆E orange juices concentrated using the
microwave vacuum evaporation were lower than the rotary evaporation.
Keywords: Orange juice, Microwave heating, Thermal processing, Kinetics, Quality
International Conference on
RAW MATERIALS TO PROCESSED FOODS 03-04 June 2021, Turkey
245
Pollen Content in Raw Spanish Rosemary Honey: Influence of the
Geographical Origin
Isabel Escriche1,2*, Marisol Juan-Borrás1, Mario Visquert1, José-Miguel Valiente3
1Institute of Food Engineering for Development. Universitat Politècnica de València. Camino de Vera, s/n. 46022,
Valencia, Spain
2Food Technology Department- Universitat Politècnica de València. Camino de Vera, s/n. 46022, Valencia, Spain
3 Institute of Control Systems and Industrial Computing (AI2).Universitat Politècnica de València. Camino de Vera,
s/n. 46022, Valencia, Spain
*E-mail: [email protected], +34 616903538
ABSTRACT
The highly appreciated rosemary honey is very light in color, with a weak intensity of odor and aroma, and
fresh, floral, and vegetal tones. In general, it is considered monofloral if the pollen from Rosmarinus
officinalis is not lower than 10%, assessed by melissopalynological analysis. Commercial transactions tend
to agree with this percentage, since it is a honey with the pollen underrepresented and there is not an
official value established. This honey stems mainly from wild areas, hence the vast presence of abundant
pollen types. At the reception of the honey packaging process, the analyst classifying this raw honey, must
also consider in the pollen count the presence of all these accompanying pollens. The objective of this work
was to evaluate the influence of the geographical area on the pollen content of raw rosemary honey. To this
aim, 50 honeys provided by beekeepers were analyzed: 25 from Valencian coast and 25 from the interior
(Albacete). The pollen quantification revealed that practically all the samples analyzed could be classified
as rosemary monofloral, since their pollen content of Rosmarinus officinalis was higher than 10-15%.
Many characteristic pollens of the Mediterranean flora were observed common to both geographic zones
(Brassicaceae, Tipo Genista, Hypecoum sp., Ceratonia siliqua, Quercus sp., Oleaceae, Helianthus annuus,
Thymus sp., Echium sp.). However, abundant pollen from Prunus dulcis stood out as a differentiating
element in the samples from the interior zone (exceeding 40% in some cases) and from Erica sp. in those
from the coast. The pollen content indicates that these honeys must be considered as monofloral rosemary
for their commercialization having the expected organoleptic characteristics of this type of honey. It also
shows that the geographical area influences the accompanying flora which in turn reflects the contribution
of nectar from other plants and in fact conditions its peculiar sensory-nuances.
Keywords: geographical origin, honey packaging process, monofloral honey, pollen analysis, rosemary
honey References: B.O.E. (2018). Boletín Oficial del Estado (Spain) 150, 63347-63353.
Proyect PID2019-106800RB-I00 (2019). Ministerio de Ciencia e Innovación. Agencia Estatal de Investigación.

International Conference on
RAW MATERIALS TO PROCESSED FOODS 03-04 June 2021, Turkey
246
Volatile profile of Spanish raw citrus honey: the best strategy for its correct
labelling
Isabel Escriche1,2, Marisol Juan-Borrás1, Mario Visquert1, Eva Domenech1,2, Andrea Asensio1,
José Miguel Valiente3
1Institute of Food Engineering for Development. Universitat Politècnica de València. Camino de Vera, s/n. 46022,
Valencia, Spain
2Food Technology Department- Universitat Politècnica de València. Camino de Vera, s/n. 46022, Valencia, Spain
3 Institute of Control Systems and Industrial Computing (AI2).Universitat Politècnica de València. Camino de Vera,
s/n. 46022, Valencia, Spain
*E-mail: [email protected], +34 616903538
ABSTRACT
Among monoflorals, the citrus honey is highly valued due to its delicate flavour reminiscent to the orange
blossom. Classifying a honey as monofloral is a tedious and time-consuming procedure and requires an
expert analyst in the identification/quantification of the pollen morphologies. For citrus honey, this
difficulty is even bigger considering the low pollen content of the new hybrid varieties of fruits without
seeds. Therefore, the identification of volatile compounds is increasingly being considered as a good option
in the classification of this type of honey. The proper classification of citrus honey before entering as a raw
material in the honey packaging process would ensure its correct labeling hence benefiting the consumer
and the beekeepers that produce this type of honey. Among the few compounds that are accepted as a true
marker, methyl-anthranilate (MA) stands out in the case of citrus honey because it is only present in the
citrus blossom nectar. The objective of this study was to evaluate the presence of specific volatile
compounds in Spanish citrus honeys and to correlate their abundance with the MA level. Citrus honey
samples (25) previously classified by pollen (more than 10% Citrus spp.) and MA (more than 2 mg/kg),
collected in the Valencian Region (Spain), and other 25 types of honey (collected around Spain) were used
in this study. Their volatile fraction was analyzed by GC-MS/MS with previous extraction by SPME. It can
be concluded that, in addition to MA (measured by HPLC), there were certain volatile compounds such as
the four lilac aldehydes (A, B, C, and D) always present together in citrus honey and being their abundance
ratio relatively stable. Furthermore, linalool, ethyl linalool, dill-ether, 2(3H)-furanone, p-mentha-1,8-dien-
7-ol (limonene) and 1-p-menthene-9-al, were found exclusively in this type of honey. The amount of all
these compounds was positively correlated with the abundance of MA.
Keywords: citrus honey, monofloral honey, volatile profile, GC-MS/MS, SPME
References: B.O.E. (2018). Boletín Oficial del Estado (Spain) 150, 63347-63353.
Proyect PID2019-106800RB-I00 (2019). Ministerio de Ciencia e Innovación. Agencia Estatal de Investigación.

International Conference on
RAW MATERIALS TO PROCESSED FOODS 03-04 June 2021, Turkey
247
DNA Degradation from Raw Material to Canned Products
Elif Tuğçe Aksun Tümerkan1*
1Department of Food Processing, Technical Vocational High School, Ankara Yıldırım Beyazıt University, ANKARA,
Turkey
*E-mail: [email protected]
ABSTRACT
Food traceability has become an important issue for the stakeholders of the food industry. Seafood
products, especially processed fish products are known in the list of top 10 food products which are
subjected to fraudulent actions. Due to the market size, being highly profitable products and difficulties of
identification of species in processed food products, processed fish products are highly vulnerable to
fraudulent actions. unearned gain and life-threatening health problems such as toxicity and allergenicity are
the main consequences of these fraudulent actions. Therefore, the traceability of fish products has gained
importance and DNA-based techniques are promising approaches for species identification over the last
decades. The quality of extracted DNA is the main factor, which has great impacts on the achievements of
steps in the species identification procedure. Thermal processing, high pressure or treatment with acidic or
alkali solutions reduce the DNA quality in terms of purity and yield. this research was aimed at the
determination of DNA degradation during canned tuna production. For this aim, the DNA was extracted
from prior and post stages of canned tuna sterilization; raw tuna, the thermal process applied tuna, tuna
with brine medium. Additionally, for determination of filling medium effect on DNA degradation; DNA
extracted from canned tuna filled with sunflower oil and olive oil as most commonly used filling medium
in canning tuna industry. The degradation level and quality of DNA from all processed tuna groups
compared with un-processed tuna with nanodrop and Real-Time PCR results. The results revealed that
thermal processing, treating with salt and canning process cause to DNA degradation. While the DNA yield
was determined as 906.1 ug/ul in raw material, this value determined as 575.20 ug/ul and 201.9 ug/ul from
thermally processed and soaked in a brine solution., respectively. Within the canning process, the DNA
yield reduced to 15.4 ug/ul and 20.6 ug/ul for olive oil and sunflower oil canned tuna respectively. The
optimal purity range of DNA was determined from cooked tuna and tuna soaked in a brine solution prior to
the canning procedure as 1.95. The canning process reduced the a260/a230 ratio, which used as an
indicator of organic contaminants.
KEYWORDS: CANNED FOOD, DNA DEGRADATION, FOOD FRAUD, REAL TIME PCR,
THERMAL PROCESS
1 INTRODUCTION
Seafood products are known one of the important parts of human diet caused by their ambitious benefits to
human health such as preventing cancer or heart issues. Fatty acids especially, omega 3 and omega 6
essential and amino acid content make seafood products are one of the most consumed products in human
diets. Therefore, the consumption of seafood has increased and the market size of seafood industry has
become one of the most traded industries over the world.( FAO, 2018;Aksun Tümerkan and Emiroğlu,
2020). Global seafood consumption has been rising from 16.1 kg/per to 20.2 kg/per capita between 2001
and 2015 and estimated reached to approximately 21 kg/per increasing in last decade(FAO., 2019.;
Fernandes et al., 2020). Recently, the size of seafood trade has reported as higher than the size of total pork
and poultry trade (Asche et al., 2015; Do et al., 2019). Food fraud generally known as placing of food
components illegally for unfair financial gain (FAO, 2018). Intentional fraud activities cause not only
damage financially to consumer, but also some types of fraud such as mislabelling or species substation
also cause to important health problem(Giusti et al., 2019). Threatening of biodiversity and fishing is an
another serious issue caused by these fraudulent actions by is illegal, unregulated and/or unreported

International Conference on
RAW MATERIALS TO PROCESSED FOODS 03-04 June 2021, Turkey
248
fishing (Giusti et al., 2019).Due to the difficulties of monitoring the processed seafood, and increasing
profitable potential in the relevant industry, these products have commonly committed to the fraudulent
(Willette et al., 2017). While intentional fraudulent activities have reported most commonly, unintentional
mislabelling or substitution of species can observed due to difficulties of identification of cryptic or closely
related species (Barendse et al., 2019). The species-specific morphological properties such as size or
colour can used for species identification, however this identification sometimes does not meet the correct
classification demand in close species or processed food. While some chromatographic and spectroscopic
methods utilized for species identification, the achievements of protein based methods such as Isoelectric
focusing (IEF) or Sodium Dodecyl Sulfate Polyacrylamide Gel Electrophoresis (SDS-PAGE) had reported
formerly (Ho et al., 2020). Usage of molecular based techniques for species identification has increased
steadily recently. Owing to the reliability and sensitivity of molecular based methods for identification of
cryptic species, these methods have also used in species authentication in food products.
Especially, following to detection of horsemeat substitution of beef and mislabelling of seafood in last
decade, the importance of species traceability in food products have take attention over the world (Mataet
al., 2020).Therefore, some developments have observed in the process of molecular-based methods from
DNA extraction to bioinformatics. While all steps of molecular based methods are important for the
achievements of correct identification of species, the purity and quality of extracted DNA is an essential
initial requirement for following processes. Whereas the species authentication based on extraction
methods, selected gene region and applied PCR-based techniques when the material as un-processed, the
achievements of this authentication can vary depending on processing methods, packaging conditions
additionally in processed food products. Especially thermal processing or treatment of raw material with
acidic or alkali solution or pressure application cause to DNA degradation and thereof differences in
identification of species. Canning of different fish species is one of the commonly applied processing
methods used by the fist world war (Martin, 1990).Tuna known as the main specie used for canning
process due to its trading and profitable potential. The tuna market is listed in top ten trading food
commodities list with $6 billion financial value (Garrett and Adam, 2010; Gordoa et al., 2017).
Therefore, the fraudulent activities especially mislabelling and species substitution are frequently reported
in canned tuna industry. A wide range of research revealed that the fraudulent of tuna species in industrial
scale and catering scale such as restaurant local retailer; Tunas are among the most desirable marine fish
worldwide, with a global tuna species catch that peaked at 7.7 million tones in 2014. Skipjack
(Katsuwonus pelamis) and Yellowfin (Thunnus albacares) were the tuna species most captured with about
3 and 1.5 million tonnes, respectively. In contrast, the captures of Bluefin tuna through the same period did
not exceed 40,000 tonnes (FAO., 2012; Sotelo et al., 2018).Thereof, the ecological and economic value of
tuna species differ among tuna-sub species (Abdullah and Rehbein, 2016). The over-consumption of the
most desirable species cause to unstable price and uncontrolled fisheries actions are considered the two
main reasons for the increasing number of substitution and mislabelling cases in the canned tuna industry
(Sotelo et al., 2018). These fraudulent actions differ significantly depending on socio-economic situation of
countries, consumer preference and traceability awareness and geographical tuna availability. For instance,
mislabelling and substitution rate reported between 37% and 48% in Spanish tuna chain, this rate was
reported as 95% in Bruxelles restaurants (Christiansen et al.,2018; Gordoa et al., 2017). Most of the
processing techniques damage to biochemical composition of raw material. Processing techniques
especially include thermal process and acid treatments impact to the yield and quality of DNA. Due to
canning process including different thermal procedure and pressure application, this process cause to DNA
degradation. Filling medium is also accepted as primary reason of DNA degradation in canned food
products (Chapela et al., 2007).Due to central role played by the quality of DNA and its yield in the DNA-
based species identification and therefore traceability of food products, these properties have considered
International Conference on
RAW MATERIALS TO PROCESSED FOODS 03-04 June 2021, Turkey
249
prior to PCR-amplification. A well-purified, non-degraded and non-contaminated DNA is the main
requirements for the achievements of DNA-based analyses. In the light of this, the aim of present study was
to assess the DNA degradation at the different steps of tuna canning process. DNA quality and yield are
assessed from tuna processing. Two different filling mediums are also compared. The amplificability of
raw, processed and canned tuna products through a Real-Time PCR approach.
2 MATERIAL AND METHOD
2.1 Products Sampling
Both raw and processed tuna sample obtained from Turkish tuna processing plant. All the sample chosen
from the same origin in terms of catching season and area for avoiding any variation originated from fish
sample. Raw tuna sample used as control (G1), thermal processed tuna prior to canning process (pre-
cooked at 70 °C (G2), soaked in brine solution prior to canning process (G3), canned tuna with olive oil
medium (G4), canned tuna with sunflower oil medium (G5). Canning procedure performed according to
commercial protocol as sealing of tuna can with industrial sealing machine, then sterilization step carried
out 121°C for 117 minutes, finally cooled under top water immediately. Raw (G1) and processed samples
(G2, G3) were stored at -80° C. Canned tuna samples (G4 and G5) stored at ambient temperature until
analyses.
2.2 DNA extraction
Raw, processed and canned tuna samples were pre-treated removing oils, spices and sauces by blotting
with sterile filter paper and each sample was then subjected to extraction method according to commercial
kit. The DNA extraction from canned tuna was carried out through the manufacturer’s procedure and the
following minor modifications. Initially,20 mg sample,250 µl Buffer ATL and 20 µl Proteinase K were
mixed and heated at 56°C until the tissue was entirely lysed. Then, the mixture was centrifuged at 12000 g
for 30 second and supernatant transferred to another tube. 250 μl extraction buffer and heated at 56 ºC for
10 minutes. Afterwards, the mixture was mixed with 250 μl binding buffer and vortexed for 15 second and
transferred to spin columns. Then the spin column washed with AW1(650 μl) and AW2 (500 μl). Finally,
the purified DNA was eluted with 200 µL pre-heated Buffer AE (37ºC). The purified DNA was stored at -
20ºC until for further experiments
2.3 Determination of DNA quality and amplificability
The quality (in terms of 260/230 and 260/280 ratios) and the concentration of DNA (ug/mL) were
measured by means of a NanoDrop 1000 spectrophotometer (Thermo Scientific, Pittsburgh, PA, USA).
The integrity and the amplificability of the gDNA was then evaluated by amplifying a 100 bp region from
the 12S rRNA was targeted teleo primer (Teleo F: 5’ACACCGCCCGTCACTCT 3’ and Teleo R:
3’CTTCCGGTACACTTACCATG 5’) (Valentini et al., 2016).The reaction mixtures contained 2 μL of
template DNA, 10 μL Master Mix(Thermo Scientific™ Maxima SYBR Green/ROX qPCR Master Mix
(2X), 2 μL of each primer, and 6 μl Dna free water. The PCR was conducted using a StepOnePlus Real-
Time PCR System (Applied Biosystems, Foster City, CA, USA) with the following program: an initial
denaturation step at 95°C for 2 min, 35 cycles of 30 s at 94 °C, 30 s at 53 °C, and 60 s at 72 °C, followed
by the final extension at 72°C for 10 min . Following to amplification, the melting curve analysis (MCA)
was performed by cooling amplification products at 65°C for 95 s and then heating from 65°C to 95°C.
2.4. Statistical analysis
All statistical analyses were performed using Software IBM SPSS version 16.0.For comparison of the yield
of DNA extracted from all tuna sample (raw, processed and canned), a two-way cross-classification

International Conference on
RAW MATERIALS TO PROCESSED FOODS 03-04 June 2021, Turkey
250
analysis of variance (ANOVA) was performed. Differences were considered statistically significant at a
level of 5% (P< 0.05) All the DNA quality analyses were conducted in triplicate assays for each tuna
sample.
3 RESULTS AND DISCUSSION
3.1. Determination of DNA quality
The results of extracted DNA from raw, processed and canned tuna samples are summarized in Figure 1
and Table 1. The DNA yield was calculated based on DNA concentration, initial tuna muscle weight and
obtained the final volume. There were significant differences found among raw, processed and canned tuna
sample (P<0.05) in terms of DNA yield (Table 1, Figure 1)., DNA yield was significantly higher in raw
(unprocessed) tuna when compared to processed and canned tuna groups. Similar results reported by
(Piskatá and Pospíšilová, 2016) who found the higher DNA yield from raw fish than processed fish
sample. Cooking and soaking in brine solution cause to degradation of DNA from tuna sample. DNA yield
was determined as 906.1 ug/uL in raw material, following the cooking process, the DNA yield reduced to
575.20 ug/uL and after soaking in brine solution prior to canning process, the DNA yield was determined
as 201.9 ug/uL. Canning process reduced the DNA yield dramatically. The DNA yield was determined as
15.4 ug/uL and 20.6 ug/uL from canned tuna with olive oil and sunflower oil filling medium, respectively.
This significant decline can be explained by the canning process include pressure and thermal steps which
effect the DNA quality. (Johny and Bhat, 2017) Highlighted that canning process involves mechanical,
thermal and chemical treatments that have detrimental effects on the quality and the integrity of DNA, and,
in turns, its amplificability. It is known that most of the processing methods cause to degradation of DNA,
for instance, thermal processing of meat to at 121°C for 10 min, reduce to DNA length up to 300 bp
(Levin et al., 2018).In the canned tuna sample groups, there were no significant differences from DNA
yields based on can- filling mediums.
Table 5: Quality differences among the tuna groups
Data are expressed as mean value ± standard deviation of triplicates. Values followed by different letters
indicate significant differences (P<0.05) Values in a same column followed by different numbers indicate
significant differences of the parameter with respect to Groups: G1: Raw tuna muscle, G2:pre-cooked tuna
sample , G3: soaked in brine solution prior to canning process, G4: canned tuna with olive oil medium, G5:
Tuna
Type of
Muscle
Quality assessment
DNA Yield
( ug/uL)
Purity
(A260/A280)
Chemical
Contamination
(A260/A230)
G1 906.1±0.03c 2.23±0.10b 2.13±0.11b
G2 575.20,±0.01c 1.95±0.06ab 2.10±0.07b
G3 201.9±0.00b 1.95±0.05a 2.21±0.09a
G4 15.4±0.00a 1.00±0.03a 0.47±0.04b
G5 20.6±0.00a 1.33±0.02a 0.44±0.05c

International Conference on
RAW MATERIALS TO PROCESSED FOODS 03-04 June 2021, Turkey
251
canned tuna with sunflower oil
Figure 3: Variation of DNA Quality Parameters During The Canning Process
The purity of the gDNA is another parameter that can strongly affect the success of PCR amplification
and sequencing processes. The purity of DNA evaluated with A260/A280 ratio. There were some
significantly differences were observed among the raw, processed and canned tuna sample (Table 1).
While the highest and the lowest values obtained in raw tuna muscle and canned tuna with sunflower oil
with 2.23 and 1.00., respectively, the optimal purity value was detected from cooked tuna and tuna
soaked in brine solution with 1.95. The widely accepted optimal range for purity ratio is between 1.8-2.0
(Piskata et al., 2017).Canning process also reduce to purity of DNA; 1.00 and 1.33 range were
determined for canned tuna in olive oil and sunflower oil, respectively. Canning and treating with oil
regardless the oil type, reduce the purity of DNA, which is also sign the DNA yield.
Another important parameter for the achievements of DNA based analyses is the A260/A230 ratio, which
is an indicator of organic contaminants such as carbohydrates and salts. The highest contamination rate
determined from tuna soaked in brine solution prior to canning process. These differences could be
explained by treatment with salt. it should range from 2.0 to 2.2 (Lucena-Aguilar et al., 2016). The lowest
contaminant values observed from canned tuna samples as 0.47 and 0.44 for canned tuna in olive oil and
sunflower oil, respectively. This significant decline can be related to the inhibition of contaminants by
sterilization during the canning process.
3.2. Determination of DNA degradation
DNA degradation among to raw, processed and canned tuna samples detected by threshold cycle (Ct)
value. As seen in Figure.2; the significant differences in terms of melting curve values were determined.
These differences can be related to thermal processing of raw material. Similar findings reported that DNA
fragmentation and amplicability of DNA resulted by autoclaving (Ballari and Martin, 2013). Regardless the

International Conference on
RAW MATERIALS TO PROCESSED FOODS 03-04 June 2021, Turkey
252
aim of sequencing in DNA-based methods, the degradation of DNA is one of the important problems
which can be cause to disruptions in species identification and food traceability. Within consumer demand
and technological advance, several kind of processed food products have become more popular than fresh
product. This case also cause to traceability of food products, which is very important for public health and
a fair trade. The achievements of fraudulent actions detection analyses depend on quality, yield and
degradation level.
A
B

International Conference on
RAW MATERIALS TO PROCESSED FOODS 03-04 June 2021, Turkey
253
Figure 2: Melting Curve (A) and Amplicon plots(B) of Tuna Sample during The Canning Process
4 CONCLUSION
The results of this research clearly show that how the quality, yield and degradation level of DNA change
depending on thermal processing, treatment with salt and canning process with different can-filling
medium. Besides canning of food items is very popular in food industries, several processing methods
include thermal and/or pressure application, these findings could be useful for future research and industry
in relevant area.
REFERENCES
[1] FAO. (2018). State of World Fisheries and Aquaculture. Food & Agriculture Organization.
[2] Aksun Tümerkan, E., Emiroğlu, Ö. (2020). The Investigation of The Impact of Different Factors
On Dna Isolation From Food Products: A Versatile Example; Seafood. International Journal of
Natural and Engineering Sciences, 14(3), 14-21.
[3] FAO. (2019.). GLOBEFISH – Information and Analysis on World Fish Trade – Slowing growth in
international seafood trade as uncertainty dominates.
[4] Fernandes, T. J. R., Amaral, J. S., & Mafra, I. (2020). DNA barcode markers applied to seafood
authentication: an updated review. Critical Reviews in Food Science and Nutrition, 1-32.
doi:10.1080/10408398.2020.1811200
[5] Asche, F., Bellemare, M. F., Roheim, C., Smith, M. D., & Tveteras, S. (2015). Fair Enough? Food
Security and the International Trade of Seafood. World Development, 67, 151-160.
doi:https://doi.org/10.1016/j.worlddev.2014.10.013
[6] Do, T. D., Choi, T.-J., Kim, J.-i., An, H.-E., Park, Y.-J., Karagozlu, M. Z., & Kim, C.-B. (2019).
Assessment of marine fish mislabeling in South Korea's markets by DNA barcoding. Food Control,
100, 53-57. doi:https://doi.org/10.1016/j.foodcont.2019.01.002
[7] Giusti, A., Tinacci, L., Sotelo, C. G., Acutis, P. L., Ielasi, N., & Armani, A. (2019). Authentication
of ready-to-eat anchovy products sold on the Italian market by BLAST analysis of a highly
informative cytochrome b gene fragment. Food Control, 97, 50-57.
doi:https://doi.org/10.1016/j.foodcont.2018.10.018
[8] Barendse, J., Roel, A., Longo, C., Andriessen, L., Webster, L. M. I., Ogden, R., & Neat, F. (2019).

International Conference on
RAW MATERIALS TO PROCESSED FOODS 03-04 June 2021, Turkey
254
DNA barcoding validates species labelling of certified seafood. Current Biology, 29(6), R198-
R199. doi:https://doi.org/10.1016/j.cub.2019.02.014
[9] Willette, D. A., Simmonds, S. E., Cheng, S. H., Esteves, S., Kane, T. L., Nuetzel, H., et al. (2017).
Using DNA barcoding to track seafood mislabeling in Los Angeles restaurants. Conservation
Biology, 31, 1076–1085. https://doi.org/10.1111/cobi.12888
[10] Ho, J. K. I., Puniamoorthy, J., Srivathsan, A., & Meier, R. (2020). MinION sequencing of seafood
in Singapore reveals creatively labelled flatfishes, confused roe, pig DNA in squid balls, and
phantom crustaceans. Food Control, 112, 107144.
doi:https://doi.org/10.1016/j.foodcont.2020.107144
[11] Mata, W., Chanmalee, T., Punyasuk, N., & Thitamadee, S. (2020). Simple PCR-RFLP detection
method for genus- and species-authentication of four types of tuna used in canned tuna industry.
Food Control, 108, 106842. doi:https://doi.org/10.1016/j.foodcont.2019.106842
[12] Martin, R. E. (1990). A History of the Seafood Industry. . In F. G. J. e. In: Martin R.E. (Ed.), The
Seafood Industry. . Boston, MA.: Springer,.
[13] Garrett, A., & Adam, B. (2010.). Yellowfin Tuna: A Global and Uk Supply Chain Analysis. Paper
presented at the Proceedings of the Fifteenth Biennial Conference of the International Institute of
Fisheries Economics & Trade,, Compiled by International Institute of Fisheries Economics &
Trade, Corvallis, Oregon, USA, 2010.
[14] Gordoa, A., Carreras, G., Sanz, N., & Viñas, J. (2017). Tuna Species Substitution in the Spanish
Commercial Chain: A Knock-On Effect. PLOS ONE, 12(1), e0170809.
doi:10.1371/journal.pone.0170809
[15] FAO. (2012). Overview of the world ‘ s anchovy sector and trade possibilities for Georgian
anchovy products.
[16] Sotelo, C. G., Velasco, A., Perez-Martin, R. I., Kappel, K., Schröder, U., Verrez-Bagnis, V., . . .
Griffiths, A. (2018). Tuna labels matter in Europe: Mislabelling rates in different tuna products.
PLOS ONE, 13(5), e0196641. doi:10.1371/journal.pone.0196641
[17] Abdullah, A., & Rehbein, H. (2016). The differentiation of tuna (family: Scombridae) products
through the PCR-based analysis of the cytochrome b gene and parvalbumin introns. Journal of the
Science of Food and Agriculture, 96(2), 456-464. doi:10.1002/jsfa.7111
[18] Christiansen, H., Fournier, N., Hellemans, B., & Volckaert, F. A. M. (2018). Seafood substitution
and mislabeling in Brussels' restaurants and canteens. Food Control, 85, 66-75.
doi:https://doi.org/10.1016/j.foodcont.2017.09.005
[19] Chapela, M. J., Sotelo, C. G., Pérez-Martín, R. I., Pardo, M. Á., Pérez-Villareal, B., Gilardi, P., &
Riese, J. (2007). Comparison of DNA extraction methods from muscle of canned tuna for species
identification. Food Control, 18(10), 1211-1215.
doi:https://doi.org/10.1016/j.foodcont.2006.07.016
[20] Valentini, A., Taberlet, P., Miaud, C., Civade, R., Herder, J., Thomsen, P. F., . . . Dejean, T.
(2016). Next-generation monitoring of aquatic biodiversity using environmental DN A
metabarcoding. Molecular Ecology, 25(4), 929-942.
[21] Piskata, Z., Pospisilova, E., & Borilova, G. (2017). Comparative study of DNA extraction methods
from fresh and processed yellowfin tuna muscle tissue. International Journal of Food Properties,
20(sup1), S430-S443. doi:10.1080/10942912.2017.1297953
[22] Johny, T.K., Bhat, S.G., (2017). PCR in Metagenomics, in: Domingues, L. (Ed.), PCR: Methods
and Protocols. Springer New York, New York, NY, pp. 249-265.
[23] Levin, R. E., Ekezie, F.-G. C., & Sun, D.-W. (2018). Chapter 14 - DNA-Based Technique:
Polymerase Chain Reaction (PCR). In D.-W. Sun (Ed.), Modern Techniques for Food

International Conference on
RAW MATERIALS TO PROCESSED FOODS 03-04 June 2021, Turkey
255
Authentication (Second Edition) (pp. 527-616): Academic Press.
[24] Lucena-Aguilar, G., Sánchez-López, A. M., Barberán-Aceituno, C., Carrillo-Ávila, J. A., López-
Guerrero, J. A., , & Aguilar-Quesada, R. (2016). DNA Source Selection for Downstream
Applications Based on DNA Quality Indicators Analysis. Biopreservation and Biobanking, 14(4),
264-270. doi:10.1089/bio.2015.0064
[25] Ballari, R. V., & Martin, A. (2013). Assessment of DNA degradation induced by thermal and UV
radiation processing: Implications for quantification of genetically modified organisms. Food
Chemistry, 141(3), 2130-2136. doi:https://doi.org/10.1016/j.foodchem.2013.05.032
International Conference on
RAW MATERIALS TO PROCESSED FOODS 03-04 June 2021, Turkey
256
Production of Cocoa Powder with Low Protein Content
Konul Mehdizade1, İnci Cerit1, Omca Demirkol1
1Department of Food Engineering, Sakarya University, Esentepe, Sakarya 54187, Turkey
*E-mail: [email protected], +90264 295 58 47
ABSTRACT
Phenylketonuria (PKU) is an inherited metabolic disease caused by the lack or absence of phenylalanine
hydroxylase (PAH) enzyme, enabling the conversion of phenylalanine to tyrosine. Since the PAH enzyme
is not active in PKU patients, the accumulation of phenylalanine and its derivatives in the body causes
mental and neurological development retardation. The aim of this study was to produce low-protein cocoa
powder as an alternative low-protein food for PKU patients who need to follow a strict diet. First of all,
defatted cocoa powder was suspended in distilled water (1:10, w/w). To increase the solubility of the cocoa
solution, amylase was added in 1:10 enzyme: substrate ratio and the reaction continued for 3 hours after the
temperature was adjusted to 50oC. Heat shock treatment was applied by freezing the suspension followed
by contact with a hot aqueous solution at 95oC. The heat shock was allowed to continue until the
temperature stabilized. Then, the suspension was boiled under the condenser for 3 hours and centrifuged at
25oC for 15 min to remove the insoluble part. The degrading enzymes, flavourzyme and alcalase, were
added to the soluble part, respectively and enzymatic treatment proceeded 3 hours for each enzyme. The
reaction was stopped by heating at 95oC for 5 min. After centrifugation, the pH of the solution was adjusted
to 3.5 using 2M H3PO4 solution to precipitate proteins, followed by centrifugation at 13,130 g for 10 min.
The pH increased back to 7.0 using 2M Ca(OH)2. After the solution was dried, the solubility and protein
content was detected. According to the results, the solubility of cocoa increased by more than 50% and the
protein content decreased by 40%. Although the protein content was highly reduced with this study,
different methods can also be tried for PKU patients to be fed with low protein-based foods.
Keywords: Cocoa, Low protein, Phenylketonuria
International Conference on
RAW MATERIALS TO PROCESSED FOODS 03-04 June 2021, Turkey
257
FTIR based Chemometric Analysis of Bioactive Compounds of Peach Juice
during Thermal Treatment
Hande Baltacıoğlu1*
1Department of Food Engineering, Faculty of Engineering, Nigde Omer Halisdemir University, 51240, Nigde, Turkey
*E-mail: [email protected]
ABSTRACT
Fruit juices contain many bioactive compounds such as phenolic compounds and vitamin C that have
positive effects on health. Peach (Prunus persica L.) is one of the most popular fruits due to its flavor and
nutritional value and it has been ranked the first among fruits that are processed into the nectar in Turkey.
Thermal treatment is the main technique to obtain a safe product in the fruit juice industry for inactivating
microorganisms and enzymes. However, bioactive components of fruit juices have been adversely affected
by the heat. Fourier-transform infrared (FTIR) spectroscopy with chemometrics has been used as a new,
rapid and efficient method to estimate the concentrations of the bioactive compounds and antioxidant
activity of foods in recent years. In this study, FTIR spectroscopy with chemometrics was used to evaluate
the bioactive compounds and antioxidant activity of peach juices during thermal treatment. The control and
thermal treatment were differentiated by using principle component analysis (PCA), and models that
correlated total phenolic content, antioxidant activity and vitamin C with infrared spectra were constructed
by using partial least square (PLS). FTIR can be used as a reliable method to determine the bioactive
compounds and antioxidant activity in peach juice during thermal treatment.
Keywords: FTIR, Peach Juice, PCA, PLS
INTRODUCTION
Fruit juices contain many bioactive compounds such as phenolic compounds, carotenoids and vitamin C.
Fruit juices have been consumed in increasing amounts all over the world. Peach (Prunus persica L.) is one
of the most important fruits which is processed to puree in the juice industry in Turkey (Jordão, 2018).
Peach has been reported as a good source of bioactive compounds such as ascorbic acid and phenolic
compounds which are well known for their health-promoting effect (Liu et al., 2015).
In the fruit juice industry, thermal treatment is generally applied to products for inactivating
microorganisms and enzymes. However, heat has negative effects on the nutritional quality of fruit juices.
In many research, the effect of thermal treatment on bioactive compounds in peaches have been studied and
it was reported that heat may cause changes in the phenolic composition (Oliveira et al., 2012; Oliveira et
al., 2014; Oliveira et al., 2015; Oliveira et al., 2016).
Fourier transform infrared (FTIR) spectroscopy has already been used as an easy, rapid and efficient
method to estimate changes in bioactive compounds and antioxidant activity of food extracts. Moreover,
FTIR spectroscopy coupled with chemometrics was used to build a relationship between chemical changes
with infrared data (Baltacıoğlu et al., 2021).
In this study, peach juice bioactive compounds and antioxidant activity were investigated during thermal
treatment by using FTIR spectroscopy. Principle component analysis (PCA) was used to differentiate the
control and thermal treated juice sample and partial least square (PLS) was used to construct models that
correlated bioactive compounds and antioxidant activity with infrared spectra.

International Conference on
RAW MATERIALS TO PROCESSED FOODS 03-04 June 2021, Turkey
258
MATERIAL AND METHOD
Material
Freshly collected peaches (Prunus persica L. cv. Monroe), that were from Niğde Ömer Halisdemir
University, Faculty of Agricultural Sciences and Technologies, Research and Application Fields, were
washed and dried. After that the seeds were discarded by cutting fruits in two pieces. Fruit juices were
obtained by using juice extractor (K 1579 Y, Arcelik, Turkey). Extracted juice was separated into small
volumes and one of them was left as a control.
Thermal Treatment at Ambient Pressure
Thermal treatment of peach juice was performed at 70 °C for 10 min. 200 ml of peach juice was placed in a
glass vessel (7 cm diameter and 9.5 cm long) were heated in a water bath (Yüksel Kaya Makine, YKM-
AS209, Turkey) that was temperature controlled. Laboratory type mechanical stirrer (Isolab, Germany) was
used to stir juice during the thermal treatment to provide uniform distribution of the temperature in the
sample. The temperature of samples was controlled by thermocouple during the thermal treatment and the
time was started when the set temperature was reached. The samples were immediately transferred to an ice
water to stop thermal inactivation instantaneously. All the experiments and measurements were repeated in
triplicate.
Determination of Total Phenolic Content
The Folin–Ciocalteu colorimetric method was used to measure total phenolic content of samples (Singleton
and Rossi, 1965). For this purpose, 100 µL of extract (phenolic compounds were extracted from samples
with methanol solution (80%, v/v) containing 1% hydrochloric acid (37%) at a ratio 1/5) was mixed with
0.75 mL of Folin–Ciocalteu reagent (10%) and kept at room temperature for 5 min. After that 0.75 mL of
sodium bicarbonate (75 g/L) was added and the mixture was hold on at room temperature for 60 min.
Absorbance of the samples was measured at 725 nm. Gallic acid was used as a standard and different
concentrations of gallic acid solutions were prepared for the calibration curve. All determinations were
carried out in triplicate, and results were represented as milligrams of gallic acid equivalent (GAE) per
kilogram of juice.
Determination of Antioxidant Activity
Antioxidant activity of the extracts was determined according to the method of Blois (1958) by using
DPPH (2,2-diphenyl-1-picrylhydrazyl). The daily prepared 3.9 mL of DPPH solution (0.1 mM) in
methanol (80%) was mixed with 100 µL of fruit juice extracts, prepared at different concentrations. After
incubated for 30 min at room temperature, absorbance was recorded at 517 nm. For the blank sample, 100
µL of methanol (80%) was mixed with the DPPH solution and its absorbance was measured at the same
nm. The experiment was carried out in triplicate. Radical scavenging activity was calculated using the
following formula:
% inhibition = [(Absorbance of the blank sample - Absorbance of the fruit juice extract)/ (1)
Absorbance of the blank sample] × 100
Concentrations of the extracts were plotted against the % inhibition values in order to obtain the EC50,
defined as the amount of antioxidant needed to decrease the initial DPPH concentration by 50%.
International Conference on
RAW MATERIALS TO PROCESSED FOODS 03-04 June 2021, Turkey
259
Determination of Ascorbic Acid
The ascorbic acid contents were determined by using HPLC (Shimadzu LC-20A/Prominence), equipped
with a 20-µL injection loop (Shimadzu CBM-20Alite System Controller), UV-VIS detector (Shimadzu
SPD-20A), a column oven (Shimadzu CTO-10AS VP) at 25 °C, and an operating system (LC-Solution)
according to the method reported by Abid et al. (2014) with slight modifications. For the extraction of
ascorbic acid, 5.0 mL of juice sample was mixed with 5 ml of orthophosphoric acid (2.5%) in a tube. After
the mixture was centrifuged (6500 rpm for 5 min at 4°C), 0.5 ml aliquot of the supernatant was transferred
to a 10 ml of centrifuge tube and completed to volume with orthophosphoric acid. The tube was shaken and
filtered through syringe filters (0.45 µm diameter). The sample (20 µL) was injected into a C18 column
(Supelco, 4.6 mm x 250 mm, 5 µm). HPLC grade methanol (30%) was chosen as mobile phase and its flow
rate was 1.0 mL/min. Eluate was detected at 280 nm. Standard ascorbic acid solutions were used to prepare
a calibration curve and the results were shown as mg/L of peach juice.
Fourier‑Transformed Infrared (FTIR) spectroscopy
After a few milligrams of lyophilized powder of peach juices were put on the attenuated total reflection
(ATR) crystal, spectra of samples were recorded at room temperature (ca. 20 °C) over the frequency range
of 4000–400 cm−1 by using FTIR (Vertex 70, Bruker Optics, Germany) spectroscopy. It was taken 128
scans at a resolution of 2 cm−1 for each spectrum. OPUS (v.8.1, Bruker Optics, Germany) software was
used to collect and analyse the spectra. The spectrum of air was recorded as background and subtracted
automatically by using the same software.
Chemometric analyses
FTIR spectra of control and thermal treated peach juice samples were discriminated by using Principal
component analysis (PCA). Minitab 17 (Minitab Inc., State College, PA, USA) software was used to
analyses the data. The total phenolic content, antioxidant activity and ascorbic acid of samples were
predicted by using FTIR spectral data with Partial least squares (PLS) regression analysis. PLS analyses
were performed by using Minitab 17 (Minitab Inc.) software. The FTIR spectral data were used as X
variables (predictors), and each of the total phenolic content, antioxidant activity and ascorbic acid of
samples was used as a Y variable (responses) to construct PLS models. Construction of the PLS models
was done described by the method of Baltacıoğlu et al. (2021). Chemometric models were established in
the wavenumbers between 4000 and 400 cm-1.
Statistical Analysis
The data were analysed using Minitab 17 (Minitab Inc., State College, PA, USA) at 95% confidence
interval, and the general linear model was used in the analysis of the data. Tukey's multiple comparison test
was conducted to determine the differences between applications. Each experiment was repeated at least
three times.
RESULTS AND DISCUSSION
FTIR analysis
As shown in Figure 1, the band observed at 3270 cm-1 was due to the O–H stretching of polysaccharides
and N–H stretching of Amide A groups of proteins for FTIR spectra of samples (Baltacıoğlu et al., 2021b).
The band located at 2924 cm−1 corresponded to asymmetric stretching vibrations of CH2 groups and the
band determined after that at 2885 cm−1 was related to symmetric stretching vibrations of CH3 groups (Sun,
2008). It was thought that both of these bands were mainly related to unsaturated lipids while proteins,
carbohydrates, and nucleic acids had little contribution to these bands. The absorption bands, observed in
the region between 1800 and 1500 cm-1 were reported as the carboxylic acid and the carboxylic ester

International Conference on
RAW MATERIALS TO PROCESSED FOODS 03-04 June 2021, Turkey
260
groups of the pectin molecules (Sun, 2008). On the other hand, the contribution of proteins was observed in
this region because the bands observed between 1700 and 1600 cm−1 were assigned as the Amide I band
and 1600–1500 cm−1 were related to the Amide II bands due to proteins (Baltacıoğlu et al., 2021b). The
peaks, which were seen from the graph in the region from 1500 to 1200 cm-1, could be due to CH2, C-C-H
and H-C-O deformations. Moreover, phenols, carboxylic acids and carbohydrates also contributed to this
region due to their C-O stretching absorption and to the C-O-H bending (Coelho et al., 2020). The bands
observed in the region between 1200 to 900 cm−1 were assigned to the stretching vibrations of C-O and C-C
bonds that were associated with sugars and organic acids (Miaw et al., 2018).
Figure 1: FTIR spectra of thermal treated peach juice samples
Chemometric analyses
PCA was performed to discriminate control and thermal treated peach juice by the help of IR spectra. The
PCA plot was demonstrated in Figure 2 with two principal components accounting for 100% of the total
variance. PC1 and PC2 explained 98.7% and 1.3% of the total variance, respectively. According to plots, it
was easily observed differences between the control and thermal treated peach juice. It could be seen that
control sample was differentiated from thermal treated samples according to PC1. In the same manner,
PCA was used to differentiate between apple juice samples on the basis of applied heat treatment by using
infrared data (Reid et al., 2005).

International Conference on
RAW MATERIALS TO PROCESSED FOODS 03-04 June 2021, Turkey
261
Figure 2: PCA score plot (PC1–PC2) of the FTIR spectra of thermal treated peach juice samples
PLS regression analysis results for the prediction of total phenolic content, antioxidant activity and ascorbic
acid of peach juice using FTIR spectral data were given in Table 1. As shown in Table 1, rCV and rPre
values were higher than 0.95, indicated good correlation within the calculated and reference values for the
models. Additionally, the RMSEC and RMSEP values within each model had small values, and the
differences between these values were also small. It can be said that the PLS models provided satisfactory
predictions (Baltacıoğlu et al., 2021). PLS regression plot of actual versus predicted total phenolic content
analyses for juices using FTIR spectra was shown in Fig. 3A. PLS regression plot of actual versus
predicted antioxidant activity analyses for juices using FTIR spectra was shown in Fig. 3B and actual
versus predicted ascorbic acid for juices using FTIR spectra was shown in Fig. 3C. High correlations
between reference and IR predicted values in total phenolic content, antioxidant activity and ascorbic acid
content could also be easily seen in the plots. Antioxidant activity and total phenolic content of tomato
extracts has been successfully quantified using IR spectra combined with PLS regression (Baltacıoğlu et
al., 2021).
Table1: PLS regression analysis for the prediction of bioactive compounds and antioxidant activity of
thermal treated peach juices using FTIR spectral data
Parameters Components rCV rPre RMSEC RMSEP
Total phenolic
content 4 0.9997 0.9798 1.366 1.222
Antioxidant activity 3 0.9999 0.9995 0.016 0.014
Ascorbic acid 1 0.9994 0.9959 0.591 0.529
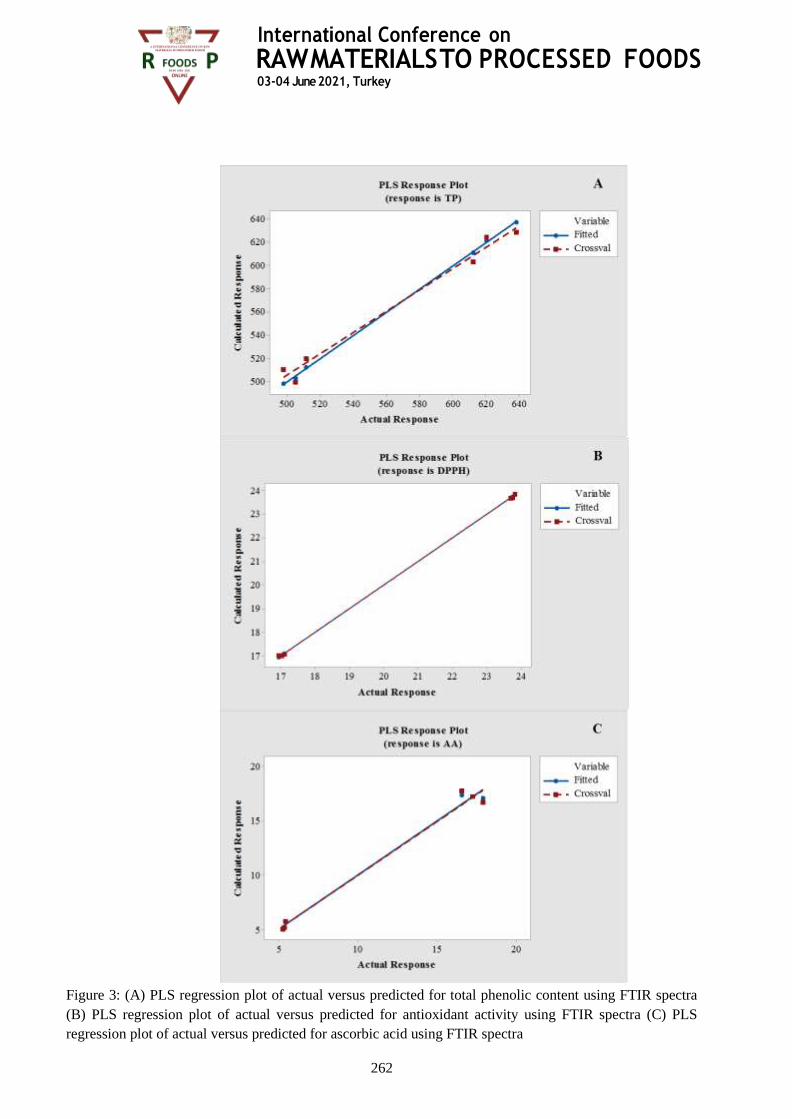
International Conference on
RAW MATERIALS TO PROCESSED FOODS 03-04 June 2021, Turkey
262
Figure 3: (A) PLS regression plot of actual versus predicted for total phenolic content using FTIR spectra
(B) PLS regression plot of actual versus predicted for antioxidant activity using FTIR spectra (C) PLS
regression plot of actual versus predicted for ascorbic acid using FTIR spectra
International Conference on
RAW MATERIALS TO PROCESSED FOODS 03-04 June 2021, Turkey
263
CONCLUSION
FTIR was firstly used to identify changes in functional groups in the thermal treated peach juices. FTIR
based chemometric analyses was easily used to evaluate the bioactive compounds and antioxidant activity
of peach juices during thermal treatment. PCA was used to discriminate the methods and models were
constructed for determining bioactive contents and antioxidant activity of peach juices during thermal
treatment as a function of the spectra by using PLS.
REFERENCES
[1] Jordão, J., (2018). European Fruit Juice Association. AIJN – Market Report 2018, 3–44.
[2] Liu, H., Cao, J., Jiang, W., (2015). Changes in phenolics and antioxidant property of peach fruit during
Ripening and responses to 1-methylcyclopropene. Postharvest Biology and Technology, 108, 111–118.
[3] Oliveira, A., Pintado, M., Almeida, D.P., (2012). Phytochemical composition and antioxidant activity
of peach as affected by pasteurization and storage duration. LWT-Food Science and Technology, 49(2),
202-207.
[4] Oliveira, A., Gomes, M.H., Alexandre, E.M., Almeida, D.P., Pintado, M.E., (2014). Impact of pH on
phytochemical profile of pasteurized peach purée during storage. Journal of Agricultural and Food
Chemistry, 62(50), 12075-12081.
[5] Oliveira, A., Coelho, M., Alexandre, E.M.C., Gomes, M.H., Almeida, D.P.F. Pintado, M., (2015).
Effect of modified atmosphere on phytochemical profile of pasteurized peach purées. LWT - Food
Science and Technology, 64(2), 520-527.
[6] Oliveira, A., Alexandre, E.M., Coelho, M., Barros, R.M., Almeida, D.P. Pintado, M., (2016). Peach
polyphenol and carotenoid content as affected by frozen storage and pasteurization. LWT-Food
Science and Technology, 66, 361-368.
[7] Baltacıoğlu, H., Baltacıoğlu, C., Okur, İ., Tanrıvermis, A., Yalıç, M., (2021). Optimization of
microwave-assisted extraction of phenolic compounds from tomato : Characterization by FTIR and
HPLC and comparison with conventional solvent extraction. Vibrational Spectroscopy 113, 103204.
[8] Singleton, V.L., Rossi, J.A. (1965). Colorimetry of total phenolics with phosphomolybdic-
phosphotungstic acid reagents. Am J Enol Vitic., 16(3):144 – 158.
[9] Blois, M.S. (1958). Antioxidant Determinations by the use of stable free radical. Nature, 181 (4617),
1199-1200.
[10] Abid, M., Jabbar S., Hu B., Hashim M.M., Wu T., Lei S., Khan M.K., Zeng X. (2014).
Thermosonication as a potential quality enhancement technique of apple juice. Ultrasonics
Sonochemistry, 21, 984–990.
[11] Baltacıoğlu, C., Baltacıoğlu, H., Seyhan, R., Uğur, Ö., Avcu, O. (2021b). Investigation of the effect
of oyster mushroom (Pleurotus ostreatus) powder on biscuit production and effect on quality criteria by
Fourier-transform infrared spectroscopy. J Food Process Preserv., 45(2), 1–10.
[12] D.W. Sun, Infrared Spectroscopy for Food Quality Analysis and Control, Academic Press, New
York, USA, 2008.
[13] Coelho, M.T., Valério, F.A., Pedro, S.I., Dos Anjos, O.M.S. (2020). Application of FTIR-ATR to
discriminate peach nectars with higher and lower sugar contents. Brazilian J Food Technol., 23, 1–10.
[14] Miaw, C.S.W., Assis, C., Silva, A.R.C.S., Cunha, M.L., Sena, M.M., De Souza, S.V.C. (2018).
Determination of main fruits in adulterated nectars by ATR-FTIR spectroscopy combined with
multivariate calibration and variable selection methods. Food Chemistry, 254, 272-280.
[15] Reid, L.M., Woodcock, T., O’Donnell, C.P., Kelly, J.D., Downey, G. (2005). Differentiation of
apple juice samples on the basis of heat treatment and variety using chemometric analysis of MIR and
International Conference on
RAW MATERIALS TO PROCESSED FOODS 03-04 June 2021, Turkey
264
NIR data. Food Research International, 38(10), 1109-1115.
Optimization of Extraction Parameters to improve Cottonseed milk yield and
reduce gossypol levels using Response Surface Methodology (RSM)
Thirukkumar S1*, Hemalatha G2, Vellaikumar S3, Amutha S2
1Ph.D. Scholar,2Professor, Department of Food Science and Nutrition, Community Science College and Research
Institute, Tamil Nadu Agricultural University, Madurai, Tamil Nadu, India – 625104 3Assistant Professor, Department of Biotechnology, Agricultural College and Research Institute, Tamil Nadu
Agricultural University, Madurai, Tamil Nadu, India – 625104
*E-mail: [email protected], +919042704485
ABSTRACT
The consumption of plant based milk products is gaining importance as a healthy alternative to dairy based
milk for lactose intolerance people. Also, the nutraceutical functional ingredients of plant based milk like
cottonseed milk confer potential health and functional benefits. This study aimed to optimize the extraction
condition for extracting cottonseed milk by using an enzymatic assisted aqueous extraction technique
(EAAE) and access the interaction of the gossypol-protein molecules by electrophoresis. The influence of
enzymatic treatments and other parameters included protease enzyme concentration (0.5 to 1%), incubation
temperature (30 to 55°C), pH (4.5 to 7.0) and hydrolysis time (120 to 360 min) on extraction yield, protein
and gossypol content was studied by RSM. The optimized enzymatic treatment conditions were enzyme
concentration of 0.50%, temperature 30°C, pH 7 and hydrolysis time 165.31 min with the desirability value
of 0.825. The optimized EAAE cottonseed milk had a significant increase in extraction yield by 11.10%
and protein content by 17.94%, while the gossypol content decreased by 45.61% with conventional
extracted cottonseed milk (CECM). The less intensity of the protein bonds appeared in CECM with EAAE
cottonseed milk through electrophoresis. The gossypol content in the optimized cottonseed milk met the
permissible intake level of gossypol content as set by the USFDA is 450 mg/kg and FAO/WHO is 600
mg/kg.
Keywords: Cottonseed milk, Enzyme assisted extraction, Gossypol, Gossypol-protein interaction
International Conference on
RAW MATERIALS TO PROCESSED FOODS 03-04 June 2021, Turkey
265
The Changes of Various Quality Characteristics and Aroma Compounds of
Astragalus Honey Obtained from Different Altitudes of Adana-Turkey
Gürkan TÜRKa, Kemal ŞENa*
aDepartment of Food Engineering, Faculty of Engineering and Architecture, Nevsehir Haci Bektas Veli University,
50300, Nevsehir, Turkey
*Corresponding author: [email protected]
ABSTRACT
In this study, the effects of altitude on the chemical and physicochemical properties and aroma compounds
of astragalus honey from the different parts of Adana, Turkey, were investigated. As the altitude increased,
the moisture content of honey samples decreased. Similarly, as the altitude increased, the acidity and the
diastase activity of samples increased. These compounds were identified and quantified using the GC-MS-
FID. It was determined, that with the increasing altitude, the total amount of the alcohol compounds
decreased, and the total amount of the lactone compounds and the norisoprenoid compounds increased with
the decreasing altitude. Moreover, 11 different aroma compounds with an odor activity value above 1 were
detected. From these compounds, Limonene, (E)-Linalool oxide, Z-Linalool oxide, and acetic acid were
determined as the odor active compounds in all of the honey samples. With this study, the altitude effect of
honey on aroma compounds was revealed for the first time.
Keywords: Honey, Astragalus, Altitude, Aroma, GS-MS-FID.
Pratical Applications
Honey, produced by honey bees using many different herbal resources, is an important food item with its
economic and nutritional value worldwide. Aroma compounds play an important role in the quality of
honey, which is named according to the plant origin from which it is obtained. Although many scientific
studies have been conducted on the aroma compounds of honey, no studies have been found on the effect
of altitude on these compounds. The influence of altitude on astragalus honey was presented in this study,
and thus the gap in the relationship between aroma compounds and altitude was scientifically filled for the
first time.
INTRODUCTION
Honey is a natural, sweet, and viscous product produces by honey bees. Honey is an important food
substance with an economic value around the world (Kaçaroğlu, 2011). According to FAO data, 1850868
tonnes of honey was produced in 2019, worldwide. After China, Turkey is the second producer country
with a total of 109330 tonnes of annual honey production (Anonymous, 2021). Astragalus honey is being
produced in numerous parts of Turkey where is rich in the means of endemic plant diversity. Astragalus
plant is deployed in Anatolia up to approximately 3500 meters altitude (Kadioglu vd., 2008). Adana is an
important region for its production of astragalus honey. Approximately 10% of the high-quality honey of
Turkey is produced in Adana (Anonymous, 2019b).
When it comes to quality, properties such as color, taste, texture, and aroma are mentioned. The effect of
the aroma on the quality of honey is crucial among these characteristics. In many studies on astragalus
honey and the other honey types to date, aroma groups such as terpenes, norisoprenoids, lactones, alcohols,
esters, aldehydes, and ketones were detected (ChangWei vd., 2018; Costa vd., 2019; Karabagias vd., 2018,
International Conference on
RAW MATERIALS TO PROCESSED FOODS 03-04 June 2021, Turkey
266
2020; Makowicz vd., 2018; Tanleque-Alberto vd., 2019; Uçkun, 2011). However, no studies focusing on
the effect of altitude on aroma compounds of any kind of honey have been encountered so far. Only a few
studies focus on the effect of altitude on the chemical and physicochemical properties (Bouhala vd., 2020;
Mohammed vd., 2017).
In the presented study, it is aimed to determine the effect of the altitude on aroma compounds as well as the
chemical and physicochemical properties of astragalus honey obtained from the different altitudes (620
meters, 1050 meters, and 1700 meters) of the Adana region.
MATERIALS AND METHOD
Materials
Honey samples were obtained from honey producers as centrifugal honey (1 kg each) from the county of
Feke (620 meters), Saimbeyli (1050 meters), and Tufanbeyli (1700 meters) of Adana province in 2017. All
the chemical solvents and standard compounds were acquired from Sigma Aldrich (St. Louis, Missouri,
USA) and Merck (Darmstadt, Germany).
Chemical and Physico-Chemical Analyses
The pollen analyses of honey samples were performed according to DIN 10760 (Anonymous, 2002a). For
dry materials analyses, honey samples were weighed as 0.5-1 gr in aluminum crucibles. After that, the
samples were dried at 60 ºC until they reached the constant weight (Kurt & Yamankaradeniz, 1982). The
electrical conductivity test was carried out according to DIN 10753 method for honey samples
(Anonymous, 2000). The pH analyses were made by directly using a pH meter. Then, 5 gr of honey were
dissolved in water and they were titrated with 0.1 N NaOH until the pH reached 8.2. Total acidity
calculations were made by using the amount of NaOH used (Manzanares vd., 2011). The proline amount in
the honey samples was determined quantitively by using the spectrophotometric technique (Horwitz, 2000).
Diastase numbers were determined with the TS-3036 method. The water bath that was used for this purpose
was set to 48 ˚C (Anonymous, 2002b).
HMF Analyses
HMF content in honey samples was determined by using Agilent 1100A model HPLC and Agilent 1100A
model diode array detector (Zappalà vd., 2005). For HMF analysis ACE C18 column was used. The
column flow rate was 0,5 ml/min, and the column temperature was 30 ºC. As the mobile phase,
MeOH/Acetic Acid/Water (20/2/78) was preferred. The injection volume was 20 μL, elution time was 20
min and the wavelength was 285 nm. The external standard method was used to calculate the amount of
HMF in honey samples.
Sugar Component Analyses
The sugar (glucose, fructose, and saccharose) analyses in honey samples were made by using Shimadzu
10A model HPLC, Shimadzu RID-10A reactive index detector, and aminex column (Rudnitskaya vd.,
2006). The column temperature was set to 30 ºC and the flow rate was set to 1,3 ml/min. As the mobile
phase, Acetonitrile/Water (80/20) was used. The injection volume was 10 μL. The external standard
method was used to calculate the amount of sugar component (glucose, fructose, and saccharose) in honey
samples.
Carbon Isotope and C4 Sugar Ratio
13C/12C ratio and from this value C4 sugar content was determined by mass spectrometry. The honey
samples were weighed 1 mg and put in tinnen capsules and closed tightly. As a standard, 1 gr of saccharose
was weighed and put in tinnen capsules. To prepare a protein precipitate, 10-12 gr of honey samples were
put in 50 ml centrifuge tubes and mixed with 4ml of distilled water. In another tube, 2 ml of 10% Na2WO4
(Sodium tungstate) and 2 ml of 0.335 M H2SO4 were mixed and added to the honey solution. To form a
clouding and a precipitate afterward, they were put in the water bath at 80 °C. In case of no clouding, 2 ml
International Conference on
RAW MATERIALS TO PROCESSED FOODS 03-04 June 2021, Turkey
267
more of 0.335 M H2SO4 was added. After the precipitation, distilled water was added to the tubes until the
total amount reached 50 ml. After that, the samples were centrifuged at 1500 rpm for 5 minutes and the
clear part was poured out. The remaining precipitate was diluted to 50 ml and centrifuged again 5 times.
The precipitate was dried in the oven at 75 °C for 3 hours and 1 mg of dried protein was put into the tinnen
capsule. Saccharose standard in the tinnen capsule, honey sample, and the protein precipitate was put in the
THERMO IRMS (infrared-mass spectroscopy) and 13C/12C ratios were determined and from the acquired
values, C4 sugar ratio was calculated (Çınar, 2010).
Isolation of the Aroma Compounds
The aroma compounds were isolated by using the liquid-liquid extraction method in the honey samples.
The extraction processes were repeated for each sample at least three times with dichloromethane (CH2Cl2)
solvent. 40 g of honey sample was diluted with 22 ml of water, then 40 ml of dichloromethane and 40 μg 4-
nonalol (internal standard) were added. After that, the mixture was poured into the 500 ml Erlenmeyer
flask. This mixture was stirred at 4-5 °C for 40 minutes under the nitrogen atmosphere. Then the mixture
was centrifuged at 9000 rpm for 15 minutes at 0 ºC. At the end of this procedure, the organic phase
consisting of the aroma compounds was taken and concentrated at 45 °C in Vigreux concentrator until 0,5
ml left. The concentrated extract was injected into the GC-MS-FID (Jerković vd., 2010; Uçkun, 2011).
GS-MS-FID Analyses
Agilent 6890N gas chromatography integrated with flame ionization detector (FID) and Agilent 5975B VL
MSD mass spectrometry was used for identification and quantification of the aroma compounds. The
separation of the aroma compounds was carried out by using a DB-WAX capillary column (30 m x 0.25
mm x 0.25 µm). The injector temperature was set to 220 ºC and the detector temperature was set to 250 °C.
Helium was selected as the carrier gas. The flow rate of helium was 3,3 ml/min. The injection volume was
3 μl. The ion source temperature of the mass spectrometry was kept at 250°C, ionization energy was kept at
70 eV, quadrupole temperature was kept at 120 °C and scanned with 1-second intervals between 29-350
mass/charge (m/e) The column temperature was increased from 40 °C for 4 minutes to 220 °C with a rate
of 2 °C per minute, and then to 245 °C with a rate of 3 °C per minute and kept there for 20 minutes
(Schneider vd., 1998, 2001). The identification of the peaks was conducted using the mass spectrometry
device library (Wiley 7.0, NIST 98, and Flavor 2L), standards, and retention index of the aroma
compounds. All the retention index values of the aroma compounds were determined by injecting a
solution that consists of every alkane between C8-C36, under the aforementioned column and gas
chromatography circumstances. Concentrations of the aroma compounds were calculated by the method of
internal standards (Van Den Dool & Kratz, 1963).
Calculation of Odor Activity Value
Odor active compounds give food its characteristic fragrance. Various methods can be used to determine
the odor active compounds. One of these methods is to determine the “Odor Activity Value” of the aroma
compounds that have been determined in GC-MS. This value is calculated by dividing the concentration of
the compound in the honey by the odor threshold value of that compound in water. The odor threshold
values of aroma compounds in water were determined as a result of literature research. If the odor activity
value is greater than 1, the compound is considered as an active compound, and the activity increases with
the increasing value.
Sensory Evaluation of the Honey Samples
The sensory evaluation of the astragalus honey was performed with the help of a pre-made 10 cm scale
conducted by a 9 people specialist panelist group, in two different methods (Uçkun, 2011). As a taste
profile analysis, firstly, the panelists were asked to evaluate the samples in manners of color, viscosity,

International Conference on
RAW MATERIALS TO PROCESSED FOODS 03-04 June 2021, Turkey
268
flavor, taste balance, crystallization, and general impressions. Later, they were asked to do an aroma profile
analysis, evaluating the odor in honey samples if it is flowery, caramel, fresh, fruity, and foreign odor
(medication, etc.)
Statistical Analyses
In the statistical evaluation of the research results, XLStat (2020) (Addinsoft, New York, NY, USA)
package software was used. Concentrations and the standard deviations (SD) were determined by using MS
Office Excel. To estimate the differences, variance analysis Duncan’s multiple comparison test was used.
Meaningful differences are accepted as p <0,05. Also, a principal component analysis (PCA) was made.
RESULTS AND DISCUSSION
The Chemical and Psycho-chemical Composition of Honeys
The physical and chemical analysis results of the astragalus honey samples were given in Table 1.
Table 1. Chemical and Physico-chemical Properties of the Astragalus Honey Samples
620 meters 1050 meters 1700 meters
Pollen Amount
%
67.47 Astragalus
5.26 Scorzonera
5.26 Plantago
5.26 Onobrychis
5.26 Maple
5.26 Cedrus
6.23 Other
63.46 Astragalus
12.50 Terebinth
8.33 Onobrychis
8.33 Centaurea
7.38 Trifolium repens
49.29 Astragalus
28.45 Eucalyptus
12.12 Linaria
5.45 Sunflower
4.69 Other
pH 3.99a 3.98a 3.35b
Total Acidity
(meq/kg) 18.21c 22.14b 26.00a
Dry Material
(%) 82.94a 83.06a 84.13a
Humidity (%) 17.06a 16.94a 15.87a
Conductivity
(mS/cm) 0.34c 0.51a 0.39b
Proline (mg/kg) 434.33c 802.00a 644.67b
Fructose +
Glucose
(g/100g)
66.20a 66.89 a 67.42 a
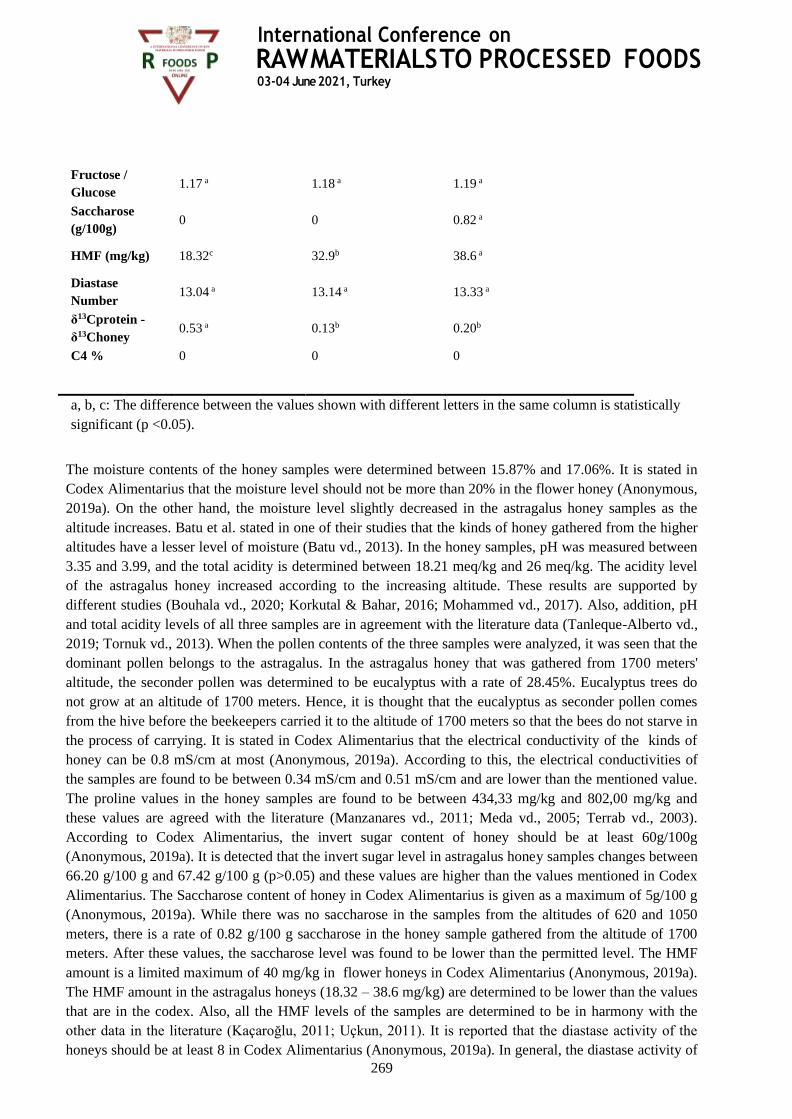
International Conference on
RAW MATERIALS TO PROCESSED FOODS 03-04 June 2021, Turkey
269
Fructose /
Glucose 1.17 a 1.18 a 1.19 a
Saccharose
(g/100g) 0 0 0.82 a
HMF (mg/kg) 18.32c 32.9b 38.6 a
Diastase
Number 13.04 a 13.14 a 13.33 a
δ13Cprotein -
δ13Choney 0.53 a 0.13b 0.20b
C4 % 0 0 0
a, b, c: The difference between the values shown with different letters in the same column is statistically
significant (p <0.05).
The moisture contents of the honey samples were determined between 15.87% and 17.06%. It is stated in
Codex Alimentarius that the moisture level should not be more than 20% in the flower honey (Anonymous,
2019a). On the other hand, the moisture level slightly decreased in the astragalus honey samples as the
altitude increases. Batu et al. stated in one of their studies that the kinds of honey gathered from the higher
altitudes have a lesser level of moisture (Batu vd., 2013). In the honey samples, pH was measured between
3.35 and 3.99, and the total acidity is determined between 18.21 meq/kg and 26 meq/kg. The acidity level
of the astragalus honey increased according to the increasing altitude. These results are supported by
different studies (Bouhala vd., 2020; Korkutal & Bahar, 2016; Mohammed vd., 2017). Also, addition, pH
and total acidity levels of all three samples are in agreement with the literature data (Tanleque-Alberto vd.,
2019; Tornuk vd., 2013). When the pollen contents of the three samples were analyzed, it was seen that the
dominant pollen belongs to the astragalus. In the astragalus honey that was gathered from 1700 meters'
altitude, the seconder pollen was determined to be eucalyptus with a rate of 28.45%. Eucalyptus trees do
not grow at an altitude of 1700 meters. Hence, it is thought that the eucalyptus as seconder pollen comes
from the hive before the beekeepers carried it to the altitude of 1700 meters so that the bees do not starve in
the process of carrying. It is stated in Codex Alimentarius that the electrical conductivity of the kinds of
honey can be 0.8 mS/cm at most (Anonymous, 2019a). According to this, the electrical conductivities of
the samples are found to be between 0.34 mS/cm and 0.51 mS/cm and are lower than the mentioned value.
The proline values in the honey samples are found to be between 434,33 mg/kg and 802,00 mg/kg and
these values are agreed with the literature (Manzanares vd., 2011; Meda vd., 2005; Terrab vd., 2003).
According to Codex Alimentarius, the invert sugar content of honey should be at least 60g/100g
(Anonymous, 2019a). It is detected that the invert sugar level in astragalus honey samples changes between
66.20 g/100 g and 67.42 g/100 g (p>0.05) and these values are higher than the values mentioned in Codex
Alimentarius. The Saccharose content of honey in Codex Alimentarius is given as a maximum of 5g/100 g
(Anonymous, 2019a). While there was no saccharose in the samples from the altitudes of 620 and 1050
meters, there is a rate of 0.82 g/100 g saccharose in the honey sample gathered from the altitude of 1700
meters. After these values, the saccharose level was found to be lower than the permitted level. The HMF
amount is a limited maximum of 40 mg/kg in flower honeys in Codex Alimentarius (Anonymous, 2019a).
The HMF amount in the astragalus honeys (18.32 – 38.6 mg/kg) are determined to be lower than the values
that are in the codex. Also, all the HMF levels of the samples are determined to be in harmony with the
other data in the literature (Kaçaroğlu, 2011; Uçkun, 2011). It is reported that the diastase activity of the
honeys should be at least 8 in Codex Alimentarius (Anonymous, 2019a). In general, the diastase activity of
International Conference on
RAW MATERIALS TO PROCESSED FOODS 03-04 June 2021, Turkey
270
the astragalus honey samples (13.04 -13.33) are found to be more than that is in the codex and that these
values are agreed with the literature (Bergamo vd., 2019; Gangwar & Gebremariam, 2010; Gomes vd.,
2010; Kaçaroğlu, 2011). In a former study it is concluded that the value difference between the values of
protein in honey and values of delta C13 in crude honey should be -1.0 or higher. In another study it is said
that the C4 sugar content, that is calculated from the levels of protein in honey and of delta C13 in crude
honey, can be maximum 7% (Padovan vd., 2003, 2007). In all the samples of astragalus honey, mentioned
values are met; this means that sugar cane or corn syrup was not used to make the honeys.
The Aroma Compounds of Astragalus Honeys
The aroma compounds of the astragalus honey samples are given in Table 2. The sum of the aroma
compounds of the astragalus honey samples gathered from altitudes of 620, 1050, and 1700 meters were
14600.50 µg/kg, 29882.90 µg/kg, 16372.89 µg/kg, respectively. In the honey samples obtained from
altitudes of 620, 1050, and 1700 meters; 53, 50, and 49 different aroma compounds identified, respectively;
and these compounds are gathered under 10 different groups, such as aldehydes and ketones, alcohols,
esters, furans and pyrans, lactones, norisoprenoids, terpenes and terpenoids, volatile acids, volatile phenol
compounds, and volatile sulfur compounds. Costa et al., in one of their studies on unifloral Melipona
honey, determined 42 different aroma compounds and gathered them in 12 groups (Costa vd., 2019).
Aldehydes and Ketones
Even though aldehydes and ketones are present in the honey with low concentrations, they can be
characterized by their strong odors (Tian vd., 2016). Among the aldehydes and ketones, 4-hydroxy4-
methyl-2-pentanone was the dominant compound in the honey samples gathered from altitudes of 620 and
1700 meters. Whereas 1- hydroxy-2-propanone was the dominant compound in the honey sample obtained
from the altitude of 1050 meters. The ratio of the 4-hydroxy-4-methyl-2-pentanone compound was 53.5%,
23.8%, and 22.4%, respectively with the increasing altitude and the amount of these compounds decreases
with the increasing altitude (p<0.05). Similarly, the amount of benzaldehyde lowers with the increasing
altitude (p<0.05).
Generally, the sum amount of the aldehydes and ketones did not change with the increasing altitude.
Although the amount of 3-hydroxy-2-butanone and 1-hydroxy-2-butanone increased with increasing
altitude, the amount of 4-hydroxy-4-methyl-2-pentanone and benzaldehyde decreased.
Alcohols
The alcohol compounds in the honey come from the reductase enzymes catalyzing the aldehydes by the
bees and the contaminant microorganisms or the oxidative decomposition of the lipids (Moreira vd., 2010).
The alcohol content in the astragalus honey obtained from the altitude of 1050 meters was found to be more
than the other samples. Remarkably, the proportional decrease in the alcohol compounds got higher with
the increasing altitude.
In a former study, it is concluded that the 2-methyl-2-butanol, which was characterized by the fragrance of
camphor tree has a 1200 µg/kg odor threshold value (Forero vd., 2015). The amount of this compound in
the honey samples is 1147.22 µg/kg, 2090.64 µg/kg, and 1251.46 µg/kg, respectively to the altitude. The
odor activity values of the 2-methyl-2-butanol were 2.05 for the honey sample obtained from the altitude of
1050 meters and 1.23 for the honey sample gathered from the altitude of 1700 meters. However, the odor
activity values of this compound were less than 1 for the honey sample obtained from the altitude of 620

International Conference on
RAW MATERIALS TO PROCESSED FOODS 03-04 June 2021, Turkey
271
meters. According to these values, it could be said that with the increasing altitude, the influence of 2-
methyl-2-butanol on the odor characteristics of the astragalus honey also increased concerning honey
sample obtained from the altitude of 620 meters (p<0.05).
The odor threshold value for 2-phenyl-ethanol, characterized by the fragrance of rose or honey (Forero vd.,
2015), is reported as 1000 µg/kg (Leffingwell & Leffingwell, 1991). The amounts of 2phenyl-ethanol were
respectively detected as 122.29 µg/kg, 130.19 µg/kg, and 117.76 µg/kg, concerning the increasing altitude
(p>0.05). The odor activity value of 2-phenyl-ethanol was determined to be less than 1 in each of the three
samples.
It was established that with the increasing altitude, the content of the alcohol compounds in the sum of all
the aroma compounds proportionally decreased. However, it was recorded that the 3-methyl- 1-butanol and
benzyl alcohol compounds increased with the altitude.

International Conference on
RAW MATERIALS TO PROCESSED FOODS 03-04 June 2021, Turkey
272

International Conference on
RAW MATERIALS TO PROCESSED FOODS 03-04 June 2021, Turkey
273
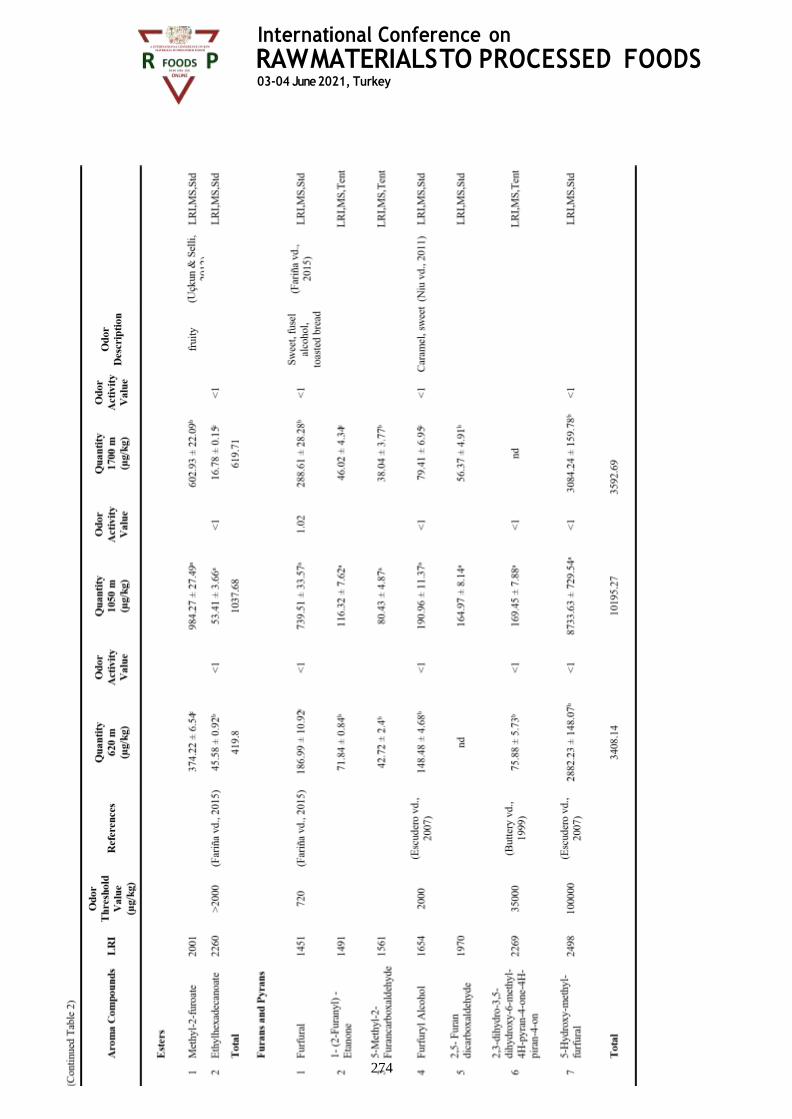
International Conference on
RAW MATERIALS TO PROCESSED FOODS 03-04 June 2021, Turkey
274
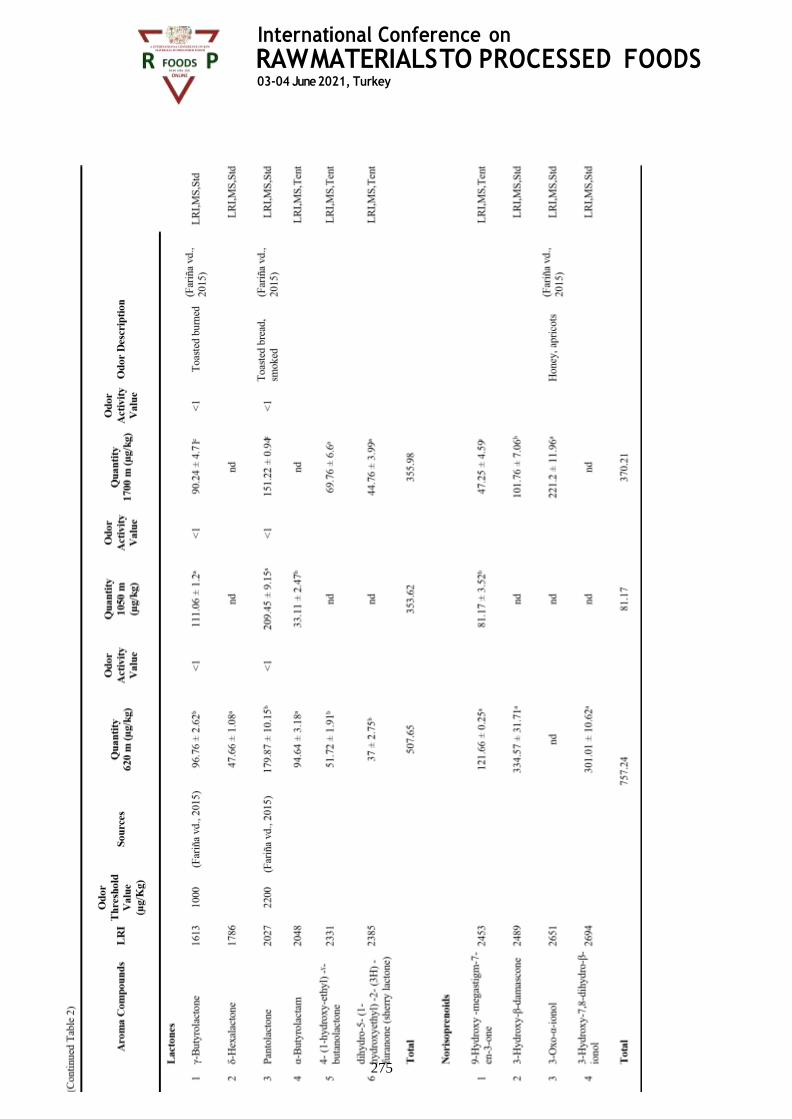
International Conference on
RAW MATERIALS TO PROCESSED FOODS 03-04 June 2021, Turkey
275
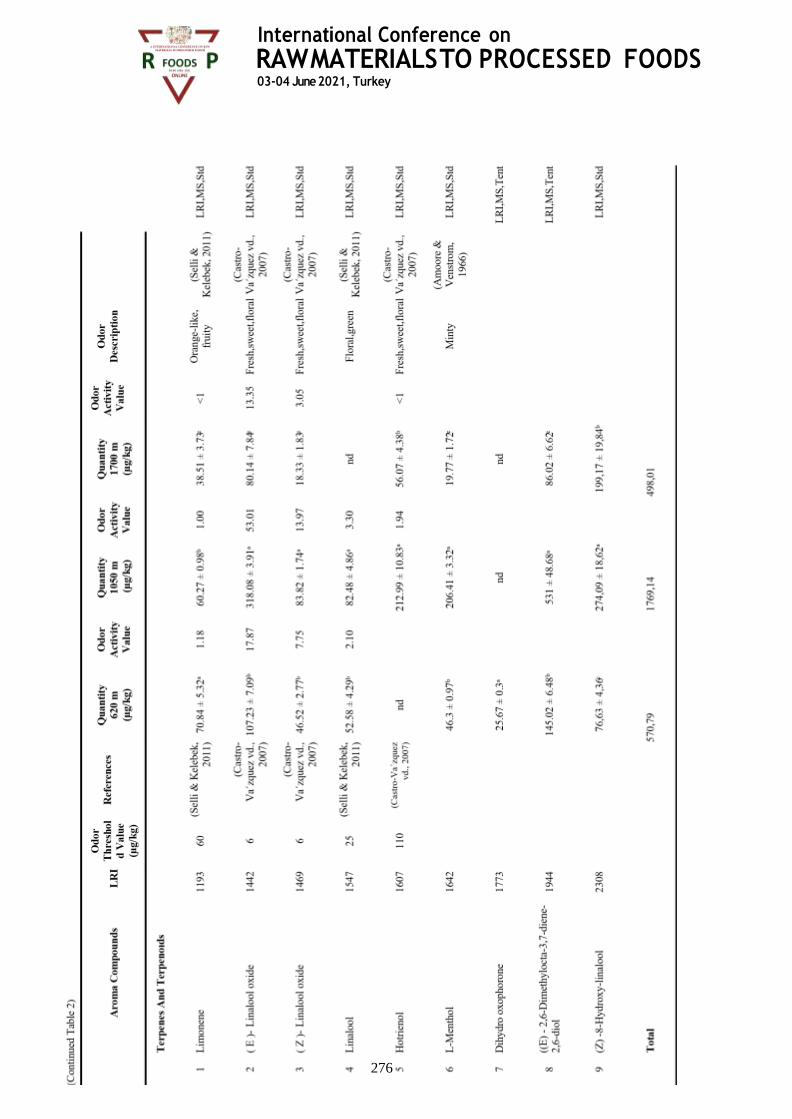
International Conference on
RAW MATERIALS TO PROCESSED FOODS 03-04 June 2021, Turkey
276
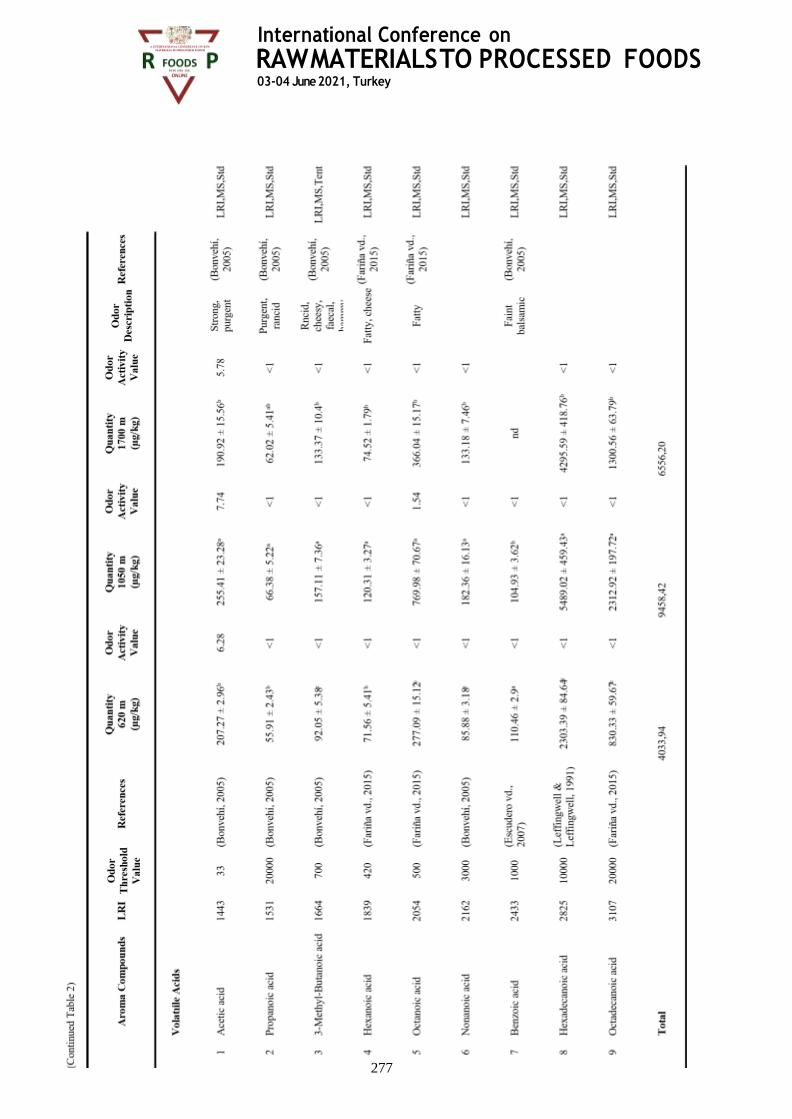
International Conference on
RAW MATERIALS TO PROCESSED FOODS 03-04 June 2021, Turkey
277

International Conference on
RAW MATERIALS TO PROCESSED FOODS 03-04 June 2021, Turkey
278
International Conference on
RAW MATERIALS TO PROCESSED FOODS 03-04 June 2021, Turkey
279
Esters
Two ester compounds, methyl-2-furoate and ethyl hexadecanoate, were found in all astragalus honey
samples. The ratios of these compounds in the sum of all the aroma compounds for honey samples obtained
from the altitudes of 620, 1050 and 1700 meters were 2.8%, 3.4%, and 3.7%, respectively. Most of the
ester compounds, which occur with the esterification of acidic and alcoholic compounds, can be
characterized by fruit and flower odors (Tian vd., 2016). Ethyl hexadecanoate in the astragalus honey
samples was found to be 45.58 μg/kg, 53.41 μg/kg, and 16.78 μg/kg, respectively to the altitude. On the
other hand, amounts of the methyl-2-furoate compound were determined to be 374.22 μg/kg, 984.27 μg/kg,
and 602.93 μg/kg respectively to the altitude. In an overall look, the amount of the ester compounds
increased in the higher altitudes, among all the aroma compounds.
Furans and Pyrans
The ratios of furan and pyran compounds in the sum of all the aroma compounds were found to be 23%,
34%, and 21%, respectively to the altitude. Furan compounds could be present in kinds of honey as a result
of insufficient heat treatment and storing conditions. Furan compounds could also be associated with the
smoke that is being used by the beekeepers to drive the bees out of the hive and reduce their aggression.
(Tanleque-Alberto vd., 2019).
Furfural is a product of the Maillard reaction and occurs from the cyclization and dehydration of a
dehydroreductor from a pentose (Moreira vd., 2010). The odor threshold value of the furfural compound,
which was characterized by alcoholic and burnt smell, is 720 µg/kg (Buttery vd., 1988). The odor activity
value of the furfural compound was only determined as 1.02 in the honey sample obtained from the altitude
of 1050 meters. The amount of this compound is 186.99 μg/kg, 739.51 μg/kg, and 288.61 μg/kg,
respectively to the altitude.
The 5-hydroxy-methyl-furfural compound may increase during storage. Also, it is known that this
compound may be formed as a result of the Maillard reaction that took place with the cyclization and
hydration of a dehydroreductor from a hexose (glucose and fructose) (Moreira vd., 2010). The amounts of
the 5-hydroxy-methyl-furfural compound were found to be 2882.23 µg/kg, 8733.63 µg/kg, and 3084.24
µg/kg in honey samples obtained from altitudes of 620, 1050, and 1700 meters, respectively.
Amounts of furfuryl alcohol in the honey samples were 148.84 μg/kg, 190.96 μg/kg, and 79.41 μg/kg,
respectively (p<0.05). 5-methyl-2-furancarboxaldehyde compound was found to be 42.72 μg/kg, 80.43
μg/kg and 38.04 μg/kg, respectively (p<0.05). Generally, it was observed that the furan and pyran
compounds are not affected by the change of altitude.
Lactones
γ- and δ-lactones are important lactone groups that are present naturally in some fruits and some fermented
foods, and they have a pleasant odor characteristic. It is also reported that most of the lactone compounds
have a fruity fragrance (peach, coconut, anise, etc.) (Yılmaztekin & Erten, 2008).
The amount of the γ-butyrolactone compound is 96.76 μg/kg, 111.06 μg/kg, and 90.24 μg/kg, respective to
the altitude. In a prior study, the aroma profiles of different kinds of honey were investigated and it is found
that γ-butyrolactone compound, which is characterized by the fragrance of honey, is present in 9 different
kinds of honey (Seisonen vd., 2015).
Pantolactone compound is characterized by the fragrance of burnt bread. (Forero vd., 2015). The ratios of
this compound in the sum of the lactone compounds was found to be 36%, 59%, and 42% in the honey
samples respectively to altitudes (p<0.05)
While dihydro-5-(1-hydroxyethyl)-2-(3H)-furanone, also known as sherry lactone, was not detected in the
International Conference on
RAW MATERIALS TO PROCESSED FOODS 03-04 June 2021, Turkey
280
honey sample from 1050 meters’ altitude, the amount of this compound in the honey sample obtained from
the altitude of 620 meters was found as 37 μg/kg. Moreover, the amount of sherry lactone in the honey
sample obtained from the altitude of 1700 meters was also determined as 44.76 μg/kg (p<0.05).
If it is concluded in terms of the altitude effect on the lactone compounds, it could be said that the total
amount of lactone compounds was higher in the low altitude honey samples. On the other hand, while the
amount of the α-butyrolactam compound decreased with the increasing altitude, the amount of γ-
butyrolactone increased.
Norisoprenoids
Norisoprenoids are an important class in the aroma compounds, that is defined in nature. Norisoprenoids,
which are present in most plants, especially tobacco, occur as a result of the degradation of carotenoids
(Cabaroğlu vd., 1997). They can also be isolated from honey since the source of most of them are flowers
(Guyot-declerck vd., 2000).
Among the norisoprenoids, 3-oxo-α-ionol is characterized by the honey odor (Forero vd., 2015). Also, this
compound was found in the honey sample obtained from the altitude of 1700 meters and its amount was
calculated as 221.2 µg/kg (p<0.05). It is believed that the presence of the 3-oxo-α-ionol compound in the
honey sample gathered from the altitude of 1700 meters is related to the presence of eucalyptus in the
pollen analysis. This point of view is supported by two different studies that found 3-oxo-α-ionol in the
eucalyptus honey (Alissandrakis vd., 2011; Vázquez vd., 2006).
The presence of the 9-hydroxy-megastigm-7-en-3-on compound in the honey samples is 121.66 μg/kg,
81.17 μg/kg, and 47.25 μg/kg, respectively concerning the altitude. Another important norisoprenoid
compound 3-hydroxy-β-damascone amount was determined as 334.57 μg/kg in the honey sample obtained
from the altitude of 620 meters and 101.76 μg/kg in honey sample gathered from the altitude of 1700
meters (p<0.05).
The amount of the norisoprenoid compounds was detected to be high in the lower altitudes. It is known that
the source of these compounds has flower origins (Guyot-declerck vd., 2000). It may be thought that the
reason for the lower amount of the norisoprenoid compounds in the honey samples obtained from high
altitudes may be connected to the decrease of the variety of flowers and plants in these altitudes.
Terpene and Terpenoids
The origin of the terpenes and their derivatives in the honey is related to the gathered nectar by the bees and
the honey essence (Soria vd., 2008). The ratios of the terpenes and terpenoids in the sum of all aroma
compounds were 3.9%, 5.8%, and 3%, respectively concerning altitudes. It was determined that some of
the terpene and terpenoid compounds have a significant role in the aroma of the astragalus honey. It was
reported that the odor threshold value of (E)-Linalool oxide and (Z)-Linalool oxide, which is characterized
by the fragrance of fresh and flowery, is 6 µg/kg (Castro-Vazquez vd., 2007). The amount of (E)-Linalool
oxide in the honey samples was 107.23 µg/kg, 318.08 µg/kg, and 80.14 µg/kg; and the odor activity values
were calculated as 17.87, 53.01, and 13.35, respectively to the increasing altitude. The amount of (Z)-
Linalool oxide in the honey samples was 46.52 µg/kg, 83.82 µg/kg, and 18.33 µg/; and the odor activity
values were calculated as 7.75, 13.97, and 3.05, respectively to the increasing altitude. It could be seen
from the results, that both (E)-Linalool oxide and (Z)-Linalool oxide compounds influence significantly the
flavour characteristics of the astragalus honey. It is reported that the hotrienol compound is present in most
kinds of flower honey, especially lavender honey (Marijanovic vd., 2009). This compound can occur either
in the maturity process of the honey or during the thermal degradation of 1-terpendiol or 8-hydroxylinalool
compounds. Also, hotrienol may occur in the later stage oxidation of lilac aldehydes, as well as a result of
isomerization of (E)-8-hydroxylinalool to lilac alcohols from lilac aldehydes (Jerkovic vd., 2013). The odor
threshold value of the hotrienol, which is characterized by the flowery fragrance, is 110 µg/kg (Castro-
International Conference on
RAW MATERIALS TO PROCESSED FOODS 03-04 June 2021, Turkey
281
Va´zquez vd., 2007). The amount of this compound was determined to be 212.99 µg/kg in the honey
sample obtained from 1050 meters’ altitude and 56.07 µg/kg in the honey sample gathered from the altitude
of 1700 meters. However, it was not found in the honey sample obtained from 620 meters’ altitude
(p<0.05). The odor activity value of hotrienol was calculated as lower than 1 in the honey sample gathered
from 1700 meters’ altitude and as 1.94 in the honey sample obtained from the altitude of 1050 meters. It
was reported that the hotrienol compound is the characteristic aroma compound of different citrus and
lavender honey which are characterized by the flowery and fruity odor (Gianelli Barra vd., 2010). The odor
threshold value of the linalool, which is characterized by a flowery and green-like fragrance, is 25 µg/kg
(Selli & Kelebek, 2011). The amount of this compound was determined as 52.58 µg/kg in the honey sample
obtained from the altitude of 620 meters and 82.48 µg/kg in the honey sample gathered from the altitude of
1050 meters, yet there is no trace of it in the honey sample obtained from 1700 meters altitude. The odor
activity value of linalool was calculated as 2.10 in the honey sample gathered from 620 meters altitude and
3.30 in the honey sample obtained from1050 meters altitude. It was seen from these results that linalool
plays an important role in the characteristic aroma of astragalus honey gathered from 620 and 1050 meters
altitudes. The odor threshold value of the limonene compound, which is characterized by orange-like and
fruity fragrance, is 60 µg/kg (Selli & Kelebek, 2011). The amounts of limonene compound in the honey
samples were 70.84 µg/kg, 60.27 µg/kg, and 38.51 µg/kg, respectively to the altitudes. The odor activity
values of limonene were respectively found as 1.18 and 1 in the honey samples obtained from 620 meters
and 1050 meters altitudes. The reason for the absence of some terpene and terpenoid compounds such as
linalool and limonene in the honey sample gathered from 1700 meters altitude may be the lack of diversity
in higher altitudes. While the amount of (E)-Linalool oxide, (Z)-Linalool oxide, L-menthol, and linalool
decreased with the increase of altitude, the amount of (Z)-8-hydroxy linalool increased. The amount of
limonene compound also decreased with increasing the altitude.
Volatile Acids
It is reported in a previous study, that the odor threshold value of acetic acid, which is characterized by the
spicy, vinegar fragrance, is 33 µg/kg (Bonvehí, 2005). The amount of acetic acid in the honey samples is
207.27 µg/kg, 255.41 µg/kg, and 190.92 µg/k, respectively to the increasing altitude. The odor activity
values of this compound were respectively calculated as 6.28, 7.74, and 5.78 in the honey samples obtained
from altitudes of 620, 1050, and 1700 meters, and it is concluded that the acetic acid influences the
characteristic aroma of the astragalus honey. It was reported in former studies, that the carboxylic acids,
such as acetic acid, give a pleasant and spicy odor to the kinds of honey, whereas butanoic acid and
hexanoic acid, which are present in butter, give an odor, which may be unpleasant, to honey (Tian vd.,
2016).
Volatile Phenols
The odor threshold value of 2-methoxy-4-vinyl-phenol characterized the spicy fragrance is 5µg/kg in the
literature (Forero vd., 2015). This compound was determined as 11.85 µg/kg in the honey sample obtained
from 620 meters altitude and 48.55 µg/kg in the honey sample gathered from 1700 meters altitude.
However, it was not found in the honey sample obtained from 1050 meters. Odor activity values of this
compound were calculated as 2.37 in the honey sample obtained from 620 meters altitude and as 9.71 in the
honey sample gathered the altitude of 1700 meters. It was detected that the 2-methoxy-4-vinyl-phenol has a
significant influence on the formation of the characteristic odor of the two astragalus honey samples.
Volatile Sulphurs
The odor threshold value of benzothiazole, which is characterized by a moss-like, roasted fragrance is 80
µg/kg (Leffingwell & Leffingwell, 1991; Okabe vd., 2019). The amount of benzothiazole in the honey
samples is 57.52 µg/kg, 149.41 µg/kg, and 68.01 µg/kg, respectively to the altitudes. The odor activity
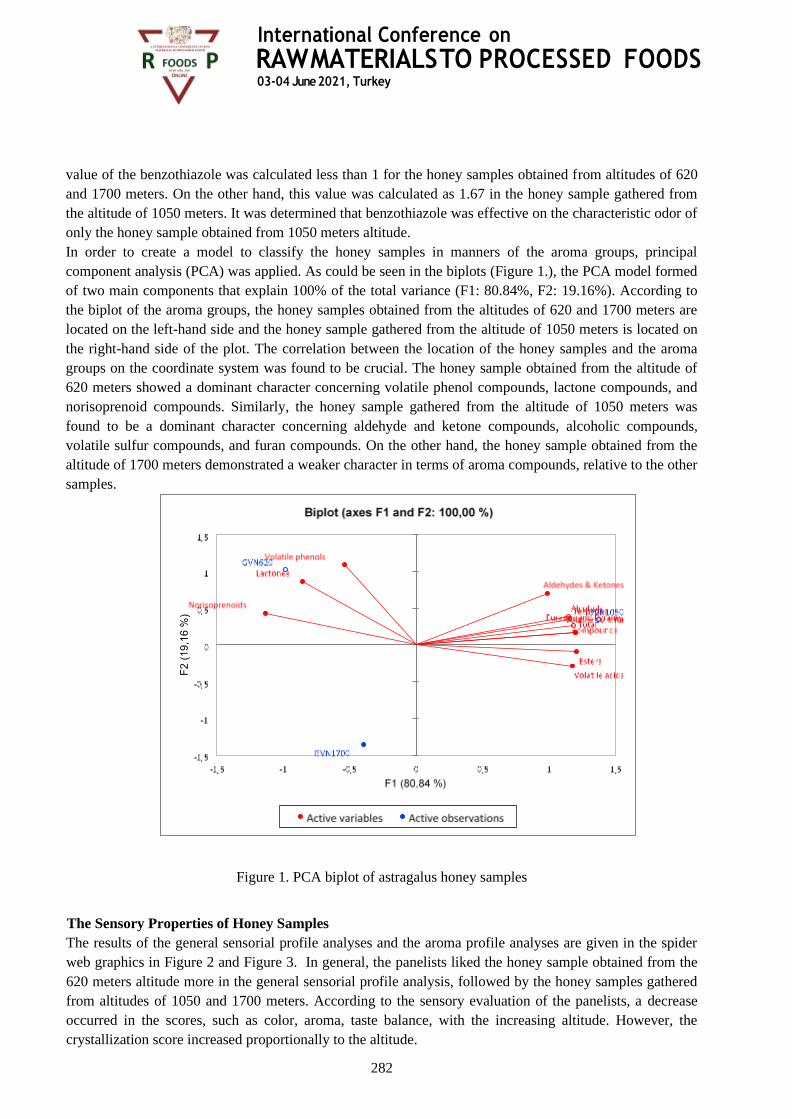
International Conference on
RAW MATERIALS TO PROCESSED FOODS 03-04 June 2021, Turkey
282
value of the benzothiazole was calculated less than 1 for the honey samples obtained from altitudes of 620
and 1700 meters. On the other hand, this value was calculated as 1.67 in the honey sample gathered from
the altitude of 1050 meters. It was determined that benzothiazole was effective on the characteristic odor of
only the honey sample obtained from 1050 meters altitude.
In order to create a model to classify the honey samples in manners of the aroma groups, principal
component analysis (PCA) was applied. As could be seen in the biplots (Figure 1.), the PCA model formed
of two main components that explain 100% of the total variance (F1: 80.84%, F2: 19.16%). According to
the biplot of the aroma groups, the honey samples obtained from the altitudes of 620 and 1700 meters are
located on the left-hand side and the honey sample gathered from the altitude of 1050 meters is located on
the right-hand side of the plot. The correlation between the location of the honey samples and the aroma
groups on the coordinate system was found to be crucial. The honey sample obtained from the altitude of
620 meters showed a dominant character concerning volatile phenol compounds, lactone compounds, and
norisoprenoid compounds. Similarly, the honey sample gathered from the altitude of 1050 meters was
found to be a dominant character concerning aldehyde and ketone compounds, alcoholic compounds,
volatile sulfur compounds, and furan compounds. On the other hand, the honey sample obtained from the
altitude of 1700 meters demonstrated a weaker character in terms of aroma compounds, relative to the other
samples.
Figure 1. PCA biplot of astragalus honey samples
The Sensory Properties of Honey Samples
The results of the general sensorial profile analyses and the aroma profile analyses are given in the spider
web graphics in Figure 2 and Figure 3. In general, the panelists liked the honey sample obtained from the
620 meters altitude more in the general sensorial profile analysis, followed by the honey samples gathered
from altitudes of 1050 and 1700 meters. According to the sensory evaluation of the panelists, a decrease
occurred in the scores, such as color, aroma, taste balance, with the increasing altitude. However, the
crystallization score increased proportionally to the altitude.
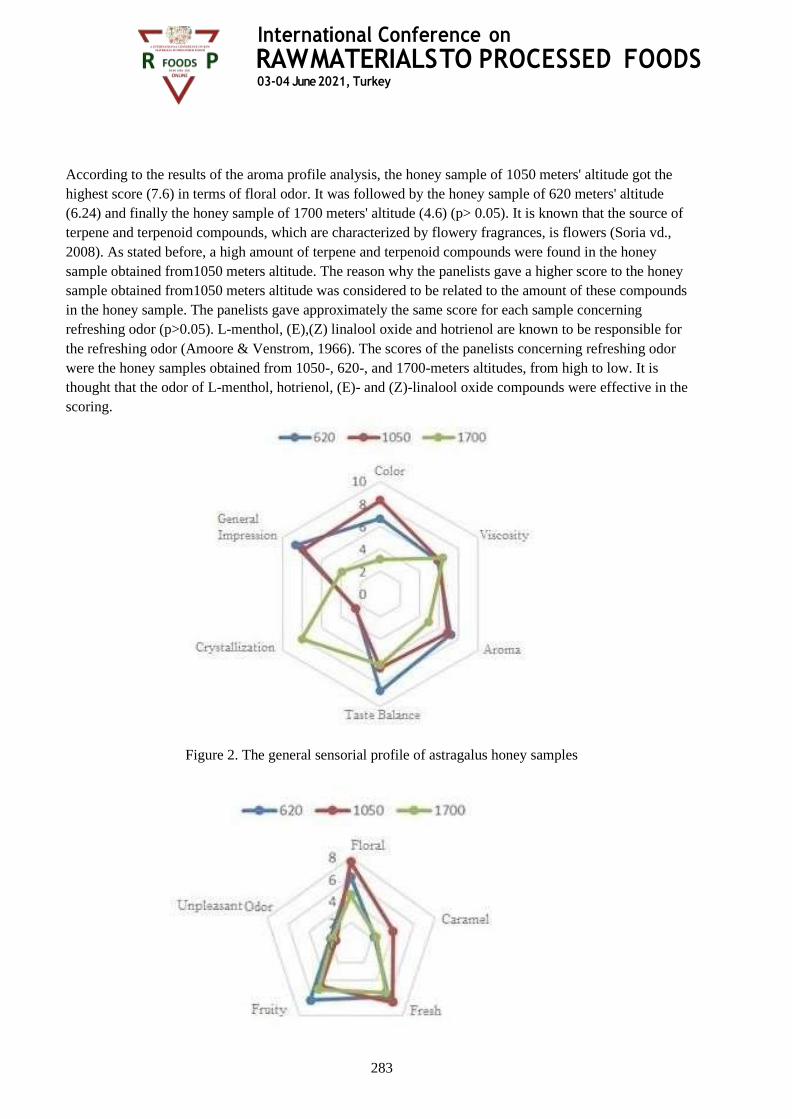
International Conference on
RAW MATERIALS TO PROCESSED FOODS 03-04 June 2021, Turkey
283
According to the results of the aroma profile analysis, the honey sample of 1050 meters' altitude got the
highest score (7.6) in terms of floral odor. It was followed by the honey sample of 620 meters' altitude
(6.24) and finally the honey sample of 1700 meters' altitude (4.6) (p> 0.05). It is known that the source of
terpene and terpenoid compounds, which are characterized by flowery fragrances, is flowers (Soria vd.,
2008). As stated before, a high amount of terpene and terpenoid compounds were found in the honey
sample obtained from1050 meters altitude. The reason why the panelists gave a higher score to the honey
sample obtained from1050 meters altitude was considered to be related to the amount of these compounds
in the honey sample. The panelists gave approximately the same score for each sample concerning
refreshing odor (p>0.05). L-menthol, (E),(Z) linalool oxide and hotrienol are known to be responsible for
the refreshing odor (Amoore & Venstrom, 1966). The scores of the panelists concerning refreshing odor
were the honey samples obtained from 1050-, 620-, and 1700-meters altitudes, from high to low. It is
thought that the odor of L-menthol, hotrienol, (E)- and (Z)-linalool oxide compounds were effective in the
scoring.
Figure 2. The general sensorial profile of astragalus honey samples

International Conference on
RAW MATERIALS TO PROCESSED FOODS 03-04 June 2021, Turkey
284
Figure 3. The aroma profile of astragalus honey samples
CONCLUSION
The general properties of all astragalus honey samples were found to be adequate concerning the national
and international standards. A decrease occurred in the amount of the dominant pollen with the increasing
altitude. In comparison with this decrease, an increase in acidity and diastase activity was observed with the
increasing altitude. With the increasing altitude, a slight increase in the amount of sum of fructose and
glucose, the ratio of fructose to glucose, and the amount of HMF were observed, as well. Proline amount
was not affected by the change of altitude.
When the characteristic aroma of the honey samples was taken into the consideration, it was seen that the
different compounds in different altitudes have effects on the characteristic aroma of the honey samples.
Among all the compounds, especially (E)-Linalool oxide and (Z)-Linalool oxide compounds had
remarkably high amounts, as well as their odor activity values. On the other hand linalool oxide, 2-methyl-
2-butanol, furfural, hotrienol, linalool, limonene, acetic acid, and 2-methoxy-4-vinyl phenol compounds
had also odor activity values greater than 1. According to these results, it could be said that the astragalus
honey could be characterized by fresh, sweetish, flowery, orange-like fruity, camphor-like, spicy, lightly
burnt, and lightly pungent. Nevertheless, the odor characteristics of the astragalus honey can be exactly
determined only with the GC-O technique.
In recent years, aroma compounds are considered to be the marker compounds that characterized the food.
There are many studies on kinds of honey, which is an important nutrient for humans. However, any study
concerning the aroma compounds of kinds of honey obtained from different altitudes was not encountered
in the literature. The influence of the altitude on the astragalus honey was presented with this study. This
study is also the first study to fill the gap in the relationship between the aroma compounds and the altitude.
However, it may be beneficial to conduct similar studies with other kinds of honey and to investigate this
subject in depth.
Acknowledgements
The authors thank Nevşehir Hacı Bektaş Veli University Rectorate for their laboratory infrastructure
support. The authors are also grateful to Dr Aykut Burgut for his assistance in obtaining the honey samples
and Sezen Gıda Limited Company (Anavarza Bal) for their support in some honey analyzes.
Conflict of interest – The authors declare no conflicts of interest, financial or otherwise.
Ethical Review - Ethical approval was not required for this research.
Data availability statement - The data that support the findings of this study are available from the
corresponding author upon reasonable request.
References
[1] N. Kaçaroğlu, “Turunçgil Balının Aroma Profilinin Belirlenmesi ve Bunun Nektar Kaynakları İle
İlişkisi”, Akdeniz Üniversitesi, 2011.
[2] Anonymous, “Food and Agriculture Organization of the United Nations”, Food and Agriculture
Organization of the United Nations, 2021. .
[3] B. Kadioglu, S. Kadioglu, ve Y. Turan, “Gevenlerin (Astragalus sp.) Farklı Kullanım
Alanları ve Önemi”, Alınteri, c. 14, sayı 8, 2008.
[4] Anonymous, “Türkiye İstatistik Kurumu”, Türkiye İstatistik Kurumu, 2019. www.tuik.gov.tr.
[5] A. C. V. Costa, D. S. Garruti, ve M. S. Madruga, “The power of odour volatiles from unifloral
melipona honey evaluated by gas chromatography–olfactometry Osme techniques”, J. Sci. Food
Agric., c. 99, sayı 9, ss. 4493–4497, 2019, doi: 10.1002/jsfa.9647.
International Conference on
RAW MATERIALS TO PROCESSED FOODS 03-04 June 2021, Turkey
285
[6] F. Tanleque-Alberto, M. Juan-Borrás, ve I. Escriche, “Quality parameters, pollen and volatile
profiles of honey from North and Central Mozambique”, Food Chem., c. 277, ss. 543–553, 2019,
doi: 10.1016/j.foodchem.2018.11.007.
[7] E. Makowicz, P. Kafarski, ve I. Jasicka-Misiak, “Chromatographic fingerprint of the volatile
fraction of rare Hedera helix honey and biomarkers identification”, Eur. Food Res. Technol., c. 244,
sayı 12, ss. 2169–2179, 2018, doi: 10.1007/s00217-018-3127-z.
[8] A. O. ChangWei, X. Wu, Z. Zhao, ve M. Liu, “Analysis of aroma components from jujube flowers
and honey.”, Shipin Kexue/Food Sci., c. 39, sayı 20, ss. 182–189, 2018.
[9] I. K. Karabagias, C. Nikolaou, ve V. K. Karabagias, “Volatile fingerprints of common and rare
honeys produced in Greece: in search of PHVMs with implementation of the honey code”, Eur.
Food Res. Technol., c. 245, sayı 1, ss. 23–39, 2018, doi: 10.1007/s00217-0183137-x.
[10] O. Uçkun, “Narenciye ve geven ballarının aroma ve aroma aktif bileşiklerinin belirlenmesi
/ Investigation of aroma and aroma active compounds in citrus and astragalus honeys”, Çukurova
Üniversitesi, 2011.
[11] I. K. Karabagias, M. Maia, S. Karabournioti, I. Gatzias, V. K. Karabagias, ve A. V.
Badeka, “Palynological, physicochemical, biochemical and aroma fingerprints of two rare honey
types”, Eur. Food Res. Technol., c. 246, sayı 9, ss. 1725–1739, 2020, doi: 10.1007/s00217020-
03526-8.
[12] A. Bouhala, S. Ouchemoukh, A. Moussi, ve S. Beldjoudi, “Altitude effect on the properties
of honeys from the region of Jijel (Algeria)”, Polish J. Food Nutr. Sci., c. 70, sayı 2, ss. 169– 178,
2020, doi: 10.31883/pjfns/118528.
[13] M. E. A. Mohammed, A. Alfifi, A. AalMudawi, M. Y. Alfaifi, S. E. I. Elbehairi, ve H. A.
Al-Bushnaq, “Some physiochemical properties of acacia honey from different altitudes of the asir
region in southern Saudi Arabia”, Czech J. Food Sci., c. 35, sayı 4, ss. 321–327, 2017, doi:
10.17221/428/2016-CJFS.
[14] Anonymous, “10760, DIN Analysis of Honey, Determination of The Relative Frequency of
Pollen”, Deutches Institut Für Normung. BERLİN, GERMANY, 2002.
[15] A. Kurt ve R. Yamankaradeniz, “Erzurum İli Merkezinde Tüketilen Süzme Ballar Üzerinde
bir Araştırma”, Gıda Dergisi, c. 7, sayı 3. ss. 115–120, 1982, [Çevrimiçi]. Available at:
http://dergipark.ulakbim.gov.tr/gidader/article/view/5000097273.
[16] Anonymous, “10753, DIN Analysis of Honey, Determination of The Electrical
Conductivity”, Deutches Institut Für Normung. GERMANY, 2000.
[17] A. B. Manzanares, Z. H. García, B. R. Galdón, E. R. Rodríguez, ve C. D. Romero,
“Differentiation of blossom and honeydew honeys using multivariate analysis on the
physicochemical parameters and sugar composition”, Food Chem., c. 126, sayı 2, ss. 664– 672,
2011, doi: 10.1016/j.foodchem.2010.11.003.
[18] W. Horwitz, “Separation of sugars in honey. Liquid chromatographic method (AOAC
Official Method 977.20)”, Off. methods Anal. AOAC Int. 17th edn. AOAC Int. Gaithersburg, MD,
2000.
[19] Anonymous, “TSE Bal Standardı, TS 3036”. 2002.
[20] M. Zappalà, B. Fallico, E. Arena, ve A. Verzera, “Methods for the determination of HMF
in honey: A comparison”, Food Control, c. 16, sayı 3, ss. 273–277, 2005, doi:
10.1016/j.foodcont.2004.03.006.
International Conference on
RAW MATERIALS TO PROCESSED FOODS 03-04 June 2021, Turkey
286
[21] A. Rudnitskaya vd., “Analysis of apples varieties - comparison of electronic tongue with
different analytical techniques”, Sensors Actuators, B Chem., c. 116, sayı 1–2, ss. 23–28, 2006, doi:
10.1016/j.snb.2005.11.069.
[22] S. B. Çınar, “Türk çam balının analitik özellikleri / Analitical properties of Turkish pine
honey”, Ankara Üniversitesi, 2010.
[23] I. Jerković, C. I. G. Tuberso, M. Gugić, ve G. Drabubalo, “Composition of sulla
(Hedysarum coronarium L.) honey solvent extractives determined by GC/MS: Norisoprenoids and
other volatile organic compounds”, Molecules, c. 15, sayı 9, ss. 6375–6385, 2010, doi:
10.3390/molecules15096375.
[24] R. Schneider, A. Razungles, C. Augier, ve R. Baumes, “Monoterpenic and norisoprenoidic
glycoconjugates of Vitis vinifera L. cv. Melon B. as precursors of odorants in Muscadet wines”, J.
Chromatogr. A, c. 936, sayı 1–2, ss. 145–157, 2001, doi: 10.1016/S00219673(01)01150-5.
[25] R. Schneider, R. Baumes, C. Bayonove, ve A. Razungles, “Volatile Compounds Involved
in the Aroma of Sweet Fortified Wines (Vins Doux Naturels) from Grenache Noir”, J. Agric. Food
Chem., c. 46, sayı 8, ss. 3230–3237, 1998, doi: 10.1021/jf9710138.
[26] H. Van Den Dool ve P. D. Kratz, “A generalization of the retention index system including
linear temperature programmed gas-liquid partition chromatography”, J. Chromatogr., sayı
RESEARCH, 1963, [Çevrimiçi]. Available at: http://worldveg.tind.io/record/1766.
[27] Anonymous, “Standarts For Honey CSX 12-1981”, 2019.
[28] A. Batu, E. Küçük, ve M. Çimen, “Doğu Anadolu ve Doğu Karadeniz Bölgeleri Çiçek
Ballarının Fizikokimyasal ve Biyokimyasal Değerlerinin Belirlenmesi Determination of the
Physicochemical and Biochemical Values of Flower Honeys Obtained from Eastern Anatolia and
Eastern Black Sea Regions”, Electron. J. Food Technol. Gıda Teknol. Elektron. Derg. Electron. J.
Food Technol., c. 87, sayı 1, ss. 52–62, 2013.
[29] I. Korkutal ve E. Bahar, “Altitude effects on grape quality ( Rakımın üzüm kalitesi üzerine
etkileri )”, Trak. Üniv. J. Eng. Sci, c. 13(1), sayı February 2012, ss. 17–29, 2016.
[30] F. Tornuk vd., “Quality characterization of artisanal and retail Turkish blossom honeys:
Determination of physicochemical, microbiological, bioactive properties and aroma profile”, Ind.
Crops Prod., c. 46, ss. 124–131, 2013, doi: 10.1016/j.indcrop.2012.12.042.
[31] A. Terrab, M. J. Díez, ve F. J. Heredia, “Palynological, physico-chemical and colour
characterization of Moroccan honeys: I. River red gum (Eucalyptus camaldulensis Dehnh) honey”,
Int. J. Food Sci. Technol., c. 38, sayı 4, ss. 379–386, 2003, doi: 10.1046/j.13652621.2003.00715.x.
[32] A. Meda, C. E. Lamien, M. Romito, J. Millogo, ve O. G. Nacoulma, “Determination of the
total phenolic, flavonoid and proline contents in Burkina Fasan honey, as well as their radical
scavenging activity”, Food Chem., c. 91, sayı 3, ss. 571–577, 2005, doi:
10.1016/j.foodchem.2004.10.006.
[33] S. Gomes, L. G. Dias, L. L. Moreira, P. Rodrigues, ve L. Estevinho, “Physicochemical,
microbiological and antimicrobial properties of commercial honeys from Portugal”, Food Chem.
Toxicol., c. 48, sayı 2, ss. 544–548, 2010, doi: 10.1016/j.fct.2009.11.029.
[34] S. Gangwar ve H. Gebremariam, “Characteristics of honey produced by different plant
species in Ethiopia”, Adv. …, c. 1, sayı June, ss. 101–105, 2010, [Çevrimiçi]. Available at:
http://soeagra.com/abr/vol1/101-05.pdf.
[35] G. Bergamo, S. K. T. Seraglio, L. V. Gonzaga, R. Fett, ve A. C. O. Costa,
“Physicochemical characteristics of bracatinga honeydew honey and blossom honey produced in the
International Conference on
RAW MATERIALS TO PROCESSED FOODS 03-04 June 2021, Turkey
287
state of Santa Catarina: An approach to honey differentiation”, Food Res. Int., c. 116, ss. 745–754,
2019, doi: 10.1016/j.foodres.2018.09.007.
[36] G. j. Padovan, D. De Jong, L. P. Rodrigues, ve J. S. Marchini, “Detection of adulteration of
commercial honey samples by the 13C/12C isotopic ratio”, Food Chem., c. 82, sayı 4, ss. 633–636,
2003, doi: 10.1016/S0308-8146(02)00504-6.
[37] G. j. Padovan, L. P. Rodrigues, I. de A. Leme, D. De Jong, ve J. S. Marchini, “Presence of
C4 Sugars in Honey Samples Detected by The Carbon Isotope Ratio Measured by IRMS”, Eurasian
J. Anal. Chem., c. 2, sayı 3, ss. 134–141, 2007.
[38] H. Tian, Y. Shen, H. Yu, ve C. Chen, “Aroma Features of Honey Measured by Sensory
Evaluation, Gas Chromatography-Mass Spectrometry, and Electronic Nose”, Int. J. Food Prop., c.
21 (1), sayı September, ss. 1755-1768., 2016, doi: 10.1080/10942912.2016.1213744.
[39] R. F. A. Moreira, C. A. B. De Maria, M. Pietroluongo, ve L. C. Trugo, “Chemical changes
in the volatile fractions of Brazilian honeys during storage under tropical conditions”, Food Chem.,
c. 121, sayı 3, ss. 697–704, 2010, doi: 10.1016/j.foodchem.2010.01.006.
[40] D. P. Forero, C. E. Orrego, D. G. Peterson, ve C. Osorio, “Chemical and sensory
comparison of fresh and dried lulo (Solanum quitoense Lam.) fruit aroma”, Food Chem., c. 169, ss.
85– 91, 2015, doi: 10.1016/j.foodchem.2014.07.111.
[41] J. C. Leffingwell ve D. Leffingwell, “GRAS Flavor Chemicals Detection Thresholds”,
Perfumer&Flavorist, c. 16, sayı 1, ss. 1–13, 1991.
[42] R. G. Buttery, J. G. Turnbaugh, ve L. C. Ling, “Contribution of volatiles to rice aroma”, J.
Agric. Food Chem., c. 36, sayı 5, ss. 1006–1009, 1988, doi: 10.1021/jf00083a025.
[43] M. Yılmaztekin ve H. Erten, “Biyoteknolojik Yollarla Aroma Maddelerinin Üretimi”,
Gıda, c. 33, ss. 35–41, 2008.
[44] S. Seisonen, E. Kivima, K. Vene, ve O. Gc, “Characterisation of the aroma profiles of
different honeys and corresponding flowers using solid-phase microextraction and gas
chromatography – mass spectrometry / olfactometry”, FOOD Chem., c. 169, ss. 34–40, 2015, doi:
10.1016/j.foodchem.2014.07.125.
[45] Cabaroğlu, Günata, ve Canbaş, “Bornova Misketi Şarabının Aroma Maddeleri Üzerine Bir
Araştırma”, Gıda, c. 22, ss. 137–145, 1997.
[46] C. Guyot-declerck, F. Chevance, G. Lermusieau, ve S. Collin, “Optimized Extraction
Procedure for Quantifying Norisoprenoids in Honey and Honey Food Products”, J. Agric. Food
Chem., c. 48, ss. 5850–5855, 2000.
[47] E. Alissandrakis, P. A. Tarantilis, C. Pappas, P. C. Harizanis, ve M. Polissiou,
“Investigation of organic extractives from unifloral chestnut (Castanea sativa L.) and eucalyptus
(Eucalyptus globulus Labill.) honeys and flowers to identification of botanical marker compounds”,
LWT - Food Sci. Technol., c. 44, sayı 4, ss. 1042–1051, 2011, doi: 10.1016/j.lwt.2010.10.002.
[48] L. C. Vázquez, M. C. Díaz-Maroto, E. Guchu, ve M. S. Pérez-Coello, “Analysis of volatile
compounds of eucalyptus honey by solid phase extraction followed by gas chromatography coupled
to mass spectrometry”, Eur. Food Res. Technol., c. 224, sayı 1, ss. 27–31, 2006, doi:
10.1007/s00217-006-0284-2.
[49] A. C. Soria, I. Martínez-Castro, ve J. Sanz, “Some aspects of dynamic headspace analysis
of volatile components in honey”, Food Res. Int., c. 41, sayı 8, ss. 838–848, 2008, doi:
10.1016/j.foodres.2008.07.010.

International Conference on
RAW MATERIALS TO PROCESSED FOODS 03-04 June 2021, Turkey
288
[50] L. Castro-Va´zquez, M. C. Dı´az-Maroto, ve M. S. Pe´rez-Coello, “Aroma composition
and new chemical markers of Spanish citrus honeys”, Food Chem., c. 103, ss. 601–606, 2007, doi:
10.1016/j.foodchem.2006.08.031.
[51] Z. Marijanovic, P. Kres, ve M. Marulic, “Screening of Volatile Composition of Lavandula
hybrida R everchon II Honey Using Headspace Solid-Phase Microextraction and Ultrasonic Solvent
Extraction”, Chem. Biodiversty, c. 6, ss. 421–430, 2009.
[52] I. Jerkovic, C. Ignazio, G. Tuberoso, P. Kres, ve M. Marulic, “The Volatile Profiles of a
Rare Apple ( Malus domestica Borkh . ) Honey : Shikimic Acid-Pathway Derivatives , Terpenes ,
and Others solvent extractives are useful for characterization of compounds responsible for the”,
Chem. Biodiversty, c. 10, ss. 1638–1652, 2013.
[53] M. P. Gianelli Barra, M. C. Ponce-Díaz, ve C. Venegas-Gallegos, “Volatile Compounds in
Honey Produced in the Central Valley of Ñuble Province, Chile”, Chil. J. Agric. Res., c. 70, sayı 1,
ss. 75–84, 2010, doi: 10.4067/s0718-58392010000100008.
[54] S. Selli ve H. Kelebek, “Aromatic profile and odour-activity value of blood orange juices
obtained from Moro and Sanguinello ( Citrus sinensis L . Osbeck )”, Ind. Crop. Prod., c. 33, sayı 3,
ss. 727–733, 2011, doi: 10.1016/j.indcrop.2011.01.016.
[55] J. S. Bonvehí, “Investigation of aromatic compounds in roasted cocoa powder”, Eur. Food
Res. Technol., c. 221, sayı 1–2, ss. 19–29, 2005, doi: 10.1007/s00217-005-1147-y.
[56] Y. Okabe, Y. Inoue, Y. Kanda, ve T. Katsumata, “Odor-active compounds contributing to the
characteristic aroma of shrimp cooked whole , including shells and viscera”, Eur. Food Res.
Technol., c. 245, sayı 1, ss. 233–241, 2019, doi: 10.1007/s00217-018-3156-7.
[57] J. E. Amoore ve D. Venstrom, Sensory Analysis of Odor Qualities in Therms of The
Sterochemical Theory. Albany: Western Regional Research Laboratory, Westerrt Utilization
Research and Development Division, of Agriculture U. S. Department Albany, California 94710,
P. 118 128, 1966.
[58] Y. Niu vd., “Characterization of odor-active compounds of various cherry wines by gas
chromatography-mass spectrometry, gas chromatography-olfactometry and their correlation with
sensory attributes”, J. Chromatogr. B Anal. Technol. Biomed. Life Sci., c. 879, sayı 23, ss. 2287–
2293, 2011, doi: 10.1016/j.jchromb.2011.06.015.
[59] R. A. Lewis, Hawley’s condensed chemical dictionary. John Wiley & Sons, 2016.
[60] G. Guclu, O. Sevindik, H. Kelebek, ve S. Selli, “Determination of Volatiles by Odor
Activity Value and Phenolics of cv. Ayvalik Early-Harvest Olive Oil”, Foods, c. 5, sayı 4, s. 46,
2016, doi: 10.3390/foods5030046.
[61] J. A. Pino ve Y. Febles, “Odour-active compounds in banana fruit cv. Giant Cavendish”,
Food Chem., c. 141, sayı 2, ss. 795–801, 2013, doi: 10.1016/j.foodchem.2013.03.064.
[62] J. H. Ruth, “Odor Thresholds and Irritation Levels of Several Chemical Substances: A
Review”, Am. Ind. Hyg. Assoc. J., c. 47, sayı 3, s. A-142-A-151, 1986, doi:
10.1080/15298668691389595.
[63] L. Fariña, V. Villar, G. Ares, F. Carrau, E. Dellacassa, ve E. Boido, “Volatile composition
and aroma profile of Uruguayan Tannat wines”, Food Res. Int., c. 69, ss. 244–255, 2015, doi:
10.1016/j.foodres.2014.12.029.
[64] O. Uçkun ve S. Selli, “Aroma Composition of Floral Honey Obtained From Kayseri
Province”, Gıda, c. 37, ss. 157–164, 2012.
[65] A. Escudero, E. Campo, L. Fariña, J. Cacho, ve V. Ferreira, “Analytical characterization of
the aroma of five premium red wines. Insights into the role of odor families and the concept of

International Conference on
RAW MATERIALS TO PROCESSED FOODS 03-04 June 2021, Turkey
289
fruitiness of wines”, J. Agric. Food Chem., c. 55, sayı 11, ss. 4501–4510, 2007, doi:
10.1021/jf0636418.
[66] R. G. Buttery, W. J. Orts, G. R. Takeoka, ve Y. Nam, “Volatile Flavor Components of Rice
Cakes”, J. Agric Food Chem., c. 47, ss. 4353–4356, 1999.
[67] J. Xie, B. Sun, F. Zheng, ve S. Wang, “Volatile flavor constituents in roasted pork of
Minipig”, Food Chem., c. 109, ss. 506–514, 2008, doi: 10.1016/j.foodchem.2007.12.074.

International Conference on
RAW MATERIALS TO PROCESSED FOODS 03-04 June 2021, Turkey
290
Drying Treatments Change the Composition of Aromatic Compounds from
Fresh to Dried Centennial Seedless Grapes
Hafiz Umer Javed1,2,3, Dong Wang1,2,4, Rani Andaleeb5, Muhammad Salman Zahid3, Ying Shi1,2,
Saeed Akhtar6, Wang Shiping3, Chang-Qing Duan1,2
1Center for Viticulture & Enology, College of Food Science and Nutritional Engineering, China Agricultural
University, No. 17 Tsinghua East Road, Beijing 100083, China 2Key Laboratory of Viticulture and Enology, Ministry of Agriculture, Beijing 100083, China
3Department of Plant Sciences, School of Agriculture and Biology, Shanghai Jiao Tong University, 800 Dongchuan
Road, Minhang District, Shanghai 200240, China 4Beijing Yi Qing Food Group Co., Ltd., No. 6 Beixinglu, Dong Duan, Daxing Distruct, Beijing 102600, China
5Department of Food Sciences and Engineering, School of Agriculture and Biology, Shanghai Jiao Tong University,
800 Dongchuan Road, Minhang District, Shanghai 200240, China 6Institute of Food Science and Nutrition, Bahauddin Zakariya University, Multan 60800, Pakistan
E-mail: [email protected]
ABSTRACT
Raisin aroma is a vital sensory characteristic that determines consumers’ acceptance. Volatile organic
compounds (VOCs) in fresh grapes, air-dried (AD), pre-treated air-dried (PAD), sun-dried (SD), and pre-
treated sun-dried (PSD) raisins were analyzed, with 99 and 77 free- and bound-form compounds identified
in centennial seedless grapes, respectively. The hexenal, (E)-2-hexenal, 1-hexanol, ethyl alcohol, and ethyl
acetate in free-form while benzyl alcohol, β-damascenone, gerenic acid in bound-form were the leading
compounds. Overall, the concentration of aldehydes, alcohols, esters, acids, terpenoids, ketones, benzene,
and phenols were abundant in fresh grapes but pyrazine and furan were identified in raisin. Out of 99
VOCs, 30 compounds had an odour active value above 1. The intensity of green, floral, and fruity aromas
were quite higher in fresh grapes followed by AD-raisins, PAD-raisins, SD-raisins, and PSD-raisins. The
intense roasted aroma was found in SD-raisins due to 2,6-diethylpyrazine and 3-ethyl-2,5-
dimethylpyrazine. Among raisins, the concentration of unsaturated fatty acid oxidized and Maillard
reaction volatiles were higher in SD-raisins and mainly contributed green, fruity and floral, and roasted
aromas, respectively.
Keywords: free-form volatile compounds; glycosidically bound-form volatile compound; centennial
seedless; aromatic profile; SPME-GS/MS

International Conference on
RAW MATERIALS TO PROCESSED FOODS 03-04 June 2021, Turkey
291
Development of Value-Added Functional Food by Fusion of Colored Potato
and Buckwheat Flour Through Hot Melt Extrusion
Md Obyedul Kalam Azad1, Md. Adnan3, In Je Sung1, Jung Dae Lim2, Jong-Suep Baek2, Young
Seok Lim3,4, Cheol Ho Park1*
1 Department of Bio-Health Technology, College of Biomedical Science, Kangwon National University, Chuncheon,
Korea
2 Department of Herbal Medicine Resource, Kangwon National University, Samcheok, Korea
3 Department of Bio-Health Convergence, College of Biomedical Science, Kangwon National University, Chuncheon,
Korea
4 Valley Food Tec., Eden, ID, USA
*E-mail: [email protected]
ABSTRACT
Thermal sensitivity of anthocyanin and low-water solubility of rutin limit their stability in processed foods
and biological activity, respectively. Therefore, we aimed to develop a value-added food composite
(VAFC) by mixing of anthocyanin-enriched potato (P) and rutin-enriched buckwheat (B) flour using soy
lecithin (LCT) and vitamin E (Vita E) by hot-melt extrusion (HME). The VAFC was formulated using P
50% + B 50% (F1), P 45%+B 45%+LCT 10% (F2), and P 45%+B 45%+LCT 8%+Vita E 2% (F3). Results
revealed that the solubility of the VAFC was significantly increased in F3 formulation. Likewise, total
phenolic content, including single phenolic acids, total flavonoid including rutin and quercetin, total
anthocyanin including single anthocyanins, and antioxidant capacity of the VAFC were significantly
increased in F3 formulation. This study successfully demonstrated the approach of developing
biopolymermediated functional VAFC from potato and buckwheat by HME.

International Conference on
RAW MATERIALS TO PROCESSED FOODS 03-04 June 2021, Turkey
292
Investigation of the Use of Pekmez in Orange Nectar Production
Hande Baltacıoğlu1*, Merve Ceyhan1
1Department of Food Engineering, Faculty of Engineering, Nigde Omer Halisdemir University, 51240, Nigde, Turkey
*E-mail: [email protected]
ABSTRACT
Sugar syrups have been used in many foods such as fruit nectars for many years since they positively affect
many characteristics of foods and provide the sensory quality and shelf life desired by the producer. Sugar
syrups are clear, colorless and viscous syrups obtained from starch by hydrolysis. However, it has been
found that sugar syrups have many negative effects on health such as various pathological changes,
oxidative stress, glucose intolerance, insulin resistance, type 2 diabetes, obesity, hypertension and
cardiovascular diseases. Pekmez (molasses) is a traditional Turkish food that is generally produced from
grapes. Pekmez contains organic acids, minerals and vitamins so it is very important for nutrition. Pekmez
meets most of the daily calcium, iron, potassium and magnesium needs. In this study, the use of pekmez in
orange nectar instead of sugar syrup has been investigated and the effects of different pekmez
concentrations on various quality characteristics of orange nectar such as Brix, titratable acidity, color and
total phenolic content have been determined and consumer preferences have been demonstrated by sensory
evaluation. With the addition of pekmez, it was determined that the water-soluble solid content, titratable
acidity and total phenolic content of the samples increased. On the other hand, the color of the sample
became darker as the pekmez concentration increased. Similarly, as the concentration of pekmez in nectar
increased, it was less appreciated. Although pekmez, which was used in a high concentration, in orange
nectar had a negative effect on color and sensory properties, the addition of pekmez improved the
nutritional value of orange nectar so a new functional product rich in phenolic compounds, vitamins and
minerals can be developed.
Keywords: Orange Nectar, Pekmez, Sugar Syrup, Total Phenolic Content
INTRODUCTION
Pekmez (molasses) is a traditional Turkish food and it has been widely produced from grapes in Turkey.
According to the Turkish Food Codex, grape molasses is defined as "the viscous product obtained by
reducing the acidity of unfermented fresh grape or raisin extract with appropriate methods and then
thickening it under vacuum or in the open in accordance with the technique." (TFC, 2017). Grape molasses
is a good source of nutrient and energy because it contains vitamin and mineral such as iron, calcium and
high sugar (Kıran et al., 2019). Pekmez is used in making blood in the body. It has positive effects on
stomach, intestines and kidneys. It is good for arteriosclerosis and facilitates blood circulation (Evrendilek,
2017).
One of the most consumed and produced products in the fruit juice industry in the world is orange juice.
Orange is one of the six main fruits that are processed into fruit juices and similar products in our country.
Orange ranks first in nectar production in many countries around the world (Jordão, 2018). Orange juice,
rich in vitamin C, carotenoids, flavonoids and minerals, is an important daily nutritional source (Topuz et
al., 2005). It is available in the market in the form of orange juice (contains 100% orange juice), orange
nectar.
International Conference on
RAW MATERIALS TO PROCESSED FOODS 03-04 June 2021, Turkey
293
MATERIAL AND METHOD
Material
In this study, fresh orange (Citrus sinensis), fresh lemon (Citrus limoni), powdered sugar (Balküpü) and
grape molasses (Gülsan) used for the production of orange nectar were obtained from local markets
(Niğde). The fruits were stored at 4 °C before the juice was obtained. 50 mL of orange juice, 12 g of sugar,
0.2 g of lemon juice were mixed and completed with 100 mL of water while preparing orange nectar as a
control sample. Orange nectar containing different concentrations (5, 10 and 15%) of grape molasses
instead of sugar syrup was prepared to examine the effect of molasses on its quality properties.
Determination of Color
L*, a* and b* values were determined using the Konica-Minolta (CR400, Osaka, Japan) color reader.
Determination of Water Soluble Solid Content
Total water soluble solid content was determined using an abbe refractometer (A. Krüss Optronic GmbH,
AR4, Hamburg). Results were expressed in °Brix.
Determination of Titratable Acidity
0.5 mL of phenol phthalein reagent was added to 10 mL sample and it was titrated with 0.1N NaOH. The
NaOH spent in the titration was recorded and the results were calculated according to AOAC (2000).
Determination of Total Phenolic Content
The total phenolic content was determined according to the Folin–Ciocalteu colorimetric method
(Singleton and Rossi, 1965). 100 µL of sample was mixed with 0.75 mL of Folin–Ciocalteu reagent
(diluted 10-fold in deionized water) and kept at room temperature for 5 min. After adding 0.75 mL of
sodium bicarbonate (75 g L-1), the mixture was allowed to stand at room temperature for 60 min and
absorbance was measured at 725 nm. Gallic acid was used as a standard, and the same procedures were
applied to gallic acid solutions at different concentrations prepared for the calibration curve. All
determinations were carried out in triplicate, and results were represented as milligrams of gallic acid
equivalent (GAE) per kilogram of juice.
Sensory analysis
The taste, odor, color and appearance properties of fruit juice samples as sensory quality parameters were
evaluated by semi-trained panelists from Niğde Ömer Halisdemir University, Department of Food
Engineering. In scoring, the best was numbered as 10 and the worst was numbered as 1. 13 panelists took
part in the evaluations. The sample evaluation form is shown in Table 1.
Table 1: Sensory evaluation form
Sample Taste Odor Color-Appearance
1
2
3
4
Statistical Analysis
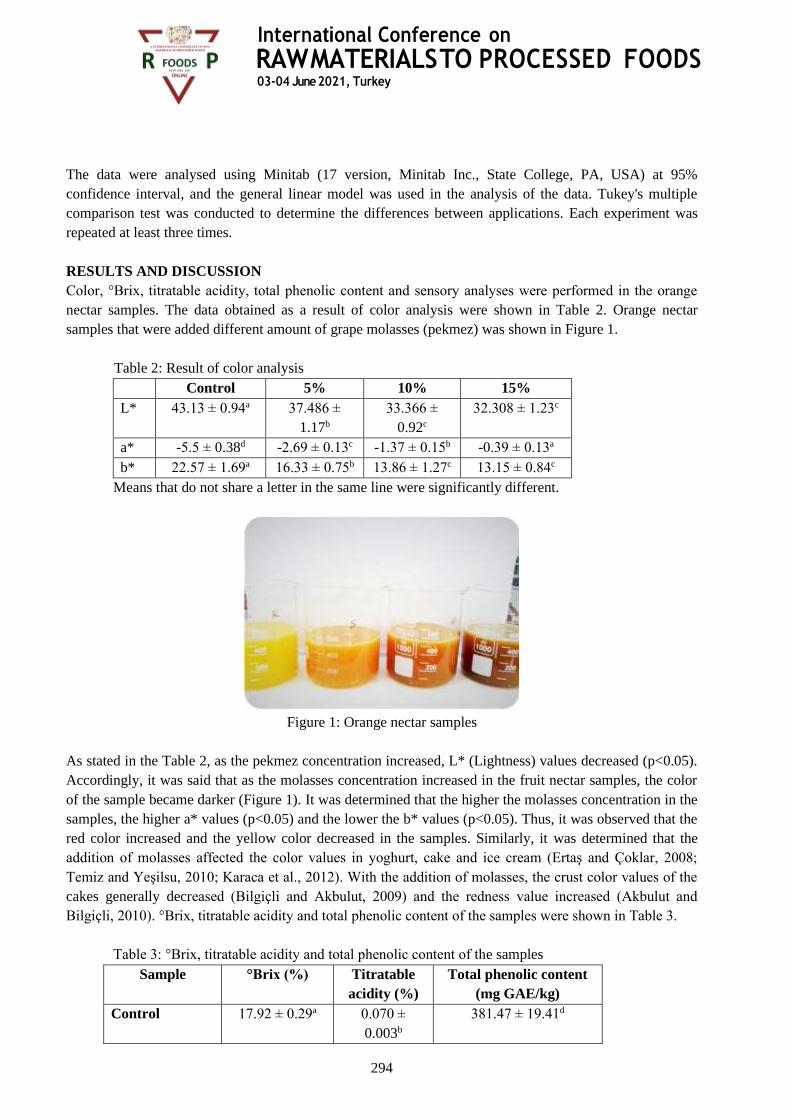
International Conference on
RAW MATERIALS TO PROCESSED FOODS 03-04 June 2021, Turkey
294
The data were analysed using Minitab (17 version, Minitab Inc., State College, PA, USA) at 95%
confidence interval, and the general linear model was used in the analysis of the data. Tukey's multiple
comparison test was conducted to determine the differences between applications. Each experiment was
repeated at least three times.
RESULTS AND DISCUSSION
Color, °Brix, titratable acidity, total phenolic content and sensory analyses were performed in the orange
nectar samples. The data obtained as a result of color analysis were shown in Table 2. Orange nectar
samples that were added different amount of grape molasses (pekmez) was shown in Figure 1.
Table 2: Result of color analysis
Control 5% 10% 15%
L* 43.13 ± 0.94a 37.486 ±
1.17b
33.366 ±
0.92c
32.308 ± 1.23c
a* -5.5 ± 0.38d -2.69 ± 0.13c -1.37 ± 0.15b -0.39 ± 0.13a
b* 22.57 ± 1.69a 16.33 ± 0.75b 13.86 ± 1.27c 13.15 ± 0.84c
Means that do not share a letter in the same line were significantly different.
Figure 1: Orange nectar samples
As stated in the Table 2, as the pekmez concentration increased, L* (Lightness) values decreased (p<0.05).
Accordingly, it was said that as the molasses concentration increased in the fruit nectar samples, the color
of the sample became darker (Figure 1). It was determined that the higher the molasses concentration in the
samples, the higher a* values (p<0.05) and the lower the b* values (p<0.05). Thus, it was observed that the
red color increased and the yellow color decreased in the samples. Similarly, it was determined that the
addition of molasses affected the color values in yoghurt, cake and ice cream (Ertaş and Çoklar, 2008;
Temiz and Yeşilsu, 2010; Karaca et al., 2012). With the addition of molasses, the crust color values of the
cakes generally decreased (Bilgiçli and Akbulut, 2009) and the redness value increased (Akbulut and
Bilgiçli, 2010). °Brix, titratable acidity and total phenolic content of the samples were shown in Table 3.
Table 3: °Brix, titratable acidity and total phenolic content of the samples
Sample °Brix (%) Titratable
acidity (%)
Total phenolic content
(mg GAE/kg)
Control 17.92 ± 0.29a 0.070 ±
0.003b
381.47 ± 19.41d
International Conference on
RAW MATERIALS TO PROCESSED FOODS 03-04 June 2021, Turkey
295
5% 10.08 ± 0.14d 0.077 ±
0.001a
513.84 ± 38.31c
10% 13.17 ± 0.18c 0.077 ±
0.002a
621.84 ± 9.18b
15% 15.75 ± 0b 0.076 ±
0.003a
695.69 ± 35.42a
Means that do not share a letter in the same column were significantly different.
When the °Brix values in the samples were examined, it was seen that the addition of grape molasses
increases the amount of water soluble solid content (p<0.05). It has been reported that the addition of
molasses also increased the total soluble solid content in ice cream samples (Temiz and Yeşilsu, 2010). The
lowest brix value was obtained in orange nectar containing 5% molasses. This value did not meet the
minimum brix value specified in the "Turkish Food Codex, Regulation of Fruit Juice and Similar Products”
(TFC, 2014). However, the °Brix values of the other samples were found to be more than 11.2, which was
the minimum brix value specified in the Regulation.
Titratable acidity values of the samples increased with the addition of molasses compared to the control
sample (p<0.05). Similarly, it has been determined that the addition of pekmez increased the titratable
acidity value in yoghurt, cake and ice cream (Ertaş and Çoklar, 2008; Temiz and Yeşilsu, 2010; Karaca et
al., 2012). On the other hand, it was said that the increase in the pekmez concentration did not make a
significant difference (p≥0.05) on the titratable acidity of the samples.
The total phenolic content of the samples increased compared to the control sample (p<0.05). In addition,
depending on the grape molasses concentration, the total phenolic content of orange nectars increased
(p<0.05). the result of sensory analysis were shown in Table 4.
Table 4: Sensory analysis
Sample Taste Odor Color-Appearance
Control 8.69 ± 1.18a 9.15 ± 1.07a 8.31 ± 1.25a
5% 7.09 ± 1.97b 7.55 ± 1.44b 8.00 ± 1.49b
10% 6.85 ± 2.34b 7.00 ± 1.58c 5.92 ± 1.89c
15% 4.85 ± 2.64c 5.62 ± 2.57d 4.92± 2.60d
Means that do not share a letter in the same column were significantly different.
Sensory analysis showed that the effect of using different amounts of molasses on the taste, odor, color and
appearance scores of the samples was statistically significant (p<0.05). The sensory analysis results of the
sample containing 5% molasses were closest to the control sample. As the molasses concentration
increased, the rate of acceptability decreased (p<0.05). In a study examining the addition of molasses to ice
cream samples, it was determined as a result of the sensory analysis that the addition of molasses up to
7.5%, improved the total acceptability scores of the samples (Temiz and Yeşilsu, 2010). It has been
reported that the addition of molasses improves the sensory properties of the cake, and as a result, a
nutritional and acceptable new product can be developed by using molasses as natural sugar in the cake
formulation (Akbulut and Bilgiçli, 2010). As a result of the sensory analysis of molasses addition in
yoghurt, increasing the molasses ratio negatively affected the appearance and color scores of the samples
due to the decrease in whiteness. However, it was reported that the panelists gave the highest sensory
International Conference on
RAW MATERIALS TO PROCESSED FOODS 03-04 June 2021, Turkey
296
scores to yoghurts produced with grape molasses and preferred 10% concentration for molasses (Karaca et
al., 2012).
CONCLUSION
Sugar syrups have been widely used in various products in the food industry due to their beneficial
properties such as providing viscosity, improving flavour, providing texture and moisture-retaining
properties, giving sweetness and increasing resistance to color loss. In the production of soft drinks and
fruit juice, fructose syrup has been widely preferred as sugar syrup. It is claimed that fructose is associated
with chronic diseases such as obesity, hypertension, insulin resistance and gout. Consumption of sugary
drinks, which is widespread among children and youth, increases the risk from fructose syrup. For this
reason, the use of corn syrups, especially fructose syrups, is limited in various countries and serious
restrictions have been imposed on the sale of products with rich fructose content (Zargaraan et al., 2016).
In this study, the possibilities of using molasses in orange nectar instead of sugar and sugar syrup were
investigated. According to the results, it was determined that as the molasses concentration increased, the
color of the sample darkened, the red color increased and the yellow color decreased in the samples.
However, it was found that the addition of molasses increased the amount of water-soluble solid content
and more than 5% molasses should be used to provide the minimum value (11.2 °Brix) specified in the
“Turkish Food Codex, Regulation of Fruit Juice and Similar Products”. Moreover, as a result of the
addition of molasses, the titratable acidity and total phenolic content of orange nectars increased compared
to the control sample. According to the results of the sensory analysis, as the molasses concentration
increased, acceptability of the samples decreased. Although the use of molasses instead of sugar and sugar
syrup in orange nectar has a negative effect on color and sensory properties, the addition of molasses
improves the nutritional value of orange nectar. Thus, it has been seen that a new functional product rich in
phenolic compounds, vitamins and minerals can be developed by using molasses as a natural sugar.
REFERENCES
[1] TFC. Turkish Food Codex, 2017. Regulation No. 2017/8, Regulation of grape molasses. Official
Gazette of Publication: 30.06.2017-30110, Ankara. (In Turkish).
[2] Kıran, T., Otlu, O., Karabulut, E., Bay Karabulut, A., (2019). Protective effects of grape molasses and
resveratrol against DMBA induced oxidative stress in rat ovarian tissues. Middle Black Sea Journal of
Health Science, 5(2), 151-159.
[3] Evrendilek, G.A., (2017). Winter boost of ancient times for health and wellness. J Nutr Food Sci, 7,
e139.
[4] Jordão, J., (2018). European Fruit Juice Association. AIJN – Market Report 2018, 3–44.
[5] Topuz, A., Topakci, M., Canakci, M., Akinci, I., Ozdemir, F., (2005). Physical and nutritional
properties of four orange varieties. Journal of Food Engineering, 66 (4), 519-523.
[6] P.R. Ashurst, Chemistry and technology of soft drinks and fruit juices, Third Edition, John Wiley &
Sons, New York, 2016.
[7] White, J.S., (2013). Challenging the fructose hypothesis: new perspectives on fructose consumption
and metabolism. Adv Nutr., 4(2), 246-56.
[8] Jensen, T., Abdelmalek, M. F., Sullivan, S., Nadeau, K. J., Green, M., Roncal, C., Nakagawa, T.,
Kuwabara, M., Sato, Y., Kang, D. H., Tolan, D. R., Sanchez-Lozada, L. G., Rosen, H. R., Lanaspa, M.
A., Diehl, A. M., Johnson, R.J., (2018). Fructose and sugar: A major mediator of non-alcoholic fatty
liver disease. Journal of hepatology, 68(5), 1063–1075.
[9] Ertaş, N., Çoklar H., (2008). Farklı pekmez çeşitlerinin doğal şeker kaynaği olarak kek hamuru ve kek
özelliklerine etkisi. Ziraat Fakültesi Dergisi, 22 (46), 51-54. (In Turkish)

International Conference on
RAW MATERIALS TO PROCESSED FOODS 03-04 June 2021, Turkey
297
[10] Temiz, H., Yeşilsu, A.F., (2010). Effect of pekmez addition on the physical, chemical, and sensory
properties of ice cream. Czech J. Food Sci., 28 (6), 538–546.
[11] Karaca, O.B., Saydam, I.B. and Güven, M., (2012). Physicochemical, mineral and sensory
properties of set-type yoghurts produced by addition of grape, mulberry and carob molasses (pekmez)
at different ratios. International Journal of Dairy Technology, 65(1), 111–117.
[12] AOAC., (2000) Official methods of analysis of the Association of Official Analysis Chemists, 17th
ed. AOAC International, Gaithersburg, MD, USA.
[13] Singleton, V.L. Rossi, J.A., (1965). Colorimetry of total phenolics with phosphomolybdic-
phosphotungstic acid reagents. American Journal of Enology and Viticulture 16, 144–158.
[14] Bilgiçli, N., Akbulut, M., (2009). Effects of different pekmez (fruit molasses) types on chemical,
nutritional content and storage stability of cake. Journal of Food Quality, 32, 96–107.
[15] Akbulut, M., Bilgiçli, N., (2010). Effects of different pekmez (fruit molasses) types used as a
natural sugar source on the batter rheology and physical properties of cakes. Journal of Food Process
Engineering, 33, 272-286.
[16] TFC. Turkish Food Codex, 2014. Regulation No. 2014/34, Regulation of fruit juice and similar
products. Official Gazette of Publication: 06.08.2014-29080, Ankara. (In Turkish).
[17] Zargaraan, A., Kamaliroosta, L., Yaghoubi, A., Mirmoghtadaie, L., (2016). Effect of substitution of
sugar by high fructose corn syrup on the physicochemical properties of bakery and dairy products: A
review. Nutrition and Food Sciences Research, 3(4), 3-11.
International Conference on
RAW MATERIALS TO PROCESSED FOODS 03-04 June 2021, Turkey
298
Determination of Honey Adulteration with High Fructose Wheat Syrup
Tamer Arslan1, Gökhan Durmaz2*, Oktay Yıldız3, Durmuş Özdemir4
1Department of Food Technology, Malatya Turgut Özal University, 44210 Malatya, Turkey 2Department of Food Engineering, Inonu University, 44280 Malatya, Turkey 3Pharmacy Faculty, Karadeniz Technical University, 61080 Trabzon, Turkey
4Department of Chemistry, Faculty of Science, İzmir Institute of Technology, 35430, İzmir, Turkey
Tel: +904223774793, Fax: +904223410046, E-mail: [email protected] (G. Durmaz)
ABSTRACT
Honey is a natural source of sugars along with several health promoting minor compounds. Commercial
value of honey is quite high which makes it attractive for food frauds.
The most commonly used starch-based sugar source for honey adulteration is high fructose corn syrup
(HFCS). Nevertheless, this type of adulteration could easily be detected by a simple IR-MS analysis as
HFCS is obtained from a C4 type plant.
In this study, it was aimed to determine the adulteration made by using high fructose wheat syrup (HFWS).
The sugar syrup was obtained by hydrolyzing wheat starch to glucose syrup followed by converting it into
42% fructose syrup. Honeys of different botanical and geographic origins were collected and several
parameters including moisture, electrical conductivity, ash ratio, water insoluble matter, free acidity,
diastase activity, HMF and proline contents were determined. Adulterated samples were prepared by
adding different amounts (%10, 20 and 40) of HFWS to the authentic honeys. Major sugars (sucrose,
glucose and fructose) were quantified by using high-performance liquid chromatography (HPLC) and
minor sugars (Trehalose, turanose, cellobiose, panose, erlose, nigerose, raffinose, kojibiose, maltose,
maltotriose, isomaltose, isomaltotriose, maltotetraose) were quantified by using high-performance ion
chromatography coupled with pulsed amperometric detection (HPAE-PAD).
It has been observed that the rates of major sugars are within the legal limits in both authentic and
adulterated samples. Moreover, carbon isotope ratio analysis has revealed that even 40% adulterated
samples were classified as authentic according to the current legislation limits. However, by evaluation of
minor sugar analysis results with chemometric techniques, it was seen that adulterated honeys could
successfully be distinguished from authentic ones.
Keywords: Honey, Adulteration, Wheat Starch, HPAE-PAD
This study was supported by Inonu University Scientific Projects Coordination Unit (Project ID: 1218)
International Conference on
RAW MATERIALS TO PROCESSED FOODS 03-04 June 2021, Turkey
299
UV-C Irradiation for Inactivation of Listeria monocytogenes on Frozen Sweet
Cherry
Ayşe Handan Baysal1
1Izmir Institute of Technology, Department of Food Engineering, Urla, Izmir, Turkey
+902327506909, +902327506909, [email protected]
ABSTRACT
This study evaluated inactivation efficiency of short wave ultraviolet (UV-C) light at 254 nm on Listeria
monocytogenes or Listeria innocua inoculated on the surface of frozen sweet cherry (Prunus avium L.).
Frozen sweet cherries inoculated with Listeria species were exposed to UV-C radiation treatments between
0-4 kj/m2 in an enclosed chamber at room temperature with radiation doses using varying exposure times
and the UV-C light intensity of radiation as measured by a portable digital radiometer at the fruit surface.
Frozen sweet cherries were both obtained from local producer and purchased from supermarket the day
before each experiment and stored at +4°C until use. 10 g of fruits (7-10 frozen sweet cherries) were
surface spot inoculated separately with two strains of L. monocytogenes and L. innocua then placed in
sterile empty petri plates and placed under germicidal UV lamp. Fruits were irradiated at a distance of 8 cm
to obtain specific doses. Experiments were repeated three times. After UV-C treatment samples were
transferred into a 90 ml of buffered peptone water and then homogenized samples were serially diluted.
Each dilution of the samples was surface plated on selective and differential medium (ALOA) and non-
selective TSA agar plates for Listeria counts. After UV-C treatment with 4.81 kJ/cm2 (96 s) 4 log cfu/g
reductions of L. monocytogenes counts were obtained. Results showed that L. monocytogenes counts
decreased with increasing UV-C dose. The reductions in the number of two L. monocytogenes strains were
different due to irradiation and Weibull model estimates UV-C inactivation of the strains.
Keywords: Inactivation, Listeria monocytogenes, sweet cherry, UV-C

International Conference on
RAW MATERIALS TO PROCESSED FOODS 03-04 June 2021, Turkey
300
Modelling the Effect of Ultrasonic Washing on the Amount of Sulfur and
Quality Characteristics of Dried Apricots Using Artificial Neural Networks
(ANN)
Alev Yüksel Aydar1*, Tuba Aydin1, Ozan Sarp Kirkaplan1, Gülce Şahin1
1Manisa Celal Bayar University, Department of Food Engineering, Manisa-Turkey
*E-mail: [email protected], (+90)2362012274
ABSTRACT
Apricot is of great importance in nutrition with minerals, vitamins and dietary fibers that regulate mental
activities, reduce stress, improve teeth and bones in children, ensure the regular functioning of the stomach
and intestinal system, prevent constipation, increase blood production. Sulfur treatment is applied to protect
the apricot from microbiological deterioration and to improve its characteristic color properties. However,
utilization of excessive amount of sulfur dioxide in foods causes many health problems including asthma
and allergenic inflammation. For this reason, the present study was aimed to investigate the use of
ultrasound as an innovative technology to reduce the amount of sulfur in dried apricots and to determine
the required ultrasonic washing time with artificial neural networks (ANN). With this purpose, dried
apricots with an initial moisture content of 25 ± 2% and containing 458 ± 14 ppm sulfur were sonicated for
120 minutes using an ultrasonic bath (32 ± 5 kHz). It has been found that ultrasonic washing causes more
color change and higher sulfur removal in apricots compared to traditional washing. The model with the
lowest RMSE and the highest R2 was selected with the "Levenberg-Marquardt" (trainlm) algorithm.
Keywords: ANN, apricot, modelling, sulfur, ultrasound

International Conference on
RAW MATERIALS TO PROCESSED FOODS 03-04 June 2021, Turkey
301
Color Quality, Ascorbic acid and Total Carotenoid Contents of Dried Orange
Slices as Influenced by Packaging Methods and Storage Conditions
Süleyman Polat
Cukurova University, Faculty of Agriculture, Department of Food Engineering, Adana, Turkey
E-mail: [email protected], +90 507 170 14 70
ABSTRACT
Dried orange slices can be produced using different drying techniques. It is considered as a snack food or
as an additive in formulations of some foods such as patisserie products and juices in powder form, due to
its high amount of bioactive and aromatic compounds. The package affects the quality of foods by
controlling the factors connected with their storage and handling. Thus, the influence of packaging methods
and storage conditions on colour, ascorbic acid content and total carotenoid value of dried orange slice
samples were investigated.
The total amount of ascorbic acid of dried orange slices was determined as 366.75 mg/100g at initial day.
Significant reductions in the ascorbic acid amounts were observed during the 3 months of storage in
connection with the applied packaging techniques. While the maximum reduction was observed with a rate
of about 43% in the package containing normal atmosphere and exposed to light (CL), the least decrease
was observed in the nitrogen containing package and stored in dark conditions (N2D) with a rate of about
%17. The total amount of carotenoids in dried orange slices (initial day) was determined as 2.59 mg/100g.
After 3 months of storage under light conditions, about 80% carotenoid loss was observed for CL while
only 38% was computed for N2D samples. Notably, the total carotenoid content decreased more
rapidly under light storage as compared to dark conditions, findings revealed that nitrogen containing
package which stored dark conditions yielded a better preservation of colour, ascorbic acid and total
carotenoid content.
Keywords: Dried orange slice, ascorbic acid, packaging, total carotenoid
The author thanks to Cukurova University Academic Research Projects Unit (Project no: FBA-2020-
13130) for their financial support.

International Conference on
RAW MATERIALS TO PROCESSED FOODS 03-04 June 2021, Turkey
302
The Improvement of Rheological Properties, Emulsion and Oxidative Stability
of Low Fat Salad Dressing by Cold Pressed Hot Pepper Seed Oil By-product
Zeynep Hazal Tekin-Cakmak1, Esra Avci1, Muhammed Ozgolet1, Salih Karasu1
1Yildiz Technical University, Faculty of Chemical and Metallurgical Engineering, Department of Food Engineering,
Davutpasa Campus, Istanbul, Turkey
ABSTRACT
This study aimed to investigate the potential use of hot pepper seed oil by-product (HPOB) in a low-fat
salad dressing to improve rheological properties, emulsion, and oxidative stability. After the cold pressing
process of hot pepper seeds, a by-product rich in protein, carbohydrate, phenolic component, and carotene,
especially capsaicin, was obtained. This by-product has potential use in the low-fat emulsion as a natural
fat replacer and antioxidant agent. The rheological properties (steady shear, frequency sweep, and 3-ITT),
emulsion stability, and oxidative stability of low-fat salad dressing prepared by different concentrations of
HPOB were compared with low fat and full-fat control salad dressing samples. All emulsions showed the
shear-thinning characters. K value of the samples ranged from 4.10 to 7.79 and increased with increasing
HPOB concentration, indicating that shear thinning characters could be improved by using HPOB. The G
value was higher than G for all samples, indicating that all samples showed solid-like viscoelastic
character. G value was significantly increased as increasing HPOB concentration, and the low-fat samples
prepared with 5% HBOB showed similar behavior to full-fat samples. The 3-ITT test was modeled with the
second-order structural kinetic model, and the model parameters, namely, Go, Ge, and Ge/Go were
calculated. Ge/Go increased with increasing HPOB concentration, indicating that recoverable characters
improved by HPOB. Physical stability of emulsion was characterized by zeta potential, particle size,
thermal loop test, and light microscope images. Oxidative stability was tested by OXITEST and IP values
of samples enriched by HPOB compared to control samples. The oxidation rate was modeled by zero, first,
and second-order kinetic models, and the oxidation kinetics constant (k) value was estimated. This study
recommended that HPOB could be successfully used as natural fat replacers and antioxidant agents.
Keywords: Antioxidant, capsaicin, fat replacers, oxidation kinetic, rheology
International Conference on
RAW MATERIALS TO PROCESSED FOODS 03-04 June 2021, Turkey
303
Current Trends in Encapsulation: Applications in Food Science
Eda Adal
Gastronomy and Culinary Arts, İskenderun Technical University, İskenderun Teknik Üniversitesi (İSTE) Rektörlüğü,
Merkez Kampüs, 31200, İskenderun, Hatay, Türkiye
0090 326 613 56 00, [email protected]
ABSTRACT
Encapsulation has been used as an efficient technology used in scientific and industrial areas for many
years. Encapsulation in food science area can be defined as getting core material surrounded by a wall
material often referred to shell, carrier, coating, matrix or encapsulant with the aim to protect the entrapped
constituents from severe environments and release them at controlled rates over prolonged periods of time
or at specific target sites (e.g., in the gastrointestinal track). Different encapsulation methods (spray drying,
freeze drying, fluidized bed drying, emulsion and extrusion) have been usually used to encapsulate
different bioactive agents, such as, vitamins, essential oils, peptides and enzymes. Recently, liposome
technology, hydrogel based microgel particles and molecular encapsulation have gained great attention for
food encapsulation. This review aims to present all of these current trend methods and usage of them in the
encapsulation of bioactive compounds applied in food.
Keywords: encapsulation, liposome, hydrogel, cyclodextrin
INTRODUCTION
Incorporating bioactive components as active agents as far as food packaging is concerned or their
inclusion as nutraceuticals in functional food substances has gained significant attention in the area of food
research. Unfortunately, use of bioactive ingredients is mostly limited by their poor solubility, stability, and
flavour during food processing due to oxygen, temperature, and light. This is in addition to their low
bioavailability and uncontrolled release pattern in the gastro-intestinal tract (GIT). As a result, their
potential biological benefits can be affected significantly. As a way to overcome such challenges, scientists
have decided to design suitable carriers. One popular method that is increasingly being applied is
encapsulation. It is a procedure designed to entrap bioactive compounds and protect them from the GIT (for
example, the stomach acid) and adverse environmental conditions (Dias et al., 2015).
In the field of food science, encapsulation is defined as the packaging technology of materials, solid, liquid
or gaseous, into small, sealed capsules capable of releasing the contents at a controlled rate. The coating
material is called capsule wall material, membrane carrier or shell. Capsule wall structures are often
composed of food grade polymers and lipids, such as proteins (gelatin, whey protein, etc.) and
polysaccharides (gum arabic, alginate, pectin, chitosan, cellulose, starch derivatives, etc.) (Fang and
Bhandari, 2010).
The encapsule wall material protects the core material from environmental influences (oxygen, light,
humidity, etc.) and improves stability handling conditions and overall acceptability. It also extends the
shelf life of products, improves the functionality of additives and expands the range of nutritionally
important food ingredients, including omega-3 fatty acids. (Kaushik et al., 2015).
Spray drying, freeze drying, spray cooling-chilling, spinning disk and centrifugal co-extrusion, extrusion,
fluidized bed, and coecervation are some of the technologies used in the food industry to manufacture a
variety of capsules through the encapsulation process (Jyothi et al., 2010). The review's goal is to describe
the fundamental and advanced technologies to encapsulate bioactive compounds with liposomes, hydrogel

International Conference on
RAW MATERIALS TO PROCESSED FOODS 03-04 June 2021, Turkey
304
based microgel and cyclodextrins, and recent advancements in researches.
LIPOSOMES
A liposome is an artificial lipid vesicle with a bilayer phospholipids arrangement with the head groups
directed towards the interior of the bilayer and the acyl group facing water on the outside of the membrane
(Figure 1). Liposomes have the unique property of delivering their content to specific parts of food.
Liposomes can also be used to deliver the encapsulated ingredient at a specific and well-defined
temperature (Ajeeshkumar et al., 2021).
Liposomes are usually made up of phosphatidylcholine (lipid) molecules, although they can also be made
up of phospholipid mixes. Major phospholipids used in liposomes are soy lecithin, egg lecithin , marine
lecithin, and milk phospholipid. Thin-film formation and the proliposome method are two of the most
frequent and up-scalable liposome manufacturing processes, resulting in liposomes of various sizes and
degrees of lamellarity (multilamellar vesicles). The proliposome approach has been used to encapsulate
food bioactives with liposomes that have the correct properties, such as high encapsulation efficiency, good
stability, narrow particle size, and controlled release (Ajeeshkumar et al., 2021; González-Ortega et al.,
2021).
Liposomes have been widely used as carrier's systems for pharmaceutical, food and nutraceutical
applications. Li and co workers (2018) studied stability and bioaccessibility of curcumin liposomes (cur-
Lps) by using different pluronics (triblock copolymers with a central hydrophobic poly (propylene oxide)
(PPO) chain with two hydrophilic poly (ethylene oxide) (PEO) on each side) as modifiers. Thin film
evaporation combined with dynamic high pressure microfluidization were used to make pluronics modified
curcumin liposomes (cur-pluronic-Lps). Chitosan-coated nanoliposomes which prepared using thin-film
hydration method, as a practical delivery system for encapsulation of caffeine were studied by Seyedabadi
et al. (2021). González-Ortega et al. (2020) encapsulated oleuropein-rich olive leaf extract in soy
phosphatidycholine and incorparated in model and commercial drinks. They demonstrated that in food
systems such as drinks, lipid encapsulation does indeed provide a good carrier for oleuropein.
Figure 1. A simplified illustration of a liposome’s molecular arrangement in water (Inprocess-lsp, 2021).

International Conference on
RAW MATERIALS TO PROCESSED FOODS 03-04 June 2021, Turkey
305
HYDROGEL BASED MICROGEL PARTICLES
Hydrogels are three-dimensional solid networks made up of physically or chemically cross-linked
hydrophilic polymeric structures that can entangle a large amount of water or other biological fluids.
Microparticles, nanoparticles, coatings, and films are all examples of physical states in which hydrogels
can be produced (Abaee et al., 2017).
They are receiving a lot of attention in the field of encapsulated delivery systems, which are used to
transport therapeutic medications and bioactive components to the location of interest, and have a lot of
applications in biotechnology, medicine, and food technology (Zhang et al, 2016).
Because of their biodegradability, biocompatibility, and nontoxicity, many hydrogels, mainly from proteins
and polysaccharides such rice starch, alginate, chitosan, and pectin as food grade polymers, have been
employed as delivery matrix for active agents in recent years. Furthermore, the combined use of protein
and polysaccharides is of great importance for the development of innovative gel systems, as different
polysaccharides interact differently with the protein network, allowing for greater control over the release
rates of such gels (Abaee et al., 2017).
Pedrali et al. (2020) extracted phenolics from winemaking byproducts and encapsulated by a a new
hydrogel-based system. Their study lead to alginate and chitosan hydrogels can be used for encapsulation
of phenolics extracted from grape seeds with encapsulation efficiency up to 92%. In another study, Zhang
et al. (2016) incorporated b-carotene into three different delivery systems: free lipid droplets; filled
hydrogel beads formed using 0.5% alginate (“0.5% beads”); and, filled hydrogel beads formed using 1%
alginate (“1% beads”). Using an extrusion apparatus, they created hydrogel beads by inserting an alginate
solution into a calcium ion solution (Encapsulator).
MOLECULAR ENCAPSULATION
Molecular encapsulation is a process during which a single molecule is incorporated as guest in another
host molecule that contains a cavity in its structure (Parbuntari et al., 2021).
Most common host molecules with applications in foods are cyclodextrins (CDs), which are cyclic
nonreducing oligosaccharides with a torus-like structure. Most common host molecules with applications in
foods are cyclodextrins (CDs), which are cyclic nonreducing oligosaccharides with a toruslike structure;
the most common native CDs are composed of 6, 7, and 8 glucosyl units interconnected via α-(1 → 4)
glycosidic linkages, and called α-, β-, and γ-CD, respectively (Figure 2) (Hu et al., 2021).
An active nonpolar molecule (guest), with the right size and co-solubilized or dispersed with the
cyclodextrin (host) in an aqueous solution, can be reversibly entrapped into the cavity to form an inclusion
complex. The driving forces of host-guest binding are mainly due to the release of enthalpyrich water
molecules from the cavity and noncovalent interactions including van der Waals interactions, hydrogen
bonding, and hydrophobic interactions. The greater the affinity for the CDs, the higher the hydrophobicity
and the smaller the guest molecule (Del Valle, 2004).
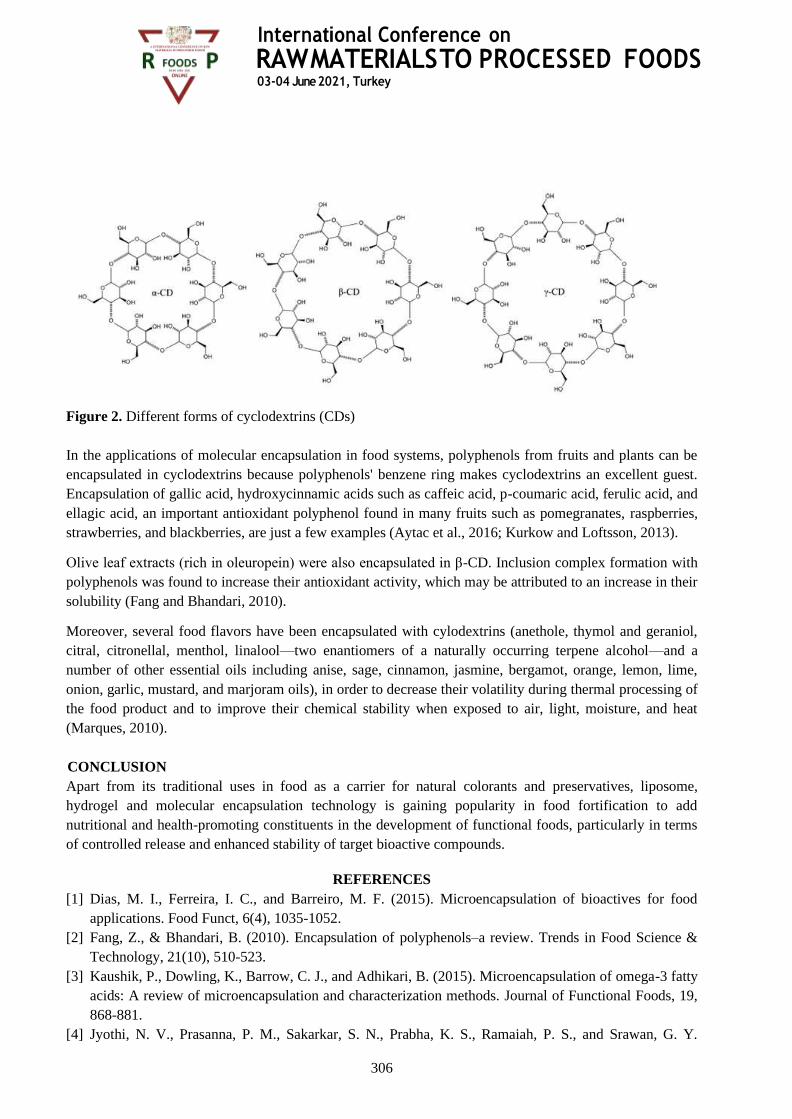
International Conference on
RAW MATERIALS TO PROCESSED FOODS 03-04 June 2021, Turkey
306
Figure 2. Different forms of cyclodextrins (CDs)
In the applications of molecular encapsulation in food systems, polyphenols from fruits and plants can be
encapsulated in cyclodextrins because polyphenols' benzene ring makes cyclodextrins an excellent guest.
Encapsulation of gallic acid, hydroxycinnamic acids such as caffeic acid, p-coumaric acid, ferulic acid, and
ellagic acid, an important antioxidant polyphenol found in many fruits such as pomegranates, raspberries,
strawberries, and blackberries, are just a few examples (Aytac et al., 2016; Kurkow and Loftsson, 2013).
Olive leaf extracts (rich in oleuropein) were also encapsulated in β-CD. Inclusion complex formation with
polyphenols was found to increase their antioxidant activity, which may be attributed to an increase in their
solubility (Fang and Bhandari, 2010).
Moreover, several food flavors have been encapsulated with cylodextrins (anethole, thymol and geraniol,
citral, citronellal, menthol, linalool—two enantiomers of a naturally occurring terpene alcohol—and a
number of other essential oils including anise, sage, cinnamon, jasmine, bergamot, orange, lemon, lime,
onion, garlic, mustard, and marjoram oils), in order to decrease their volatility during thermal processing of
the food product and to improve their chemical stability when exposed to air, light, moisture, and heat
(Marques, 2010).
CONCLUSION
Apart from its traditional uses in food as a carrier for natural colorants and preservatives, liposome,
hydrogel and molecular encapsulation technology is gaining popularity in food fortification to add
nutritional and health-promoting constituents in the development of functional foods, particularly in terms
of controlled release and enhanced stability of target bioactive compounds.
REFERENCES
[1] Dias, M. I., Ferreira, I. C., and Barreiro, M. F. (2015). Microencapsulation of bioactives for food
applications. Food Funct, 6(4), 1035-1052.
[2] Fang, Z., & Bhandari, B. (2010). Encapsulation of polyphenols–a review. Trends in Food Science &
Technology, 21(10), 510-523.
[3] Kaushik, P., Dowling, K., Barrow, C. J., and Adhikari, B. (2015). Microencapsulation of omega-3 fatty
acids: A review of microencapsulation and characterization methods. Journal of Functional Foods, 19,
868-881.
[4] Jyothi, N. V., Prasanna, P. M., Sakarkar, S. N., Prabha, K. S., Ramaiah, P. S., and Srawan, G. Y.
International Conference on
RAW MATERIALS TO PROCESSED FOODS 03-04 June 2021, Turkey
307
(2010). Microencapsulation techniques, factors influencing encapsulation efficiency. J Microencapsul,
27(3), 187-197.
[5] Ajeeshkumar, K. K., Aneesh, P. A., Raju, N., Suseela, M., Ravishankar, C. N., & Benjakul, S. (2021).
Advancements in liposome technology: Preparation techniques and applications in food, functional
foods, and bioactive delivery: A review. Comprehensive Reviews in Food Science and Food Safety,
20(2), 1280-1306.
[6] González-Ortega, R., Šturm, L., Skrt, M., Di Mattia, C. D., Pittia, P., & Ulrih, N. P. (2021). Liposomal
encapsulation of oleuropein and an olive leaf extract: Molecular interactions, antioxidant effects and
applications in model food systems. Food Biophysics, 16(1), 84-97.
[7] Li, Z. L., Peng, S. F., Chen, X., Zhu, Y. Q., Zou, L. Q., Liu, W., & Liu, C. M. (2018). Pluronics
modified liposomes for curcumin encapsulation: Sustained release, stability and bioaccessibility. Food
research international, 108, 246-253.
[8] Seyedabadi, M. M., Rostami, H., Jafari, S. M., & Fathi, M. (2021). Development and characterization
of chitosan-coated nanoliposomes for encapsulation of caffeine. Food Bioscience, 40, 100857.
[9] https://www.inprocess-lsp.com/liposomes/ accessed by 26.06.2021 at 01.00 p.m.
[10] Abaee, A., Mohammadian, M., & Jafari, S. M. (2017). Whey and soy protein-based hydrogels and
nano-hydrogels as bioactive delivery systems. Trends in Food Science & Technology, 70, 69-81.
[11] Zhang, Z., Zhang, R., & McClements, D. J. (2016). Encapsulation of β-carotene in alginate-based
hydrogel beads: Impact on physicochemical stability and bioaccessibility. Food Hydrocolloids, 61, 1-
10.
[12] Pedrali, D., Barbarito, S., & Lavelli, V. (2020). Encapsulation of grape seed phenolics from
winemaking byproducts in hydrogel microbeads–Impact of food matrix and processing on the
inhibitory activity towards α-glucosidase. Lwt, 133, 109952.
[13] Parbuntari, H., Etika, S. B., & Delvia, E. (2021, February). Molecular encapsulation of bioactive
molecules of Ruku-Ruku leaves (Ocimum tenuiflorum Linnen) as a preliminary stability study. In
Journal of Physics: Conference Series (Vol. 1788, No. 1, p. 012002). IOP Publishing.
[14] Hu, Z., Li, S., Wang, S., Zhang, B., & Huang, Q. (2021). Encapsulation of menthol into
cyclodextrin metal-organic frameworks: Preparation, structure characterization and evaluation of
complexing capacity. Food Chemistry, 338, 127839.
[15] Del Valle, E. M. M. (2004). Cyclodextrins and their uses: A review. Process Biochemistry, 39(9),
1033–1046.
[16] Aytac, Z., Kusku, S. I., Durgun, E., & Uyar, T. (2016). Encapsulation of gallic acid/cyclodextrin
inclusion complex in electrospun polylactic acid nanofibers: Release behavior and antioxidant activity
of gallic acid. Materials Science and Engineering: C, 63, 231–239.
[17] Kurkov, S. V., & Loftsson, T. (2013). Cyclodextrins. International Journal of Pharmaceutics,
453(1), 167–180.
[18] Marques, H. M. C. (2010). A review on cyclodextrin encapsulation of essential oils and volatiles.
Flavour and Fragrance Journal, 25(5), 313–326.
International Conference on
RAW MATERIALS TO PROCESSED FOODS 03-04 June 2021, Turkey
308
Effect of Roasting and Drying on Phenolic Compounds and Color Properties of
Domat Variety Olive Seeds
Alev Yüksel Aydar1*, Tuba Aydin1, Büşra Baykan1, Tuncay Yilmaz1
1Manisa Celal Bayar University, Department of Food Engineering, Manisa-Turkey
*E-mail: [email protected]
ABSTRACT
The olive, precious fruit, is eaten for centuries with its unique nutritional properties. The cultivation of
olive was particularly concentrated in countries surrounding the Mediterranean Sea. Olive seed (inner
kernel) represents approximately 2-4% of olive fruit and is a by-product of the production of stuffed and
sliced olives. The research represents that olive seeds contain bioactive components close to olive and olive
oil. Market demand for biological products rich in phenolic compounds, have many positive health effects
such as preventing bad cholesterol on human health, reducing the risk of heart disease and cancer, has been
increasing for decades. In this study, the effect of hot air drying and roasting on the color properties and
phenolic components of olive seeds including gallic acid, 3-hydroxytyrosol, vanillic acid, verbascoside and
oleuropein has been investigated. Total phenolic compounds of olive seed were increased both in hot air
drying and roasting processes compared to raw olive seeds. L* values were found 47.15, 38.14, 47.14 and
40.93 olive seeds roasted for 25 min., roasted for 35 min., dried at 60 °C and dried at 70 °C, respectively.
Keywords: Drying, Roasting, Olive Seed, Phenolic Compounds, Color Properties
International Conference on
RAW MATERIALS TO PROCESSED FOODS 03-04 June 2021, Turkey
309
Bioavalibility of Olive and Olive oil Phenolic Compounds
Turkan Mutlu Keceli1*, Senem Kamiloglu2, Esra Capanoglu3, Apostolos Kritsakis4
1The University of Cukurova, Department of Food Engineering 01330 Balcali-Adana- Turkey 2Bursa Uludag University, Science and Technology Application and Research Center, Gorukle, Bursa, Turkey
3Istanbul Technical University, Faculty of Chemical & Metallurgical Engineering, Food Engineering Department,
34469, Maslak, Istanbul, Turkey 4Emeritus Professor of International Hellenic University, Thessaloniki Greece,
Chairman of the Observatory of Oxidative Stress, in Health and Agrifood
*E-mail: [email protected], 0322 3386173
ABSTRACT
Phenolic compounds are an important class of natural antioxidants. In small amounts in food, phenolic
compounds are capable of preventing/retarding and/or reducing the oxidation witch oxidation can lead to a
decrease in both nutritional value and sensory quality. Phenolic compounds are intensively studied in order
to evaluate their effects on health, including antioxidant, antiallergic, antimicrobial, antithrombotic,
antiatherogenic, hypoglycemic, antiinflammatory, antitumor, cytostatic, and immunosuppressive
properties, and protective activities. The increase interest in extra virgin olive oil (EVOO) is mainly
attributed to its high oxidative stability due to its chemical composition that includes an unsaponifiable
fraction, containing important phenolic compounds. The antioxidant properties of phenolic compounds in
olives and olive oil are mainly based to their reduction - oxidation (redox) properties, which allow them to
act as reducing agents, hydrogen donators, and singlet oxygen quenchers. Accumulating evidence suggests
that virgin olive oil may have health benefits; it can be considered as an example of a functional food
containing a variety of components that may contribute to its overall therapeutic characteristics. It is very
well known that phenolic compounds of olive oil have numerous antioxidant effects, however little is
known about their bioavailability at real-life doses. The purpose of this presentation is to discuss the
importance and the bioavailability of olives and olive oil phenolic compounds.
Keywords: Olives, Olive Oil, Phenolic Compounds, Antioxidants, Bioavailability
References (Optional):
Keceli, T.M., Kamiloglu, S., Capanoglu, E.G. (2017) Phenolic Compounds in Olives and Olive oil and Their Bioavalaibality. In:
Olives and Olive Oil As Functional Foods, Edits Apostolos Kiritsakis & Fereidoon Shahidi, Wiley, Co.
International Conference on
RAW MATERIALS TO PROCESSED FOODS 03-04 June 2021, Turkey
310
Evaluation of Plant Ingredients Obtained from Cannabis Species for Use as
Food Additives
Ümit Babacan1*, Mehmet Fatih Cengiz1, Mariem Bouali1, Sude Keşçi1
1Akdeniz University, Faculty of Agriculture, Department of Agricultural Biotechnology, 07070, Antalya,
TURKEY
*E-mail: [email protected], 00 90 506 541 87 13,
ABSTRACT
Cannabis, whose growing area has recently been expanded with legal permission in our country, is an
important plant material that, attracts the attention of the pharmaceutical industry due to its content of
secondary metabolites such as cannabinoids, terpenes, and phenolic compounds. Nowadays, the active
substance is also used in the food industry as cannabis infused foods in many countries where cannabis is
legal. However, these kinds of products have been prohibited by legal authorities in many countries,
including Turkey. According to “Plant List” declared by Republic of Turkey Ministry of Agriculture and
Forest, only the seed part of the Cannabis can be used, and total cannabinoid content should be less than 5
mg/kg. In this case, seeds of cannabis, whose cannabinoid contents are lower than the permitted level, can
be used for food products like edible oil, dietary fiber, protein powder and snacks.
Generally, cannabis seeds contain 20–25% protein, 20–30% carbohydrates, 25–35% oil (50-70% linoleic,
15-25%, -linoleic, 10-16% oleic), 10–15% insoluble fiber and variety of minerals (P, K, Mg, Ca, Na, Fe).
Cannabis oil is particularly high in polyunsaturated fatty acids, particularly omega-3 and omega-6, which
account for approximately 80% of the fatty acids, while the protein contains a high amount of essential
amino acids and arginine. The seed protein's high arginine content makes it particularly useful as a dietary
component in foods that promote cardiovascular health. In addition, fiber content of the seed is beneficial
for maintaining a healthy colon, where it acts as a prebiotic to encourage probiotic development.
In conclusion, although the cannabis vegetative plants have been restricted for using as food products in
many countries due to their cannabinoid contents, some parts of the plant especially seeds could be used for
production of valuable food materials. These materials should be checked for the cannabinoid contents
before use as food ingredients.
Keywords: Cannabis, Food additives, Plant ingredients, Products.
International Conference on
RAW MATERIALS TO PROCESSED FOODS 03-04 June 2021, Turkey
311
Volatiles Compositions of Strawberry Fruit During Shelf Life Using Pre and
Postharvest Hexanal Treatment
Ayşe Tülin Öz1, Ebru Kafkas2
1Department of Food Engineering, Faculty of Engineering, Osmaniye Korkut Ata University, Osmaniye, Turkey 2Department of Horticulture, Faculty of Agriculture, Çukurova University, Adana, Turkey
ABSTRACT
Changes in volatile compositions were determined in ‘Rubygem’ strawberry varieties releated to pre and
postharvest hexanal application during shelf life. Fort his concern ‘Rubygem’ varieties were treated with
hexanal vapor and sprey applications which were (%0, %0.01 %0.02), doses before and after harvest and
strawberry fruits were stored at 2oC and RH %90 conditions. Effects of hexanal sprey and vapor application
of strawberry fruit volatile profiles were analyzed with HS-SPME/GC-MS tecnique. Differences among
treatments were identified in volatile compositions at three days intervals during 15 days of storage. Results
showed that, hexanal application type and concentration effected in the amount of volatile and composition
of esters, ketones, alcohols, acids, aldehydes during shelf life. The hexanal application time and
concentrations were affected on volatiles composition and amount ‘Rubygem’ strawberry varieties. For this
reason, hexanal application has important effects on volatiles of strawberries during shelf life.
Keywords: strawberry, hexanal, volatile profile, pre-harvest, postharvest
International Conference on
RAW MATERIALS TO PROCESSED FOODS 03-04 June 2021, Turkey
312
Efficacy of Pre-Harvest Sprey Application on Strawberry Fruit Postharvest
Quality
Ayşe Tülin Öz1, Hayrünnisa Yurdakul1
1Department of Food Engineering, Faculty of Engineering, Osmaniye Korkut Ata University, Osmaniye, Turkey
ABSTRACT
Synthetic fungicides use for prevention of fungal decay however hexanal is known as GRAS which is
organic volatile compound that sprey applicaion uses for antifungal protection instead. Aimed to evaluate
the efficacy of “Fortuna” cultivars on physical, chemical and microbial qualities. To this end, “Fortuna”
strawberry varieties were spreyed with hexanal in three different doses (0%, 0.01% 0.02%), before harvest.
After spreying strawberry fruits were stored under cold-stored conditions. Efficacy of hexanal sprey
application on fruit color, firmness, soluble solids, titratable acidity total phenolic content, total flavonoid
content, organic acids and soluble sugars, microbial quality in stored at 2 °C for 15 days were evaluated.
Results indicated that hexanal sprey treatment positively effects to ‘Fortuna’ strawberry firmness, microbial
qualities furthermore maintained physical quality, chemical composition and postharvest quality and the
shelf life.
Keywords: hexanal, sprey, strawberry, sugar, shelf life
International Conference on
RAW MATERIALS TO PROCESSED FOODS 03-04 June 2021, Turkey
313
The Effect of Different Drying Methods on Drying Kinetic, Bioactive and Color
Properties of Cape Gooseberry Fruit
Esra Avci1, Zeynep Hazal Tekin-Cakmak1, Selma Kayacan1, Salih Karasu1
1Yildiz Technical University, Faculty of Chemical and Metallurgical Engineering, Department of Food Engineering,
Davutpasa Campus, Istanbul, Turkey
ABSTRACT
In this study, the effects of freeze-drying (FD), ultrasound-assisted vacuum drying (UAVD), vacuum
drying (VD) and hot air drying (HAD) methods on the drying kinetic, total bioactive content, phenolic
profile, carotenoid content, and color and microstructural properties of Cape Gooseberry (Physalis
peruviana L.) samples were evaluated. The effects of different drying methods were investigated and the
drying methods significantly affected all selected parameters of dried Cape gooseberry (P<0.05). At 50 °C,
the drying time of the Cape Gooseberry samples was 780 min, 960 min, and 1180 min for UAVD, VD, and
HAD, respectively. According to the phenolic profile, total phenolic content (TPC), antioxidant activity
(DPPH method), and total carotenoid analysis, FD retained more bioactive compounds than other methods,
followed by UAVD. Compared to other dried samples, FD had less shrinkage and highest color quality.
UAVD showed lower shrinkage and less drying times than VD and HAD. Thanks to higher bioactive
compounds retention, better color and surface quality, and higher recovery of bioactive compounds, UAVD
and VD methods should be used as alternative methods to HAD method for drying of Cape Gooseberry
fruit.
Keywords: Antioxidant, carotenoid, color, SEM

International Conference on
RAW MATERIALS TO PROCESSED FOODS 03-04 June 2021, Turkey
314
Some Rheological Characteristics of Kefiran Biopolymer Isolated from Kefir
Grains Biomass
Eda Ondul Koc1*, Mahmut Inal2
1*Bolu Abant Izzet Baysal University, Yeniçağa Yaşar Çelik Vocational School Food Processing Department,
Food Quality Control and Analysis 14650 Yeniçağa/Bolu 2Hakkari University, Yüksekova Vocational School Vegetable and Animal Production Department
30000 Hakkari
*E-mail: [email protected], 05536095124
ABSTRACT
Kefiran is an extracellular polysaccharide constituted by glucose and galactose produced by Lactobacillus
kefiranofaciens. It is included into kefir grains has several health promoting properties. In the present work,
kefiran was produced from kefir grains, using UHT skimmed milk as a raw material. The some rheological,
physico-chemical and morphological characteristics of this polysaccharide were assessed by means of a
series of techniques. The flow properties of kefiran solutions with concentrations ranging from 1.1 to 3.3 %
(w/v) were examined. Kefiran showed a Newtonian behaviour at low concentrations and a pseudoplastic or
shear thinning flow at the higher concentrations. Apparent viscosity decreased with the increased of shear
rate according to pseudoplastic behaviour. High-performance liquid chromatography (HPLC) analysis of
monosaccharides suggested that kefiran was composed of glucose and galactose in an approximate ratio of
1.0:0.4.) Spectral analysis of kefiran (FTIR) revealed the presence of carboxyl, hydroxyl, and amide
groups, which corresponded to a typical heteropolymeric polysaccharide, which indicated a purified
structure of isolated kefiran from kefir grains biomass. The scanning electron microscopy (SEM) images of
polysaccharide kefiran showed homogeneous morphology with porous and a sponge-like structure. This
polysaccharide brings a perspective for its use as gelling agent in foods.
Keywords: Exopolysaccharide, Kefiran, Rheology
International Conference on
RAW MATERIALS TO PROCESSED FOODS 03-04 June 2021, Turkey
315
Properties and Applications of a Branched Polysaccharide Kefiran
Eda Ondul Koc*
*Bolu Abant Izzet Baysal University, Yeniçağa Yaşar Çelik Vocational School Food Processing Department,
Food Quality Control and Analysis 14650 Yeniçağa/Bolu
*E-mail: [email protected], 05536095124
ABSTRACT
The synthetic polymers lead to serious environmental problems due to their non-biodegradation.
Considering increased concerns about the synthetic polymers and harmful effects of the environmental
pollution, biopolymers have recently attracted mounting interest among researchers and industrialists.
Rising interesting in the use of eco-friendly materials as green alternatives for fossil-based biopolymers has
shifted the research focus towards biopolymers. Kefiran has been introduced as a biodegradable polymer
due to its nontoxicity. Kefiran, an extracellular polysaccharide with many hydroxyl groups, obtained from
the microorganisms present in kefir grain. This edible biopolymer is a water-soluble branched
glucogalactan with equal amounts of D-glucose and D-galactose. This review aims at presenting an
overview on recent advances in the use of kefiran biopolymer with special reference to their antioxidant
and antimicrobial applications, biologic activities, film-forming ability in various fields.
Keywords: Biopolymer, Exopolysaccharide, Kefiran
International Conference on
RAW MATERIALS TO PROCESSED FOODS 03-04 June 2021, Turkey
316
The effect of Activated Carbon Obtained from Hazelnut Shell by KOH on the
Removal of Aqueous Methylene Blue Solutions
Birsen Sarici1, Esra Altıntığ2, Sukru, Karatas3
1İstanbul Aydın Üniversitesi, Fen Bilimler Enstitüsü, Gıda Güvenliği Bölümü, İstanbul, Türkiye,
[email protected], Tlf: 05056502172 2Sakarya Uygulamalı Bilimler Üniversitesi, Pamukova M.Y.O. Gıda Teknolojileri Bölümü, Sakarya, Türkiye,
[email protected] 3İstanbul Aydın Üniversitesi, Mühendislik Fakültesi, Gıda Mühendisliği Bölümü İstanbul, Türkiye,
ABSTRACT
Activated carbon is widely used for water and gas purification, removal of metal ions and dyes, and
production of high purity substances. Activated carbon can be produced from almost any carbon-rich and
inexpensive biomass with low inorganic content. In this study, chemical activation method was used in the
production of activated carbon from hazelnut shell with high carbon content. Chemical activation consists
of a series of reactions that result in the aromatization of the carbon skeleton and formation of the porous
structure as a result of dehydration of the cellulosic components of the raw material. In this study,
potassium hydroxide (KOH) was used as the activating agent. In order to achieve optimum activated
carbon production conditions from hazelnut shell, hazelnut shells in different mesh range (50-70-150) are
impregnated with different raw material / KOH ratios (1/1, ½, 1/3,) and nitrogen atmosphere (flow) at 600
oC. (flow rate 200 mL / min) and heat treatment rate 10 ° C / min for 2 hours. The optimum application
conditions were determined by determining the moisture content, ash ratio, when all the results obtained at
the end of the study were evaluated, it was seen that the sample obtained from the study with a range of 70
mesh and 1/3 ratio had the highest adsorption capacity. Due to its high surface area, low moisture and ash
content, KOH was thought to be a suitable chemical in the activation of activated carbon produced from
hazelnut shell. Volatile and fixed carbon amount, carbonization efficiency, iodine number, methylene blue
number of the produced activated carbon samples. In this study, in order to understand the methylene blue
adsorption mechanism, a series of instrumentation techniques were performed for the characterization of
the adsorbent using SEM / EDS, X-Ray and FT-IR analysis.
Keywords: Activated Carbon, Hazelnut shell, KOH, Methylene Blue

International Conference on
RAW MATERIALS TO PROCESSED FOODS 03-04 June 2021, Turkey
317
Assessment of the aroma profiles of Spirulina Platensis using HS-SPME–GC-
MS and Determination of Antioxidant Capacity
Turkan Uzlasir1, Oya Isik2, Leyla Hizarci Uslu2, Serkan Selli3, Hasim Kelebek1
1Department of Food Engineering, Faculty of Engineering, Adana Alparslan Turkes Science and Technology
University, 01250 Adana/ Turkey
2Department of Fisheries Basic Sciences, Faculty of Fisheries, Cukurova University, 01330 Adana/ Turkey 3Department of Food Engineering, Faculty of Agriculture, Cukurova University, 01330 Adana/ Turkey
Tel.: +90 5072105451 E-mail: [email protected]
ABSTRACT
Increased population, increased nutritional needs, and the risk of diseases caused by malnutrition have
prompted humanity to improve existing resources and take advantage of novel new food sources.
Microalgae are microbial resources capable of generating a variety of commercially valuable chemical and
biological compounds. The use of Spirulina platensis as human food dates back to the Aztec civilization
period. The impact of extraction solvents (methanol, ethanol, and water) on the total phenolic composition
and antioxidant activity of commercial Spirulina platensis was investigated in this study. The antioxidant
capacities of extracts were assessed via the DPPH methods. GC and HS-SPME-GC / MS were used to
evaluate the fatty acid profile and aroma compounds of Spirulina platensis, respectively. The total phenolic
content (TPC) and antioxidant potential of Spirulina extract obtained with water were clearly higher than
methanol, ethanol, and acetone extracts. The most abundant fatty acids in commercial Spirulina samples
were determined as elaidic acid (C18: 1 trans) and arachidic acid (C20:0). The high amount of hexadecane
and heptadecane as aroma compounds in Spirulina platensis and were identified, and β-ionone has also
been identified, which is considered a volatile fragrance compound and is used in the food industry as an
artificial sweetening ingredient.
Keywords: Spirulina platensis, aroma compounds, antioxidant potential
INTRODUCTION
Cyanobacteria, also described as blue-green algae (Cyanophyta), are gram-negative, photosynthetic, and
prokaryotic organisms. Their habitats are mostly around the world, from aquatic to land, and salt lakes,
deserts, polar regions, and hot springs (Borowitzka, 2018). Spirulina platensis is a filamentous,
multicellular, survival in alkaline environments micro-algae which is commonly cultivated the worldwide
as a source both of nutritious and of phycocyanin (blue pigment) utilized in food and cosmetics (Belay,
2013). Concurrently, the earliest records were showed that the Aztecs collected "Arthrospira platensis" a
nutrient-rich (particularly in terms of vitamin B12 and protein) from Lake Texcoco in Mexico and
consumed it as food for many years. (Ciferri, 1983; Fox, 1996). Spirulina platensis has been collected from
by the local people in Lake Chad for many years and used as a nutritional supplement known as "dihe"
(Siva Kiran et al., 2015). Among the Spirulina species, Spirulina fusiformis (Arthrospira fusiformis),
Spirulina platensis (Arthrospira platensis), and Spirulina maxima (Arthrospira maxima) have been
investigated the most extensively. They have high nutritional and potentially medicinal properties (Deng &
Chow, 2010). The World Health Organization (WHO) has approved Spirulina platensis as a rich natural
source of valuable secondary metabolites with potential economic applications and therapeutic
characteristis that are commonly utilized to supplement human and animal food (Hadizadeh et
al., 2019). Spirulina contains high amounts of protein (60-70 percent of dry weight), as well as essential
International Conference on
RAW MATERIALS TO PROCESSED FOODS 03-04 June 2021, Turkey
318
fatty acids, minerals (iron, magnesium, calcium, potassium), and vitamins (Deng & Chow, 2010). Both the
National Aeronautics and Space Administration (NASA) and the European Space Agency (ESA) it is
suggested as one of the primary food in long-term space missions due to its remarkably high nutritional
values (Deng & Chow, 2010). The cell wall is easy to be digested by humans as it consists of 86%
digestible polysaccharides (Li & Qi, 1997). Spirulina includes about 15% carbohydrate, 70% protein, 7%
mineral, 5% fat, and 3% moisture. Unlike other plant-based proteins, it contains both essential and non-
essential amino acids in a balanced way (Colla et al., 2007; Saranraj & Sivasakthi, 2014). It includes
abundant the essential fatty acids such as linoleic acid, γ-linolenic acid (36% of total PUFAs),
eicosapentaenoic acid, stearidonic acid, arachidonic acid, and docosahexaenoic acid. Furthermore, it has
been stated that gamma-linoleic acid is a significant component of the Spirulina cell membrane (Diraman
et al., 2009; Mühling et al., 2005).
Spirulina and its components have been reported to offer beneficial effects as a 'full' protein supply in
several human health indications, ranging from malnutrition to antioxidant capabilities. (Ravi et
al., 2010). Spirulina contains active phytochemicals such as chlorophyll (green pigment),
zeaxanthin (yellow pigment), xanthophylls (myxantophyll, zeazanthin, cryptozantine, echinone), and
carotenes (α-carotene, β-carotene, euglenanone, lutein), in addition to C-phycocyanin (blue
pigment) and allo phycocyanin, which are the phycobiliproteins that make up about 20% of the dry weight
and have the highest economic value (El-Baz et al., 2013).
The interest in micro-algae aroma compounds has grown in recent years, owing primarily to the various
structural properties and intriguing pharmacological functions of volatile compounds (Andrade et
al., 2018). Dimethyl sulfide, organohalogens, and unsaturated aldehydes aremong the aroma compounds
known to affect the flavor or aroma of micro-algae (Steinke et al., 2002). Furthermore, micro-
algae aroma compounds are not usually associated with musty, fishy, or mud-like odors (Milovanović et
al., 2015).
Spirulina's functional and nutritional potential has piqued researcher's interest in recent years. The
total phenolic contents, antioxidant potentials, fatty acids, and aroma compounds of Spirulina
platensis, as well as other important quality parameters, were thoroughly investigated in this
study. The fatty acid profile and aroma compounds were analyzed by GC and GC/MS,
respectively.
MATERIAL AND METHOD
Chemicals
Folin-Ciocalteu reagent were bought from Merck (Darmstadt, Germany) and Trolox and 2,2-Diphenyl-1-
picrylhydrazyl (DPPH) were also procured from Sigma-Aldrich Chemical Co. (St. Louis, USA). All of the
solvents and chemicals utilized in this research were chromatographic and analytical grade.
Spirulina platensis extract preparation
Egert (S1) and Algopyhco (S2) commercial Spirulina samples were procured from local markets in powder
form in Turkey. Spirulina extracts were prepared with various solvents such as water, ethanol, acetone, and
methanol at a 80% ratio. In this study, the reason for using different solvents is to determine if there is any
difference in antioxidant and total phenolic analyzed because of solvents. In a 50 ml erlenmeyer flask, one
gram of Spirulina was weighed, 20 ml of water was put in, and the mixture was mixed at room temperature
for one night in the dark. Identical conditions were also used for extracts of acetone, ethanol, and
methanol. The mixture was then centrifuged for 15 minutes at 4°C at 5.500 rpm.
Chemical Composition of Spirulina platensis
International Conference on
RAW MATERIALS TO PROCESSED FOODS 03-04 June 2021, Turkey
319
The total protein content analysis
Protein analysis is required to determine the amount of a specific protein in a mixture, the amount of non-
protein hydrogen, and the nutritional value of nutrients. The basic principles of the methods are the
determination of nitrogen and peptide bonds. The total protein content was analyzed using the Kjeldahl
method (AOAC, 2007; Cemerolu, 2014) in this study.
The moisture content analysis
Moisture content was determined by drying 2 g of sample for 16 hours in a 105 ° C drying oven in fixed
weighed petri dishes. The samples cooled in a glass desiccator were weighed and Official Methods of
Analysis were used to calculate the moisture content (AOAC, 2007).
The fatty acid methyl esters (FAME) analysis
Using the Soxhlet extraction device, Spirulina platensis was extracted with an appropriate solvent. Gas
chromatography was used in coupled with a flame ionization detector(FID) and split injection (1:50) to
assess the fatty acid profile of Spirulina. Cold transmethylation was used to prepare fatty acid methyl
esters (IOOC, 2001COI/T. 20/Doc. no. 24). A 60 m capillary column (DB23; Agilent Inc.) with a 0.25 mm
I.D. and 0.25 µm film thickness was used to separate the samples (AOAC, 2007; Christie, 1989; David et
al., 2005).
Antioxidant activity
DPPH assay The antioxidant activity was evaluated using the DPPH method, which was modified
(Sanchez-Moreno et al.,1998) from Brand-Williams et al., (1995). In a brief, 100µl of
each Spirulina extract was mixed with 3.9 ml of DPPH solution and incubated at room temperature for 1
hour in the dark. Using a UV–visible spectrophotometer, the absorbance was measured at 515 nm (Carry
60, Agilent, Malaysia). The antioxidant activity was determined using a calibration curve and expressed as
Trolox equivalents per gram.
Total phenolic content analyses
The total phenolic content were detected utilizing a Folin–Ciocalteu reagent previously expounded by
Cemeroğlu (2014) and Shahidi & Ambigaipalan (2015). In briefly, 7.5 ml of distilled water was added to
100 μl of extract or standard, then mixed for 3 minutes with 0.5 ml of Folin reagent, and added 1 ml of 20%
(w/v) Na₂CO₃ (sodium carbonate) and 0.9 ml of distilled water. The absorbance was measured using a UV-
VIS spectrophotomeer at 765 nm after the mixture was left to proceed for 1 hour at room temperature. TPC
was measured in milligrams per gram of extract and expressed as gallic acid equivalents (GAE).
Aroma compounds analysis
The headspace solid phase micro-extraction (HS-SPME) method was used to extract aroma compounds
in Spirulina platensis powders for gas chromatography-mass spectrometry (GC-MS) analysis (Agustini vd.
2019). On the "Agilent 6890N" brand gas chromatography and the associated "Agilent 5975B VL MSD"
mass spectrometer, the amount, identification, and determination of aroma compounds were all performed
concurrently. With the aid of a special separator, the column output is split into two and sent similarly to
the FID and MSD in this method (Dean switch-Agilent). As a result of the simultaneous quantification and
detection process, the sensitivity of the study has improved (Selli et al., 2014). The aroma compounds were
determined by "Agilent 7890A" brand flame ionization detector (FID) gas chromatography. A DB-WAX
capillary column (60 m x 0.25 mm x 0.4 m) was used to separate aroma compounds. "Agilent 5975B VL
MSD" brand mass spectrometer based on gas chromatography was used for the identification of its.

International Conference on
RAW MATERIALS TO PROCESSED FOODS 03-04 June 2021, Turkey
320
Identification of peaks was made by injecting the standard solution for compounds with the
standard, matching the mass spectrum of non-standard compounds with mass spectra from flavor libraries
stored in computer memory (Wiley 7.0, NIST-98, and Flavor.2L). The concentrations of aroma were
determined using the internal standard method after identification (Selli et al., 2008). Each analysis
was carried out three times. In the calculation, the response factor of each compound was taken into
account.
Statistical Analysis
SPSS 22.0 with ANOVA (SPSS Inc) was used to for the statistical data analysis. Duncan's test measured
the variations in the content levels of the results. Means with p-values below 0.05 have been found to be
statistically important.
RESULTS AND DISCUSSION
The moisture and Total protein content of Spirulina samples
Protein accounts for 60-70% of the dry weight of Spirulina, depending on the source (Phang et
al., 2000). Spirulina is "a full protein source" that contains essential amino acids, albeit it has less
methionine, cysteine, and lysine than meat, eggs, and milk proteins. Recently, there has been increasing
relevance in gaining some peptides and biofunctional proteins from micro-algae. Algal proteins have been
found to be of high quality with extensive examination and nutritional studies (Becker, 2007; Samarakoon
& Jeon, 2012). There are studies on the effects of proteins and peptides obtained from micro-algae such
as antihypertensive, antioxidant, and anti-inflammatory (Samarakoon& Jeon, 2012; Raposo et
al., 2013). Tthe total protein and moisture content varied significantly depending on commercial samples
(p<0.05). The physicochemical compositions of commercial Spirulina platensis in dry basis were moisture
contents 8.78 (SP1) and 9.24(SP2), protein content 42.14 (SP2) and 43.90 (SP1) in percentage.
In a study, antimicrobial effect and the nutraceutical properties of Moroccan Spirulina were investigated,
and it was stated that this Moroccan strain contained a significant amount of protein (76.65%) (Seghiri et
al., 2019).
Spirulina protein concentration was reported to be 58.2% by Alvarenga et al. (2011), but Mbaguinan et al.
(2006) was observed a higher protein content (69.2 %) in Spirulina obtained from Kanem Lake Chad
(Mbaguinan et al., 2006).
Moisture is a crucial component in determining the quality of micro-algae. The content of dry matter of
commercial Spirulina samples were average 90.99%. In fact, companies incorporate moisture standards in
their nutritional data, with a limit of less than 9% (WHO, 2004). It's possible that the difference in value is
attributable to the drying processes and time (Show et al., 2013). The packaging and storage circumstances
may influence indirectly the humidity rate. Extreme drying of microalgae is not recommended since it may
alter the structure of living cells, reducing their physicochemical qualities. As a result, their overall quality
will be subpar (Show et al., 2013).
The fatty acid profile of Spirulina samples
Microalgae can accumulate lipids till 90% of their dry weight, and their mean lipid composition ranges
between 1-70%. Microalgae lipids are organisms rich in long-chain fatty acids (PUFA) such as gamma
linoleic acid (GLA), eicosapentaenoic acid (EPA), and arachidonic acid (ARA) (Spolaore et al., 2006; El-
Baky & El-Baroty, 2013). The most abundant fatty acids for SP1 and SP2 samples were determined as
arachidic acid (C20:0) and elaidic acid (C18: 1 trans), respectively. Spirulina's long chain fatty
acids, provide a variety of benefits and functions in dietetic and medicinal applications. The synthesis of

International Conference on
RAW MATERIALS TO PROCESSED FOODS 03-04 June 2021, Turkey
321
prostaglandin hormone requires polyunsaturated fatty acids with 20 carbons in their structure, as in ARA
and EPA. Microalgae-derived omega-3 fatty acids are also in field of in the food and agriculture to make
omega-3 fatty acid-enriched foods (El-Baky & El-Baroty, 2013; Spolaore et al., 2006).
Spirulina is rich in γ-linolenic acid, which accounts for 36 % of total PUFAs, and also contains arachidonic
acid, linoleic acid, docosahexaenoic acid, eicosapentaenoic acid, arachidonic acid, and stearidonic acid,
according to Habib et al. (2008). Ten unsaturated fatty acids (palmitoleic acid, palmitoleic acid, sapienic
acid, vaccenic acid, linolelaidic acid, linoleic acid, elaidic acid, γ-linolenic acid, oleic acid, dihomo-
gamma-linolenic acid, and eicosenoic acid) and three saturated fatty acids (eicosadienoic acid were
determined in the study with commercial Spirulina by Al-Dhabi& Valan Arasu (2016).
Antioxidant activity and total phenolic content and of Spirulina samples
Spirulina is considered a rich source of nutritional phenolic and flavonoid compounds due to its higher
production capacity than traditional plant-based sources. The easy participation of phenolic compounds in
oxidation-reduction processes occurring in internal and exterior cells results in their antioxidant action
(Atouia et al., 2005). The antioxidant capacity and TPC of extracts prepared from Spirulina using various
solvents were calculated using the gallic acid calibration curve in milligrams of gallic acid equivalents per
gram of dry weight (mg GAE/g dw). A calibration curve was used to calculate the antioxidant
capacity, that was expressed as a mM Trolox equivalent per gram. The commercial Spirulina samples
extracted using various solvents have DPPH values ranging from 499 to 1746 mmol Trolox/100 g DW, and
TPC values ranging from 123 to 998 mg GAE/100 g DW. Antioxidant potential
and TPC of Spirulina extract obtained with water were clearly higher than methanol, ethanol, and acetone
extracts (p<0.05). The highest TPC and DPPH value between commercial Spirulina samples (998 mg
GAE/ 100 g DW and 1746 μmol Trolox/100g DW, rrespectively) were determined in SP2 sample extracted
with water.
The TPC of commercial Spirulina products ranged from 2.4 mg/g (21st Century HealthCare,
Inc., Arizona) to to 24.4 mg/g (source Naturals, Inc., Santa Cruz, California), according to Al-Dhabi &
Valan Arasu (2016). The existence of total phenolic components and other metabolites is linked to
antioxidant capabilities, according to Wu et al. (2005).
Antioxidants are chemicals that neutralize free radicals or their effects and help to protect the body from
free radicals or their actions (Wanasundara& Shahidi, 2005). Spirulina protects against lipid peroxidation
and DNA damage by warn antioxidant enzyme activity and neutralizing free radicals (Abdelkhalek et
al., 2015). In a study, the DPPH value of Spirulina maxima samples was determined between 23.22 to
35.62 μg/ml (Abd El-Baky et al., 2009). The micro-algae are regarded a promising therapy for fighting
cardiovascular disorders due to their high antioxidant activity (Deng& Chow, 2010). Antioxidant activity
was determined to be higher in the methanolic fraction (23 mg TE/g dw)(DPPH) in a study assessing the
biological and nutritional properties, as well as the functional composition of
Moroccan Spirulina. Plants and Spirulina both contain a large number of antioxidant
metabolites. Metabolites containing the phenolic functional group in their chemical structure have been
discovered to have enzyme inhibition, anti-inflammatory activity, antiallergic activity, oestrogenic activity,
antioxidant activity, cytotoxic anticancer activity, and vascular activity (Shukla et al., 2009).
Aroma compounds of Spirulina samples
Microalgae naturally produce aroma compounds such as alcohols, esters, carbonyls, terpenes, and
aldehydes. In the food industry, these chemicals are utilized as flavoring additives.
International Conference on
RAW MATERIALS TO PROCESSED FOODS 03-04 June 2021, Turkey
322
There were a total of 53 aroma compounds identified and quantified. Spirulina platensis contains a high
amount of heptadecane (80-82%), hexadecane (4-4.7%), and β-ionone has been widely utilized in the food
industry as an artificial flavoring ingredient. Pentadecane, hexadecane, and heptadecane between the most
common hydrocarbons found in Spirulina platensis. Hydrocarbons are produced as a result of the
decarboxylation of stearic and palmitic acids (Andrade et al., 2018; Cuellar-Bermdez et al.,
2017). Although it has a high odour threshold, the presence of this compound may cause to the off-flavor of
algae linked with crude fish notes (Cuellar-Bermúdez et al., 2017)
Milovanovic et al. (2015), detected odorous compounds such as 2-pentylfuran, 2-methylisoborneol, 𝛽-
ionone and 𝛽-cyclochitral and hydrocarbons (alkenes and medium-length alkanes alkenes) in small
amounts in Spirulina.
In a study explored the role of Spirulina on growth and chemical composition in different geographical
regions, volatile compounds such as 5-hepten-2-one, 5-methyl-2-hexanone, α-ionone, 6 methyl-, and
epoxy-β-ionone were determined (De Jesus et al., 2018).
In a study conducted at Ege University, volatile components were examined in the extracts
of Spirulina platensis obtained by using various solvents (methanol, dichloromethane petroleum ether,
ethyl acetate) and heptadecane and tetradecane were determined as the main components (Ozdemir et
al., 2004).
Conclusion
The total phenolic content (TPC) and antioxidant potential of Spirulina extracts prepared with water were
clearly higher than extracts obtained with methanol, ethanol, or acetone. The most abundant fatty acids
for Spirulina samples were determined as arachidic acid (C20:0) and elaidic acid (C18: 1 trans). The HS-
SPME-GC/MS was used to evaluate the aroma compounds of commercial Spirulina samples. A total of
53 aroma compounds were identified and quantified. The high amount of heptadecane (%80-82) and
hexadecane (%4-4.7) were determined as aroma compounds in Spirulina platensis. Spirulina has incredible
characteristics and can be regarded a “Super Food” in many ways. It has the highest concentration of
nutrients of any plant, food, herb, or grain ever discovered. It includes 60% highly digestible vegetable
protein, as well as particularly high levels of vitamin B-12, beta-carotene, iron, trace minerals, and
important fatty acids. It has a balanced spectrum of amino acids, chlorophyll, and the blue pigment,
phycocyanin, and due to its high nutrient and protein content is accepted as an ideal food supplement and
an immune booster.
REFERENCES
Abd El-Baky, H. H., El Baz, F. K., El-Baroty, G. S. (2009). Production of phenolic compounds
from Spirulina maxima microalgae and its protective effects. African Journal of
Biotechnology, 8 (24), 7059-7067.
Abdelkhalek, N.K., Ghazy, E.W., Abdel-Daim, M.M. (2015) Pharmacodynamic interaction
of Spirulina platensis and deltamethrin in freshwater fish Nile tilapia, Oreochromis niloticus:
impact on lipid peroxidation and oxidative stress. Environmental Science and Pollution
Research, 22(4), 3023–3031.
International Conference on
RAW MATERIALS TO PROCESSED FOODS 03-04 June 2021, Turkey
323
Al-Dhabi, N. A., & Valan Arasu, M. (2016). Quantification of Phytochemicals from
Commercial Spirulina Products and Their Antioxidant Activities. Evidence-Based Complementary
and Alternative Medicine, 1–13.
Alvarenga, R., Rodrigues, B., Cantarelli, S., Zangeronimo, G., Júnior, S., Silva, R., Santos, M., &
Pereira, J. (2011). Brasilian Zootechnical, 40(5), 992-996.
Andrade, L. M., Andrade, C.J., Dias, M. (2018). Chlorella and Spirulina microalgae as sources of
functional foods, nutraceuticals, and food supplements; an overview. MOJ Food Process
Technology, 6(1), 45‒58.
AOAC International. (2007). Official methods of analysis. Method 976.06, 976.05, 960.52.
Atouia, A. K., Mansouria, A., Boskoub, G., Kefalasa, P. (2005). Tea and herbal infusions: Their
antioxidant activity and phenolic profile. Food Chemistry, 89(1), 27–36.
Aydi, S. sassi, Aydi, S., Ben Abdallah Kolsi, R., Haddeji, N., Rahmani, R., Ktari, N., Bouajila,
J. (2020). CO2 enrichment: Enhancing antioxidant, antibacterial and anticancer activities
in Arthrospira platensis. Food Bioscience, 35, 100575.
Becker, E. W. (2007). Micro-algae as a source of protein. Biotechnology Advances, 25(2).
Da Silva, M. F., Casazza, A. A., Ferrari, P. F., Aliakbarian, B., Converti, A., Bezerra, R. P.,
Perego, P. (2017). Recovery of phenolic compounds of food concern from Arthrospira
platensis by green extraction techniques. Algal Research, 25, 391–401.
David, F., Sandra, P., Vickers, A. K. (2005). Column selection for the analysis of fatty acid methyl
esters, Agilent Technologies Application Notes, USA.
De Jesus, C. S., da Silva Uebel, L., Costa, S. S., Miranda, A. L., de Morais, E. G., de Morais, M.
G., Druzian, J. I. (2018). “Outdoor pilot-scale cultivation of Spirulina sp. LEB-18 in different
geographic locations for evaluating its growth and chemical composition. Bioresource
Technology, 256, 86–94.
Deng, R., & Chow, T. J. (2010). Hypolipidemic, antioxidant and antiinflammatory activities of
microalgae Spirulina. Journal of Cardiovascular Pharmacology and Therapeutics, 28, 33-45.
Diraman, H., Koru, E., & Dibeklioglu, H. (2009). Fatty Acid Profile of Spirulina platensis used as
a food supplement. The Israeli Journal of Aquaculture - Bamidgeh, 61(2), 134-142.
Kelebek, H., Jourdes, M., Selli, S., Teissedre, P.L. (2013). Comparative evaluation of the phenolic
content and antioxidant capacity of sun-dried raisins. Journal of the Science of Food and
Agriculture, 93(12), 2963–2972.
Phang, S. M., Miah, M. S., Chu, W. L., Hashim, M. (2000). Spirulina culture in digested sago
starch factory waste water. Journal of Applied Phycology, 12: 395–400.
Raposo, M. F. J., de Morais, R. M. S. C., Bernardo de Morais, A. M. (2013). Health applications
of bioactive compounds from marine microalgae. Life Sciences, 93(15), 479–486.

International Conference on
RAW MATERIALS TO PROCESSED FOODS 03-04 June 2021, Turkey
324
Ravi, M., De, S. L., Azharuddin, S., & Paul, S.F.D. (2010). The beneficial effects
of Spirulina focusing on its immunomodulatory and antioxidant properties. Nutrition and Dietary
Supplements, 2, 73-83.
Samarakoon, K., Jeon, Y. (2012). Bio-functionalities of proteins derived from marine algae- A
review. Food Research International, 48(2), 948–960.
Sánchez-Moreno, C., Larrauri, J. A., Saura-Calixto, F. (1998). A procedure to measure the
antiradical efficiency of polyphenols. Journal of the Science of Food and Agriculture, 76(2), 270–
276.
Saranraj, P., & Sivasakthi, S. (2014). Spirulina platensis – food for future: a review. Asian Journal
of Pharmaceutical Science & Technology, 4 (1), 26-33.
Scaglioni, P. T., Quadros, L., de Paula, M., Furlong, V. B., Abreu, P. C., Badiale-Furlong,
E. (2018). Inhibition of enzymatic and oxidative processes by phenolic extracts from Spirulina
sp. and Nannochloropsis sp. Food Technology and Biotechnology, 56 (3), 344-353.
Seghiri, R., Kharbach, M., & Essamri, A. (2019). Functional composition, nutritional properties,
and biological activities of Moroccan Spirulina microalga. Journal of Food Quality, 1–11.
Selli, S., Canbas, A., Varlet, V., Kelebek, H., Prost, C., Serot, T. (2008). Characterization of the
most odor-active volatiles of orange wine made from a Turkish cv. Kozan ( Citrus sinensis L.
Osbeck). Journal of Agricultural and Food Chemistry, 56(1), 227–234.
Selli, S., Kelebek, H., Ayseli, M. T., Tokbas, H. (2014). Characterization of the most aroma-
active compounds in cherry tomato by application of the aroma extract dilution analysis. Food
Chemistry, 165, 540–546.
Siva Kiran, R.R., Madhu, G.M., Satyanarayana, S.V. (2015). Spirulina in combating protein
energy malnutrition (PEM) and protein energy Wasting (PEW) - A review. Journal of Nutrition
Research, 3 (1): 62–79.
Wanasundara, P., Shahidi, F., (2005). Antioxidants: science, technology, and applications. Bailey's
Industrial Oil and Fat Products, 6th Edition, Wiley, 6.
WHO (2004). Global Strategy on Diet, Physical Activity and Health, WHO, Geneva, Switzerland,
Wu, L.C., Ho, J.A. A., Shieh, M.C., & Lu, I.W. (2005). Antioxidant and antiproliferative activities
of Spirulina and Chlorella water extracts. Journal of Agricultural and Food Chemistry, 53, 10,
4207–4212.
Yamamoto, M., Baldermann, S., Yoshikawa, K., Fujita, A., Mase, N., Watanabe,
N. (2014). Determination of volatile compounds in four commercial samples of Japanese Green
Algae using solid phase microextraction gas chromatography mass spectrometry. The Scientific
World Journal, 1–8.
Funding
This work was supported by the TUBITAK-120O858 project.

International Conference on
RAW MATERIALS TO PROCESSED FOODS 03-04 June 2021, Turkey
325
Optimization of Low Fat High Protein Cookies Formulation: Effects of Using
Butter and Composite Flour on Nutritional, Physical and Sensory Properties
Emir Ayşe Özer1, Neslihan Özbuldu2, Beyza Özpalas3
1Department of Food Engineering, Faculty of Agriculture, Hatay Mustafa Kemal University, Hatay, Turkey 2Department of Nutrition and Dietetic, Faculty of Health Sciences, Kilis 7 Aralık University, Kilis, Turkey
*E-mail: [email protected]
ABSTRACT
In the recent century, consumers demand in the area of food products have changed significantly with
lifestyle modifications related to change in the eating habit. Based on the consumers' demand, the food
industry and scientists focus on low fat and calorie functional foods that prohibit nutrition related with
disease and develop mental well-being and physical. This study, therefore, is aimed at improvement a low
fat-high calorie functional cookie fortified with composite flour (chickpea 50%, whole grain wheat 25%
and oat 25%), butter, almond, dried mulberry, egg powder and whey powder. The statistical analyses were
carried out using response surface methodology (RSM). The nutritional (moisture, ash, fat, protein,
carbohydrate and energy content), physical (diameter and thickness measurement, spread ratio) and sensory
properties (color, appearance, taste-odor, texture, overall acceptability and affordability) of produced
cookies were evaluated. The results indicate that the protein content of cookies increased from 13 g/ 100g
to 24.38 g/ 100g with reduced-fat and calorie nearly 9 % in cookies. Cookie containing 15% butter and
15% composite flour has the highest score for overall acceptability and affordability among the cookie
samples. The research demonstrated that low fat-high protein cookies fortified by composite flour, highly
acceptable and nutrition composition can be produced.
Keywords: butter, high protein, low fat cookie, reduced calorie, response surface methodology
INTRODUCTION
Obesity and overweight have been increasing in many parts of the world (Tchang et al., 2021; Pinche et al.,
2018). These increases are related with many chronic diseases such as high blood pressure, type 2 diabetes,
cardiovascular disease (Seidu et al., 2021; Sun et al., 2018; Hu et al., 2016; Pergola and Silvestris., 2013).
Many studies present that rising obesity and overweight are associated with eating habits like increasing fat
and caloric intake (Neuhouser et al., 2012; Philipson et al., 2008; Cutler et al., 2003). Fat is a necessary
nutritious for humans and also one of the essential food substances. However, a high fat diet may cause an
increasing risk of many health problems (Pergola et al., 2013; Kafatos et al., 2000). In the recent century,
health and wellness are crucial factors so consumers are growing aware that food impacts health conditions
because of the consumption of high fat foods, adequate nutrition, sedentary lifestyle, increasing costs of
medicine (Aljunid and Syed, 2021). This increasing awareness of consumers leads to understand that their
food choices may have consequences for their health and are paying more attention to the health benefits of
food to maintain a healthy lifestyle. The convenience food consumed by the majority of consumers is high
fat intake and a lack of minerals, vitamins, dietary fiber and proteins. For these reasons, consumers tend to
consume low fat, reduced fat, fat free and functional foods during the last decade (Betoret et al., 2011;
Incles and Matt, 2011; Annunziata et al., 2011). One of the biggest challenges today is to improve cheap
foods which have a high nutritional value and mostly acceptable to mean customers (Pimentel et al., 2021).
Functional food promotes health benefits above normal nutrition. The functional food sector is one of the
fastest increasing markets of the food sector all over the world. This situation can lead to different areas of
International Conference on
RAW MATERIALS TO PROCESSED FOODS 03-04 June 2021, Turkey
326
science provides factories with opportunities to improve various new functional productions (Santos et al.,
2014).
Bakery productions are one of the excellent tools for fortification, value addition and feeding at a mass
scale. Currently, the fortification of cookies has evolved to develop its functional and nutritional properties
because of the healthy eating awareness of consumers (Awolu and Olugbenga, 2017; Iora et al., 2015).
Cookies are extensively consumed ready to eat and high fat bakery production due to the cheapness,
acceptable taste, availability, long shelf life and quick release of energy (Panghal et al., 2018). Fat is a basic
ingredient in cookies because it is responsible for flavour, mouthfeel, texture, nutritional and sensory
properties (Devi et al., 2016). However, cookies are low in, proteins, vitamins, minerals, fiber and rich in
undesirable fats, carbohydrates and calories. Therefore, it is necessary to improve low fat and high
nutritional value cookies. In the last decades, researchers and the food industry focus on the development of
the fortification of cookies. It was reported that extruded bean flour was used in cookies in order to reduce
fat, improve nutritional value and sensory properties in the final product (Moriano et al., 2019). Fortified
cookie by vitamins, prebiotic fibre and reducing fat was accepted by the consumers in terms of colour,
flavour and eating quality (Mudgil et al., 2017; Struck et al., 2016; Boobier et al., 2006). Moreover, cookies
can be readily fortified with legume flour in order to increase protein and fibre. The using of mixed flour in
cookies improvement to develop nutritional values has been reported by several studies (Bello et al., 2021;
Adegunwa et al., 2020; Eyenga et al., 2020; Vieira et al., 2020; Mas et al., 2020; Wirawan et al., 2020).
Oat recently is attracted by researchers because of a high amount of beta glucan content composites of
antioxidant activity and lipid fraction which has a significant impact on the nutritional and technological
quality (Wirawan et al., 2020; Wang et al., 2014; Wu et al., 2011; Gray et al., 2000). Oats have a good
source of beta glucan which reduce the risk of some disease like diabetes, hypertension, cardiovascular
diseases and obesity (Chen et al., 2021; Loskutov et al., 2021; Zurbau et al., 2021; Wolever et al., 2019;
Weickert et al., 2018; Mackie et al., 2016; Liu et al., 2014). Compare to other cereals, oats involve much
more fat which is rich in polyunsaturated fatty acids. Such fat is unstable, because of the rapid oxidation
process so oat productions for example, oat flakes and oat flour can be used in bakery productions like
cookies in order to improve shelf-life (Forsido et al., 2021; Sagar et al., 2021). The addition of oat flour in
the cookie can lead to improve protein quality, dietary fibre, shelf life and sensory properties in final
production (Sudha et al., 2007).
Chickpea which is characterised by the highest nutritional value among all legumes consists of 50%
carbohydrates, 17-20% protein, 5-6% of fat and 3-4% crude fiber (Alajaji et al., 2006). Moreover, chickpea
seed is a good source of carotenoids, folic acid, sterols, tocopherols, B-group vitamins, microelements;
magnesium, potassium, selenium, zinc, phosphorous. In addition, chickpea has great digestible protein, a
complex carbohydrate with a low glycemic index and dietary fiber which can protect against cardiovascular
disease. Using chickpea flour to making bakery products not only rising mineral and protein content but
also contributed to lower glycemic response in consumers (Faridy et al., 2020; Gon˜i et al., 2003). In recent
years, studies about the applications of chickpea in bakery productions have been increasing (Dhankhar et
al., 2021; Han et aş., 2021; Torra et al., 2021; Sibian et al., 2020; Benkadri et al., 2018; Mieszkowska et al.,
2016; Thongram et al., 2016).
Wheat (Triticum aestivum) is a nutritionally substantial cereal and staple food for humans all over the
world (Inyang et al., 2018; Akhtar et al., 2008). It is widely used in bakery productions such as pasta,
cookies, extruded snacks and crackers due to the valuable properties of the protein (gluten) that compound
elasticity and strength to get a desirable flavour and texture (Beta et al., 2020; Tropping and David, 2007;
Potter and Hotchkiss, 2006). Consumption of whole grain wheat productions is known to have beneficial
impacts on the human body related with their high substance of bioactive phytochemicals, minerals,
vitamins, protein and dietary fiber (Ktenioudaki et al., 2015). It is reported that the consumption of whole
International Conference on
RAW MATERIALS TO PROCESSED FOODS 03-04 June 2021, Turkey
327
grain wheat is positive effects on type 2 diabetes, cancer, obesity and cardiovascular disease (Aune et al.,
2016; Aune et al., 2013; Kumar et al., 2011). For this reason, whole grain wheat is attracted by customers
and the food industry in recent years (Chen et al., 2017; Singh et al., 2017). Using whole grain or refined
varieties can contribute significant nutritional and functional variation (Babiker et al., 2021; Sagar et al.,
2021; Bakke et al., 2014: Ndife et al., 2014; Bakke and Vickers, 2007). Keep in this view, the purpose of
this study to improve functional cookies that increased protein quality and quantity, soluble, insoluble
dietary fiber and reduced fat, and calorie intake by prepared composite flour: oat, chickpea and whole grain
wheat flour.
MATERIAL- METHOD
Materials
Pre-cooked chickpea flour, whole grain wheat flour, oat flour, corn starch, rice flour, butter, almond, dried
mulberry, egg powder, whey powder, salt, guar gum, sodium bicarbonate, and ammonium bicarbonate
were purchased commercially. All chemicals and reagents were analytical grades.
Method
Determination of the Suitable Mixture and Parameter Ranges for Cookie Production
It is planned to obtain a biscuit formulation with increased protein quality and quantity by preparing a
mixture consisting of pre-cooked chickpea flour, whole wheat flour, oat flour, corn starch and rice flour. As
a result of preliminary studies, the mixing ratio of chickpeas, whole wheat grain and oat flour (CWO) was
determined as 2:1:1. As a result of preliminary trials, CWO ratio was determined as 25-100 g / 100 g flour
and 10-25 g butter as independent variables. Corn starch: rice flour at the ratio of 1:1 was used in the
productions with a CWO mixture ratio of less than 100 g.
Experimental Design for Cookies Formulation
It is designed according to Response Surface Method, which is an experimental design method. For the
optimization of rich protein and low-fat cookies, experiments were conducted according to a central
composite design containing two independent variables which dictated 13 experimental runs. The
experiments at a central point for five in order to calculate to the repeatability of the method. Independent
variables used to determine optimum cookie formulations were CWO and butter content. The low and high
parameters were 25-100g for. CWO and 10-25g for butter. The level of different variables is shown in
Table 1.
Table 1: Experiment design of independent variables of cookie samples
Independent variables Code -1 0 +1
Butter content (g/100g flour) X1 10 17.50 25
CWO (g/100g flour) X2 25 62.50 100
Production X1 X2
1 -1.00 -1.00
2 1.00 1.00
3 -1.00 1.00
4 0.00 0.00
5 0.00 -1.00
6 0.00 0.00
7 0.00 0.00
International Conference on
RAW MATERIALS TO PROCESSED FOODS 03-04 June 2021, Turkey
328
8 -1.00 0.00
9 1.00 -1.00
10 0.00 0.00
11 0.00 0.00
12 0.00 1.00
13 1.00 0.00
Cookie Preparation
The production of cookies was carried out by making some modifications in the method specified in AACC
Method No: 10-54. Cookies were produced by adding rice flour and corn starch (1:1) in the ratio of 0%,
37.5% and 75% to the C:W:O flour mixture. First of all, mixing flours and all powder components were
made homogeneous by mixing in a mixer (Kitchenaid, U.S.) for 2 minutes. Then the specified amount of
butter was added and stripped every 30 seconds and mixed for 3 more minutes. After that, different
amounts of water were added according to the amount of butter and flour specified in the experimental
design and the kneading process was completed by mixing for 2 more minutes by stripping every 30
seconds. The obtained dough was rested for 20 minutes and then shaped into discs of approximately 50 mm
diameter and 5 mm thickness. The cookies were transferred to the oven (M4256, Simfer, Kayseri, Turkey)
and baked at 180°C for 20 minutes. After baking, the cookies were cooled at room temperature nearly 30
minutes and then necessary measurements were made, and the rest of the cookies were ground in a grinder
(Premier PRG 259, Istanbul Turkey) and stored in polyethylene containers for further analyses.
Proximate and Nutritional Composition
Crude protein, crude fat, total ash, moisture was determined by employing a standard method of analysis
AOAC, 1990. The total carbohydrate and energy content of cookies was calculated by using the following
equations (1) and (2) (Gibson, 1990):
Carbonhydrate % = 100 − (moisture% + %protein + % fat + %ash) (1)
𝐸𝑛𝑒𝑟𝑔𝑦 = 4 (% 𝑃𝑟𝑜𝑡𝑒𝑖𝑛 𝑐𝑜𝑛𝑡𝑒𝑛𝑡 𝑜𝑓 𝑐𝑜𝑜𝑘𝑖𝑒𝑠 + % 𝑐𝑎𝑟𝑏𝑜𝑛ℎ𝑦𝑑𝑟𝑎𝑡𝑒 𝑐𝑜𝑛𝑡𝑒𝑛𝑡 𝑜𝑓 𝑐𝑜𝑜𝑘𝑖𝑒𝑠)
+ (% 𝑓𝑎𝑡 𝑐𝑜𝑛𝑡𝑒𝑛𝑡 𝑜𝑓 𝑐𝑜𝑜𝑘𝑖𝑒𝑠) 𝑋 9
(2)
Physical Analyses
Diameter, Thickness and Spread ratio
The diameter (D) and thickness (T) values of the cookie samples were measured using a vernier caliper as
specified in AACC Standard Method No: 10-54 (AOAC, 1990). After the diameter (mm) and thickness
(mm) values of the biscuits are determined spread ratio. The spread ratio of the cookies was determined by
calculating the ratio of diameter to thickness for each sample.
Colour Analyses
Colour parameters of cookie samples were measured with a Hunterlab MiniScan EZ (Reston, Virginia,
USA), and the values were expressed based on the CIALAB measurement system. White and black
calibration tiles were used to standardize the device before analysis. In HunterLab colour scale, L*
(lightness factor 0=black, 100 white); a* (−a green, +a red); b* (-b blue, +b* yellow) values were recorded

International Conference on
RAW MATERIALS TO PROCESSED FOODS 03-04 June 2021, Turkey
329
at the daylight (D65/10°) setting.
Sensory Analyses
The sensory evaluation of the cookies was conducted using 10 trained panelists from Hatay Mustafa Kemal
University Food Engineering Department. Cookies were coded with three-digit numbers and positioned
randomly. The sensory evaluation sheet was provided to the panelist and was asked to assess the colour,
appearance, flavour, texture, overall acceptability and affordability according to their preferences on a 1-5
hedonic scale. According to the scale; 1: bad, 2: not enough, 3: acceptable, 4: good, 5: very good. All
sensory evaluations were conducted at room temperature and water was served to panelists for mouth
cleaning between the evaluations of the samples (Martinez‐Flores et al., 2005; Meilgaard et al., 1999).
Statistical Analyses
In determining the effects of independent variables on dependent variables, the Central Composite Design
of the Response Surface Method was used for variance analysis. As a result of the variance analysis,
significant differences between group means were determined using the SPSS package program. Chemical
and physical analyses were performed in triplicate and two replications for sensory evaluation.
RESULT AND DISCUSSION
Proximate and Nutritional Composition
The result of moisture, ash, fat, protein, carbohydrate and energy content of cookies are summarized in
Table 2.
Table 2: Nutritional properties of low-fat high protein cookies
Sample
Number
Moisture
(%)
Ash
(%)
Fat
(%)
Protein
(%)
Carbohydrate
(%)
Energy
(kcal/100g)
1 10,11±0,01a 2,50±0,00d 11,22±0,05a 13,93±0,08b 62,24±0,12g 406±0,22b
2 13,00±0,01i 2,94±0,00i 19,23±0,06i 24,17±0,50f 40,66±0,55a 432±0,27h
3 13,30±0,08j 3,07±0,02j 12,70±0,02c 24,38±0,68f 46,55±0,72c 398±0,30a
4 12,83±0,01h 2,59±0,00f 14,26±0,02d 18,40±0,15d 51,92±0,12e 410±0,05d
5 10,70±0,03c 2,26±0,00b 14,25±0,06d 15,01±0,55c 57,77±0,59f 419±0,37g
6 12,23±0,05e 2,55±0,00e 14,85±0,05e 18,35±0,07d 52,02±0,07e 415±0,46e
7 12,45±0,04f 2,68±0,01g 15,55±0,08f 18,28±0,54d 51,04±0,64d 417±0,27f
8 12,32±0,07e 2,56±0,02e 11,51±0,10b 15,60±0,11c 57,99±0,26f 398±0,29a
9 10,26±0,01b 2,18±0,00a 17,02±0,08g 13,00±0,50a 57,55±0,56f 435±0,39j
10 12,89±0,03h 2,43±0,01c 14,20±0,00d 18,09±0,47d 52,40±0,49e 410±0,09d
11 12,71±0,01g 2,43±0,00c 14,20±0,01d 18,60±0,26d 52,05±0,25e 410±0,01d
12 13,29±0,08j 2,79±0,01h 14,20±0,04d 24,27±0,04f 45,45±0,02b 407±0,50c
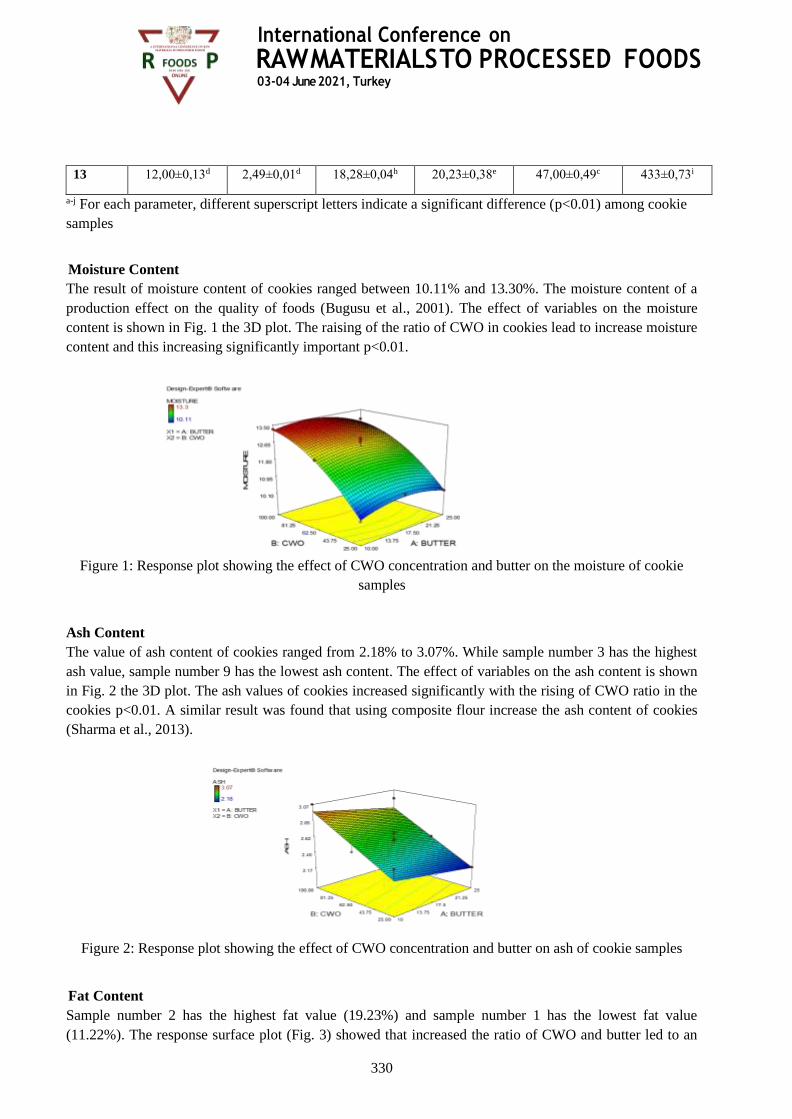
International Conference on
RAW MATERIALS TO PROCESSED FOODS 03-04 June 2021, Turkey
330
13 12,00±0,13d 2,49±0,01d 18,28±0,04h 20,23±0,38e 47,00±0,49c 433±0,73i
a-j For each parameter, different superscript letters indicate a significant difference (p<0.01) among cookie
samples
Moisture Content
The result of moisture content of cookies ranged between 10.11% and 13.30%. The moisture content of a
production effect on the quality of foods (Bugusu et al., 2001). The effect of variables on the moisture
content is shown in Fig. 1 the 3D plot. The raising of the ratio of CWO in cookies lead to increase moisture
content and this increasing significantly important p<0.01.
Figure 1: Response plot showing the effect of CWO concentration and butter on the moisture of cookie
samples
Ash Content
The value of ash content of cookies ranged from 2.18% to 3.07%. While sample number 3 has the highest
ash value, sample number 9 has the lowest ash content. The effect of variables on the ash content is shown
in Fig. 2 the 3D plot. The ash values of cookies increased significantly with the rising of CWO ratio in the
cookies p<0.01. A similar result was found that using composite flour increase the ash content of cookies
(Sharma et al., 2013).
Figure 2: Response plot showing the effect of CWO concentration and butter on ash of cookie samples
Fat Content
Sample number 2 has the highest fat value (19.23%) and sample number 1 has the lowest fat value
(11.22%). The response surface plot (Fig. 3) showed that increased the ratio of CWO and butter led to an
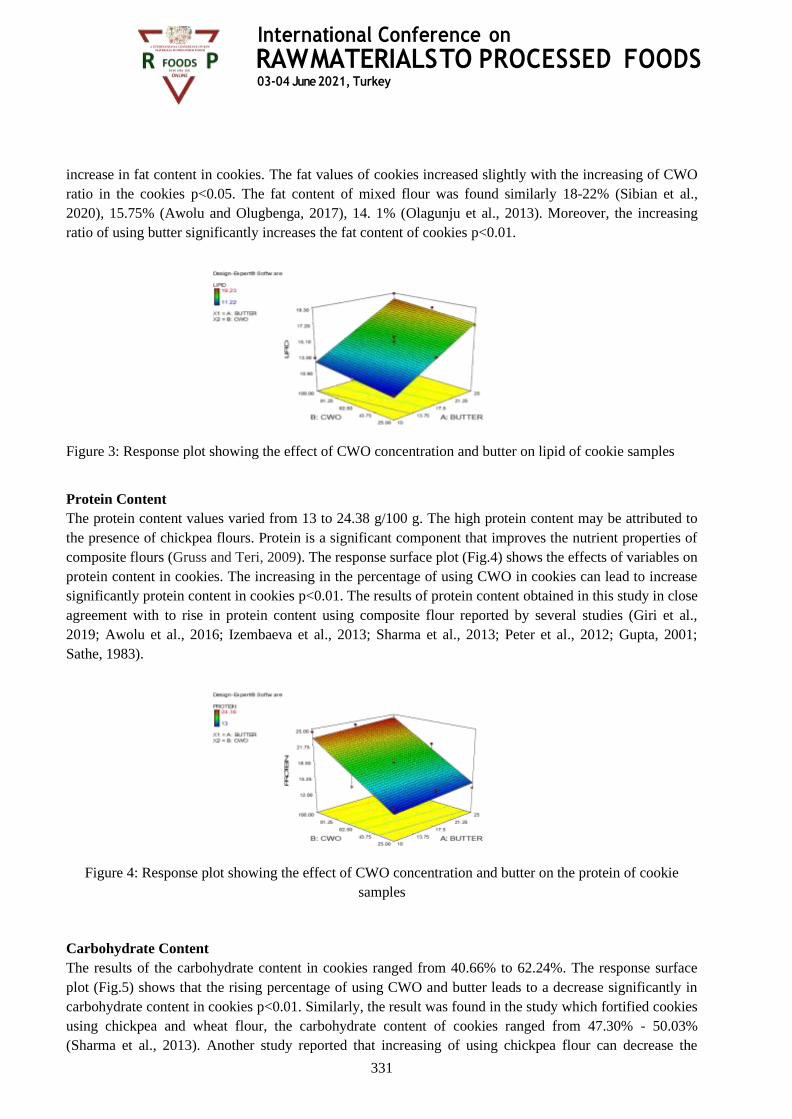
International Conference on
RAW MATERIALS TO PROCESSED FOODS 03-04 June 2021, Turkey
331
increase in fat content in cookies. The fat values of cookies increased slightly with the increasing of CWO
ratio in the cookies p<0.05. The fat content of mixed flour was found similarly 18-22% (Sibian et al.,
2020), 15.75% (Awolu and Olugbenga, 2017), 14. 1% (Olagunju et al., 2013). Moreover, the increasing
ratio of using butter significantly increases the fat content of cookies p<0.01.
Figure 3: Response plot showing the effect of CWO concentration and butter on lipid of cookie samples
Protein Content
The protein content values varied from 13 to 24.38 g/100 g. The high protein content may be attributed to
the presence of chickpea flours. Protein is a significant component that improves the nutrient properties of
composite flours (Gruss and Teri, 2009). The response surface plot (Fig.4) shows the effects of variables on
protein content in cookies. The increasing in the percentage of using CWO in cookies can lead to increase
significantly protein content in cookies p<0.01. The results of protein content obtained in this study in close
agreement with to rise in protein content using composite flour reported by several studies (Giri et al.,
2019; Awolu et al., 2016; Izembaeva et al., 2013; Sharma et al., 2013; Peter et al., 2012; Gupta, 2001;
Sathe, 1983).
Figure 4: Response plot showing the effect of CWO concentration and butter on the protein of cookie
samples
Carbohydrate Content
The results of the carbohydrate content in cookies ranged from 40.66% to 62.24%. The response surface
plot (Fig.5) shows that the rising percentage of using CWO and butter leads to a decrease significantly in
carbohydrate content in cookies p<0.01. Similarly, the result was found in the study which fortified cookies
using chickpea and wheat flour, the carbohydrate content of cookies ranged from 47.30% - 50.03%
(Sharma et al., 2013). Another study reported that increasing of using chickpea flour can decrease the

International Conference on
RAW MATERIALS TO PROCESSED FOODS 03-04 June 2021, Turkey
332
carbohydrate content (Torra et al., 2021). The comparable, outcome of the study which using wheat flour in
cookies shows that the content of carbohydrates was found 44- 46% (Giri et al., 2019).
Figure 5: Response plot showing the effect of CWO concentration and butter on the carbohydrate of cookie
samples
Energy Content
As it can be seen in Table 2 the energy content of cookies ranged between 398 and 435 kcal. As the percent
of CWO increases in cookies, there was a significant decrease in energy content p<0.05. However, the
raising of using butter ratio in cookies can lead to increase significantly energy content in cookies p<0.01.
The effects of the percentage of using CWO and butter on the energy content are shown in Fig. 6 the 3D
plot. This finding corresponded to previous studies which show using mixing flours leads to increase
energy content (Dhankhar et al., 2021; Kulthe et al., 2014; Sharma et al., 2013).
Figure 6: Response plot showing the effect of CWO and butter concentration on energy content of cookie
samples
Physical Analyses
The result of diameter, thickness, spread ratio, and colour of cookie samples are shown in Table 3. and
Table 4. respectively.
Table 3: Diameter, thickness and spread ratio values of low fat high protein cookie samples
Sample Number Diameter Thickness Spread Ratio
1 4,74±0,05 0,82±0,04h 5,78±0,33a
2 4,40±0,00 0,52±0,04a 8,46±0,66f
3 4,48±0,04 0,62±0,04b,c 7,23±0,54d,e
4 4,64±0,09 0,7±0,07d,e,f 6,63±0,62b,c,d
5 4,58±0,04 0,78±0,04g,h 5,87±0,30a

International Conference on
RAW MATERIALS TO PROCESSED FOODS 03-04 June 2021, Turkey
333
6 4,48±0,04 0,60±0,00b 7,47±0,07e
7 4,70±0,07 0,68±0,04c,d,e 6,91±0,51c,d,e
8 4,64±0,05 0,74±0,05e,f,g 6,27±0,45a,b,c
9 4,60±0,00 0,78±0,04g,h 5,90±0,37a
10 4,62±0,08 0,66±0,05b,c,d 7,00±0,59d,e
11 4,66±0,05 0,76±0,05f,g,h 6,13±0,51a,b
12 4,70±0,07 0,68±0,04c,d,e 6,91±0,59c,d,e
13 4,6±0,07 0,78±0,04g,h 5,90±0,45a
a-h For each parameter, different superscript letters indicate a significant difference (p<0.01) among cookie
samples
Table 4: L, a, b values of cookie samples.
Sample Number L value a value b value
1 57,83±0,06c 12,32±0,03j 28,03±0,08c,d
2 56,78±0,04b 12,72±0,01k 28,22±0,04e
3 56,67±0,02b 11,55±0,07i 26,68±0,03a
4 64,11±0,08j 9,15±0,00a 27,42±0,02b
5 65,07±0,03l 10,64±0,05d 29,95±0,06i
6 63,81±0,02i 9,80±0,01b 28,31±0,05e
7 62,52±0,01h 9,96±0,17c 28,55±0,10f
8 59,97±0,17d 10,75±0,01e 28,17±0,24d,e
9 64,93±0,05k 10,73±0,02d,e 30,85±0,06j
10 61,13±0,09f 11,03±0,01g 28,91±0,01g
11 60,95±0,04e 10,94±0,01f,g 29,06±0,04h
12 56,41±0,10a 10,92±0,02f 28,01±0,01c
13 62,01±0,04g 11,33±0,04h 30,04±0,07i
a-j For each parameter, different superscript letters indicate a significant difference (p<0.05) among cookie
samples
Diameter, Thickness and Spread Ratio
Diameter values of cookie samples ranged from 4.40 to 4.70. The effect of variables on the diameter
content is shown in Fig.7 in the 3D plot. It can be seen in Fig.7 that the diameters of cookie samples are not
affected significantly by the ratio of CWO and butter. The effects of the percentage of using CWO and
butter on the thickness are shown in Fig. 8 the 3D plot. While the percentage of CWO in cookie samples
affect significantly thickness of cookie samples, there is no relationship between the concentration of butter
in cookie samples and thickness. The value of thickness in cookie samples is decreasing from 0.82 to 0.52
with an increasing CWO percentage in cookie samples. As it can be seen in Fig. 8 the increasing in the
percentage of CWO in cookie samples can lead to a decrease significantly in the value of thickness p<0.05.
Spread ratio values of cookie samples ranged from 5.78 to 8.46. The response surface pilot Fig. 9 shows
that there is a significant effect of the percentage of using CWO on spread ratio in cookies. Nevertheless,
the percentage of using butter in cookies does not affect the spread ratio statistically. Spread factor results
showed that as the concentration of incorporated treatments of whole grain wheat increased, the spread

International Conference on
RAW MATERIALS TO PROCESSED FOODS 03-04 June 2021, Turkey
334
ratio increased significantly p<0.05. Higher protein content impacts negatively on the spread ratio in
cookies (Gaines et al., 1989). However, cookies developed by a high percentage of chickpea flour, despite
having high protein content demonstrated a higher spread ratio. This anomalous behaviour could be
attributed to the reduced viscosity of chickpea dough and it causes a higher spread ratio. A previous study
indicates a decrease in the viscosity of dough with the addition of chickpea flour (Barron et al., 1993). A
similar result found that lower is the viscosity of dough, faster is the spreading rate of cookies (Hoseney et
al., 1994).
Figure 7: Response plot showing the effect of CWO concentration and butter on the diameter of cookie
samples
Figure 8: Response plot showing the effect of CWO concentration and butter on the thickness of cookie
samples
Figure 9: Response plot showing the effect of CWO concentration and butter on spread ratio of cookie
samples
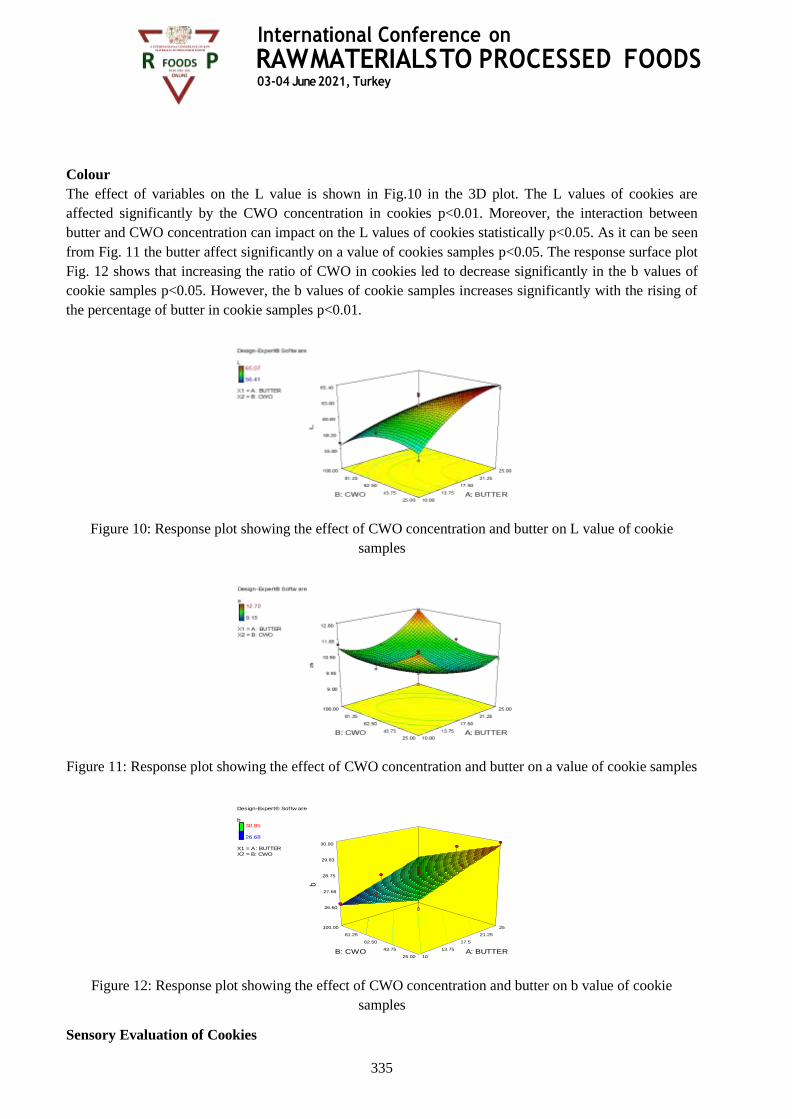
International Conference on
RAW MATERIALS TO PROCESSED FOODS 03-04 June 2021, Turkey
335
Colour
The effect of variables on the L value is shown in Fig.10 in the 3D plot. The L values of cookies are
affected significantly by the CWO concentration in cookies p<0.01. Moreover, the interaction between
butter and CWO concentration can impact on the L values of cookies statistically p<0.05. As it can be seen
from Fig. 11 the butter affect significantly on a value of cookies samples p<0.05. The response surface plot
Fig. 12 shows that increasing the ratio of CWO in cookies led to decrease significantly in the b values of
cookie samples p<0.05. However, the b values of cookie samples increases significantly with the rising of
the percentage of butter in cookie samples p<0.01.
Figure 10: Response plot showing the effect of CWO concentration and butter on L value of cookie
samples
Figure 11: Response plot showing the effect of CWO concentration and butter on a value of cookie samples
Figure 12: Response plot showing the effect of CWO concentration and butter on b value of cookie
samples
Sensory Evaluation of Cookies
Design-Expert® Softw are
b
30.85
26.68
X1 = A: BUTTER
X2 = B: CWO
10
13.75
17.5
21.25
25
25.00
43.75
62.50
81.25
100.00
26.60
27.68
28.75
29.83
30.90
b
A: BUTTER B: CWO
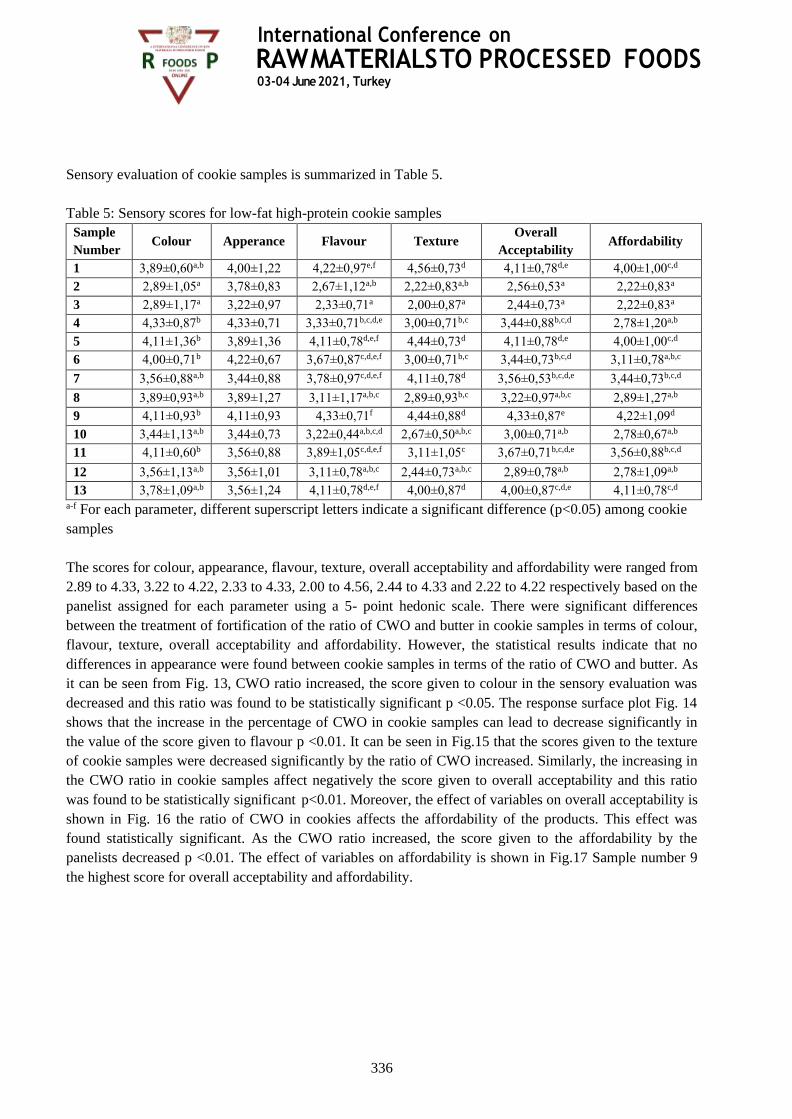
International Conference on
RAW MATERIALS TO PROCESSED FOODS 03-04 June 2021, Turkey
336
Sensory evaluation of cookie samples is summarized in Table 5.
Table 5: Sensory scores for low-fat high-protein cookie samples
Sample
Number Colour Apperance Flavour Texture
Overall
Acceptability Affordability
1 3,89±0,60a,b 4,00±1,22 4,22±0,97e,f 4,56±0,73d 4,11±0,78d,e 4,00±1,00c,d
2 2,89±1,05a 3,78±0,83 2,67±1,12a,b 2,22±0,83a,b 2,56±0,53a 2,22±0,83a
3 2,89±1,17a 3,22±0,97 2,33±0,71a 2,00±0,87a 2,44±0,73a 2,22±0,83a
4 4,33±0,87b 4,33±0,71 3,33±0,71b,c,d,e 3,00±0,71b,c 3,44±0,88b,c,d 2,78±1,20a,b
5 4,11±1,36b 3,89±1,36 4,11±0,78d,e,f 4,44±0,73d 4,11±0,78d,e 4,00±1,00c,d
6 4,00±0,71b 4,22±0,67 3,67±0,87c,d,e,f 3,00±0,71b,c 3,44±0,73b,c,d 3,11±0,78a,b,c
7 3,56±0,88a,b 3,44±0,88 3,78±0,97c,d,e,f 4,11±0,78d 3,56±0,53b,c,d,e 3,44±0,73b,c,d
8 3,89±0,93a,b 3,89±1,27 3,11±1,17a,b,c 2,89±0,93b,c 3,22±0,97a,b,c 2,89±1,27a,b
9 4,11±0,93b 4,11±0,93 4,33±0,71f 4,44±0,88d 4,33±0,87e 4,22±1,09d
10 3,44±1,13a,b 3,44±0,73 3,22±0,44a,b,c,d 2,67±0,50a,b,c 3,00±0,71a,b 2,78±0,67a,b
11 4,11±0,60b 3,56±0,88 3,89±1,05c,d,e,f 3,11±1,05c 3,67±0,71b,c,d,e 3,56±0,88b,c,d
12 3,56±1,13a,b 3,56±1,01 3,11±0,78a,b,c 2,44±0,73a,b,c 2,89±0,78a,b 2,78±1,09a,b
13 3,78±1,09a,b 3,56±1,24 4,11±0,78d,e,f 4,00±0,87d 4,00±0,87c,d,e 4,11±0,78c,d
a-f For each parameter, different superscript letters indicate a significant difference (p<0.05) among cookie
samples
The scores for colour, appearance, flavour, texture, overall acceptability and affordability were ranged from
2.89 to 4.33, 3.22 to 4.22, 2.33 to 4.33, 2.00 to 4.56, 2.44 to 4.33 and 2.22 to 4.22 respectively based on the
panelist assigned for each parameter using a 5- point hedonic scale. There were significant differences
between the treatment of fortification of the ratio of CWO and butter in cookie samples in terms of colour,
flavour, texture, overall acceptability and affordability. However, the statistical results indicate that no
differences in appearance were found between cookie samples in terms of the ratio of CWO and butter. As
it can be seen from Fig. 13, CWO ratio increased, the score given to colour in the sensory evaluation was
decreased and this ratio was found to be statistically significant p <0.05. The response surface plot Fig. 14
shows that the increase in the percentage of CWO in cookie samples can lead to decrease significantly in
the value of the score given to flavour p <0.01. It can be seen in Fig.15 that the scores given to the texture
of cookie samples were decreased significantly by the ratio of CWO increased. Similarly, the increasing in
the CWO ratio in cookie samples affect negatively the score given to overall acceptability and this ratio
was found to be statistically significant p<0.01. Moreover, the effect of variables on overall acceptability is
shown in Fig. 16 the ratio of CWO in cookies affects the affordability of the products. This effect was
found statistically significant. As the CWO ratio increased, the score given to the affordability by the
panelists decreased p <0.01. The effect of variables on affordability is shown in Fig.17 Sample number 9
the highest score for overall acceptability and affordability.
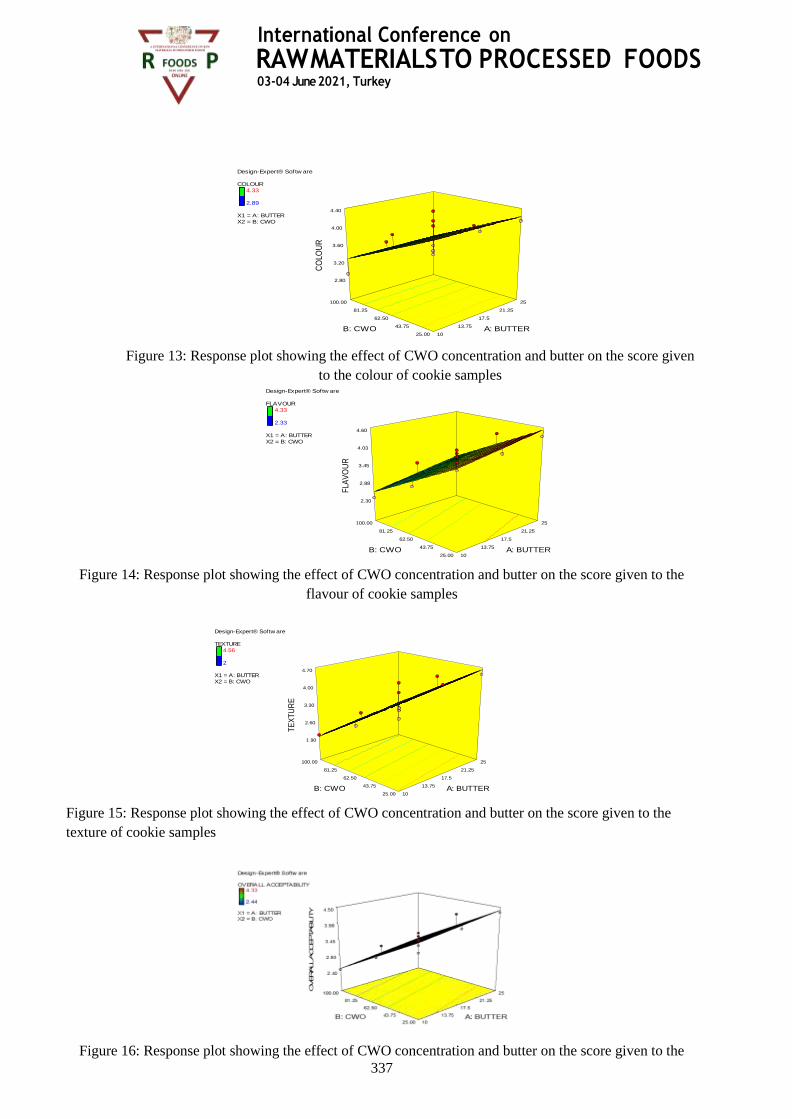
International Conference on
RAW MATERIALS TO PROCESSED FOODS 03-04 June 2021, Turkey
337
Figure 13: Response plot showing the effect of CWO concentration and butter on the score given
to the colour of cookie samples
Figure 14: Response plot showing the effect of CWO concentration and butter on the score given to the
flavour of cookie samples
Figure 15: Response plot showing the effect of CWO concentration and butter on the score given to the
texture of cookie samples
Figure 16: Response plot showing the effect of CWO concentration and butter on the score given to the
Design-Expert® Softw are
COLOUR
4.33
2.89
X1 = A: BUTTER
X2 = B: CWO
10
13.75
17.5
21.25
25
25.00
43.75
62.50
81.25
100.00
2.80
3.20
3.60
4.00
4.40
CO
LOU
R
A: BUTTER B: CWO
Design-Expert® Softw are
FLAVOUR
4.33
2.33
X1 = A: BUTTER
X2 = B: CWO
10
13.75
17.5
21.25
25
25.00
43.75
62.50
81.25
100.00
2.30
2.88
3.45
4.03
4.60
FLA
VO
UR
A: BUTTER B: CWO
Design-Expert® Softw are
TEXTURE
4.56
2
X1 = A: BUTTER
X2 = B: CWO
10
13.75
17.5
21.25
25
25.00
43.75
62.50
81.25
100.00
1.90
2.60
3.30
4.00
4.70
TE
XT
UR
E
A: BUTTER B: CWO

International Conference on
RAW MATERIALS TO PROCESSED FOODS 03-04 June 2021, Turkey
338
overall acceptability of cookie samples
Figure 17: Response plot showing the effect of CWO concentration and butter on the score given
to the affordability of cookie samples
CONCLUSION
It can be concluded from the above research that composite flour consisting of 32% chickpea, 16% whole
grain wheat, and 16% oat flours can be used successfully to replace 100% of the refined wheat flour in
order to formulate healthy low fat high protein cookies having the additional benefit of daily nutrition.
Thus from the results, it may be concluded that cookies high in proteins (nearly 100% increase) and low in
calories (nearly 9 % decrease) could be prepared with composite flour. Also from the physical analyses, it
may be concluded that cookies can be acceptable for sensory quality. The optimized cookie production
chosen by the software was 25% chickpea flour, 12.9 % whole grain wheat flour, 12.9% oat flour and 15%
butter that gives the value of protein %20. The formulated functional cookies had higher protein content
than cookies in the literature. The research demonstrated that highly acceptable reduced-calorie with high
protein cookies which are fortified by composite flour, almond, butter, dried mulberry highly acceptable
and nutrition composition, can be produced.
REFERENCES [1] Tchang, Beverly G., Katherine H. Saunders, and Leon I. Igel. (2021). "Best Practices in the
Management of Overweight and Obesity." Medical Clinics 105 (1), 149-174.
[2] Piche ME, Poirier P, Lemieux I, Despres JP. (2018). Overview of epidemiology and contribution of
obesity and body fat distribution to cardiovascular disease: an update. Prog Cardiovasc Dis. 61, 103–
13.
[3] Seidu, Samuel., (2021). "The impact of obesity on severe disease and mortality in people with SARS‐
CoV‐2: A systematic review and meta‐analysis." Endocrinology, diabetes & metabolism, 4. 1.
[4] Sun J, Zhou W, Gu T, Zhu D, Bi Y. (2018). A retrospective study on the association between obesity
and cardiovascular risk diseases with aging in Chinese adults. Sci Rep,8, 5806.
[5] Hu J, Yang S, Zhang A, Yang P, Cao X, Li X., (2016). Abdominal obesity is more closely associated
with diabetic kidney disease than general obesity. Diabetes Care, 39 (e)179–80.
[6] De Pergola G, Silvestris F. (2013). Obesity as a major risk factor for cancer. Journal of Obesity,
291546.
[7] Neuhouser, Marian L., (2012). "A low-glycemic load diet reduces serum C-reactive protein and
modestly increases adiponectin in overweight and obese adults." The Journal of Nutrition, 142 (2), 369-
374.
[8] Philipson, Tomas, and Richard Posner. (2008). Is the obesity epidemic a public health problem? A
decade of research on the economics of obesity. No. w14010. National Bureau of Economic Research.
International Conference on
RAW MATERIALS TO PROCESSED FOODS 03-04 June 2021, Turkey
339
[9] Cutler, David M., Edward L. Glaeser, and Jesse M. Shapiro. (2003). "Why have Americans become
more obese?" Journal of Economic perspectives, 17 (3), 93-118.
[10] De Pergola, Giovanni, and Franco Silvestris. (2013). "Obesity as a major risk factor for cancer."
Journal of Obesity.
[11] Kafatos, A. G., and C. A. Codrington (2000). "Eurodiet Core Report, Nutrition & Diet for Healthy
Lifestyles in Europe, Science & Policy Implications." Crete: University of Crete, School of Medicine
and European Commission DG Sanco.
[12] Aljunid, Syed Mohamed. (2021). "Obesity, a Costly Epidemic." Laparoscopic Sleeve Gastrectomy.
Springer, Cham,13-22.
[13] Betoret, E., (2011). "Functional foods development: Trends and technologies." Trends in Food
Science & Technology, 22 (9), 498-508.
[14] Incles, Matt. (2011). "Future directions for the global functional food market." Leatherhead Food
Research. United Kingdom.
[15] Annunziata, Azzurra, and Riccardo Vecchio. (2011). "Factors affecting Italian consumer attitudes
toward functional foods.".
[16] Pimentel, Tatiana Colombo., (2021). "Vegan probiotic products: A modern tendency or the newest
challenge in functional foods." Food Research International, 140, 110033.
[17] Santos, D. S. D., Storck, C. R., & Fogaça, A. O. (2014). Biscuit made with addition of lemon peel
flour. Disciplinarum Scientia – Revista Brasileira de Ciências e Saúde, 15, 123-135.
[18] Awolu, Olugbenga Olufemi. (2017). "Optimization of the functional characteristics, pasting and
rheological properties of pearl millet-based composite flour." Heliyon, 3, 2.
[19] Iora, S. R. F., Maciel, G. M., Zielinski, A. A. F., Silva, M. V., Pontes, P. V. A., Haminiuk, C. W. I.,
& Granato, D. (2015). Evaluation of the bioactive compounds and the antioxidant capacity of grape
pomace. International Journal of Food Science & Technology, 50(1), 62-69.
[20] Panghal, Anil, Navnidhi Chhikara, and B. S. Khatkar. (2018). "Effect of processing parameters and
principal ingredients on quality of sugar snap cookies: a response surface approach." Journal of Food
Science and Technology, 55 (8), 3127-3134.
[21] Devi, Amita, and B. S. Khatkar. (2016). "Physicochemical, rheological and functional properties of
fats and oils in relation to cookie quality: a review." Journal of Food Science and Technology, 53 (10),
3633-3641.
[22] Moriano, Maria Eletta., (2019). "Reduced-fat biscuits: Interplay among structure, nutritional
properties and sensory acceptability." LWT, 109, 467-474.
[23] Mudgil, Deepak, Sheweta Barak, and B. S. Khatkar. (2017). "Cookie texture, spread ratio and
sensory acceptability of cookies as a function of soluble dietary fiber, baking time and different water
levels." LWT, 80, 537-542
[24] Struck, S., Gundel, L., Zahn, S., & Rohm, H. (2016). Fiber enriched reduced sugar muffins made
from iso-viscous batters. LWT-Food Science and Technology, 65, 32-38.
[25] Boobier, W. J., J. S. Baker, and B. Davies. (2006). "Development of a healthy biscuit: an
alternative approach to biscuit manufacture." Nutrition Journal, 5 (1), 1-7.
[26] Bello, Florence Abolaji, Victoria Imaobong Bassey, and Margaret Odudu Edet. (2021).
"Optimization of Cassava, Mungbean and Coconut Pomace Flour Levels in the Production of Fiber-
Rich Cookies Using Response Surface Methodology." Journal of Culinary Science & Technology 1-20.
[27] Adegunwa, Mojisola Olanike., (2020). "Production and quality evaluation of cookies from
composite flour of unripe plantain (Musa paradisiaca), groundnut (Arachis hypogaea L.) and cinnamon
(Cinnamomum venum)." Journal of Culinary Science & Technology, 18 (5), 413-427.
[28] Eyenga, E. F., Tang, E. N., Achu, M. B. L., Boulanger, R., Mbacham, W. F., & Ndindeng, S. A.
(2020). Physical, nutritional, and sensory quality of rice‐based biscuits fortified with safou (Dacryodes
edulis) fruit powder. Food Science & Nutrition, 8 (7), 3413-3424.
[29] Vieira, Marta V., (2020). "3D printed functional cookies fortified with Arthrospira platensis:
Evaluation of its antioxidant potential and physical-chemical characterization." Food Hydrocolloids,
107, 105893.
International Conference on
RAW MATERIALS TO PROCESSED FOODS 03-04 June 2021, Turkey
340
[30] Mas, Agustín Lucini., (2020).et al. "Defatted chia flour as functional ingredient in sweet cookies.
How do Processing, simulated gastrointestinal digestion and colonic fermentation affect its antioxidant
properties?" Food Chemistry, 316, 126279.
[31] Wirawan, Elsa Uttamo, and See Wan Yan. (2020). "Consumers' perception and physicochemical
properties of novel functional cookie enriched with medicinal plant Strobilanthes crispus." British Food
Journal.
[32] Wang, Qi, and Peter R. Ellis. (2014). "Oat β-glucan: physico-chemical characteristics in relation to
its blood-glucose and cholesterol-lowering properties." British Journal of Nutrition, 112 (S2), S4-S13.
[33] Wu, Zhen., (2011). "Characterization and antioxidant activity of the complex of tea polyphenols
and oat β-glucan." Journal of Agricultural and Food Chemistry, 59 (19), 10737-10746.
[34] Gray, David A., (2000). "Enrichment of oat antioxidant activity by dry milling and sieving."
Journal of Cereal Science, 32 (1), 89-98.
[35] Chen, Oliver,, (2021). "The Role of Oat Nutrients in the Immune System: A Narrative Review."
Nutrients, 13 (4), 1048.
[36] Loskutov, Igor G., and Elena K. Khlestkina. (2021). "Wheat, Barley, and Oat Breeding for Health
Benefit Components in Grain." Plants, 10 (1), 86.
[37] Zurbau, Andreea., (2021). "The effect of oat β-glucan on postprandial blood glucose and insulin
responses: a systematic review and meta-analysis." European Journal of Clinical Nutrition, 1-15.
[38] Wolever, Thomas MS, et al. (2019). "Impact of oat processing on glycaemic and insulinaemic
responses in healthy humans: a randomised clinical trial."The British journal of Nutrition, 121 (11),
1264-1270.
[39] Weickert, M. O., & Pfeiffer, A. F. (2018). Impact of dietary fiber consumption on insulin resistance
and the prevention of type 2 diabetes. The Journal of nutrition, 148 (1), 7-12.
[40] Mackie A, Rigby N, Harvey P, Bajka B. (2016). Increasing dietary oat fiber decreases the
permeability of intestinal mucus. Jorunal of Functional Foods, 26, 418–27.
[41] Liu Y, Colditz GA, Cotterchio M, Boucher BA, Kreiger N. (2014). Adolescent dietary fiber,
vegetable fat, vegetable protein, and nut intakes and breast cancer risk. Breast Cancer Res Treat. 145,
461–70.
[42] Forsido, Sirawdink Fikreyesus., (2021). "Effects of storage temperature and packaging material on
physico-chemical, microbial and sensory properties and shelf life of extruded composite baby food
flour." Heliyon, 7 (4), e06821.
[43] Sagar, Narashans Alok, and Sunil Pareek. (2021). "Fortification of multigrain flour with onion skin
powder as a natural preservative: Effect on quality and shelf life of the bread." Food Bioscience, 41,
100992.
[44] M.L.Sudha,V.Baskaran,K.Leelavathi. (2007). Apple pomace as a source of dietary fiber and
polyphenols and its effect on the rheological characteristics and cake making Food Chemistry, 104 (2),
686-692.
[45] Alajaji, Saleh A., and Tarek A. El-Adawy. (2006). "Nutritional composition of chickpea (Cicer
arietinum L.) as affected by microwave cooking and other traditional cooking methods." Journal of
Food Composition and Analysis, 19 (8), 806-812.
[46] Faridy, Juárez-Chairez Milagros., (2020). "Biological activities of chickpea in human health (Cicer
arietinum L.). A review." Plant Foods for Human Nutrition, 75 (2), 142-153.
[47] Gon˜i, I. & Valentı´n-Gamazo, C. (2003). Chickpea flour ingredients slows glycemic response to
pasta in healthy volunteers. Food Chemistry, 81, 511–515.
[48] Dhankhar, Jyotika, Neha Vashistha, and Asha Sharma. (2021). "Development of biscuits by partial
substitution of refined wheat flour with chickpea flour and date powder." Journal of Microbiology,
Biotechnology and Food Sciences, 1093-1097.
[49] Han, Lihong., (2021). "Nutrient and specification enhancement of fortified Asian noodles by
chickpea flour substitution and transglutaminase treatment." International Journal of Food Properties,
24 (1), 174-191.
[50] Torra, Marta., (2021). "Chickpea and Chestnut Flours as Non-Gluten Alternatives in Cookies."
Foods, 10 (5), 911.
International Conference on
RAW MATERIALS TO PROCESSED FOODS 03-04 June 2021, Turkey
341
[51] Sibian, Mandeep Singh, and Charanjit Singh Riar. (2020). "Formulation and characterization of
cookies prepared from the composite flour of germinated kidney bean, chickpea, and wheat." Legume
Science, 2 (3), e42.
[52] Benkadri, Soulef., (2018). "Gluten-free biscuits based on composite rice–chickpea flour and
xanthan gum." Food Science and Technology International, 24 (7), 607-616.
[53] Mieszkowska, Arleta, and Agata Marzec. (2016). "Effect of polydextrose and inulin on texture and
consumer preference of short-dough biscuits with chickpea flour." LWT, 73, 60-66.
[54] Thongram, Sushma., (2016). "Physicochemical and organoleptic properties of cookies incorporated
with legume flours." Cogent Food & Agriculture, 2 (1), 1172389.
[55] Inyang, Ufot E., Etini A. Daniel, and Florence A. Bello. (2018). "Production and quality evaluation
of functional biscuits from whole wheat flour supplemented with acha (fonio) and kidney bean flours."
Asian Journal of Agriculture and Food Sciences, 6, 6.
[56] Akhtar S, Anjum F, Rehman S, Sheikh M and Farzena K. (2008). Effect of fortification on the
physico-chemical and microbiological stability of whole wheat flour. Food Chemistry, 112, 156-163.
[57] Beta, Trust., (2020). "Purple Wheat (Triticum sp.) Seeds: Phenolic Composition and Antioxidant
Properties." Nuts and Seeds in Health and Disease Prevention. Academic Press, 103-125.
[58] Topping, David. (2007). "Cereal complex carbohydrates and their contribution to human health."
Journal of Cereal Science ,46 (3), 220-229.
[59] Potter N, Hotchkiss J (2006). Food Science. 5th ed. CBS Publishers and Distributors. Daryangaji,
New Delhi, India
[60] Ktenioudaki, Anastasia, Laura Alvarez-Jubete, and Eimear Gallagher. (2015). "A review of the
process-induced changes in the phytochemical content of cereal grains: the breadmaking process."
Critical Reviews in Food Science and Nutrition, 55 (5), 611-619.
[61] Aune, Dagfinn., (2016). "Whole grain consumption and risk of cardiovascular disease, cancer, and
all cause and cause specific mortality: systematic review and dose-response meta-analysis of
prospective studies." Bmj, 353.
[62] Aune, Dagfinn., (2013). "Whole grain and refined grain consumption and the risk of type 2
diabetes: a systematic review and dose–response meta-analysis of cohort studies." European Journal of
Epidemiology, 28 (11), 845-858.
[63] Kumar, P., Yadava, R. K., Gollen, B., Kumar, S., Verma, R. and Yadar, S. (2011). Nutritional
contents and medicinal properties of wheat: A Review. Life Science and Medicine Research, 22, 1-10.
[64] Chen, Zhijie., (2017). "Comparison of phenolic profiles, antioxidant capacity and relevant enzyme
activity of different Chinese wheat varieties during germination." Food Bioscience, 20, 159-167.
[65] Singh, Arashdeep, and Savita Sharma. (2017). "Bioactive components and functional properties of
biologically activated cereal grains: a bibliographic review." Critical Reviews in Food Science and
Nutrition, 57 (14), 3051-3071.
[66] Babiker, Elfadıl E., (2021). "Bioactive compounds, nutritional and sensory properties of cookies
prepared with wheat and tigernut flour."Food Chemistry, 349, 129:155.
[67] Sagar, N. A., & Pareek, S. (2021). Fortification of multigrain flour with onion skin powder as a
natural preservative: Effect on quality and shelf life of the bread. Food Bioscience, 41, 100992.
[68] Bakke, A. and Vickers, Z. (2014). Consumer liking of refined and whole wheat breads. Journal of
Food Science and Technology, Vol. 72, S473-S480.
[69] Ndife, Joel, F. Kida, and S. Fagbemi. (2014). "Production and quality assessment of enriched
cookies from whole wheat and full fat soya." European Journal of Food Science and Technology, 2 (1),
19-28.
[70] Bakke A and Vickers Z. (2007). Consumer liking of refined and whole wheat breads. Journal of.
Food Science, 72, 473-480.
[71] AOAC Official Methods of Analysis of Association of Official Analytical Chemists, Washington,
DC, USA (1990)
[72] Gibson R.S. (1990). Principles of nutritional assessment. Oxford Press.
[73] AACC Approved Methods of American Association of Cereal Chemists International, St. Paul,
MN, USA (1990).

International Conference on
RAW MATERIALS TO PROCESSED FOODS 03-04 June 2021, Turkey
342
[74] Martinez‐Flores, H. E., (2005). "Sensorial and biological evaluation of an extruded product made
from corn supplemented with soybean and safflower pastes."International Journal of Food Science &
Technology, 40 (5), 517-524.
[75] Meilgaard MC, Civille GV, Carr BT. (1999). Sensory evaluation techniques. 3rd ed. Boca Raton,
FL: CRC Press.
[76] Bugusu, Betty A., Osvaldo Campanella, and Bruce R. Hamaker. (2001). "Improvement of
sorghum‐wheat composite dough rheological properties and breadmaking quality through zein
addition."Cereal Chemistry, 78 (1), 31-35.
[77] Sharma, Chanchal, Darshan Punia, and Neelam Khetarpaul. (2013). "Sensory characteristics,
proximate composition, dietary fibre content and storage stability of barley, wheat and chickpea
composite flour biscuits." British Food Journal.
[78] Sibian, Mandeep Singh, and Charanjit Singh Riar. (2020). "Formulation and characterization of
cookies prepared from the composite flour of germinated kidney bean, chickpea, and wheat." Legume
Science, 2 (3) e42.
[79] Olagunju, A. I., and B. O. T. Ifesan. (2013). "Nutritional composition and acceptability of cookies
made from wheat flour and germinated sesame (Sesamum indicum) flour blends."Current Journal of
Applied Science and Technology, 702-713.
[80] Gruss, Teri. (2009). "Ten reasons to use amaranth in your gluten-free recipes.".
[81] Giri, Namrata A., and B. K. Sakhale. (2019). "Development of sweet potato flour based high
protein and low calorie gluten free cookies."Current Research in Nutrition and Food Science Journal, 7
(2), 427-435.
[82] Awolu, Olugbenga Olufemi, Richard Onyemaechi Osemeke, and Beatrice O. Temilade Ifesan.
(2016). "Antioxidant, functional and rheological properties of optimized composite flour, consisting
wheat and amaranth seed, brewers’ spent grain and apple pomace."Journal of Food Science and
Technology, 53 (2), 1151-1163.
[83] Izembaeva, A. K., (2013). "The use of composite mixtures in the productions of biscuits."
Bulgarian Journal of Agriculture Science, 19, 28-31.
[84] Peter, Dayanand, Pagar Nitin Yashwant, and M. Revathy. (2012). "Studies on development of high
protein-low calorie cookies."International Journal of Current Research and Review, 4 (23), 84.
[85] Gupta, V. (2001). “Nutritional and sensory evaluation of value added bakery products”, MSc
thesis, CCSHAU, Hisar.
[86] Sathe, S. K. (1983). Functional properties of black gram (Phaseolus mungo L.) proteins. . LWT-
Food Science and Technology, 16, 69-72.
[87] Kulthe, Amit Arjun., (2014). "Development of high protein and low calorie cookies."Journal of
Food Science and Technology, 51 (1), 153-157.
[88] Gaines, C. S., Finney, P. L. (1989). Effects of selected commercial enzymes on cookie spread and
cookie dough consistency. Cereal Chemistry.
[89] Barron, Jesus M., and Armıda Espınoza. (1993)."Fortification of maize tortilla with alkali‐treated
chickpea flour."International Journal of Food Science & Technology, 28 (5), 505-511.
[90] Hoseney, R. C., Rogers, D. E. (1994). Mechanism of sugar functionality in cookies. The science of
cookie and cracker production, 1, 203-225.

International Conference on
RAW MATERIALS TO PROCESSED FOODS 03-04 June 2021, Turkey
343
Optimization of Gluten Free Cookies Produced with Nutritious Ingredients:
Evaluating a New Food Product
Emir Ayşe Özer
Hatay Mustafa Kemal University, Agriculture Faculty, Department of Food Engineering, Hatay, Turkey
*E-mail: [email protected]
ABSTRACT
Especially; in order to reduce the risk of many diseases like diabetes mellitus, hypertension, celiac,
cardiovascular disease, hypertension, the need for new bakery products with low sugar and increased
protein amount is increasing day by day. Nutritionally balanced gluten-free cookies were prepared from
composite flour (chickpea, buckwheat, corn, almond milk waste flour) with high protein and low sugar
were developed using the central composite design of the response surface. ANOVA of models showed
that the moisture, ash, protein, fat, carbohydrate, L*, a*, b*, hardness, overall acceptability were significant
(P<0.01); and energy, diameter, thickness, spread ratio and mouthful were significant (p<05). The result of
the study determined the optimization of gluten free cookies with protein content and spread ratio, overall
acceptability maximum are 66 g composite flour, 20 g powder sugar, 15 g protein and 7.70 spread ratio.
Keywords: nutritional composition, low sugar, gluten free cookie, response surface methodology
INTRODUCTION
Biscuits are an easy-to-carry snack product, inexpensive, ready to eat, with a long shelf life consumed by
all age groups. Biscuits are generally formulated from flour, oil and sugar. The percentage of sugar is
approximately between 30 and 40% (Nagi et al., 2012, Van der Sman et al., 2019) Sucrose is used because
of its significant effect on the formation of a dough, structure and texture as well as on the quality of the
final product (Devi et al., 2016, Zoulias et al., 2002, Laguna et al., 2013). However, it is well known that
high sugar intake is related with a several of health issues such as diabetes mellitus, obesity, tooth decay,
cardiovascular disease(Yin et al., 2021, Milner et al., 2020). Recently, consumers' demand for healthier
products with increasing nutritional awareness; the interest in low-sugar bakery products is increasing
significantly. This situation leads the food industry to develop new products with high nutritional value
(high protein and dietary fibre, low fat, sugar and salt, etc.) or to reformulate existing products.
Celiac disease (CD) is a chronic systemic autoimmune disorder where the body cannot handle the effect of
gluten. If left untreated CD can lead to serious complications, such as intestinal cancers, osteoporosis,
anaemia and infertility (Elli et al., 2019, Dimidi et al., 2021, Grogan et al., 2021). Celiac patients have
several nutritional deficiencies like protein, mineral (iron, calcium and magnesium), vitamins, minerals and
dietary fibre. The only treatments that lifelong gluten-free diet eliminates these deficiencies (Hallert et al,,
2002, Barton et al., 2007, Kinsey et al., 2008, Saturni et al., 2010).
In recent years, healthy eating-conscious celiac patients prefer gluten-free grain-based foods more due to
the raising symptoms and of gluten intolerance like weight fluctuation, fatigue, bone and joint pain,
bloating (Houben et al., 2012, Zaharkova et al., 2019, Hu et al., 2020). Moreover, people who have not
been diagnosed with celiac disease and gluten sensitivity continue to adopt this diet as lifestyle choice.
(Stantiall and Serventi, 2017, Arslain et al., 2021). Gluten-free (GF) products have a very poor nutritional
profile, as they are mostly made from refined flours, sugar, fat and starches (usually rice flour and corn or
potato starch) (Šarić et al., 2019). The use of legumes, pseudo cereals, cereals and nuts may improve the

International Conference on
RAW MATERIALS TO PROCESSED FOODS 03-04 June 2021, Turkey
344
nutritional quality of gluten-free baked goods (Ibanoglu et al., 2006). Currently, the production amount and
variety of gluten-free food products has been gradually increased. Pseudo grains (Gallagher, 2004, Lee et
al, 2009), nuts, legumes, dried fruits and vegetables were included to improve the nutritional value of GF
breads, cookies, pastas, snack cereals, crackers (Ibanoglu et al., 2006, Dimidi et al., 2021, Mosca and
Pellegrini 2021, Hu et al., 2020). For instance, functional cookie was developed with enhancing flavonoids,
protein, dietary fibre, antioxidants, polyunsaturated fatty acids, minerals, phenolic, with highly acceptable
(Goyat et al., 2018). Addition, the study conducted by Sionons and Holl (2018) showed that biscuits are
produced by pinto beans and tiger nut flour 40% were acceptable sensory properties at the same value as
cookies produced by pre-treated pinto beans. Valitutti et al., (2017) indicated that CD patients mostly prefer
biscuits and crackers among the bakery products.
For these reasons, the nutritional content of GF cookies needs to be balanced and made more nutritious
especially for celiac patients and gluten intolerance people. In the light of this information, the aim of this
study is to develop reduced sugar, high nutritional value cookie with acceptable sensory and texture
attributes from composite flour which consist of chickpea, buckwheat, corn, and almond milk waste flour.
MATERIAL AND METHODS
Materials
Buckwheat flour, corn flour, chickpea flour, almond milk waste flour, rice flour, flax seed, powdered sugar,
butter, egg powder, instant skim milk powder, salt, guar gum, sodium bicarbonate, and ammonium
bicarbonate were commercially purchased. All chemicals and reagents were analytical grade.
Methods
Experimental design, modelling and optimization
Response surface methodology was used to determine the impacts of two independent variables, composite
flour (A) and powdered sugar (B) on nutritional colour, physical properties composition, and sensory
attributes (dependent variables) of GF cookies. Range of upper and lower values of independent variables
were 25-75 g/100 g and 20-40 g respectively was used in order to optimize and evaluate the impact of
independent variables on the depend variables a central composite design (CCD) (Table 1). The
relationship between the independent variables were analysed by fitting a proper model, a second order
polynomial model.
𝑌 = 𝛽0 + ∑ 𝛽𝑖𝑋𝑖
𝑛
𝑖=1
+ ∑ 𝛽𝑖𝑖𝑋𝑖2
𝑛
𝑖=1
+ ∑ 𝛽𝑖𝑗𝑋𝑖𝑋𝑖𝑗
𝑛
𝑖≠𝑗=1
+ 𝑒
That Y is the depend variables, b0 is the centre point of the model (0,0), bi is the regression coefficent, bii is
the quadratic cofficent, bij is the the value of interaction of independent variables, Xi Xi and Xj are the
independent variables of model.
Variance and regression analyses of the design were performed by Design Expert 7.0 software
(Stat-Ease Inc., USA). Numerical optimization was used by the maximum values of protein content, spread
ratio and overall acceptability in order to optimum values of independent variables (Myers and
Montgomery, 2002).
Table 1. Experimental design of independent variables for gluten free cookies
Independent variables
Run number Composite flour Powdered sugar (g/100 g)
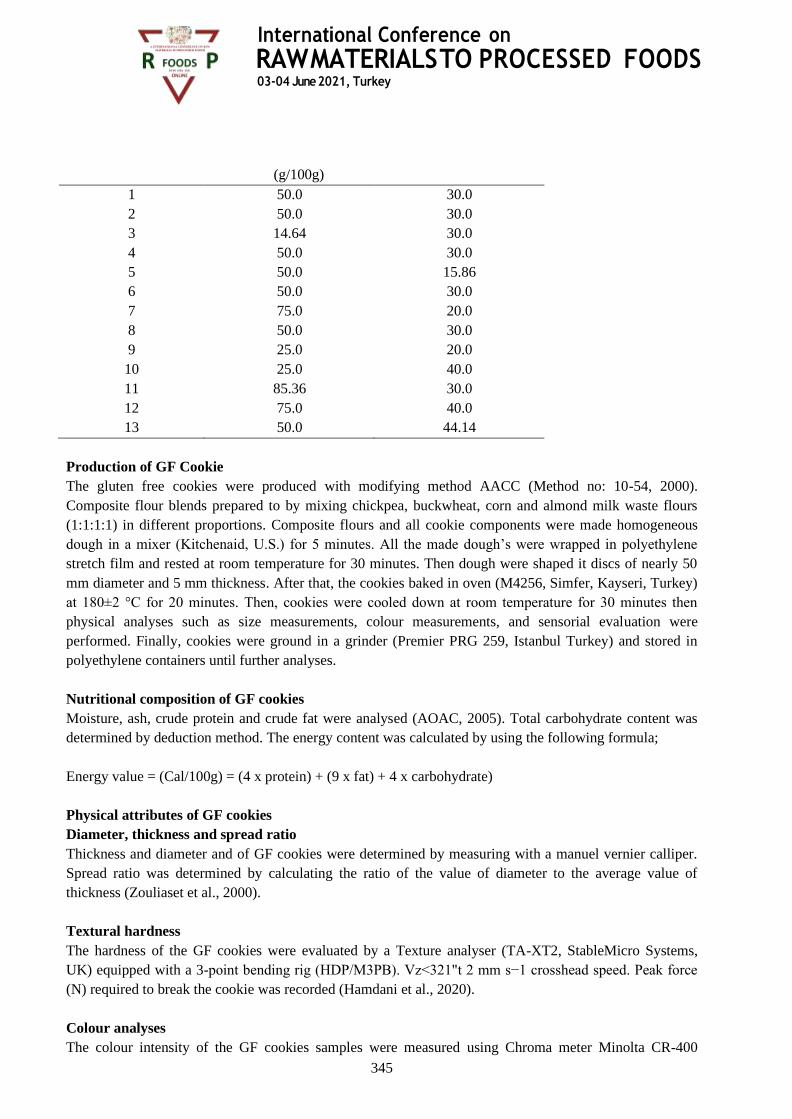
International Conference on
RAW MATERIALS TO PROCESSED FOODS 03-04 June 2021, Turkey
345
(g/100g)
1 50.0 30.0
2 50.0 30.0
3 14.64 30.0
4 50.0 30.0
5 50.0 15.86
6 50.0 30.0
7 75.0 20.0
8 50.0 30.0
9 25.0 20.0
10 25.0 40.0
11 85.36 30.0
12 75.0 40.0
13 50.0 44.14
Production of GF Cookie
The gluten free cookies were produced with modifying method AACC (Method no: 10-54, 2000).
Composite flour blends prepared to by mixing chickpea, buckwheat, corn and almond milk waste flours
(1:1:1:1) in different proportions. Composite flours and all cookie components were made homogeneous
dough in a mixer (Kitchenaid, U.S.) for 5 minutes. All the made dough’s were wrapped in polyethylene
stretch film and rested at room temperature for 30 minutes. Then dough were shaped it discs of nearly 50
mm diameter and 5 mm thickness. After that, the cookies baked in oven (M4256, Simfer, Kayseri, Turkey)
at 180±2 °C for 20 minutes. Then, cookies were cooled down at room temperature for 30 minutes then
physical analyses such as size measurements, colour measurements, and sensorial evaluation were
performed. Finally, cookies were ground in a grinder (Premier PRG 259, Istanbul Turkey) and stored in
polyethylene containers until further analyses.
Nutritional composition of GF cookies
Moisture, ash, crude protein and crude fat were analysed (AOAC, 2005). Total carbohydrate content was
determined by deduction method. The energy content was calculated by using the following formula;
Energy value = (Cal/100g) = (4 x protein) + (9 x fat) + 4 x carbohydrate)
Physical attributes of GF cookies
Diameter, thickness and spread ratio
Thickness and diameter and of GF cookies were determined by measuring with a manuel vernier calliper.
Spread ratio was determined by calculating the ratio of the value of diameter to the average value of
thickness (Zouliaset et al., 2000).
Textural hardness
The hardness of the GF cookies were evaluated by a Texture analyser (TA-XT2, StableMicro Systems,
UK) equipped with a 3-point bending rig (HDP/M3PB). Vz<321"t 2 mm s−1 crosshead speed. Peak force
(N) required to break the cookie was recorded (Hamdani et al., 2020).
Colour analyses
The colour intensity of the GF cookies samples were measured using Chroma meter Minolta CR-400

International Conference on
RAW MATERIALS TO PROCESSED FOODS 03-04 June 2021, Turkey
346
(Konica Minolta Co., Osaka, Japan). The instrument was calibrated using a standard light white calibration
tile before analysis. The L* (lightness), a* (redness-greenness) and b* (yellowness-blueness) values were
recorded at the daylight separately (Olawoye and Gbadamosi, 2020).
Sensory evaluation
Sensory evaluation of GF cookies samples on 5-point hedonic scale (5- liked extremely and 1- disliked
extremely) conducted by ten trained panellists (both male and female) from Hatay Mustafa Kemal
University Food Engineering and Agriculture Engineering Department (Hejrani et al., 2017).
RESULT AND DISCASSION
Nutritional composition of GF cookies
The result of the nutrient composition of GF cookies are shown in Table 2 and it was found that moisture
(3.34 to 4.97%), ash (1.60 to 2.44%), protein (11.68 to 15.96%), fat (21.46 to 23.19%), carbohydrate (52.84
to 63.12%), and energy value (478 to 491Cal/100 g). The moisture, ash, protein and fat content of GF
cookies were found significantly increased with the increase in however, carbohydrate, and calorie content
found decreased. The protein amount of gluten-free cookies increased linearly with the raising in amount of
composite flour in the cookies and this increase was found to be statistically significant (p<0.01). One of
the aims of this study was to increase the amount of protein. The amount of protein varies between 10.46
and 16.96. This value is considerably higher than the protein amount of GF cookies which are
commercially sales on market. The implication of these results is that the composite flour consisting were
good sources of protein. Similar result was found by Giri and Sakhale (2021) increase in the level of
incorporation of orange fleshed sweet potato flour in GF cookies lead to increase significantly crude fibre,
moisture, ash, carbohydrate content of cookies samples however, protein, fat, and carbohydrate content
decreased.
Table 2. Nutritional properties of GF cookies
Sample
Number
Moisture
(%)
Ash
(%)
Protein
(%)
Fat
(%)
Carbohydrate
(%)
Energy
(kcal/100g)
1 4.43±0,10 2.09±0,08 13,53±0,20 22,27±0,10 57,68±0,20 485
2 3.95±0,11 2.11±0,08 13,81±0,09 22,49±0,50 57,64±0,40 488
3 3,36±0,10 1,60±0,12 10,46±0,12 21,46±0,25 63,12±0,20 487
4 4,18±0,01 2,15±0,05 13,82±0,12 22,35±0,21 57,50±0,25 486
5 4,79±0,04 2,00±0,03 13,84±0,08 22,41±0,34 55,96±0,40 484
6 3,92±0,09 2,00±0,04 13,83±0,54 22,65±0,10 57,60±0,20 490
7 4,69±0,05 2,36±0,02 15,25±0,11 23,19±0,40 54,51±0,40 478
8 4,62±0,10 1,96±0,07 13,50±0,14 22,34±0,25 57,58±0,25 485
9 3,56±0,01 1,82±0,06 11,83±0,10 22,22±0,46 60,57±0,55 490
10 3,45±0,04 1,84±0,01 11,68±0,09 22,25±0,50 60,78±0,25 490
11 4,97±0,06 2,44±0,08 15,96±0,10 22,79±0,25 52,84±0,25 489
12 4,21±0,11 2,31±0,11 15,37±0,05 23,19±0,05 54,92±0,10 490
13 3,34±0,18 2,11±0,16 13,90±0,05 22,52±0,54 58,13±0,50 491
The fitted regression model developed for moisture, ash, protein, fat, carbohydrate and energy are given in
Table 3. Fit summary statistics suggested lineer model for moisture, ash, protein, carbohydrate and energy;
and suggested quadratic model for fat were generated in the regression model are present. The models for
moisture, ash, protein, fat, carbohydrate (P<0.01) and energy (P<0.05) were all significant, and their

International Conference on
RAW MATERIALS TO PROCESSED FOODS 03-04 June 2021, Turkey
347
correlation coefficients were all higher than 0.80. Therefore, the proposed model is accurate for predicting
changes in these responses with the experimental domain.
Table 3. Analysis of predicted model equation for the nutritional composition of GF cookies
Parameters Model Model
R2
F
Value
value
Prob > F
Final equation in terms of coded
factors
Moisture lineer 0.8859 18.35 0.0500 Moisture = +4.11+0.52*A-0.33*B
Ash lineer 0.8043 11.38 0.0500 Thickness =+0.62+6.066E-004*
A+0.050* B
Protein lineer 0.8858 7.07 0.0500 Spread Ratio =+7.20+0.095 *A-0.46 *
B
Fat Quadratic 0.9969 44.94 0.0500 Hardnes =+19.95+5.15* A+0.49* B-
0.14*
A * B-1.07A2+0.046* B2
Carbohydrate lineer 0.9719 17.32 0.0500 Carbohydrate =+57.60-3.31 *A+0.46 *
B
Energy lineer 0.8838 6.49 0.0500 Energy =+7.20+0.095 *A-0.46 * B
Physical and textural properties of GF Cookies
The diameter, thickness, and spread ratio of the GF cookies samples are shown in Table 4. The diameter
and thickness of the GF cookie samples ranged from 4.36-4.59 mm to 0.53–0.70 mm, respectively. The
fitted regression equations diameter, thickness, are presented Table 5. As the amount of powder sugar on
the diameter and thickness were found statistically significant (p <0.01). The response surfaces of the
effects of composite flour and powder sugar on diameter, thickness, spread ratio, hardness of cookies is
presented in Figure 1. It shows the effects of composite flour and powder sugar were positively related to
the diameter, spread ratio and hardness of GF cookies. As the amount of powder sugar increased, the
diameter and thickness were increased. The result indicates that the powdered sugar had a significant
impact on the thickness, diameter of the GF cookie. One of the important quality characteristic is spread
ratio for cookies. It is known that one of the desirable quality parameters is high spread ratio (Bolarinwa et
al., 2019). The spread ratio of the cookie ranged from 6.56 to 8.31. The fitted regression equations for
spread ratio is presented in Table 5. Fit summary statistics suggested lineer model for spread ratio. The
effect of the amount of sugar on the spreading rate was found to be significant (P <0.01). As the amount of
sugar increased, the spreading rate decreased. A study indicates that produced cookies with reduced fat and
sugar content may not shrink and flow (Manley, 2011). Similar result was found that developed gluten free
cookies with rice flour (Ogunbusola et al., 2020). The regression equation for spread ratio is presented in
Table.5 in terms of coded levels that A, and B represent composite flour and powdered sugar, respectively.
Hardness is one of the important quality parameters of cookies. Hardness of cookies ranged between 11.18
and 29.64 N (Table 4). The fitted regression model for hardness of GF cookies is shown in Table 5. Fit
summary statistics suggested quadratic model for hardness; were generated in the regression model. The
amount of composite flour and powder sugar increased, the hardness of the cookies increased and it was
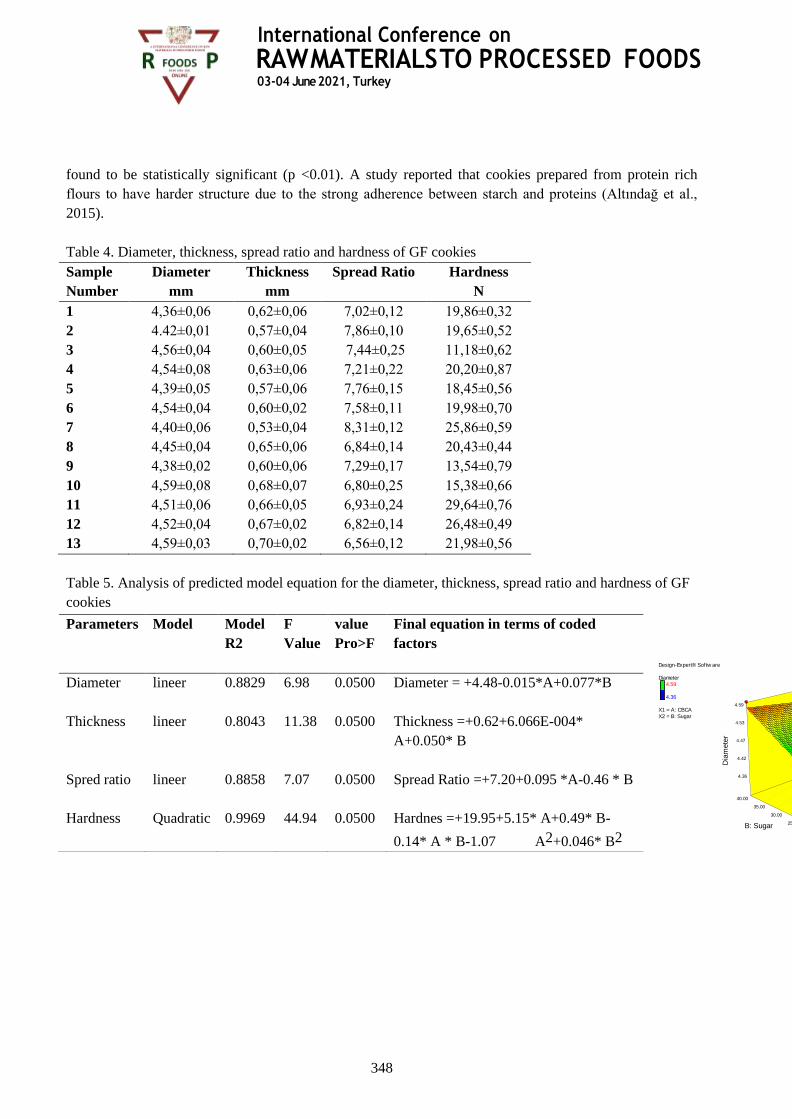
International Conference on
RAW MATERIALS TO PROCESSED FOODS 03-04 June 2021, Turkey
348
found to be statistically significant (p <0.01). A study reported that cookies prepared from protein rich
flours to have harder structure due to the strong adherence between starch and proteins (Altındağ et al.,
2015).
Table 4. Diameter, thickness, spread ratio and hardness of GF cookies
Sample
Number
Diameter
mm
Thickness
mm
Spread Ratio Hardness
N
1 4,36±0,06 0,62±0,06 7,02±0,12 19,86±0,32
2 4.42±0,01 0,57±0,04 7,86±0,10 19,65±0,52
3 4,56±0,04 0,60±0,05 7,44±0,25 11,18±0,62
4 4,54±0,08 0,63±0,06 7,21±0,22 20,20±0,87
5 4,39±0,05 0,57±0,06 7,76±0,15 18,45±0,56
6 4,54±0,04 0,60±0,02 7,58±0,11 19,98±0,70
7 4,40±0,06 0,53±0,04 8,31±0,12 25,86±0,59
8 4,45±0,04 0,65±0,06 6,84±0,14 20,43±0,44
9 4,38±0,02 0,60±0,06 7,29±0,17 13,54±0,79
10 4,59±0,08 0,68±0,07 6,80±0,25 15,38±0,66
11 4,51±0,06 0,66±0,05 6,93±0,24 29,64±0,76
12 4,52±0,04 0,67±0,02 6,82±0,14 26,48±0,49
13 4,59±0,03 0,70±0,02 6,56±0,12 21,98±0,56
Table 5. Analysis of predicted model equation for the diameter, thickness, spread ratio and hardness of GF
cookies
Design-Expert® Softw are
Diameter
4.59
4.36
X1 = A: CBCA
X2 = B: Sugar
25
37.5
50
62.5
75
20.00
25.00
30.00
35.00
40.00
4.36
4.42
4.47
4.53
4.59
D
iam
ete
r
A: CBCA B: Sugar
Parameters Model Model
R2
F
Value
value
Pro>F
Final equation in terms of coded
factors
Diameter lineer 0.8829 6.98 0.0500 Diameter = +4.48-0.015*A+0.077*B
Thickness lineer 0.8043 11.38 0.0500 Thickness =+0.62+6.066E-004*
A+0.050* B
Spred ratio lineer 0.8858 7.07 0.0500 Spread Ratio =+7.20+0.095 *A-0.46 * B
Hardness Quadratic 0.9969 44.94 0.0500 Hardnes =+19.95+5.15* A+0.49* B-
0.14* A * B-1.07 A2+0.046* B2

International Conference on
RAW MATERIALS TO PROCESSED FOODS 03-04 June 2021, Turkey
349
Figure 1. Response surfaces for the impact of composite flour and powder sugar on diameter, thickness,
spread ratio and hardness of GF cookies
Colour is one of the crucial quality parameter that effect directly on acceptability by consumer. As seen in
Table 6 the L*, a* and b* values of GF cookies were found to be 38.27 to 73.20, 4.87 to 15.40, 16.56 to
29.06, respectively. The fitted regression equations for L*, a* and b* are presented Table 7.
As the amount of composite flour and sugar amount increased, the colour darkness of GF cookies
increased. (Table 7). Colour characteristics reflect starch dextrination, caramelization, and Maillard
reaction induced by cooking the product (Chung et al., 2014, Giuberti et al., 2018). (Figure 2). Increased
levels of composite flour proportion lead to decreased the lightness (L*), probably because of maillard
reaction and raising protein content (Gomez et al., 2003). a* value increased with increase composite flour
and powder sugar. b* value increased with degreased composite flour and increased powder sugar.
Similar results were found that using mixing flour in GF cookies lead to differences significantly in a* and
b* values (Bolarinwa et al., 2018).
Table 6. Colour characteristics of GF cookies
Sample Number L* a* b*
1 57,33±0,18 11,02±0,04 23,25±0,11
2 56,65±0,06 10,98±0,01 22,27±0,06
3 73,20±0,03 4,87±0,09 16,56±0,04
Design-Expert® Softw are
Thickness
0.7
0.53
X1 = A: CBCA
X2 = B: Sugar
25
37.5
50
62.5
75
20.00
25.00
30.00
35.00
40.00
0.53
0.57
0.61
0.66
0.70
T
hic
kness
A: CBCA B: Sugar
Design-Expert® Softw are
Hardness
25.24
10.28
X1 = A: CBCA
X2 = B: Sugar
25.00
37.50
50.00
62.50
75.00
20.00
25.00
30.00
35.00
40.00
10.00
14.00
18.00
22.00
26.00
H
ard
ness
A: CBCA B: Sugar
Design-Expert® Softw are
Spread Ratio
8.3
6.56
X1 = A: CBCA
X2 = B: Sugar
25
37.5
50
62.5
75
20.00
25.00
30.00
35.00
40.00
6.50
6.95
7.40
7.85
8.30
S
pre
ad R
atio
A: CBCA B: Sugar
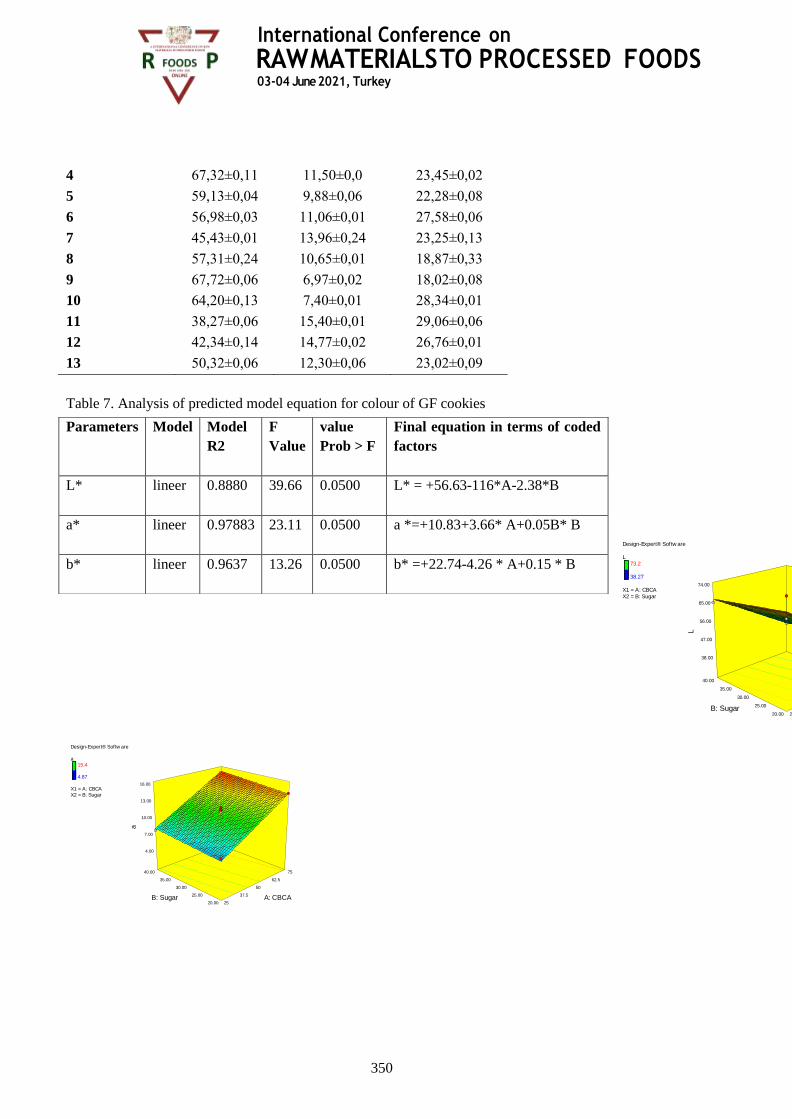
International Conference on
RAW MATERIALS TO PROCESSED FOODS 03-04 June 2021, Turkey
350
4 67,32±0,11 11,50±0,0 23,45±0,02
5 59,13±0,04 9,88±0,06 22,28±0,08
6 56,98±0,03 11,06±0,01 27,58±0,06
7 45,43±0,01 13,96±0,24 23,25±0,13
8 57,31±0,24 10,65±0,01 18,87±0,33
9 67,72±0,06 6,97±0,02 18,02±0,08
10 64,20±0,13 7,40±0,01 28,34±0,01
11 38,27±0,06 15,40±0,01 29,06±0,06
12 42,34±0,14 14,77±0,02 26,76±0,01
13 50,32±0,06 12,30±0,06 23,02±0,09
Table 7. Analysis of predicted model equation for colour of GF cookies
Design-Expert® Softw are
L
73.2
38.27
X1 = A: CBCA
X2 = B: Sugar
25
37.5
50
62.5
75
20.00
25.00
30.00
35.00
40.00
38.00
47.00
56.00
65.00
74.00
L
A: CBCA B: Sugar
Design-Expert® Softw are
a
15.4
4.87
X1 = A: CBCA
X2 = B: Sugar
25
37.5
50
62.5
75
20.00
25.00
30.00
35.00
40.00
4.00
7.00
10.00
13.00
16.00
a
A: CBCA B: Sugar
Parameters Model Model
R2
F
Value
value
Prob > F
Final equation in terms of coded
factors
L* lineer 0.8880 39.66 0.0500 L* = +56.63-116*A-2.38*B
a* lineer 0.97883 23.11 0.0500 a *=+10.83+3.66* A+0.05B* B
b* lineer 0.9637 13.26 0.0500 b* =+22.74-4.26 * A+0.15 * B
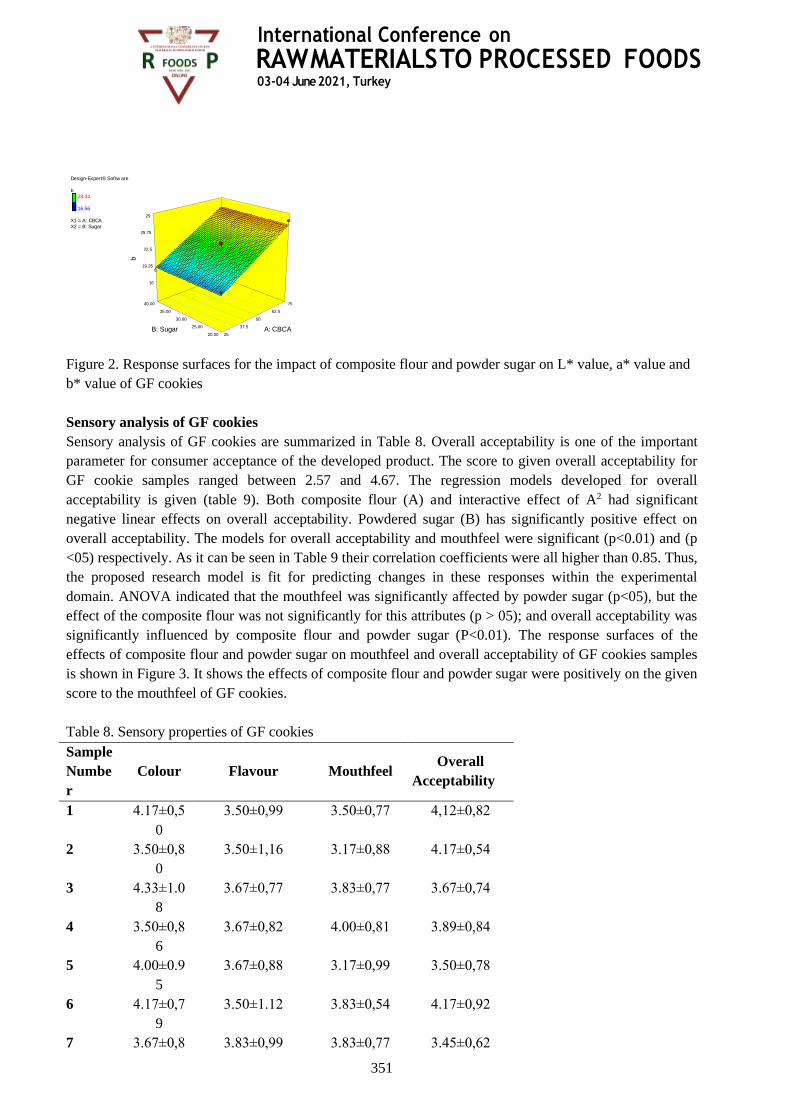
International Conference on
RAW MATERIALS TO PROCESSED FOODS 03-04 June 2021, Turkey
351
Figure 2. Response surfaces for the impact of composite flour and powder sugar on L* value, a* value and
b* value of GF cookies
Sensory analysis of GF cookies
Sensory analysis of GF cookies are summarized in Table 8. Overall acceptability is one of the important
parameter for consumer acceptance of the developed product. The score to given overall acceptability for
GF cookie samples ranged between 2.57 and 4.67. The regression models developed for overall
acceptability is given (table 9). Both composite flour (A) and interactive effect of A2 had significant
negative linear effects on overall acceptability. Powdered sugar (B) has significantly positive effect on
overall acceptability. The models for overall acceptability and mouthfeel were significant (p<0.01) and (p
<05) respectively. As it can be seen in Table 9 their correlation coefficients were all higher than 0.85. Thus,
the proposed research model is fit for predicting changes in these responses within the experimental
domain. ANOVA indicated that the mouthfeel was significantly affected by powder sugar (p<05), but the
effect of the composite flour was not significantly for this attributes (p > 05); and overall acceptability was
significantly influenced by composite flour and powder sugar (P<0.01). The response surfaces of the
effects of composite flour and powder sugar on mouthfeel and overall acceptability of GF cookies samples
is shown in Figure 3. It shows the effects of composite flour and powder sugar were positively on the given
score to the mouthfeel of GF cookies.
Table 8. Sensory properties of GF cookies
Sample
Numbe
r
Colour Flavour Mouthfeel Overall
Acceptability
1 4.17±0,5
0
3.50±0,99 3.50±0,77 4,12±0,82
2 3.50±0,8
0
3.50±1,16 3.17±0,88 4.17±0,54
3 4.33±1.0
8
3.67±0,77 3.83±0,77 3.67±0,74
4 3.50±0,8
6
3.67±0,82 4.00±0,81 3.89±0,84
5 4.00±0.9
5
3.67±0,88 3.17±0,99 3.50±0,78
6 4.17±0,7
9
3.50±1.12 3.83±0,54 4.17±0,92
7 3.67±0,8 3.83±0,99 3.83±0,77 3.45±0,62
Design-Expert® Softw are
b
28.34
16.56
X1 = A: CBCA
X2 = B: Sugar
25
37.5
50
62.5
75
20.00
25.00
30.00
35.00
40.00
16
19.25
22.5
25.75
29
b
A: CBCA B: Sugar

International Conference on
RAW MATERIALS TO PROCESSED FOODS 03-04 June 2021, Turkey
352
8
8 4.67±0,9
9
4.33±1,14 4.67±0,99 4.67±0,99
9 4.00±0,9
3
3.86±0,99 3.86±0,88 3.86±0,68
10 4.57±1,1
4
3.96±0,76 4.57±0,54 4.86±0,98
11 4.57±0,6
0
2.43±1,15 4.43±1,08 2.57±0,82
12 4.00±1,1
4
3.43±1.67 4.43±0,95 3.70±0,95
13 4.17±1,2
5
4.67±0,74 4.83±0,67 4.67±0,64
Table 9. Analysis of predicted model equation for the diameter, thickness, spread ratio and hardness of GF
cookies
Parameters Model Model
R2
F
Value
value Prob
> F
Final equation in terms of coded
factors
Mouthfeel lineer 0.9637 13.26 0.500 Mouthfeel.=+4.01+0.085* A+0.46* B
Overall
acceptability
Quadratic 0.8640 8.89 0.500 overall Acceptability =+4.20-0.39*
A+0.36* B -0.19* A * B-0.45*
A2+0.032*
Figure 3. Response surfaces for the impact of composite flour and powder sugar on mouthfeel and overall
acceptability of GF cookies
Optimization of GF cookies
The suitability and adequacy of the models were evaluated by the coefficient of determination R-Squared
(R2). Generally, models are considered good when R2 is greater than 0.75, and models less than R2 0.25 are
considered unusable (Mandenius and Brundin, 2008). In this research, a model is suitable for optimizing
since R2 is greater than 0.80 (Table 3, 5, 7, 9). The optimization of the responses were determined
numerically with statistical software Design-expert 7. The optimal amounts of composite flour and powder
Design-Expert® Softw are
Mouthfeel
4.83
3.17
X1 = A: CBCA
X2 = B: Sugar
25
37.5
50
62.5
75
20.00
25.00
30.00
35.00
40.00
3.10
3.55
4.00
4.45
4.90
M
outh
feel
A: CBCA B: Sugar
Design-Expert® Softw are
overall Acceptability
4.86
2.57
X1 = A: CBCA
X2 = B: Sugar
25.00
37.50
50.00
62.50
75.00
20.00
25.00
30.00
35.00
40.00
2.50
3.10
3.70
4.30
4.90
overa
ll A
ccepta
bili
ty
A: CBCA B: Sugar

International Conference on
RAW MATERIALS TO PROCESSED FOODS 03-04 June 2021, Turkey
353
sugar to determine GF cookies with the highest for spread factor, protein content and overall acceptability
and their combination were selected. The optimal amounts of ingredients in GF cookie was determined
maximum overall sensory acceptability, protein content and spread ratio are 66 g composite flour, 20 g
powder sugar, 15 g protein and 7.70 spread ratio. These optimum parameters were obtained selected based
on the highest desirability value is determined 0.71 (Figure 4).
Figure 4. Response surfaces for the impact of composite flour and powder sugar on desirability
CONCLUSION
It was determined in this study the effects of composite flour, and powder sugar on nutritional composition,
physical properties, colour characteristics and sensory analysis of GF cookies with response surface
experimental design. The results indicated that composite flour and powder sugar were significant for
moisture, carbohydrate, energy, hardness, a* value and overall acceptability; composite flour was mainly
responsible for ash, protein, fat, L* value and b* value; and powder sugar was all significant for diameter,
thickness, spread ratio and mouhtfeel in the cookie. Gluten free flour blends such as legumes, cereals,
pseudo cereals, nuts, dried vegetable and fruits could be used to produce the gluten free cookies with
increased nutritional content. So, this product will be a suitable snack food not only for celiac patients, but
also for diabetics, cardiovascular patients, vegetarians and individuals with healthy eating consciousness.
Thus, dietetic, functional and easy-to-carry products can be developed.
ORCID
Emir Ayşe Özer. https://orcid.org/0000-0001-7776-9625
REFERENCES
AACC, (1999). Official methods of analysis American association of cereal chemists. (10th ed.).
Minnesota, USA.
AACC. (2000). Official methods of analysis American association of cereal chemists. (10th ed.). St Paul.
AOAC (2005). Official methods of analysis association of official analytical chemists. (18th ed.). AOAC
International, Arlington, VA, USA
Arslain, K., Gustafson, C. R., Baishya, P., & Rose, D. J. (2021). Determinants of gluten-free diet adoption
among individuals without celiac disease or non-celiac gluten sensitivity. Appetite, 156, 104958.
https://doi.org/10.1016/j.appet.2020.104958
Barton, S. H., Kelly, D. G., & Murray, J. A. (2007). Nutritional deficiencies in celiac disease.
Gastroenterology Clinics of North America, 36(1), 93-108. https://doi.org/10.1016/j.gtc.2007.01.006
Design-Expert® Softw are
Desirability
Design Points
1
0
X1 = A: CBCA
X2 = B: Sugar
25.00 37.50 50.00 62.50 75.00
20.00
25.00
30.00
35.00
40.00Desirability
A: CBCA
B: S
ug
ar
0.120
0.239
0.359
0.478
0.598
55555
Prediction 0.718
International Conference on
RAW MATERIALS TO PROCESSED FOODS 03-04 June 2021, Turkey
354
Chauhan, A., Saxena, D. C., & Singh, S. (2016). Physical, textural and sensory characteristics of wheat and
amaranth flour blend cookies. Cogent Food and Agriculture, 2, 1125773. doi:
10.1080/23311932.2015.1125773
Devi, Amita, and B. S. Khatkar. "Physicochemical, rheological and functional properties of fats and oils in
relation to cookie quality: a review." Journal of Food Science and Technology 53 (10), 3633-3641,
(2016).
Dimidi, E., Kabir, B., Singh, J., Ageridou, A., Foster, C., Ciclitira, P., ... & Whelan, K. (2021). Predictors
of adherence to a gluten-free diet in celiac disease: do knowledge, attitudes, experiences, symptoms,
and quality of life play a role?. Nutrition, 90, 111249. https://doi.org/10.1016/j.nut.2021.111249
Elli, L., Ferretti, F., Orlando, S., Vecchi, M., Monguzzi, E., Roncoroni, L., & Schuppan, D. (2019).
Management of celiac disease in daily clinical practice. European Journal of Internal Medicine, 61,
15-24. doi: 10.1016/j.ejim.2018.11.012
Foschia, M., Horstmann, S., Arendt, E., & Zannini, E. (2016). Nutritional therapy – facing the gap between
coeliac disease and gluten-free food. International Journal of Food Microbiology, 239, 113–124. doi:
10.1016/j.ijfoodmicro.2016.06.06.014
Gallagher, E., Gormley, T. R., & Arendt, E. K. (2004). Recent advances in the formulation of gluten-free
cereal-based products. Trends in Food Science & Technology, 15(3-4), 143-152.
https://doi.org/10.1016/j.tifs.2003.09.012
Giri, N. A., & Sakhale, B. K. (2021). Effects of incorporation of orange‐fleshed sweet potato flour on
physicochemical, nutritional, functional, microbial, and sensory characteristics of gluten‐free
cookies. Journal of Food Processing and Preservation, 45(4), e15324.
https://doi.org/10.1111/jfpp.15324
Giuberti, G., Rocchetti, G., Sigolo, S., Fortunati, P., Lucini, L., & Gallo, A. (2018). Exploitation of alfalfa
seed (Medicago sativa L.) flour into gluten-free rice cookies: Nutritional, antioxidant and quality
characteristics. Food chemistry, 239, 679-687. https://doi.org/10.1016/j.foodchem.2017.07.004
Goyat, J., Passi, S., Suri, S., & Dutta, H. (2018). Development of chia (Salvia hispanica, L.) and quinoa
(Chenopodium quinoa, L.) seed flour substituted cookies-physicochemical, nutritional and storage
studies. Current Research in Nutrition and Food Science Journal, 6(3), 757– 769.
http://dx.doi.org/10.12944/CRNFSJ.6.3.18
Hallert, C., Grant, C., Grehn, S., Grännö, C., Hultén, S., Midhagen, G., ... & Valdimarsson, T. (2002).
Evidence of poor vitamin status in coeliac patients on a gluten‐free diet for 10 years. Alimentary
Pharmacology and Therapeutics, 16(7), 1333-1339. doi: 10.1046/j.1365-2036.2002.01283.x
Hamdani, A. M., Wani, I. A., & Bhat, N. A. (2020). Gluten free cookies from rice-chickpea composite
flour using exudate gums from acacia, apricot and karaya. Food Bioscience, 35, 100541.
https://doi.org/10.1016/j.fbior.2020.100541
Hejrani, T., Sheikholeslami, Z., Mortazavi, A., & Davoodi, M. G. (2017). The properties of part baked
frozen bread with guar and xanthan gums. Food Hydrocolloids, 71, 252-257.
https://doi.org/10.1016/j.foodhyd.2016.04.012
Houben, A., Höchstötter, A., & Becker, T. (2012). Possibilities to increase the quality in gluten-free bread
production: an overview. European Food Research and Technology, 235(2), 195-208.
Hu, L., Guo, J., Zhu, X., Liu, R., Wu, T., Sui, W., & Zhang, M. (2020). Effect of steam explosion on
nutritional composition and antioxidative activities of okra seed and its application in gluten‐free
cookies. Food Science and Nutrition, 8(8), 4409-4421. https://doi.org/10.1002/fsn3.1739
İbanoğlu, Ş., Ainsworth, P., Özer, E. A., & Plunkett, A. (2006). Physical and sensory evaluation of a
nutritionally balanced gluten-free extruded snack. Journal of Food Engineering, 75(4), 469-472.
https://doi.org/10.1016/j.jfoodeng.2005.04.060

International Conference on
RAW MATERIALS TO PROCESSED FOODS 03-04 June 2021, Turkey
355
Kinsey, L., Burden, S. T., & Bannerman, E. (2008). A dietary survey to determine if patients with coeliac
disease are meeting current healthy eating guidelines and how their diet compares to that of the
British general population. European journal of clinical nutrition, 62(11), 1333-1342. doi:
10.1038/sj.ejcn.1602856
Laguna, L., Primo‐Martín, C., Salvador, A., & Sanz, T. (2013). Inulin and erythritol as sucrose replacers in
short‐dough cookies: sensory, fracture, and acoustic properties. Journal of Food science, 78(5),
S777-S784. doi: 10.1111/1750-3841.12119
Lee, A. R., Ng, D. L., Dave, E., Ciaccio, E. J., & Green, P. H. R. (2009). The effect of substituting
alternative grains in the diet on the nutritional profile of the gluten‐free diet. Journal of Human
Nutrition and Dietetics, 22(4), 359-363. doi: 10.1111/j.1365-277X.2009.00970.x
Mandenius, C. F., & Brundin, A. (2008). Bioprocess optimization using design‐of‐experiments
methodology. Biotechnology progress, 24(6), 1191-1203. doi: 10.1002/btpr.67
Manley, D. (2011). Manley's Technology of Biscuits, Crackers and Cookies (4th ed.). Cambridge, UK.
McGrogan, L., Mackinder, M., Stefanowicz, F., Aroutiounova, M., Catchpole, A., Wadsworth, J., ... &
Gerasimidis, K. (2021). Micronutrient deficiencies in children with coeliac disease; a double-edged
sword of both untreated disease and treatment with gluten-free diet. Clinical Nutrition, 40(5), 2784-
2790. https://doi.org/10.1016/j.clnu.2021.03.006
Milner, L., Kerry, J. P., O'Sullivan, M. G., & Gallagher, E. (2020). Physical, textural and sensory
characteristics of reduced sucrose cakes, incorporated with clean-label sugar-replacing alternative
ingredients. Innovative Food Science and Emerging Technologies, 59, 102235.
https://doi.org/10.1016/j.ifset.2019.102235
Mosca, A. C., & Pellegrini, N. (2021). Toward an innovative gluten-free diet. In Biotechnological
Strategies for the Treatment of Gluten Intolerance Academic Press, Mauro, R. (Ed.). 131-153.
https://doi.org/10.1016/B978-0-12-821594-4.00002-5
Myers, R. H., Montgomery, D. C., & Anderson-Cook, C. M. (2016). Response surface methodology,
product and process optimization using experimental design (2nd ed.). New York, John Wiley &
Sons.
Nagi, H. P. S., Kaur, J., Dar, B. N., & Sharma, S. (2012). Effect of storage period and packaging on the
shelf life of cereal bran incorporated biscuits. American Journal of Food Technology, 7(5), 301–310.
doi: 10.3923/ajft.2012.301.310
Olawoye, B., & Gbadamosi, S. O. (2020). Influence of processing on the physiochemical, functional and
pasting properties of Nigerian amaranthus viridis seed flour: a multivariate analysis approach. SN
Applied Sciences, 2(4), 1-13. doi:10.1007/s42452-020-2418-8
Šarić, B., Dapčević-Hadnađev, T., Hadnađev, M. et al. (2019). Fiber concentrates from raspberry and
blueberry pomace in gluten-free cookie formulation: Effect on dough rheology and cookie baking
properties. Journal of Texture Studies, 50, 124–130. https://doi.org/10.1111/jtxs.12374
Saturni, L., Ferretti, G., & Bacchetti, T. (2010). The gluten-free diet: safety and nutritional quality.
Nutrients, 2(1), 16-34. doi: 10.3390/nu20100016
Simons, C. W., & Hall III, C. (2018). Consumer acceptability of gluten‐free cookies containing raw cooked
and germinated pinto bean flours. Food Science and Nutrition, 6(1), 77-84. doi: 10.1002/fsn3.531
Stantiall, S. E., & Serventi, L. (2017). Nutritional and sensory challenges of gluten-free bakery products: A
review. International Journal of Food Sciences and Nutrition, 69(4), 1–10. doi:
10.1080/09637486.2017.1378626
Van der Sman RGM, Renzetti S. (2019). Understanding function-ality of sucrose in biscuits for
reformulation purposes. Critical Reviews in Food Science and Nutrition, 59, 2225–2239.
doi:10.1080/10408398.2018.1442315
International Conference on
RAW MATERIALS TO PROCESSED FOODS 03-04 June 2021, Turkey
356
Yin, J., Zhu, Y., Malik, V., Li, X., Peng, X., Zhang, F. F., ... & Liu, L. (2021). Intake of sugar-sweetened
and low-calorie sweetened beverages and risk of cardiovascular disease: a meta-analysis and
systematic review. Advances in Nutrition, 12(1), 89-101. https://doi.org/10.1093/advances/nmaa084
Zharkova, I. M., Samokhvalov, A. A., Gustinovich, V. G., Koryachkina, S. Y., & Roslyakov, Y. F. (2019).
Review of bakery products for gluten free and herodietetic nutrition. Proceedings of the Voronezh
State University of Engineering Technologies, 81(1), 213-217. https://doi.org/10.20914/2310-1202-
2019-1-213-217
Zoulias, E. I., Oreopoulou, V., & Tzia, C. (2002). Textural properties of low-fat cookies containing
carbohydrate-or protein-based fat replacers. Journal of Food Engineering, 55(4), 337-342.
https://doi.org/10.1016/S0260-8774(02)00111-5
Zoulias, E. I., Piknis, S., & Oreopoulou, V. (2000). Effect of sugar replace-ment by polyols and acesulfane-
K on properties of low fat cookies. Journal of the Science of Food and Agriculture, 80(14), 2049–
2056. https://doi.org/10.1002/1097-0010(200011)80:14<2049::AID-JSFA735>3.0.CO;2-Q