2 ALASKA ECONOMIC TRENDS JULY 2006labor.state.ak.us/trends/jul06.pdf4 ALASKA ECONOMIC TRENDS JULY...
23
Transcript of 2 ALASKA ECONOMIC TRENDS JULY 2006labor.state.ak.us/trends/jul06.pdf4 ALASKA ECONOMIC TRENDS JULY...


2 ALASKA ECONOMIC TRENDS JULY 2006
Web site: almis.labor.state.ak.us
Frank H. Murkowski, Governor of AlaskaGreg O’Claray, Commissioner
Susan Erben, Editor
Layout and cover design by Sam Dapcevich
Editorial assistance by Jack Cannon and Brian Laurent
Email Trends authors at: [email protected]
Free subscriptions:[email protected]
(907) 465-4500
July 2006Volume 26Number 7
ISSN 0160-3345
To contact us for more information, a free
subscription, mailing list changes or back
copies, email us at [email protected]
or call (907) 465-4500.
Alaska Economic Trends is a monthly publication
dealing with a wide variety of economic-related issues in the state. Its purpose is to inform the public about
those issues.
Alaska Economic Trends is funded by the
Employment Security Division and published by
the Alaska Department of Labor & Workforce
Development.
Printed and distributed by Assets, Inc., a vocational training and employment
program, at a cost of $1.10 per copy.
Material in this publication is public
information and, with appropriate credit, may be reproduced without
permission.
Cover: Sara Williamson, 25, of Juneau cleans a cus-tomer’s windshield while
working at the Capital Serv-ice gas station in Juneau in
fall 2005. Now she worksat the Douglas Breeze-In
and the Goldbelt Tour Cen-ter. She moved up from
Washington 1 ½ years ago. “It’s extremely expensive
for one person to live with one job. The rent up here is so expensive, I have to work two jobs.” Is it worth it? “Oh, it’s worth it. There are awesome people here.
It’s like one big giant neighborhood.”
Photo by David Gelotte
Governor’s Letter 3
The Cost of Living in Alaska 4The gap is narrowing
Employment Scene 17Oil and gas jobs up 1,000 over the year
Profi le 19Training for Jobs in the Energy Industry

3ALASKA ECONOMIC TRENDS JULY 2006
Living Large in Alaska:Countering the Costs
By Governor Frank H. Murkowski
This month’s Trends features data and analysis on the cost of living in Alaska. As the economists discuss, the unique benefi ts of living in the 49th state, with
its rugged and remote characteristics, come with unique costs. While it’s still more expensive to live in Alaska than in much of the rest of the country, the gap is narrowing, particularly in some of our higher-population areas.
To help counter the higher cost of living in this great state, my administration has worked hard to grow our economy and maximize our resource industries. We’ve expanded past our primary economic base of oil revenues and revitalized our mining and fi shing industries. The construction of a natural gas pipeline and additional oil fi elds bring with them more high-paying jobs throughout the state.
As of April, we’ve created more than 15,400 new jobs during my administration across all industries. Forecasts estimate 3,600 new jobs in 2006 and 2007 for the high-growth industries of mining, energy, construction and health care. Altogether, a 10-year forecast predicts an overall total of 43,000 new jobs during the 2002-2012 period.
More jobs mean more opportunities for Alaskans to earn a good living in Alaska and enjoy the unique benefi ts our state offers. In addition to creating jobs, we’re helping Alaskans get trained and placed in those jobs. Our Alaska Job Centers logged more than 240,000 visits in 2005, and of the 66,725 people receiving signifi cant staff assistance, 9,264 of them found jobs. That’s a 30-percent increase in the number of Alaskans put to work compared to the previous year.
ALEXsys, a new online system to help match job seekers and employers, is now up and running and will likely increase the numbers further. And to reach kids in the schools or those in some more remote areas of the state, we’ve added two Mobile Job Units to take the full services of the Job Centers right to them.
And speaking of our students, we know that many of tomorrow’s builders of the natural gas pipeline are currently in our middle schools. So we’re working to increase their awareness of the opportunities ahead for them and what they can start doing now to get ready for those good-paying jobs in the future.
But it won’t just be today’s students building the natural gas pipeline. All Alaskans are eligible to join in this historic venture. Training programs will help those ready for a change in career or those continuing in the construction trades. Other pipeline infrastructure industries, such as transportation, will also need more workers. The opportunities are abundant.
As Alaskans, we enjoy a quality of life second to none. We’re surrounded by jaw-dropping scenery and a never-ending supply of recreational options. While Alaska is statistically a more expensive place to live, her returns on investment are enormous. Get out there and enjoy it, and we’ll keep working on continued growth and prosperity for our great state.

4 ALASKA ECONOMIC TRENDS JULY 2006
he high cost of living in Alaska is part of the state’s folklore. Stories are told of eggs being sold for a dollar each in Skagway during the Klondike
gold rush and of converted garages renting for $1,000 a month in Fairbanks during construc-tion of the trans-Alaska oil pipeline. Even during more stable economic periods, the unique ben-efi ts of living in the 49th state – a rugged and expansive land more remote from the nation’s population centers than every other state except Hawaii – come with unique costs.
This article takes a look at some of those costs by examining the most current information from a variety of cost-of-living studies and concludes that although it’s still more expensive to live in Alaska than in much of the rest of the country, the gap is gradually narrowing.
Two ways to look at cost of living
Cost-of-living measures come in two basic types. One looks at the change in prices over time in a specifi c location. The Consumer Price Index, considered the broadest and most comprehen-sive measure of infl ation, is the best example of this type of measure. Landlords, workers, unions and employers use the CPI to adjust rents and salaries, among other things, and the Alaska Permanent Fund Corporation uses the CPI to determine how much money must be added to the principal of the Permanent Fund every year to keep up with infl ation.
Other cost-of-living studies compare prices in different locations for a specifi c time period. These studies are used primarily by employ-
Ters and benefi t providers who want to equalize wages or payments to people in different loca-tions – and by employees and benefi t recipients who want to make a case for why their wages or benefi t payments should be raised. A number of these types of measures will be examined.
Highest inflation in 12 years
For the fi rst time since 1993, infl ation as mea-sured by the Anchorage CPI1 crested the 3 percent mark in 2005. (See Exhibits 1 and 2.) The city’s 3.1 percent increase was lower than the national infl ation rate of 3.4 percent, but well above Anchorage’s 10-year average of 2.2 percent.
Prices rose in nearly all major categories in 2005, with the biggest increase coming in the transportation component. (See Exhibit 3.) The only decline among the major categories was in apparel and upkeep, where prices have fallen in seven out of the last 10 years, due mostly to the dramatic increase in cheaper imports from China. In general, national infl ation exceeded Anchorage’s, continuing a long-running trend of a slowly narrowing gap between Alaska prices and average prices for the nation as a whole.
Housing costs, which have the largest impact on
1 Because a Consumer Price Index is not calculated for any other Alaska city, the Anchorage CPI is often used as the best substitute for a statewide infl ation measure. All references to the CPI in this article are to the CPI-U (Consumer Price Index for all Urban Con-sumers). The CPI-U covers about 87 percent of the U.S. population and nearly all of the Anchorage population. The U.S. Department of Labor’s Bureau of Labor Statistics also produces an index called the Consumer Price Index for all Urban Wage Earners and Clerical Workers, or CPI-W, which covers a subset of the CPI-U population who work in clerical or wage occupations.
by Neal Fried and Dan Robinson
EconomistsThe Cost of Living in Alaska
The gap is narrowing between Alaska and the U.S.

5ALASKA ECONOMIC TRENDS JULY 2006
the overall CPI, rose by 2.7 percent, compared to 3.3 percent for the U.S. High oil and natu-ral gas prices are refl ected in a number of CPI categories. Fuels and utilities, a subcategory of housing, rose by 8.2 percent in 2005 after an even higher increase of 9.2 percent in 2004. Overall, energy prices, which are scattered throughout a number of other categories, rose by 12.8 percent in 2005, the largest single-year increase for the category in the last decade. Nationally, energy prices rose even more – 17.0 percent – in 2005.
How the inflation rate is calculated
As noted above, the Consumer Price Index mea-sures price changes over time. More specifi cally, it measures the average change over time in the prices paid by urban consumers for a combina-tion of consumer goods and services referred to as the “market basket.” Anchorage is one of 27 local areas nationwide for which a CPI is calcu-lated. CPI data for Anchorage is available on a semi-annual basis back to 1984.
To produce the Anchorage CPI, the U.S. Depart-ment of Labor’s Bureau of Labor Statistics con-ducts detailed surveys of Anchorage consumers’ spending habits. Survey responses determine the makeup of the city’s market basket as well as the weight each item will have in the overall index. A category’s weight represents its per-centage of the average consumer’s total expen-ditures. (See Exhibit 4.)
Not surprisingly, the CPI weights housing high-est.2 As a result, housing has the most infl uence on the overall index. Housing’s dominant weight also gives the CPI a local fl avor, since housing prices can differ substantially throughout the
2 The CPI measures housing prices according to “rental equiva-lency,” which looks at the current rental values of houses rather than actual sale prices or appraised values. This method has been criticized as not being refl ective of the actual increases in consumer expenditures for housing, since rental prices have not increased as much as sale prices for homes in recent years. One of the Bureau of Labor Statistics’ responses has been that some of the increase in home values is due to investment buying and investments are excluded from CPI calculations.
Anchorage Consumer Price Index3.1% infl ation is the highest in 12 years
Source: U.S.Department of Labor, Bureau of Labor Statistics
1
6.2%
4.6%
3.4%
3.1%
2.1%
2.9%
2.7%
1.5%
1.5%
1.0%
1.7%
2.8%
1.9%
2.7%
2.6% 3.
1%
90 91 92 93 94 95 96 97 98 99 00 01 02 03 04 050%
1%
2%
3%
4%
5%
6%
7%Inflation Rate
country depending on local market forces. When local CPI numbers differ substantially from national CPI numbers (see Exhibits 2 and 3), housing prices are the most likely culprit since other CPI categories such as transporta-tion, food, clothing and recreation costs are dictated more by national and international conditions than local ones.
One example of this was during the late 1980s when Anchorage’s real estate market crashed. Falling housing prices kept Anchorage’s overall CPI nearly fl at in 1987 and 1988 – 0.4 percent for each of the two years. (See Exhibit 2.) During this same period, the national housing market was robust and as a result the national infl ation rate was considerably higher than Anchorage’s – 3.6 percent in 1987 and 4.1 percent in 1988.
Medical costs available again
CPI data for Anchorage medical care were published again in 2005 after being unavailable since the fi rst half of 2002 due to an insuffi cient sample of medical costs.3 The lack of annual data from 2002 through 2004 makes it impos-
3 Although medical care costs were not separately published, they were still incorporated into the overall CPI.

6 ALASKA ECONOMIC TRENDS JULY 2006
sible to calculate yearly percentage increases over that period, but there is no doubt that health care prices have been soaring. Between 2001 and 2005, medical costs increased by 22 percent.
Over the longer term, no other component of the CPI comes close to matching the increase in costs for medical care. (See Exhibit 5.) Since 1984, medical care has increased by a whop-ping 226 percent. Nationally the story is much the same, with an increase of nearly 203 per-cent over the same period. Whether medical costs will continue to rise at such a pace is uncertain, but one factor suggesting they might is increasing demand, fueled by the aging baby boomer population.
CPI can’t be used for geographic comparisons
National and city-specifi c CPI data are released as index numbers from which percent changes are then calculated. In 2005, for example, the U.S. index was 195.3 and Anchorage’s was 171.8. (See Exhibit 2.) The reference base for both areas is 1982-1984, which means that since those base years, U.S. prices have risen 95.3 percent and Anchorage prices have risen 71.8 percent.
What the higher U.S. number does not mean is that U.S. prices are higher than Anchorage’s. The only conclusion that can be drawn from the higher U.S. number is that, since the 1982-1984 period, prices have increased more nation-ally than they have for Anchorage. As other cost-of-living studies show, prices in Anchorage and other Alaska cities are still higher than the national average. What these studies and the CPI data confi rm, however, is that the difference between Alaska prices and nationwide averages is signifi cantly smaller than it used to be.
Food costs especially high in Southwest Alaska
Four times a year the University of Alaska Fair-banks’ Cooperative Extension Service surveys food costs in about 20 Alaska communities and Portland, Ore. (See Exhibits 6 and 7.) The food
2 Consumer Price Index - UrbanU.S. city and Anchorage averages, 1960 to 2005
YearAnchorage
Average
PercentChange
fromPrevious
YearU.S.
Average
PercentChange
fromPrevious
Year
1960 34.0 29.61961 34.5 1.5% 29.9 1.0%1962 34.7 0.6% 30.2 1.0%1963 34.8 0.3% 30.6 1.3%1964 35.0 0.6% 31.0 1.3%1965 35.3 0.9% 31.5 1.6%1966 36.3 2.8% 32.4 2.9%1967 37.2 2.5% 33.4 3.1%1968 38.1 2.4% 34.8 4.2%1969 39.6 3.9% 36.7 5.5%1970 41.1 3.8% 38.8 5.7%1971 42.3 2.9% 40.5 4.4%1972 43.4 2.6% 41.8 3.2%1973 45.3 4.4% 44.4 6.2%1974 50.2 10.8% 49.3 11.0%1975 57.1 13.7% 53.8 9.1%1976 61.5 7.7% 56.9 5.8%1977 65.6 6.7% 60.6 6.5%1978 70.2 7.0% 65.2 7.6%1979 77.6 10.5% 72.6 11.3%1980 85.5 10.2% 82.4 13.5%1981 92.4 8.1% 90.9 10.3%1982 97.4 5.4% 96.5 6.2%1983 99.2 1.8% 99.6 3.2%1984 103.3 4.1% 103.9 4.3%1985 105.8 2.4% 107.6 3.6%1986 107.8 1.9% 109.6 1.9%1987 108.2 0.4% 113.6 3.6%1988 108.6 0.4% 118.3 4.1%1989 111.7 2.9% 124.0 4.8%1990 118.6 6.2% 130.7 5.4%1991 124.0 4.6% 136.2 4.2%1992 128.2 3.4% 140.3 3.0%1993 132.2 3.1% 144.5 3.0%1994 135.0 2.1% 148.2 2.6%1995 138.9 2.9% 152.4 2.8%1996 142.7 2.7% 156.9 3.0%1997 144.8 1.5% 160.5 2.3%1998 146.9 1.5% 163.0 1.6%1999 148.4 1.0% 166.6 2.2%2000 150.9 1.7% 172.2 3.4%2001 155.2 2.8% 177.1 2.8%2002 158.2 1.9% 179.9 1.6%2003 162.5 2.7% 184.0 2.3%2004 166.7 2.6% 188.9 2.7%2005 171.8 3.1% 195.3 3.4%
Note: The base years are 1982 to 1984.
Source: U.S. Department of Labor, Bureau of Labor Statistics

7ALASKA ECONOMIC TRENDS JULY 2006
3The Consumer Price Index in Anchorage and the U.S.Annual averages for selected components, 1983 to 2005
ALL ITEMS EXCEPT SHELTER HOUSING TRANSPORTATION
YearU.S.
Average
PercentChange
from Prev.Year
Anchor-age
Average
PercentChange
from Prev.Year
U.S.Average
PercentChange
from Prev.Year
Anchor-age
Average
PercentChange
from Prev.Year
U.S.Average
PercentChange
from Prev.Year
Anchor-age
Average
PercentChange
from Prev.Year
1983 99.8 3.7% 99.9 3.7% 99.5 2.7% 99.0 0.8% 99.3 2.4% 98.5 1.8%1984 103.9 4.1% 103.8 3.9% 103.6 4.1% 102.7 3.7% 103.7 4.4% 104.6 6.2%1985 107.0 3.0% 107.5 3.6% 107.7 4.0% 103.0 0.3% 106.4 2.6% 108.2 3.4%1986 108.0 0.9% 111.2 3.4% 110.9 3.0% 102.6 -0.4% 102.3 -3.9% 107.8 -0.4%1987 111.6 3.3% 115.1 3.5% 114.2 3.0% 97.5 -5.0% 105.4 3.0% 111.3 3.2%1988 115.9 3.9% 117.8 2.3% 118.5 3.8% 95.4 -2.2% 108.7 3.1% 113.0 1.5%1989 121.6 4.9% 122.3 3.8% 123.0 3.8% 96.3 0.9% 114.1 5.0% 116.7 3.3%1990 128.2 5.4% 128.0 4.7% 128.5 4.5% 103.9 7.9% 120.5 5.6% 120.7 3.4%1991 133.5 4.1% 131.9 3.0% 133.6 4.0% 111.2 7.0% 123.8 2.7% 121.7 0.8%1992 137.3 2.8% 134.6 2.0% 137.5 2.9% 116.6 4.9% 126.5 2.2% 123.3 1.3%1993 141.4 3.0% 137.9 2.5% 141.2 2.7% 121.1 3.9% 130.4 3.1% 128.8 4.5%1994 144.8 2.4% 140.3 1.7% 144.8 2.5% 122.9 1.5% 134.3 3.0% 136.9 6.3%1995 148.6 2.6% 144.6 3.1% 148.5 2.6% 124.9 1.6% 139.1 3.6% 143.8 5.0%1996 152.8 2.8% 148.4 2.6% 152.8 2.9% 127.9 2.4% 143.0 2.8% 147.2 2.4%1997 155.9 2.0% 150.6 1.5% 156.8 2.6% 129.4 1.2% 144.3 0.9% 147.0 -0.1%1998 157.2 0.8% 152.6 1.3% 160.4 2.3% 131.0 1.2% 141.6 -1.9% 144.9 -1.4%1999 160.2 1.9% 153.5 0.6% 163.9 2.2% 132.7 1.3% 144.4 2.0% 143.7 -0.8%2000 165.7 3.4% 156.1 1.7% 169.6 3.5% 134.2 1.1% 153.3 6.2% 150.5 4.7%2001 169.7 2.4% 160.6 2.9% 176.4 4.0% 139.0 3.6% 154.3 0.7% 153.0 1.7%2002 170.8 0.6% 162.2 1.0% 180.3 2.2% 143.5 3.2% 152.9 -1.0% 151.5 -1.0%2003 174.6 2.2% 166.5 2.7% 184.8 2.5% 146.8 2.3% 157.6 3.1% 158.3 4.5%2004 179.3 2.7% 171.7 3.1% 189.5 2.5% 149.1 1.6% 163.1 3.5% 162.7 2.8%2005 186.1 3.8% 177.5 3.4% 195.7 3.3% 153.1 2.7% 173.9 6.6% 171.7 5.5%
FOOD and BEVERAGES MEDICAL CARE1 APPAREL and UPKEEP
YearU.S.
Average
PercentChange
from Prev.Year
Anchor-age
Average
PercentChange
from Prev.Year
U.S.Average
PercentChange
from Prev.Year
Anchor-age
Average
PercentChange
from Prev.Year
U.S.Average
PercentChange
from Prev.Year
Anchor-age
Average
PercentChange
from Prev.Year
1983 99.5 2.3% 99.7 2.6% 100.6 8.8% 99.7 5.2% 100.2 2.5% 101.6 5.2%1984 103.2 3.7% 103.2 3.5% 106.8 6.2% 105.5 5.8% 102.1 1.9% 101.7 0.1%1985 105.6 2.3% 106.2 2.9% 113.5 6.3% 110.9 5.1% 105.0 2.8% 105.8 4.0%1986 109.1 3.3% 110.8 4.3% 122.0 7.5% 127.8 15.2% 105.9 0.9% 109.0 3.0%1987 113.5 4.0% 113.1 2.1% 130.1 6.6% 137.0 7.2% 110.6 4.4% 116.6 7.0%1988 118.2 4.1% 113.8 0.6% 138.6 6.5% 145.8 6.4% 115.4 4.3% 119.1 2.1%1989 124.9 5.7% 117.2 3.0% 149.3 7.7% 154.4 5.9% 118.6 2.8% 125.0 5.0%1990 132.1 5.8% 123.7 5.5% 162.8 9.0% 161.2 4.4% 124.1 4.6% 127.7 2.2%1991 136.8 3.6% 127.7 3.2% 177.0 8.7% 173.5 7.6% 128.7 3.7% 126.6 -0.9%1992 138.7 1.4% 130.3 2.0% 190.1 7.4% 183.0 5.5% 131.9 2.5% 130.2 2.8%1993 141.6 2.1% 131.2 0.7% 201.4 5.9% 189.6 3.6% 133.7 1.4% 131.2 0.8%1994 144.9 2.3% 131.9 0.5% 211.0 4.8% 197.8 4.3% 133.4 -0.2% 128.9 -1.8%1995 148.9 2.8% 138.5 5.0% 220.5 4.5% 211.6 7.0% 132.0 -1.0% 130.0 0.9%1996 153.7 3.2% 143.4 3.5% 228.2 3.5% 231.1 9.2% 131.7 -0.2% 128.7 -1.0%1997 157.7 2.6% 145.8 1.7% 234.6 2.8% 248.9 7.7% 132.9 0.9% 127.0 -1.3%1998 161.1 2.2% 147.3 1.0% 242.1 3.2% 255.7 2.7% 133.0 0.1% 125.6 -1.1%1999 164.6 2.2% 148.4 0.7% 250.6 3.5% 260.8 2.0% 131.3 -1.3% 125.8 0.2%2000 168.4 2.3% 151.7 2.2% 260.8 4.1% 272.1 4.3% 129.6 -1.3% 124.5 -1.0%2001 173.6 3.1% 156.4 3.1% 272.8 4.6% 282.9 4.0% 127.3 -1.8% 131.1 5.3%2002 176.8 1.8% 157.9 1.0% 285.6 4.7% ------ ------ 124.0 -2.6% 126.7 -3.4%2003 180.5 2.1% 161.8 2.5% 297.1 4.0% ------ ------ 120.9 -2.5% 123.2 -2.8%2004 186.6 3.4% 168.9 4.4% 310.1 4.4% ------ ------ 120.4 -0.4% 123.9 0.6%2005 191.2 2.5% 173.1 2.5% 323.2 4.2% 344.2 ------ 119.5 -0.1% 121.3 -2.1%
1 No index was created for medical care for Anchorage for the years 2002 to 2004.
Source: U. S. Department of Labor, Bureau of Labor Statistics

8 ALASKA ECONOMIC TRENDS JULY 2006
limited to food, which is only part of the aver-age consumer’s expenditures, it should be used with caution when it is used as a substitute for a more comprehensive cost-of-living comparison. The fact that food costs in St. Paul are twice as expensive as food costs in Ketchikan, for exam-ple, does not necessarily mean that the overall cost of living in St. Paul is twice as high as in Ketchikan.
Another limitation of the survey is that it uses the same market basket of food items for all areas, despite the fact that there may be signifi -cant differences between the list of food items consumed by a family in Anchorage and that consumed by a family in Bethel. The survey recently began including the cost of having grocery items delivered by mail, but it does not account for subsistence-harvested meat, fi sh, berries and other items that often replace store-bought food.
Within Alaska, food costs were the lowest in the Mat-Su area, Fairbanks and Anchorage, al-though all of the Alaska communities surveyed had at least slightly higher food costs than Portland, Ore. (See Exhibit 6.) The highest cost areas tend to be the most remote, requiring delivery of food by air for much of the year and by barge during the summer months. St. Paul, Naknek-King Salmon, Dillingham, Bethel and Dutch Harbor all fall into this category.
The next tier consists of relatively small com-munities that lie on a major transportation system – either a road system or the Alaska Marine Highway. Among those included in this group are Kodiak, Haines, Cordova and Seward. Other important factors in the cost of food are proximity to larger population cen-ters, the year-round stability of a community’s population and the level of competition within the local market.
High rents in Kodiak and Juneau
Housing costs can be a good proxy for an area’s cost of living because they make up such a large percentage of total household expendi-tures. A 2005 survey of rental prices for hous-ing in 10 areas around the state, conducted by
4 Consumers Spend Most on HousingConsumer Price Index weighting1
5 Health Care in its Own LeagueAnchorage Consumer Price Index
1 As of December 2005
Source: U.S. Department of Labor, Bureau of Labor Statistics
Note: The base years are 1982 to 1984.
Source: U.S. Department of Labor Statistics, Bureau of Labor Statistics
Housing43.6%
Transportation 19.0%
Food and beverage 12.3%
Recreation 7.0%
Medical care 6.2%
Education and communication 5.5%Other goods and services 3.7%
Apparel and upkeep 2.7%
items selected are based on a national survey of eating habits and are meant to represent a low-cost, balanced diet. Prices are also gathered for electricity, heating oil, automobile gas, lumber and propane.
The survey is especially useful because it cov-ers so many different Alaska communities. In many of the areas, the survey is the only source of cost-of-living information. It is important to note, however, that because the survey is mostly
1985 1990 1995 2000 200550
100
150
200
250
300
350
Index Values
All ItemsHousing
MedicalEnergy
344.2
185.4171.8153.1

9ALASKA ECONOMIC TRENDS JULY 2006
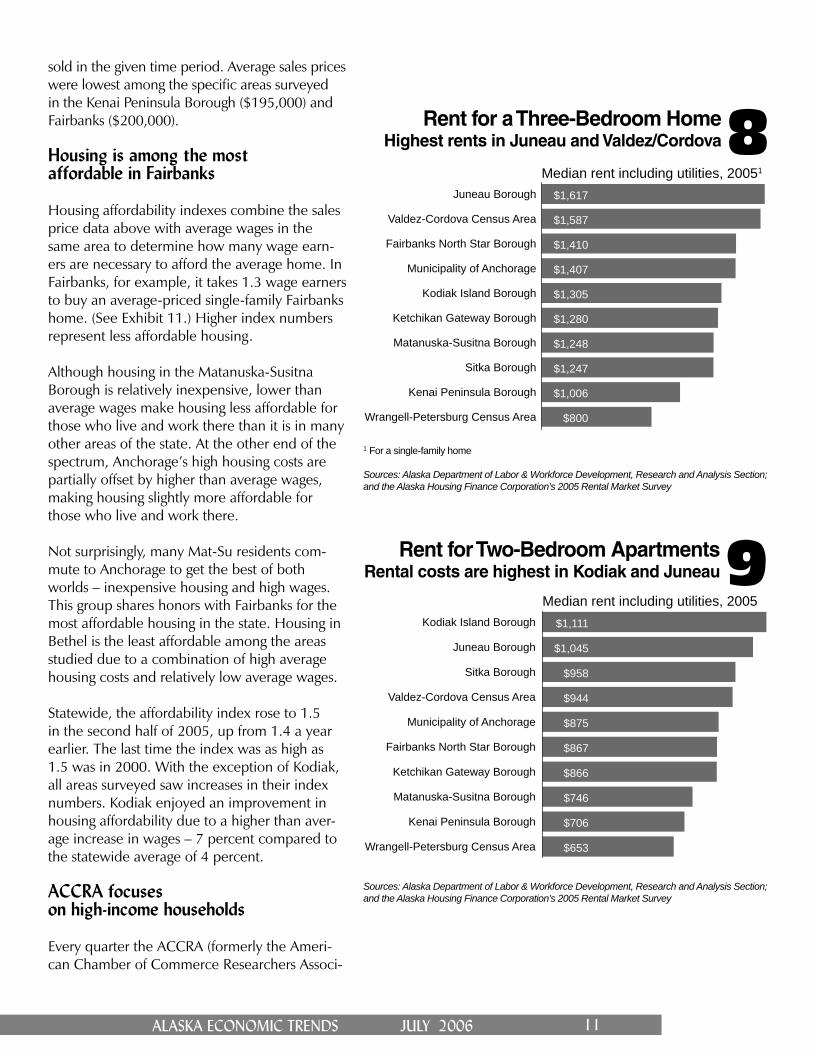
the Alaska Department of Labor & Workforce Development for the Alaska Housing Finance Corporation, shows that renting a house was most expensive in Juneau and renting an apartment was most expensive in Kodiak. (See Exhibits 8 and 9.)
According to the survey, the median rent and utilities for a three-bedroom single-fam-ily home in Juneau was $1,617, a 6 percent increase from 2004 and more than double the median cost in the Wrangell-Petersburg Census Area. Kodiak Island Borough saw the biggest increase in housing rental costs from 2004 to 2005, rising from $1,180 to $1,305 – a jump of 11 percent. Wrangell-Petersburg, the Kenai Peninsula Borough and Sitka all experienced reductions in housing rental prices and the remaining areas surveyed had moderate in-creases.
Kodiak apartment rentals also increased sub-stantially in 2005, jumping 9 percent from $1,015 to $1,111. The median rental price of a two-bedroom apartment in eight of the other nine areas surveyed increased much more modestly and in the Wrangell-Petersburg Cen-sus Area the median rent actually fell by $70.
6Rural Alaskans Pay More for FoodFood costs at home for a week, December 2005
Source: University of Alaska Fairbanks’ Cooperative Extension Service
What would $100 in 1980 equal today? The Anchorage Consumer Price Index can help determine how much money it would take today to equal a dollar amount from some earlier year. To illustrate, this equation shows how $100 in 1980 would be equal to $201 in 2005.
2005 Anchorage CPI (see Exhibit 2) 171.8= 2.01
Divided by 1980 Anchorage CPI 85.5
The 2.01 is then multiplied by the number of 1980 dollars in order to fi nd the 2005 equivalent ($100 x 2.01 = $201). Another way to describe this is to say that $100 in 1985 had the same purchasing power as $201 had in 2005.
The formula can also be reversed to defl ate current dollars to some earlier year (for example, $100 in 2005 would equal about $50 in 1980). Infl ation calculators that require only the years and a dollar amount are available at several Web sites, including ours: almis.labor.state.ak.us. (Click on “Cost of Living” in the left margin; then click on “Infl ation Calculator,” which is based on the U.S. Consumer Price Index.)
$245$227$224$203$171$171$165$159$148$136$136$135$129$125$122$118$114$111
$109
St. PaulNaknek-King Salmon
DillinghamBethelHaines
Dutch HarborCordova
HomerKodiak
SewardDelta Junction
SitkaKenai
JuneauKetchikan
AnchorageFairbanks
Mat-Su areaPortland, Ore.
Cost for a family of four, children ages 6 to 11
$0 $50 $100 $150 $200 $250
Communities

10 ALASKA ECONOMIC TRENDS JULY 2006
Juneau down to second at $281,000. (See Exhibit 10.) Strong economic growth and a shrinking in-ventory of undeveloped land help explain the 11 percent increase in Anchorage’s numbers.
It is important to recognize, however, that aver-age sales price data do not necessarily represent the average prices for an area’s total single-family housing stock, but merely the portion that was
7 The Cost of Food at Home for a Week in Eight Alaska CitiesCost for a family of four with children ages 6 to 11, 1978 to 20051, 2
Year 3 Anc
hora
ge
Fairb
anks
Perc
ent o
fA
ncho
rage
June
au
Perc
ent o
fA
ncho
rage
Bet
hel
Perc
ent o
fA
ncho
rage
Nom
e
Perc
ent o
fA
ncho
rage
Kod
iak
Perc
ent o
fA
ncho
rage
Ken
ai 4 /
Sold
otna
Perc
ent o
fA
ncho
rage
Tok
Perc
ent o
fA
ncho
rage
1978 $76.67 $84.15 110% $73.72 96% $114.05 149% $118.85 155% - - $82.48 108% - -1979 4 $82.18 $89.39 109% $74.88 91% $129.16 157% $128.67 157% - - $100.41 122% - -1980 $88.44 $90.54 102% $85.92 97% $130.87 148% $131.14 148% $99.42 112% $120.84 137% $108.82 123%1981 $86.69 $98.47 114% $93.95 108% $138.66 160% $150.27 173% - - - - $114.80 132%1982 $77.30 $92.09 119% $99.98 129% $125.50 162% $149.04 193% - - - - - -1983 $81.66 $83.79 103% $88.62 109% $128.30 157% $130.14 159% $104.94 129% $86.98 107% - -1984 $84.22 $91.26 108% $91.66 109% $136.54 162% $142.07 169% $115.97 138% $87.97 104% $121.66 144%1985 $89.06 $90.08 101% $106.61 120% $138.13 155% $152.41 171% $108.17 121% $91.47 103% $116.19 130%1986 $87.25 $90.61 104% $87.65 100% $137.96 158% $142.04 163% $105.49 121% $92.78 106% $124.18 142%1987 $88.90 $85.12 96% $88.24 99% $140.81 158% $147.96 166% $104.39 117% $96.95 109% $117.51 132%1988 $90.99 $94.74 104% $92.95 102% $137.57 151% $147.69 162% $116.68 128% $95.53 105% $119.69 132%1989 $93.80 $94.33 101% $96.73 103% $140.65 150% - - $124.61 133% $104.20 111% $139.43 149%1990 $98.73 $103.49 105% $100.86 102% $146.92 149% $155.48 157% $154.55 157% $103.21 105% $131.03 133%1991 $102.84 $114.65 111% $104.21 101% $152.49 148% $150.29 146% $127.96 124% $111.88 109% $143.45 139%1992 $100.46 $92.31 92% $102.62 102% $142.51 142% $158.08 157% $124.61 124% $109.60 109% $132.94 132%1993 $97.89 $93.42 95% $103.70 106% $147.84 151% $145.94 149% $125.19 128% $111.61 114% $136.96 140%1994 $91.32 $94.96 104% $104.09 114% $133.47 146% $140.22 154% $123.99 136% $105.51 116% $140.78 154%1995 $89.30 $93.26 104% $99.38 111% $140.68 158% $148.55 166% $123.04 138% $102.48 115% $122.89 138%1996 $101.43 $96.65 95% $96.93 96% $148.70 147% $162.61 160% $125.71 124% $105.01 104% $142.46 140%1997 $96.57 $97.73 101% $98.89 102% $150.42 156% - - $123.92 128% $104.87 109% - -1998 $98.74 $98.35 100% $103.08 104% $155.24 157% $174.27 176% $130.04 132% $104.13 105% $144.67 147%1999 $99.87 $98.52 99% $104.45 105% $163.11 163% $155.29 155% $143.81 144% $109.58 110% $132.61 133%2000 $100.89 $100.63 100% $104.55 104% $162.63 161% $157.40 156% $133.89 133% $112.01 111% $139.31 138%2001 $106.43 $103.61 97% $112.53 106% $180.89 170% $176.56 166% $140.23 132% $119.55 112% $141.73 133%2002 $100.61 $100.80 100% $110.52 110% $187.96 187% $179.76 179% $143.36 142% $119.12 118% $126.92 126%2003 $105.54 $112.77 107% $117.78 112% $186.07 176% $177.38 168% $144.13 137% $122.39 116% $126.37 120%2004 $117.33 $118.73 101% $122.48 104% $198.33 169% $183.46 156% $140.70 120% $127.38 109% $120.85 103%2005 $121.50 $123.72 102% $123.60 102% $202.08 166% $199.08 164% $147.77 122% $128.05 105% $126.03 104%
1 Sales tax included in food prices.2 A hyphen means data are unavailable.3 Data are for September of each year.4 September 1979 data for Kenai/Soldotna are not available; December 1979 data are used instead.
Source: University of Alaska Fairbanks’ Cooperative Extension Service, “Cost of Food at Home for a Week in Alaska.” The food survey can be found at www.uaf.edu/ces/fcs/index.html.
Average selling price for houses highest in Anchorage
Prices for single-family homes have skyrocketed in recent years. Another survey conducted for AHFC shows that the average sale price rose 9 percent from the second half of 2004 to the second half of 2005. For the fi rst time, Anchorage had the highest average sales price at $294,000, bumping
11ALASKA ECONOMIC TRENDS JULY 2006
sold in the given time period. Average sales prices were lowest among the specifi c areas surveyed in the Kenai Peninsula Borough ($195,000) and Fairbanks ($200,000).
Housing is among the most affordable in Fairbanks
Housing affordability indexes combine the sales price data above with average wages in the same area to determine how many wage earn-ers are necessary to afford the average home. In Fairbanks, for example, it takes 1.3 wage earners to buy an average-priced single-family Fairbanks home. (See Exhibit 11.) Higher index numbers represent less affordable housing.
Although housing in the Matanuska-Susitna Borough is relatively inexpensive, lower than average wages make housing less affordable for those who live and work there than it is in many other areas of the state. At the other end of the spectrum, Anchorage’s high housing costs are partially offset by higher than average wages, making housing slightly more affordable for those who live and work there.
Not surprisingly, many Mat-Su residents com-mute to Anchorage to get the best of both worlds – inexpensive housing and high wages. This group shares honors with Fairbanks for the most affordable housing in the state. Housing in Bethel is the least affordable among the areas studied due to a combination of high average housing costs and relatively low average wages.
Statewide, the affordability index rose to 1.5 in the second half of 2005, up from 1.4 a year earlier. The last time the index was as high as 1.5 was in 2000. With the exception of Kodiak, all areas surveyed saw increases in their index numbers. Kodiak enjoyed an improvement in housing affordability due to a higher than aver-age increase in wages – 7 percent compared to the statewide average of 4 percent.
ACCRA focuses on high-income households
Every quarter the ACCRA (formerly the Ameri-can Chamber of Commerce Researchers Associ-
8Rent for a Three-Bedroom HomeHighest rents in Juneau and Valdez/Cordova
1 For a single-family home
Sources: Alaska Department of Labor & Workforce Development, Research and Analysis Section; and the Alaska Housing Finance Corporation’s 2005 Rental Market Survey
9Rent for Two-Bedroom ApartmentsRental costs are highest in Kodiak and Juneau
Sources: Alaska Department of Labor & Workforce Development, Research and Analysis Section; and the Alaska Housing Finance Corporation’s 2005 Rental Market Survey
$1,617
$1,587
$1,410
$1,407
$1,305
$1,280
$1,248
$1,247
$1,006
$800
Juneau Borough
Valdez-Cordova Census Area
Fairbanks North Star Borough
Municipality of Anchorage
Kodiak Island Borough
Ketchikan Gateway Borough
Matanuska-Susitna Borough
Sitka Borough
Kenai Peninsula Borough
Wrangell-Petersburg Census Area
Median rent including utilities, 20051
$1,111
$1,045
$958
$944
$875
$867
$866
$746
$706
$653
Kodiak Island Borough
Juneau Borough
Sitka Borough
Valdez-Cordova Census Area
Municipality of Anchorage
Fairbanks North Star Borough
Ketchikan Gateway Borough
Matanuska-Susitna Borough
Kenai Peninsula Borough
Wrangell-Petersburg Census Area
Median rent including utilities, 2005

12 ALASKA ECONOMIC TRENDS JULY 2006
ation) Cost of Living Index provides comparisons of living costs for about 300 urban areas in the United States. ACCRA looks at costs for profes-sional and managerial households with incomes in the top 20 percent for the area.
In recent years ACCRA data have consistently shown that for this specifi c group of house-holds, Alaska cities are from 15 percent to 33 percent more expensive than the average of all cities surveyed. For the fi rst quarter of 2006, the four Alaska cities covered by AC-CRA ranged from about 17 percent to about 33 percent more expensive than the average city. (See Exhibit 12.)
ACCRA data are collected by organizations in the cities that volunteer to participate and meet certain minimum standards. As a result, there is more room for error than in some surveys and ACCRA encourages users not to use percentage differences as exact measures. This may partly explain why ACCRA data show that Fairbanks housing costs exceed those for Anchorage, despite the fact that the AHFC data discussed above show that Fairbanks housing is signifi -cantly less expensive than Anchorage’s.4
Runzheimer looks at lower-income households
The Runzheimer Plan of Living Cost Standards provides useful information about households on the lower end of the income spectrum.5 Runz-heimer data are designed to show how much more or less it would cost in different cities to maintain the standard of living a specifi c income level would provide in a standard U.S. city. The data show that maintaining the living standards of a household with $32,000 in income in the standard city would require $40,289 in Juneau, $36,884 in Anchorage, and $34,645 in Fair-banks. (See Exhibit 13.)
4 There are other possible explanations based on the surveys’ dif-ferent target groups and methodologies, but it seems likely that at least part of the reason for the unusually high Fairbanks housing costs is survey error, given all of the other available housing cost data. 5 The Alaska Department of Labor’s Workers’ Compensation Divi-sion contracts with Runzheimer International to survey geographic cost differentials for households with specifi c annual incomes every two years in order to equalize workers’ compensation pay-ments.
10 The Cost of Single-Family HomesPrices in Anchorage surpass Juneau
$294,000
$281,000
$249,000
$238,000
$232,000
$215,000
$214,000
$202,000
$200,000
$195,000
Anchorage
Juneau
Statewide
Bethel
Ketchikan
Mat-Su
Kodiak
Rest of State
Fairbanks
Kenai PeninsulaBorough
Average sales prices for July to December 2005
Sources: Alaska Department of Labor & Workforce Development, Research and Analysis Section; and the Alaska Housing Finance Corporation’s 2005 Survey of Lender’s Activity
11Housing AffordabilityWage earners needed to buy average house
1.3
1.3
1.4
1.5
1.6
1.6
1.7
1.8
1.8
2.2
Fairbanks
Kenai PeninsulaBorough
Alaska
Anchorage
Kodiak
Mat-Su
Juneau
Ketchikan
Bethel
For July to December 2005
Anchorage workerbuys a Mat-Su house
Sources: Alaska Department of Labor & Workforce Development, Research and Analysis Section; and the Alaska Housing Finance Corporation’s 2005 Alaska Affordability Index

13ALASKA ECONOMIC TRENDS JULY 2006
12Professional and Managerial Households with Incomes in the Top 20%ACCRA1 Cost of Living Index for selected cities, First Quarter 2006
Region City
ItemsIndex
CostsGrocery
Items Housing UtilitiesTranspor-
tationHealth
Care
Misc.Goods and
Services
Anchorage 117.4 125.2 122.6 88.2 102.0 135.1 121.1 Fairbanks 124.1 123.9 130.7 139.3 106.7 135.8 118.3 Juneau 132.6 140.0 146.3 130.6 116.7 151.2 121.9 Kodiak 126.4 145.9 125.7 129.0 128.7 135.3 117.4
West Seattle 116.3 110.0 136.8 93.6 108.7 117.1 110.6 Vancouver, Wash. 97.9 92.7 95.8 83.9 104.5 111.8 102.1 Los Angeles-Long Beach 158.2 135.8 271.7 102.9 115.0 116.6 108.7 San Francisco 170.6 145.3 283.9 86.6 112.0 126.9 135.1 Las Vegas 106.1 96.7 123.1 116.4 107.8 102.3 93.2
Southwest/Mountain Boise, Idaho 98.0 93.6 89.3 92.7 98.8 102.2 107.5 St. George, Utah 98.2 93.4 102.5 77.7 92.4 89.7 105.1 Phoenix 103.8 99.1 113.4 90.4 101.4 100.8 102.7 Denver 100.4 103.7 106.7 94.3 94.7 102.5 97.1 Dallas 95.8 105.8 78.4 119.1 102.6 99.7 97.0
Midwest Rochester, Minn. 99.7 88.9 89.5 128.1 97.6 103.8 103.9 Cleveland 98.0 106.4 92.0 112.4 99.1 100.9 95.0 Chicago 111.9 109.4 133.5 107.2 105.2 107.5 99.3
Southeast Orlando, Fla. 102.9 94.9 108.0 91.2 107.0 94.4 104.8 Montgomery, Ala. 95.1 92.9 89.0 98.5 98.8 87.1 99.6 Atlanta 97.5 97.8 96.3 86.2 102.0 101.2 99.9 Raleigh, N.C. 93.1 101.1 75.9 95.7 100.1 118.1 98.3
Atlantic/New England New York City - Manhattan 201.2 144.6 373.6 135.1 108.6 127.8 138.2 Boston 133.6 112.6 163.2 126.0 111.5 130.4 126.4 Philadelphia 124.0 123.7 144.7 115.2 110.0 115.9 115.1 Note: Index numbers represent a comparison to the average for all cities studied. For example, 117.4 means that city has 17.4 percent higher costs than the average.
1 ACCRA, founded in 1961 as the American Chamber of Commerce Researchers Association, is a nonprofi t professional organization. The ACCRA Cost of Living Index’s stated purpose is to compare the cost of maintaining a standard of living appropriate for moderately affl uent professional and managerial households. It has been published quarterly since 1968.
Source: ACCRA Cost of Living Index
Compared to the ACCRA survey, the percentage difference between Alaska cities and the respec-tive averages for cities covered is not dramati-cally different with the exception of Fairbanks where the 24 percent ACCRA difference shrinks to 8 percent in the Runzheimer data. Of the three cities studied, Juneau’s relatively low-in-come households face the highest costs.
The military’s cost-of-living index
In order to roughly equalize payments to military personnel, the Department of Defense produces a cost-of-living index for areas where troops are or may be stationed outside the Lower 48. (See Exhibit 14.) The index com-pares prices for about 120 goods and services,

14 ALASKA ECONOMIC TRENDS JULY 2006
13 Gap is Smaller for Low-Income HouseholdsRunzheimer Plan of Living Cost Standards, December 20041
TotalCosts
Percent ofStandard
City Taxation
Percent ofStandard
CityTrans-
portation
Percent ofStandard
City Housing
Percent ofStandard
City
Misc.Goods
andServices
Percent ofStandard
City
Alaska Composite 37,273 116.5% 2,448 77.4% 4,648 106.5% 18,972 135.2% 12,572 110.4%
Anchorage 36,884 115.3% 2,448 77.4% 4,759 109.0% 18,648 132.9% 12,503 109.8% Fairbanks 34,645 108.3% 2,448 77.4% 4,668 106.9% 16,458 117.3% 12,606 110.7% Juneau 40,289 125.9% 2,448 77.4% 4,517 103.5% 21,812 155.4% 12,606 110.7%
West Astoria, Ore. 33,802 105.6% 3,390 107.2% 4,367 100.0% 16,386 116.8% 11,383 99.9% Bellingham, Wash. 35,976 112.4% 2,448 77.4% 4,684 107.3% 17,835 127.1% 11,836 103.9% Corvalis, Ore. 33,880 105.9% 3,390 107.2% 4,358 99.8% 16,458 117.3% 11,398 100.1% Hilo, Hawaii 36,636 114.5% 3,123 98.7% 5,582 127.9% 16,207 115.5% 12,931 113.5% Lakeport, Calif. 41,802 130.6% 2,448 77.4% 5,272 120.8% 22,993 163.8% 12,141 106.6% Los Angeles 57,446 179.5% 2,448 77.4% 6,488 148.6% 36,888 262.8% 12,556 110.2% Yakima, Wash. 31,293 97.8% 2,448 77.4% 4,680 107.2% 13,188 94.0% 11,836 103.9%
Southwest/Mountain Cody, Wyo. 27,961 87.4% 2,448 77.4% 4,539 104.0% 11,305 80.5% 10,850 95.3% El Paso, Texas 27,649 86.4% 2,448 77.4% 4,643 106.4% 11,035 78.6% 10,746 94.3% Flagstaff, Ariz. 34,974 109.3% 2,719 86.0% 4,670 107.0% 16,753 119.4% 11,815 103.7% Jackson, Wyo. 51,455 160.8% 2,448 77.4% 4,539 104.0% 34,691 247.2% 10,850 95.3% Lewiston, Idaho 30,521 95.4% 2,790 88.2% 4,482 102.7% 13,822 98.5% 10,551 92.6% Reno, Nev. 35,262 110.2% 2,448 77.4% 4,953 113.5% 17,147 122.2% 11,584 101.7% Provo, Utah 30,676 95.9% 3,175 100.4% 4,660 106.8% 12,755 90.9% 11,122 97.6%
Midwest Grand Rapids, Minn. 30,360 94.9% 2,583 81.7% 4,960 113.6% 13,228 94.3% 10,930 96.0% Lansing, Mich. 36,102 112.8% 2,744 86.8% 5,535 126.8% 17,717 126.2% 11,236 98.6% Oklahoma City 28,317 88.5% 3,215 101.6% 4,548 104.2% 10,316 73.5% 11,068 97.2% Springfi eld, Mo. 27,588 86.2% 3,215 101.6% 4,509 103.3% 9,756 69.5% 11,142 97.8%
Southeast Nashville, Tenn. 28,806 90.0% 2,448 77.4% 4,168 95.5% 11,703 83.4% 11,195 98.3% New Orleans 30,524 95.4% 3,091 97.7% 5,475 125.4% 12,033 85.7% 10,924 95.9% West Palm Beach, Fla. 37,478 117.1% 2,448 77.4% 5,433 124.5% 19,155 136.5% 11,559 101.5% Wilmer, Ala. 27,471 85.8% 3,433 108.5% 4,211 96.5% 10,313 73.5% 10,692 93.9%
Atlantic/New England Boston 48,062 150.2% 3,241 102.5% 6,361 145.7% 27,570 196.4% 12,335 108.3% Elmira, N.Y. 29,160 91.1% 3,099 98.0% 4,659 106.7% 11,303 80.5% 11,036 96.9% Trenton, N.J. 45,624 142.6% 2,754 87.1% 5,453 124.9% 27,391 195.2% 11,436 100.4%
1 Runzheimer International is a private consultant that provides geographic cost compaisons on a contract basis. The data in this exhibit were produced by Runz-heimer for the Alaska Department of Labor’s Workers’ Compensation Division for the purpose of equalizing workers’ compensation payments. Runzheimer’s Web site is www.runzheimer.com.
Source: Runzheimer International
including food, clothing, personal care, vehi-cles, transportation, medical care and utilities. The index does not include housing, which is treated separately by the military with specifi c housing allowances for different locations. It also does not cover taxes or insurance.
The military index is a helpful addition to the library of Alaska cost-of-living information
because it includes data for so many Alaska locations – 27 in 2006 – and also because it is updated frequently. For the goods and services included in the index, Barrow, Bethel, Dill-ingham, Galena, Kotzebue, Metlakatla, Nome and Wainwright had the highest prices. Wasilla had the lowest prices, with Anchorage a close second. Fairbanks and Juneau were also rela-tively inexpensive, confi rming that goods and

15ALASKA ECONOMIC TRENDS JULY 2006
14Military Cost-of-Living AllowancesOCONUS1 Index, Alaska 2006
Location Index
Anchorage 122Barrow 152Bethel 152Clear Air Station, USAF (south of Nenana) 124College (near Fairbanks) 124Cordova 134Delta Junction 126Dillingham 152Fairbanks 124Galena 152Homer 134Juneau 128Kenai/Soldotna 134Ketchikan 138Kodiak 128Kotzebue 152Metlakatla 152Nome 152Petersburg 138Seward 134Sitka 136Spruce Cape (on Kodiak Island) 128Tok 132Unalaska 128Valdez 134Wainwright 152Wasilla 120
1 OCONUS is an acronym for Outside the Continental U.S.; Alaska is counted as an OCONUS location.
Source: Department of Defense, as posted in June 2006
services are generally cheaper in the state’s population centers.
Geographic pay for state workers
A 1986 study of geographic cost differences done by the McDowell Group, a research and consulting fi rm, is still used in state workers’ salary schedules and, though dated, remains helpful for the general information it gives on cost-of-living differences around the state. (See Exhibit 15.) The study’s authors noted that the areas studied fell into distinct groups, with the least expensive group consisting of the larger urban communities and the most expensive consisting of remote, small communities and villages with minimal retail development, small but expensive housing and a lack of ground transportation access. The same factors cer-tainly apply 20 years later.
Federal COLA is changing
For decades, most federal workers in Alaska have received a 25 percent tax-free cost-of-living adjustment. Originally, the fi gure was based on the cost differences between living in Washington, D.C., and Alaska, but over time the number became less and less defensible on economic grounds.
After years of study, the federal government has decided to phase out the fl at 25 percent supplement and replace it with more specifi c locality supplements. Eventually, federal work-ers in Anchorage will receive a 14 percent supplement, Fairbanks 16 percent and Juneau 18 percent.6 The new percentages are based on surveys conducted in 2003 and will apply to all areas within a 50 mile radius of the three communities. All other areas of the state will continue to receive the 25 percent supple-ment.
The percentages will be updated every three
6 Federal workers will have their supplemental pay reduced by a percentage point a year until the new percentages are reached.

16 ALASKA ECONOMIC TRENDS JULY 2006
15 Geographic Pay Differential 1State of Alaska
Cost-of-LivingDifferential
Aleutian Islands 112Aniak, Galena and McGrath 130Anchorage 100Barrow and Kotzebue 142Bethel 138Bristol Bay 127Cook Inlet and Kenai 100Cordova, Glennallen and Valdez 111Delta Junction and Tok 116Fairbanks 104Fort Yukon 142Haines, Skagway and Yakutat 105Juneau 100Ketchikan 100Kodiak 109Nenana 120Nome 134Palmer and Wasilla 100Seward 100Sitka 100Wade Hampton Census Area 130Wrangell and Petersburg 100
1 Based on a 1986 McDowell Group study
Source: Alaska Department of Administration
years based on new survey information and since a new round of surveys is currently be-ing conducted, they could change in the near future. There is also the possibility of delay in implementation since some of the affected federal employees have sued to prevent the planned changes from going forward.
Alaska is still expensive – but less so than it used to be
Each of the many surveys and studies discussed in this article provides useful information about the cost of living in Alaska. Taken as a whole, they clearly indicate that it generally costs more to live in Alaska than in the average U.S. city.
Alaska Cost-of-Living Information on the Internet
Aside from the information in the preceding article, there are Web sites that can provide quick cost-of-living comparisons. Most of the data provide little detail but the Web sites can be a handy quick reference.
The Alaska Department of Labor & Workforce Devel-opment’s relocation site offers cost-of-living informa-tion, plus general information about Alaska, the state’s employment opportunities and traveling to Alaska.
labor.state.ak.us/research/relocate/relocmap.htm
The U.S. Department of Labor’s Bureau of Labor Sta-tistics’ Consumer Price Index site provides CPI data for Anchorage and other areas throughout the U.S., as well as general, technical and research information on the index. The site also has an infl ation calculator.
www.stats.bls.gov/cpi/home.htm
Other private Web sites include ACCRA, which was mentioned in the preceding article, and CityRating.com. www.cityrating.com/costofl iving.asp www.accra.org
17ALASKA ECONOMIC TRENDS JULY 2006
otal nonfarm wage and salary employment rose by 12,800 in May to 318,400. About a third of the job increase came from the leisure and
hospitality sector, where there was large seasonal hiring in both the accommodations and food and drink industries. Construction and retail trade also saw signifi cant increases, adding a combined total of 3,600 jobs in May.
Over-the-year comparisons show that the oil and gas industry has added 1,000 jobs since May 2005, for a robust 12 percent growth rate over the 12-month period. The industry’s 9,400 jobs in May were approaching levels not seen since 2001. Signifi cant new development is occurring at satellite fi elds and development efforts have picked up due at least partly to several consecutive years of high oil prices.
All the state’s major employment sectors at least matched May 2005’s job count and most are up moderately. Two industries that bear watching in the coming months are construction and health care. Both continue to show over-the-year growth, but in smaller amounts than the last several years. Construction was up just 300 jobs from May 2005 to May 2006 and health care was up 500 jobs over the same period after both recorded average annual job increases of 900 in 2005.
Alaska’s unemployment rate fell six-tenths of a percentage point in May to 6.9 percent,
according to the Alaska Department of Labor & Workforce Development. The decline was typical for May, a month when a signifi cant number of unemployed workers fi nd jobs in the state’s seasonal industries.
Despite the expected seasonal decline, the unemployment rate has begun to creep higher when compared to year-ago rates. After consistent, gradual declines for more than two years, the rate rose above its year-ago level in March by two-tenths of a percentage point. The gap widened to four-tenths of a percentage point in April and May’s 6.9 percent rate is fi ve-tenths of a percentage point higher than May 2005’s 6.4 percent rate.
The unemployment rate remains relatively low by historical standards, however, and the over-the-year increases are small enough to be of questionable signifi cance until several more months of data become available.
Anchorage’s unemployment rate fell three-tenths of a percentage point in May to 5.6 percent, and Fairbanks’ rate fell seven-tenths of a percentage point to 5.8 percent. Both cities’ May rates were four-tenths of a percentage point higher than in May 2005. Juneau’s rate fell six-tenths of a percentage point in May to 4.7 percent, matching May 2005’s rate. The Denali Borough had the state’s lowest rate in May at 4.3 percent and the Wade Hampton Census Area had the highest at 22.6 percent.
Employment Scene By Dan RobinsonEconomist
Oil and gas jobs up 1,000 over the year
T

18 ALASKA ECONOMIC TRENDS JULY 2006
1 Nonfarm Wage and SalaryEmployment Preliminary Revised Revised Changes from:
Alaska 5/06 4/06 5/05 4/06 5/05
Total Nonfarm Wage and Salary 1 318,400 305,600 313,300 12,800 5,100Goods-Producing 2 41,300 38,900 39,800 2,400 1,500Service-Providing 3 277,100 266,700 273,500 10,400 3,600Natural Resources and Mining 11,700 11,700 10,500 0 1,200 Logging 500 400 600 100 -100 Mining 11,300 11,200 9,900 100 1,400 Oil and Gas 9,400 9,400 8,400 0 1,000Construction 19,300 17,100 19,000 2,200 300Manufacturing 10,300 10,100 10,300 200 0 Wood Product Manufacturing 300 300 400 0 -100 Seafood Processing 6,200 6,300 6,300 -100 -100Trade, Transportation, Utilities 65,900 62,000 64,800 3,900 1,100 Wholesale Trade 6,500 6,300 6,400 200 100 Retail Trade 37,100 35,700 36,200 1,400 900 Food and Beverage Stores 6,400 6,200 6,300 200 100 General Merchandise Stores 9,200 9,100 9,000 100 200 Transportation, Warehousing, Utilities 22,300 20,000 22,200 2,300 100 Air Transportation 6,400 5,900 6,300 500 100 Truck Transportation 3,200 3,000 3,100 200 100Information 7,000 6,900 7,000 100 0 Telecommunications 4,200 4,100 4,200 100 0Financial Activities 15,000 14,600 14,700 400 300Professional and Business Services 24,300 23,000 24,100 1,300 200Educational 4 and Health Services 36,400 36,300 35,900 100 500 Health Care 26,300 26,100 25,800 200 500Leisure and Hospitality 32,800 28,500 32,400 4,300 400 Accommodations 8,600 6,500 8,500 2,100 100 Food Services and Drinking Places 19,700 18,000 19,400 1,700 300Other Services 11,600 11,500 11,300 100 300Government 84,100 83,900 83,300 200 800 Federal Government 5 17,000 16,500 17,100 500 -100 State Government 24,900 25,200 24,500 -300 400 State Government Education 6 7,500 8,000 7,000 -500 500 Local Government 42,200 42,200 41,700 0 500 Local Government Education 7 24,400 24,300 24,200 100 200 Tribal Government 3,900 3,800 3,900 100 0
Notes for all exhibits on this page:1 Excludes self-employed workers, fi shermen, domestic workers, unpaid family workers and nonprofi t volunteers2 Goods-producing sectors include natural resources and mining, construction and manufacturing.3 Service-providing sectors include all others not listed as goods-producing sectors.4 Private education only5 Excludes uniformed military6 Includes the University of Alaska7 Includes public school systems8 Metropolitan Statistical Area
Sources for all exhibits on this page: Alaska Department of Labor & Workforce Development, Research and Analysis Section; and the U.S Bureau of Labor Statistics
3 Nonfarm Wage and Salary EmploymentBy Region
Preliminary Revised Revised Changes from: Percent Change: 5/06 4/06 5/05 4/06 5/05 4/06 5/05
Anch/Mat-Su (MSA) 8 168,500 164,700 165,200 3,800 3,300 2.3% 2.0% Anchorage 150,000 147,200 147,200 2,800 2,800 1.9% 1.9%Gulf Coast 29,150 26,700 29,050 2,450 100 9.2% 0.3%Interior 47,700 44,000 47,100 3,700 600 8.4% 1.3% Fairbanks 39,300 37,400 39,000 1,900 300 5.1% 0.8%Northern 16,700 16,650 15,850 50 850 0.3% 5.4%Southeast 38,550 35,650 38,300 2,900 250 8.1% 0.7%Southwest 17,650 17,650 17,950 0 -300 0.0% -1.7%
2 Unemployment RatesBy borough and census area
Prelim. Revised RevisedNOT SEASONALLY ADJUSTED 5/06 4/06 5/05United States 4.4 4.5 4.9Alaska Statewide 6.9 7.5 6.4Anchorage/Mat-Su (MSA) 8 5.9 6.3 5.4 Municipality of Anchorage 5.6 5.9 5.2 Mat-Su Borough 7.2 8.4 6.5Gulf Coast Region 8.4 9.5 8.0 Kenai Peninsula Borough 8.0 9.7 7.7 Kodiak Island Borough 10.3 7.6 8.8 Valdez-Cordova Census Area 8.7 10.7 8.5Interior Region 6.5 7.3 5.9 Denali Borough 4.3 10.6 4.2 Fairbanks North Star Borough (MSA) 8 5.8 6.5 5.4 Southeast Fairbanks Census Area 9.4 10.8 9.5 Yukon-Koyukuk Census Area 13.2 13.6 11.2Northern Region 11.2 11.1 11.4 Nome Census Area 13.2 13.6 12.0 North Slope Borough 8.6 8.0 9.7 Northwest Arctic Borough 12.0 11.6 12.5Southeast Region 6.3 7.5 6.0 Haines Borough 7.4 11.6 8.2 Juneau Borough 4.7 5.3 4.7 Ketchikan Gateway Borough 5.9 7.4 6.1 Prince of Wales-Outer Ketchikan CA 12.9 14.9 10.8 Sitka Borough 5.5 5.7 4.7 Skagway-Hoonah-Angoon CA 9.9 18.1 8.5 Wrangell-Petersburg Census Area 9.5 10.5 9.3 Yakutat Borough 7.6 11.8 7.7Southwest Region 14.0 13.7 12.8 Aleutians East Borough 12.3 8.0 14.2 Aleutians West Census Area 10.7 7.4 9.5 Bethel Census Area 15.1 14.6 13.3 Bristol Bay Borough 7.0 16.7 4.9 Dillingham Census Area 11.8 12.0 11.5 Lake and Peninsula Borough 5.7 6.8 7.2 Wade Hampton Census Area 22.6 23.8 19.8SEASONALLY ADJUSTED United States 4.6 4.7 5.1 Alaska Statewide 7.1 7.0 6.6
For more current state and regional employment and unemployment data, visit our Web site.
almis.labor.state.ak.us

19ALASKA ECONOMIC TRENDS JULY 2006
Training for Jobs in the Energy Industry By Susan Erben Trends Editor
“It is a very powerful thing for me to see…”
he morning of March 27, 2006, Laura Lynn Welles met with 22 high school students in Mountain Village (pop. 786), 95 miles northwest of
Bethel. That afternoon she met with 15 more students. The next day it was eight students and their teacher, and then eight students volun-teered to meet with her one-on-one. The next day she fl ew 50 miles northwest to Emmonak (pop. 740), 10 miles from the Bering Sea, and spoke to 67 high school students. The day after that she met with 40 students and gave a Power Point presentation to 26. And that was just in the end of March.
Welles, like the Alaska Department of Labor & Workforce Development’s six other “career guides,” is on a crusade – a crusade to tell as many students and their teachers, parents and siblings not only about the growing number of energy jobs in Alaska, but how to get them. They’re showing the students how to prepare themselves in high school now so they’ll be competitive enough to get an apprenticeship,
Tan internship or into training that will give them a craft, a job and a future.
The state’s seven career guides are jobs that were created as part of a $7 million “High-Growth Job Training Initiative for Energy” grant the U.S. Department of Labor gave the Alaska Department of Labor last year. The money is for training Alaska adults and youth for jobs in oil, gas and mining, plus jobs in the industries that support oil, gas and mining – construction, and marine, pipeline and trucking transporta-tion.
The purpose of the grant is to develop innova-tive ways the Alaska Department of Labor and other training providers can work hand-in-hand with industry and the state’s educational system to get people trained for Alaska’s economic op-portunities, said Corine Geldhof, director of the Alaska Department of Labor’s Division of Busi-ness Partnerships.
Geldhof said the grant is part of President Bush’s push to get Ameri-cans trained for jobs in high-growth fi elds such as energy at a time when baby boomers are retiring and the demand for workers trained with industry-recognized skills is increasing.
She said the growth in Alaska’s energy industry,
Phot
o by
Kay
lene
Joh
nson
, Ala
ska
Wor
ks P
artn
ersh
ip I
nc.
Instructor David Lipp of Anchorage (right) shows Derrick Andrews of Aleknagik (far left) and Evan Ishnook of Kokhanok the controls of the tractor trailer they learned to drive during Alaska Works Partner-ship’s youth construction academy held June 5-16 in King Salmon.

20 ALASKA ECONOMIC TRENDS JULY 2006
coupled with the state’s aging work force, will leave a tremendous gap if Alaskans aren’t trained for those jobs.
In some trade occupations, more than 50 per-cent of the workers are 45 or older, said Margie Germain-Antrim, a Business Partnerships pro-gram coordinator. Even at AVTEC,1 the state’s major vocational training facility, the average student is in his or her early 30s. The U.S. Department of Labor announced the grant in July 2005 and, after negotiations, the money arrived in November. The year-long grant is due to end this November, but Geldhof said she’ll ask for a time extension until June 2007. The extension would allow the Alaska Department of Labor to align its activities with the education system’s calendar and serve more Alaska youth, she said. (The grant is in addi-tion to the roughly $20 million that Alaska gets each year from the U.S. Department of Labor to develop its work force, according to Alaska Department of Labor offi cials.)
Every “product” that comes out of the $7 million – such as a class curriculum, program blueprints, “best practices” summaries and vocational training models – becomes the federal agency’s property and will be posted on the Internet for other cities and states to use.
“It’s not just business as usual,” she said. “They’re saying, ‘Show us how you get industry to the table, how you’re doing work force development in innovative ways.’ And we can’t do our job without bringing economic development to the table, and education reform,” Geldhof said.
□ □ □
Nick Grubich, the principal at Mountain Vil-lage School, said he saw a difference in the high schoolers there after Welles, Bethel’s career guide, had worked with them and Paul Ancell, a vocational counselor at Anchorage’s Muldoon Job Center, had held a video conference with them from Anchorage to interpret their answers to a career-interest survey.
1 Alaska Vocational Technical Center in Seward
“It is a very powerful thing for me to see when these kids are actually thinking and talking about their future,” Grubich said in an email to the Bethel Job Center manager. “There was general excitement and an eager willingness on the part of the students to stay and listen well after the dismissal bell rung, very unusual for our kids.”
Under formal agreements with six school districts, the career guides work in the schools – most have offi ce space there – with students individually and in groups, and with school counselors, on everything from a good work ethic to what construction apprenticeships are like and how to use AKCIS, the Alaska Depart-ment of Labor’s career information system database.
Many of the career guides worked in the state’s job centers before taking the new positions, said Ken Mill, an assistant director of the Department of Labor’s Employment Security Division, which received $1.7 million of the energy grant to pay for the career guides and other programs. School districts in Bethel, Mat-Su, Juneau, Fairbanks and the Kenai Peninsula have the equivalent of one career guide each; Anchorage has two, he said.
Mill said his division is also hiring a student intern at each of the six school districts. Each career guide and the staff at the local job center will train the intern so he or she can help fellow students research career options. The interns are working up to four hours a day during school and full-time at a nearby job center in the sum-mer, Mill said. So far, interns are in place at all but two of the six school districts, he said.
The department has also set up three other posi-tions to work under the grant called “industry liaisons.” They work directly with industry em-ployers to create internships, opportunities for on-the-job training (where the Department of Labor subsidizes up to 50 percent of an employ-ee’s pay, usually for three to six months), and teacher “externships” (where teachers work in the industry, usually for a week or two, so teach-ers can relay what they’ve learned fi rst-hand in an industry to their students), Mill said.

21ALASKA ECONOMIC TRENDS JULY 2006
Jeff Burton, who has a mining background, and Traci Felton, a job center employment special-ist, both work out of Anchorage’s Midtown Job Center as the industry liaisons. Gail Phillips, the former speaker of the House, worked as a third liaison from January through June. Mill said she was critical in establishing connections with the energy industry.
ESD’s $1.7 million is also going toward “fast track[ing] the public work force system’s change to a market-driven, industry centered one-stop system that is responsive to state and local economic needs,” according to the division’s formal agreement with Business Part-nerships. Mill said that includes identifying an “apprentice point person” in each of the state’s 24 job centers who knows everything there is to know about the 200 apprenticeship pro-grams in the state, 28 of which are trade union programs involving numerous employers. The rest are small-business programs.
It also includes support for two mobile job cen-ters – a 32-foot van with three laptops based out of Anchorage to travel the state’s road system and a 20-foot one for Southeast to travel to cit-ies and villages on the Alaska Marine Highway System. The Anchorage-based van has been on the road since April; the Southeast van will be up and running this summer, Mill said.
He said the fast-tracking also means working more with other state agencies, Native corpo-rations, labor unions and employers. He cited some examples: A vocational counselor and a job training specialist from Anchorage’s Mul-doon Job Center each work out of the Cook Inlet Tribal Council’s headquarters two days a week; the Department of Labor is working with the Aleutian Pribilof Islands Association to train them on ALEXsys, the department’s new online job seeker/work force services system; and ESD has a Department of Education representative at its meetings to design “tech prep” type courses for the schools (where high school vocational classes are aligned with apprenticeship and uni-versity requirements).
Mill said ESD is also using the $1.7 million for individual training accounts, which is money
the division pays to help people in apprentice or other training programs with everything from tool belts and training tuition to travel, food and housing. Some of the mini-grants are between $50 and $100, but most range from $1,800 to $3,200, he said.
A big chunk of the $7 million grant – $1.35 million – is going to the nonprofi t Alaska Works Partnership Inc. for its job-training programs,
Laura Wassillie of Kokhanok tries her hand at driving a 17,000-pound Kenworth tractor trailer at Alaska Works Partnership’s youth construction academy June 5-16 in King Salmon. She had never driven a car before the construction driving course – now she has a driver’s license and, after a year, can apply for a commercial driver’s license. In the meantime, she’ll be qualifi ed to work as a fl agger.
Phot
o by
Kay
lene
Joh
nson
, Ala
ska
Wor
ks P
artn
ersh
ip I
nc.

22 ALASKA ECONOMIC TRENDS JULY 2006
including its one- to three-week construction academies. In May and June, union trainers instructed 60 17- to 24-year-olds in carpentry, electricity and construction driving at academies in St. Mary’s, King Salmon, Klawock, Ninilchik and Anchorage. Alaska Works, in conjunction with school districts, Native corporations and other groups, set up the academies. Eighty to 90 percent of the students will likely land jobs in those industries, and some of those might ap-ply for other trade apprenticeship positions, an Alaska Works spokeswoman said.
Other Alaska Works programs include Women in the Trades and an apprentice program geared toward people living in Alaska’s villages. Alaska Works is also affi liated with Helmets to Hard-hats, a nonprofi t that connects retired military with apprenticeship slots, offi cials said. Mill said many of ESD’s mini-grants are channeled through Alaska Works.
Business Partnerships awarded $860,000 of the $7 million energy grant to 14 school districts, nonprofi ts and industry associations that came up with innovative ways to train youth and adults or to show them what’s out there as far as train-ing, said Business Partnerships’ Germain-Antrim. She said her division initially awarded “plan-ning grants” of up to $15,000 each – $110,000 total – to 17 groups, which gave the groups six weeks to plan their grant proposals. Then in April, Business Partnerships awarded the $860,000 in “implementation grants” ranging from $25,000 to $90,000 each to the 14 groups.
Germain-Antrim said most of the groups that received the planning grants, as well as career guides, industry liaisons and job center manag-ers, met in Anchorage in February for a week-long conference with industry experts from oil and gas, construction, transportation and min-ing, and educators from schools and training providers throughout the state.
“It was incredible,” Germain-Antrim said. “We learned [from industry] what they look for, how their industry works, where their biggest demand is, where they see their industry is going.” (She said they learned from VECO representatives, for instance, the company has hired every avail-
able graduate from Charter College’s condensed autoCAD drafting program.)
Business Partnerships awarded two of the 14 grants to the Matanuska-Susitna Borough School District, including one for $25,000 for a construction trades academy held in June for 14 Alaska vocational and math teachers. They learned real-world construction applications of what they’re teaching, among other things, Germain-Antrim said.
Alaska Process Industry Careers Consortium received a $59,000 grant for teacher extern-ships, where 12 middle and high school teachers worked for two weeks alongside workers in the oil and gas, mining and construction industries at the Pebble mine project, Fort Knox and on the North Slope. Now the teachers will be able to pass on their experiences to their students, Ger-main-Antrim said. Using APICC’s estimate that urban school teachers work with 130 students a day, those teachers could reach 1,560 kids.
The Alaska Hospitality Alliance was awarded $33,000 to work with rural school districts in training 100 Alaskans ages 16 to 24 via video-conferencing for employment in the Alaska hospitality industry. The Alliance is targeting youth and young adults in villages who haven’t had the chance to learn employment skills or get job experience, the fi rst step on the road to jobs in the energy and other industries, an Alliance spokeswoman said. Once students fi nish their training next year – three hours a week for two semesters – they’ll be in excellent standing to apply for jobs at hotels the Alliance is working with in Denali National Park and elsewhere in the state, she said.
Of the rest of the $7 million energy grant, $413,300 is going to AVTEC in Seward for a state-of-the-art maritime fi refi ghting simulator, other equipment and programs, and $110,000 is going to Kenai Peninsula College’s Mining and Petroleum Training Service for mine training classes. Roughly $2.9 million is held in reserve for continuing many of the same programs in the state fi scal year 2007 (July 1, 2006, to June 30, 2007), offi cials said.

23ALASKA ECONOMIC TRENDS JULY 2006
Workers’ Compensation RequirementsThe Alaska Workers’ Compensation Act requires all employers with one or more employees in Alaska to have workers’ compensation insurance, unless the employer has at least 100 employees and has been approved as a self-insurer.
Employers purchase workers’ compensation insurance from commercial insurance carriers. Once employers have insurance, they’re required to post in their workplaces an Employer’s Notice of Insurance, which insurance companies provide. Employers must also submit proof of insurance to the Workers’ Compensation Division, the administrative arm of the Workers’ Compensation Board.
Executive offi cers of for-profi t corporations are required to have workers’ compensation insurance unless they choose to waive coverage by fi ling a waiver with the division.
If employers are unable to obtain insurance coverage from a commercial carrier, they can purchase insurance through a state assigned risk pool. And if employers feel their insurance premium is too high, they can request arbitration.
For more information or forms, call the Workers’ Compensation Division at (907) 465-2790 or visit the division’s Web site at www.labor.state.ak.us/employer/employer.htm and click on “Workers’ Compensation.” On the Workers’ Compensation page, the “Forms” and “Employer Information” links under “Quick Links” on the right are particularly helpful.
Employer Resources
Trends Authors
Neal Fried, a Department of Labor economist in An-chorage, specializes in the Anchorage/Mat-Su region’s employment, earnings and the cost of living. To reach him, call (907) 269-4861 or email him at [email protected].
Dan Robinson, a Depart-ment of Labor economist in Juneau, specializes in statewide employment and earnings. To reach him, call (907) 465-6036 or email him at [email protected].
Susan Erben, a Department of Labor publications spe-cialist in Juneau, is editor of Alaska Economic Trends. To contact her, call (907) 465-6561 or email her at [email protected].