2 0 2 1 - AUT
63
2019 REPORT 2021 THE NEW ZEALAND CARE WORKFORCE SURVEY
Transcript of 2 0 2 1 - AUT

2 0 1 9 R E P O R T
2021
T H E N E W Z E A L A N D C A R E W O R K F O R C E S U R V E Y

i
AUTHORS
Katherine Ravenswood, Julie Douglas and Tanya Ewertowska
ACKNOWLEDGEMENTS
The authors would like to acknowledge the support of the New Zealand Work Research Institute. In
particular, the work of Alexandra Turcu, Summer Staninski and Tamara Tesolin in preparing the report for
publication.
This report is only possible because of the many care and support workers, nurses and managers in these
sectors who took the time to complete the survey, and encouraged their colleagues to complete it also.
PUBLISHED
New Zealand Work Research Institute, Auckland
ISBN: 978-1-927184-81-3
2021
Suggested citation: Ravenswood, K., Douglas, J. & Ewertowska, T. (2021) The New Zealand Care
Workforce Survey 2019 Report. Auckland.

ii
1 Introduction .......................................................................................................................................... 1
2 Participant Demographics ..................................................................................................................... 3
2.1 Gender .......................................................................................................................................... 3
2.2 Age ................................................................................................................................................ 4
2.3 Country of Birth ............................................................................................................................ 4
2.4 Ethnicity ........................................................................................................................................ 5
2.5 Household and family care responsibilities ................................................................................... 5
2.6 Location ........................................................................................................................................ 6
3 Job Characteristics ................................................................................................................................ 7
3.1 Hours of work and shifts ............................................................................................................... 7
3.2 Hourly Pay ................................................................................................................................... 10
3.3 Employment Status ..................................................................................................................... 11
3.4 Smart Phone usage and provision ............................................................................................... 12
3.5 Primary tasks undertaken on the job .......................................................................................... 14
4 Experience and Skills, Training and Professional Development .......................................................... 15
4.1 Experience .................................................................................................................................. 15
4.2 Skills ............................................................................................................................................ 18
4.3 Training and Professional Development ..................................................................................... 18
5 Qualifications & Formal Study ............................................................................................................. 21
5.1 Currently Studying ...................................................................................................................... 21
5.2 Would Like to Undertake Study .................................................................................................. 22
6 The Work Environment ....................................................................................................................... 25
6.1 Job Security ................................................................................................................................. 25
6.2 Satisfaction with pay and hours of work ..................................................................................... 26
6.3 Workplace relations .................................................................................................................... 29
6.4 Time, work pressure and flexibility ............................................................................................. 32
6.5 Job Satisfaction and intentions to quit ........................................................................................ 34
7 Workplace Health and Safety .............................................................................................................. 40
7.1 Workplace Stress ........................................................................................................................ 40
7.2 Safety at Work ............................................................................................................................ 40
7.3 Work-related injury and illness ................................................................................................... 42

iii
CONTENTS CONTINUED
7.4 Workplace Violence .................................................................................................................... 44
8 Conclusions ......................................................................................................................................... 51
9 References .......................................................................................................................................... 54
LIST OF FIGURES
Figure 1. Age of respondents by occupation................................................................................................. 4
Figure 2. Ethnicity of respondents ................................................................................................................ 5
Figure 3. Percent of respondents from each major New Zealand city .......................................................... 6
Figure 4. Care and support workers' shortest shift by sector ....................................................................... 8
Figure 5. Care and support workers' average weekly hours by sector .......................................................... 9
Figure 6. Care and Support Workers' Hourly Pay ........................................................................................ 11
Figure 7. Length of experience in each sector ............................................................................................ 17
Figure 8. Completed Training in the last 12 months provided by the employer ......................................... 19
Figure 9. Currently studying for a work-related qualification ..................................................................... 21
Figure 10. What support does your employer provide to study towards qualifications? ........................... 23
Figure 11. Qualifications achieved by occupation ....................................................................................... 24
Figure 12. My pay fairly reflects the skills, responsibilities and experience needed ................................... 27
Figure 13. Care and support workers' satisfaction with their hours of work .............................................. 28
Figure 14. Management-employee relations are good ............................................................................... 30
Figure 15. Satisfaction with team or employer support by occupation ...................................................... 31
Figure 16. Do respondents have enough time to spend with clients? ........................................................ 33
Figure 17. Care and support workers' satisfaction with the work itself, by sector ..................................... 36
Figure 18. Care and support workers, recommend this job by sector ........................................................ 39
Figure 19. How safe care and support workers feel at work....................................................................... 41
Figure 20. Cause of the most recent work-related injury or illness ............................................................ 44
Figure 21. Experience of workplace violence from clients, by occupation ................................................. 46
Figure 22. Experience of workplace violence from colleagues or managers, by occupation ...................... 49

iv
LIST OF TABLES
Table 1. Number of Respondents by sector and occupation ........................................................................ 3
Table 2. Care and support workers' employment status by sector ............................................................. 12
Table 3. Main tasks for care and support workers ...................................................................................... 14
Table 4. Most common 'main' reason for quitting by occupation .............................................................. 38
Table 5. Responses by occupation: tools and equipment, information to safely do their job .................... 42
Table 6. Work-related injury and illness experienced in the last 12 months .............................................. 43
Table 7. Experience of sexual harassment and violence at work from clients: nurses and care & support
workers ....................................................................................................................................................... 47
Table 8. Experience of sexual harassment and violence at work from colleagues or managers, by
occupation .................................................................................................................................................. 50

v
EXECUTIVE SUMMARY
The purpose of this report is to present the work experiences of those working in residential aged care,
home and community support, disability support and mental health and addiction support. Care and
support workers, nurses and managers were surveyed. An online survey was conducted in late 2019. There
was a sample of 2,373 respondents. Of these respondents: 1,784 were care and support workers, 229
nurses and 360 managers. This was a nationwide survey with respondents from urban and small-town
settings across the North and South Islands of New Zealand.
Key Findings
Hours of work
Managers (81.4%) were more likely to work regular day time shifts than care and support workers (46.9%)
or nurses (43.7%).
Amongst care and support workers, the majority of those in home and community support had ‘shortest
shifts’ of 0 to 4 hours per shift. They were also more likely than care and support workers in the other
sectors to have lower weekly hours of work. Unsurprisingly, therefore, 61.5% of home and community
support workers would like to have more hours of work.
A large proportion of nurses (90.4%) and of care and support workers (88.0%) had a guaranteed minimum
number of hours’ work each week.
Technology
A large proportion of all occupations are required to use a smartphone, tablet or similar device for work:
65.5% of care and support workers, 67.9% of nurses and 79.9% of managers.
Of those required to use a phone or device, 37.6% of care and support workers provided their own phone
or device. This compares to 11.9% of managers and 8.0% of nurses who have to provide their own phone
or device.
Training and Professional Development
More care and support workers (26.1%) had not completed training provided by their employer in the last
12 months, compared to 7.1% of nurses and 8.7% of managers who had not.

vi
Amongst those who had completed training provided by their employers, managers were more likely to
have completed this training during their paid work hours. Care and support workers in home and
community support were less likely than those in the other sectors to complete training during paid work
time.
More managers (61.9%) than nurses (51.0%) or care and support workers (49.7%) were satisfied with the
opportunity they had to develop their abilities.
Pay
Only 40.6% of all respondents agreed that their rate of pay fairly reflected the skills, responsibilities and
experience needed to do their job. Fewer nurses (31.8%) agreed that their rate of pay fairly reflected the
skills, responsibilities and experience needed to do their job than managers or care and support workers.
Workplace relations
Fewer than half of all respondents agreed that management and employees had good relations in their
workplace.
Fewer than half of care and support workers (46.6%) and nurses (44.3%) agreed that they receive the
respect and acknowledgement that they deserve considering all their efforts and achievements.
Quitting intentions
Nearly 1/3 of nurses (32.8%) and care and support workers (30.0%) said that they intended to quit in the
next 12 months. Stress/burnout was the most commonly given reason for intending to quit.
Fewer than half of all respondents would recommend their job to family and friends.
Workplace Health and Safety
The majority of respondents felt safe at work. However fewer than half of care and support workers
(48.1%) and nurses (48.8%) felt that they are told everything that they need to know in order to do their
job safely.
Stress or other mental health conditions was the most commonly identified work-related injury or illness
amongst all respondents. Fatigue and mental stress were also commonly cited as the cause of work-related
injury or illness.
Nearly half of managers and care and support workers and 2/3 of nurses experience physical violence from
clients sometimes, often, most of the time or always.

vii
23.9% of care and support workers, and 28.3% of nurses have experienced sexual harassment from clients
(or clients’ families) at work.
10.8% of nurses and 8.1% of care and support workers have experienced sexual violence from clients (or
clients’ families) at work.
1
1 Introduction
The purpose of this report is to present the work experiences of those working in residential aged care,
home and community support, disability support and mental health and addiction. This report follows The
New Zealand Aged Care Workforce Survey reports 2014 and 2016. Unlike the previous two reports, this
report has extended its scope beyond aged care to include the disability support and mental health and
addiction support sectors. This scope was extended to reflect changes indicated through policy direction -
such as the Workforce in Action Plan and the Care and Support Workers (Pay Equity) 2017 Act (and
subsequent amendments) - that begin to view the health and disability workforce in its entirety.
The aim of the 2019 New Zealand Care Workforce Survey was to provide independent data that tracks
trends in the work conditions and work experiences of this workforce. Although government agencies are
increasingly reporting on this workforce, and employers and member-only associations survey their
members, there is not yet comprehensive publicly available data on multiple facets of the work experience
of the care workforce in its entirety. Importantly, this report also presents data on the experiences of
managers who are, clearly, important in planning and managing those who are direct care workers. There
are few other sources of information on the experiences of managers.
The two previous reports presented data sector by sector. In contrast, this report presents data on each
occupation and each sector, for each topic. This is in part in response to the greater amount of data
collected – as the survey now covers four, not two, sectors - and so that it is easier to compare across
occupation and sector on each topic.
Methodology
This report is based on online survey data collected in late 2019. The online software Qualtrics was used
to survey the occupations of manager, nurse and care and support workers. As with previous surveys, the
survey was distributed through key stakeholders in these sectors, as well as in direct dissemination to
publicly available emails of employers and training providers in these sectors. In addition to these
measures, the survey link was also publicised through a social media campaign advertising the online
survey.
Full information on the aim of the survey and respondent confidentiality was provided on the online survey
in line with principles of informed consent and ethical research. In 2019, this information was also

2
translated into te reo Māori. This was done as a step towards meeting research responsibilities under te
Tiriti o Waitangi, to ensure that research is accessible to Māori.
The survey questions largely remain the same as the 2014 and 2016 reports, based on the Australian
National Aged Care Workforce Census and Survey (Mavromaras et al., 2017). Additional questions,
pertinent to the regulatory environment in Aotearoa/New Zealand, are included in each survey iteration.
In this 2019 survey, questions on the implementation of the 2017 pay equity settlement and its subsequent
amendments were asked. These will be reported separately. Further questions were added to explore the
incidence and experience of workplace violence. This issue is one that is little understood internationally
in these sectors – most research into workplace violence in healthcare tends to focus on institutional
settings such as hospitals. These questions were sourced from peer-reviewed published research into
workplace violence in community care.
This report was supported by the New Zealand Work Research Institute.

3
2 Participant Demographics
There was a total of 2,373 valid responses from care or support workers, nurses (due to sample size,
enrolled and registered nurses’ answers have been aggregated for this report), and managers. This total
was across all sectors surveyed: residential aged care, home and community support; disability support;
and mental health and addiction. Of these, 1,784 were care and support workers, 229 nurses and 360
managers. Table 1 below shows how many responded by sector and occupation.
The participant demographics for care and support workers broadly meet what we know of the care and
support workforce (TAS, 2018; Twaddle & Khan, 2014).
Table 1. Number of Respondents by sector and occupation
Sector Care and Support Workers
Nurses Managers Total
Residential aged care 283 118 158 559
Home and community support
697 16 53 766
Disability support 459 15 83 557
Mental health and addiction support
345 80 66 491
Total 1784 229 360 2373
2.1 Gender
Most of the respondents were female (87.0%). A further 12.1% identified their gender as male and 0.9%
of respondents identified as gender diverse. More nurses identified as gender diverse (2.6%) than care and
support workers or managers. More managers identified their gender as male (14.7%) than nurses (9.6%)
or care and support workers (11.9%).
More mental health and addiction support workers (24.4%) were male than in other sectors. This was
followed by disability support with 15.9% of respondents identifying their gender as male. Both residential
aged care (93.6%) and home and community support (94.1%) had the highest percentage of female
respondents, even more so than nurses (87.8%).

4
2.2 Age
The majority of respondents were in the age brackets of 45 to 54 (26.5%), and 55 to 64 (35.9 %). The
smallest proportion of respondents were in the age brackets 15 to 24 (2.2%) and over 70 (3.2%). The age
of respondents was similar across all occupations and all sectors. Nurse respondents were, overall, younger
than care and support workers or managers.
Amongst care and support workers, mental health and addiction support workers were generally younger
than those working in residential aged care and home and community support: 18.6% of respondents were
aged 25 to 34, 15.7% aged 35 to 44, 27.5% aged 45 to 54, 29.0% aged 55 to 64.
Figure 1. Age of respondents by occupation
2.3 Country of Birth
The majority of respondents were born in New Zealand (72.4%). Among nurses, 63.8% were born in New
Zealand and 71.7% of managers were born in New Zealand.
Of all the care and support workers who responded, 73.7% were born in New Zealand. This differed by
sector: 66.1% of care and support workers in residential aged care, 79.2% of home and community support
workers, 71.0% of disability support workers, and 72.2% of mental health and addiction support worker
respondents, were born in New Zealand. Of those care and support workers who were not New Zealand
citizens, 82.4% were permanent residents, 2.7% on skilled migrant visas, 11.1% on essential skills visas,
1.9% on student visas, and 1.9% on post-study visas.
0
5
10
15
20
25
30
35
40
15 - 24 25 - 34 35 - 44 45 - 54 55 - 64 65 - 69 over 70
% o
f re
spo
nd
ents
Care and support workers Nurses Managers

5
2.4 Ethnicity
Participants could select more than one ethnicity. Overall, the majority identified their ethnicity as pākehā,
New Zealand European or European. Figure 2 below outlines the ethnicity of respondents, excluding
pākehā, New Zealand European or European. Responses were classified using the Ethnicity New Zealand
Standard Classification (StatisticsNZ, n.d.).
Figure 2. Ethnicity of respondents
Managers were the least ethnically diverse amongst the respondents to this survey: 81.1% identified as
pākehā, New Zealand European or European, compared to 70.2% of care and support workers, and 68.1%
of nurses. Only 13.3% of managers identified as Māori (19.8% care and support workers, 10.5% nurses).
2.5 Household and family care responsibilities
Over half of the respondents' jobs provide most of or all of the income for their household or family: 32.1%
answered that their job was the only income in their family or household and 23.8% responded that their
job provides most of the income in their family or household. Of the total responses, 44.1% said that their
job is not the only income in their family or household. A bigger proportion of care and support workers
0
2
4
6
8
10
12
14
16
18
20
% o
f re
spo
nd
ents

6
Figure 3. Percent of respondents from each major New Zealand city
(45.0%) than nurses (38.0%) and managers (43.6%) responded that 'their job is not the only income in their
family or household.
Respondents were asked how many hours they spent (unpaid) each week caring for dependent family or
household members. Nearly half (47.7%) of respondents did not have any dependents (for example
children, disabled or elderly relatives). Of the remaining respondents, 22.1% spent one to 10 hours caring
for dependents; 10.0% spent 11 to 20 hours caring for dependents; 5.7 % spent 21 to 30 hours; and 14.5%
spent 30 hours or more caring for dependents.
Respondents were also asked if they had more than one job. Only 14.5% of the respondents overall said
that they had another job. This was lower for managers (8.2%) than nurses (12.0%), and care and support
workers (15.9%). Of those with more than one job (across all occupations), the majority (53.8%) worked
between 1 and 10 hours per week in their other job. A small proportion (10.8%) worked 30 hours or more
in their additional job(s).
2.6 Location
This was a nationwide survey comprising respondents from both the North (71.3%) and South (28.7%)
Island. Respondents were distributed across North Island cities, with a further 23.9% from 'other North
Island towns'. In the South Island, respondents came from a range of cities, with a further 10.1% from
'other South Island towns'.

7
3 Job Characteristics
This section provides information on key characteristics of the job and work that respondents do. In
particular, it provides information on hours of work and shifts (including the length and type of shifts, hours
of work per week, unpaid hours of work, guaranteed hours of work, and underemployment); hourly pay;
employment status (for example, permanent full-time etc); technology usage; and key tasks undertaken.
3.1 Hours of work and shifts
This section gathered information about respondents’ work hours, shift allocation and preferences.
Respondents reported whether they had weekly minimum guaranteed hours, if they would increase their
hours if regular hours were available, their shortest shift in the last week, how often they were expected
to work unpaid hours, and their average weekly paid hours.
3.1.1 Shifts
Respondents were asked to select a shift type that best reflected their current roster, from the options of
regular day, regular night, split shift, irregular, rotating, or other. There were 2,218 responses to this
question: 306 managers, 222 nurses and 1,690 care and support workers. Across all three occupations,
regular day shifts were the most common type of shift, including 46.9% of care and support workers, 43.7%
of nurses, and 81.4% of managers. Rotating shifts were the next most common shift for both nurses (24.3%)
and care and support workers (16.3%). Amongst care and support workers, this was followed by 13.8%
working split shifts, then 10.0% in irregular shifts, 7.0% in regular night shifts, and 6.0% other. More home
and community support workers responded (25.8%) that their regular shift is a split shift than care and
support workers in the other sectors. For nurses, irregular shifts were the third primary shift type at 14.4%,
followed by 8.1% in other shift types, 5.9% working regular night shifts, and 3.6% in split shifts. Managers
who did not work regular day shifts primarily indicated working other shifts (11.4%), and few responded
that they worked rotating shifts (2.6%), irregular shifts (2.0%), regular night shifts (1.6%) or split shifts
(1.0%).
Nurses and care and support workers were asked how long their shortest shift was in the previous week.
There was a total of 1,845 responses to this question: 218 nurses and 1,627 care and support workers.
When selecting the length of their shortest shift in the previous week, respondents were able to choose
between the options of less than 1 hour, 2 to 4 hours, 5 to 7 hours, 8 to 10 hours, and 11 or more hours.
8
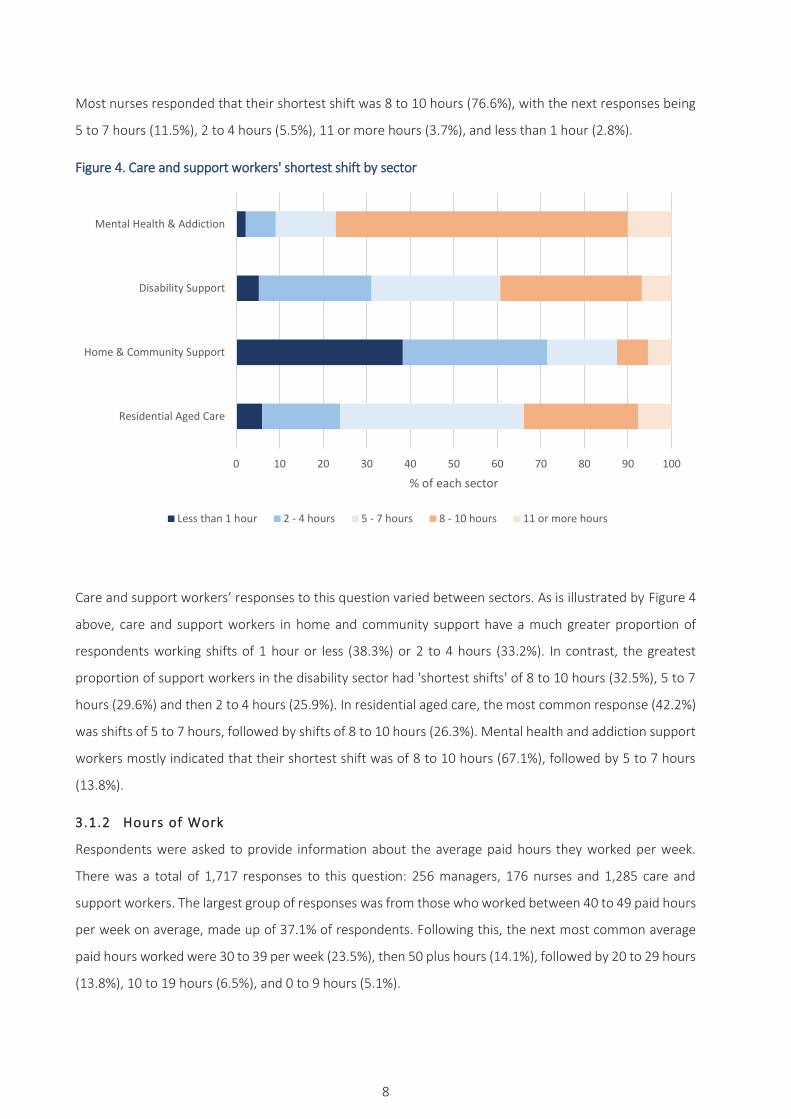
Most nurses responded that their shortest shift was 8 to 10 hours (76.6%), with the next responses being
5 to 7 hours (11.5%), 2 to 4 hours (5.5%), 11 or more hours (3.7%), and less than 1 hour (2.8%).
Figure 4. Care and support workers' shortest shift by sector
Care and support workers’ responses to this question varied between sectors. As is illustrated by Figure 4
above, care and support workers in home and community support have a much greater proportion of
respondents working shifts of 1 hour or less (38.3%) or 2 to 4 hours (33.2%). In contrast, the greatest
proportion of support workers in the disability sector had 'shortest shifts' of 8 to 10 hours (32.5%), 5 to 7
hours (29.6%) and then 2 to 4 hours (25.9%). In residential aged care, the most common response (42.2%)
was shifts of 5 to 7 hours, followed by shifts of 8 to 10 hours (26.3%). Mental health and addiction support
workers mostly indicated that their shortest shift was of 8 to 10 hours (67.1%), followed by 5 to 7 hours
(13.8%).
3.1.2 Hours of Work
Respondents were asked to provide information about the average paid hours they worked per week.
There was a total of 1,717 responses to this question: 256 managers, 176 nurses and 1,285 care and
support workers. The largest group of responses was from those who worked between 40 to 49 paid hours
per week on average, made up of 37.1% of respondents. Following this, the next most common average
paid hours worked were 30 to 39 per week (23.5%), then 50 plus hours (14.1%), followed by 20 to 29 hours
(13.8%), 10 to 19 hours (6.5%), and 0 to 9 hours (5.1%).
0 10 20 30 40 50 60 70 80 90 100
Residential Aged Care
Home & Community Support
Disability Support
Mental Health & Addiction
% of each sector
Less than 1 hour 2 - 4 hours 5 - 7 hours 8 - 10 hours 11 or more hours

9
Amongst managers, hours tended to be longer, with 68.8% of managers working 40 to 49 paid hours per
week on average, and 16.0% working 50 plus hours per week. Fewer managers worked 30 to 39 hours
(9.0%), 20 to 29 hours (3.9%), 0 to 9 hours (2.0%), and 10 to 19 hours (0.4%). The largest grouping of nurses
was also those who worked 40 to 49 weekly paid hours on average (49.4%), while more nurses than
managers worked 30 to 39 hours (25.6%), and fewer worked 50 plus hours (12.5%). From there, the next
most common average weekly paid hours for nurses was the range of 20 to 29 hours (8.5%), then 10 to 19
hours (2.3%), and 0 to 9 hours (1.7%).
Figure 5. Care and support workers' average weekly hours by sector
As Figure 5, above, indicates, amongst support workers, the majority of care and support workers in mental
health and addiction (57.0%) worked 40 to 49 paid hours per week on average, greater than any of the
other sectors. A greater proportion of respondents who work in home and community support have lower
weekly hours than other sectors with 25.6% responding that they worked 20 to 29 paid hours per week on
average, closely followed by those who worked 30 to 39 hours (25.0%). Fewer care and support workers
in home support worked 40 to 49 hours (12.5%) than in the other sectors.
3.1.3 Unpaid Hours of Work
For this question, respondents indicated how often they were expected to work extra hours that were not
paid, from the options of never, sometimes, often, most of the time, or always. There was a total of 2,209
response to this question: 303 managers, 222 nurses and 1,684 care and support workers. Most care and
support workers indicated that they were never (59.0%) or sometimes (24.6%) expected to work unpaid
hours, with fewer reporting that it happened often (8.1%), most of the time (4.9%) or always (3.5%).
0 10 20 30 40 50 60 70 80 90 100
Residential Aged Care
Home & Community Support
Disability Support
Mental Health & Addiction
% of each sector
0-9 hours 10-19 hours 20-29 hours 30 - 39 hours 40 - 49 hours 50 plus hours

10
Responses from nurses followed a similar trend, although compared with care and support workers more
nurses indicated that it occurred often (11.7%), most of the time (9.9%) or always (6.8%), with more nurses
responding sometimes (28.8%) and fewer responding never (42.8%). Managers’ responses were in a
comparatively even spread, with the most common response being sometimes (26.4%), then never
(23.1%), followed by always (21.1%), often (16.2%), and most of the time (13.2%).
3.1.4 Guaranteed minimum hours of work
This question was asked of care and support workers and nurses. There was a total of 1,910 responses to
this question: 219 nurses and 1,691 care and support workers. Amongst care and support workers, the
majority (88.0%) responded that they had a guaranteed minimum number of hours’ work each week. This
was slightly higher in disability support (92.9%) and mental health and addiction support (92.1%), than
residential aged care (83.1%) or home and community support (84.7%). Amongst nurse respondents,
90.4% reported having weekly minimum guaranteed hours.
3.2 Hourly Pay
At the time of data collection, in September 2019, the adult minimum wage was $17.70. Data was only
available from care and support workers and managers for this question. There was a total of 1,985
responses to this question: 299 managers and 1,686 care and support workers.
Figure 6, below, shows the difference in proportion of care and support workers' hourly pay by sector.
Overall, those who work in mental health and addiction reported higher hourly wages than other sectors:
over half (51.7%) of those respondents were paid $25.50, followed by 14.6% at $23.00 to $25.49, and
14.3% over $25.50.
Disability support workers also earned higher wages than those in residential aged care or home and
community support. In disability support, 31.7% of care and support workers were paid $25.50, 30.0%
were at the $23.00 to $25.49 range, and 20.0% at $21.50 to $22.99.
Compared with care and support workers in other sectors, residential aged care had the highest proportion
in the lowest hourly wage bracket. Of note is that some respondents reported an hourly wage that was
lower than the lowest specified by the Support Workers (Pay Equity Settlements) Act 2017 at the time of
the survey.

11
Figure 6. Care and Support Workers' Hourly Pay
Amongst managers who responded to this question: 16.4% earned $40.00 to $44.99, 16.1% were paid
$35.00 to $39.99, 15.4% were at $30.00 to $34.99, followed by 13.7% at $25.00 to $29.99, and 10.7% at
$20.00 to $24.99. Fewer managers indicated that they earned the lowest option of less than $20.00 (0.7%),
or the higher options of $45.00 to $49.99 (7.0%), and $50.00 to $54.99 (8.0%). However, 12.0% of
managers earned $55.00 per hour and over.
3.3 Employment Status
This question asked respondents to indicate their employment status, with the option to select from:
permanent full-time
permanent part-time
fixed term
casual
agency
self-employed
There was a total of 2,211 responses to this question: 304 managers, 222 nurses and 1,685 care and
support workers. Permanent full-time employment was the most common type for all three occupations,
0
10
20
30
40
50
60
$17.70 - $20.49 $20.50 - $21.49 $21.50 - $22.99 $23.00 - $25.49 $25.50 > $25.50
% o
f ea
ch s
ecto
r
Residential Aged Care Home & Community Support Disability Support Mental Health & Addiction

12
though more so for managers (86.8%) than for nurses (66.7%), and care and support workers (58.9%). The
second most common type was permanent part-time employment, covering 6.3% of managers, 22.5% of
nurses, and 33.6% of care and support workers. Amongst care and support workers, 4.6% were in casual
employment, 1.6% on fixed term contracts, and then 0.7% in agency employment and 0.6% self-employed.
For nurses, 5.4% were in casual employment, 3.2% fixed term, 1.4% agency, and 0.9% self-employed.
Managers differed, with their third most common employment type being self-employed (3.6%), then fixed
term (2.6%) before casual employment (0.7%), with none in agency employment.
Table 2. Care and support workers' employment status by sector
Sector Permanent full-time
Permanent part-time
Fixed term contract
Casual Agency Self-employed
Residential Aged Care
56.0% 34.6% 2.3% 5.6% 1.5% 0.0%
Home & Community Support
41.1% 51.5% 1.1% 4.9% 0.8% 0.8%
Disability Support
75.9% 16.7% 2.3% 3.4% 0.5% 1.1%
Mental Health & Addiction
74.1% 19.5% 1.2% 4.9% 0.3% 0.0%
As illustrated above, support workers in home and community support are less likely to be employed on a
permanent full-time basis than those in residential aged care, disability support or mental health and
addiction. Both disability support and mental health and addiction support workers had much higher
proportions employed on a permanent full-time basis than those in the other two sectors. Home and
community support was the only sector in which more than half of respondents were employed on a
permanent part-time basis.
3.4 Smart Phone usage and provision
As technological advances mean that smart phones (or similar devices) are more frequently required to log
hours, accept shifts, record care and so on, this question asked respondents if they were required to use
smartphones in the course of their work, and then what, if any, smart phone provision was provided by
their employer. There was a total of 2,216 responses to this question: 306 managers, 221 nurses and 1,689
care and support workers.
Most respondents across the three occupations indicated that they were required to use a smartphone or
tablet at work. This included 65.5% of care and support workers, 67.9% of nurses, and 79.7% of managers.

13
This meant that those respondents not required to use a smartphone or tablet at work made up 34.5% of
care and support workers, 32.1% of nurses, and 20.3% of managers.
Requirements for care and support workers to use a smartphone or tablet differed slightly across sectors,
with 64.1% responding yes in mental health and addiction, 68.8% yes responses in home and community
support, and 69.8% yes responses in disability support. In comparison, fewer care and support workers in
the residential aged care sector were required to use a smartphone or tablet, with 51.7% responding yes,
they were required to.
In total, 1,500 respondents across the three occupations were required to use a smartphone or tablet at
work, including 1,106 care and support workers, 150 nurses, and 244 managers. These respondents were
asked to tick all of the following that applied to them:
My work provides the phone or tablet (n=998)
My work pays for the data plan (n=686)
I have to provide my phone or tablet (n=457)
I have to pay for the data plan (n=306)
Overall, out of those who were required to use a smart phone or other device:
26.0% of care and support workers provided their own data plan. This compares to 4.9% of
managers and 4.0% of nurses.
37.6% of care and support workers provided their own phone or device. This compares to 11.9%
of managers and 8.0% of nurses.
42.1% of care and support workers had their data plan provided by their employer. This compares
to 63.5% of managers and 43.3% of nurses.
59.1% of care and support workers had their phone or device provided by their employer. This
compares to 84.4% of managers and 92.0% of nurses.

14
3.5 Primary tasks undertaken on the job
Care and support workers were asked to provide information about the top tasks they spent the most time
doing in their job. They were able to select up to 3 top tasks, from the following options:
personal care
engaging with clients or companionship
cleaning or housework
meal preparation
home maintenance
client’s shopping or appointments
social integration
administrative tasks, and
supervising other staff
Table 3. Main tasks for care and support workers
Sector Personal Care
Engaging with Clients
Cleaning or Housework
Meal Preparation
Client's Shopping/ Appointments
Social Integration
Residential Aged Care
227 120 70 - - -
Home & Community Support
601 - 449 256 - -
Disability Support
276 262 163 - - -
Mental Health & Addiction
- 272 - - 150 147
There are some differences between sectors, with the biggest difference being that the top 3 tasks that
are carried out by respondents in mental health and addiction did not include personal care or cleaning.
Home and community support had different responses: it was the one sector in which most respondents
did not select 'Engaging with Clients' as one of their top 3 tasks. However, 233 home and community
support respondents did select 'engaging with clients', meaning that for many it was a main task. The tasks
that take up the most time reflect not only the nature of the care being provided, but also the funding
models that can determine a focus on physical care more than social or personal interaction.

15
4 Experience and Skills, Training and
Professional Development
4.1 Experience
In this section, respondents were asked to provide information about the length of their experience with
their current provider and their experience in each sector.
4.1.1 Length of t ime with this provider
This question asked respondents to indicate how long they had worked for their current provider or service,
from the options of:
less than 1 year
1 year up to 5 years
5 up to 10 years
10 up to 15 years
15 up to 20 years
20 years and over
There was a total of 2,111 responses to this question: 287 managers, 210 nurses and 1,614 care and
support workers. Care and support workers most commonly indicated that they had worked for their
provider for 1 year up to 5 years (40.9%), followed by 5 to 10 years (21.0%), and then less than 1 year
(15.3%), and then progressively reducing from 10 to 15 years (12.3%), 15 to 20 years (6.3%), and 20 years
and over (4.2%). Care and support workers’ responses were consistent across the different sectors.
For nurses, the most common length of time working for their current provider was also 1 to 5 years
(32.9%), then less than 1 year (22.9%), 5 to 10 years (16.7%), 10 to 15 years (11.4%) and 20 years and over
(11.4%), and 15 to 20 years (4.8%).
Managers’ responses followed similar trends to care and support workers and nurses, with 1 to 5 years
being the most common answer (42.9%), then 5 to 10 years (16.4%), followed closely by less than 1 year
(14.6%), and 10 to 15 years (13.2%), and lastly 20 years and over (6.6%), and 15 to 20 years (6.3%).
4.1.2 Total length of experience
For this question, respondents provided information about the length of their experience in each sector in
New Zealand, with the sectors being residential aged care, home and community support, disability

16
support, and mental health and addiction. The following figure illustrates the length of experience that
care and support workers have in each sector. For example, the figure entitled ‘residential aged care sector’
gives the responses for care and support workers currently in that sector. It compares their total length of
experience in each of the other sectors.
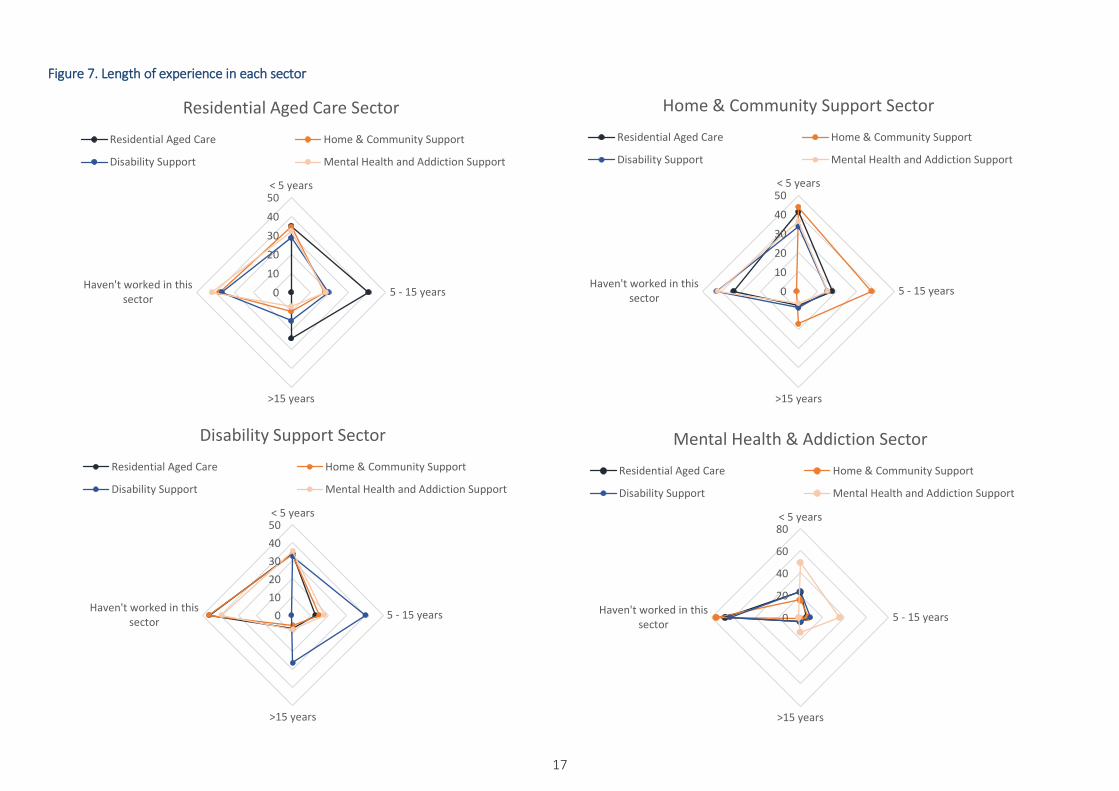
17
Figure 7. Length of experience in each sector
0
10
20
30
40
50< 5 years
5 - 15 years
>15 years
Haven't worked in thissector
Residential Aged Care Sector
Residential Aged Care Home & Community Support
Disability Support Mental Health and Addiction Support
0
10
20
30
40
50< 5 years
5 - 15 years
>15 years
Haven't worked in thissector
Home & Community Support Sector
Residential Aged Care Home & Community Support
Disability Support Mental Health and Addiction Support
0
10
20
30
40
50< 5 years
5 - 15 years
>15 years
Haven't worked in thissector
Disability Support Sector
Residential Aged Care Home & Community Support
Disability Support Mental Health and Addiction Support
0
20
40
60
80< 5 years
5 - 15 years
>15 years
Haven't worked in thissector
Mental Health & Addiction Sector
Residential Aged Care Home & Community Support
Disability Support Mental Health and Addiction Support

18
4.2 Skills
Respondents were asked if they had the skills and abilities that they needed to do their job. There was a
total of 1,972 responses to this question: 279 managers, 197 nurses, and 1,436 care and support workers.
Overall, across occupations, those who agreed or strongly agreed that they had the skills and abilities they
needed made up 83.8% of respondents, with 10.4% being neutral, and 5.7% disagreeing or strongly
disagreeing. Amongst the respondents who were in agreement, a much larger portion strongly agreed
(59.0%) than agreed (24.8%), suggesting that there was strong agreement overall from respondents that
they had the skills and abilities they needed in their job.
Respondents were then asked if they used many of their skills and abilities in their current job. As with the
responses about having the skills needed for their job, most respondents indicated that they used many of
their skills and abilities in their current job. Of those who responded, 85.6% agreed or strongly agreed,
7.9% were neutral, and 6.5% disagreed or strongly disagreed that they used many of their skills and
abilities. Further, a considerably larger proportion of respondents strongly agreed (64.0%), than agreed
(21.6%). This was similar across occupation and sector.
4.3 Training and Professional Development
This section reports on how many respondents had undertaken any training or professional development
during the last 12 months and what the purpose of the training or professional development was. They
were also asked if they thought that adequate training was available in their workplace, and if they had the
opportunity to develop.
Respondents were asked whether they had undertaken any training or professional development provided
by their employer during the last 12 months. There were 2,110 respondents who responded to this
question: 286 managers, 210 nurses and 1,614 care and support workers. Figure 8, below, illustrates the
percentage of respondents, by sector, who had not completed any training provided by their employer; or
who had, and it was:
During work time
Outside of work time, but paid
Outside of work time, and unpaid

19
Figure 8. Completed Training in the last 12 months provided by the employer
The proportion of respondents who had not undertaken employer-provided training or professional
development was lowest amongst nurses at 7.1%, followed closely by managers with 8.7%, but for care
and support workers was approximately triple that of nurses and managers, at 26.1%. Of the three
occupations, managers were most likely to indicate that they undertook employer-provided training or
professional development during work time (72.0%).
When the care and support workers' responses were analysed by sector, training and professional
development was far more frequently undertaken during work time in the mental health and addiction
(62.4%), disability support (47.4%), and residential aged care (40.7%) sectors, than in the home and
community support sector (26.2%). Care and support workers in home support more often reported
undertaking training outside of work time that was unpaid (15.1%), than those in residential aged care
(10.3%), disability support (8.8%), and mental health and addiction support (1.9%). Accordingly, a smaller
proportion of care and support workers in home and community support were provided paid training
outside of work time (18.1%), in comparison with those in residential aged care (30.9%), disability support
(26.8%), and mental health and addiction support (20.4%). The home and community support sector also
had more than twice the level of care and support workers who had not undertaken any employer-
provided training or professional development at 40.6%, compared with 18.1% in residential aged care,
17.1% in disability support, and 15.4% in mental health and addiction support.
0
10
20
30
40
50
60
70
80
During work time Outside of work time (paid) Outside of work time (notpaid)
No training
% o
f re
spo
nd
ents
Care or support worker Nurse Manager

20
4.3.1 Opportunity to develop and availabil ity of adequate training
Respondents were asked how satisfied they were with the opportunity they had to develop their abilities.
There was a total of 1,935 responses to this question: 273 managers, 196 nurses and 1,466 care and
support workers. A small majority of those who answered the question were satisfied or totally satisfied
with the opportunity to develop their abilities (51.6%), and the remainder of the respondents were
relatively evenly spread between being neutral (25.7%) and dissatisfied or totally dissatisfied (22.7%). More
managers (61.9%) were totally satisfied or satisfied with the opportunity they had to develop their abilities
than nurses (51.0%) and care and support workers (49.7%).
Respondents were also asked to indicate whether adequate training was available through their workplace.
There was a total of 1,925 responses to this question: 266 managers, 197 nurses and 1,462 care and
support workers. A small majority of respondents, 53.4%, agreed or strongly agreed that adequate training
was available, while 22.3% were neutral, and 24.3% disagreed or strongly disagreed.

21
5 Qualifications & Formal Study
In this section, respondents provided information about their qualifications. Questions asked which formal
qualifications they had, whether they were currently studying for a work-related qualification, if they
wanted to undertake further work-related study, and what types of support their employer provided
employees to study towards qualifications.
5.1 Currently Studying
There was a total of 2,101 response to this question: 285 managers, 210 nurses and 1,606 care and support
workers. Across all occupations, the majority were not currently studying towards a work-related
qualification. A slightly higher proportion of care and support workers were currently studying than nurses
or managers.
Figure 9. Currently studying for a work-related qualification
While there were generally only slight differences between sectors in the proportions of care and support
workers who were and were not studying, the home and community support sector responses indicated
that a higher proportion were not currently studying. In mental health and addiction 73.4% of care and
support workers were not studying (26.6% were studying). This was closely mirrored in disability support
with 72.6% not studying (27.4% studying) and in residential aged care which had 71.0% not studying (29.0%

22
studying). In comparison, the home and community support sector had a slightly larger proportion of care
and support workers not studying at 78.4% (21.6% studying).
5.2 Would Like to Undertake Study
Respondents were asked 'Would you like to undertake any further work-related study?' There were 2,102
responses to this question: 284 managers, 209 nurses and 1,609 care and support workers. Across all
occupations 65.2% of respondents indicated that they would like to undertake further work-related study
and 34.8% indicated that they would not. Responses to this question were generally similar across
occupations, though the proportion of those wanting to undertake further study was higher amongst care
and support workers (65.9%) and nurses (64.6%), compared with managers (61.6%).
There were higher proportions of care and support workers wanting to undertake further work-related
study in the residential aged care (75.4%) and mental health and addiction support sectors (71.8%), in
comparison with disability support (64.3%) and home and community support sectors (60.3%).
5.2.1 Employer Support for Study
Care and support workers were also asked what support their employer provided to study towards
qualifications. They could tick all responses that applied from:
Paid study time
Group study sessions at work
Literacy support
Peer mentor/study buddy
Tuition fees paid
No support

23
Figure 10. What support does your employer provide to study towards qualifications?
The most frequently reported support was group study sessions at work (n=536), paid study time (n=419)
and tuition fee payment (n=416). 429 care and support workers answered that they receive no support
from their employer, more than those who reported that they were supported with paid study time or
tuition fee payment.
5.2.2 Qualif ications Held
Respondents were asked to indicate all of the qualifications that they hold. A total of 2,081 answered this
question: 283 managers, 196 nurses and 1602 care and support workers. Very few indicated that they
held no qualifications, with 8.5% of managers, 7.2% of care and support workers and 2.0% of nurses. The
percentage response for nurses is unusual in that in order to practice, nurses must have qualified in an
appropriate nursing question, and therefore may indicate a mistaken response.
Figure 11, below, illustrates the qualifications held across occupations. As respondents could tick multiple
responses, totals may add up to more than 100%. Level 2, 3 and 4 refers to the national qualifications for
care and support workers, as indicated in the Support Workers (Pay Equity) Settlements Act 2017. Other
options included nursing or other undergraduate certificate or diploma, nursing or other undergraduate
degree, nursing or other postgraduate qualification. Generally, (as illustrated below) as expected, more
care and support workers hold national qualifications for care and support workers, more nurses hold
nursing qualifications, and more managers hold ‘other’ undergraduate and postgraduate degrees.
0
100
200
300
400
500
600
Group sessions atwork
Paid study time Tuition fees paid Peermentor/study
buddy
Literacy Support No support
Nu
mb
er o
f re
spo
nd
ents

24
Figure 11. Qualifications achieved by occupation
0
5
10
15
20
25
30
35
40
45
Level 2 Level 3 Level 4 Nursing UGDiploma
Nursing UG Degree Nursing PG Other UG diploma Other UG degree Other PG
% o
f re
spo
nd
ents
Care and support workers Nurses Managers

25
6 The Work Environment
This section presents information from questions that asked about:
job security
satisfaction with pay and hours of work
time, work pressure and flexibility of hours
workplace relations
job satisfaction and quitting intentions
6.1 Job Security
There was a total of 1,956 responses to this question: 272 managers, 197 nurses and 1,487 care and
support workers. The majority of respondents were satisfied or totally satisfied with their job security
(54.9%), with smaller proportions being neutral (23.6%), and dissatisfied or totally dissatisfied (21.5%). For
care and support workers, 52.4% were satisfied or totally satisfied, while 25.1% were neutral and 22.5%
dissatisfied or totally dissatisfied. Nurses were more frequently satisfied or totally satisfied with their job
security, at 58.4%, with 21.8% of nurses being neutral and 19.8% dissatisfied or totally dissatisfied.
Managers had the largest proportion of respondents who were satisfied or totally satisfied with their job
security, at 66.2%, and fewer who were neutral (16.9%), and dissatisfied or totally dissatisfied (16.9%).
Care and support workers’ satisfaction with job security in the mental health and addiction sector differed
from care and support workers in the other sectors. Care and support workers in the mental health and
addiction sector were more often satisfied with their job security, with 60.5% of them being satisfied or
totally satisfied, while the proportion of those who were satisfied or totally satisfied was 53.1% in the
residential aged care sector, 51.9% in disability support, and 48.4% in home and community support.

26
6.2 Satisfaction with pay and hours of work
6.2.1 Total Pay
In this question, respondents were asked to indicate their satisfaction with their total pay. There was a
total of 1,988 responses: 275 managers, 202 nurses and 1,511 care and support workers. Similar
proportions of the respondents were dissatisfied or totally dissatisfied (28.8%) or neutral (27.8%), while a
larger proportion were satisfied or totally satisfied (43.5%). From the care and support workers who
responded to this question, 26.5% were dissatisfied or totally dissatisfied with their total pay, 29.5%
neutral, and 44.0 % satisfied or totally satisfied.
Compared with care and support workers, nurses were more likely to be dissatisfied or totally dissatisfied
with their total pay (43.6%) with fewer nurses who were neutral (21.8%), and fewer being satisfied or
totally satisfied (34.7%). Managers’ responses were more comparable with care and support workers’, with
30.5% of managers being dissatisfied or totally dissatisfied, 22.5% neutral, and 46.9% satisfied or totally
satisfied. Generally, care and support workers’ satisfaction (or dissatisfaction) was consistent across
sectors.
6.2.2 Fair pay
Respondents were asked to report whether their rate of pay fairly reflected the skills, responsibilities, and
experience needed to do their job. There was a total of 1,944 responses to this question: 272 managers,
198 nurses, and 1,474 care and support workers. Nearly equal proportions of respondents agreed as those
who disagreed, with 40.6% who agreed or strongly agreed, 39.0% who disagreed or strongly disagreed,
and 20.4% who were neutral.
Managers and care and support workers’ responses were similar. Amongst managers, 43.8% agreed or
strongly agreed that their pay rate was fair, 17.6% were neutral, and 38.6% disagreed or strongly disagreed.
From the care and support workers, 41.2% agreed or strongly agreed that their pay rate was fair, 21.1%
were neutral, and 37.7% disagreed or strongly disagreed. Considerably more nurses disagreed, compared
with care and support workers and managers. Those nurses who disagreed or strongly disagreed made up
49.5% of the nurse respondents, while 18.7% were neutral, and 31.8% agreed or strongly agreed.

27
Figure 12. My pay fairly reflects the skills, responsibilities and experience needed
In the home and community support sector, a higher proportion of care and support workers agreed or
strongly agreed that their pay fairly reflected the skills, responsibilities and experience needed for the job
at 44.8% compared to: 37.6% in the residential aged care sector, 36.3% in mental health and addiction
and 41.3% in disability support. It may be worth noting that in mental health and addiction a higher
percentage of respondents (41.5%) strongly disagreed or disagreed than were strongly in agreement or
agreed with the statement. A similar response was found in residential aged care: 43.2% disagreed or
strongly disagreed, while 37.6% agreed or strongly agreed that their pay fairly reflected the skills,
responsibilities and experience needed for the job.
6.2.3 Satisfaction with the hours of work
This question asked respondents to report their satisfaction with the hours they work. There was a total of
1,957 responses to this question: 275 managers, 198 nurses and 1,484 care and support workers. Of the
respondents who answered this question, 58.5% reported that they were satisfied or totally satisfied,
21.6% reported being neutral, and 19.9% were dissatisfied or totally dissatisfied. In comparison with care
and support workers, slightly larger proportions of nurses and managers reported being satisfied with their
hours. For nurses, 64.6% were satisfied or totally satisfied with their hours, 20.2% were neutral, and 15.2%
were dissatisfied or totally dissatisfied. From the managers who responded, 60.7% were satisfied or totally
satisfied, 21.5% were neutral, and 17.8% dissatisfied or totally dissatisfied. Care and support workers had
somewhat lower satisfaction, compared to nurses, with 57.2% of care and support workers who responded

28
to the question indicating that they were satisfied or totally satisfied, 21.8% who indicated being neutral,
and 21.0% being dissatisfied or totally dissatisfied.
Figure 13. Care and support workers' satisfaction with their hours of work
There was some variation across sectors in care and support workers’ satisfaction with their hours. Care
and support workers in the home and community support sector more frequently reported being
dissatisfied with their hours of work with 27.6% being dissatisfied or totally dissatisfied. Care and support
workers in disability support less often reported that they were dissatisfied or totally dissatisfied, at 14.4%,
while 25.6% were neutral, and 60.0% were satisfied or totally satisfied. The mental health and addiction
sector had more reports of satisfaction amongst care and support workers, with 67.7% being satisfied or
totally satisfied.
6.2.4 Underemployment
Respondents were asked if they would increase their hours if regular hours were available. There was a
total of 2,200 responses to this question: 303 managers, 219 nurses and 1,678 care and support workers.
A slight majority of care and support workers responded yes, at 53.9%. In contrast to care and support
workers, more nurses responded that they would not increase their hours (69.4%) than responded they
would (30.6%). Managers' responses were similar to those of nurses, with 84.8% answering no and 15.2%
yes.
0
10
20
30
40
50
60
70
80
Residential Aged Care Home & CommunitySupport
Disability Support Mental Health & Addiction
% o
f re
spo
nd
ents
Satisfied Neutral Dissatisfied

29
There were differences between sectors in care and support workers’ responses to increasing their hours.
In disability support 46.4% of care and support workers indicated yes, they would like to have more hours
of work, and 53.6% indicated no. Responses were similar in mental health and addiction, at 45.1% yes and
54.9% no. This differed from residential aged care (58.2% indicating yes), and home and community
support (61.5% responding yes) that they would like to have more hours of work.
6.3 Workplace relations
This data reports respondents’ experience of management-employee relations, support from their team
or manager, and how respondents perceive that they receive the respect and acknowledgement that they
deserve for their efforts and achievements.
6.3.1 Management-Employee relations
For this question, respondents reported whether management and employees had good relations in their
workplace. There was a total of 1,929 responses to this question: 269 managers, 197 nurses and 1,463 care
and support workers. More respondents agreed or strongly agreed (45.4%), than disagreed or strongly
disagreed (32.6%), or were neutral (22.0%).

30
Figure 14. Management-employee relations are good
As illustrated in Figure 14 above, there was a large difference between responses from nurses and care
and support workers, compared with managers. A large majority of managers reported that manager and
employee relations were good, with 70.6% of managers who agreed or strongly agreed compared to 48.2%
of nurses and 40.4% of care and support workers.
Responses from care and support workers varied between sectors. In mental health and addiction support
a much larger proportion agreed or strongly agreed (51.2%), and fewer disagreed or strongly disagreed
(22.6%). In home and community support, this trend was reversed, with a larger proportion of care and
support workers who disagreed or strongly disagreed that management and employees had good relations
(45.4%), and a smaller group who agreed or strongly agreed (34.3%). Responses in disability support were
similar to the overall trend, and there were only small differences in residential aged care, with slightly
more who agreed or strongly agreed (43.7%) and fewer respondents who disagreed or strongly disagreed
(32.6%).
6.3.2 Support from team or service provider
For this question, respondents indicated how satisfied they were with the level of support they received
from their team or service provider. There was a total of 1,944 responses to this question: 271 managers,
198 nurses, and 1,475 care and support workers. Overall, as illustrated in Figure 15 below, a greater
proportion of managers reported being totally satisfied or satisfied (65.7%) with the level of support they
0
10
20
30
40
50
60
70
80
Care & support workers Nurses Managers
% o
f re
spo
nd
ents
Agree Disagree Don't know

31
received than either care and support workers or nurses. Of the care and support workers who responded
to this question, 44.8% were totally satisfied or satisfied, 22.9% were neutral, and 32.3% were totally
dissatisfied or dissatisfied with the support they received. Nurses’ satisfaction with the level of support
they received from their team or service provider was slightly higher than care and support workers, with
52.5% indicating that they were totally satisfied or satisfied, 19.2% who were neutral, and 28.3% who were
totally dissatisfied or dissatisfied.
Figure 15. Satisfaction with team or employer support by occupation
Compared with the overall rates across sectors, care and support workers in the mental health and
addiction support sector more often indicated that they were totally satisfied or satisfied (61.0%) than
disability support (46.9%) or residential aged care (46.0%). The home and community support sector had
the lowest proportion of care and support workers who were totally satisfied or satisfied (35.0%) with the
level of support from their team or service provider.
6.3.3 Respect and acknowledgement
In this question, respondents were asked to report whether, considering all their efforts and achievements,
they received the respect and acknowledgement they deserved. There was a total of 1,936 responses to
this question: 267 managers, 194 nurses and 1,475 care and support workers. From the care and support
worker respondents, 46.6% agreed or strongly agreed, 22.5% were neutral, and 30.9% disagreed or
strongly disagreed. Similarly, 44.3% of nurses agreed or strongly agreed, 25.8% were neutral, and 29.9%
disagreed or strongly disagreed. However, managers’ responses indicated that they were more likely to
0 5 10 15 20 25 30 35 40
Totally dissatisfied
.
.
.
Totally satisfied.
% Care & support workers % Nurses % Managers

32
feel they received the respect and acknowledgement they deserved, with 62.5% who agreed or strongly
agreed, 20.6% who were neutral, and 16.9% who disagreed or strongly disagreed.
6.4 Time, work pressure and flexibility
This section gathered information about whether respondents were able to spend enough time with each
client, if they felt under pressure to work harder, and how satisfied they were with the flexibility available
to them to balance work and non-work commitments.
6.4.1 Client t ime
This question asked respondents to indicate whether they were able to spend enough time with each
client. There were 1,912 responses to this question: 225 managers, 200 nurses and 1,487 care and support
workers. Overall, it appears that care and support workers are more likely to feel that they have enough
time to spend with clients than either nurses or managers (see Figure 16 below). However, managers were
more likely to agree (44.9%) that they have enough time to spend with clients than nurses (37.5%). Given
that care and support workers are more often involved in direct care and interaction with clients, this may
be the reason that they generally agree that they have enough time to spend with clients.

33
Figure 16. Do respondents have enough time to spend with clients?
Responses by care and support workers in the mental health and addiction support and residential aged
care sectors differed to the overall proportions across sectors. In mental health and addiction support,
there was a larger proportion of care and support workers who agreed (27.0%) or strongly agreed (29.4%)
that they were able to spend enough time with each client, and fewer who disagreed (11.3%) or strongly
disagreed (6.8%). In contrast, those who disagreed (12.5%) or strongly disagreed (30.1%) made up the
largest group of respondents in the residential aged care sector, with a smaller group who agreed (14.8%)
or strongly agreed (22.7%) that they had enough client time.
6.4.2 Pressure to work harder
For this question, respondents reported whether they felt under pressure to work harder in their job. There
was a total of 1,919 responses to this question: 270 managers, 199 nurses and 1,450 care and support
workers. Managers and nurses more often reported feeling under pressure to work harder in their job,
than care and support workers. From the managers who responded, 51.9% agreed or strongly agreed that
they felt under pressure, and 32.6% disagreed or strongly disagreed, and 15.6% were neutral. Amongst
nurses, in comparison, 47.7% agreed or strongly agreed that they felt under pressure to work harder, while
28.1% disagreed or strongly disagreed.
Amongst the care and support workers who responded, responses in the disability support sector showed
that 34.6% agreed or strongly agreed, 25.5% were neutral, and 39.8% disagreed or strongly disagreed that
0 5 10 15 20 25 30
Strongly disagree
.
.
.
Strongly Agree
% Care & support workers % Nurses % Managers

34
they felt under pressure to work harder. In residential aged care, more care and support workers agreed
or strongly agreed (53.6%) that they were under pressure to work harder; fewer disagreed or strongly
disagreed (28.4%). In the home and community support sector, fewer care and support workers agreed or
strongly agreed (32.2%), and more disagreed or strongly disagreed (46.4%). There were similar responses
in mental health and addiction as in home and community support, with 40.7% who disagreed or strongly
disagreed that they were under pressure to work harder and 32.8% agreed or strongly agreed.
6.4.3 Flexibi l ity to balance work and non -work commitments
There were 1952 respondents who reported their satisfaction with the flexibility available to them to
balance work and non-work commitments: 274 managers, 199 nurses and 1,479 care and support workers.
A high proportion of managers (65.3%) reported that they were satisfied and totally satisfied, 18.2% were
neutral, 16.4% were dissatisfied or totally dissatisfied with the flexibility available to them. Nurses and care
and support workers had much lower levels of satisfaction with the flexibility available to them than
managers. From the nurses who responded, 53.3% were satisfied or totally satisfied, 20.6% were neutral,
and 26.1% were dissatisfied or totally dissatisfied. For care and support workers, 53.8% were satisfied or
totally satisfied, 23.1% were neutral, 23.1% dissatisfied or totally dissatisfied with the flexibility to balance
work and non-work commitments.
Care and support workers' responses to this question differed between sectors. Compared with the other
sectors, a larger proportion of care and support workers in mental health and addiction support were
satisfied with the flexibility available, with 30.6% who were satisfied and 33.3% totally satisfied, 24.1% who
were neutral, and only 6.8% who were dissatisfied and 5.1% totally dissatisfied. In contrast with mental
health and addiction support, fewer care and support workers in the disability support sector were satisfied
(28.4%) or totally satisfied (24.9%), and more were dissatisfied (15.0%) or totally dissatisfied (9.9%).
Similarly to disability support, of care and support workers in home support who responded to the question
24.9% were satisfied and 27.9% totally satisfied; 22.8% were neutral, and 11.1% were dissatisfied and
13.3% totally dissatisfied with the flexibility available to them. In the residential aged care sector, care and
support workers’ satisfaction with flexibility was lower generally than the other sectors, with 18.8% being
satisfied and 24.9% totally satisfied, 24.9% neutral, 9.9% dissatisfied and 21.6% totally dissatisfied.
6.5 Job Satisfaction and intentions to quit
6.5.1 Overall job satisfaction
Respondents were asked how satisfied they were with their job, all things considered. There was a total of
1,957 responses: 275 managers, 198 nurses and 1,484 care and support workers. A majority of
respondents reported that they were satisfied or totally satisfied (63.4%), and 23.8% that they were

35
neutral. However, only 12.8% of respondents indicated that they were dissatisfied or totally dissatisfied
with their job, all things considered. From the managers who reported their satisfaction with their job, all
things considered, 67.6% were satisfied or totally satisfied, 23.6% were neutral, and 8.7% were dissatisfied
or totally dissatisfied. Care and support workers had slightly lower rates of satisfaction, with 63.4% being
satisfied or totally satisfied, 23.8% neutral, and 12.8% who were dissatisfied or totally dissatisfied. Nurses
reported the lowest rates of satisfaction with their job, but still had a majority of 57.6% who were satisfied
or totally satisfied, 24.2% being neutral, and 18.2% who were dissatisfied or totally dissatisfied.
For care and support workers in residential aged care, 56.8% were satisfied or totally satisfied, 26.3% were
neutral, and 16.9% were dissatisfied or totally dissatisfied with their job. In contrast, care and support
workers in mental health and addiction support had higher rates of satisfaction than the total across all
sectors, with 70.5% being satisfied or totally satisfied, 19.5% neutral, and 9.9% dissatisfied or totally
dissatisfied.
6.5.2 The Work itself
Respondents were asked in this question to report their satisfaction with their work itself, or in other
words, their satisfaction with what they do. There was a total of 1,965 responses to this question: 275
managers, 197 nurses and 1,493 care and support workers. Managers had the highest satisfaction with the
work itself out of the three occupations, with 77.5% being satisfied or totally satisfied, 14.5% being neutral,
and 8.0% dissatisfied or totally dissatisfied. Care and support workers followed managers, with 71.0% who
reported that they were satisfied or totally satisfied, 18.4% who were neutral, and 10.6% dissatisfied or
totally dissatisfied with the work itself. While there was also a majority of nurses who were satisfied with
the work itself, this was a smaller majority than amongst care and support workers and managers, with
63.5% of nurses being satisfied or totally satisfied, 22.3% neutral, and 14.2% being dissatisfied or totally
dissatisfied.

36
Figure 17. Care and support workers' satisfaction with the work itself, by sector
As illustrated in Figure 17 above, there were some variations between sectors in care and support workers’
satisfaction with the work itself. Care and support workers in residential aged care reported similar levels
of satisfaction as nurses, so that 64.9% were satisfied or totally satisfied, however fewer were neutral
(16.1%), and more were dissatisfied or totally dissatisfied (19.0%), than the nurse respondents. The sector
with the next lowest satisfaction amongst care and support workers was disability support, with 66.4%
satisfied or totally satisfied with the work itself, 23.4% neutral, and 10.2% dissatisfied. Care and support
workers in mental health and addiction support reported somewhat higher satisfaction and had fewer
neutral responses, so that 72.9% were satisfied or totally satisfied, 16.3% were neutral, and 10.8% were
dissatisfied. The home and community support sector had the largest proportion of care and support
workers who were satisfied with the work itself, with 75.3% being satisfied or totally satisfied, 17.0% who
were neutral, and only 7.7% dissatisfied or totally dissatisfied.
6.5.3 Quitting Intentions
For this question, 1,787 respondents indicated whether they planned to look for a new job within the next
12 months: 260 managers, 189 nurses and 1,338 care and support workers. In comparison with nurses and
care and support workers, a smaller proportion of managers agreed or strongly agreed that they planned
to look for a new job within the next 12 months. Of the managers, 26.5% agreed or strongly agreed, while
60.0% disagreed or strongly disagreed that they planned to look for a new job. Amongst nurses, 32.8%
agreed or strongly agreed that they planned to look for a new job, while 51.9% disagreed or strongly
0 5 10 15 20 25 30 35 40 45
Totally Dissatisfied
Dissatisfied
Neutral
Satisfied
Totally Satisfied
Mental Health & Addiction Disability Support Home & Community Support Residential Aged Care
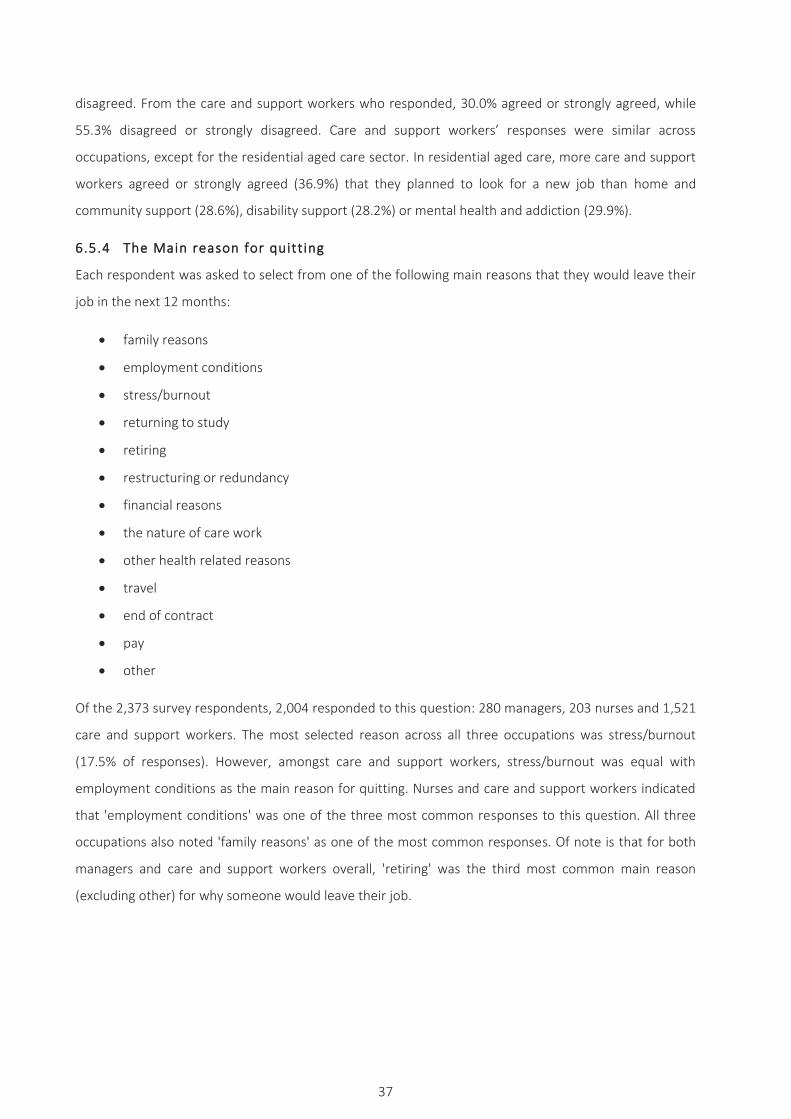
37
disagreed. From the care and support workers who responded, 30.0% agreed or strongly agreed, while
55.3% disagreed or strongly disagreed. Care and support workers’ responses were similar across
occupations, except for the residential aged care sector. In residential aged care, more care and support
workers agreed or strongly agreed (36.9%) that they planned to look for a new job than home and
community support (28.6%), disability support (28.2%) or mental health and addiction (29.9%).
6.5.4 The Main reason for quitting
Each respondent was asked to select from one of the following main reasons that they would leave their
job in the next 12 months:
family reasons
employment conditions
stress/burnout
returning to study
retiring
restructuring or redundancy
financial reasons
the nature of care work
other health related reasons
travel
end of contract
pay
other
Of the 2,373 survey respondents, 2,004 responded to this question: 280 managers, 203 nurses and 1,521
care and support workers. The most selected reason across all three occupations was stress/burnout
(17.5% of responses). However, amongst care and support workers, stress/burnout was equal with
employment conditions as the main reason for quitting. Nurses and care and support workers indicated
that 'employment conditions' was one of the three most common responses to this question. All three
occupations also noted 'family reasons' as one of the most common responses. Of note is that for both
managers and care and support workers overall, 'retiring' was the third most common main reason
(excluding other) for why someone would leave their job.

38
Table 4. Most common 'main' reason for quitting by occupation
1st most common 2nd most common 3rd most common
Managers Stress/burnout (24.6%) Family Reasons (12.9%) Retiring (12.1%)
Nurses Stress/burnout (22.2%) Family Reasons (13.3%) Employment Conditions (12.8%)
Care & support workers
Stress/burnout & Employment Conditions (15.5% each)
Family Reasons (15.3%) Retiring (10.8%)
When care and support workers’ responses are broken down by sector, there are some interesting
differences between the sectors. Stress and burnout was not the most common reason given in home and
community support and was 'first equal' in responses from support workers in mental health and addiction.
In mental health and addiction, the three most common reasons given were:
Stress/burnout and family reasons (14.7% each)
'Other' (not specified) (14.4%)
Pay and 'other health related reasons' (not specified) (8.4% each)
In home and community support, the three most common reasons given were:
Employment conditions (17.9%)
Family reasons (15.2%)
Stress burnout (13.7%) and retiring (13.6%)
The three most common responses from care and support workers in both disability support and
residential aged care were: stress/burnout, family reasons and employment conditions.
6.5.5 Would you recommend your job?
In this question, 1,996 respondents indicated whether they would recommend their job to their friends
and family: 271 managers, 200 nurses and 1525 care and support workers. Amongst care and support
workers, 40.7% reported that they would recommend their job. In comparison, fewer nurses (39.5%) would
recommend their job. Managers were more likely to recommend their job (44.6%), compared with nurses
and care and support workers. This means that across all of the sectors surveyed, and across all three
occupations, fewer than half of all respondents would recommend their job to friends and family.

39
Figure 18. Care and support workers, recommend this job by sector
Respondents from mental health and addiction, had a higher response (47.5%) who would recommend
their job, compared to home and community support (40.3%), disability support (39.4%) and residential
aged care (35.1%). Respondents from residential aged care had a bigger proportion than the other sectors
who would not recommend their job (25.7%).
0
5
10
15
20
25
30
35
40
45
50
Yes Maybe No
% o
f re
spo
nd
ents
Residential Aged Care Home & Community Support Disability Support Mental Health & Addiction

40
7 Workplace Health and Safety
This section reports on findings related to health and safety. The survey asked for responses on stress,
perceptions of safety at work, and how well respondents are supported with equipment and knowledge to
undertake their work. Respondents were also asked about their experience of workplace related injuries
and illnesses and workplace violence.
7.1 Workplace Stress
Respondents were asked in this question to indicate whether they agreed, disagreed, or were neutral about
the statement ‘my job is more stressful than I had ever imagined’. There was a total of 1,917 responses to
this question: 267 managers, 195 nurses and 1455 care and support workers.
Amongst managers who responded, 48.3% agreed or strongly agreed that their job was more stressful than
they had ever imagined, 19.1% were neutral, and 32.6% disagreed or strongly disagreed. Slightly fewer
nurses (42.6%) agreed or strongly agreed, 26.2% were neutral, and 31.3% disagreed or strongly disagreed.
Care and support workers had the smallest proportion who agreed or strongly agreed, at 36.6%, while
23.3% were neutral, and 40.1% disagreed or strongly disagreed. However, responses in the residential aged
care sector differed. The majority of care and support workers residential aged care agreed or strongly
agreed (53.1%) that their job was more stressful than they had ever imagined. This meant that in residential
aged care, fewer care and support workers disagreed or strongly disagreed (26.3%) or were neutral
(20.6%).
7.2 Safety at Work
Respondents were asked 'How safe do you feel at work?' The options given for responding were very
unsafe, unsafe, safe and very safe. A total of 2,100 respondents answered this question: 285 managers,
209 nurses, and 1,606 care and support workers.
Amongst managers the majority (87.0%) indicated that they felt safe or very safe in their workplaces.
Similarly, the majority (72.2%) of nurses, although smaller, felt safe or very safe at work. Amongst care and
support workers overall, 61.1% felt very safe or safe at work – a much smaller majority than managers or
nurses. As Figure 19 below illustrates, a greater proportion of respondents who work in home and
community support (89.3%) reported feeling very safe and safe than in residential aged care (76.3%) and
disability support (81.4%). Mental health and addiction respondents reported similar feelings (87.4%) of

41
safety to those in home and community support. Respondents who work in residential aged care felt less
safe than the other sectors with 23.8% feeling very unsafe or unsafe.
Figure 19. How safe care and support workers feel at work
There were two questions that gauged if respondents were provided with the resources they need to do
their job safely:
1) I have the tools and equipment that I need to do my job safely (2,092 total responses: 285
managers, 210 nurses and 1,597 care and support workers).
2) I am told everything I need to know to do my job safely (2,065 total responses: 282 Managers, 209
nurses and 1,574 care and support workers).
Table 5 below details the responses by occupation.
0
10
20
30
40
50
60
70
Very unsafe Unsafe Safe Very Safe
% o
f re
spo
nd
ents
Residential Aged Care Home & Community Support Disability Support Mental Health & Addiction

42
Table 5. Responses by occupation: tools and equipment, information to safely do their job
Care & support workers (%)
Nurses (%) Managers (%)
I have the tools & equipment I need to do my job safely
Strongly disagree 5.6 7.1 3.5
Disagree 9.4 13.8 9.8
Neither agree/ disagree 27.1 21.0 19.6
Agree 26.2 29.0 23.9
Strongly Agree 31.6 23.3 43.2
I am told everything I need to know to do my job safely
Strongly disagree 8.8 11.5 5.0
Disagree 16.6 15.3 12.1
Neither agree/ disagree 26.6 24.4 23.8
Agree 23.1 27.3 23.0
Strongly Agree 25.0 21.5 36.2
Generally, more than half of all responses across all three occupations agreed or strongly agreed that they
have the tools and equipment that they need to do their job safely. However, less than half of nurses and
care and support workers agreed or strongly agreed that they are told everything that they need to know
to do their job safely. When broken down by sector, just over half of residential aged care respondents
(53.9%) and mental health and addiction respondents (55.6%) agreed or strongly agreed that they are told
everything they need to know to do their job safely. Just under half (49.9%) of those in disability support
agreed or strongly agreed, and only 40.8% of those in home and community support agreed or strongly
agreed with the statement.
7.3 Work-related injury and illness
Respondents were asked to identify any of the work-related injuries or illnesses that they had suffered in
the last 12 months. Table 6 below illustrates the total number of responses for each category available to
choose from, listed from the most common response at the top, to least common at the bottom.
Regardless of occupation or sector 'stress or other mental health condition' was the most frequently
identified work-related injury or illness.

43
Table 6. Work-related injury and illness experienced in the last 12 months
Work-related injury/illness
Total number of responses
Number of care & support workers
Number of nurses Number of managers
Stress or other mental health condition
562 426 67 69
Bruising 267 232 25 10
Back injury 262 231 23 8
Chronic joint or muscle 260 217 24 19
Strain/sprain 258 225 19 14
Minor injury 169 147 11 11
'Other' 71 54 11 6
Cut/slash/open wound 70 60 6 4
Fracture 25 18 4 3
Burns 24 22 2 0
Needle stick injury 17 12 2 3
Amputation 2 2 0 0
Some examples of 'other' work-related injury or illness identified by respondents included: animal bites,
infectious diseases (such as cold, flu, norovirus), sun burn and electrocution.
When comparing care and support workers by sector the three most commonly identified work-related
injuries or illness, after stress, were:
Residential aged care: bruising, back injury, chronic joint or muscle problems.
Home and community support: sprain/strain, back injury, chronic joint or muscle problems.
Disability support: bruising, sprain/strain, back injury
Mental health and addiction: back injury, chronic joint or muscle problems, sprain/strain.
Respondents were also asked to identify the cause of the most recent work-related injury or illness. There
were 1,025 responses to this question: 92 managers, 103 nurses and 830 care and support workers. Figure
20 shows the most frequently identified causes of work-related injury or illness identified across
occupation.

44
Figure 20. Cause of the most recent work-related injury or illness
Lifting, pushing, pulling or bending was the most frequently identified (n=224), followed by exposure to
mental stress (n=205), and fatigue (n=152). Some examples of 'other' causes that were identified include:
workload, clients' pets, the client themselves, and bullying.
Finally, respondents were asked if the most recent workplace injury or illness had resulted in them taking
time off work. There were 1,067 responses to this question: 97 managers, 105 nurses and 865 care and
support workers. Of managers, 42.3% responded that their most recent workplace injury or illness had
resulted in time off work. This compares to 38.1% of nurses and 49.0% of care and support workers saying
that their most recent workplace injury or illness had resulted in them taking time off work.
7.4 Workplace Violence
Respondents were asked to consider their experience of workplace violence. They were asked about their
experiences of workplace violence received from 1) clients and clients' family; and 2) colleagues and
managers. Specifically, they were asked how often they experienced the following types of violence:
physical violence – for example, hitting, pushing, slapping
0 50 100 150 200 250
Other
Long term exposure to sounds
Contact with a chemical or substance
Vehicle accident
Needle stick injury
Prolonged standing/working in cramped or unchangingpositions
Repetitive movement
Fall or slip
Hitting, being hit or cut by person, object or vehicle
Fatigue
Exposure to mental stress
Lifting/pushing/pulling/bending
Number of respondents

45
verbal aggression – for example, swearing, yelling and shouting
emotional abuse – for example, name calling, bullying and threats
sexual harassment – for example, unwanted sexual attention
sexual violence – for example, unwanted physical sexual contact
These questions were derived from peer-reviewed studies on workplace violence in home and community
support (Hanson et al., 2015; Nakaishi et al., 2013).
7.4.1 Workplace violence from cl ients and their famil ies
Figure 21, below, illustrates the experience of violence from clients and their families across the
occupations.
Physical Violence
There were 2006 responses to this question: 270 managers, 189 nurses, and 1547 care and support
workers. More than half of managers (54.1%) and care and support workers (53.8%) never experienced
physical violence from clients or clients' families. However, only just under a third of nurses (31.7%) never
experienced physical violence from clients or their families. Consequently, nearly half of all managers and
care and support workers experience physical violence from clients, sometimes, often, most of the time,
or always. Amongst nurses this was nearly two thirds of the responses.
When care and support workers' responses are analysed by sector, those in home and community support
report lower incidences of physical violence from clients or clients' families with 75.7% stating they never
experience it. This compares with 58.3% of respondents from mental health and addiction, 27.1% of care
and support workers in residential aged care and 33.3% of disability support workers who never experience
physical violence from clients or clients’ families.
Verbal Aggression
There were 2,010 responses to this question: 270 managers, 196 nurses, and 1,544 care and support
workers. The majority (managers – 53.3%; nurses – 50.0%; care and support workers – 47.2%) experience
verbal aggression from clients 'sometimes'. A small proportion in each occupation reported 'always'
experiencing verbal aggressions: managers (2.6%), nurses (4.1%) and care and support workers (3.6%).
When care and support workers were analysed by sector, there were some key differences between
sectors. Home and community support responses had a higher proportion (42.3%) of those who 'never'
experience verbal aggression compared to those in disability support (16.8%), mental health and addiction
(13.8%) and residential aged care (12.3%).

46
Figure 21. Experience of workplace violence from clients, by occupation

47
Emotional abuse
There were 1,970 responses to this question: 268 managers, 190 nurses and 1,512 care and support
workers. Care and support workers had the highest proportion (50.3%) who never experienced emotional
abuse compared to nurses (33.7%) and managers (47.8%). Amongst managers 1.9% always experienced
emotional abuse, compared to 1.7% of care and support workers and 2.6% of nurses.
Sexual harassment and sexual violence
There were 1,952 responses to the question asking how often respondents experienced sexual
harassment: 265 managers, 187 nurses and 1,500 care and support workers. A strong majority across all
occupations 'never' experienced sexual harassment: 84.5% of managers, 71.7% of nurses and 76.1% of
care and support workers never experience sexual harassment at work. No managers responded that they
'most of the time' or 'always' experienced sexual harassment at work from clients or their families. While
the percentages of care and support workers who experience sexual harassment from clients at work is
small, it does mean that there are workers who regularly experience sexual harassment.
There were 1,927 responses to the question asking how often respondents experienced sexual violence:
261 managers, 185 nurses, 1,481 care and support workers. The majority across all occupations reported
that they never experienced sexual violence from clients or their families (managers – 95.8%; nurses –
89.2%; care and support workers – 91.9%). No managers reported experiencing sexual violence from
clients often, most of the time, or always. No nurses reported experiencing sexual violence from clients
most of the time, or always. Small proportions of care and support workers experienced sexual violence
from clients often (0.3%), most of the time (0.2%), and always (0.1%). While a very small percentage of
responses, it is sobering to note that some care and support workers experience sexual harassment and
sexual violence from clients or clients’ families always.
Table 7, below, provides the responses of nurses and care and support workers to these two questions.
Table 7. Experience of sexual harassment and violence at work from clients: nurses and care & support
workers
Never Sometimes Often Most of the time
Always
How often do you experience sexual harassment from clients or their families?
Care & support workers (%)
76.1 21.8 1.6 0.3 0.3
Nurses (%) 71.7 23.0 3.7 1.1 0.5
How often do you experience sexual violence from clients or their families?
Care & support workers (%)
91.9 7.4 0.3 0.2 0.1
Nurses (%) 89.2 10.3 0.5 0 0

48
7.4.2 Workplace violence experienced from colleagues or managers
The previous section addressed the experience of violence inflicted by clients or clients' families. This
section addresses workplace violence experienced from colleagues or managers. As in the previous section
it addresses physical violence, verbal aggression, emotional abuse, sexual harassment and sexual violence.
Figure 22 below illustrates the responses across occupations, excluding those who answered ‘never’.
Physical violence
There were 2,048 responses to this question: 279 managers, 206 nurses and 1,563 care and support
workers. The majority responded that they 'never' experience physical violence from colleagues or
managers: 96.4% of managers, 89.3% of nurses and 93.0% of care and support workers.
Verbal aggression
There were 2,026 responses to this question: 279 managers, 206 nurses and 1,541 care and support
workers. A majority replied that they 'never' experience verbal aggression from colleagues or managers:
76.3% of managers, 66.0% of nurses and 75.1% of care and support workers never experience verbal
aggression from colleagues or managers. However, 19.9% of care and support workers, 28.2% of nurses
and 19.0% of managers sometimes experience verbal aggression from colleagues or managers.
When care and support workers' responses were analysed by sector a higher proportion of home and
community support workers (81.6%) and mental health and addiction support workers (78.7%) never
experienced verbal aggression from colleagues or managers than those in residential aged care (64.3%) or
disability support (68.7%).
Emotional abuse
There were 2,022 responses to this question: 279 managers, 206 nurses and 1,537 care and support
workers. Unlike physical violence and verbal aggression, there was not a similar pattern across occupations.
Amongst nurses only 56.8% of them reported 'never' experiencing emotional abuse from colleagues or
managers. This compares to 71.0% of care and support workers, and 76.7% of managers who reported
that they never experience emotional abuse from colleagues or managers. There were 0.7% of care and
support workers, 0.7% of managers and 1.9% of nurses who 'always' experienced emotional abuse from
colleagues or managers.

49
Figure 22. Experience of workplace violence from colleagues or managers, by occupation

50
Sexual harassment and Sexual violence
There were 2,001 responses to the question asking if respondents ever experienced sexual harassment
from colleagues or managers: 279 managers, 205 nurses, 1,517 care and support workers. The vast
majority 'never' experienced sexual harassment (94.3% of managers, 90.7% of nurses and 95.0% of care
and support workers). However, some did experience sexual harassment sometimes (3.9% of managers,
5.9% of nurses and 4.2% of care and support workers). Smaller proportions experienced sexual harassment
from colleagues or managers often, most of the time or always.
There were 1,978 responses to the question asking if respondents ever experienced sexual violence at
work from colleagues or managers: 276 managers, 202 nurses, 1,500 care and support workers. The vast
majority (97.1% of managers, 94.1% of nurses and 97.7% of care and support workers) never experienced
sexual violence from colleagues or managers. Very small proportions of care and support workers and
managers always experience sexual violence from colleagues or managers. Table 8, below, provides the
responses across occupation of how often respondents experienced sexual harassment and sexual violence
perpetrated by colleagues or managers.
Table 8. Experience of sexual harassment and violence at work from colleagues or managers, by occupation
Never Sometimes Often Most of the time
Always
How often do you experience sexual harassment from colleagues or managers?
Care & support workers (%)
95.0 4.2 0.5 0.3 0.1
Nurses (%) 90.7 5.9 2.4 0.5 0.5
Managers (%) 94.3 3.9 0.4 1.1 0.4
How often do you experience sexual violence from colleagues or managers?
Care & support workers (%)
97.7 1.6 0.4 0.2 0.1
Nurses (%) 94.1 3.5 2.0 0.5 0.0
Managers (%) 97.1 1.1 0.4 1.1 0.4

51
8 Conclusions
Standard or regular work is work that best supports workers in reliable, consistent work conditions that
provide stable incomes and the opportunity to ensure that they can balance work commitments with their
home and personal life. Standard work can be measured on elements related to the number of regularly
worked hours per week, a daytime regular shift, and permanent full-time work. Across the occupations of
managers, nurses and care and support workers, the results from this survey illustrate that managers and
nurses enjoy much more standard work in general than care and support workers. Managers and nurses
have more regular, daytime shifts and higher weekly average hours. The majority are employed in
permanent, full-time work. For managers, it could be that for some, average weekly hours in excess of 40
hours per week contribute to negative outcomes such as stress.
Amongst care and support workers, respondents in mental health and addiction had the most standard
work with more of those respondents likely to be in permanent, full time work with regular weekly hours
most likely to be around 30 to 40 hours per week. Respondents from mental health and addiction were
also more likely to be on the higher hourly rates than care and support workers in the other sectors. It is
interesting to note that a greater proportion of care and support workers from mental health and addiction
identified their gender as male than the other sectors.
As a sector, home and community support stands out as being the least standard and regular for care and
support workers than the other sectors. They experience short shifts, more split shifts, lower average
weekly hours, and are less likely to be on permanent, full time employment contracts. Compared to the
other sectors and occupations reported on here, home and community support workers had the lowest
levels of satisfaction with job security, with less than half of respondents satisfied with their job security.
Unsurprisingly, therefore, 61.5% of home and community support respondents would like to have more
hours of work per week.
Less than half of all respondents, across all occupations, agreed that their pay was fair in relation to their
skills, responsibilities, and experience. Nurses had much higher rates of dissatisfaction with pay than the
other occupations, with 43.6% of nurses dissatisfied with their total pay. In contrast, 44.0% of care and
support workers were satisfied with their total pay (26.5% dissatisfied and 29.5% neutral). Interestingly,
given the overall poorer reported outcomes for home and community support workers, more care and
support workers from this sector than the other sectors agreed that their pay was fair with respect to the
skills, responsibilities and experience required to do their job. However, at 44.8% this was still less than
half of respondents in this sector. There is cause for concern in that less than half of nurses and care and

52
support workers agreed that they receive the respect and acknowledgement that they deserve considering
their efforts and achievements at work.
The introduction of the Care and Support Workers (Pay Equity) Settlement Act 2017 brought a stronger
focus on training and qualifications in this workforce. Most respondents to this survey indicated that they
had completed training provided by their employer in the last 12 months. However, care and support
workers were the least likely occupation to have completed training provided by their employer (26.1%) in
the last 12 months. Managers were more likely to be given training during their work time, than either
nurses or care and support workers. Among care and support workers, those in home and community care
were least likely to be given training during work time, or to be paid if it occurred outside of work time.
Two thirds of this workforce (across all occupations) would like to undertake work-related study.
Although home and community support workers have poorer work conditions in general than those in the
other sectors surveyed here, care and support workers in residential aged care were less likely to feel safe
at work – 23.8% did not feel safe at work. Across all occupations, stress or other mental health conditions
was the most commonly reported workplace health and safety issue. However, nurses overall were more
likely to experience workplace violence, both from clients and from colleagues. Worryingly, although in
small proportions, workers in residential aged care, home and community support, disability support and
mental health and addiction do experience sexual harassment and sexual violence at work: 24.0% of care
and support workers, and 28.3% of nurses experience sexual harassment from their clients or their clients’
family; 8.1% of care and support workers, and 10.8% of nurses suffer sexual violence from clients or clients’
family. Care and support workers and nurses, therefore, experience unwanted sexual attention and
unwanted physical sexual contact at work. This is an issue that needs further investigation.
Given increasing attention to retention and recruitment of the care and support workforce and sectors it
is important to note that approximately one third of nurses, and one quarter of care and support workers
indicated that they intend to quit in the next 12 months. When looking at care and support workers by
sector, more than one third (36.9%) of those in residential aged care intend to quit. Stress/burnout,
employment conditions, family reasons, and retiring were commonly given reasons across all respondents
for the intention to quit their job. Fewer than half of all respondents would recommend their job to family
or friends.
The evidence presented in this report suggests that more work needs to be done to ensure that the care
workforce (including nurses and managers) have work and workloads that are safe, and do not contribute
to stress and poor mental health. This is particularly important given that stress is one of the key reasons
given for survey respondents wanting to quit their job. Care and support workers in mental health and
addiction, as well as managers, report better experiences at work overall. Home and community support

53
is still a sector that does not provide regular or reliable work to care and support workers despite regulatory
changes aiming to ‘regularise’ this work. Overall, the care workforce is a well-qualified workforce that
would like the opportunity to further their skill and knowledge which indicates considerable good will and
motivation that with good policy can be leveraged to create a thriving workforce providing high quality
care to clients across multiple sectors.
54
9 References
Central Region’s Technical Advisory Service (2018). Health Workforce Information Programme data for
Kaiawhina - November 2018. Retrieved from https://www.workforceinaction.org.nz/resources/research/
Hanson, G. C., Perrin, N. A., Moss, H., Laharnar, N., & Glass, N. (2015). Workplace violence against
homecare workers and its relationship with workers health outcomes: A cross-sectional study. BMC
Public Health, 15(11), 11–23. https://doi.org/10.1186/s12889-014-1340-7
Mavromaras, K. et al. (2017). 2016 National Aged Care Workforce Census and Survey – The Aged Care
Workforce, 2016. The Department of Health, Australian Government. ISBN: 978-1-76007-314-5
Nakaishi, L., Moss, H., Weinstein, M., Perrin, N., Rose, L., Anger, W. K., … Glass, N. (2013). Exploring
workplace violence among home care workers in a consumer-driven home health care program.
Workplace Health and Safety, 61(10), 441–450. https://doi.org/10.3928/21650799-20130916-17
StatisticsNZ (n.d.). Ethnicity New Zealand Standard Classification 2005 V2.0.0. Retrieved from
www.aria.stats.govt.nz
Twaddle, S. & Khan, M. (2014). Health and Disability Kaiawhina Worker Workforce. 2013 Profile.
Wellington: BERL Economics. Retrieved from https://www.workforceinaction.org.nz/wp-
content/uploads/2014/05/2013-Health-and-Disability-Kaiawhina-Worker-Workforce-Profile.pdf

w w w . w o r k r e s e a r c h . a u t . a c . n zw o r k . r e s e a r c h @ a u t . a c . n z
facebook.com/workresearch @NZWorkResearch NZ Work Research Institute


![Polish Open - Warsaw Cup 2018 · 2018. 11. 19. · B/10 Marcel Müller [15] Austrian National Team (AUT) R/1103 Timotej Todic Klub Kang (SLO) 905.4 (AUT) B/10 (0-0 DSQ) B/145 David](https://static.fdocuments.in/doc/165x107/5fde042bfe6071319c5a0360/polish-open-warsaw-cup-2018-11-19-b10-marcel-mller-15-austrian-national.jpg)